Zip Codes with the Highest Percentage of Population Employed in Architecture & Engineering in Pittston, PA
RELATED REPORTS & OPTIONS
Architecture & Engineering
Pittston
Compare Zip Codes
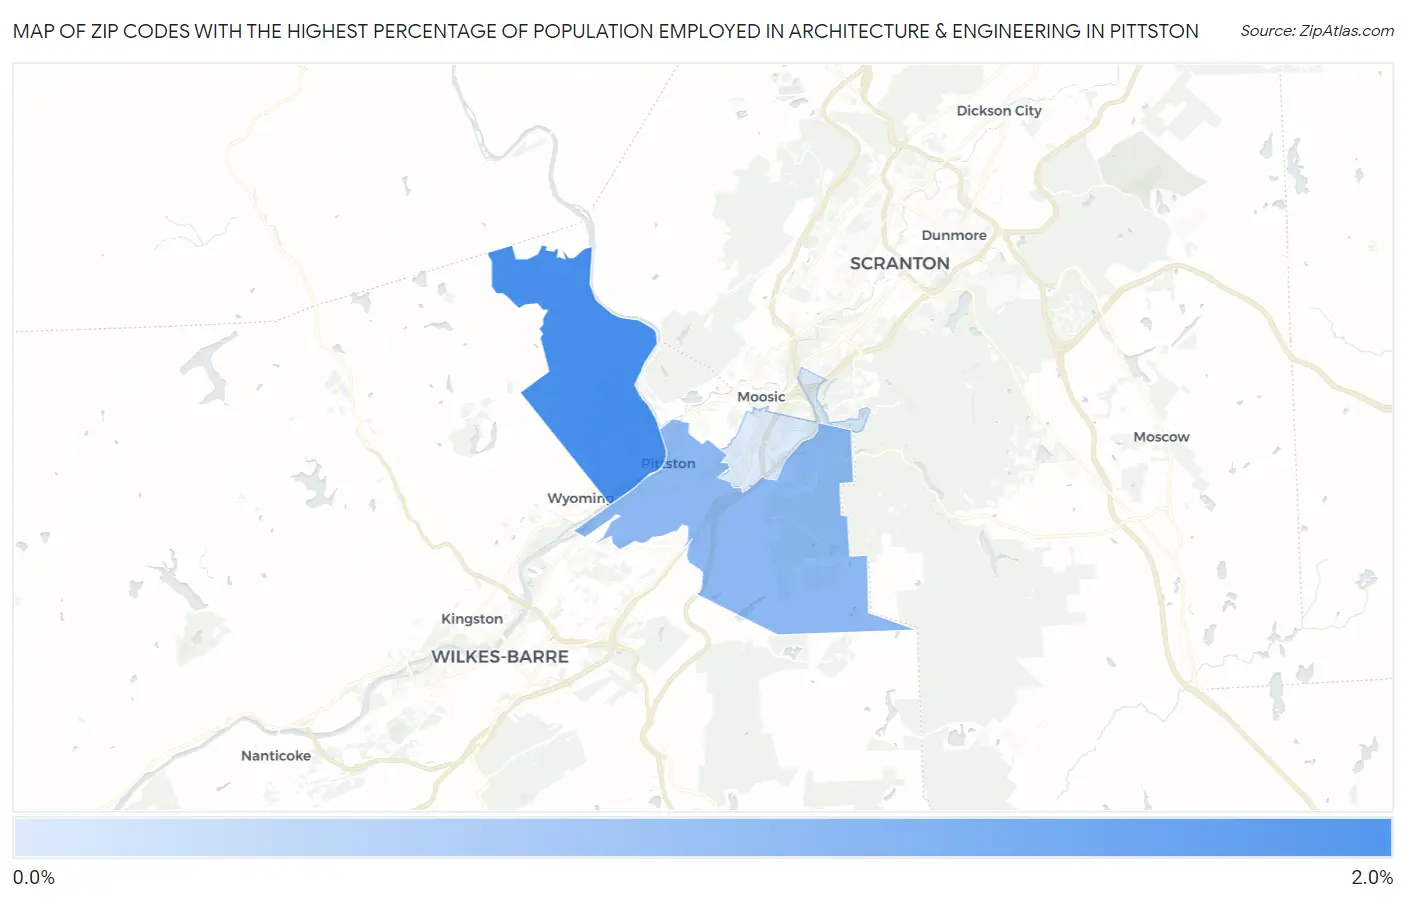
Map of Zip Codes with the Highest Percentage of Population Employed in Architecture & Engineering in Pittston
0.29%
1.9%
Zip Codes with the Highest Percentage of Population Employed in Architecture & Engineering in Pittston, PA
| Zip Code | % Employed | vs State | vs National | |
| 1. | 18643 | 1.9% | 2.0%(-0.139)#588 | 2.1%(-0.247)#10,232 |
| 2. | 18640 | 1.2% | 2.0%(-0.883)#909 | 2.1%(-0.991)#15,414 |
| 3. | 18641 | 0.29% | 2.0%(-1.75)#1,205 | 2.1%(-1.86)#21,635 |
1
Common Questions
What are the Top Zip Codes with the Highest Percentage of Population Employed in Architecture & Engineering in Pittston, PA?
Top Zip Codes with the Highest Percentage of Population Employed in Architecture & Engineering in Pittston, PA are:
What zip code has the Highest Percentage of Population Employed in Architecture & Engineering in Pittston, PA?
18643 has the Highest Percentage of Population Employed in Architecture & Engineering in Pittston, PA with 1.9%.
What is the Percentage of Population Employed in Architecture & Engineering in Pittston, PA?
Percentage of Population Employed in Architecture & Engineering in Pittston is 1.1%.
What is the Percentage of Population Employed in Architecture & Engineering in Pennsylvania?
Percentage of Population Employed in Architecture & Engineering in Pennsylvania is 2.0%.
What is the Percentage of Population Employed in Architecture & Engineering in the United States?
Percentage of Population Employed in Architecture & Engineering in the United States is 2.1%.