Zip Codes with the Highest Percentage of Population Employed in Architecture & Engineering in Lancaster, PA
RELATED REPORTS & OPTIONS
Architecture & Engineering
Lancaster
Compare Zip Codes
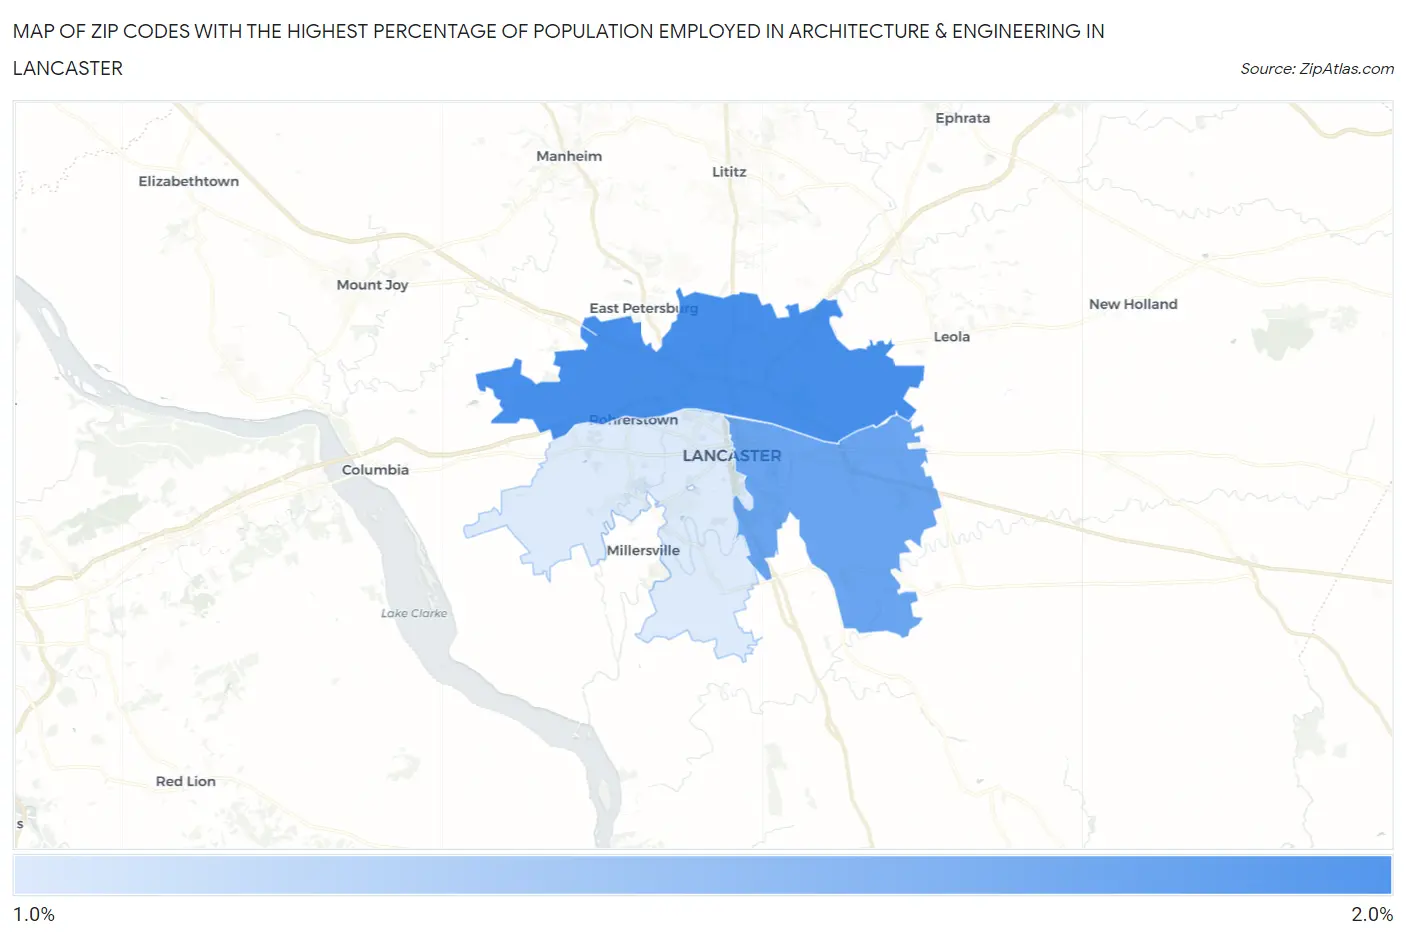
Map of Zip Codes with the Highest Percentage of Population Employed in Architecture & Engineering in Lancaster
1.1%
1.9%
Zip Codes with the Highest Percentage of Population Employed in Architecture & Engineering in Lancaster, PA
| Zip Code | % Employed | vs State | vs National | |
| 1. | 17601 | 1.9% | 2.0%(-0.177)#600 | 2.1%(-0.285)#10,459 |
| 2. | 17602 | 1.7% | 2.0%(-0.365)#675 | 2.1%(-0.473)#11,654 |
| 3. | 17603 | 1.1% | 2.0%(-0.986)#954 | 2.1%(-1.09)#16,214 |
1
Common Questions
What are the Top Zip Codes with the Highest Percentage of Population Employed in Architecture & Engineering in Lancaster, PA?
Top Zip Codes with the Highest Percentage of Population Employed in Architecture & Engineering in Lancaster, PA are:
What zip code has the Highest Percentage of Population Employed in Architecture & Engineering in Lancaster, PA?
17601 has the Highest Percentage of Population Employed in Architecture & Engineering in Lancaster, PA with 1.9%.
What is the Percentage of Population Employed in Architecture & Engineering in Lancaster, PA?
Percentage of Population Employed in Architecture & Engineering in Lancaster is 1.0%.
What is the Percentage of Population Employed in Architecture & Engineering in Pennsylvania?
Percentage of Population Employed in Architecture & Engineering in Pennsylvania is 2.0%.
What is the Percentage of Population Employed in Architecture & Engineering in the United States?
Percentage of Population Employed in Architecture & Engineering in the United States is 2.1%.