Zip Codes with the Highest Percentage of Population Employed in Architecture & Engineering in Bethlehem, PA
RELATED REPORTS & OPTIONS
Architecture & Engineering
Bethlehem
Compare Zip Codes
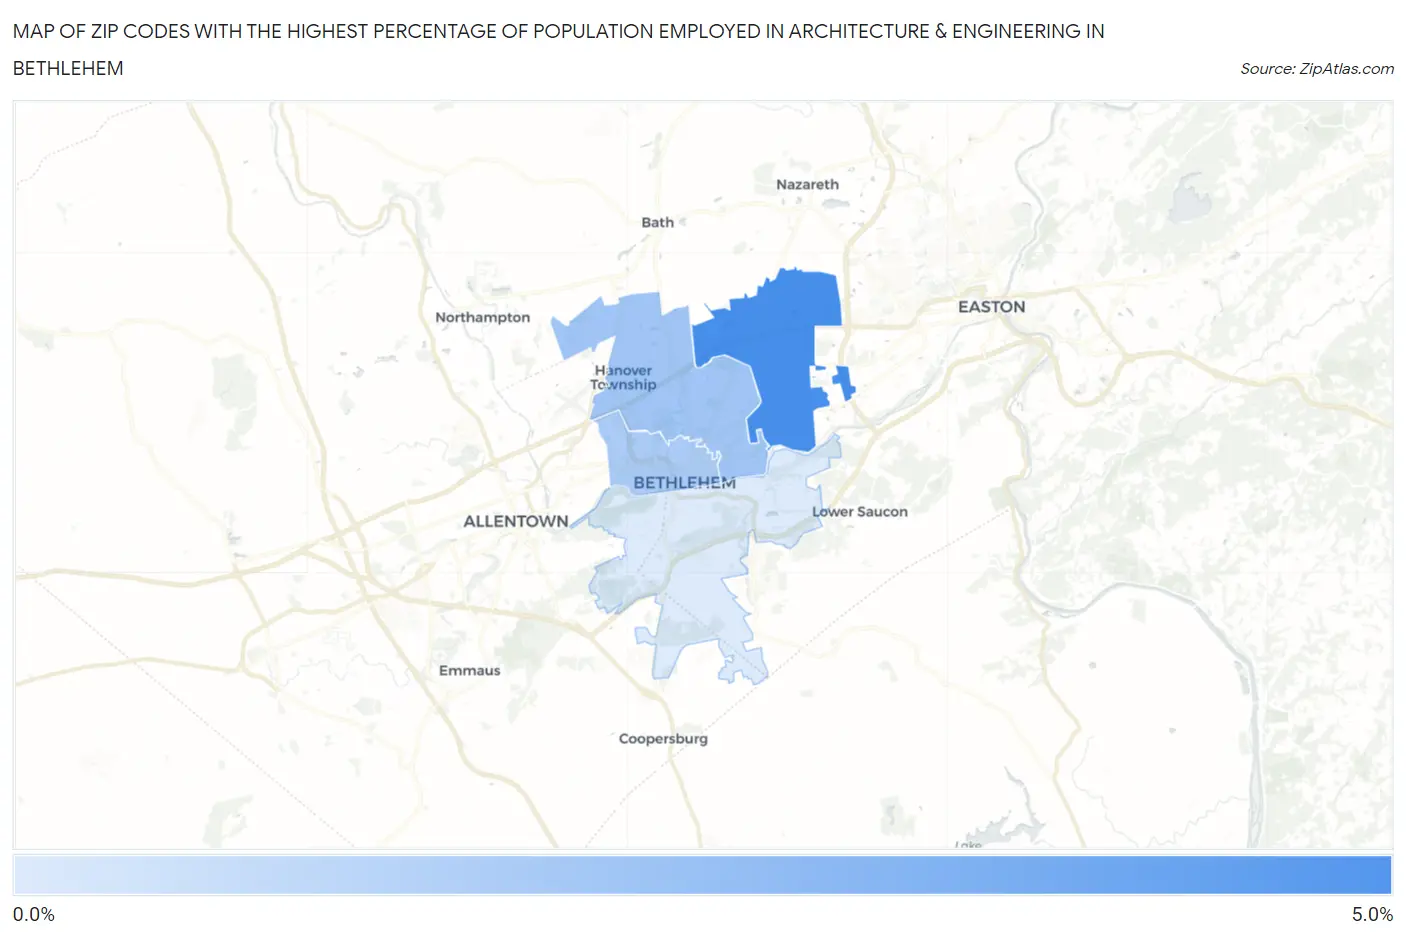
Map of Zip Codes with the Highest Percentage of Population Employed in Architecture & Engineering in Bethlehem
0.72%
4.9%
Zip Codes with the Highest Percentage of Population Employed in Architecture & Engineering in Bethlehem, PA
| Zip Code | % Employed | vs State | vs National | |
| 1. | 18020 | 4.9% | 2.0%(+2.81)#79 | 2.1%(+2.70)#1,782 |
| 2. | 18017 | 2.4% | 2.0%(+0.326)#426 | 2.1%(+0.218)#7,630 |
| 3. | 18018 | 2.1% | 2.0%(+0.036)#519 | 2.1%(-0.072)#9,166 |
| 4. | 18015 | 0.72% | 2.0%(-1.32)#1,071 | 2.1%(-1.43)#18,744 |
1
Common Questions
What are the Top 3 Zip Codes with the Highest Percentage of Population Employed in Architecture & Engineering in Bethlehem, PA?
Top 3 Zip Codes with the Highest Percentage of Population Employed in Architecture & Engineering in Bethlehem, PA are:
What zip code has the Highest Percentage of Population Employed in Architecture & Engineering in Bethlehem, PA?
18020 has the Highest Percentage of Population Employed in Architecture & Engineering in Bethlehem, PA with 4.9%.
What is the Percentage of Population Employed in Architecture & Engineering in Bethlehem, PA?
Percentage of Population Employed in Architecture & Engineering in Bethlehem is 1.6%.
What is the Percentage of Population Employed in Architecture & Engineering in Pennsylvania?
Percentage of Population Employed in Architecture & Engineering in Pennsylvania is 2.0%.
What is the Percentage of Population Employed in Architecture & Engineering in the United States?
Percentage of Population Employed in Architecture & Engineering in the United States is 2.1%.