Zip Codes with the Highest Percentage of Population Employed in Architecture & Engineering in Maryland
RELATED REPORTS & OPTIONS
Architecture & Engineering
Maryland
Compare Zip Codes
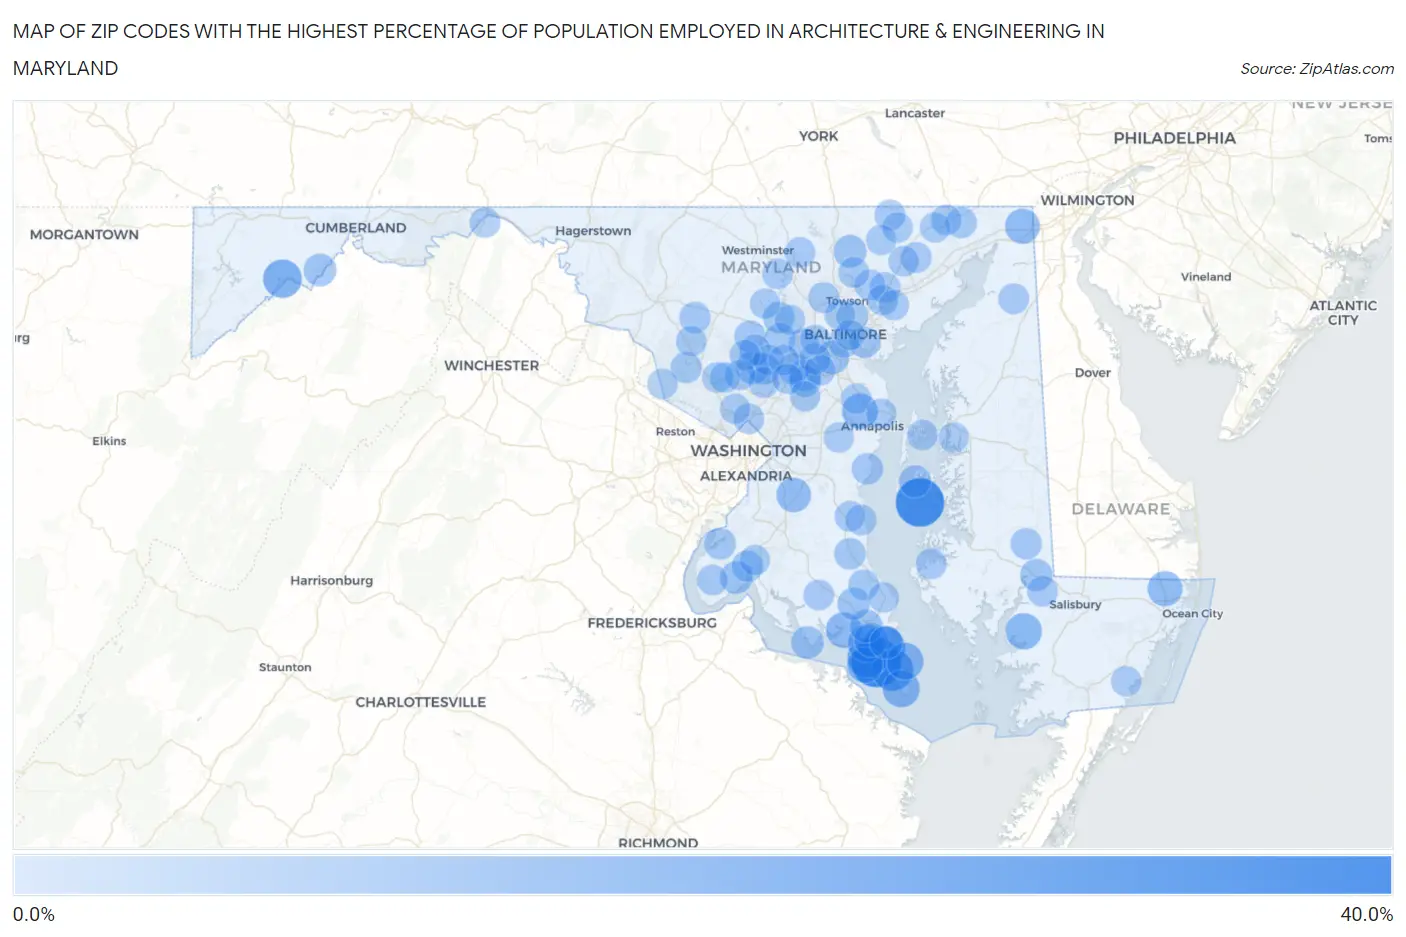
Map of Zip Codes with the Highest Percentage of Population Employed in Architecture & Engineering in Maryland
0.0%
40.0%
Zip Codes with the Highest Percentage of Population Employed in Architecture & Engineering in Maryland
| Zip Code | % Employed | vs State | vs National | |
| 1. | 20630 | 37.1% | 2.4%(+34.7)#1 | 2.1%(+34.9)#34 |
| 2. | 21652 | 35.2% | 2.4%(+32.8)#2 | 2.1%(+33.0)#43 |
| 3. | 20667 | 24.7% | 2.4%(+22.3)#3 | 2.1%(+22.6)#63 |
| 4. | 20684 | 22.9% | 2.4%(+20.5)#4 | 2.1%(+20.8)#78 |
| 5. | 20692 | 20.8% | 2.4%(+18.4)#5 | 2.1%(+18.7)#90 |
| 6. | 21523 | 17.7% | 2.4%(+15.4)#6 | 2.1%(+15.6)#115 |
| 7. | 20687 | 15.1% | 2.4%(+12.7)#7 | 2.1%(+12.9)#145 |
| 8. | 20628 | 15.1% | 2.4%(+12.7)#8 | 2.1%(+12.9)#146 |
| 9. | 20620 | 14.0% | 2.4%(+11.6)#9 | 2.1%(+11.8)#173 |
| 10. | 21865 | 13.6% | 2.4%(+11.2)#10 | 2.1%(+11.5)#180 |
| 11. | 21405 | 12.9% | 2.4%(+10.5)#11 | 2.1%(+10.7)#203 |
| 12. | 20690 | 12.5% | 2.4%(+10.1)#12 | 2.1%(+10.4)#218 |
| 13. | 20650 | 12.5% | 2.4%(+10.1)#13 | 2.1%(+10.4)#219 |
| 14. | 21813 | 11.6% | 2.4%(+9.17)#14 | 2.1%(+9.41)#259 |
| 15. | 21920 | 11.2% | 2.4%(+8.83)#15 | 2.1%(+9.07)#276 |
| 16. | 20623 | 10.6% | 2.4%(+8.20)#16 | 2.1%(+8.44)#307 |
| 17. | 20634 | 9.8% | 2.4%(+7.40)#17 | 2.1%(+7.63)#358 |
| 18. | 21090 | 8.4% | 2.4%(+6.02)#18 | 2.1%(+6.26)#500 |
| 19. | 20619 | 8.3% | 2.4%(+5.88)#19 | 2.1%(+6.12)#524 |
| 20. | 20653 | 8.0% | 2.4%(+5.60)#20 | 2.1%(+5.84)#577 |
| 21. | 20862 | 7.7% | 2.4%(+5.30)#21 | 2.1%(+5.54)#623 |
| 22. | 20626 | 7.6% | 2.4%(+5.22)#22 | 2.1%(+5.46)#638 |
| 23. | 21111 | 7.6% | 2.4%(+5.22)#23 | 2.1%(+5.46)#639 |
| 24. | 21557 | 7.4% | 2.4%(+5.03)#24 | 2.1%(+5.27)#670 |
| 25. | 20693 | 7.4% | 2.4%(+4.99)#25 | 2.1%(+5.22)#677 |
| 26. | 20636 | 7.1% | 2.4%(+4.69)#26 | 2.1%(+4.93)#730 |
| 27. | 21837 | 6.7% | 2.4%(+4.34)#27 | 2.1%(+4.57)#815 |
| 28. | 20794 | 6.7% | 2.4%(+4.31)#28 | 2.1%(+4.55)#826 |
| 29. | 21676 | 6.6% | 2.4%(+4.17)#29 | 2.1%(+4.41)#866 |
| 30. | 20777 | 6.0% | 2.4%(+3.59)#30 | 2.1%(+3.83)#1,089 |
| 31. | 20658 | 5.8% | 2.4%(+3.37)#31 | 2.1%(+3.61)#1,189 |
| 32. | 21104 | 5.6% | 2.4%(+3.22)#32 | 2.1%(+3.46)#1,280 |
| 33. | 20678 | 5.5% | 2.4%(+3.13)#33 | 2.1%(+3.37)#1,318 |
| 34. | 20677 | 5.5% | 2.4%(+3.07)#34 | 2.1%(+3.31)#1,354 |
| 35. | 21738 | 5.4% | 2.4%(+3.02)#35 | 2.1%(+3.26)#1,382 |
| 36. | 20701 | 5.4% | 2.4%(+3.02)#36 | 2.1%(+3.26)#1,383 |
| 37. | 20764 | 5.4% | 2.4%(+3.01)#37 | 2.1%(+3.25)#1,387 |
| 38. | 21042 | 5.2% | 2.4%(+2.86)#38 | 2.1%(+3.10)#1,487 |
| 39. | 21251 | 5.2% | 2.4%(+2.82)#39 | 2.1%(+3.06)#1,512 |
| 40. | 21659 | 5.2% | 2.4%(+2.78)#40 | 2.1%(+3.02)#1,543 |
| 41. | 21770 | 5.1% | 2.4%(+2.73)#41 | 2.1%(+2.97)#1,585 |
| 42. | 21153 | 4.9% | 2.4%(+2.51)#42 | 2.1%(+2.75)#1,735 |
| 43. | 21917 | 4.9% | 2.4%(+2.51)#43 | 2.1%(+2.75)#1,742 |
| 44. | 20841 | 4.8% | 2.4%(+2.45)#44 | 2.1%(+2.69)#1,801 |
| 45. | 21036 | 4.8% | 2.4%(+2.43)#45 | 2.1%(+2.67)#1,811 |
| 46. | 21046 | 4.8% | 2.4%(+2.42)#46 | 2.1%(+2.66)#1,828 |
| 47. | 20685 | 4.5% | 2.4%(+2.10)#47 | 2.1%(+2.34)#2,144 |
| 48. | 21224 | 4.5% | 2.4%(+2.08)#48 | 2.1%(+2.32)#2,172 |
| 49. | 21075 | 4.4% | 2.4%(+2.02)#49 | 2.1%(+2.26)#2,246 |
| 50. | 21043 | 4.4% | 2.4%(+1.99)#50 | 2.1%(+2.23)#2,283 |
| 51. | 21076 | 4.4% | 2.4%(+1.97)#51 | 2.1%(+2.21)#2,310 |
| 52. | 21830 | 4.3% | 2.4%(+1.93)#52 | 2.1%(+2.16)#2,355 |
| 53. | 21087 | 4.3% | 2.4%(+1.91)#53 | 2.1%(+2.15)#2,371 |
| 54. | 21057 | 4.3% | 2.4%(+1.91)#54 | 2.1%(+2.15)#2,372 |
| 55. | 21029 | 4.3% | 2.4%(+1.89)#55 | 2.1%(+2.13)#2,392 |
| 56. | 21015 | 4.2% | 2.4%(+1.86)#56 | 2.1%(+2.10)#2,434 |
| 57. | 20868 | 4.2% | 2.4%(+1.85)#57 | 2.1%(+2.09)#2,452 |
| 58. | 20880 | 4.2% | 2.4%(+1.85)#58 | 2.1%(+2.08)#2,454 |
| 59. | 21913 | 4.2% | 2.4%(+1.84)#59 | 2.1%(+2.08)#2,460 |
| 60. | 21131 | 4.2% | 2.4%(+1.80)#60 | 2.1%(+2.04)#2,506 |
| 61. | 21132 | 4.2% | 2.4%(+1.77)#61 | 2.1%(+2.01)#2,539 |
| 62. | 20910 | 4.2% | 2.4%(+1.77)#62 | 2.1%(+2.01)#2,546 |
| 63. | 21648 | 4.1% | 2.4%(+1.74)#63 | 2.1%(+1.98)#2,579 |
| 64. | 20732 | 4.1% | 2.4%(+1.71)#64 | 2.1%(+1.95)#2,622 |
| 65. | 21155 | 4.1% | 2.4%(+1.69)#65 | 2.1%(+1.93)#2,651 |
| 66. | 21044 | 4.1% | 2.4%(+1.69)#66 | 2.1%(+1.93)#2,656 |
| 67. | 21230 | 4.1% | 2.4%(+1.68)#67 | 2.1%(+1.92)#2,674 |
| 68. | 20689 | 4.0% | 2.4%(+1.66)#68 | 2.1%(+1.90)#2,707 |
| 69. | 20662 | 4.0% | 2.4%(+1.61)#69 | 2.1%(+1.85)#2,768 |
| 70. | 20659 | 3.9% | 2.4%(+1.55)#70 | 2.1%(+1.79)#2,873 |
| 71. | 21918 | 3.9% | 2.4%(+1.53)#71 | 2.1%(+1.77)#2,906 |
| 72. | 20871 | 3.9% | 2.4%(+1.51)#72 | 2.1%(+1.75)#2,942 |
| 73. | 21750 | 3.9% | 2.4%(+1.50)#73 | 2.1%(+1.74)#2,957 |
| 74. | 21048 | 3.9% | 2.4%(+1.50)#74 | 2.1%(+1.74)#2,960 |
| 75. | 21014 | 3.9% | 2.4%(+1.49)#75 | 2.1%(+1.73)#2,968 |
| 76. | 21619 | 3.9% | 2.4%(+1.48)#76 | 2.1%(+1.72)#2,981 |
| 77. | 20723 | 3.8% | 2.4%(+1.46)#77 | 2.1%(+1.70)#3,015 |
| 78. | 21154 | 3.8% | 2.4%(+1.40)#78 | 2.1%(+1.64)#3,125 |
| 79. | 21128 | 3.8% | 2.4%(+1.39)#79 | 2.1%(+1.63)#3,138 |
| 80. | 20833 | 3.8% | 2.4%(+1.39)#80 | 2.1%(+1.62)#3,142 |
| 81. | 20896 | 3.7% | 2.4%(+1.34)#81 | 2.1%(+1.58)#3,240 |
| 82. | 20657 | 3.7% | 2.4%(+1.32)#82 | 2.1%(+1.56)#3,266 |
| 83. | 21162 | 3.7% | 2.4%(+1.30)#83 | 2.1%(+1.54)#3,311 |
| 84. | 21084 | 3.6% | 2.4%(+1.26)#84 | 2.1%(+1.50)#3,413 |
| 85. | 21228 | 3.6% | 2.4%(+1.22)#85 | 2.1%(+1.46)#3,497 |
| 86. | 21034 | 3.6% | 2.4%(+1.18)#86 | 2.1%(+1.42)#3,575 |
| 87. | 21163 | 3.6% | 2.4%(+1.18)#87 | 2.1%(+1.41)#3,585 |
| 88. | 21146 | 3.6% | 2.4%(+1.17)#88 | 2.1%(+1.41)#3,587 |
| 89. | 21409 | 3.5% | 2.4%(+1.15)#89 | 2.1%(+1.39)#3,644 |
| 90. | 20832 | 3.5% | 2.4%(+1.15)#90 | 2.1%(+1.39)#3,648 |
| 91. | 21035 | 3.5% | 2.4%(+1.14)#91 | 2.1%(+1.38)#3,659 |
| 92. | 20724 | 3.5% | 2.4%(+1.14)#92 | 2.1%(+1.37)#3,672 |
| 93. | 21210 | 3.5% | 2.4%(+1.11)#93 | 2.1%(+1.34)#3,754 |
| 94. | 21784 | 3.5% | 2.4%(+1.09)#94 | 2.1%(+1.33)#3,786 |
| 95. | 21231 | 3.5% | 2.4%(+1.09)#95 | 2.1%(+1.32)#3,810 |
| 96. | 21829 | 3.4% | 2.4%(+1.06)#96 | 2.1%(+1.30)#3,860 |
| 97. | 20646 | 3.4% | 2.4%(+1.06)#97 | 2.1%(+1.30)#3,870 |
| 98. | 21658 | 3.4% | 2.4%(+1.05)#98 | 2.1%(+1.29)#3,888 |
| 99. | 20837 | 3.4% | 2.4%(+1.03)#99 | 2.1%(+1.26)#3,936 |
| 100. | 20855 | 3.4% | 2.4%(+1.02)#100 | 2.1%(+1.26)#3,938 |
Common Questions
What are the Top 10 Zip Codes with the Highest Percentage of Population Employed in Architecture & Engineering in Maryland?
Top 10 Zip Codes with the Highest Percentage of Population Employed in Architecture & Engineering in Maryland are:
What zip code has the Highest Percentage of Population Employed in Architecture & Engineering in Maryland?
20630 has the Highest Percentage of Population Employed in Architecture & Engineering in Maryland with 37.1%.
What is the Percentage of Population Employed in Architecture & Engineering in the State of Maryland?
Percentage of Population Employed in Architecture & Engineering in Maryland is 2.4%.
What is the Percentage of Population Employed in Architecture & Engineering in the United States?
Percentage of Population Employed in Architecture & Engineering in the United States is 2.1%.