La Pine, OR Map & Demographics
La Pine Map
La Pine Overview
$24,382
PER CAPITA INCOME
$54,091
AVG FAMILY INCOME
$50,625
AVG HOUSEHOLD INCOME
43.1%
WAGE / INCOME GAP [ % ]
56.9¢/ $1
WAGE / INCOME GAP [ $ ]
0.40
INEQUALITY / GINI INDEX
2,483
TOTAL POPULATION
1,327
MALE POPULATION
1,156
FEMALE POPULATION
114.79
MALES / 100 FEMALES
87.11
FEMALES / 100 MALES
47.9
MEDIAN AGE
3.1
AVG FAMILY SIZE
2.5
AVG HOUSEHOLD SIZE
904
LABOR FORCE [ PEOPLE ]
43.6%
PERCENT IN LABOR FORCE
5.4%
UNEMPLOYMENT RATE
La Pine Zip Codes
La Pine Area Codes
Income in La Pine
Income Overview in La Pine
Per Capita Income in La Pine is $24,382, while median incomes of families and households are $54,091 and $50,625 respectively.
| Characteristic | Number | Measure |
| Per Capita Income | 2,483 | $24,382 |
| Median Family Income | 618 | $54,091 |
| Mean Family Income | 618 | $61,260 |
| Median Household Income | 969 | $50,625 |
| Mean Household Income | 969 | $59,872 |
| Income Deficit | 618 | $0 |
| Wage / Income Gap (%) | 2,483 | 43.15% |
| Wage / Income Gap ($) | 2,483 | 56.85¢ per $1 |
| Gini / Inequality Index | 2,483 | 0.40 |
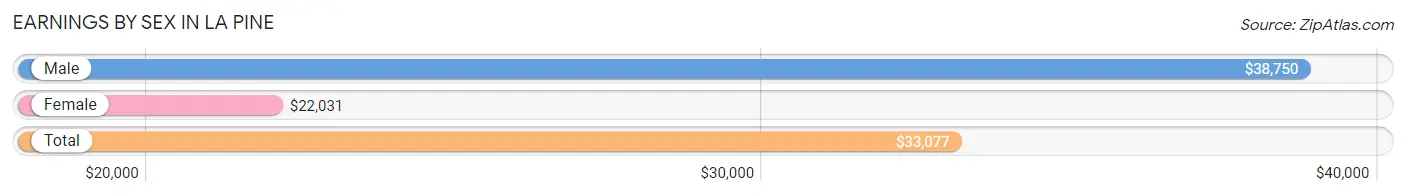
Earnings by Sex in La Pine
Average Earnings in La Pine are $33,077, $38,750 for men and $22,031 for women, a difference of 43.1%.
| Sex | Number | Average Earnings |
| Male | 595 (62.5%) | $38,750 |
| Female | 357 (37.5%) | $22,031 |
| Total | 952 (100.0%) | $33,077 |
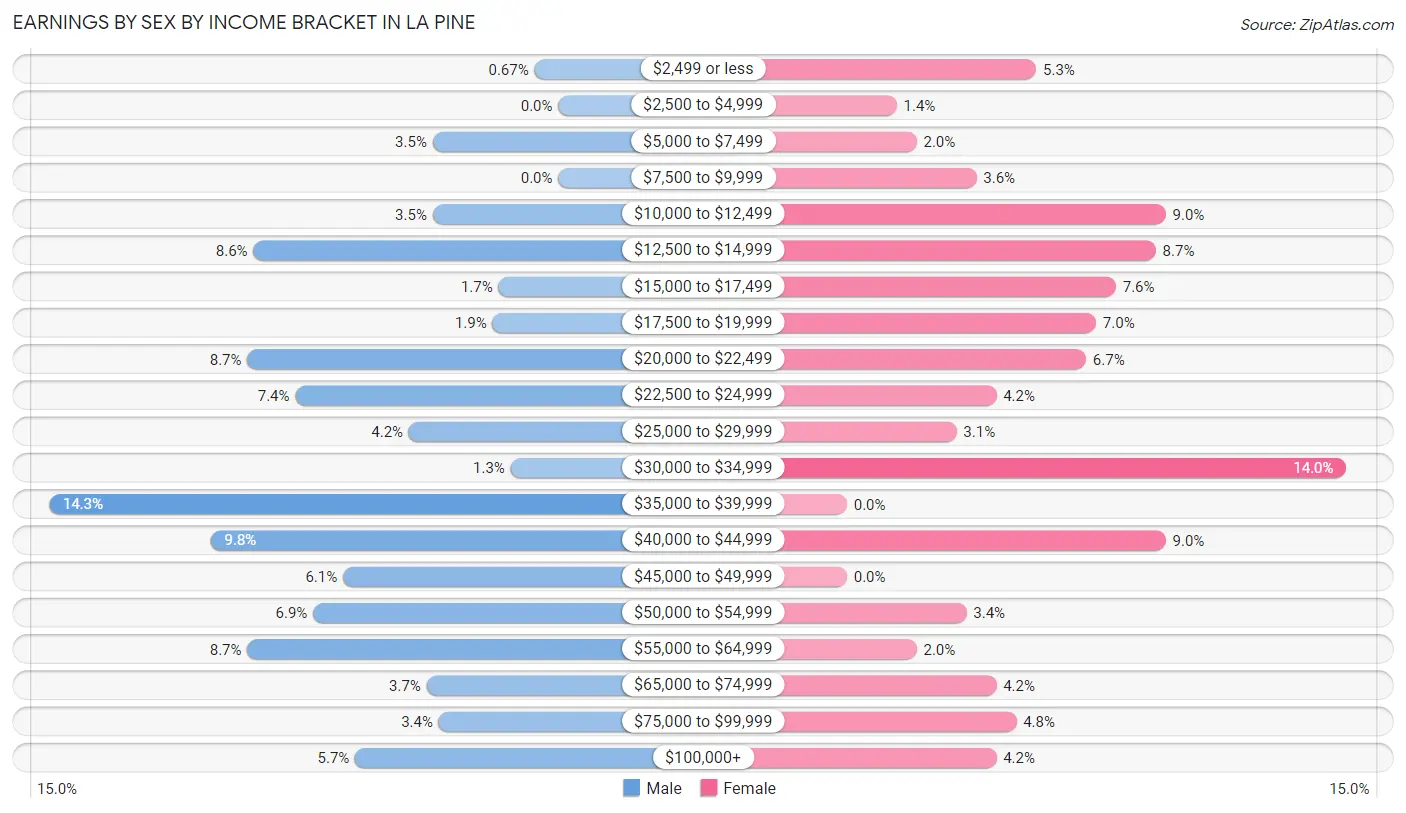
Earnings by Sex by Income Bracket in La Pine
The most common earnings brackets in La Pine are $35,000 to $39,999 for men (85 | 14.3%) and $30,000 to $34,999 for women (50 | 14.0%).
| Income | Male | Female |
| $2,499 or less | 4 (0.7%) | 19 (5.3%) |
| $2,500 to $4,999 | 0 (0.0%) | 5 (1.4%) |
| $5,000 to $7,499 | 21 (3.5%) | 7 (2.0%) |
| $7,500 to $9,999 | 0 (0.0%) | 13 (3.6%) |
| $10,000 to $12,499 | 21 (3.5%) | 32 (9.0%) |
| $12,500 to $14,999 | 51 (8.6%) | 31 (8.7%) |
| $15,000 to $17,499 | 10 (1.7%) | 27 (7.6%) |
| $17,500 to $19,999 | 11 (1.8%) | 25 (7.0%) |
| $20,000 to $22,499 | 52 (8.7%) | 24 (6.7%) |
| $22,500 to $24,999 | 44 (7.4%) | 15 (4.2%) |
| $25,000 to $29,999 | 25 (4.2%) | 11 (3.1%) |
| $30,000 to $34,999 | 8 (1.3%) | 50 (14.0%) |
| $35,000 to $39,999 | 85 (14.3%) | 0 (0.0%) |
| $40,000 to $44,999 | 58 (9.8%) | 32 (9.0%) |
| $45,000 to $49,999 | 36 (6.0%) | 0 (0.0%) |
| $50,000 to $54,999 | 41 (6.9%) | 12 (3.4%) |
| $55,000 to $64,999 | 52 (8.7%) | 7 (2.0%) |
| $65,000 to $74,999 | 22 (3.7%) | 15 (4.2%) |
| $75,000 to $99,999 | 20 (3.4%) | 17 (4.8%) |
| $100,000+ | 34 (5.7%) | 15 (4.2%) |
| Total | 595 (100.0%) | 357 (100.0%) |
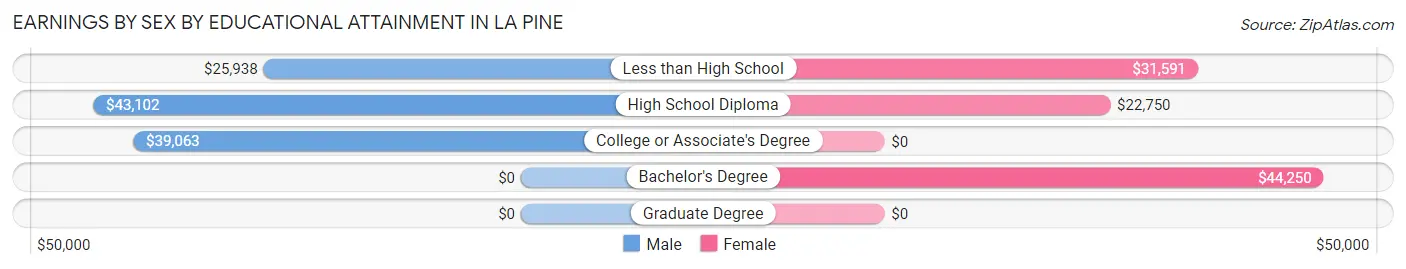
Earnings by Sex by Educational Attainment in La Pine
Average earnings in La Pine are $39,438 for men and $24,167 for women, a difference of 38.7%. Men with an educational attainment of high school diploma enjoy the highest average annual earnings of $43,102, while those with less than high school education earn the least with $25,938. Women with an educational attainment of bachelor's degree earn the most with the average annual earnings of $44,250, while those with high school diploma education have the smallest earnings of $22,750.
| Educational Attainment | Male Income | Female Income |
| Less than High School | $25,938 | $31,591 |
| High School Diploma | $43,102 | $22,750 |
| College or Associate's Degree | $39,063 | $0 |
| Bachelor's Degree | - | - |
| Graduate Degree | - | - |
| Total | $39,438 | $24,167 |
Family Income in La Pine
Family Income Brackets in La Pine
According to the La Pine family income data, there are 227 families falling into the $50,000 to $74,999 income range, which is the most common income bracket and makes up 36.7% of all families. Conversely, the less than $10,000 income bracket is the least frequent group with only 9 families (1.5%) belonging to this category.
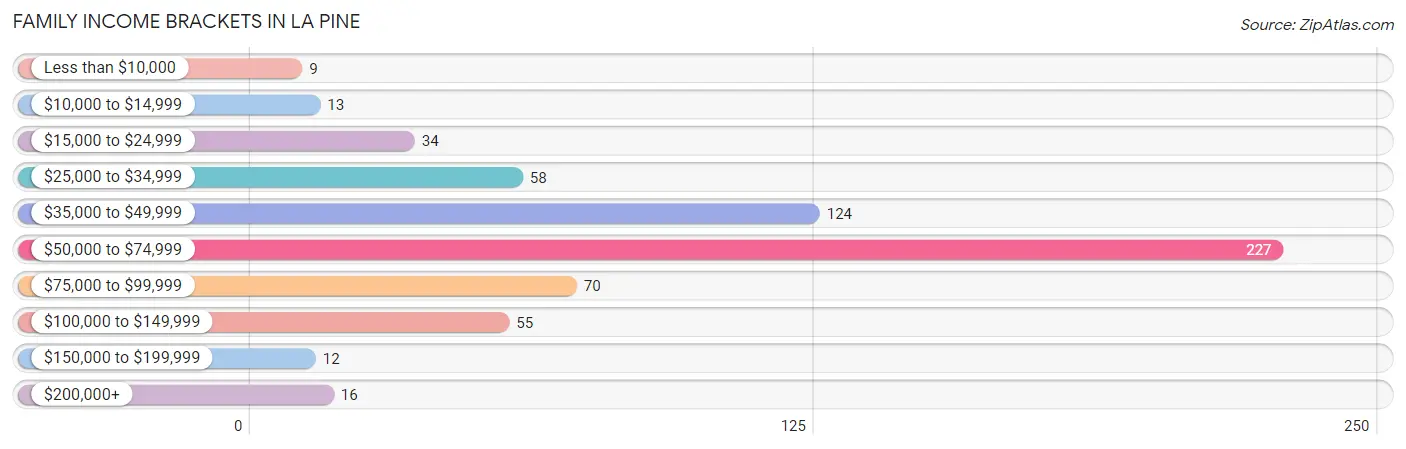
| Income Bracket | # Families | % Families |
| Less than $10,000 | 9 | 1.5% |
| $10,000 to $14,999 | 13 | 2.1% |
| $15,000 to $24,999 | 34 | 5.5% |
| $25,000 to $34,999 | 58 | 9.4% |
| $35,000 to $49,999 | 124 | 20.1% |
| $50,000 to $74,999 | 227 | 36.7% |
| $75,000 to $99,999 | 70 | 11.3% |
| $100,000 to $149,999 | 55 | 8.9% |
| $150,000 to $199,999 | 12 | 1.9% |
| $200,000+ | 16 | 2.6% |
Family Income by Famaliy Size in La Pine
7+ person families (43 | 7.0%) account for the highest median family income in La Pine with $83,092 per family, while 2-person families (332 | 53.7%) have the highest median income of $26,295 per family member.
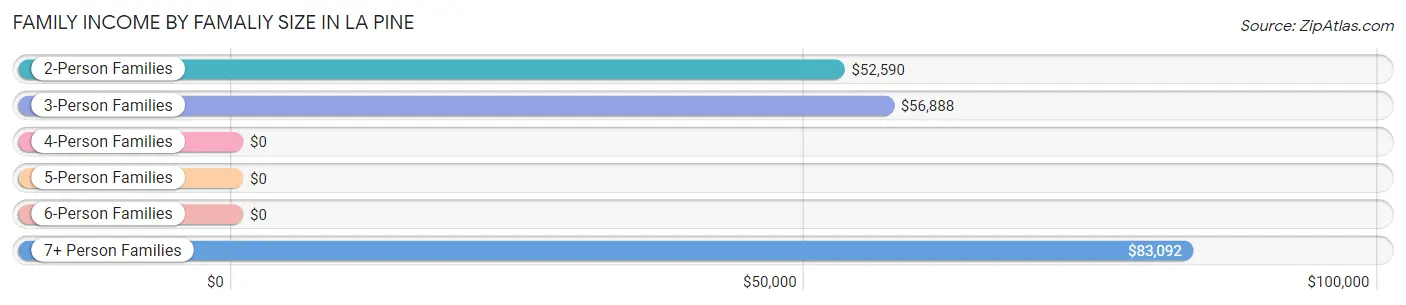
| Income Bracket | # Families | Median Income |
| 2-Person Families | 332 (53.7%) | $52,590 |
| 3-Person Families | 151 (24.4%) | $56,888 |
| 4-Person Families | 40 (6.5%) | $0 |
| 5-Person Families | 52 (8.4%) | $0 |
| 6-Person Families | 0 (0.0%) | $0 |
| 7+ Person Families | 43 (7.0%) | $83,092 |
| Total | 618 (100.0%) | $54,091 |
Family Income by Number of Earners in La Pine
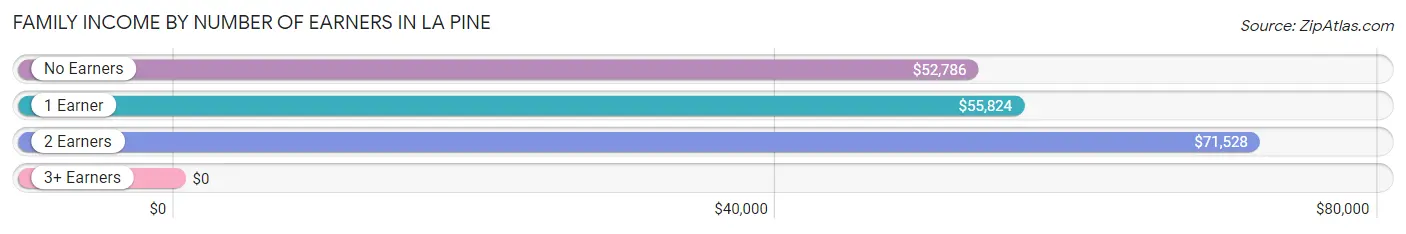
| Number of Earners | # Families | Median Income |
| No Earners | 209 (33.8%) | $52,786 |
| 1 Earner | 247 (40.0%) | $55,824 |
| 2 Earners | 137 (22.2%) | $71,528 |
| 3+ Earners | 25 (4.1%) | $0 |
| Total | 618 (100.0%) | $54,091 |
Household Income in La Pine
Household Income Brackets in La Pine
With 274 households falling in the category, the $50,000 to $74,999 income range is the most frequent in La Pine, accounting for 28.3% of all households. In contrast, only 12 households (1.2%) fall into the $150,000 to $199,999 income bracket, making it the least populous group.
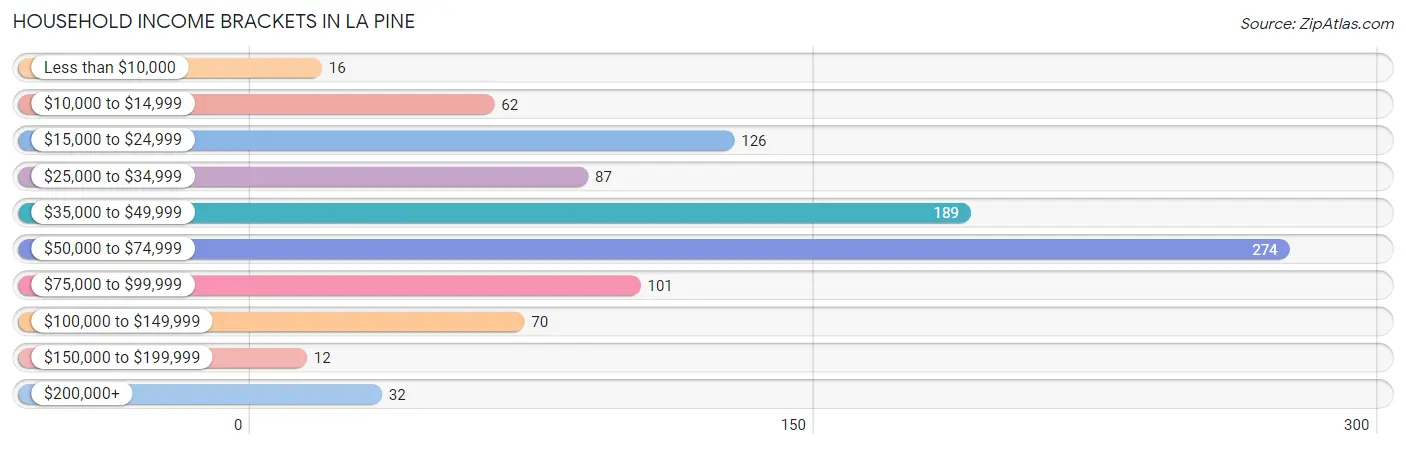
| Income Bracket | # Households | % Households |
| Less than $10,000 | 16 | 1.7% |
| $10,000 to $14,999 | 62 | 6.4% |
| $15,000 to $24,999 | 126 | 13.0% |
| $25,000 to $34,999 | 87 | 9.0% |
| $35,000 to $49,999 | 189 | 19.5% |
| $50,000 to $74,999 | 274 | 28.3% |
| $75,000 to $99,999 | 101 | 10.4% |
| $100,000 to $149,999 | 70 | 7.2% |
| $150,000 to $199,999 | 12 | 1.2% |
| $200,000+ | 32 | 3.3% |
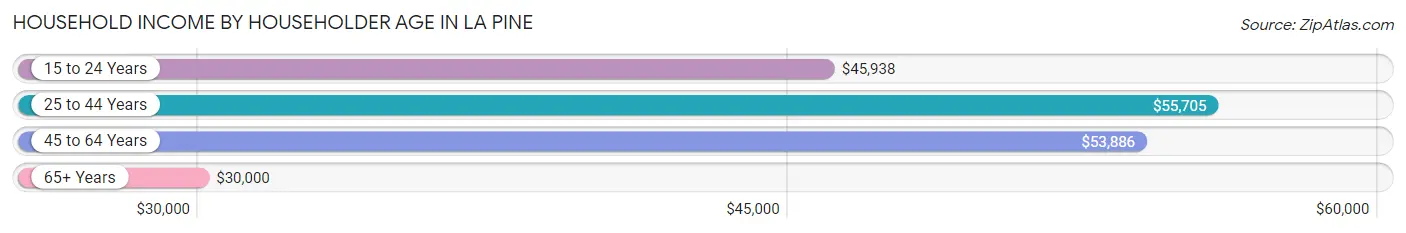
Household Income by Householder Age in La Pine
The median household income in La Pine is $50,625, with the highest median household income of $55,705 found in the 25 to 44 years age bracket for the primary householder. A total of 244 households (25.2%) fall into this category. Meanwhile, the 65+ years age bracket for the primary householder has the lowest median household income of $30,000, with 316 households (32.6%) in this group.
| Income Bracket | # Households | Median Income |
| 15 to 24 Years | 51 (5.3%) | $45,938 |
| 25 to 44 Years | 244 (25.2%) | $55,705 |
| 45 to 64 Years | 358 (36.9%) | $53,886 |
| 65+ Years | 316 (32.6%) | $30,000 |
| Total | 969 (100.0%) | $50,625 |
Poverty in La Pine
Income Below Poverty by Sex and Age in La Pine
With 12.1% poverty level for males and 17.7% for females among the residents of La Pine, 6 to 11 year old males and 5 year old females are the most vulnerable to poverty, with 30 males (41.1%) and 22 females (53.7%) in their respective age groups living below the poverty level.
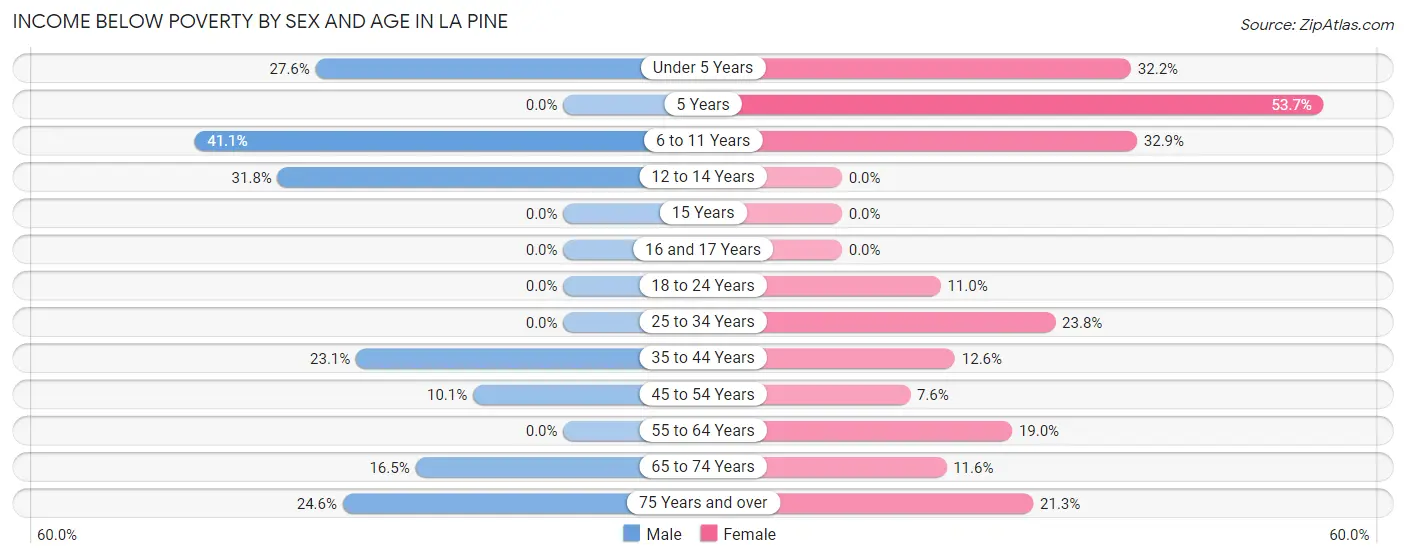
| Age Bracket | Male | Female |
| Under 5 Years | 24 (27.6%) | 19 (32.2%) |
| 5 Years | 0 (0.0%) | 22 (53.7%) |
| 6 to 11 Years | 30 (41.1%) | 23 (32.9%) |
| 12 to 14 Years | 7 (31.8%) | 0 (0.0%) |
| 15 Years | 0 (0.0%) | 0 (0.0%) |
| 16 and 17 Years | 0 (0.0%) | 0 (0.0%) |
| 18 to 24 Years | 0 (0.0%) | 10 (11.0%) |
| 25 to 34 Years | 0 (0.0%) | 24 (23.8%) |
| 35 to 44 Years | 36 (23.1%) | 17 (12.6%) |
| 45 to 54 Years | 17 (10.1%) | 12 (7.6%) |
| 55 to 64 Years | 0 (0.0%) | 36 (19.0%) |
| 65 to 74 Years | 28 (16.5%) | 15 (11.6%) |
| 75 Years and over | 14 (24.6%) | 26 (21.3%) |
| Total | 156 (12.1%) | 204 (17.7%) |
Income Above Poverty by Sex and Age in La Pine
According to the poverty statistics in La Pine, males aged 5 years and females aged 12 to 14 years are the age groups that are most secure financially, with 100.0% of males and 100.0% of females in these age groups living above the poverty line.
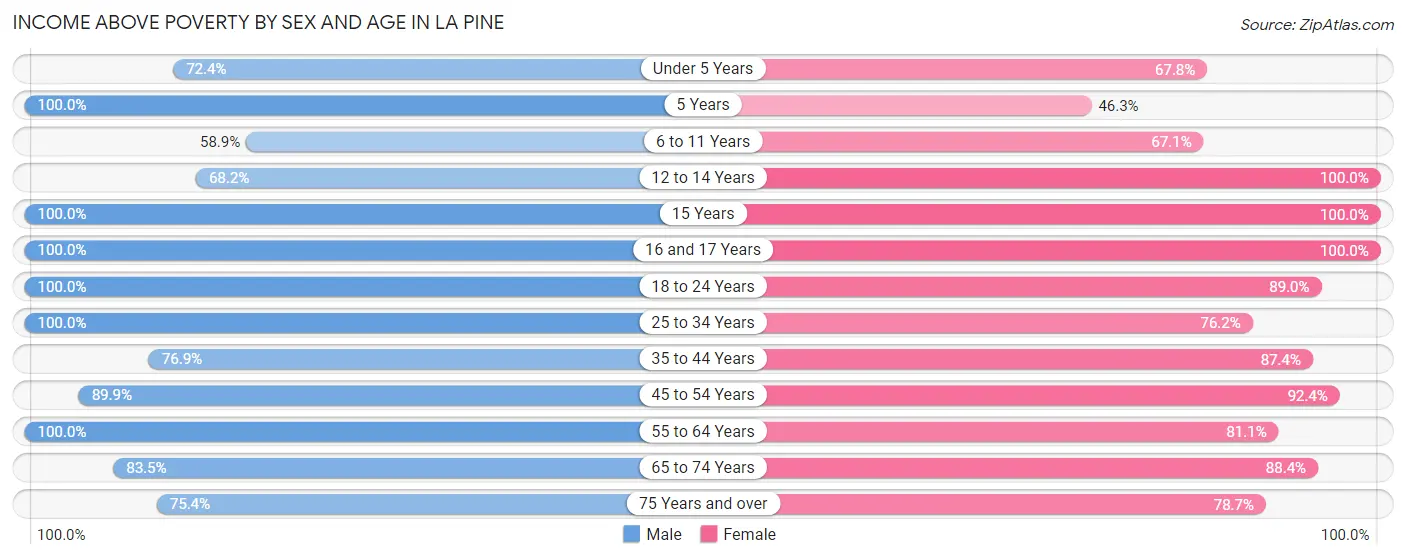
| Age Bracket | Male | Female |
| Under 5 Years | 63 (72.4%) | 40 (67.8%) |
| 5 Years | 19 (100.0%) | 19 (46.3%) |
| 6 to 11 Years | 43 (58.9%) | 47 (67.1%) |
| 12 to 14 Years | 15 (68.2%) | 18 (100.0%) |
| 15 Years | 10 (100.0%) | 11 (100.0%) |
| 16 and 17 Years | 38 (100.0%) | 26 (100.0%) |
| 18 to 24 Years | 127 (100.0%) | 81 (89.0%) |
| 25 to 34 Years | 124 (100.0%) | 77 (76.2%) |
| 35 to 44 Years | 120 (76.9%) | 118 (87.4%) |
| 45 to 54 Years | 152 (89.9%) | 146 (92.4%) |
| 55 to 64 Years | 242 (100.0%) | 154 (81.0%) |
| 65 to 74 Years | 142 (83.5%) | 114 (88.4%) |
| 75 Years and over | 43 (75.4%) | 96 (78.7%) |
| Total | 1,138 (87.9%) | 947 (82.3%) |
Income Below Poverty Among Married-Couple Families in La Pine
The poverty statistics for married-couple families in La Pine show that 5.3% or 21 of the total 399 families live below the poverty line. Families with 5 or more children have the highest poverty rate of 70.8%, comprising of 17 families. On the other hand, families with 1 or 2 children have the lowest poverty rate of 0.0%, which includes 0 families.
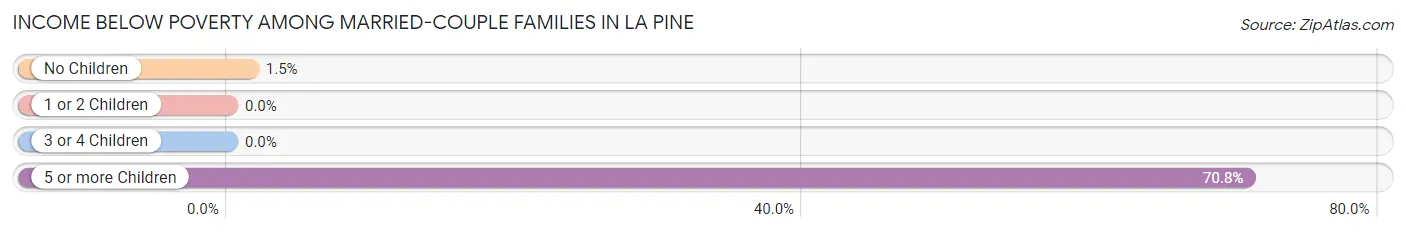
| Children | Above Poverty | Below Poverty |
| No Children | 271 (98.6%) | 4 (1.5%) |
| 1 or 2 Children | 84 (100.0%) | 0 (0.0%) |
| 3 or 4 Children | 16 (100.0%) | 0 (0.0%) |
| 5 or more Children | 7 (29.2%) | 17 (70.8%) |
| Total | 378 (94.7%) | 21 (5.3%) |
Income Below Poverty Among Single-Parent Households in La Pine
According to the poverty data in La Pine, 6.5% or 5 single-father households and 12.7% or 18 single-mother households are living below the poverty line. Among single-father households, those with no children have the highest poverty rate, with 5 households (50.0%) experiencing poverty. Likewise, among single-mother households, those with 3 or 4 children have the highest poverty rate, with 13 households (100.0%) falling below the poverty line.
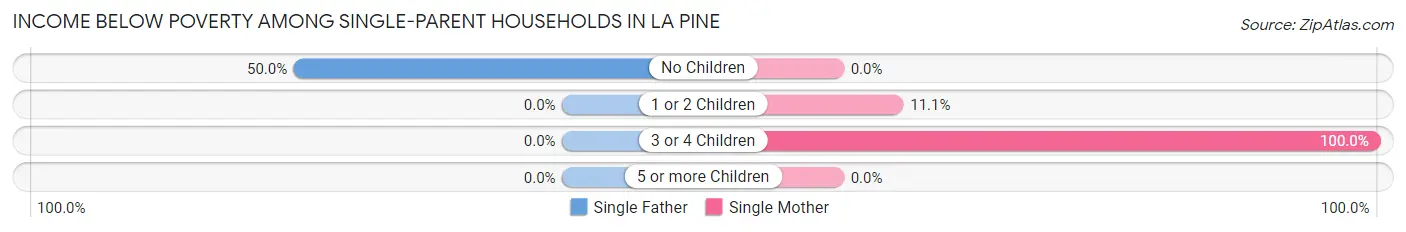
| Children | Single Father | Single Mother |
| No Children | 5 (50.0%) | 0 (0.0%) |
| 1 or 2 Children | 0 (0.0%) | 5 (11.1%) |
| 3 or 4 Children | 0 (0.0%) | 13 (100.0%) |
| 5 or more Children | 0 (0.0%) | 0 (0.0%) |
| Total | 5 (6.5%) | 18 (12.7%) |
Income Below Poverty Among Married-Couple vs Single-Parent Households in La Pine
The poverty data for La Pine shows that 21 of the married-couple family households (5.3%) and 23 of the single-parent households (10.5%) are living below the poverty level. Within the married-couple family households, those with 5 or more children have the highest poverty rate, with 17 households (70.8%) falling below the poverty line. Among the single-parent households, those with 3 or 4 children have the highest poverty rate, with 13 household (100.0%) living below poverty.
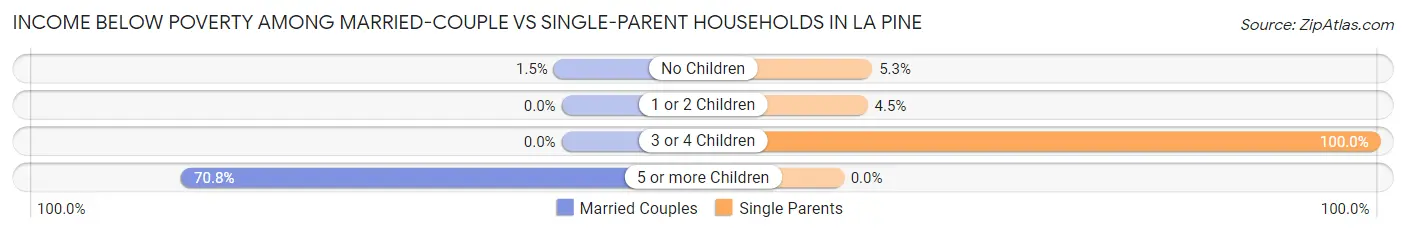
| Children | Married-Couple Families | Single-Parent Households |
| No Children | 4 (1.5%) | 5 (5.3%) |
| 1 or 2 Children | 0 (0.0%) | 5 (4.5%) |
| 3 or 4 Children | 0 (0.0%) | 13 (100.0%) |
| 5 or more Children | 17 (70.8%) | 0 (0.0%) |
| Total | 21 (5.3%) | 23 (10.5%) |
Race in La Pine
The most populous races in La Pine are White / Caucasian (2,111 | 85.0%), Hispanic or Latino (387 | 15.6%), and Two or more Races (277 | 11.2%).
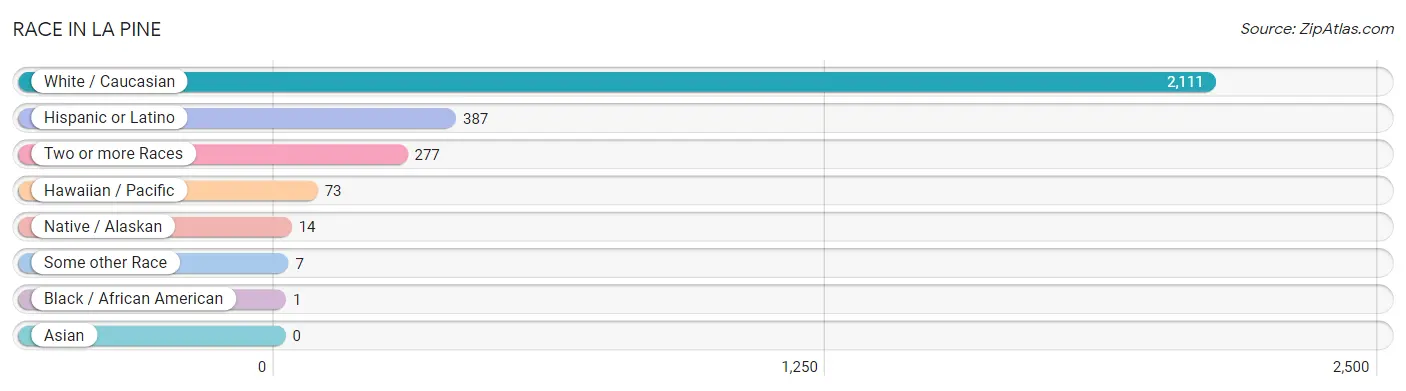
| Race | # Population | % Population |
| Asian | 0 | 0.0% |
| Black / African American | 1 | 0.0% |
| Hawaiian / Pacific | 73 | 2.9% |
| Hispanic or Latino | 387 | 15.6% |
| Native / Alaskan | 14 | 0.6% |
| White / Caucasian | 2,111 | 85.0% |
| Two or more Races | 277 | 11.2% |
| Some other Race | 7 | 0.3% |
| Total | 2,483 | 100.0% |
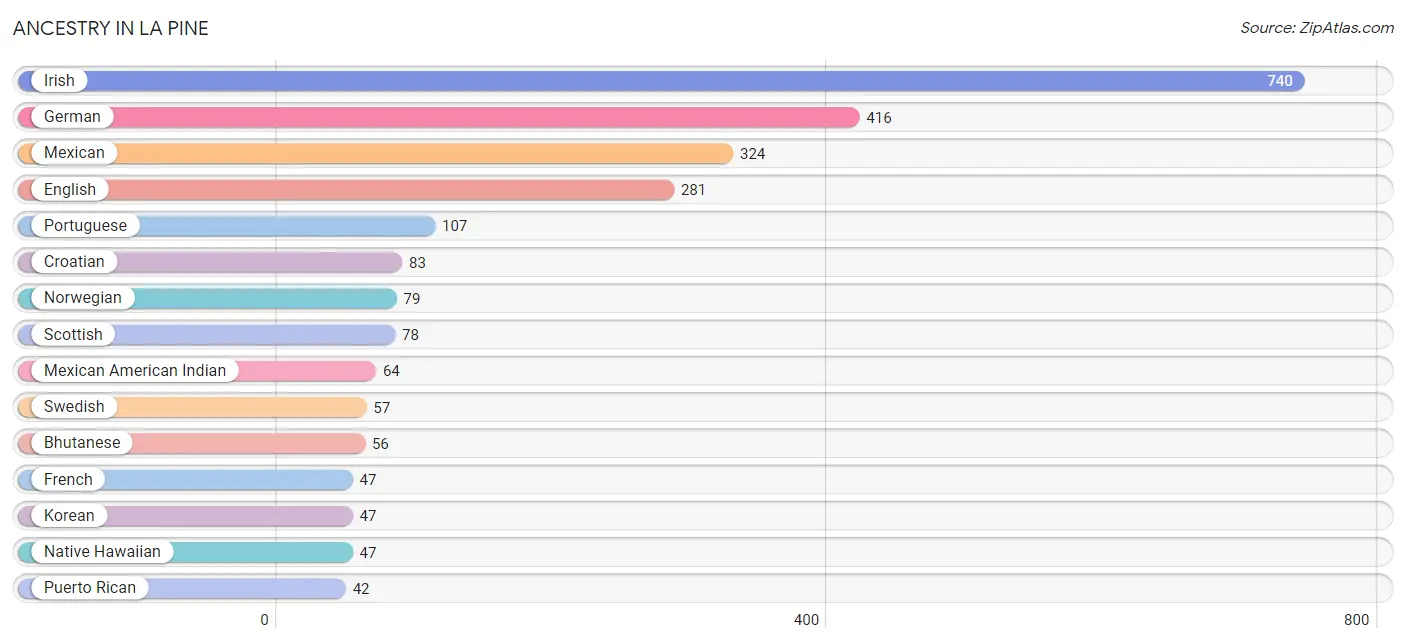
Ancestry in La Pine
The most populous ancestries reported in La Pine are Irish (740 | 29.8%), German (416 | 16.8%), Mexican (324 | 13.1%), English (281 | 11.3%), and Portuguese (107 | 4.3%), together accounting for 75.2% of all La Pine residents.
| Ancestry | # Population | % Population |
| American | 36 | 1.5% |
| Armenian | 5 | 0.2% |
| Bhutanese | 56 | 2.3% |
| Celtic | 7 | 0.3% |
| Cherokee | 9 | 0.4% |
| Croatian | 83 | 3.3% |
| Dutch | 5 | 0.2% |
| Eastern European | 4 | 0.2% |
| English | 281 | 11.3% |
| European | 14 | 0.6% |
| French | 47 | 1.9% |
| German | 416 | 16.8% |
| Hungarian | 7 | 0.3% |
| Indian (Asian) | 35 | 1.4% |
| Irish | 740 | 29.8% |
| Italian | 27 | 1.1% |
| Korean | 47 | 1.9% |
| Mexican | 324 | 13.1% |
| Mexican American Indian | 64 | 2.6% |
| Native Hawaiian | 47 | 1.9% |
| Norwegian | 79 | 3.2% |
| Pennsylvania German | 5 | 0.2% |
| Portuguese | 107 | 4.3% |
| Puerto Rican | 42 | 1.7% |
| Scandinavian | 3 | 0.1% |
| Scotch-Irish | 23 | 0.9% |
| Scottish | 78 | 3.1% |
| Slavic | 9 | 0.4% |
| Spaniard | 6 | 0.2% |
| Spanish | 15 | 0.6% |
| Swedish | 57 | 2.3% |
| Swiss | 14 | 0.6% |
| Ukrainian | 6 | 0.2% |
| Welsh | 35 | 1.4% | View All 34 Rows |
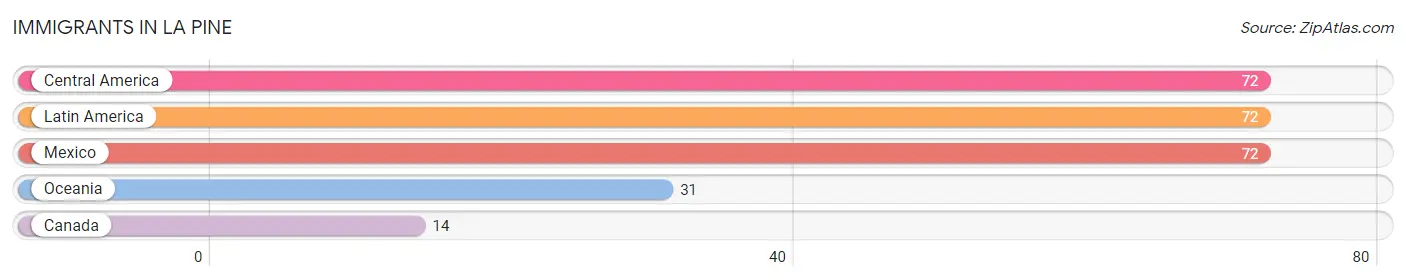
Immigrants in La Pine
The most numerous immigrant groups reported in La Pine came from Central America (72 | 2.9%), Latin America (72 | 2.9%), Mexico (72 | 2.9%), Oceania (31 | 1.3%), and Canada (14 | 0.6%), together accounting for 10.5% of all La Pine residents.
| Immigration Origin | # Population | % Population |
| Canada | 14 | 0.6% |
| Central America | 72 | 2.9% |
| Latin America | 72 | 2.9% |
| Mexico | 72 | 2.9% |
| Oceania | 31 | 1.3% | View All 5 Rows |
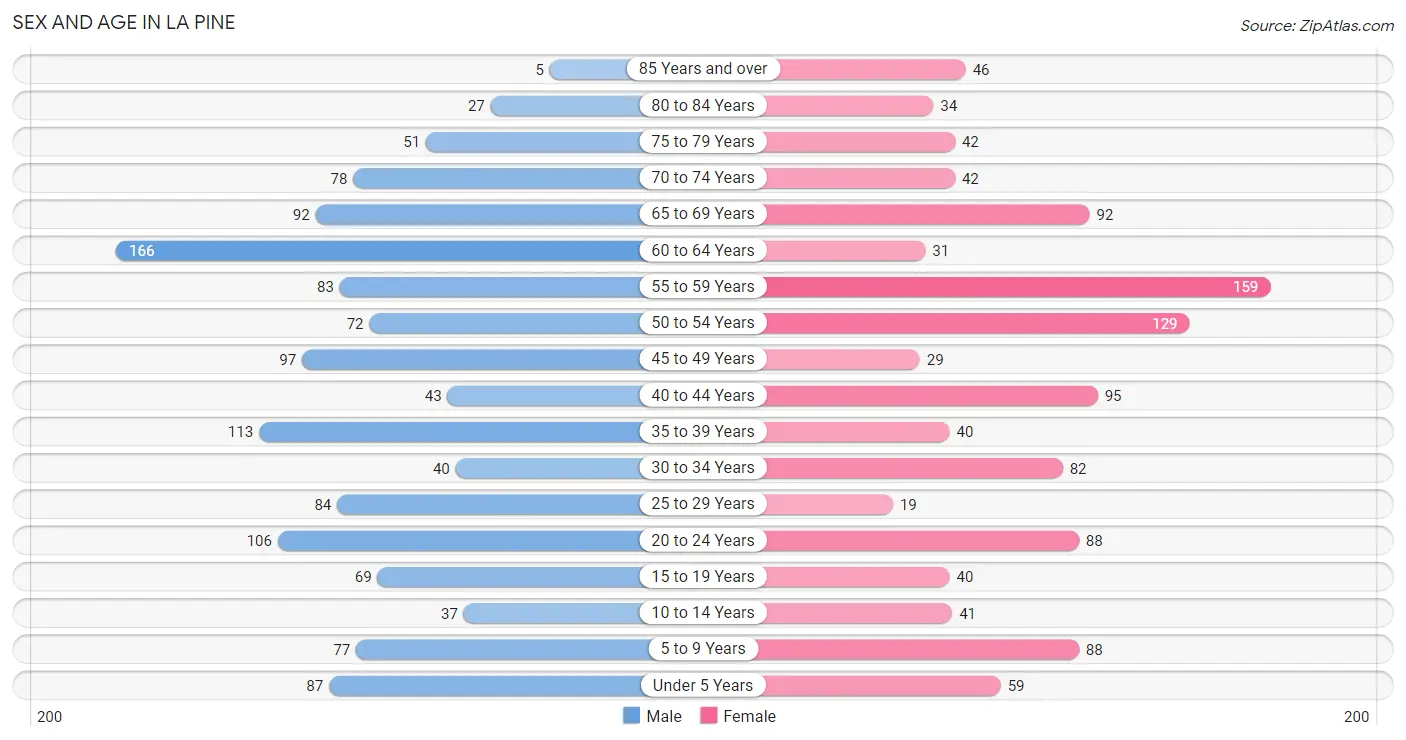
Sex and Age in La Pine
Sex and Age in La Pine
The most populous age groups in La Pine are 60 to 64 Years (166 | 12.5%) for men and 55 to 59 Years (159 | 13.8%) for women.
| Age Bracket | Male | Female |
| Under 5 Years | 87 (6.6%) | 59 (5.1%) |
| 5 to 9 Years | 77 (5.8%) | 88 (7.6%) |
| 10 to 14 Years | 37 (2.8%) | 41 (3.5%) |
| 15 to 19 Years | 69 (5.2%) | 40 (3.5%) |
| 20 to 24 Years | 106 (8.0%) | 88 (7.6%) |
| 25 to 29 Years | 84 (6.3%) | 19 (1.6%) |
| 30 to 34 Years | 40 (3.0%) | 82 (7.1%) |
| 35 to 39 Years | 113 (8.5%) | 40 (3.5%) |
| 40 to 44 Years | 43 (3.2%) | 95 (8.2%) |
| 45 to 49 Years | 97 (7.3%) | 29 (2.5%) |
| 50 to 54 Years | 72 (5.4%) | 129 (11.2%) |
| 55 to 59 Years | 83 (6.2%) | 159 (13.8%) |
| 60 to 64 Years | 166 (12.5%) | 31 (2.7%) |
| 65 to 69 Years | 92 (6.9%) | 92 (8.0%) |
| 70 to 74 Years | 78 (5.9%) | 42 (3.6%) |
| 75 to 79 Years | 51 (3.8%) | 42 (3.6%) |
| 80 to 84 Years | 27 (2.0%) | 34 (2.9%) |
| 85 Years and over | 5 (0.4%) | 46 (4.0%) |
| Total | 1,327 (100.0%) | 1,156 (100.0%) |
Families and Households in La Pine
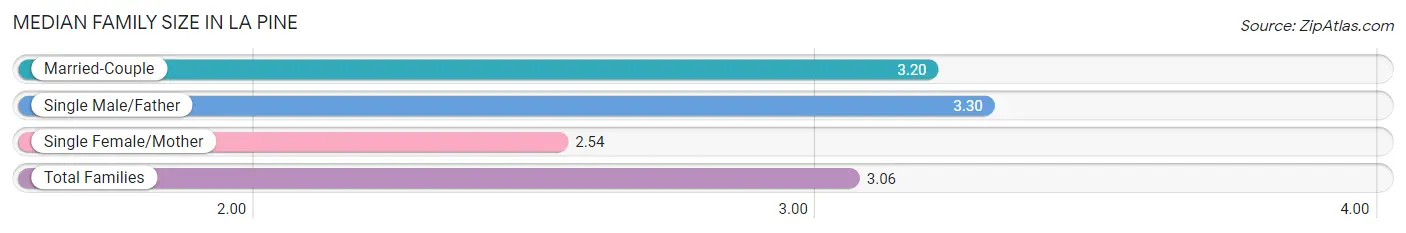
Median Family Size in La Pine
The median family size in La Pine is 3.06 persons per family, with single male/father families (77 | 12.5%) accounting for the largest median family size of 3.3 persons per family. On the other hand, single female/mother families (142 | 23.0%) represent the smallest median family size with 2.54 persons per family.
| Family Type | # Families | Family Size |
| Married-Couple | 399 (64.6%) | 3.20 |
| Single Male/Father | 77 (12.5%) | 3.30 |
| Single Female/Mother | 142 (23.0%) | 2.54 |
| Total Families | 618 (100.0%) | 3.06 |
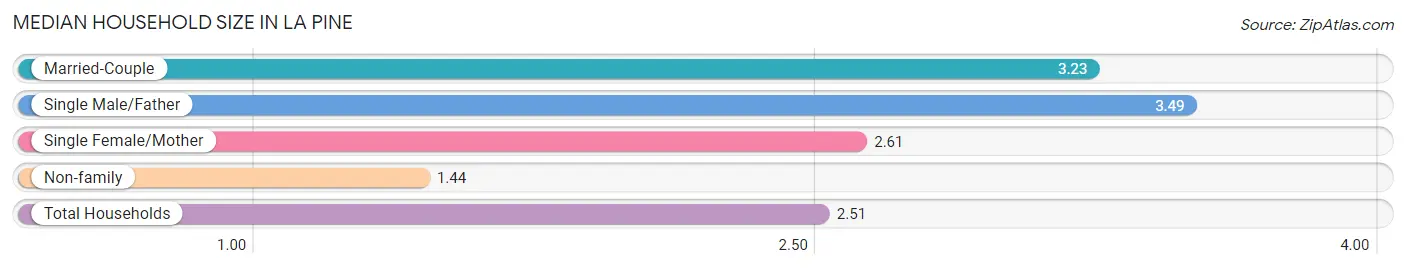
Median Household Size in La Pine
The median household size in La Pine is 2.51 persons per household, with single male/father households (77 | 8.0%) accounting for the largest median household size of 3.49 persons per household. non-family households (351 | 36.2%) represent the smallest median household size with 1.44 persons per household.
| Household Type | # Households | Household Size |
| Married-Couple | 399 (41.2%) | 3.23 |
| Single Male/Father | 77 (8.0%) | 3.49 |
| Single Female/Mother | 142 (14.6%) | 2.61 |
| Non-family | 351 (36.2%) | 1.44 |
| Total Households | 969 (100.0%) | 2.51 |
Household Size by Marriage Status in La Pine
Out of a total of 969 households in La Pine, 618 (63.8%) are family households, while 351 (36.2%) are nonfamily households. The most numerous type of family households are 2-person households, comprising 311, and the most common type of nonfamily households are 1-person households, comprising 237.
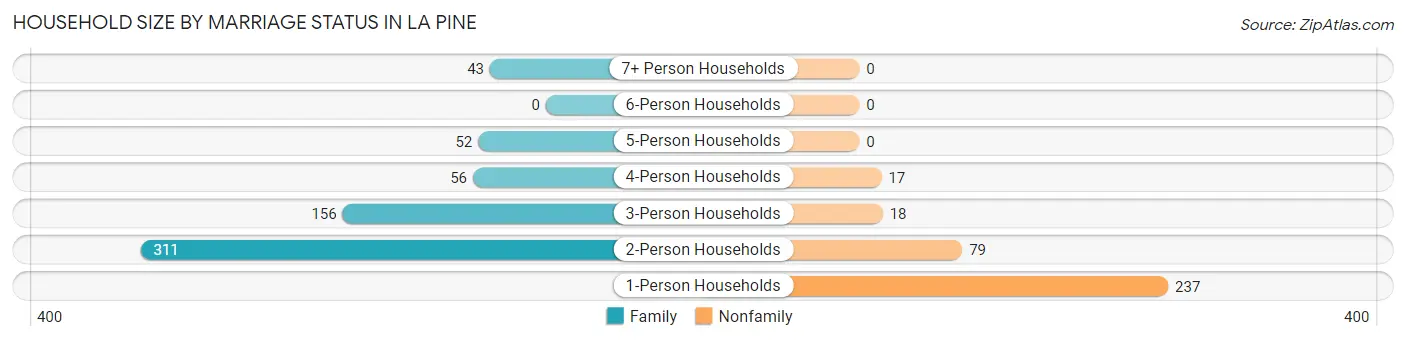
| Household Size | Family Households | Nonfamily Households |
| 1-Person Households | - | 237 (24.5%) |
| 2-Person Households | 311 (32.1%) | 79 (8.2%) |
| 3-Person Households | 156 (16.1%) | 18 (1.9%) |
| 4-Person Households | 56 (5.8%) | 17 (1.8%) |
| 5-Person Households | 52 (5.4%) | 0 (0.0%) |
| 6-Person Households | 0 (0.0%) | 0 (0.0%) |
| 7+ Person Households | 43 (4.4%) | 0 (0.0%) |
| Total | 618 (63.8%) | 351 (36.2%) |
Female Fertility in La Pine
Fertility by Age in La Pine
Average fertility rate in La Pine is 27.0 births per 1,000 women. Women in the age bracket of 20 to 34 years have the highest fertility rate with 58.0 births per 1,000 women. Women in the age bracket of 20 to 34 years acount for 100.0% of all women with births.
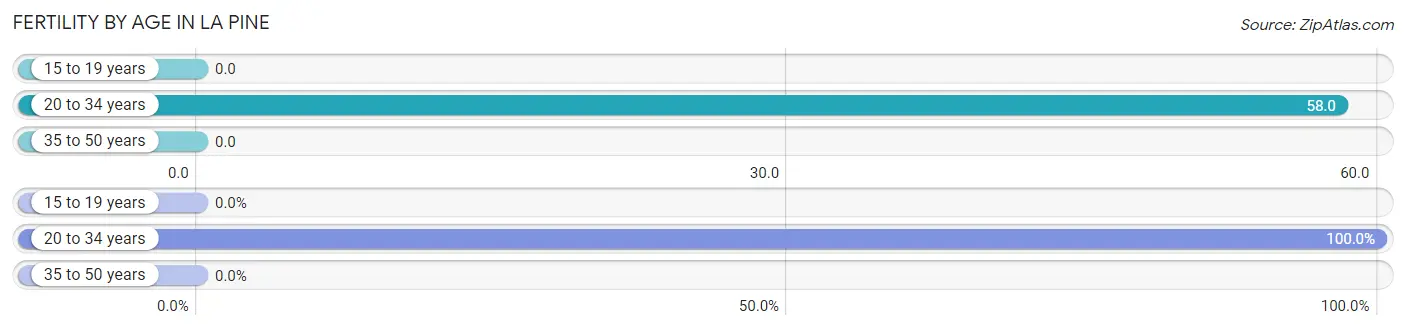
| Age Bracket | Women with Births | Births / 1,000 Women |
| 15 to 19 years | 0 (0.0%) | 0.0 |
| 20 to 34 years | 11 (100.0%) | 58.0 |
| 35 to 50 years | 0 (0.0%) | 0.0 |
| Total | 11 (100.0%) | 27.0 |
Fertility by Age by Marriage Status in La Pine
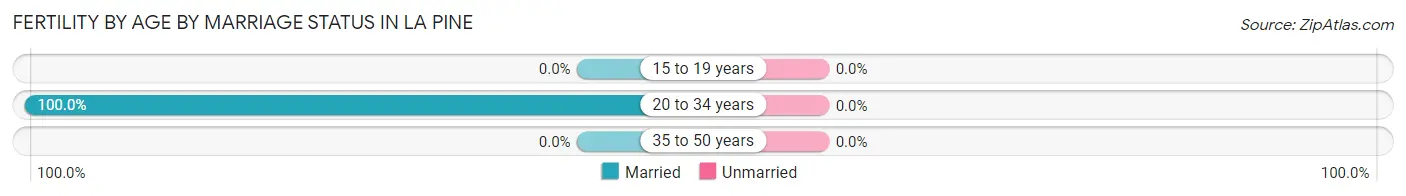
| Age Bracket | Married | Unmarried |
| 15 to 19 years | 0 (0.0%) | 0 (0.0%) |
| 20 to 34 years | 11 (100.0%) | 0 (0.0%) |
| 35 to 50 years | 0 (0.0%) | 0 (0.0%) |
| Total | 11 (100.0%) | 0 (0.0%) |
Fertility by Education in La Pine
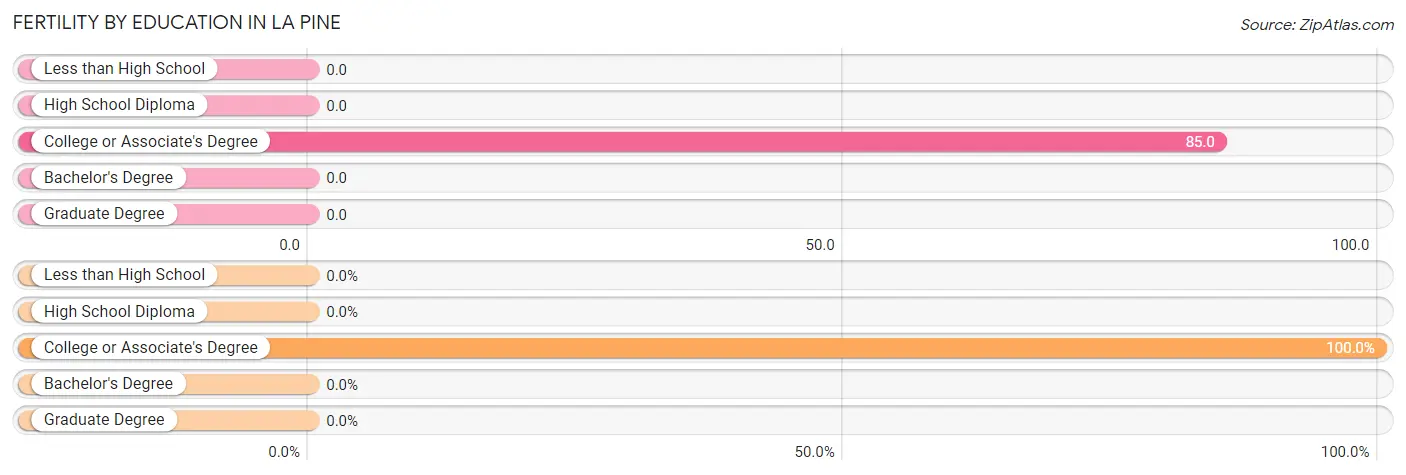
| Educational Attainment | Women with Births | Births / 1,000 Women |
| Less than High School | 0 (0.0%) | 0.0 |
| High School Diploma | 0 (0.0%) | 0.0 |
| College or Associate's Degree | 11 (100.0%) | 85.0 |
| Bachelor's Degree | 0 (0.0%) | 0.0 |
| Graduate Degree | 0 (0.0%) | 0.0 |
| Total | 11 (100.0%) | 27.0 |
Fertility by Education by Marriage Status in La Pine
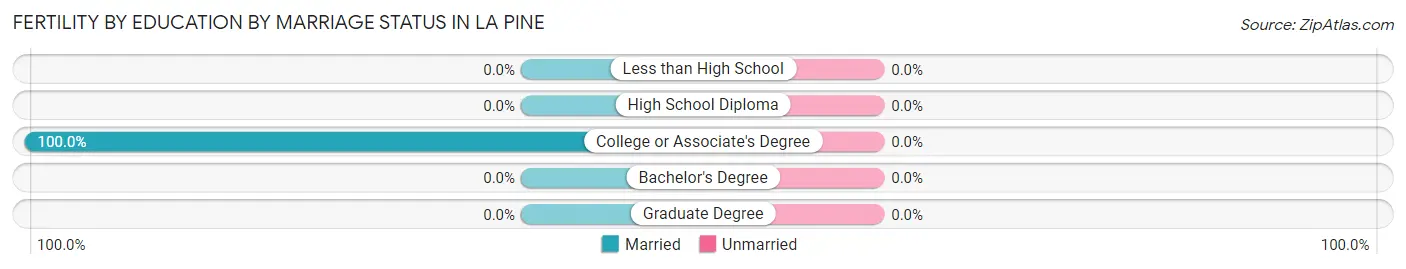
| Educational Attainment | Married | Unmarried |
| Less than High School | 0 (0.0%) | 0 (0.0%) |
| High School Diploma | 0 (0.0%) | 0 (0.0%) |
| College or Associate's Degree | 11 (100.0%) | 0 (0.0%) |
| Bachelor's Degree | 0 (0.0%) | 0 (0.0%) |
| Graduate Degree | 0 (0.0%) | 0 (0.0%) |
| Total | 11 (100.0%) | 0 (0.0%) |
Employment Characteristics in La Pine
Employment by Class of Employer in La Pine
Among the 847 employed individuals in La Pine, private company employees (583 | 68.8%), self-employed (not incorporated) (131 | 15.5%), and not-for-profit organizations (65 | 7.7%) make up the most common classes of employment.
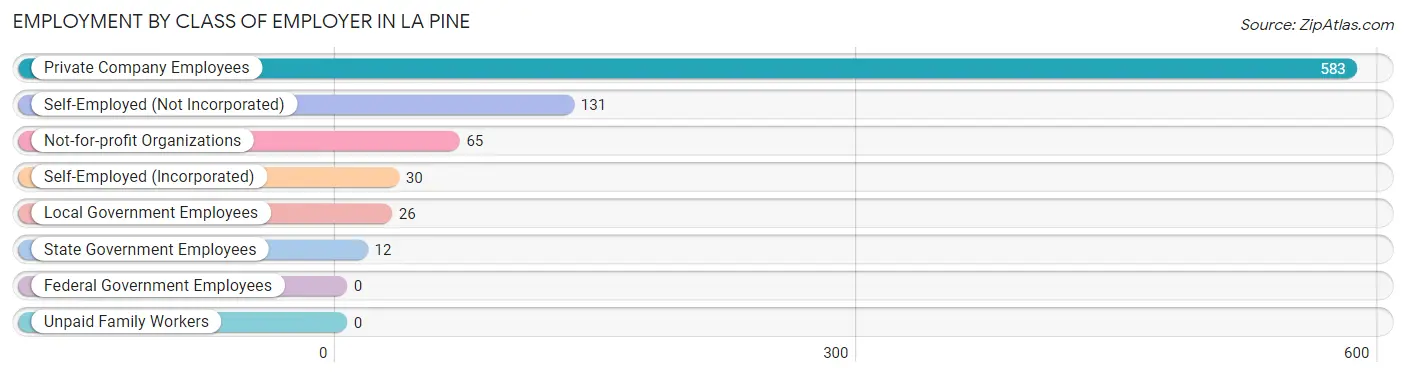
| Employer Class | # Employees | % Employees |
| Private Company Employees | 583 | 68.8% |
| Self-Employed (Incorporated) | 30 | 3.5% |
| Self-Employed (Not Incorporated) | 131 | 15.5% |
| Not-for-profit Organizations | 65 | 7.7% |
| Local Government Employees | 26 | 3.1% |
| State Government Employees | 12 | 1.4% |
| Federal Government Employees | 0 | 0.0% |
| Unpaid Family Workers | 0 | 0.0% |
| Total | 847 | 100.0% |
Employment Status by Age in La Pine
According to the labor force statistics for La Pine, out of the total population over 16 years of age (2,073), 43.6% or 904 individuals are in the labor force, with 5.4% or 49 of them unemployed. The age group with the highest labor force participation rate is 25 to 29 years, with 87.4% or 90 individuals in the labor force. Within the labor force, the 20 to 24 years age range has the highest percentage of unemployed individuals, with 23.3% or 21 of them being unemployed.
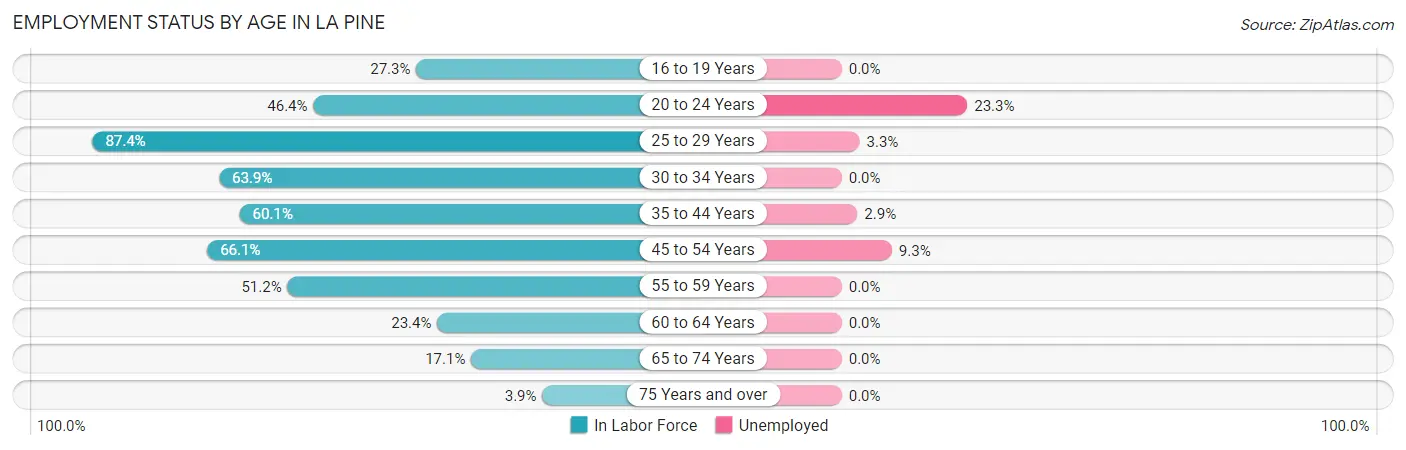
| Age Bracket | In Labor Force | Unemployed |
| 16 to 19 Years | 24 (27.3%) | 0 (0.0%) |
| 20 to 24 Years | 90 (46.4%) | 21 (23.3%) |
| 25 to 29 Years | 90 (87.4%) | 3 (3.3%) |
| 30 to 34 Years | 78 (63.9%) | 0 (0.0%) |
| 35 to 44 Years | 175 (60.1%) | 5 (2.9%) |
| 45 to 54 Years | 216 (66.1%) | 20 (9.3%) |
| 55 to 59 Years | 124 (51.2%) | 0 (0.0%) |
| 60 to 64 Years | 46 (23.4%) | 0 (0.0%) |
| 65 to 74 Years | 52 (17.1%) | 0 (0.0%) |
| 75 Years and over | 8 (3.9%) | 0 (0.0%) |
| Total | 904 (43.6%) | 49 (5.4%) |
Employment Status by Educational Attainment in La Pine
According to labor force statistics for La Pine, 56.9% of individuals (729) out of the total population between 25 and 64 years of age (1,282) are in the labor force, with 3.8% or 28 of them being unemployed. The group with the highest labor force participation rate are those with the educational attainment of bachelor's degree or higher, with 89.2% or 66 individuals in the labor force. Within the labor force, individuals with college / associate degree education have the highest percentage of unemployment, with 11.0% or 25 of them being unemployed.
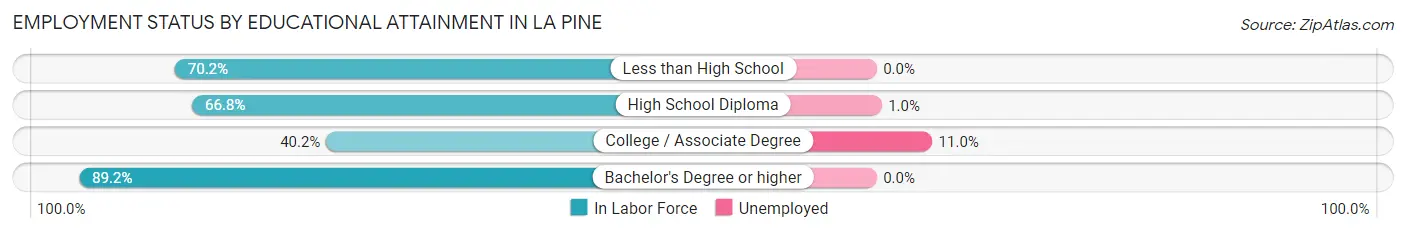
| Educational Attainment | In Labor Force | Unemployed |
| Less than High School | 134 (70.2%) | 0 (0.0%) |
| High School Diploma | 302 (66.8%) | 5 (1.0%) |
| College / Associate Degree | 227 (40.2%) | 62 (11.0%) |
| Bachelor's Degree or higher | 66 (89.2%) | 0 (0.0%) |
| Total | 729 (56.9%) | 49 (3.8%) |
Employment Occupations by Sex in La Pine
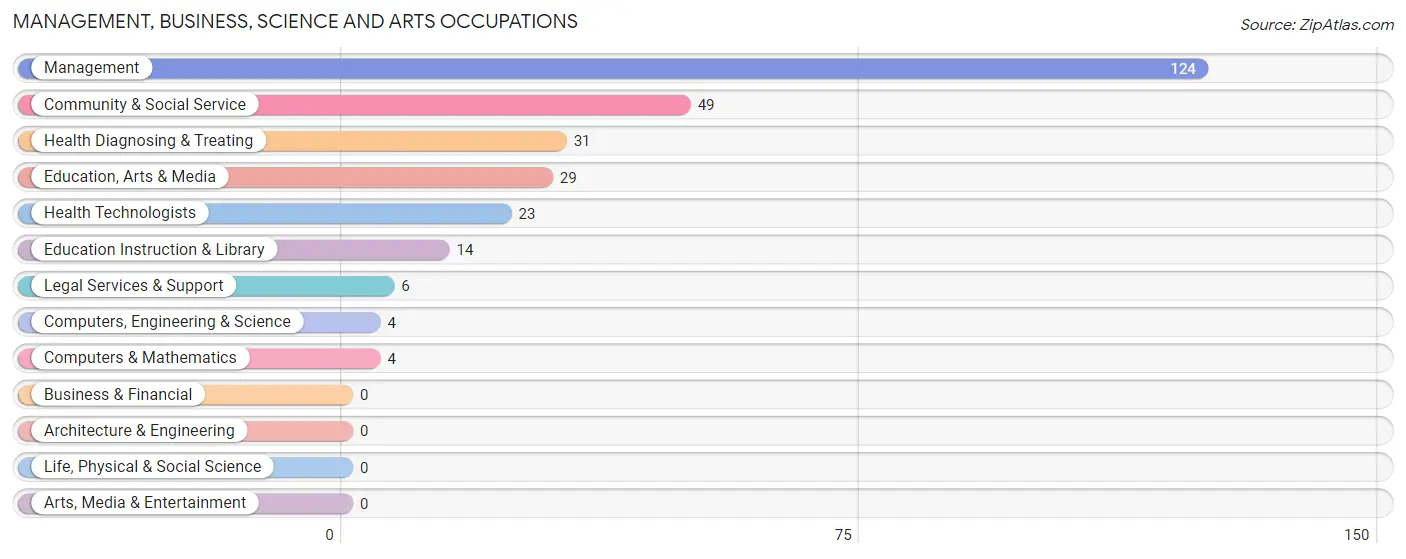
Management, Business, Science and Arts Occupations
The most common Management, Business, Science and Arts occupations in La Pine are Management (124 | 14.5%), Community & Social Service (49 | 5.7%), Health Diagnosing & Treating (31 | 3.6%), Education, Arts & Media (29 | 3.4%), and Health Technologists (23 | 2.7%).
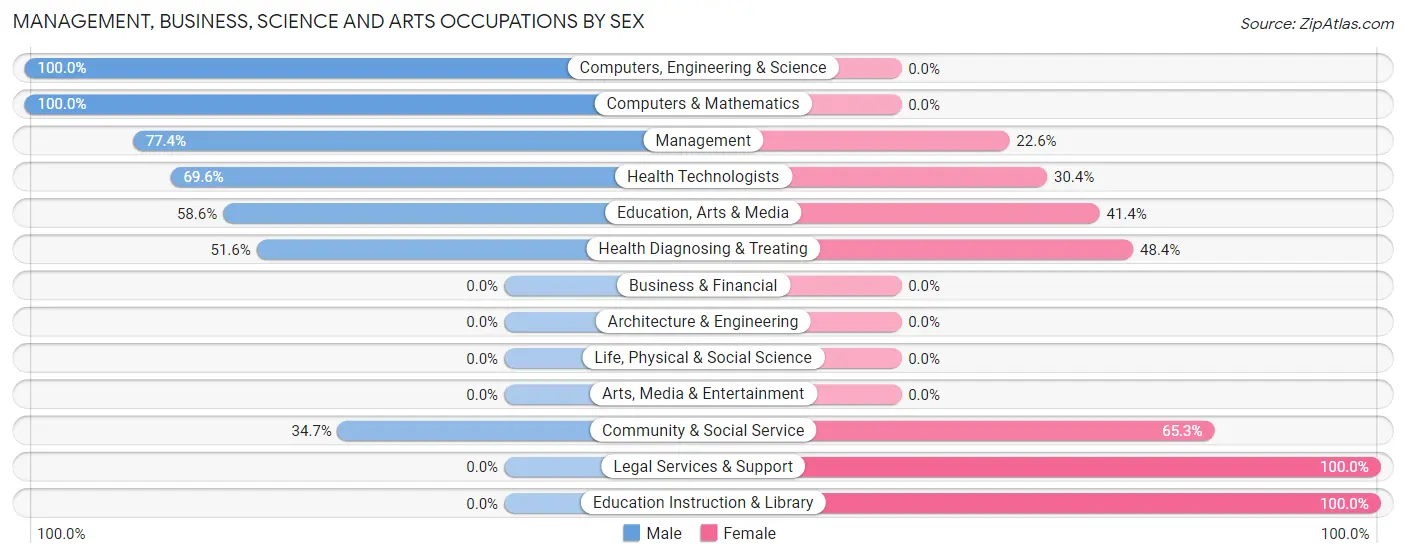
Management, Business, Science and Arts Occupations by Sex
Within the Management, Business, Science and Arts occupations in La Pine, the most male-oriented occupations are Computers, Engineering & Science (100.0%), Computers & Mathematics (100.0%), and Management (77.4%), while the most female-oriented occupations are Legal Services & Support (100.0%), Education Instruction & Library (100.0%), and Community & Social Service (65.3%).
| Occupation | Male | Female |
| Management | 96 (77.4%) | 28 (22.6%) |
| Business & Financial | 0 (0.0%) | 0 (0.0%) |
| Computers, Engineering & Science | 4 (100.0%) | 0 (0.0%) |
| Computers & Mathematics | 4 (100.0%) | 0 (0.0%) |
| Architecture & Engineering | 0 (0.0%) | 0 (0.0%) |
| Life, Physical & Social Science | 0 (0.0%) | 0 (0.0%) |
| Community & Social Service | 17 (34.7%) | 32 (65.3%) |
| Education, Arts & Media | 17 (58.6%) | 12 (41.4%) |
| Legal Services & Support | 0 (0.0%) | 6 (100.0%) |
| Education Instruction & Library | 0 (0.0%) | 14 (100.0%) |
| Arts, Media & Entertainment | 0 (0.0%) | 0 (0.0%) |
| Health Diagnosing & Treating | 16 (51.6%) | 15 (48.4%) |
| Health Technologists | 16 (69.6%) | 7 (30.4%) |
| Total (Category) | 133 (63.9%) | 75 (36.1%) |
| Total (Overall) | 563 (65.9%) | 291 (34.1%) |
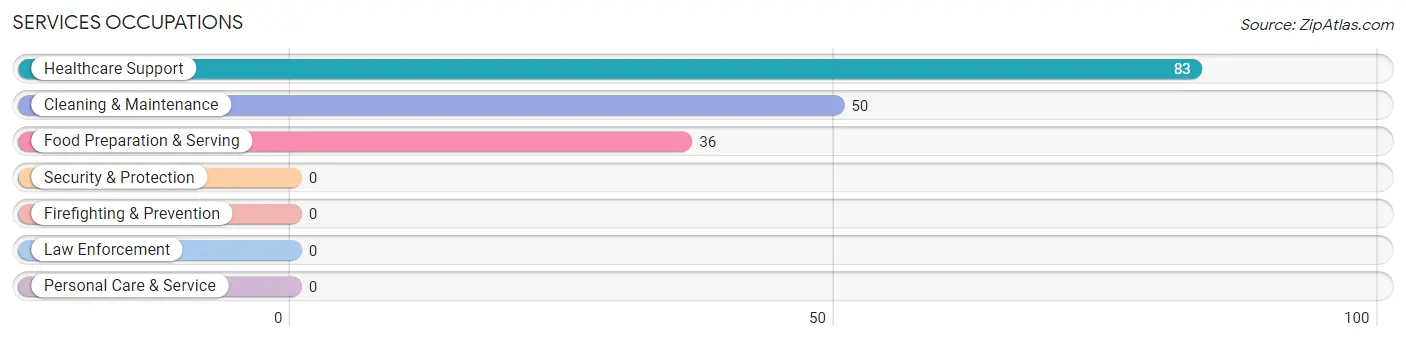
Services Occupations
The most common Services occupations in La Pine are Healthcare Support (83 | 9.7%), Cleaning & Maintenance (50 | 5.9%), and Food Preparation & Serving (36 | 4.2%).
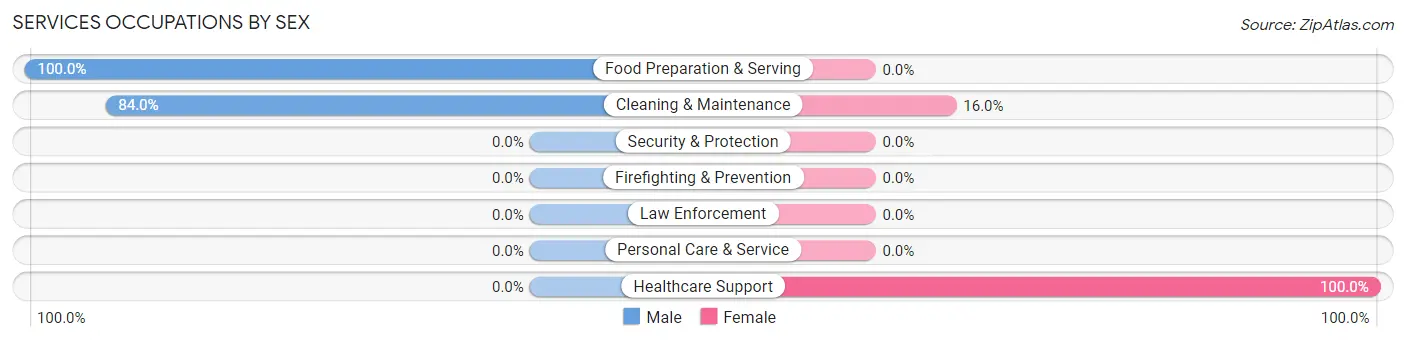
Services Occupations by Sex
Within the Services occupations in La Pine, the most male-oriented occupations are Food Preparation & Serving (100.0%), and Cleaning & Maintenance (84.0%), while the most female-oriented occupations are Healthcare Support (100.0%), and Cleaning & Maintenance (16.0%).
| Occupation | Male | Female |
| Healthcare Support | 0 (0.0%) | 83 (100.0%) |
| Security & Protection | 0 (0.0%) | 0 (0.0%) |
| Firefighting & Prevention | 0 (0.0%) | 0 (0.0%) |
| Law Enforcement | 0 (0.0%) | 0 (0.0%) |
| Food Preparation & Serving | 36 (100.0%) | 0 (0.0%) |
| Cleaning & Maintenance | 42 (84.0%) | 8 (16.0%) |
| Personal Care & Service | 0 (0.0%) | 0 (0.0%) |
| Total (Category) | 78 (46.2%) | 91 (53.8%) |
| Total (Overall) | 563 (65.9%) | 291 (34.1%) |
Sales and Office Occupations
The most common Sales and Office occupations in La Pine are Sales & Related (86 | 10.1%), and Office & Administration (51 | 6.0%).

Sales and Office Occupations by Sex
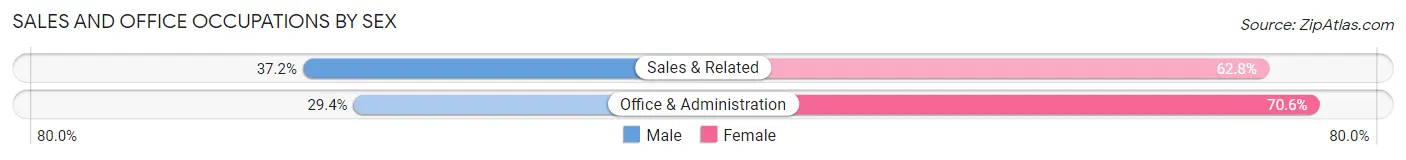
| Occupation | Male | Female |
| Sales & Related | 32 (37.2%) | 54 (62.8%) |
| Office & Administration | 15 (29.4%) | 36 (70.6%) |
| Total (Category) | 47 (34.3%) | 90 (65.7%) |
| Total (Overall) | 563 (65.9%) | 291 (34.1%) |
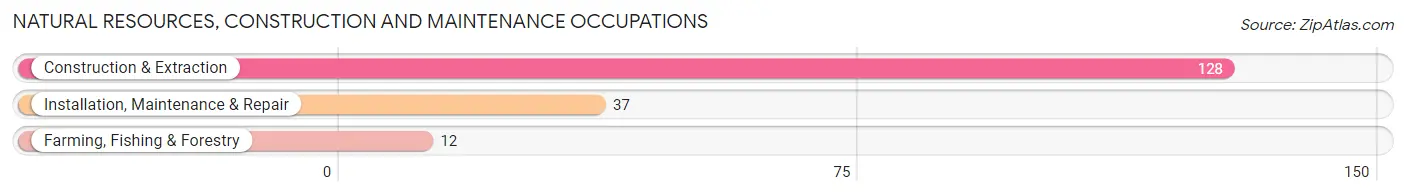
Natural Resources, Construction and Maintenance Occupations
The most common Natural Resources, Construction and Maintenance occupations in La Pine are Construction & Extraction (128 | 15.0%), Installation, Maintenance & Repair (37 | 4.3%), and Farming, Fishing & Forestry (12 | 1.4%).
Natural Resources, Construction and Maintenance Occupations by Sex
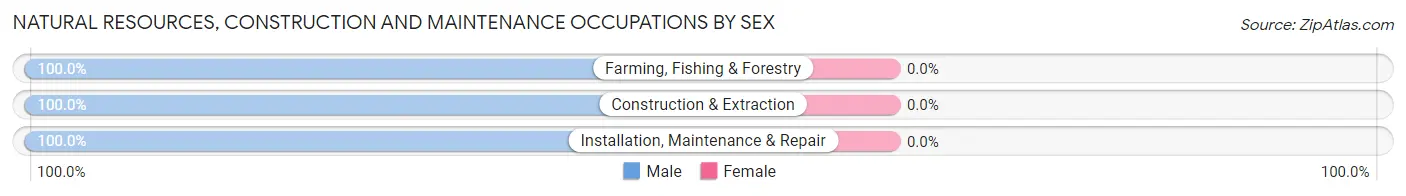
| Occupation | Male | Female |
| Farming, Fishing & Forestry | 12 (100.0%) | 0 (0.0%) |
| Construction & Extraction | 128 (100.0%) | 0 (0.0%) |
| Installation, Maintenance & Repair | 37 (100.0%) | 0 (0.0%) |
| Total (Category) | 177 (100.0%) | 0 (0.0%) |
| Total (Overall) | 563 (65.9%) | 291 (34.1%) |
Production, Transportation and Moving Occupations
The most common Production, Transportation and Moving occupations in La Pine are Production (74 | 8.7%), Transportation (66 | 7.7%), and Material Moving (23 | 2.7%).
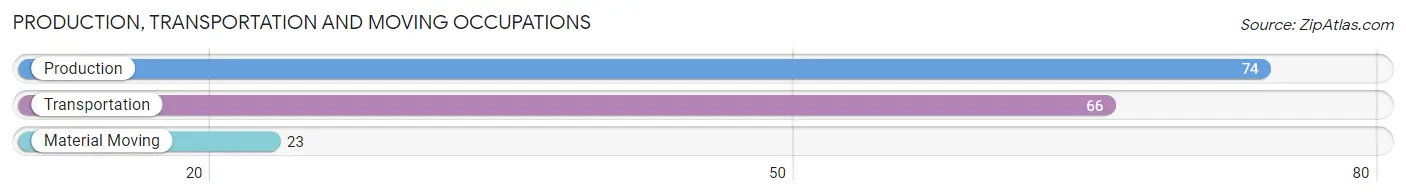
Production, Transportation and Moving Occupations by Sex
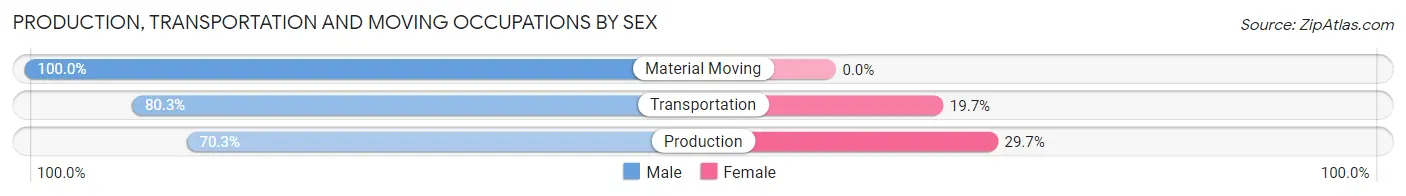
| Occupation | Male | Female |
| Production | 52 (70.3%) | 22 (29.7%) |
| Transportation | 53 (80.3%) | 13 (19.7%) |
| Material Moving | 23 (100.0%) | 0 (0.0%) |
| Total (Category) | 128 (78.5%) | 35 (21.5%) |
| Total (Overall) | 563 (65.9%) | 291 (34.1%) |
Employment Industries by Sex in La Pine
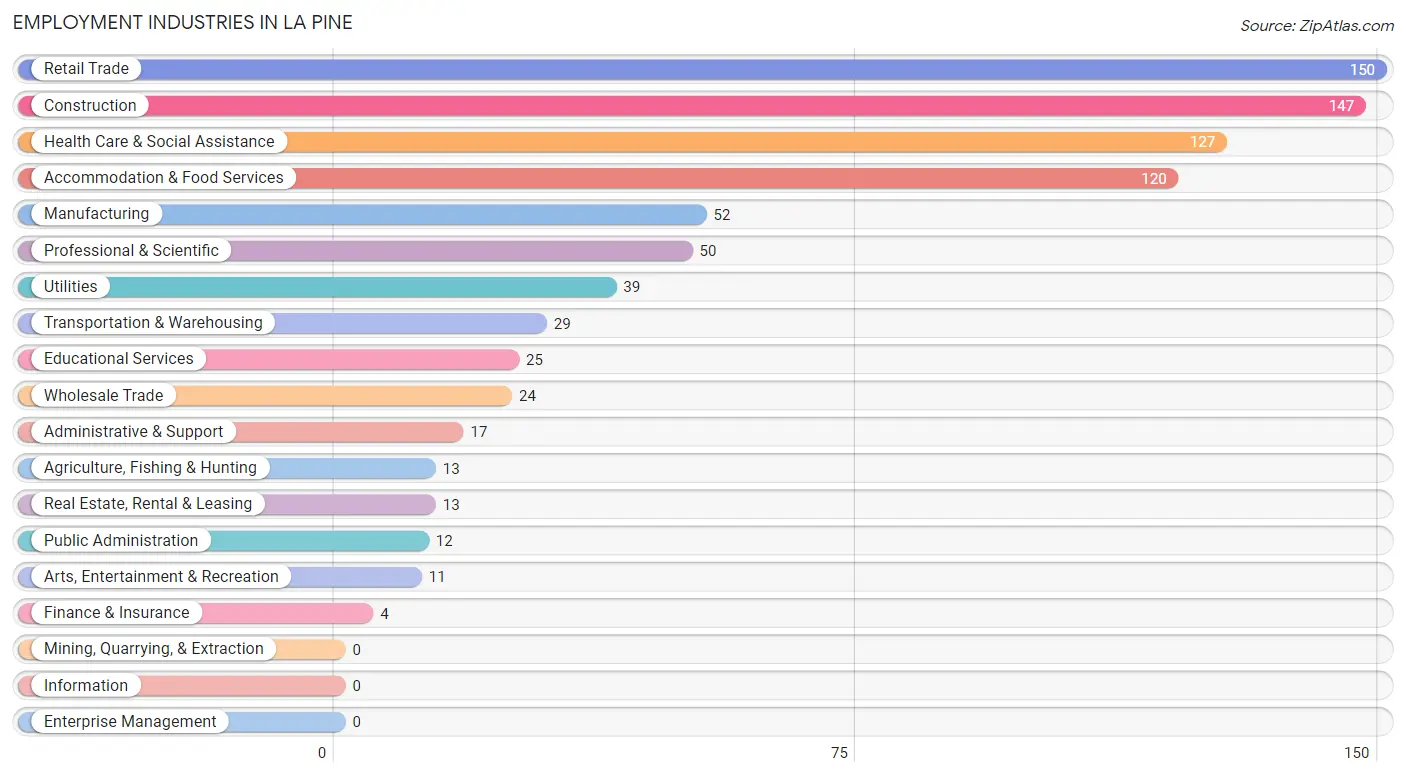
Employment Industries in La Pine
The major employment industries in La Pine include Retail Trade (150 | 17.6%), Construction (147 | 17.2%), Health Care & Social Assistance (127 | 14.9%), Accommodation & Food Services (120 | 14.1%), and Manufacturing (52 | 6.1%).
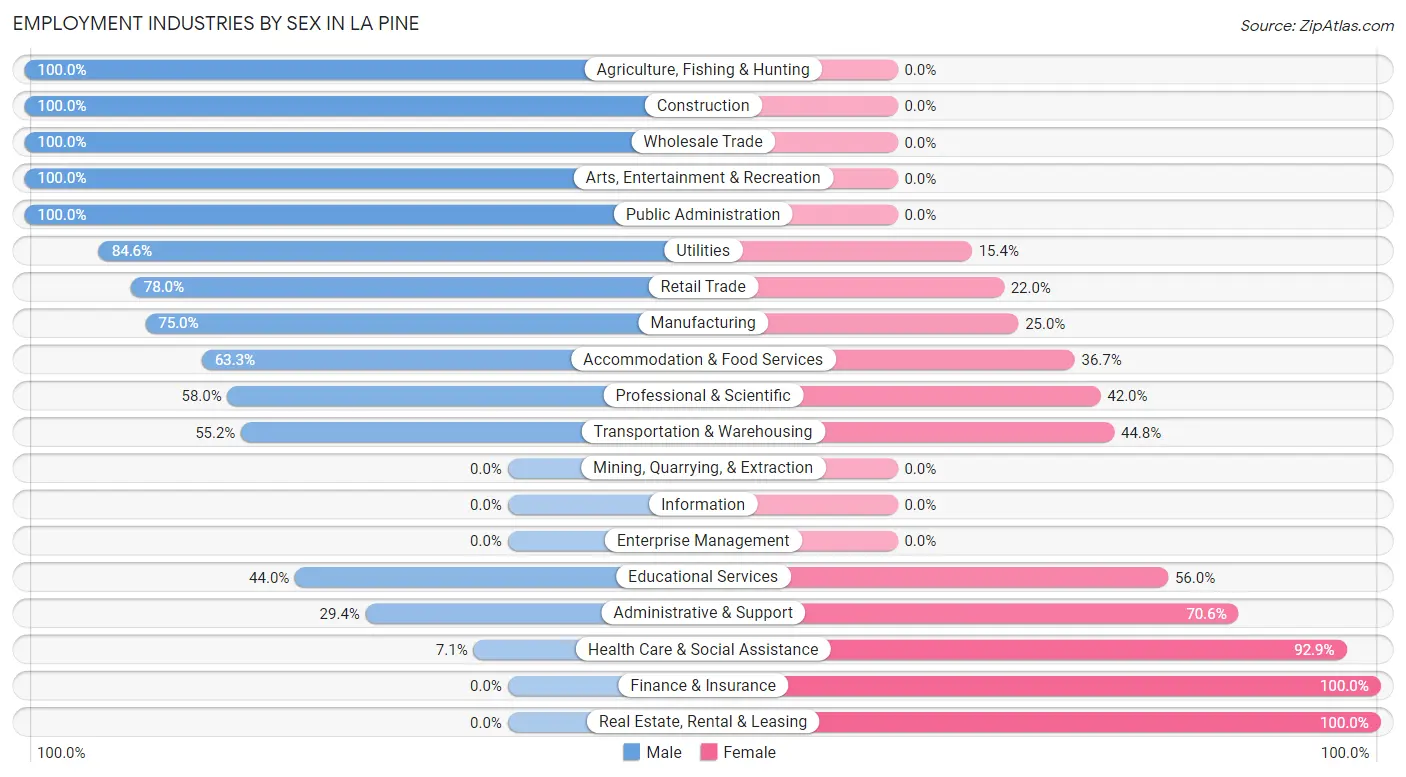
Employment Industries by Sex in La Pine
The La Pine industries that see more men than women are Agriculture, Fishing & Hunting (100.0%), Construction (100.0%), and Wholesale Trade (100.0%), whereas the industries that tend to have a higher number of women are Finance & Insurance (100.0%), Real Estate, Rental & Leasing (100.0%), and Health Care & Social Assistance (92.9%).
| Industry | Male | Female |
| Agriculture, Fishing & Hunting | 13 (100.0%) | 0 (0.0%) |
| Mining, Quarrying, & Extraction | 0 (0.0%) | 0 (0.0%) |
| Construction | 147 (100.0%) | 0 (0.0%) |
| Manufacturing | 39 (75.0%) | 13 (25.0%) |
| Wholesale Trade | 24 (100.0%) | 0 (0.0%) |
| Retail Trade | 117 (78.0%) | 33 (22.0%) |
| Transportation & Warehousing | 16 (55.2%) | 13 (44.8%) |
| Utilities | 33 (84.6%) | 6 (15.4%) |
| Information | 0 (0.0%) | 0 (0.0%) |
| Finance & Insurance | 0 (0.0%) | 4 (100.0%) |
| Real Estate, Rental & Leasing | 0 (0.0%) | 13 (100.0%) |
| Professional & Scientific | 29 (58.0%) | 21 (42.0%) |
| Enterprise Management | 0 (0.0%) | 0 (0.0%) |
| Administrative & Support | 5 (29.4%) | 12 (70.6%) |
| Educational Services | 11 (44.0%) | 14 (56.0%) |
| Health Care & Social Assistance | 9 (7.1%) | 118 (92.9%) |
| Arts, Entertainment & Recreation | 11 (100.0%) | 0 (0.0%) |
| Accommodation & Food Services | 76 (63.3%) | 44 (36.7%) |
| Public Administration | 12 (100.0%) | 0 (0.0%) |
| Total | 563 (65.9%) | 291 (34.1%) |
Education in La Pine
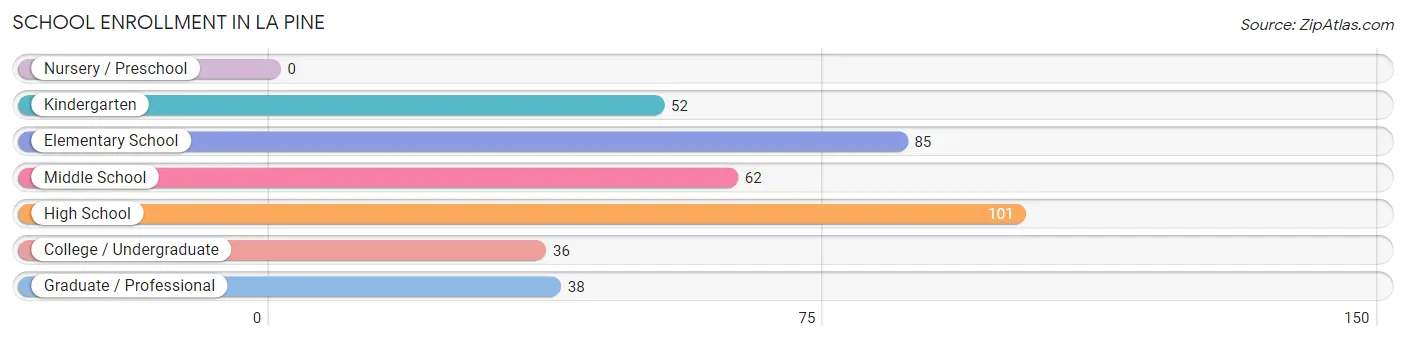
School Enrollment in La Pine
The most common levels of schooling among the 374 students in La Pine are high school (101 | 27.0%), elementary school (85 | 22.7%), and middle school (62 | 16.6%).
| School Level | # Students | % Students |
| Nursery / Preschool | 0 | 0.0% |
| Kindergarten | 52 | 13.9% |
| Elementary School | 85 | 22.7% |
| Middle School | 62 | 16.6% |
| High School | 101 | 27.0% |
| College / Undergraduate | 36 | 9.6% |
| Graduate / Professional | 38 | 10.2% |
| Total | 374 | 100.0% |
School Enrollment by Age by Funding Source in La Pine
Out of a total of 374 students who are enrolled in schools in La Pine, 46 (12.3%) attend a private institution, while the remaining 328 (87.7%) are enrolled in public schools. The age group of 10 to 14 year olds has the highest likelihood of being enrolled in private schools, with 19 (24.4% in the age bracket) enrolled. Conversely, the age group of 15 to 17 year olds has the lowest likelihood of being enrolled in a private school, with 85 (100.0% in the age bracket) attending a public institution.
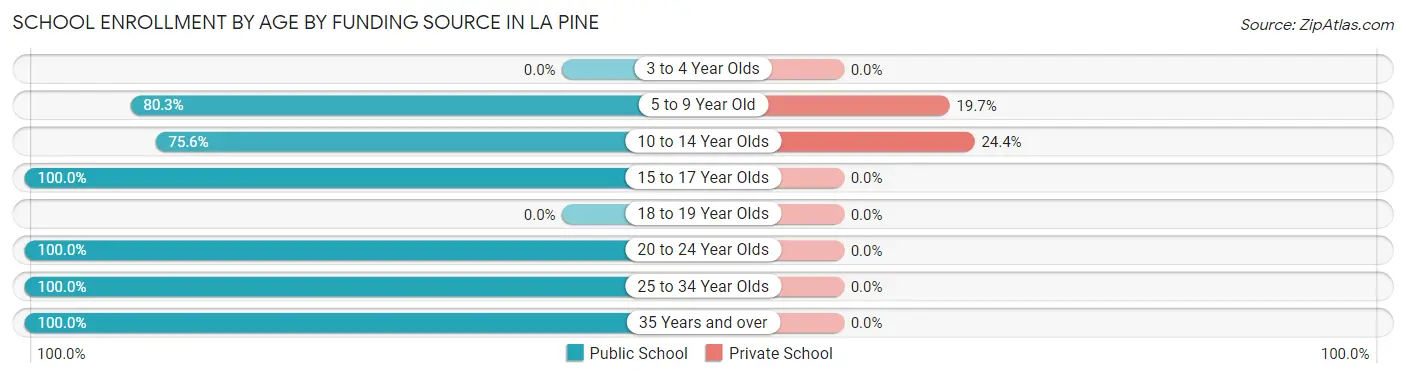
| Age Bracket | Public School | Private School |
| 3 to 4 Year Olds | 0 (0.0%) | 0 (0.0%) |
| 5 to 9 Year Old | 110 (80.3%) | 27 (19.7%) |
| 10 to 14 Year Olds | 59 (75.6%) | 19 (24.4%) |
| 15 to 17 Year Olds | 85 (100.0%) | 0 (0.0%) |
| 18 to 19 Year Olds | 0 (0.0%) | 0 (0.0%) |
| 20 to 24 Year Olds | 42 (100.0%) | 0 (0.0%) |
| 25 to 34 Year Olds | 20 (100.0%) | 0 (0.0%) |
| 35 Years and over | 12 (100.0%) | 0 (0.0%) |
| Total | 328 (87.7%) | 46 (12.3%) |
Educational Attainment by Field of Study in La Pine
Liberal arts & history (32 | 15.6%), social sciences (29 | 14.1%), visual & performing arts (22 | 10.7%), bio, nature & agricultural (20 | 9.8%), and multidisciplinary studies (18 | 8.8%) are the most common fields of study among 205 individuals in La Pine who have obtained a bachelor's degree or higher.
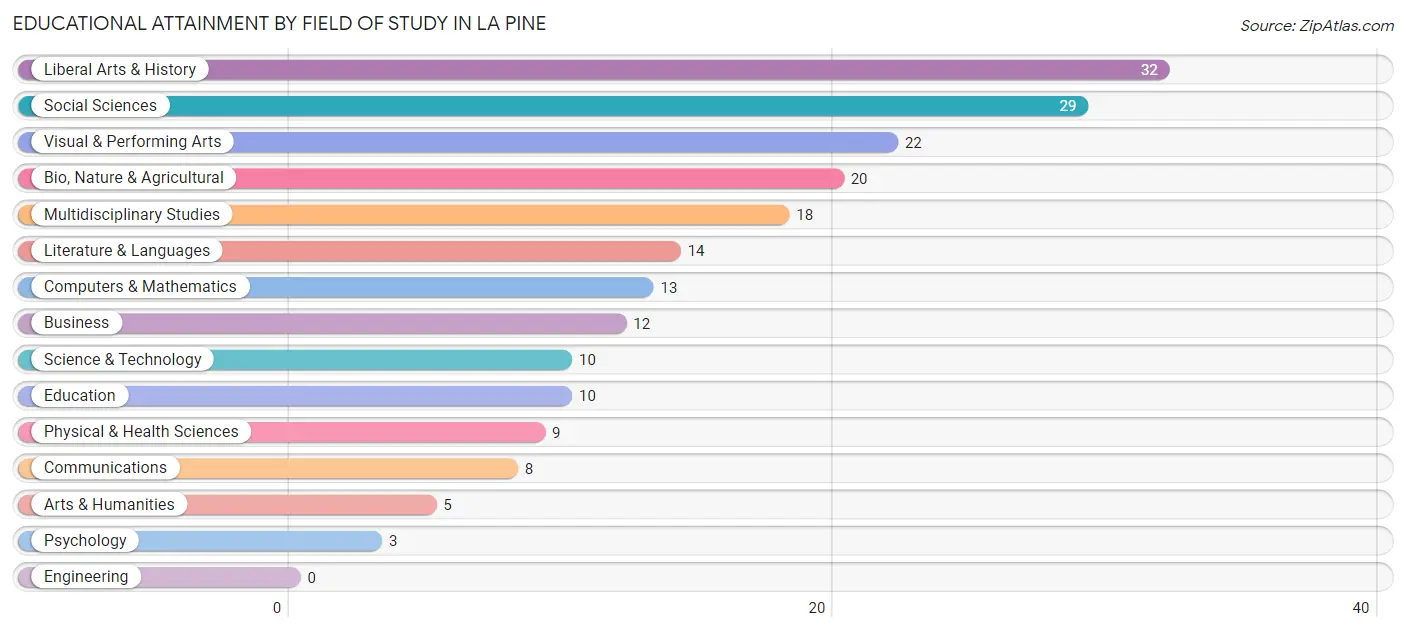
| Field of Study | # Graduates | % Graduates |
| Computers & Mathematics | 13 | 6.3% |
| Bio, Nature & Agricultural | 20 | 9.8% |
| Physical & Health Sciences | 9 | 4.4% |
| Psychology | 3 | 1.5% |
| Social Sciences | 29 | 14.1% |
| Engineering | 0 | 0.0% |
| Multidisciplinary Studies | 18 | 8.8% |
| Science & Technology | 10 | 4.9% |
| Business | 12 | 5.9% |
| Education | 10 | 4.9% |
| Literature & Languages | 14 | 6.8% |
| Liberal Arts & History | 32 | 15.6% |
| Visual & Performing Arts | 22 | 10.7% |
| Communications | 8 | 3.9% |
| Arts & Humanities | 5 | 2.4% |
| Total | 205 | 100.0% |
Transportation & Commute in La Pine
Vehicle Availability by Sex in La Pine
The most prevalent vehicle ownership categories in La Pine are males with 2 vehicles (272, accounting for 48.9%) and females with 2 vehicles (88, making up 93.5%).
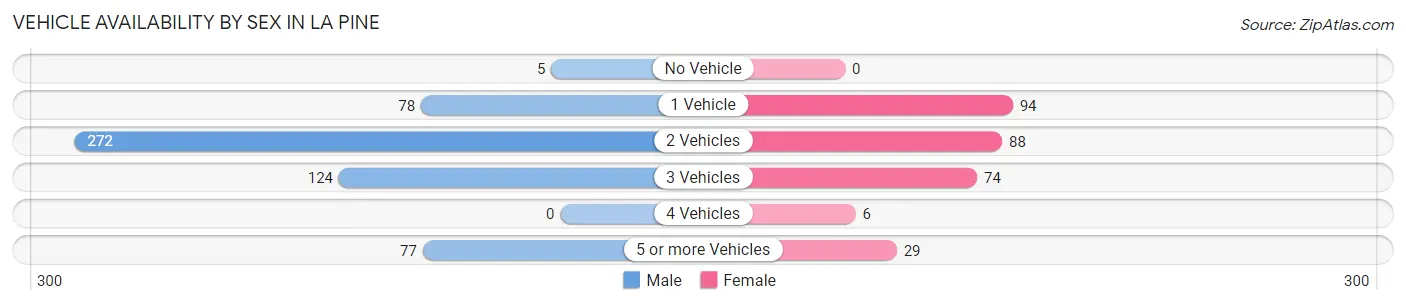
| Vehicles Available | Male | Female |
| No Vehicle | 5 (0.9%) | 0 (0.0%) |
| 1 Vehicle | 78 (14.0%) | 94 (32.3%) |
| 2 Vehicles | 272 (48.9%) | 88 (30.2%) |
| 3 Vehicles | 124 (22.3%) | 74 (25.4%) |
| 4 Vehicles | 0 (0.0%) | 6 (2.1%) |
| 5 or more Vehicles | 77 (13.9%) | 29 (10.0%) |
| Total | 556 (100.0%) | 291 (100.0%) |
Commute Time in La Pine
The most frequently occuring commute durations in La Pine are 5 to 9 minutes (121 commuters, 15.6%), 40 to 44 minutes (94 commuters, 12.1%), and less than 5 minutes (88 commuters, 11.3%).
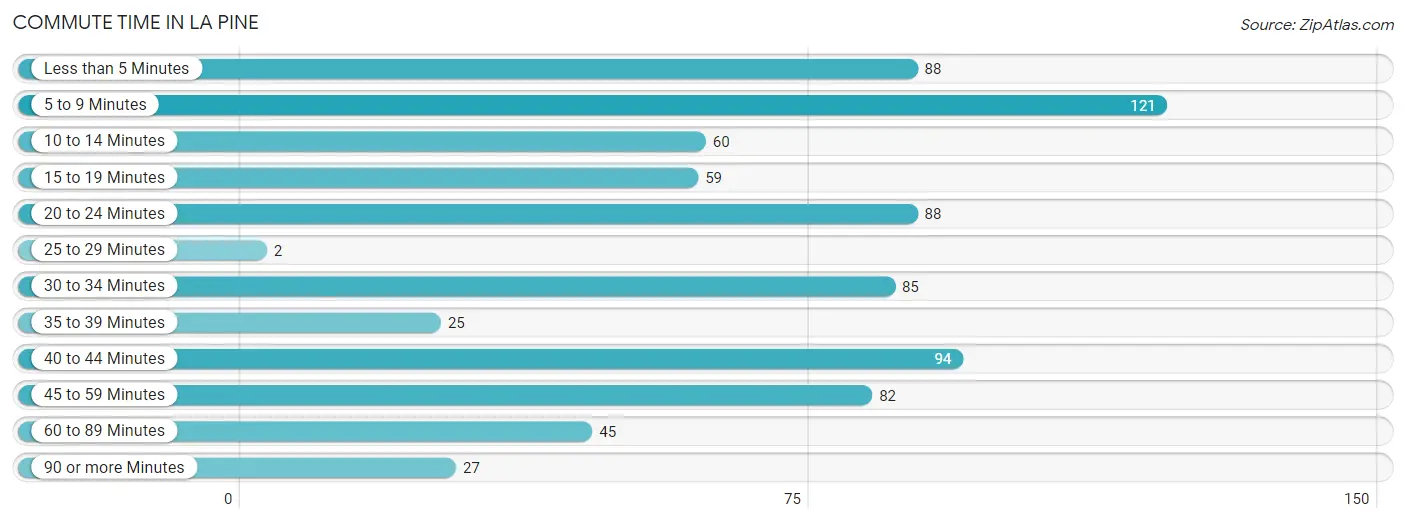
| Commute Time | # Commuters | % Commuters |
| Less than 5 Minutes | 88 | 11.3% |
| 5 to 9 Minutes | 121 | 15.6% |
| 10 to 14 Minutes | 60 | 7.7% |
| 15 to 19 Minutes | 59 | 7.6% |
| 20 to 24 Minutes | 88 | 11.3% |
| 25 to 29 Minutes | 2 | 0.3% |
| 30 to 34 Minutes | 85 | 11.0% |
| 35 to 39 Minutes | 25 | 3.2% |
| 40 to 44 Minutes | 94 | 12.1% |
| 45 to 59 Minutes | 82 | 10.6% |
| 60 to 89 Minutes | 45 | 5.8% |
| 90 or more Minutes | 27 | 3.5% |
Commute Time by Sex in La Pine
The most common commute times in La Pine are 5 to 9 minutes (87 commuters, 16.4%) for males and less than 5 minutes (38 commuters, 15.6%) for females.
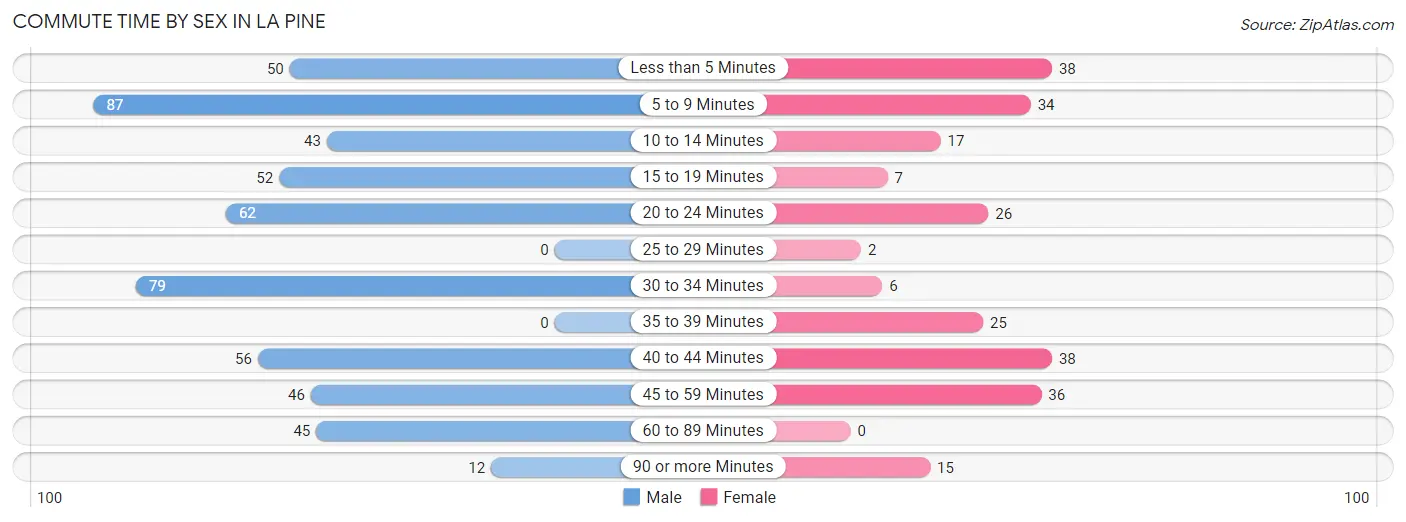
| Commute Time | Male | Female |
| Less than 5 Minutes | 50 (9.4%) | 38 (15.6%) |
| 5 to 9 Minutes | 87 (16.4%) | 34 (13.9%) |
| 10 to 14 Minutes | 43 (8.1%) | 17 (7.0%) |
| 15 to 19 Minutes | 52 (9.8%) | 7 (2.9%) |
| 20 to 24 Minutes | 62 (11.7%) | 26 (10.7%) |
| 25 to 29 Minutes | 0 (0.0%) | 2 (0.8%) |
| 30 to 34 Minutes | 79 (14.8%) | 6 (2.5%) |
| 35 to 39 Minutes | 0 (0.0%) | 25 (10.2%) |
| 40 to 44 Minutes | 56 (10.5%) | 38 (15.6%) |
| 45 to 59 Minutes | 46 (8.6%) | 36 (14.7%) |
| 60 to 89 Minutes | 45 (8.5%) | 0 (0.0%) |
| 90 or more Minutes | 12 (2.3%) | 15 (6.1%) |
Time of Departure to Work by Sex in La Pine
The most frequent times of departure to work in La Pine are 8:00 AM to 8:29 AM (93, 17.5%) for males and 9:00 AM to 9:59 AM (67, 27.5%) for females.
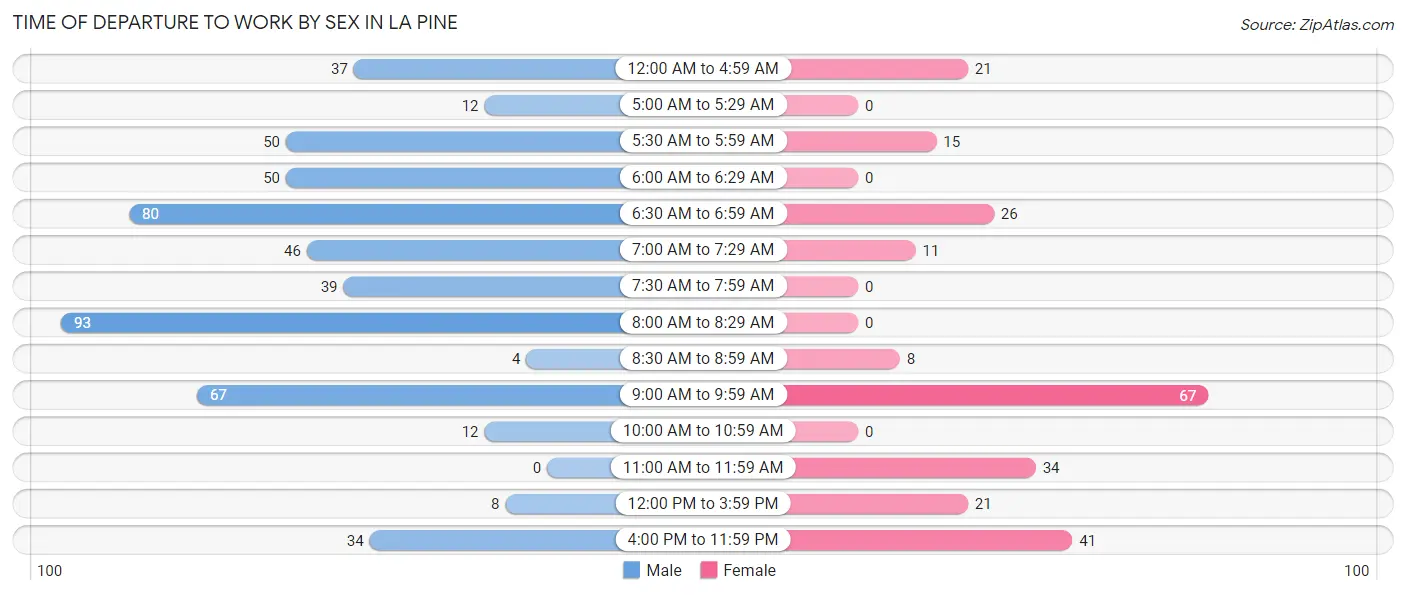
| Time of Departure | Male | Female |
| 12:00 AM to 4:59 AM | 37 (7.0%) | 21 (8.6%) |
| 5:00 AM to 5:29 AM | 12 (2.3%) | 0 (0.0%) |
| 5:30 AM to 5:59 AM | 50 (9.4%) | 15 (6.1%) |
| 6:00 AM to 6:29 AM | 50 (9.4%) | 0 (0.0%) |
| 6:30 AM to 6:59 AM | 80 (15.0%) | 26 (10.7%) |
| 7:00 AM to 7:29 AM | 46 (8.6%) | 11 (4.5%) |
| 7:30 AM to 7:59 AM | 39 (7.3%) | 0 (0.0%) |
| 8:00 AM to 8:29 AM | 93 (17.5%) | 0 (0.0%) |
| 8:30 AM to 8:59 AM | 4 (0.7%) | 8 (3.3%) |
| 9:00 AM to 9:59 AM | 67 (12.6%) | 67 (27.5%) |
| 10:00 AM to 10:59 AM | 12 (2.3%) | 0 (0.0%) |
| 11:00 AM to 11:59 AM | 0 (0.0%) | 34 (13.9%) |
| 12:00 PM to 3:59 PM | 8 (1.5%) | 21 (8.6%) |
| 4:00 PM to 11:59 PM | 34 (6.4%) | 41 (16.8%) |
| Total | 532 (100.0%) | 244 (100.0%) |
Housing Occupancy in La Pine
Occupancy by Ownership in La Pine
Of the total 969 dwellings in La Pine, owner-occupied units account for 552 (57.0%), while renter-occupied units make up 417 (43.0%).
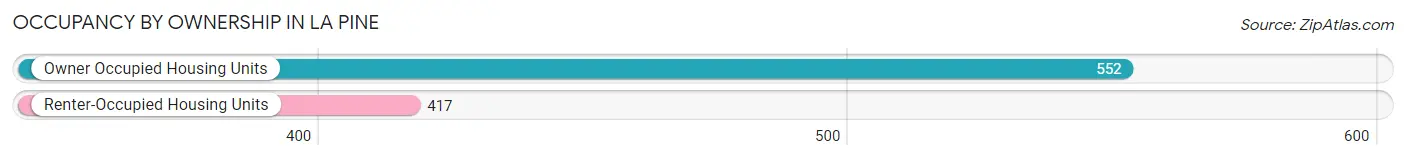
| Occupancy | # Housing Units | % Housing Units |
| Owner Occupied Housing Units | 552 | 57.0% |
| Renter-Occupied Housing Units | 417 | 43.0% |
| Total Occupied Housing Units | 969 | 100.0% |
Occupancy by Household Size in La Pine
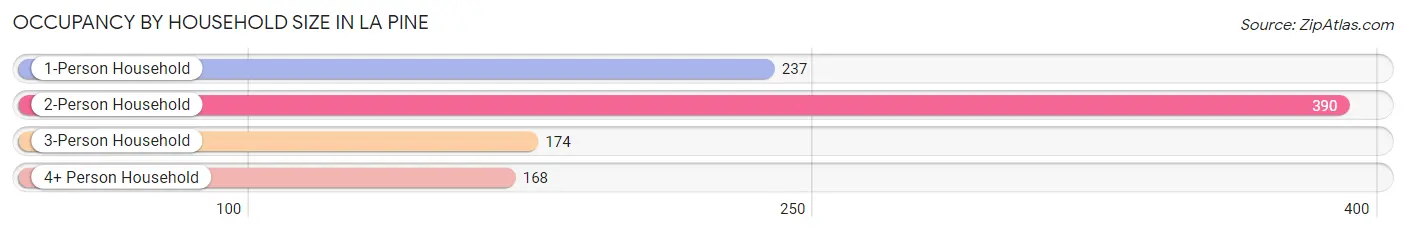
| Household Size | # Housing Units | % Housing Units |
| 1-Person Household | 237 | 24.5% |
| 2-Person Household | 390 | 40.3% |
| 3-Person Household | 174 | 18.0% |
| 4+ Person Household | 168 | 17.3% |
| Total Housing Units | 969 | 100.0% |
Occupancy by Ownership by Household Size in La Pine
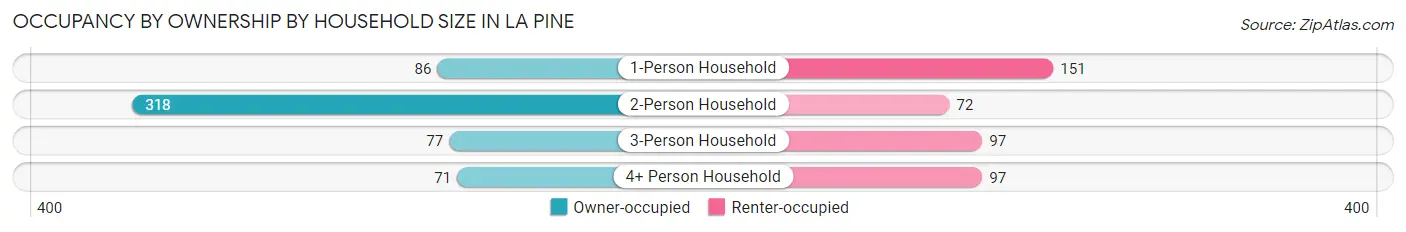
| Household Size | Owner-occupied | Renter-occupied |
| 1-Person Household | 86 (36.3%) | 151 (63.7%) |
| 2-Person Household | 318 (81.5%) | 72 (18.5%) |
| 3-Person Household | 77 (44.3%) | 97 (55.7%) |
| 4+ Person Household | 71 (42.3%) | 97 (57.7%) |
| Total Housing Units | 552 (57.0%) | 417 (43.0%) |
Occupancy by Educational Attainment in La Pine
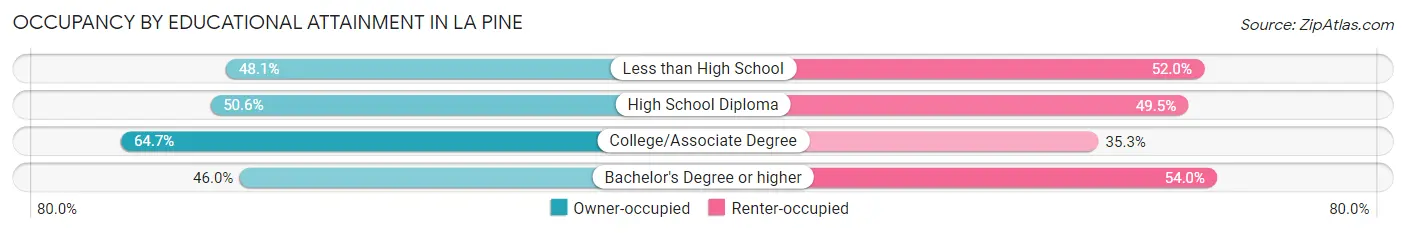
| Household Size | Owner-occupied | Renter-occupied |
| Less than High School | 37 (48.0%) | 40 (51.9%) |
| High School Diploma | 139 (50.5%) | 136 (49.4%) |
| College/Associate Degree | 319 (64.7%) | 174 (35.3%) |
| Bachelor's Degree or higher | 57 (46.0%) | 67 (54.0%) |
Occupancy by Age of Householder in La Pine
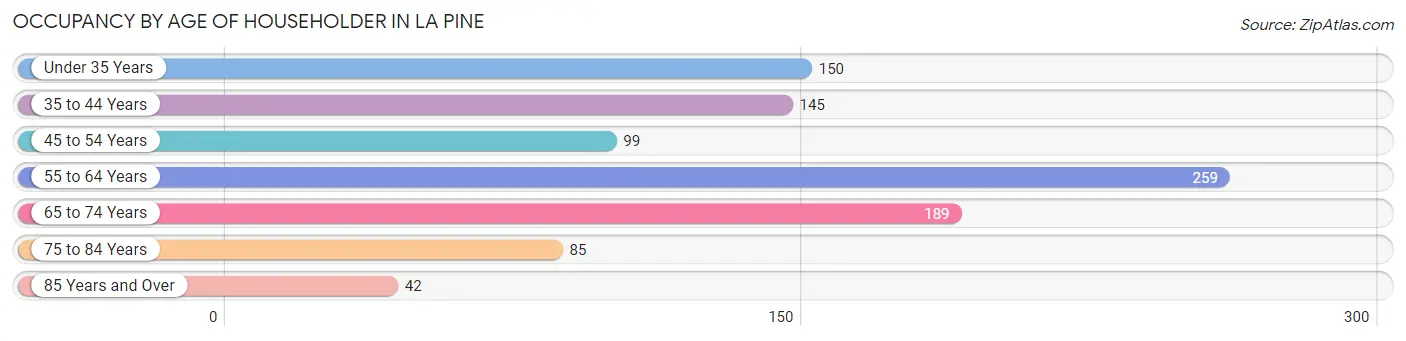
| Age Bracket | # Households | % Households |
| Under 35 Years | 150 | 15.5% |
| 35 to 44 Years | 145 | 15.0% |
| 45 to 54 Years | 99 | 10.2% |
| 55 to 64 Years | 259 | 26.7% |
| 65 to 74 Years | 189 | 19.5% |
| 75 to 84 Years | 85 | 8.8% |
| 85 Years and Over | 42 | 4.3% |
| Total | 969 | 100.0% |
Housing Finances in La Pine
Median Income by Occupancy in La Pine
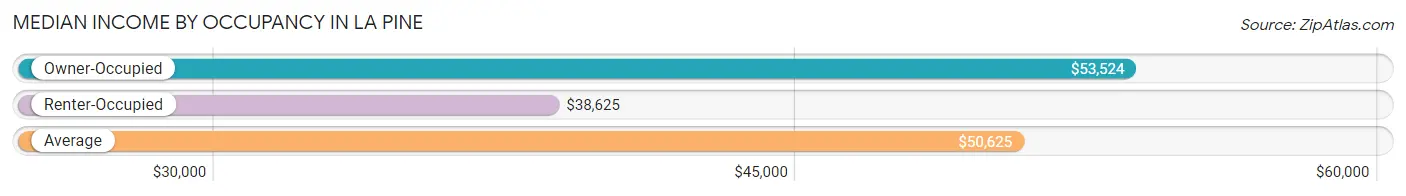
| Occupancy Type | # Households | Median Income |
| Owner-Occupied | 552 (57.0%) | $53,524 |
| Renter-Occupied | 417 (43.0%) | $38,625 |
| Average | 969 (100.0%) | $50,625 |
Occupancy by Householder Income Bracket in La Pine
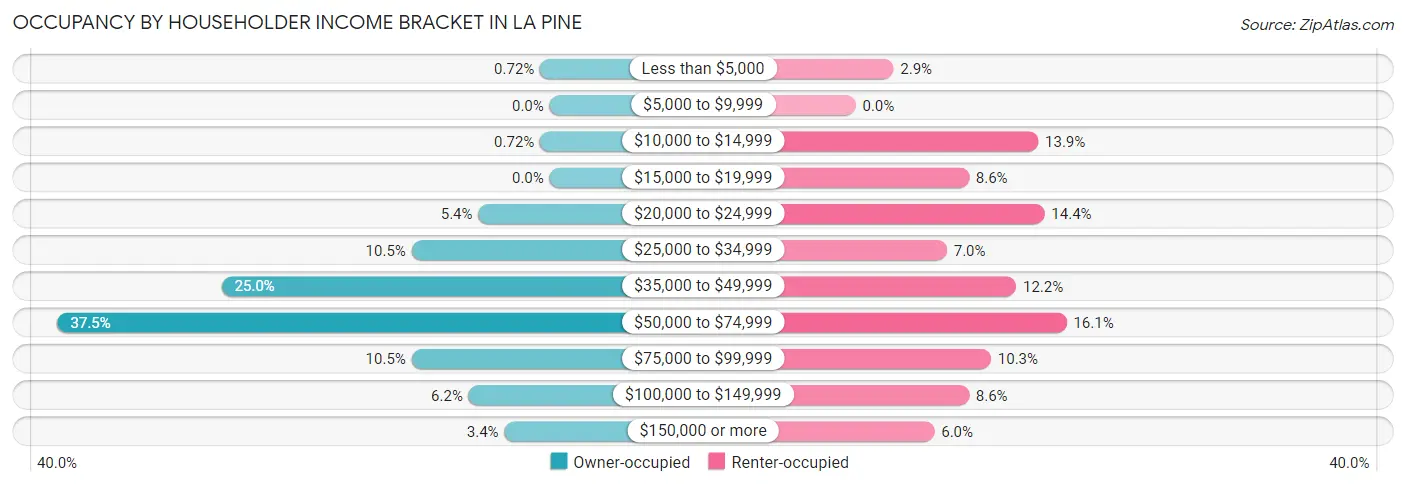
| Income Bracket | Owner-occupied | Renter-occupied |
| Less than $5,000 | 4 (0.7%) | 12 (2.9%) |
| $5,000 to $9,999 | 0 (0.0%) | 0 (0.0%) |
| $10,000 to $14,999 | 4 (0.7%) | 58 (13.9%) |
| $15,000 to $19,999 | 0 (0.0%) | 36 (8.6%) |
| $20,000 to $24,999 | 30 (5.4%) | 60 (14.4%) |
| $25,000 to $34,999 | 58 (10.5%) | 29 (7.0%) |
| $35,000 to $49,999 | 138 (25.0%) | 51 (12.2%) |
| $50,000 to $74,999 | 207 (37.5%) | 67 (16.1%) |
| $75,000 to $99,999 | 58 (10.5%) | 43 (10.3%) |
| $100,000 to $149,999 | 34 (6.2%) | 36 (8.6%) |
| $150,000 or more | 19 (3.4%) | 25 (6.0%) |
| Total | 552 (100.0%) | 417 (100.0%) |
Monthly Housing Cost Tiers in La Pine
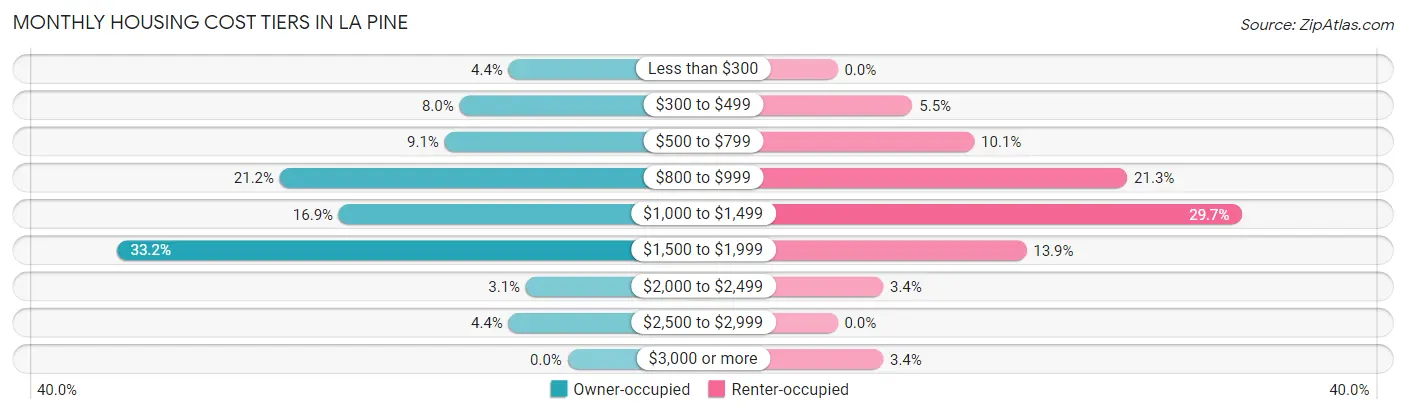
| Monthly Cost | Owner-occupied | Renter-occupied |
| Less than $300 | 24 (4.3%) | 0 (0.0%) |
| $300 to $499 | 44 (8.0%) | 23 (5.5%) |
| $500 to $799 | 50 (9.1%) | 42 (10.1%) |
| $800 to $999 | 117 (21.2%) | 89 (21.3%) |
| $1,000 to $1,499 | 93 (16.9%) | 124 (29.7%) |
| $1,500 to $1,999 | 183 (33.2%) | 58 (13.9%) |
| $2,000 to $2,499 | 17 (3.1%) | 14 (3.4%) |
| $2,500 to $2,999 | 24 (4.3%) | 0 (0.0%) |
| $3,000 or more | 0 (0.0%) | 14 (3.4%) |
| Total | 552 (100.0%) | 417 (100.0%) |
Physical Housing Characteristics in La Pine
Housing Structures in La Pine
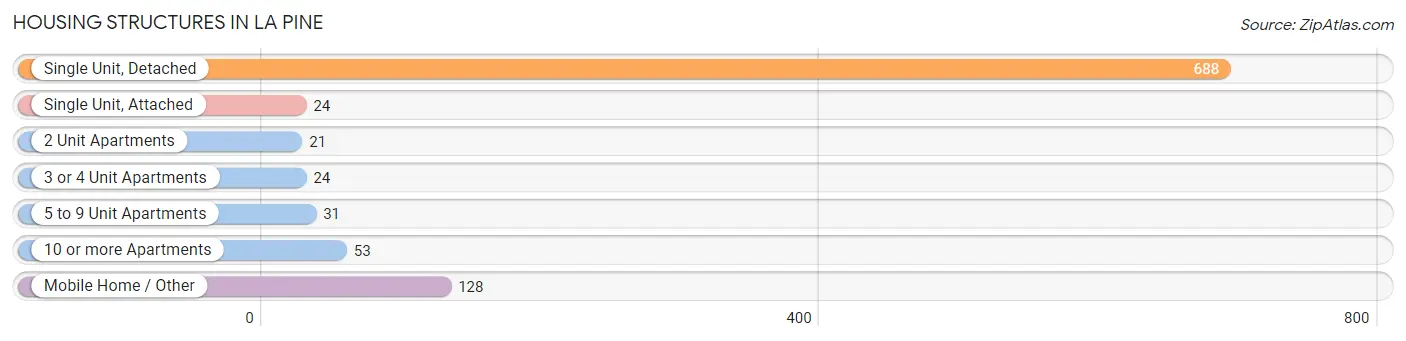
| Structure Type | # Housing Units | % Housing Units |
| Single Unit, Detached | 688 | 71.0% |
| Single Unit, Attached | 24 | 2.5% |
| 2 Unit Apartments | 21 | 2.2% |
| 3 or 4 Unit Apartments | 24 | 2.5% |
| 5 to 9 Unit Apartments | 31 | 3.2% |
| 10 or more Apartments | 53 | 5.5% |
| Mobile Home / Other | 128 | 13.2% |
| Total | 969 | 100.0% |
Housing Structures by Occupancy in La Pine
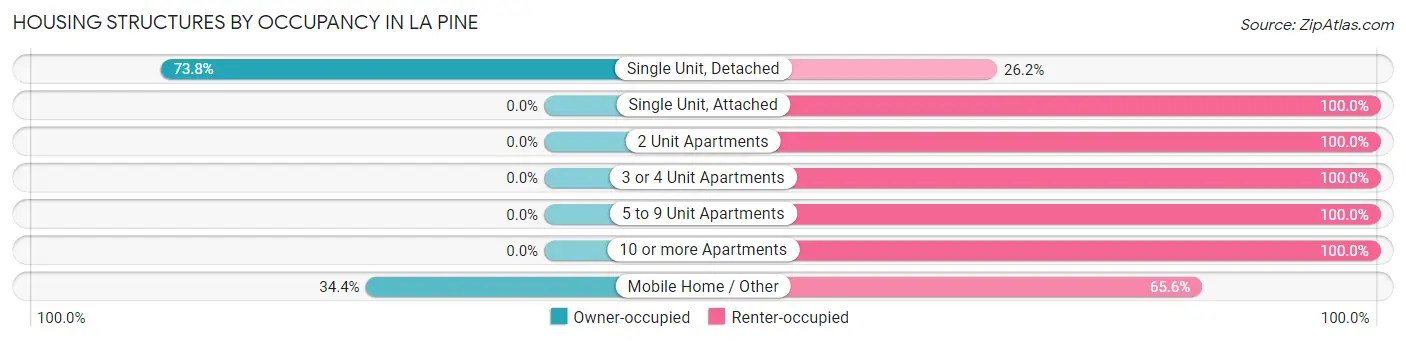
| Structure Type | Owner-occupied | Renter-occupied |
| Single Unit, Detached | 508 (73.8%) | 180 (26.2%) |
| Single Unit, Attached | 0 (0.0%) | 24 (100.0%) |
| 2 Unit Apartments | 0 (0.0%) | 21 (100.0%) |
| 3 or 4 Unit Apartments | 0 (0.0%) | 24 (100.0%) |
| 5 to 9 Unit Apartments | 0 (0.0%) | 31 (100.0%) |
| 10 or more Apartments | 0 (0.0%) | 53 (100.0%) |
| Mobile Home / Other | 44 (34.4%) | 84 (65.6%) |
| Total | 552 (57.0%) | 417 (43.0%) |
Housing Structures by Number of Rooms in La Pine
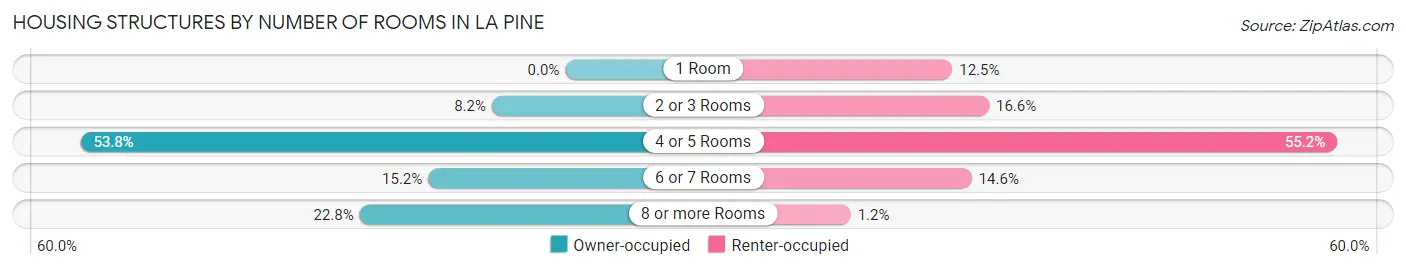
| Number of Rooms | Owner-occupied | Renter-occupied |
| 1 Room | 0 (0.0%) | 52 (12.5%) |
| 2 or 3 Rooms | 45 (8.2%) | 69 (16.6%) |
| 4 or 5 Rooms | 297 (53.8%) | 230 (55.2%) |
| 6 or 7 Rooms | 84 (15.2%) | 61 (14.6%) |
| 8 or more Rooms | 126 (22.8%) | 5 (1.2%) |
| Total | 552 (100.0%) | 417 (100.0%) |
Housing Structure by Heating Type in La Pine
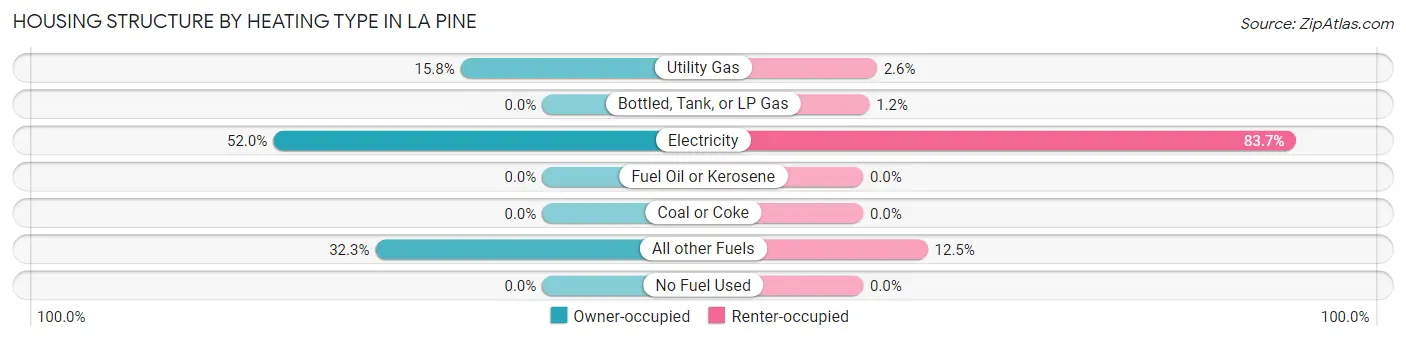
| Heating Type | Owner-occupied | Renter-occupied |
| Utility Gas | 87 (15.8%) | 11 (2.6%) |
| Bottled, Tank, or LP Gas | 0 (0.0%) | 5 (1.2%) |
| Electricity | 287 (52.0%) | 349 (83.7%) |
| Fuel Oil or Kerosene | 0 (0.0%) | 0 (0.0%) |
| Coal or Coke | 0 (0.0%) | 0 (0.0%) |
| All other Fuels | 178 (32.3%) | 52 (12.5%) |
| No Fuel Used | 0 (0.0%) | 0 (0.0%) |
| Total | 552 (100.0%) | 417 (100.0%) |
Household Vehicle Usage in La Pine
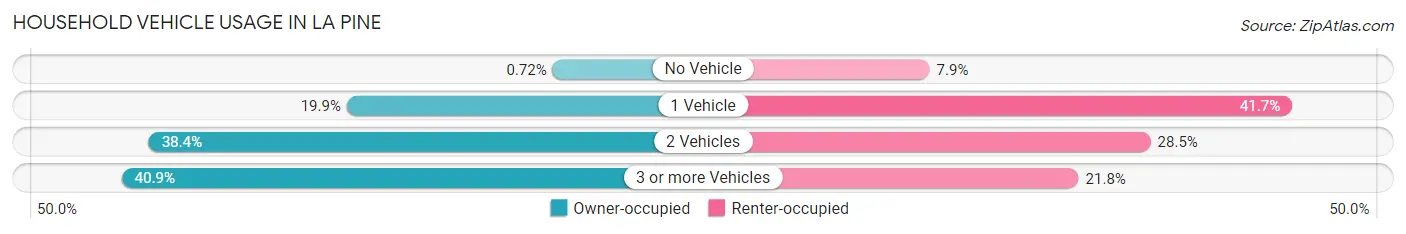
| Vehicles per Household | Owner-occupied | Renter-occupied |
| No Vehicle | 4 (0.7%) | 33 (7.9%) |
| 1 Vehicle | 110 (19.9%) | 174 (41.7%) |
| 2 Vehicles | 212 (38.4%) | 119 (28.5%) |
| 3 or more Vehicles | 226 (40.9%) | 91 (21.8%) |
| Total | 552 (100.0%) | 417 (100.0%) |
Real Estate & Mortgages in La Pine
Real Estate and Mortgage Overview in La Pine
| Characteristic | Without Mortgage | With Mortgage |
| Housing Units | 92 | 460 |
| Median Property Value | $240,000 | $319,400 |
| Median Household Income | $43,250 | $19 |
| Monthly Housing Costs | $397 | $0 |
| Real Estate Taxes | $2,019 | $0 |
Property Value by Mortgage Status in La Pine
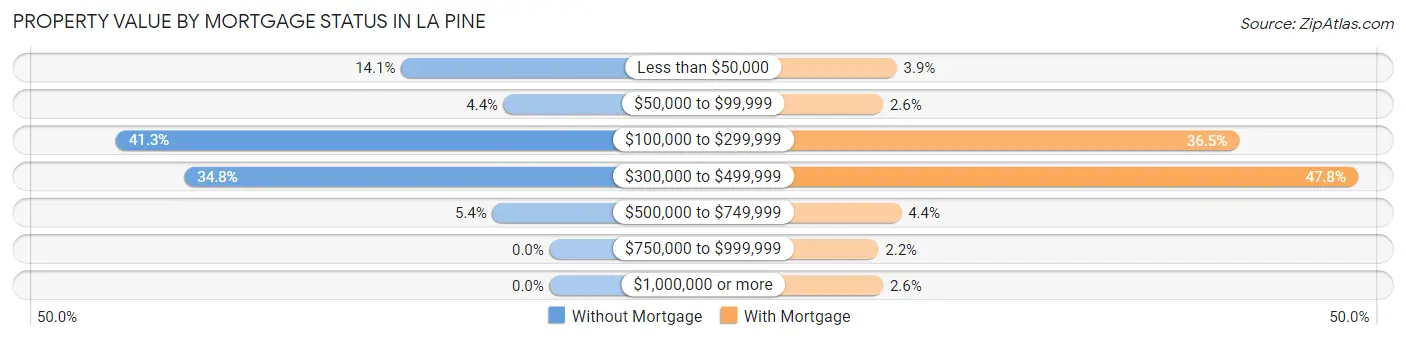
| Property Value | Without Mortgage | With Mortgage |
| Less than $50,000 | 13 (14.1%) | 18 (3.9%) |
| $50,000 to $99,999 | 4 (4.3%) | 12 (2.6%) |
| $100,000 to $299,999 | 38 (41.3%) | 168 (36.5%) |
| $300,000 to $499,999 | 32 (34.8%) | 220 (47.8%) |
| $500,000 to $749,999 | 5 (5.4%) | 20 (4.3%) |
| $750,000 to $999,999 | 0 (0.0%) | 10 (2.2%) |
| $1,000,000 or more | 0 (0.0%) | 12 (2.6%) |
| Total | 92 (100.0%) | 460 (100.0%) |
Household Income by Mortgage Status in La Pine
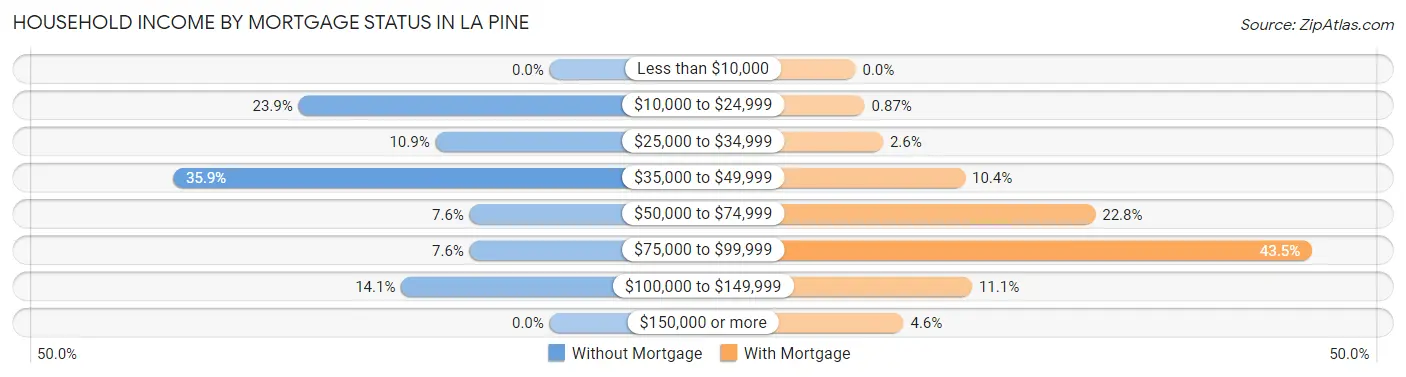
| Household Income | Without Mortgage | With Mortgage |
| Less than $10,000 | 0 (0.0%) | 0 (0.0%) |
| $10,000 to $24,999 | 22 (23.9%) | 4 (0.9%) |
| $25,000 to $34,999 | 10 (10.9%) | 12 (2.6%) |
| $35,000 to $49,999 | 33 (35.9%) | 48 (10.4%) |
| $50,000 to $74,999 | 7 (7.6%) | 105 (22.8%) |
| $75,000 to $99,999 | 7 (7.6%) | 200 (43.5%) |
| $100,000 to $149,999 | 13 (14.1%) | 51 (11.1%) |
| $150,000 or more | 0 (0.0%) | 21 (4.6%) |
| Total | 92 (100.0%) | 460 (100.0%) |
Property Value to Household Income Ratio in La Pine
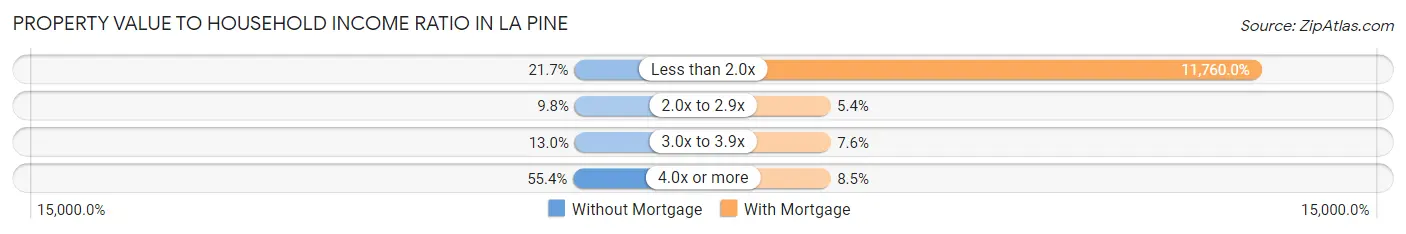
| Value-to-Income Ratio | Without Mortgage | With Mortgage |
| Less than 2.0x | 20 (21.7%) | 54,096 (11,760.0%) |
| 2.0x to 2.9x | 9 (9.8%) | 25 (5.4%) |
| 3.0x to 3.9x | 12 (13.0%) | 35 (7.6%) |
| 4.0x or more | 51 (55.4%) | 39 (8.5%) |
| Total | 92 (100.0%) | 460 (100.0%) |
Real Estate Taxes by Mortgage Status in La Pine
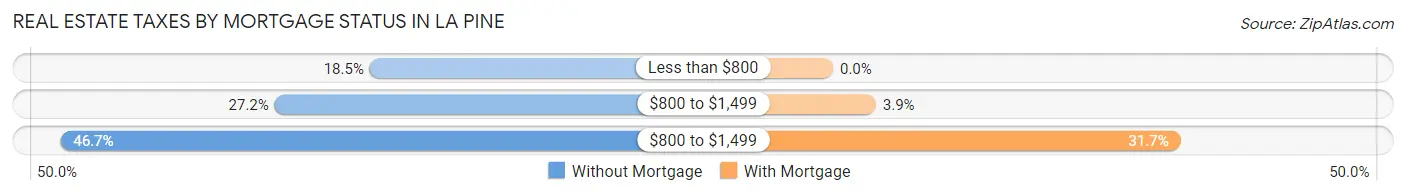
| Property Taxes | Without Mortgage | With Mortgage |
| Less than $800 | 17 (18.5%) | 0 (0.0%) |
| $800 to $1,499 | 25 (27.2%) | 18 (3.9%) |
| $800 to $1,499 | 43 (46.7%) | 146 (31.7%) |
| Total | 92 (100.0%) | 460 (100.0%) |
Health & Disability in La Pine
Health Insurance Coverage by Age in La Pine
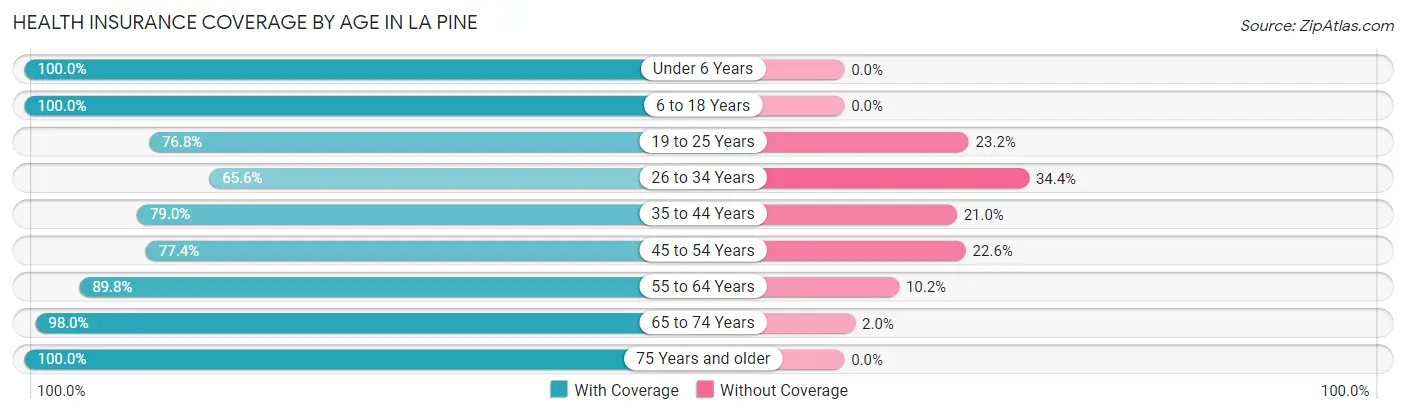
| Age Bracket | With Coverage | Without Coverage |
| Under 6 Years | 206 (100.0%) | 0 (0.0%) |
| 6 to 18 Years | 292 (100.0%) | 0 (0.0%) |
| 19 to 25 Years | 159 (76.8%) | 48 (23.2%) |
| 26 to 34 Years | 139 (65.6%) | 73 (34.4%) |
| 35 to 44 Years | 230 (79.0%) | 61 (21.0%) |
| 45 to 54 Years | 253 (77.4%) | 74 (22.6%) |
| 55 to 64 Years | 388 (89.8%) | 44 (10.2%) |
| 65 to 74 Years | 293 (98.0%) | 6 (2.0%) |
| 75 Years and older | 179 (100.0%) | 0 (0.0%) |
| Total | 2,139 (87.5%) | 306 (12.5%) |
Health Insurance Coverage by Citizenship Status in La Pine
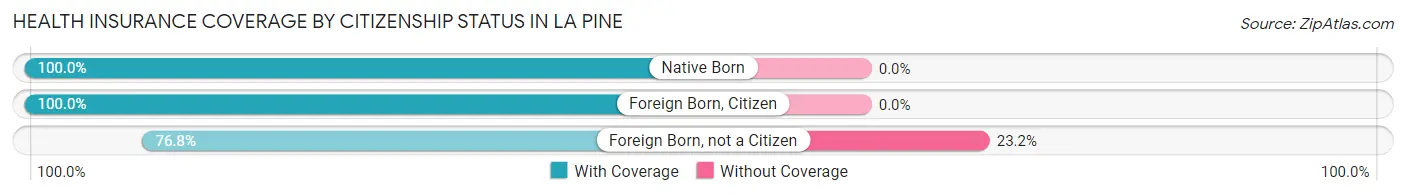
| Citizenship Status | With Coverage | Without Coverage |
| Native Born | 206 (100.0%) | 0 (0.0%) |
| Foreign Born, Citizen | 292 (100.0%) | 0 (0.0%) |
| Foreign Born, not a Citizen | 159 (76.8%) | 48 (23.2%) |
Health Insurance Coverage by Household Income in La Pine
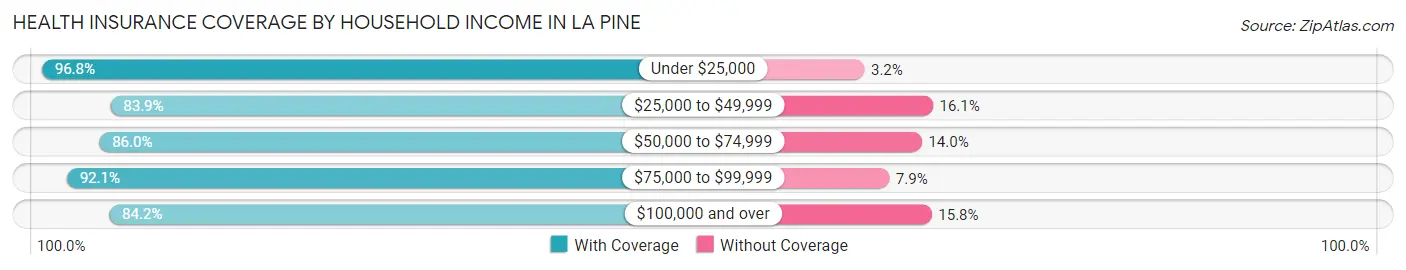
| Household Income | With Coverage | Without Coverage |
| Under $25,000 | 330 (96.8%) | 11 (3.2%) |
| $25,000 to $49,999 | 559 (83.9%) | 107 (16.1%) |
| $50,000 to $74,999 | 590 (86.0%) | 96 (14.0%) |
| $75,000 to $99,999 | 292 (92.1%) | 25 (7.9%) |
| $100,000 and over | 356 (84.2%) | 67 (15.8%) |
Public vs Private Health Insurance Coverage by Age in La Pine
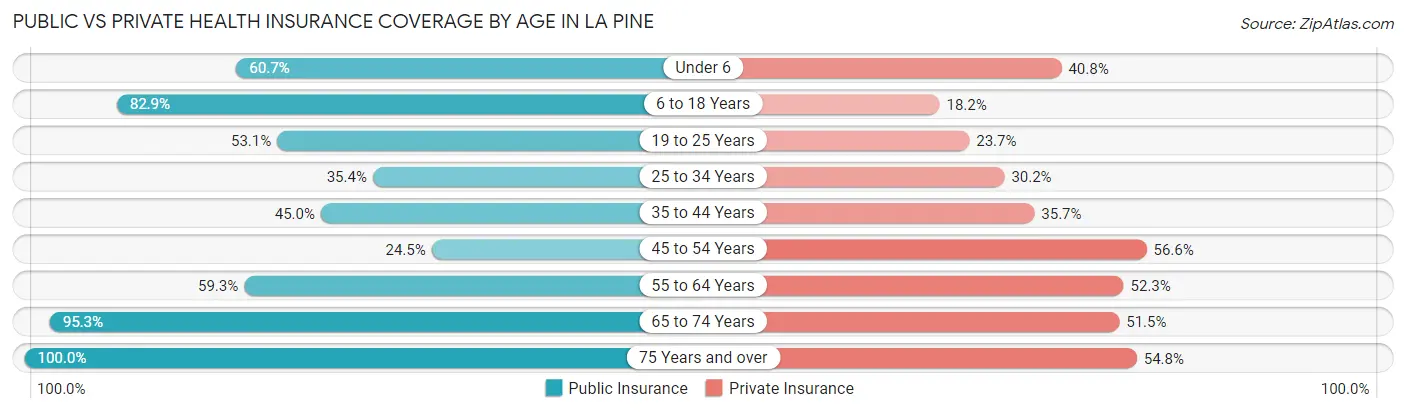
| Age Bracket | Public Insurance | Private Insurance |
| Under 6 | 125 (60.7%) | 84 (40.8%) |
| 6 to 18 Years | 242 (82.9%) | 53 (18.1%) |
| 19 to 25 Years | 110 (53.1%) | 49 (23.7%) |
| 25 to 34 Years | 75 (35.4%) | 64 (30.2%) |
| 35 to 44 Years | 131 (45.0%) | 104 (35.7%) |
| 45 to 54 Years | 80 (24.5%) | 185 (56.6%) |
| 55 to 64 Years | 256 (59.3%) | 226 (52.3%) |
| 65 to 74 Years | 285 (95.3%) | 154 (51.5%) |
| 75 Years and over | 179 (100.0%) | 98 (54.7%) |
| Total | 1,483 (60.7%) | 1,017 (41.6%) |
Disability Status by Sex by Age in La Pine
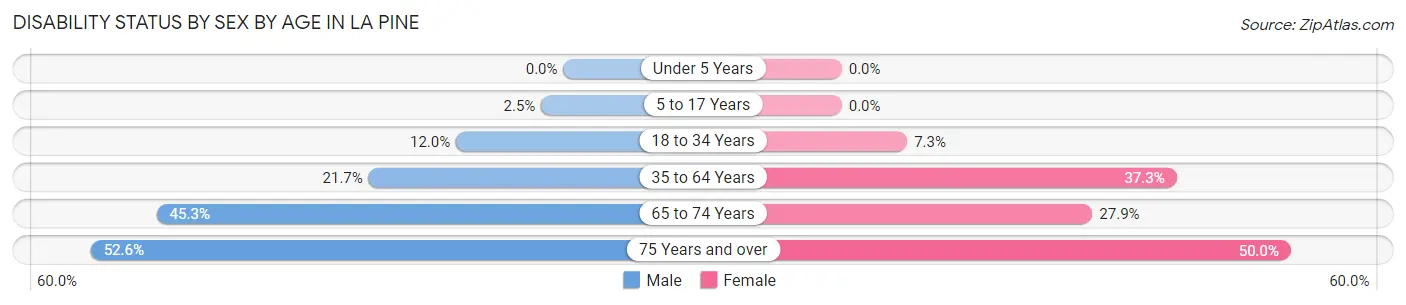
| Age Bracket | Male | Female |
| Under 5 Years | 0 (0.0%) | 0 (0.0%) |
| 5 to 17 Years | 4 (2.5%) | 0 (0.0%) |
| 18 to 34 Years | 30 (11.9%) | 14 (7.3%) |
| 35 to 64 Years | 123 (21.7%) | 180 (37.3%) |
| 65 to 74 Years | 77 (45.3%) | 36 (27.9%) |
| 75 Years and over | 30 (52.6%) | 61 (50.0%) |
Disability Class by Sex by Age in La Pine
Disability Class: Hearing Difficulty
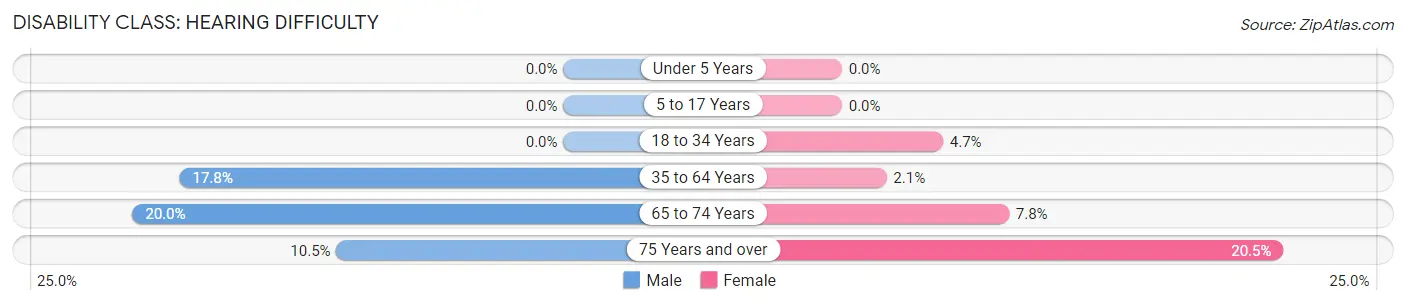
| Age Bracket | Male | Female |
| Under 5 Years | 0 (0.0%) | 0 (0.0%) |
| 5 to 17 Years | 0 (0.0%) | 0 (0.0%) |
| 18 to 34 Years | 0 (0.0%) | 9 (4.7%) |
| 35 to 64 Years | 101 (17.8%) | 10 (2.1%) |
| 65 to 74 Years | 34 (20.0%) | 10 (7.7%) |
| 75 Years and over | 6 (10.5%) | 25 (20.5%) |
Disability Class: Vision Difficulty
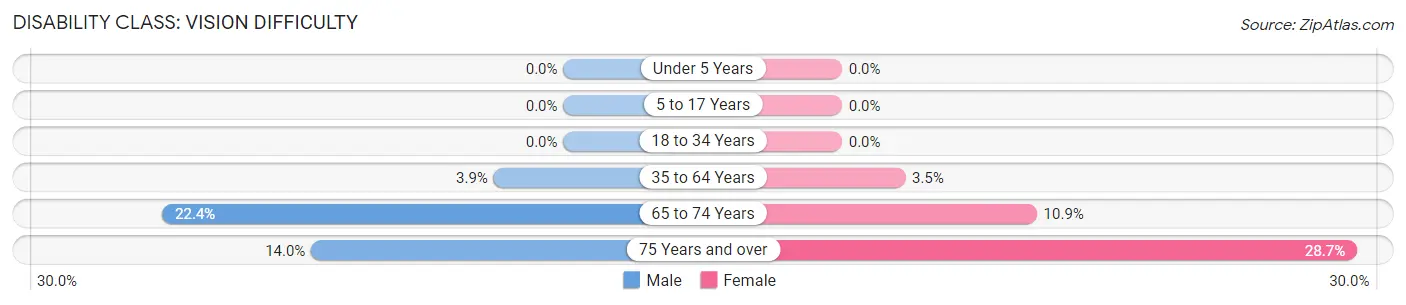
| Age Bracket | Male | Female |
| Under 5 Years | 0 (0.0%) | 0 (0.0%) |
| 5 to 17 Years | 0 (0.0%) | 0 (0.0%) |
| 18 to 34 Years | 0 (0.0%) | 0 (0.0%) |
| 35 to 64 Years | 22 (3.9%) | 17 (3.5%) |
| 65 to 74 Years | 38 (22.4%) | 14 (10.8%) |
| 75 Years and over | 8 (14.0%) | 35 (28.7%) |
Disability Class: Cognitive Difficulty
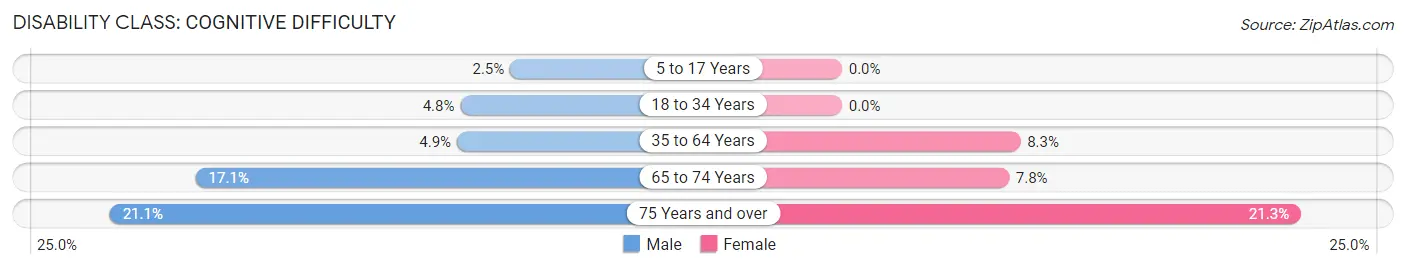
| Age Bracket | Male | Female |
| 5 to 17 Years | 4 (2.5%) | 0 (0.0%) |
| 18 to 34 Years | 12 (4.8%) | 0 (0.0%) |
| 35 to 64 Years | 28 (4.9%) | 40 (8.3%) |
| 65 to 74 Years | 29 (17.1%) | 10 (7.7%) |
| 75 Years and over | 12 (21.0%) | 26 (21.3%) |
Disability Class: Ambulatory Difficulty
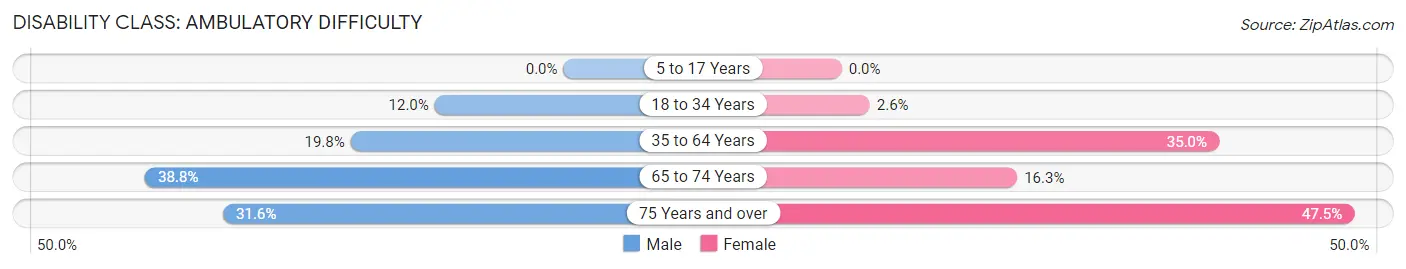
| Age Bracket | Male | Female |
| 5 to 17 Years | 0 (0.0%) | 0 (0.0%) |
| 18 to 34 Years | 30 (11.9%) | 5 (2.6%) |
| 35 to 64 Years | 112 (19.8%) | 169 (35.0%) |
| 65 to 74 Years | 66 (38.8%) | 21 (16.3%) |
| 75 Years and over | 18 (31.6%) | 58 (47.5%) |
Disability Class: Self-Care Difficulty
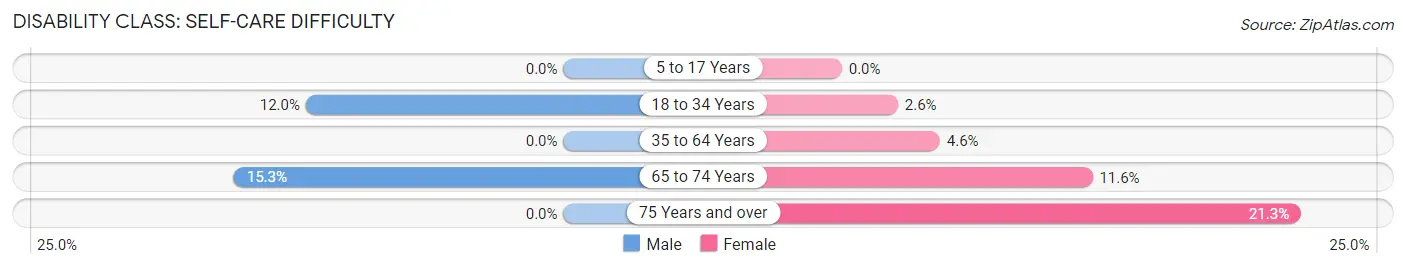
| Age Bracket | Male | Female |
| 5 to 17 Years | 0 (0.0%) | 0 (0.0%) |
| 18 to 34 Years | 30 (11.9%) | 5 (2.6%) |
| 35 to 64 Years | 0 (0.0%) | 22 (4.5%) |
| 65 to 74 Years | 26 (15.3%) | 15 (11.6%) |
| 75 Years and over | 0 (0.0%) | 26 (21.3%) |
Technology Access in La Pine
Computing Device Access in La Pine
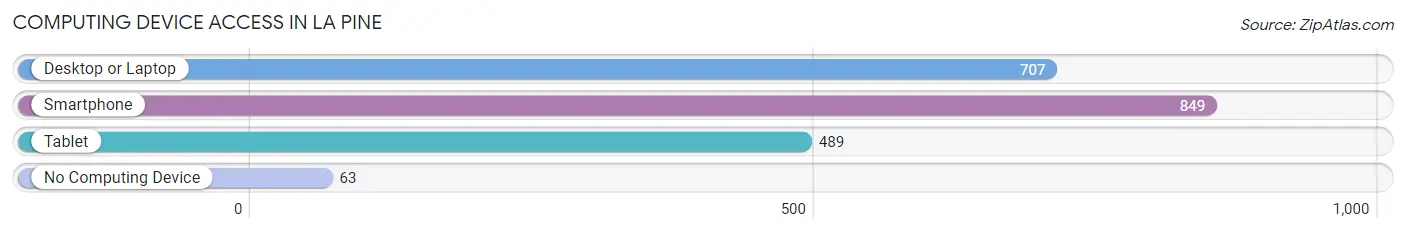
| Device Type | # Households | % Households |
| Desktop or Laptop | 707 | 73.0% |
| Smartphone | 849 | 87.6% |
| Tablet | 489 | 50.5% |
| No Computing Device | 63 | 6.5% |
| Total | 969 | 100.0% |
Internet Access in La Pine
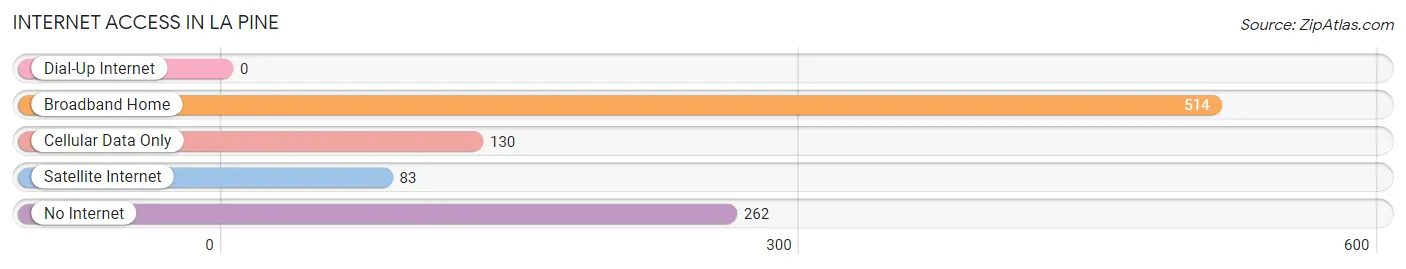
| Internet Type | # Households | % Households |
| Dial-Up Internet | 0 | 0.0% |
| Broadband Home | 514 | 53.0% |
| Cellular Data Only | 130 | 13.4% |
| Satellite Internet | 83 | 8.6% |
| No Internet | 262 | 27.0% |
| Total | 969 | 100.0% |
La Pine Summary
La Pine is a small city located in Deschutes County, Oregon, United States. It is situated in the high desert of Central Oregon, approximately 25 miles south of Bend and 25 miles north of Klamath Falls. The city is located in the heart of the Deschutes National Forest and is surrounded by the Cascade Mountains. La Pine is a popular destination for outdoor recreation, including camping, fishing, hiking, and skiing.
History
The area that is now La Pine was originally inhabited by the Northern Paiute people. The first non-native settlers arrived in the area in the late 1800s, and the town of La Pine was officially established in 1912. The town was named after the nearby La Pine River, which was named by French fur trappers in the early 1800s.
The early settlers of La Pine were primarily loggers and ranchers. The town grew slowly, and by the 1950s, it had a population of just over 500 people. In the 1960s, the town began to experience a population boom as people moved to the area to take advantage of the nearby recreational opportunities.
Geography
La Pine is located in the high desert of Central Oregon, approximately 25 miles south of Bend and 25 miles north of Klamath Falls. The city is situated in the heart of the Deschutes National Forest and is surrounded by the Cascade Mountains. The city is located at an elevation of 4,000 feet and has a total area of 4.2 square miles.
The climate in La Pine is semi-arid, with hot summers and cold winters. The average annual temperature is 44 degrees Fahrenheit, and the average annual precipitation is 11 inches.
Economy
The economy of La Pine is largely based on tourism and outdoor recreation. The city is a popular destination for camping, fishing, hiking, and skiing. The nearby Deschutes National Forest provides a variety of recreational opportunities, including camping, fishing, hunting, and hiking.
The city is also home to several businesses, including restaurants, retail stores, and service providers. The city is also home to several manufacturing companies, including a wood products manufacturer and a metal fabrication company.
Demographics
As of the 2010 census, the population of La Pine was 1,653. The racial makeup of the city was 94.3% White, 0.7% African American, 0.7% Native American, 0.7% Asian, 0.2% Pacific Islander, 1.2% from other races, and 2.1% from two or more races. Hispanic or Latino of any race were 4.2% of the population.
The median household income in La Pine was $37,917, and the median family income was $45,938. The per capita income was $20,945. About 15.3% of the population was below the poverty line.
Common Questions
What is Per Capita Income in La Pine?
Per Capita income in La Pine is $24,382.
What is the Median Family Income in La Pine?
Median Family Income in La Pine is $54,091.
What is the Median Household income in La Pine?
Median Household Income in La Pine is $50,625.
What is Income or Wage Gap in La Pine?
Income or Wage Gap in La Pine is 43.1%.
Women in La Pine earn 56.9 cents for every dollar earned by a man.
What is Inequality or Gini Index in La Pine?
Inequality or Gini Index in La Pine is 0.40.
What is the Total Population of La Pine?
Total Population of La Pine is 2,483.
What is the Total Male Population of La Pine?
Total Male Population of La Pine is 1,327.
What is the Total Female Population of La Pine?
Total Female Population of La Pine is 1,156.
What is the Ratio of Males per 100 Females in La Pine?
There are 114.79 Males per 100 Females in La Pine.
What is the Ratio of Females per 100 Males in La Pine?
There are 87.11 Females per 100 Males in La Pine.
What is the Median Population Age in La Pine?
Median Population Age in La Pine is 47.9 Years.
What is the Average Family Size in La Pine
Average Family Size in La Pine is 3.1 People.
What is the Average Household Size in La Pine
Average Household Size in La Pine is 2.5 People.
How Large is the Labor Force in La Pine?
There are 904 People in the Labor Forcein in La Pine.
What is the Percentage of People in the Labor Force in La Pine?
43.6% of People are in the Labor Force in La Pine.
What is the Unemployment Rate in La Pine?
Unemployment Rate in La Pine is 5.4%.