Mulino, OR Map & Demographics
Mulino Map
Mulino Overview
$38,700
PER CAPITA INCOME
$105,804
AVG FAMILY INCOME
$98,417
AVG HOUSEHOLD INCOME
57.8%
WAGE / INCOME GAP [ % ]
42.2¢/ $1
WAGE / INCOME GAP [ $ ]
0.38
INEQUALITY / GINI INDEX
2,203
TOTAL POPULATION
1,083
MALE POPULATION
1,120
FEMALE POPULATION
96.70
MALES / 100 FEMALES
103.42
FEMALES / 100 MALES
52.1
MEDIAN AGE
3.0
AVG FAMILY SIZE
3.1
AVG HOUSEHOLD SIZE
1,115
LABOR FORCE [ PEOPLE ]
56.9%
PERCENT IN LABOR FORCE
11.6%
UNEMPLOYMENT RATE
Mulino Zip Codes
Mulino Area Codes
Income in Mulino
Income Overview in Mulino
Per Capita Income in Mulino is $38,700, while median incomes of families and households are $105,804 and $98,417 respectively.
| Characteristic | Number | Measure |
| Per Capita Income | 2,203 | $38,700 |
| Median Family Income | 605 | $105,804 |
| Mean Family Income | 605 | $115,787 |
| Median Household Income | 711 | $98,417 |
| Mean Household Income | 711 | $114,339 |
| Income Deficit | 605 | $0 |
| Wage / Income Gap (%) | 2,203 | 57.81% |
| Wage / Income Gap ($) | 2,203 | 42.19¢ per $1 |
| Gini / Inequality Index | 2,203 | 0.38 |
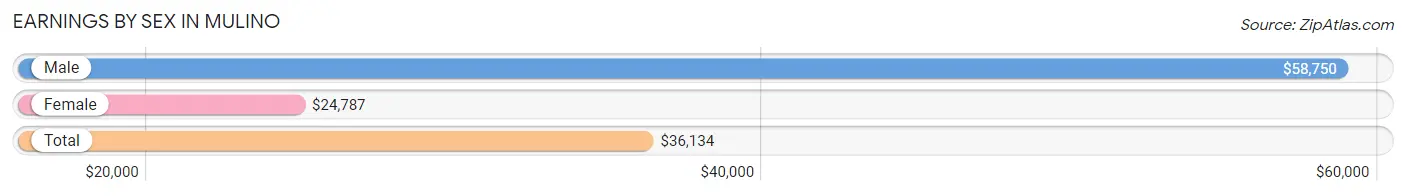
Earnings by Sex in Mulino
Average Earnings in Mulino are $36,134, $58,750 for men and $24,787 for women, a difference of 57.8%.
| Sex | Number | Average Earnings |
| Male | 615 (54.8%) | $58,750 |
| Female | 508 (45.2%) | $24,787 |
| Total | 1,123 (100.0%) | $36,134 |
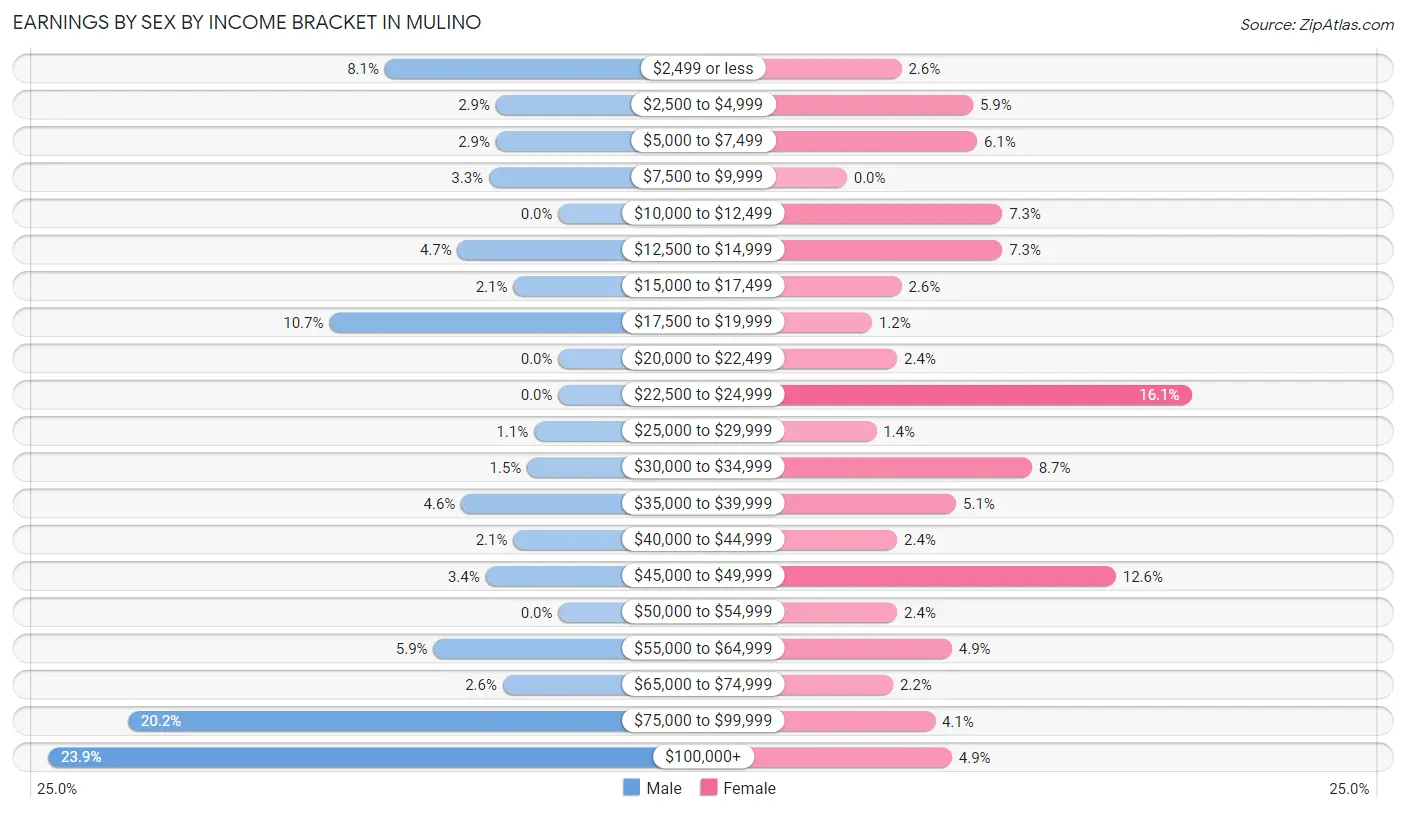
Earnings by Sex by Income Bracket in Mulino
The most common earnings brackets in Mulino are $100,000+ for men (147 | 23.9%) and $22,500 to $24,999 for women (82 | 16.1%).
| Income | Male | Female |
| $2,499 or less | 50 (8.1%) | 13 (2.6%) |
| $2,500 to $4,999 | 18 (2.9%) | 30 (5.9%) |
| $5,000 to $7,499 | 18 (2.9%) | 31 (6.1%) |
| $7,500 to $9,999 | 20 (3.3%) | 0 (0.0%) |
| $10,000 to $12,499 | 0 (0.0%) | 37 (7.3%) |
| $12,500 to $14,999 | 29 (4.7%) | 37 (7.3%) |
| $15,000 to $17,499 | 13 (2.1%) | 13 (2.6%) |
| $17,500 to $19,999 | 66 (10.7%) | 6 (1.2%) |
| $20,000 to $22,499 | 0 (0.0%) | 12 (2.4%) |
| $22,500 to $24,999 | 0 (0.0%) | 82 (16.1%) |
| $25,000 to $29,999 | 7 (1.1%) | 7 (1.4%) |
| $30,000 to $34,999 | 9 (1.5%) | 44 (8.7%) |
| $35,000 to $39,999 | 28 (4.5%) | 26 (5.1%) |
| $40,000 to $44,999 | 13 (2.1%) | 12 (2.4%) |
| $45,000 to $49,999 | 21 (3.4%) | 64 (12.6%) |
| $50,000 to $54,999 | 0 (0.0%) | 12 (2.4%) |
| $55,000 to $64,999 | 36 (5.9%) | 25 (4.9%) |
| $65,000 to $74,999 | 16 (2.6%) | 11 (2.2%) |
| $75,000 to $99,999 | 124 (20.2%) | 21 (4.1%) |
| $100,000+ | 147 (23.9%) | 25 (4.9%) |
| Total | 615 (100.0%) | 508 (100.0%) |
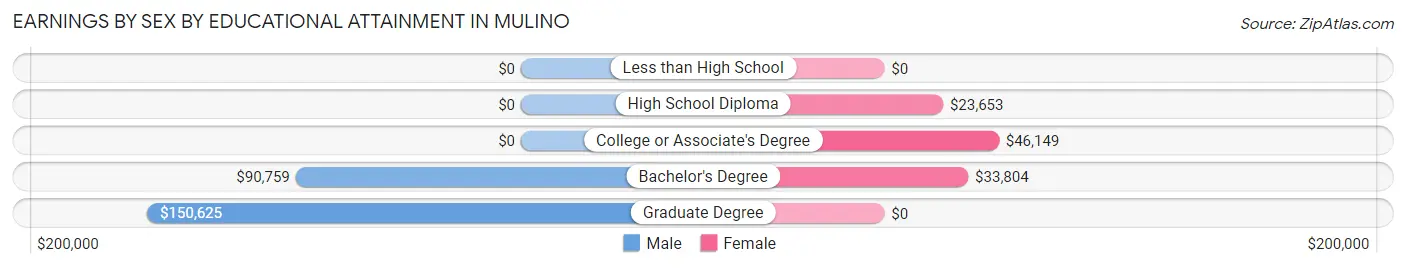
Earnings by Sex by Educational Attainment in Mulino
Average earnings in Mulino are $75,329 for men and $29,464 for women, a difference of 60.9%. Men with an educational attainment of graduate degree enjoy the highest average annual earnings of $150,625, while those with bachelor's degree education earn the least with $90,759. Women with an educational attainment of college or associate's degree earn the most with the average annual earnings of $46,149, while those with high school diploma education have the smallest earnings of $23,653.
| Educational Attainment | Male Income | Female Income |
| Less than High School | - | - |
| High School Diploma | - | - |
| College or Associate's Degree | - | - |
| Bachelor's Degree | $90,759 | $33,804 |
| Graduate Degree | $150,625 | $0 |
| Total | $75,329 | $29,464 |
Family Income in Mulino
Family Income Brackets in Mulino
According to the Mulino family income data, there are 143 families falling into the $100,000 to $149,999 income range, which is the most common income bracket and makes up 23.6% of all families.
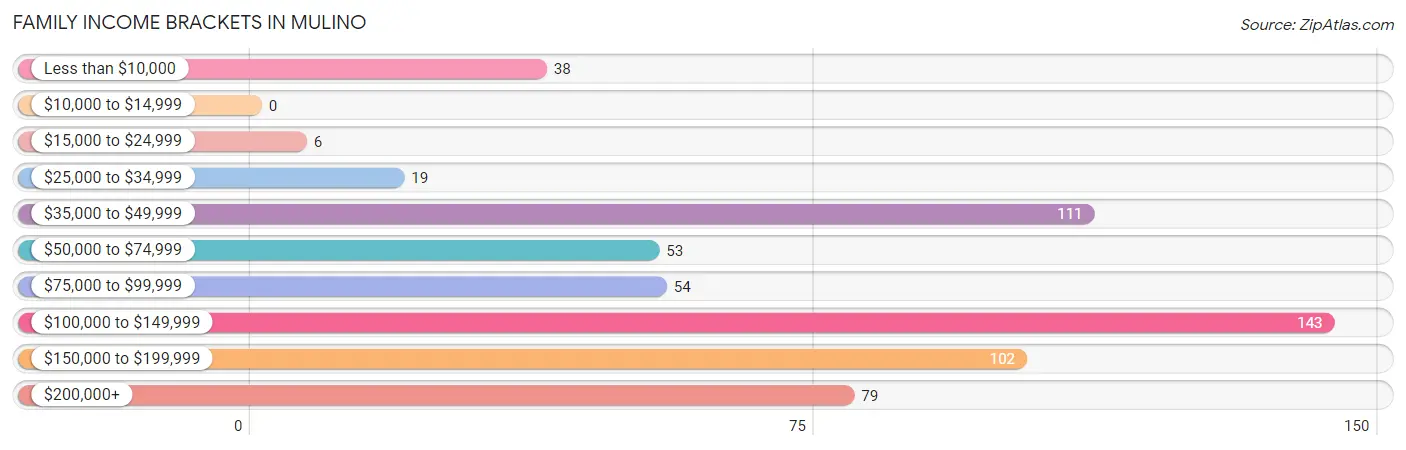
| Income Bracket | # Families | % Families |
| Less than $10,000 | 38 | 6.3% |
| $10,000 to $14,999 | 0 | 0.0% |
| $15,000 to $24,999 | 6 | 1.0% |
| $25,000 to $34,999 | 19 | 3.1% |
| $35,000 to $49,999 | 111 | 18.3% |
| $50,000 to $74,999 | 53 | 8.8% |
| $75,000 to $99,999 | 54 | 8.9% |
| $100,000 to $149,999 | 143 | 23.6% |
| $150,000 to $199,999 | 102 | 16.9% |
| $200,000+ | 79 | 13.1% |
Family Income by Famaliy Size in Mulino
5-person families (52 | 8.6%) account for the highest median family income in Mulino with $187,813 per family, while 4-person families (39 | 6.5%) have the highest median income of $46,493 per family member.
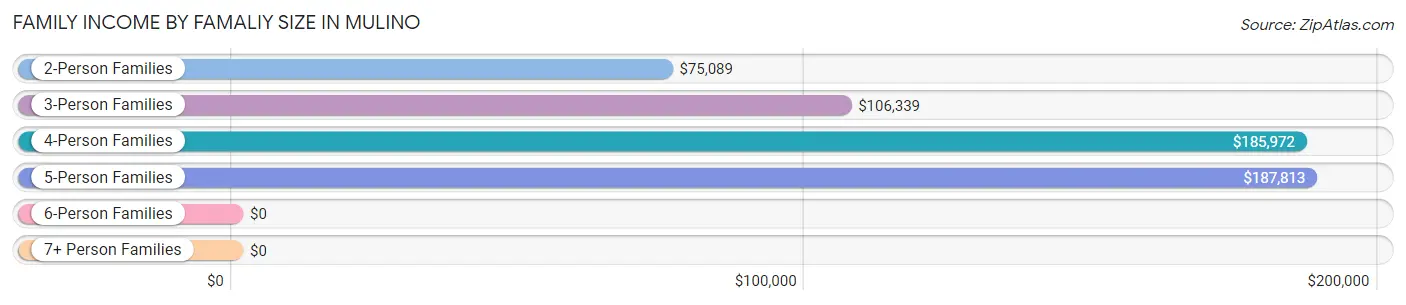
| Income Bracket | # Families | Median Income |
| 2-Person Families | 359 (59.3%) | $75,089 |
| 3-Person Families | 123 (20.3%) | $106,339 |
| 4-Person Families | 39 (6.5%) | $185,972 |
| 5-Person Families | 52 (8.6%) | $187,813 |
| 6-Person Families | 19 (3.1%) | $0 |
| 7+ Person Families | 13 (2.1%) | $0 |
| Total | 605 (100.0%) | $105,804 |
Family Income by Number of Earners in Mulino
The median family income in Mulino is $105,804, with families comprising 3+ earners (51) having the highest median family income of $186,375, while families with no earners (135) have the lowest median family income of $45,046, accounting for 8.4% and 22.3% of families, respectively.
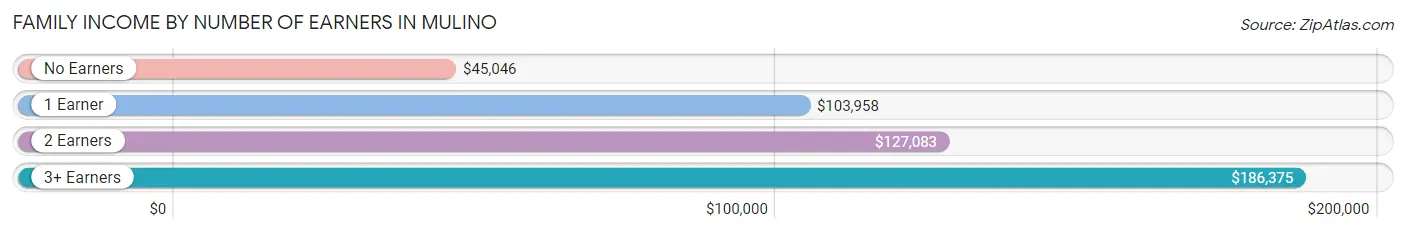
| Number of Earners | # Families | Median Income |
| No Earners | 135 (22.3%) | $45,046 |
| 1 Earner | 149 (24.6%) | $103,958 |
| 2 Earners | 270 (44.6%) | $127,083 |
| 3+ Earners | 51 (8.4%) | $186,375 |
| Total | 605 (100.0%) | $105,804 |
Household Income in Mulino
Household Income Brackets in Mulino
With 134 households falling in the category, the $100,000 to $149,999 income range is the most frequent in Mulino, accounting for 18.9% of all households.
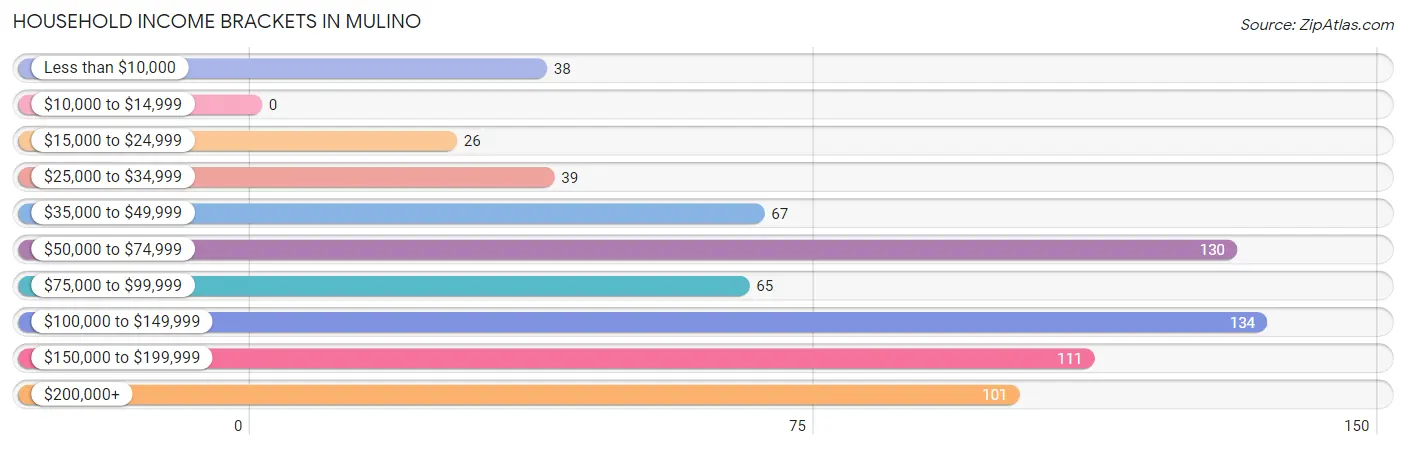
| Income Bracket | # Households | % Households |
| Less than $10,000 | 38 | 5.3% |
| $10,000 to $14,999 | 0 | 0.0% |
| $15,000 to $24,999 | 26 | 3.7% |
| $25,000 to $34,999 | 39 | 5.5% |
| $35,000 to $49,999 | 67 | 9.4% |
| $50,000 to $74,999 | 130 | 18.3% |
| $75,000 to $99,999 | 65 | 9.1% |
| $100,000 to $149,999 | 134 | 18.8% |
| $150,000 to $199,999 | 111 | 15.6% |
| $200,000+ | 101 | 14.2% |
Household Income by Householder Age in Mulino
The median household income in Mulino is $98,417, with the highest median household income of $181,217 found in the 25 to 44 years age bracket for the primary householder. A total of 99 households (13.9%) fall into this category. Meanwhile, the 15 to 24 years age bracket for the primary householder has the lowest median household income of $0, with 8 households (1.1%) in this group.
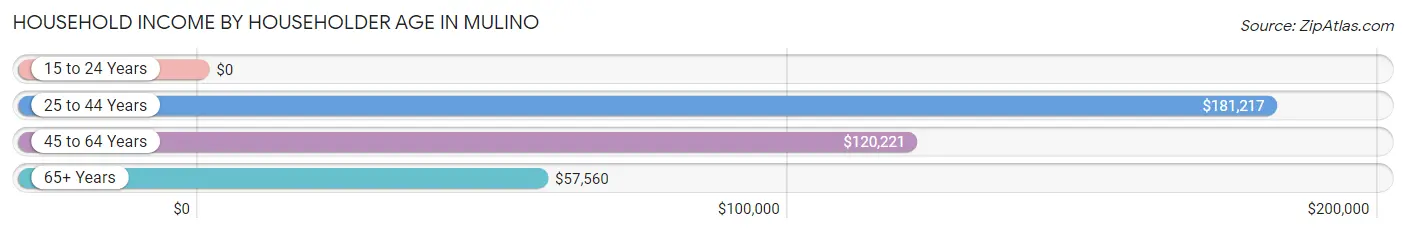
| Income Bracket | # Households | Median Income |
| 15 to 24 Years | 8 (1.1%) | $0 |
| 25 to 44 Years | 99 (13.9%) | $181,217 |
| 45 to 64 Years | 399 (56.1%) | $120,221 |
| 65+ Years | 205 (28.8%) | $57,560 |
| Total | 711 (100.0%) | $98,417 |
Poverty in Mulino
Income Below Poverty by Sex and Age in Mulino
With 10.7% poverty level for males and 12.9% for females among the residents of Mulino, 16 and 17 year old males and 65 to 74 year old females are the most vulnerable to poverty, with 10 males (38.5%) and 87 females (35.2%) in their respective age groups living below the poverty level.
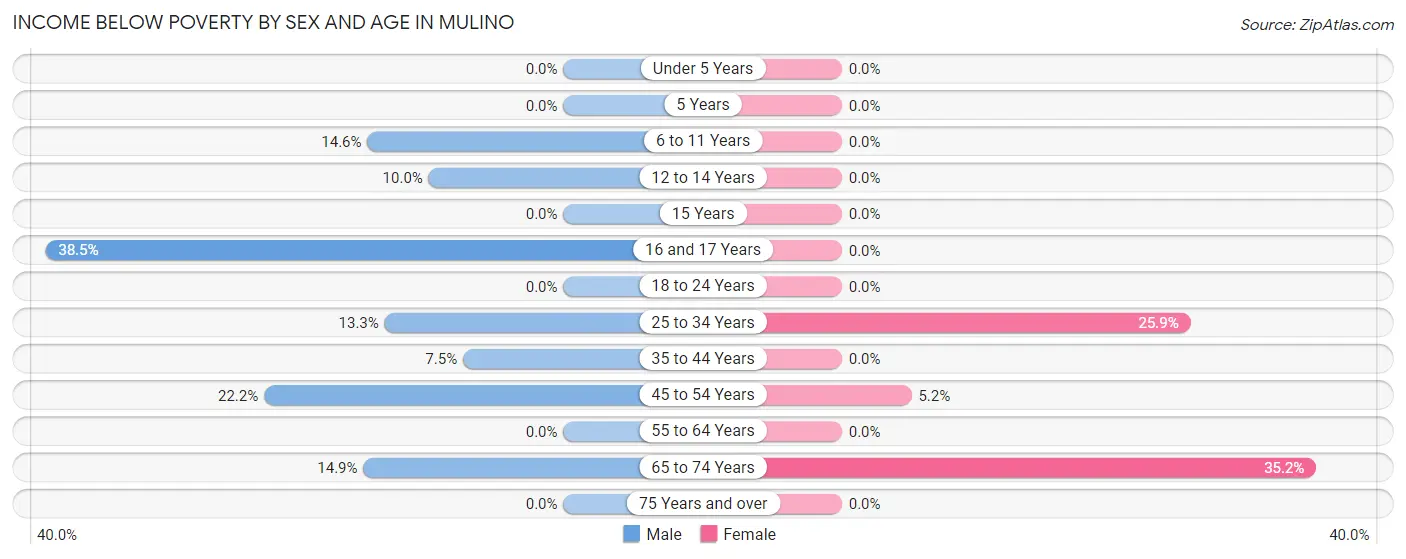
| Age Bracket | Male | Female |
| Under 5 Years | 0 (0.0%) | 0 (0.0%) |
| 5 Years | 0 (0.0%) | 0 (0.0%) |
| 6 to 11 Years | 8 (14.5%) | 0 (0.0%) |
| 12 to 14 Years | 8 (10.0%) | 0 (0.0%) |
| 15 Years | 0 (0.0%) | 0 (0.0%) |
| 16 and 17 Years | 10 (38.5%) | 0 (0.0%) |
| 18 to 24 Years | 0 (0.0%) | 0 (0.0%) |
| 25 to 34 Years | 15 (13.3%) | 51 (25.9%) |
| 35 to 44 Years | 7 (7.4%) | 0 (0.0%) |
| 45 to 54 Years | 38 (22.2%) | 6 (5.2%) |
| 55 to 64 Years | 0 (0.0%) | 0 (0.0%) |
| 65 to 74 Years | 30 (14.8%) | 87 (35.2%) |
| 75 Years and over | 0 (0.0%) | 0 (0.0%) |
| Total | 116 (10.7%) | 144 (12.9%) |
Income Above Poverty by Sex and Age in Mulino
According to the poverty statistics in Mulino, males aged under 5 years and females aged under 5 years are the age groups that are most secure financially, with 100.0% of males and 100.0% of females in these age groups living above the poverty line.
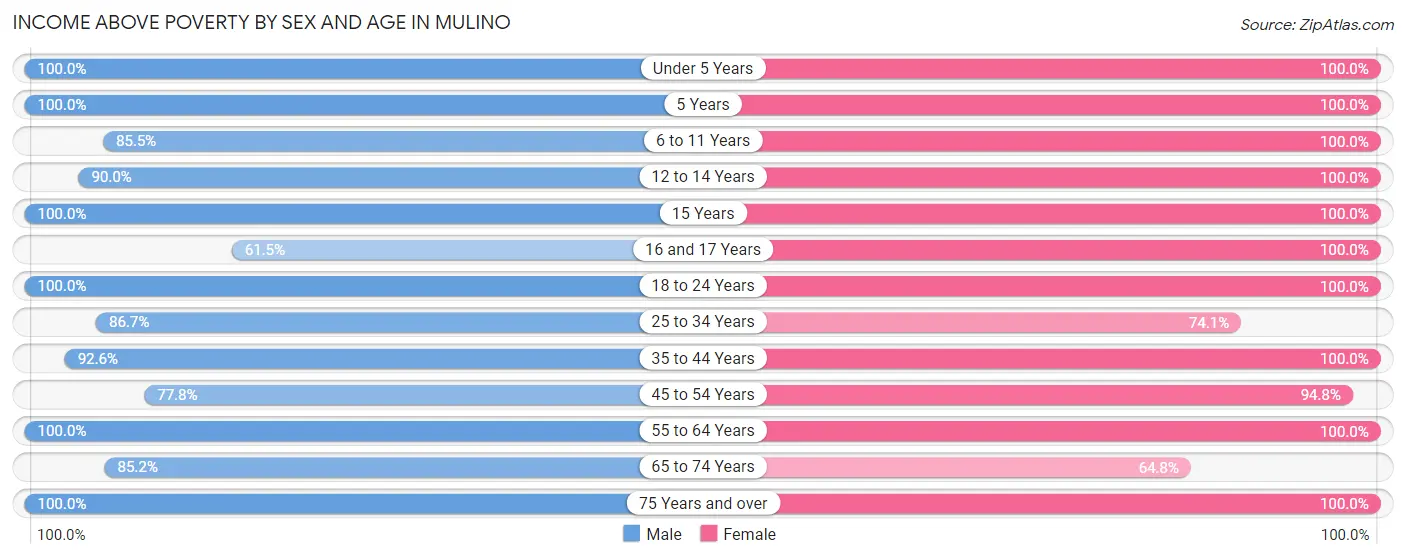
| Age Bracket | Male | Female |
| Under 5 Years | 15 (100.0%) | 19 (100.0%) |
| 5 Years | 3 (100.0%) | 4 (100.0%) |
| 6 to 11 Years | 47 (85.5%) | 16 (100.0%) |
| 12 to 14 Years | 72 (90.0%) | 18 (100.0%) |
| 15 Years | 25 (100.0%) | 9 (100.0%) |
| 16 and 17 Years | 16 (61.5%) | 38 (100.0%) |
| 18 to 24 Years | 78 (100.0%) | 119 (100.0%) |
| 25 to 34 Years | 98 (86.7%) | 146 (74.1%) |
| 35 to 44 Years | 87 (92.5%) | 86 (100.0%) |
| 45 to 54 Years | 133 (77.8%) | 110 (94.8%) |
| 55 to 64 Years | 173 (100.0%) | 211 (100.0%) |
| 65 to 74 Years | 172 (85.2%) | 160 (64.8%) |
| 75 Years and over | 48 (100.0%) | 40 (100.0%) |
| Total | 967 (89.3%) | 976 (87.1%) |
Income Below Poverty Among Married-Couple Families in Mulino
The poverty statistics for married-couple families in Mulino show that 9.3% or 45 of the total 483 families live below the poverty line. Families with no children have the highest poverty rate of 10.9%, comprising of 38 families. On the other hand, families with 3 or 4 children have the lowest poverty rate of 0.0%, which includes 0 families.
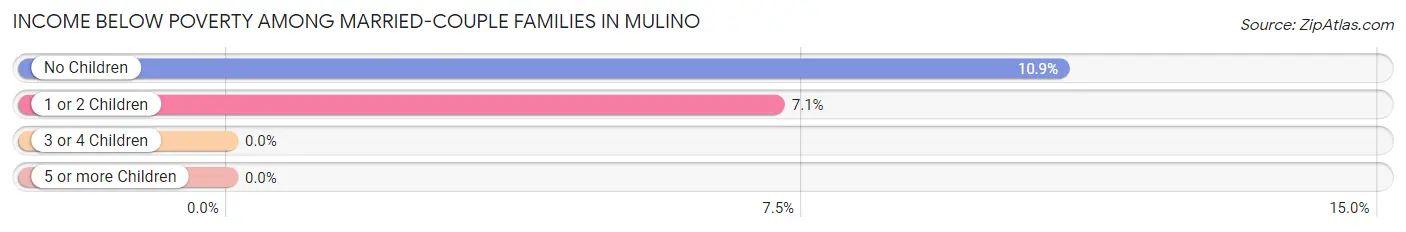
| Children | Above Poverty | Below Poverty |
| No Children | 312 (89.1%) | 38 (10.9%) |
| 1 or 2 Children | 91 (92.9%) | 7 (7.1%) |
| 3 or 4 Children | 35 (100.0%) | 0 (0.0%) |
| 5 or more Children | 0 (0.0%) | 0 (0.0%) |
| Total | 438 (90.7%) | 45 (9.3%) |
Income Below Poverty Among Single-Parent Households in Mulino
| Children | Single Father | Single Mother |
| No Children | 0 (0.0%) | 0 (0.0%) |
| 1 or 2 Children | 0 (0.0%) | 0 (0.0%) |
| 3 or 4 Children | 0 (0.0%) | 0 (0.0%) |
| 5 or more Children | 0 (0.0%) | 0 (0.0%) |
| Total | 0 (0.0%) | 0 (0.0%) |
Income Below Poverty Among Married-Couple vs Single-Parent Households in Mulino
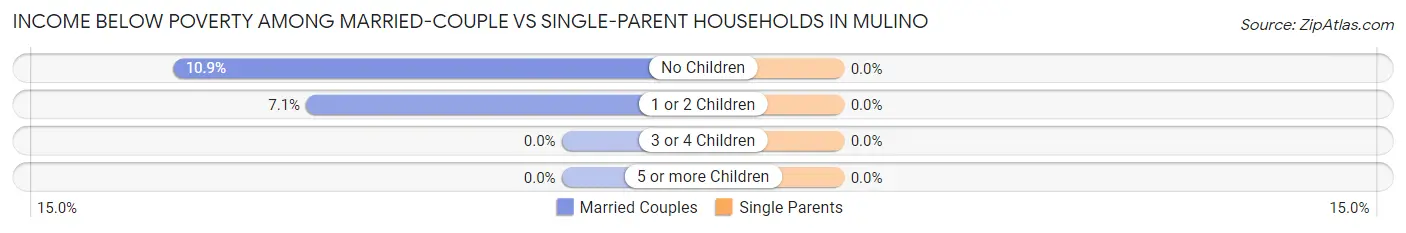
| Children | Married-Couple Families | Single-Parent Households |
| No Children | 38 (10.9%) | 0 (0.0%) |
| 1 or 2 Children | 7 (7.1%) | 0 (0.0%) |
| 3 or 4 Children | 0 (0.0%) | 0 (0.0%) |
| 5 or more Children | 0 (0.0%) | 0 (0.0%) |
| Total | 45 (9.3%) | 0 (0.0%) |
Race in Mulino
The most populous races in Mulino are White / Caucasian (2,027 | 92.0%), Native / Alaskan (87 | 4.0%), and Some other Race (42 | 1.9%).
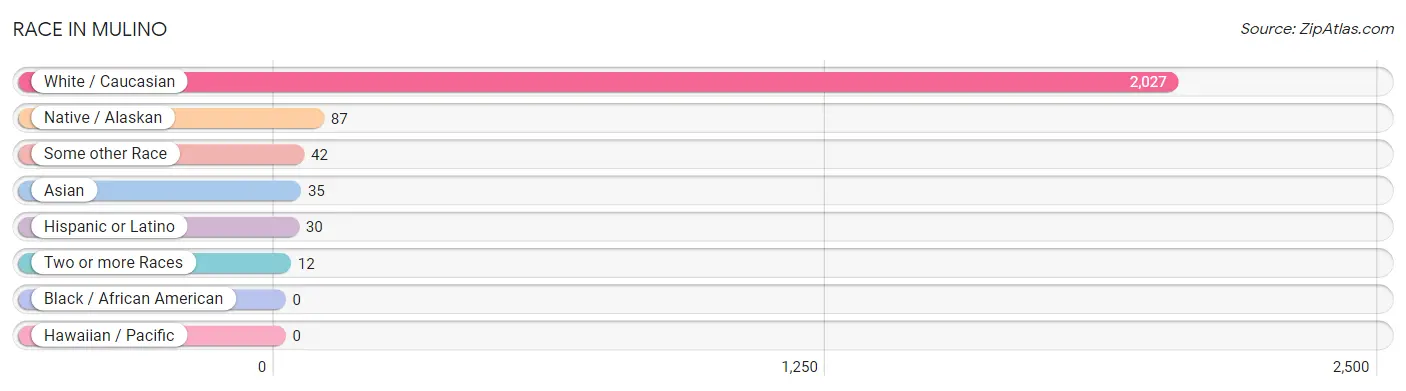
| Race | # Population | % Population |
| Asian | 35 | 1.6% |
| Black / African American | 0 | 0.0% |
| Hawaiian / Pacific | 0 | 0.0% |
| Hispanic or Latino | 30 | 1.4% |
| Native / Alaskan | 87 | 4.0% |
| White / Caucasian | 2,027 | 92.0% |
| Two or more Races | 12 | 0.5% |
| Some other Race | 42 | 1.9% |
| Total | 2,203 | 100.0% |
Ancestry in Mulino
The most populous ancestries reported in Mulino are German (371 | 16.8%), Irish (323 | 14.7%), English (255 | 11.6%), French (187 | 8.5%), and Norwegian (100 | 4.5%), together accounting for 56.1% of all Mulino residents.
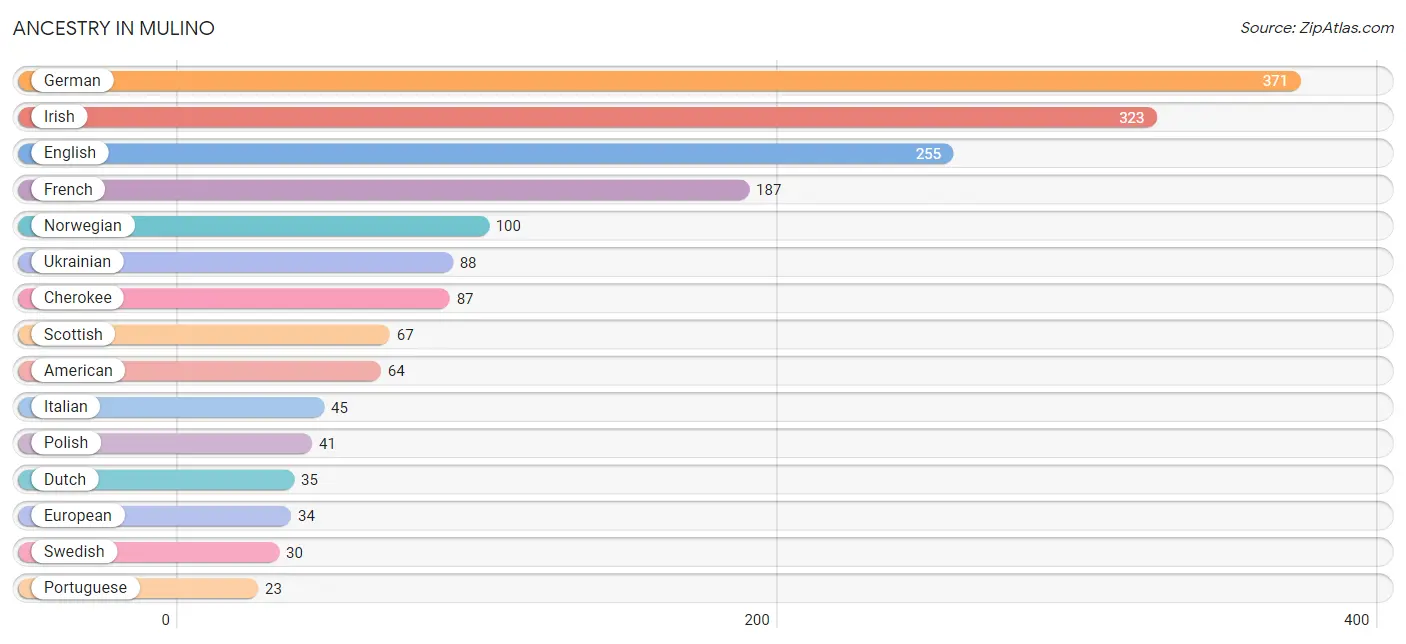
| Ancestry | # Population | % Population |
| American | 64 | 2.9% |
| Belgian | 12 | 0.5% |
| Bhutanese | 19 | 0.9% |
| Cherokee | 87 | 4.0% |
| Czech | 4 | 0.2% |
| Czechoslovakian | 14 | 0.6% |
| Danish | 17 | 0.8% |
| Dutch | 35 | 1.6% |
| Ecuadorian | 15 | 0.7% |
| English | 255 | 11.6% |
| European | 34 | 1.5% |
| French | 187 | 8.5% |
| German | 371 | 16.8% |
| Greek | 15 | 0.7% |
| Indian (Asian) | 21 | 0.9% |
| Irish | 323 | 14.7% |
| Italian | 45 | 2.0% |
| Mexican | 6 | 0.3% |
| Norwegian | 100 | 4.5% |
| Polish | 41 | 1.9% |
| Portuguese | 23 | 1.0% |
| Puerto Rican | 9 | 0.4% |
| Scandinavian | 10 | 0.4% |
| Scotch-Irish | 6 | 0.3% |
| Scottish | 67 | 3.0% |
| South American | 15 | 0.7% |
| Swedish | 30 | 1.4% |
| Thai | 7 | 0.3% |
| Ukrainian | 88 | 4.0% | View All 29 Rows |
Immigrants in Mulino
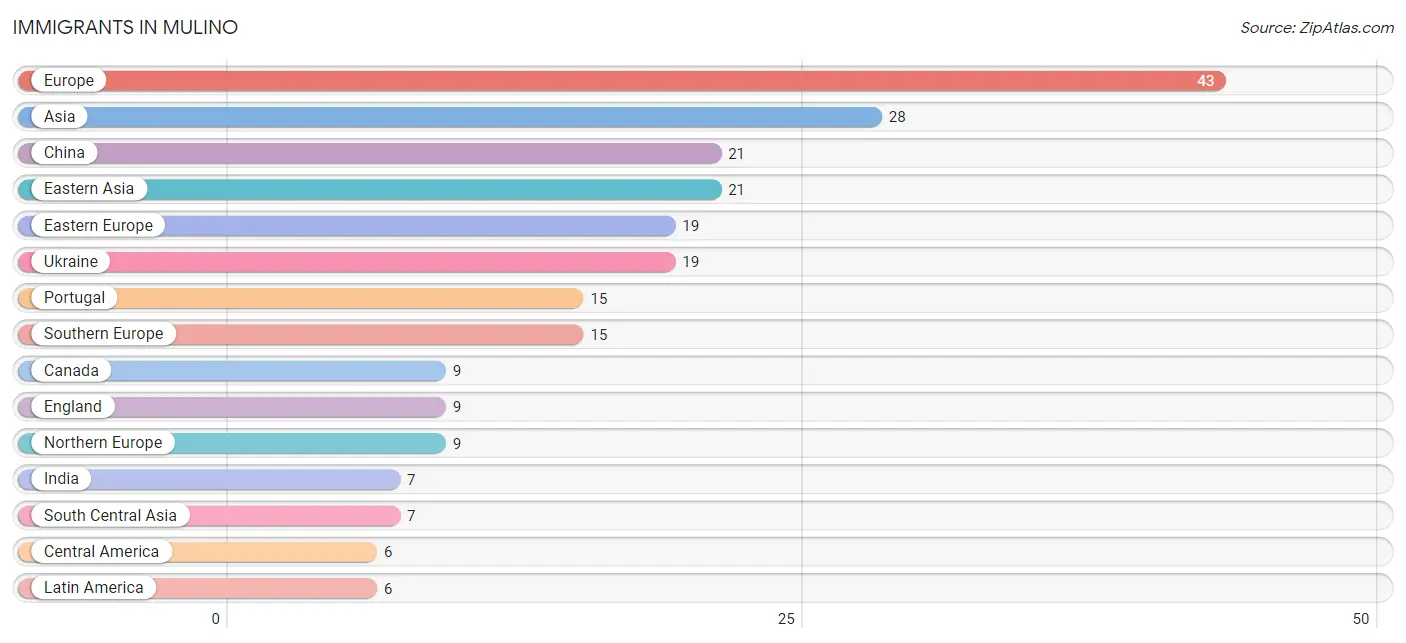
The most numerous immigrant groups reported in Mulino came from Europe (43 | 1.9%), Asia (28 | 1.3%), China (21 | 0.9%), Eastern Asia (21 | 0.9%), and Eastern Europe (19 | 0.9%), together accounting for 6.0% of all Mulino residents.
| Immigration Origin | # Population | % Population |
| Asia | 28 | 1.3% |
| Canada | 9 | 0.4% |
| Central America | 6 | 0.3% |
| China | 21 | 0.9% |
| Eastern Asia | 21 | 0.9% |
| Eastern Europe | 19 | 0.9% |
| England | 9 | 0.4% |
| Europe | 43 | 1.9% |
| India | 7 | 0.3% |
| Latin America | 6 | 0.3% |
| Mexico | 6 | 0.3% |
| Northern Europe | 9 | 0.4% |
| Portugal | 15 | 0.7% |
| South Central Asia | 7 | 0.3% |
| Southern Europe | 15 | 0.7% |
| Ukraine | 19 | 0.9% | View All 16 Rows |
Sex and Age in Mulino
Sex and Age in Mulino
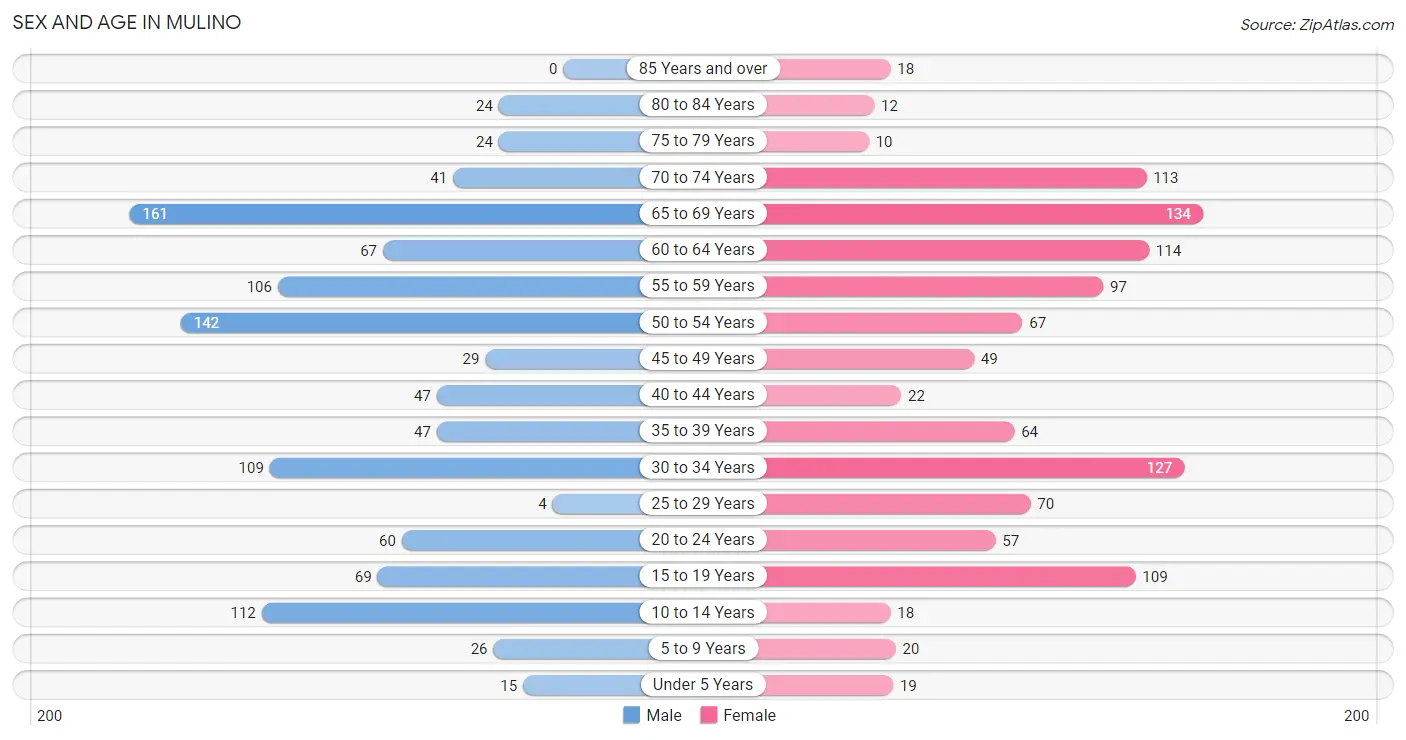
The most populous age groups in Mulino are 65 to 69 Years (161 | 14.9%) for men and 65 to 69 Years (134 | 12.0%) for women.
| Age Bracket | Male | Female |
| Under 5 Years | 15 (1.4%) | 19 (1.7%) |
| 5 to 9 Years | 26 (2.4%) | 20 (1.8%) |
| 10 to 14 Years | 112 (10.3%) | 18 (1.6%) |
| 15 to 19 Years | 69 (6.4%) | 109 (9.7%) |
| 20 to 24 Years | 60 (5.5%) | 57 (5.1%) |
| 25 to 29 Years | 4 (0.4%) | 70 (6.2%) |
| 30 to 34 Years | 109 (10.1%) | 127 (11.3%) |
| 35 to 39 Years | 47 (4.3%) | 64 (5.7%) |
| 40 to 44 Years | 47 (4.3%) | 22 (2.0%) |
| 45 to 49 Years | 29 (2.7%) | 49 (4.4%) |
| 50 to 54 Years | 142 (13.1%) | 67 (6.0%) |
| 55 to 59 Years | 106 (9.8%) | 97 (8.7%) |
| 60 to 64 Years | 67 (6.2%) | 114 (10.2%) |
| 65 to 69 Years | 161 (14.9%) | 134 (12.0%) |
| 70 to 74 Years | 41 (3.8%) | 113 (10.1%) |
| 75 to 79 Years | 24 (2.2%) | 10 (0.9%) |
| 80 to 84 Years | 24 (2.2%) | 12 (1.1%) |
| 85 Years and over | 0 (0.0%) | 18 (1.6%) |
| Total | 1,083 (100.0%) | 1,120 (100.0%) |
Families and Households in Mulino
Median Family Size in Mulino
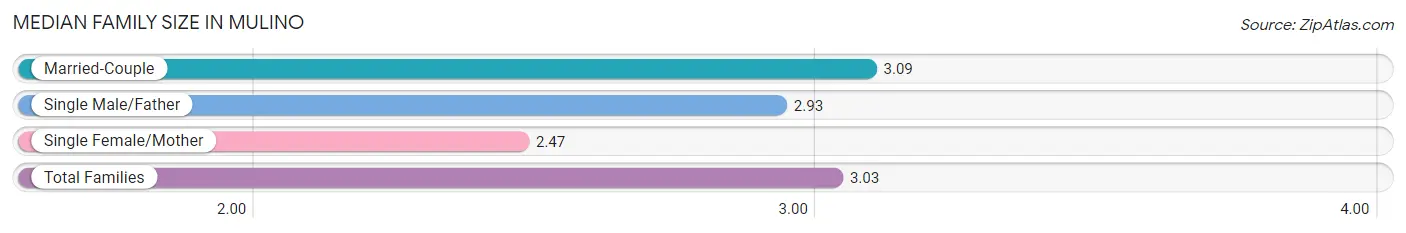
The median family size in Mulino is 3.03 persons per family, with married-couple families (483 | 79.8%) accounting for the largest median family size of 3.09 persons per family. On the other hand, single female/mother families (36 | 5.9%) represent the smallest median family size with 2.47 persons per family.
| Family Type | # Families | Family Size |
| Married-Couple | 483 (79.8%) | 3.09 |
| Single Male/Father | 86 (14.2%) | 2.93 |
| Single Female/Mother | 36 (5.9%) | 2.47 |
| Total Families | 605 (100.0%) | 3.03 |
Median Household Size in Mulino
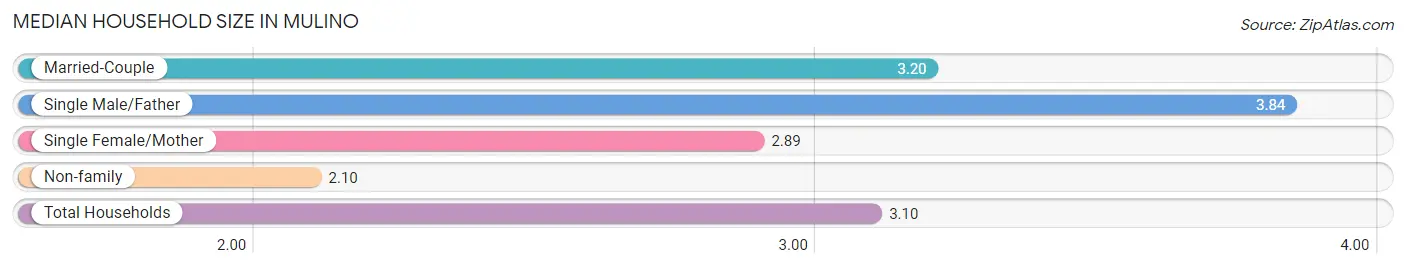
The median household size in Mulino is 3.10 persons per household, with single male/father households (86 | 12.1%) accounting for the largest median household size of 3.84 persons per household. non-family households (106 | 14.9%) represent the smallest median household size with 2.10 persons per household.
| Household Type | # Households | Household Size |
| Married-Couple | 483 (67.9%) | 3.20 |
| Single Male/Father | 86 (12.1%) | 3.84 |
| Single Female/Mother | 36 (5.1%) | 2.89 |
| Non-family | 106 (14.9%) | 2.10 |
| Total Households | 711 (100.0%) | 3.10 |
Household Size by Marriage Status in Mulino
Out of a total of 711 households in Mulino, 605 (85.1%) are family households, while 106 (14.9%) are nonfamily households. The most numerous type of family households are 2-person households, comprising 282, and the most common type of nonfamily households are 1-person households, comprising 59.
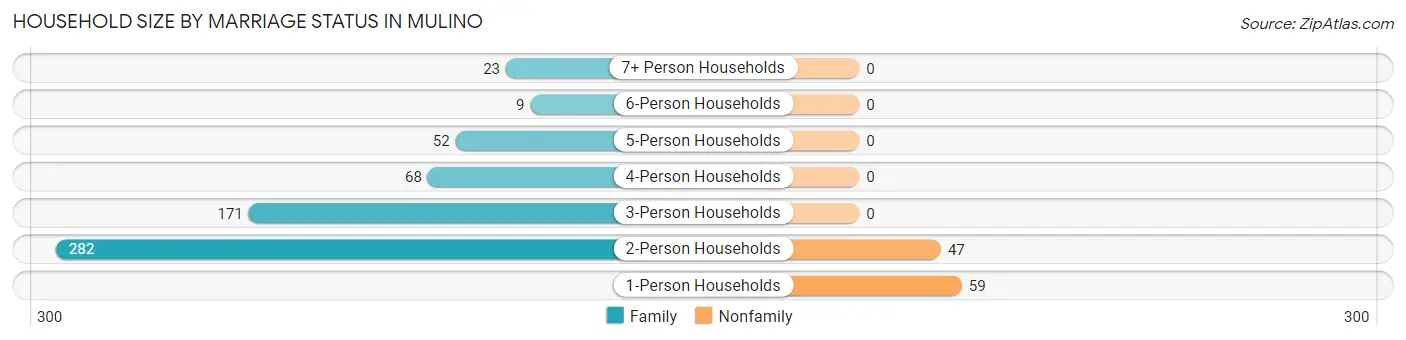
| Household Size | Family Households | Nonfamily Households |
| 1-Person Households | - | 59 (8.3%) |
| 2-Person Households | 282 (39.7%) | 47 (6.6%) |
| 3-Person Households | 171 (24.0%) | 0 (0.0%) |
| 4-Person Households | 68 (9.6%) | 0 (0.0%) |
| 5-Person Households | 52 (7.3%) | 0 (0.0%) |
| 6-Person Households | 9 (1.3%) | 0 (0.0%) |
| 7+ Person Households | 23 (3.2%) | 0 (0.0%) |
| Total | 605 (85.1%) | 106 (14.9%) |
Female Fertility in Mulino
Fertility by Age in Mulino
Average fertility rate in Mulino is 28.0 births per 1,000 women. Women in the age bracket of 20 to 34 years have the highest fertility rate with 55.0 births per 1,000 women. Women in the age bracket of 20 to 34 years acount for 100.0% of all women with births.
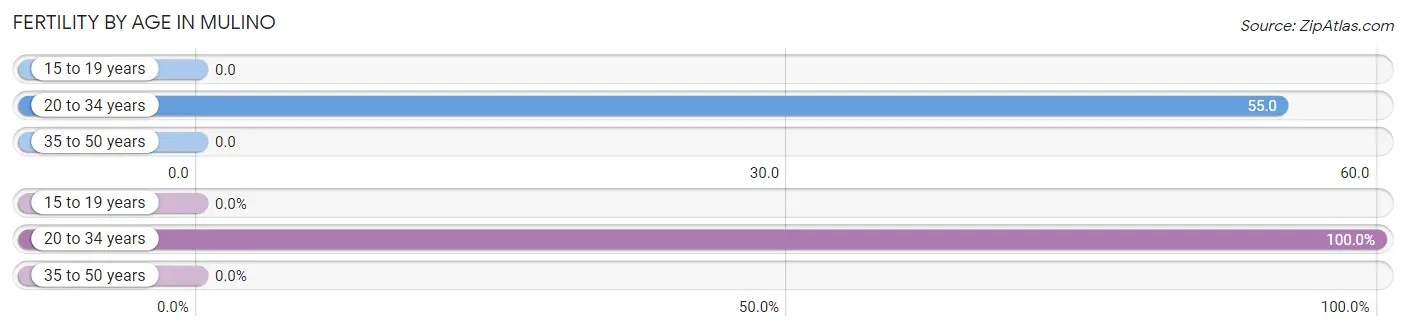
| Age Bracket | Women with Births | Births / 1,000 Women |
| 15 to 19 years | 0 (0.0%) | 0.0 |
| 20 to 34 years | 14 (100.0%) | 55.0 |
| 35 to 50 years | 0 (0.0%) | 0.0 |
| Total | 14 (100.0%) | 28.0 |
Fertility by Age by Marriage Status in Mulino
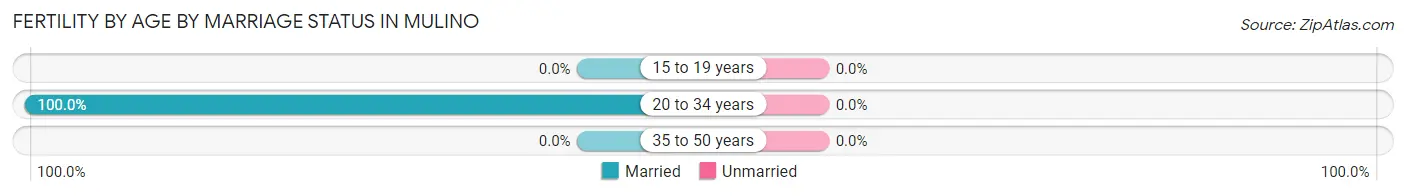
| Age Bracket | Married | Unmarried |
| 15 to 19 years | 0 (0.0%) | 0 (0.0%) |
| 20 to 34 years | 14 (100.0%) | 0 (0.0%) |
| 35 to 50 years | 0 (0.0%) | 0 (0.0%) |
| Total | 14 (100.0%) | 0 (0.0%) |
Fertility by Education in Mulino
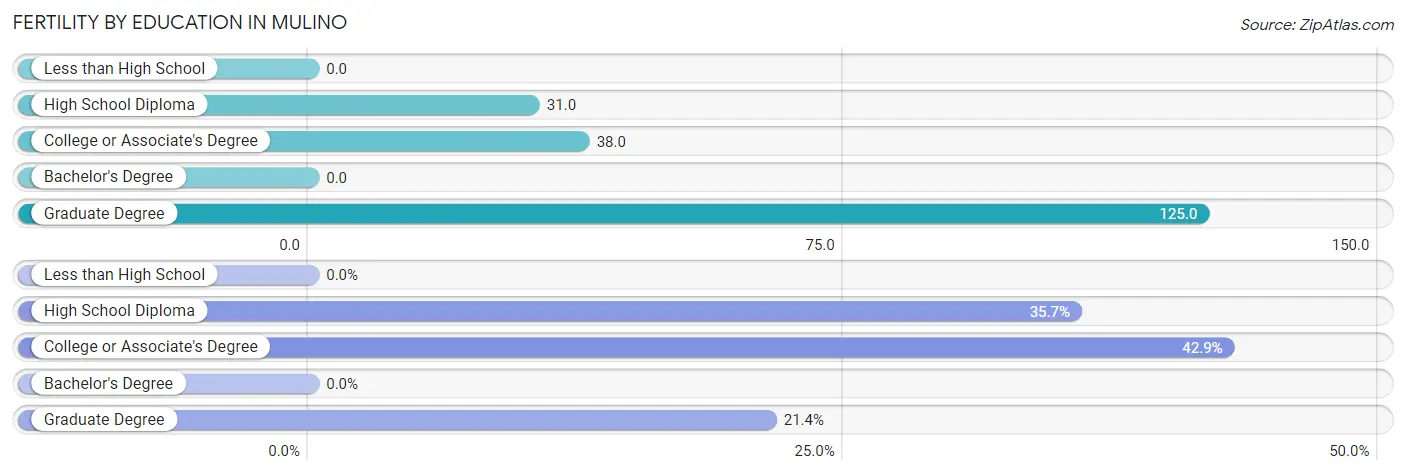
| Educational Attainment | Women with Births | Births / 1,000 Women |
| Less than High School | 0 (0.0%) | 0.0 |
| High School Diploma | 5 (35.7%) | 31.0 |
| College or Associate's Degree | 6 (42.9%) | 38.0 |
| Bachelor's Degree | 0 (0.0%) | 0.0 |
| Graduate Degree | 3 (21.4%) | 125.0 |
| Total | 14 (100.0%) | 28.0 |
Fertility by Education by Marriage Status in Mulino
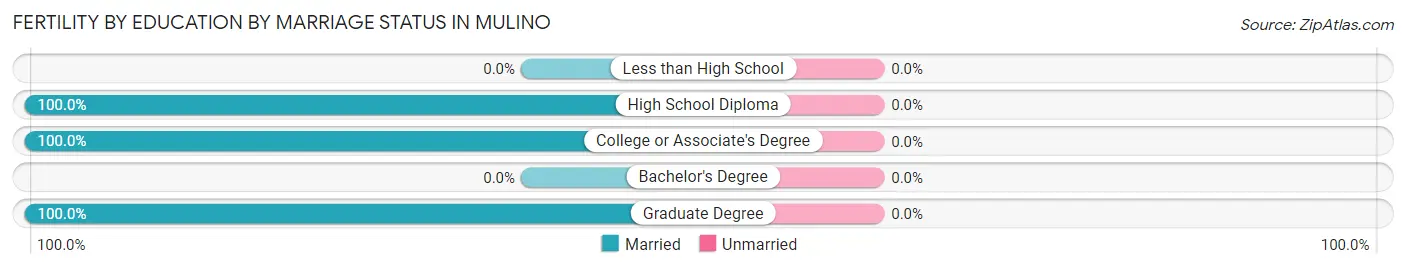
| Educational Attainment | Married | Unmarried |
| Less than High School | 0 (0.0%) | 0 (0.0%) |
| High School Diploma | 5 (100.0%) | 0 (0.0%) |
| College or Associate's Degree | 6 (100.0%) | 0 (0.0%) |
| Bachelor's Degree | 0 (0.0%) | 0 (0.0%) |
| Graduate Degree | 3 (100.0%) | 0 (0.0%) |
| Total | 14 (100.0%) | 0 (0.0%) |
Employment Characteristics in Mulino
Employment by Class of Employer in Mulino
Among the 967 employed individuals in Mulino, private company employees (523 | 54.1%), self-employed (not incorporated) (135 | 14.0%), and self-employed (incorporated) (119 | 12.3%) make up the most common classes of employment.
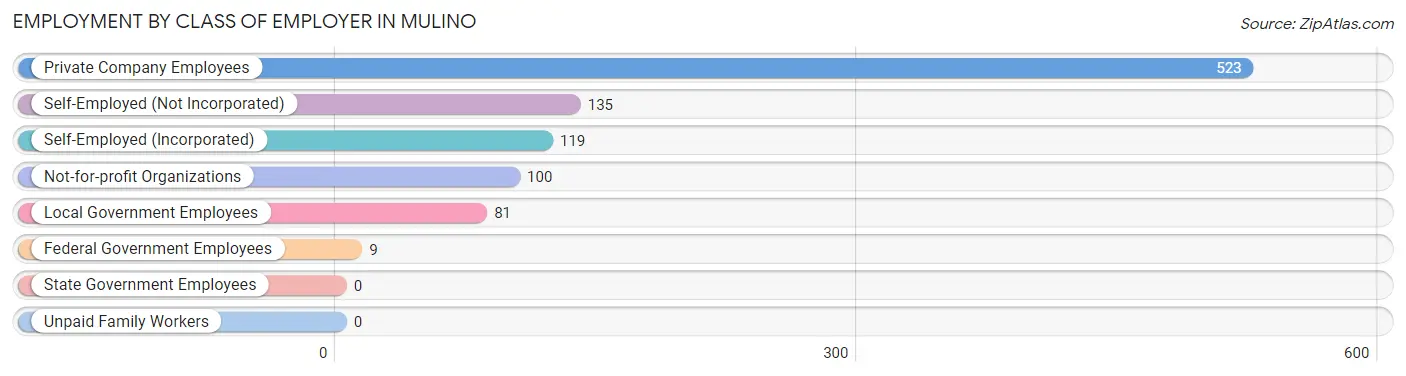
| Employer Class | # Employees | % Employees |
| Private Company Employees | 523 | 54.1% |
| Self-Employed (Incorporated) | 119 | 12.3% |
| Self-Employed (Not Incorporated) | 135 | 14.0% |
| Not-for-profit Organizations | 100 | 10.3% |
| Local Government Employees | 81 | 8.4% |
| State Government Employees | 0 | 0.0% |
| Federal Government Employees | 9 | 0.9% |
| Unpaid Family Workers | 0 | 0.0% |
| Total | 967 | 100.0% |
Employment Status by Age in Mulino
According to the labor force statistics for Mulino, out of the total population over 16 years of age (1,959), 56.9% or 1,115 individuals are in the labor force, with 11.6% or 129 of them unemployed. The age group with the highest labor force participation rate is 30 to 34 years, with 100.0% or 236 individuals in the labor force. Within the labor force, the 25 to 29 years age range has the highest percentage of unemployed individuals, with 43.8% or 14 of them being unemployed.
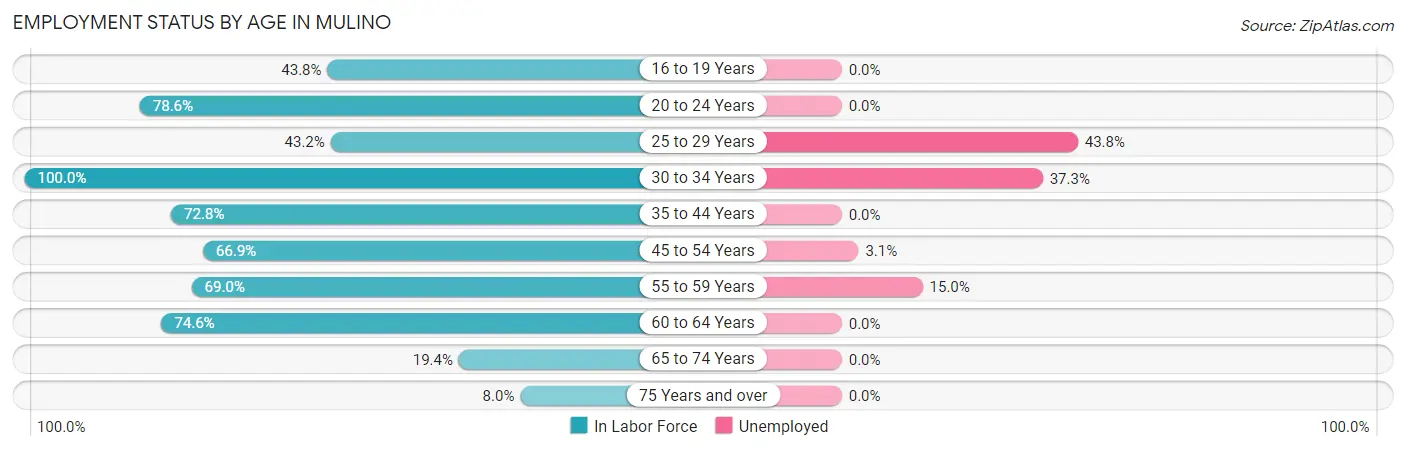
| Age Bracket | In Labor Force | Unemployed |
| 16 to 19 Years | 63 (43.8%) | 0 (0.0%) |
| 20 to 24 Years | 92 (78.6%) | 0 (0.0%) |
| 25 to 29 Years | 32 (43.2%) | 14 (43.8%) |
| 30 to 34 Years | 236 (100.0%) | 88 (37.3%) |
| 35 to 44 Years | 131 (72.8%) | 0 (0.0%) |
| 45 to 54 Years | 192 (66.9%) | 6 (3.1%) |
| 55 to 59 Years | 140 (69.0%) | 21 (15.0%) |
| 60 to 64 Years | 135 (74.6%) | 0 (0.0%) |
| 65 to 74 Years | 87 (19.4%) | 0 (0.0%) |
| 75 Years and over | 7 (8.0%) | 0 (0.0%) |
| Total | 1,115 (56.9%) | 129 (11.6%) |
Employment Status by Educational Attainment in Mulino
According to labor force statistics for Mulino, 74.6% of individuals (866) out of the total population between 25 and 64 years of age (1,161) are in the labor force, with 14.9% or 129 of them being unemployed. The group with the highest labor force participation rate are those with the educational attainment of high school diploma, with 76.8% or 212 individuals in the labor force. Within the labor force, individuals with less than high school education have the highest percentage of unemployment, with 60.0% or 21 of them being unemployed.
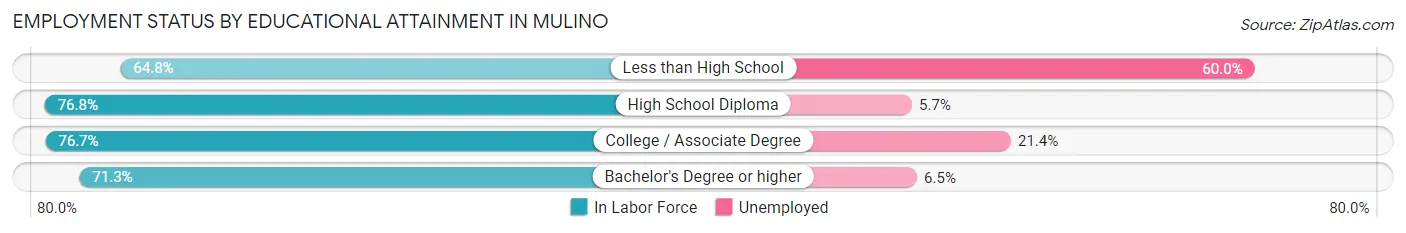
| Educational Attainment | In Labor Force | Unemployed |
| Less than High School | 35 (64.8%) | 32 (60.0%) |
| High School Diploma | 212 (76.8%) | 16 (5.7%) |
| College / Associate Degree | 373 (76.7%) | 104 (21.4%) |
| Bachelor's Degree or higher | 246 (71.3%) | 22 (6.5%) |
| Total | 866 (74.6%) | 173 (14.9%) |
Employment Occupations by Sex in Mulino
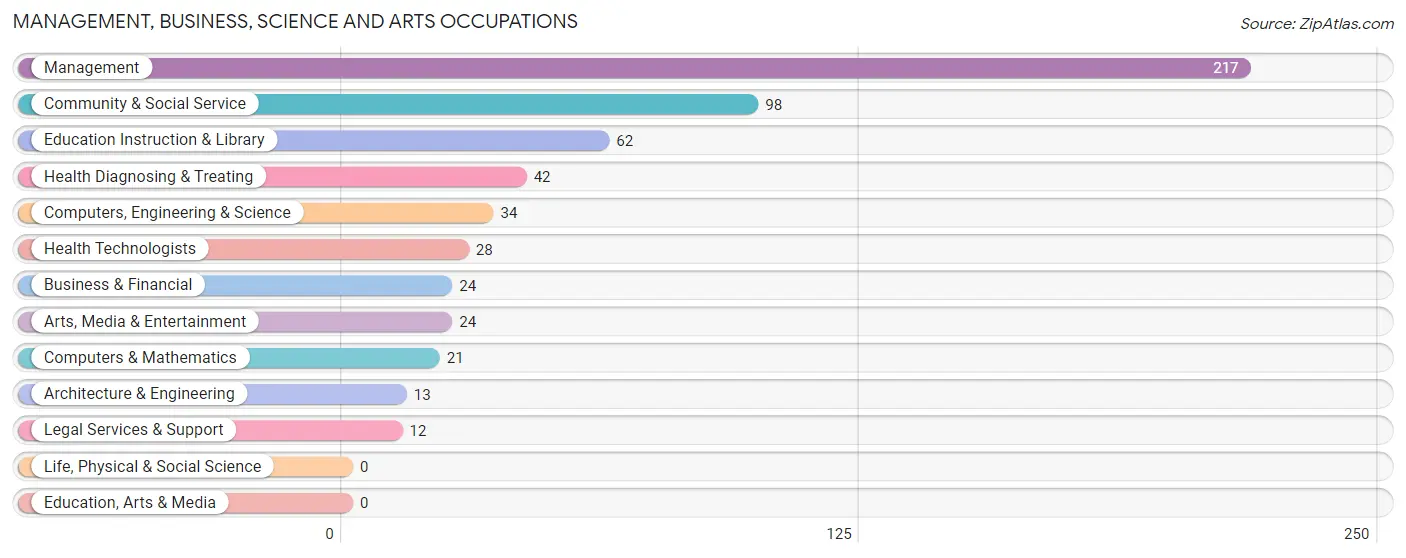
Management, Business, Science and Arts Occupations
The most common Management, Business, Science and Arts occupations in Mulino are Management (217 | 22.0%), Community & Social Service (98 | 9.9%), Education Instruction & Library (62 | 6.3%), Health Diagnosing & Treating (42 | 4.3%), and Computers, Engineering & Science (34 | 3.5%).
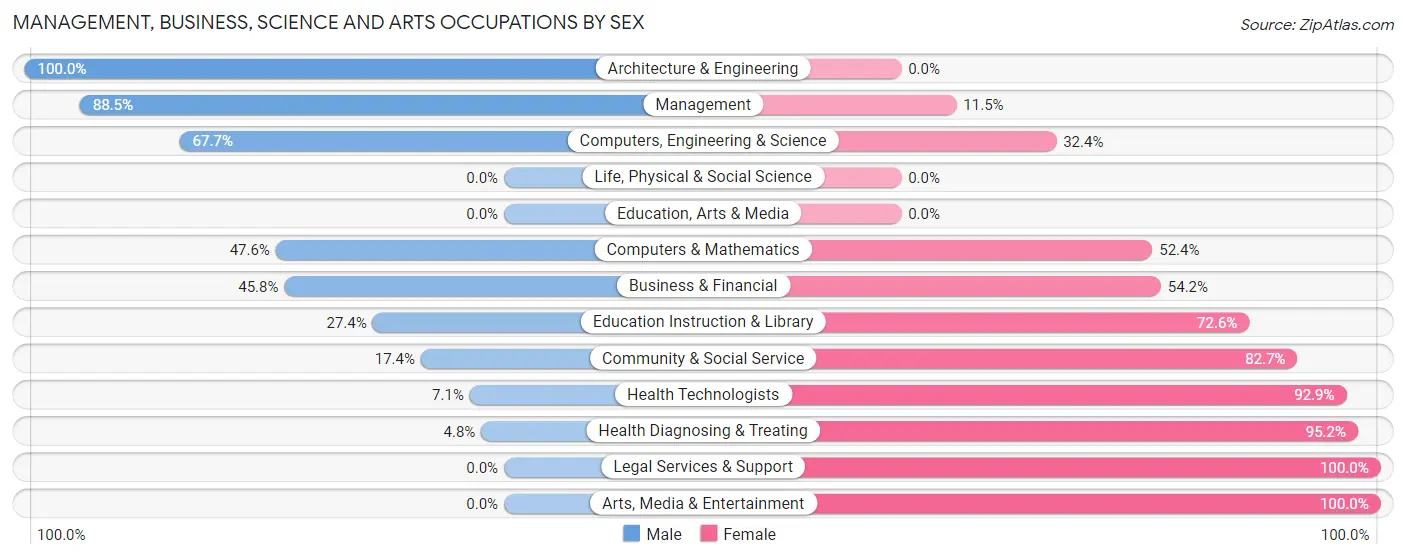
Management, Business, Science and Arts Occupations by Sex
Within the Management, Business, Science and Arts occupations in Mulino, the most male-oriented occupations are Architecture & Engineering (100.0%), Management (88.5%), and Computers, Engineering & Science (67.6%), while the most female-oriented occupations are Legal Services & Support (100.0%), Arts, Media & Entertainment (100.0%), and Health Diagnosing & Treating (95.2%).
| Occupation | Male | Female |
| Management | 192 (88.5%) | 25 (11.5%) |
| Business & Financial | 11 (45.8%) | 13 (54.2%) |
| Computers, Engineering & Science | 23 (67.6%) | 11 (32.4%) |
| Computers & Mathematics | 10 (47.6%) | 11 (52.4%) |
| Architecture & Engineering | 13 (100.0%) | 0 (0.0%) |
| Life, Physical & Social Science | 0 (0.0%) | 0 (0.0%) |
| Community & Social Service | 17 (17.3%) | 81 (82.7%) |
| Education, Arts & Media | 0 (0.0%) | 0 (0.0%) |
| Legal Services & Support | 0 (0.0%) | 12 (100.0%) |
| Education Instruction & Library | 17 (27.4%) | 45 (72.6%) |
| Arts, Media & Entertainment | 0 (0.0%) | 24 (100.0%) |
| Health Diagnosing & Treating | 2 (4.8%) | 40 (95.2%) |
| Health Technologists | 2 (7.1%) | 26 (92.9%) |
| Total (Category) | 245 (59.0%) | 170 (41.0%) |
| Total (Overall) | 512 (51.9%) | 474 (48.1%) |
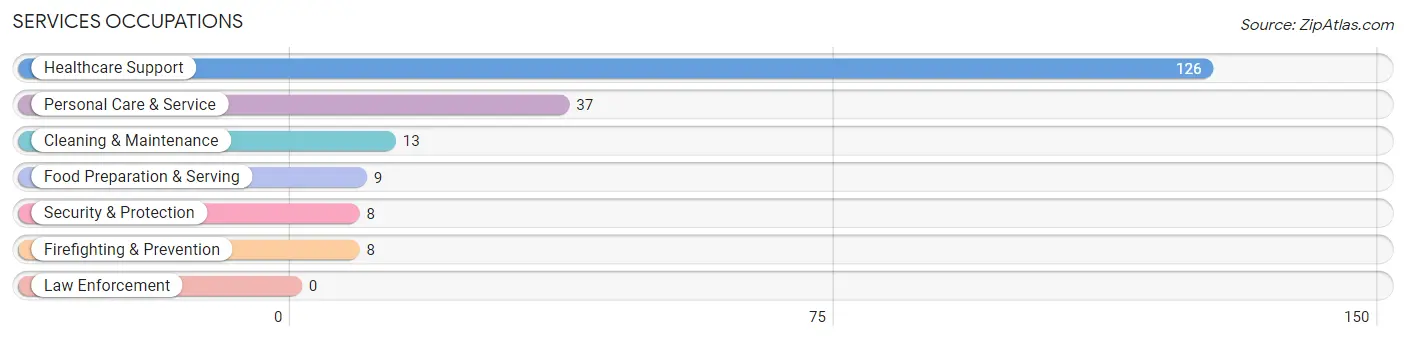
Services Occupations
The most common Services occupations in Mulino are Healthcare Support (126 | 12.8%), Personal Care & Service (37 | 3.7%), Cleaning & Maintenance (13 | 1.3%), Food Preparation & Serving (9 | 0.9%), and Security & Protection (8 | 0.8%).
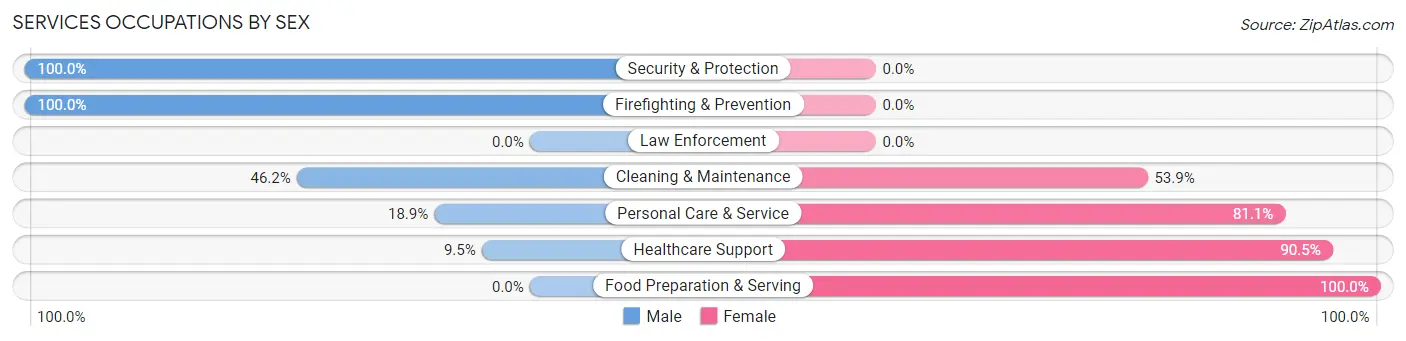
Services Occupations by Sex
Within the Services occupations in Mulino, the most male-oriented occupations are Security & Protection (100.0%), Firefighting & Prevention (100.0%), and Cleaning & Maintenance (46.2%), while the most female-oriented occupations are Food Preparation & Serving (100.0%), Healthcare Support (90.5%), and Personal Care & Service (81.1%).
| Occupation | Male | Female |
| Healthcare Support | 12 (9.5%) | 114 (90.5%) |
| Security & Protection | 8 (100.0%) | 0 (0.0%) |
| Firefighting & Prevention | 8 (100.0%) | 0 (0.0%) |
| Law Enforcement | 0 (0.0%) | 0 (0.0%) |
| Food Preparation & Serving | 0 (0.0%) | 9 (100.0%) |
| Cleaning & Maintenance | 6 (46.2%) | 7 (53.8%) |
| Personal Care & Service | 7 (18.9%) | 30 (81.1%) |
| Total (Category) | 33 (17.1%) | 160 (82.9%) |
| Total (Overall) | 512 (51.9%) | 474 (48.1%) |
Sales and Office Occupations
The most common Sales and Office occupations in Mulino are Office & Administration (107 | 10.8%), and Sales & Related (89 | 9.0%).
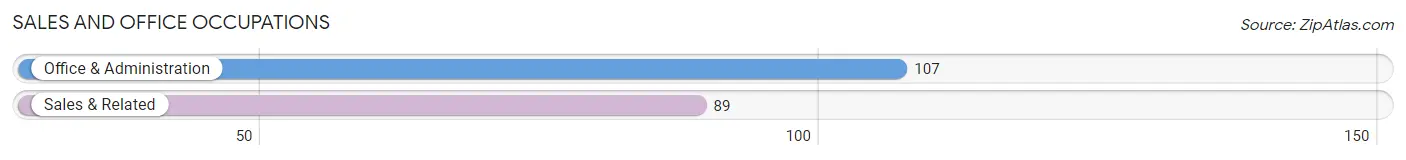
Sales and Office Occupations by Sex

| Occupation | Male | Female |
| Sales & Related | 59 (66.3%) | 30 (33.7%) |
| Office & Administration | 0 (0.0%) | 107 (100.0%) |
| Total (Category) | 59 (30.1%) | 137 (69.9%) |
| Total (Overall) | 512 (51.9%) | 474 (48.1%) |
Natural Resources, Construction and Maintenance Occupations
The most common Natural Resources, Construction and Maintenance occupations in Mulino are Installation, Maintenance & Repair (76 | 7.7%), and Construction & Extraction (38 | 3.8%).
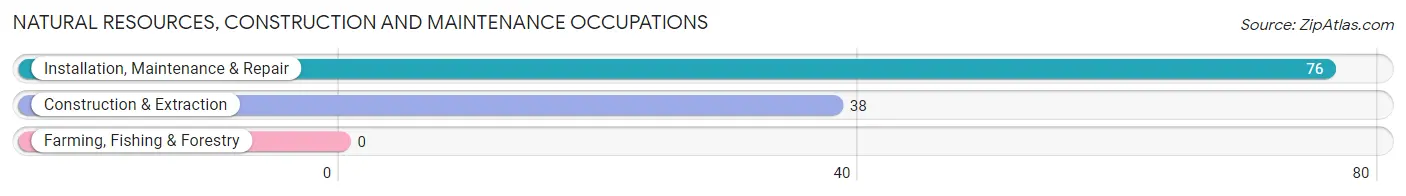
Natural Resources, Construction and Maintenance Occupations by Sex
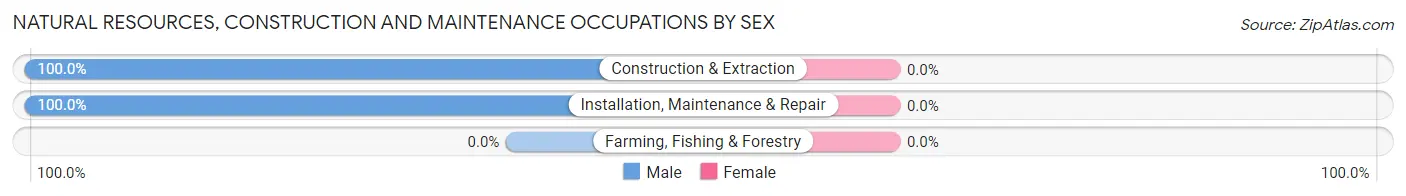
| Occupation | Male | Female |
| Farming, Fishing & Forestry | 0 (0.0%) | 0 (0.0%) |
| Construction & Extraction | 38 (100.0%) | 0 (0.0%) |
| Installation, Maintenance & Repair | 76 (100.0%) | 0 (0.0%) |
| Total (Category) | 114 (100.0%) | 0 (0.0%) |
| Total (Overall) | 512 (51.9%) | 474 (48.1%) |
Production, Transportation and Moving Occupations
The most common Production, Transportation and Moving occupations in Mulino are Transportation (28 | 2.8%), Production (21 | 2.1%), and Material Moving (19 | 1.9%).
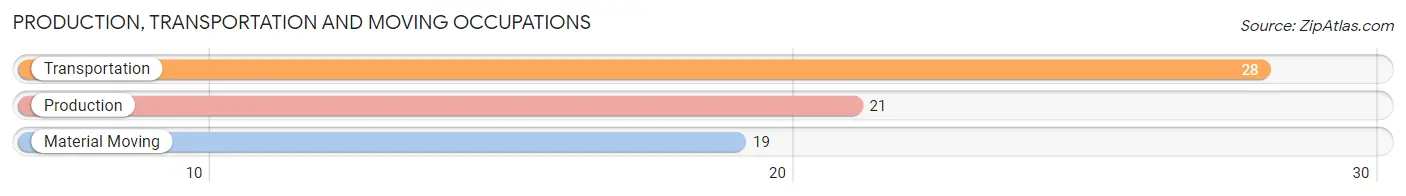
Production, Transportation and Moving Occupations by Sex
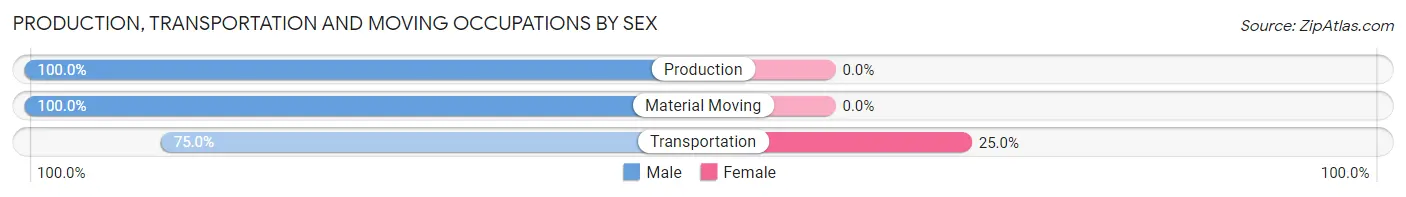
| Occupation | Male | Female |
| Production | 21 (100.0%) | 0 (0.0%) |
| Transportation | 21 (75.0%) | 7 (25.0%) |
| Material Moving | 19 (100.0%) | 0 (0.0%) |
| Total (Category) | 61 (89.7%) | 7 (10.3%) |
| Total (Overall) | 512 (51.9%) | 474 (48.1%) |
Employment Industries by Sex in Mulino
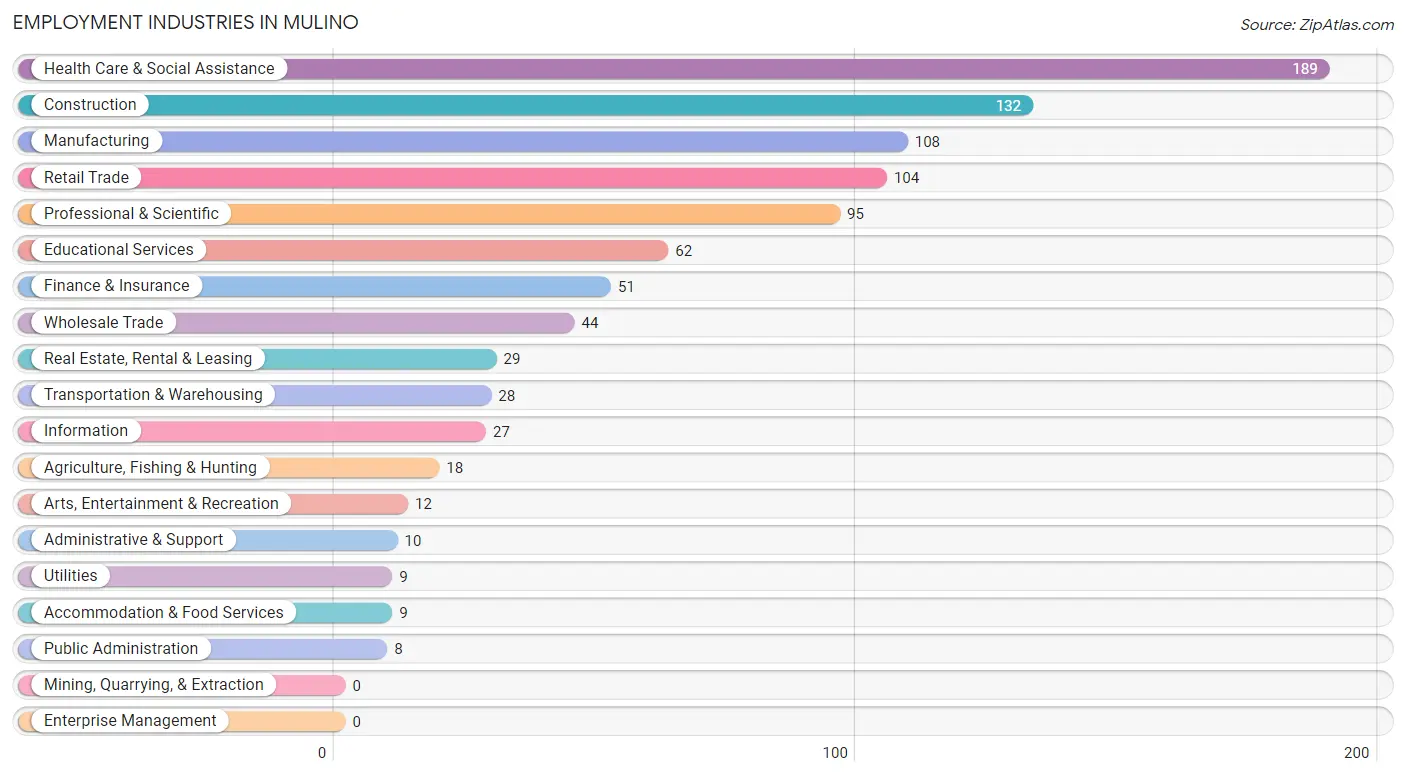
Employment Industries in Mulino
The major employment industries in Mulino include Health Care & Social Assistance (189 | 19.2%), Construction (132 | 13.4%), Manufacturing (108 | 11.0%), Retail Trade (104 | 10.5%), and Professional & Scientific (95 | 9.6%).
Employment Industries by Sex in Mulino
The Mulino industries that see more men than women are Agriculture, Fishing & Hunting (100.0%), Transportation & Warehousing (100.0%), and Utilities (100.0%), whereas the industries that tend to have a higher number of women are Finance & Insurance (100.0%), Arts, Entertainment & Recreation (100.0%), and Accommodation & Food Services (100.0%).
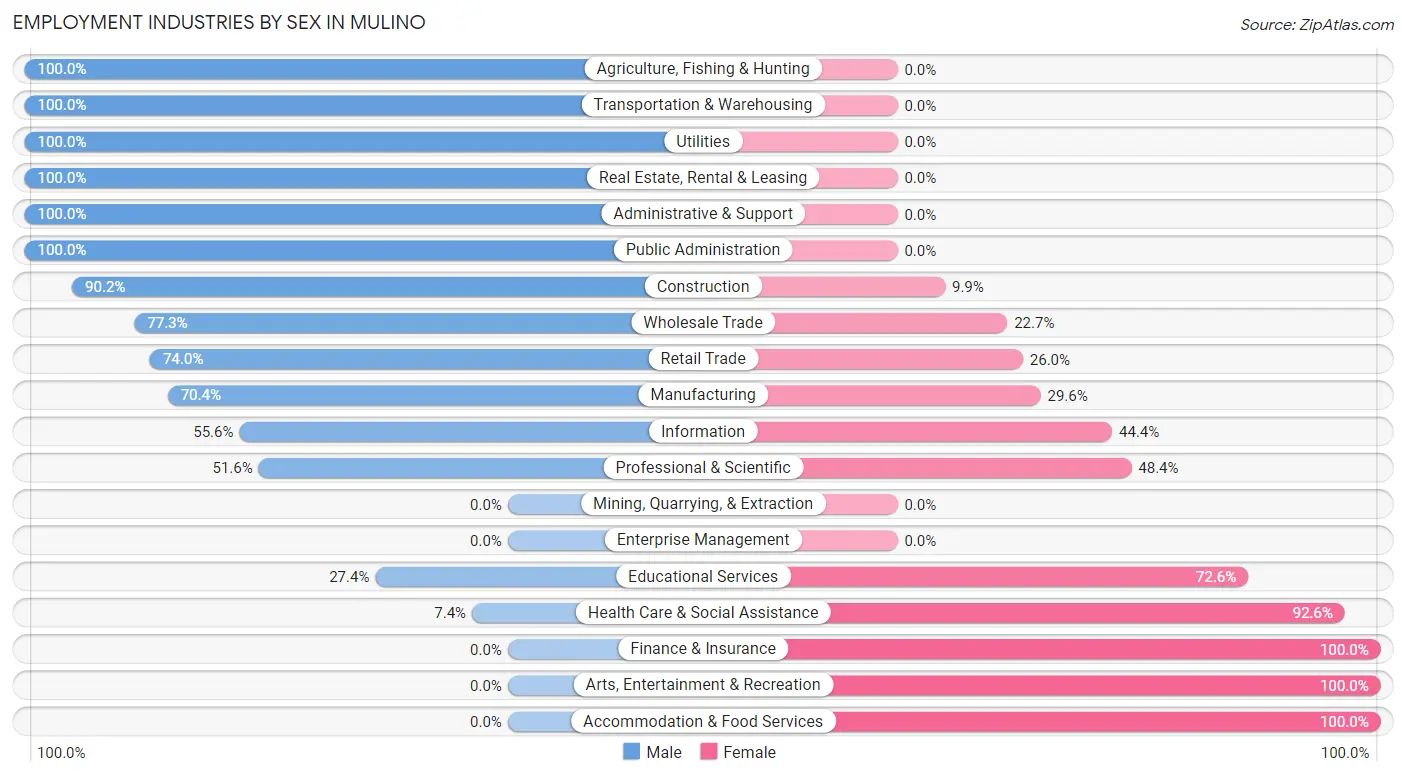
| Industry | Male | Female |
| Agriculture, Fishing & Hunting | 18 (100.0%) | 0 (0.0%) |
| Mining, Quarrying, & Extraction | 0 (0.0%) | 0 (0.0%) |
| Construction | 119 (90.1%) | 13 (9.9%) |
| Manufacturing | 76 (70.4%) | 32 (29.6%) |
| Wholesale Trade | 34 (77.3%) | 10 (22.7%) |
| Retail Trade | 77 (74.0%) | 27 (26.0%) |
| Transportation & Warehousing | 28 (100.0%) | 0 (0.0%) |
| Utilities | 9 (100.0%) | 0 (0.0%) |
| Information | 15 (55.6%) | 12 (44.4%) |
| Finance & Insurance | 0 (0.0%) | 51 (100.0%) |
| Real Estate, Rental & Leasing | 29 (100.0%) | 0 (0.0%) |
| Professional & Scientific | 49 (51.6%) | 46 (48.4%) |
| Enterprise Management | 0 (0.0%) | 0 (0.0%) |
| Administrative & Support | 10 (100.0%) | 0 (0.0%) |
| Educational Services | 17 (27.4%) | 45 (72.6%) |
| Health Care & Social Assistance | 14 (7.4%) | 175 (92.6%) |
| Arts, Entertainment & Recreation | 0 (0.0%) | 12 (100.0%) |
| Accommodation & Food Services | 0 (0.0%) | 9 (100.0%) |
| Public Administration | 8 (100.0%) | 0 (0.0%) |
| Total | 512 (51.9%) | 474 (48.1%) |
Education in Mulino
School Enrollment in Mulino
The most common levels of schooling among the 375 students in Mulino are middle school (111 | 29.6%), college / undergraduate (80 | 21.3%), and high school (79 | 21.1%).
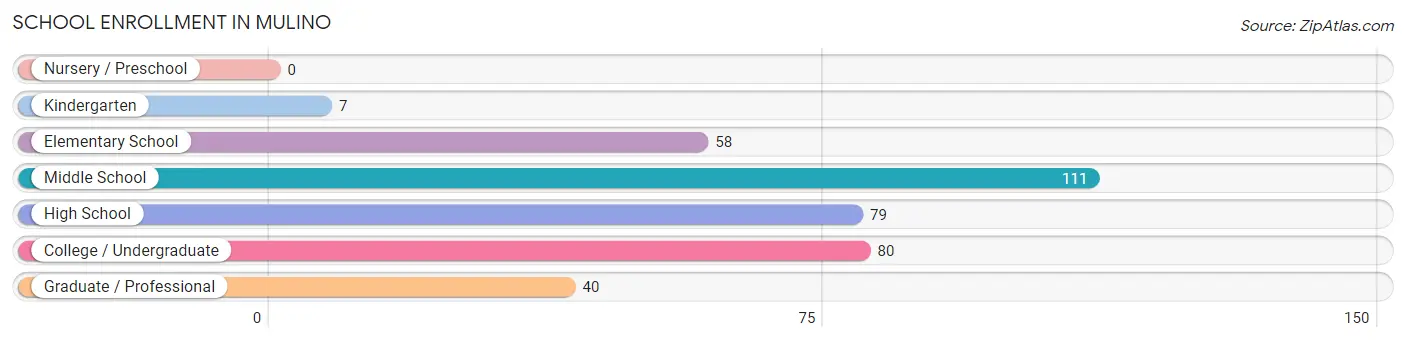
| School Level | # Students | % Students |
| Nursery / Preschool | 0 | 0.0% |
| Kindergarten | 7 | 1.9% |
| Elementary School | 58 | 15.5% |
| Middle School | 111 | 29.6% |
| High School | 79 | 21.1% |
| College / Undergraduate | 80 | 21.3% |
| Graduate / Professional | 40 | 10.7% |
| Total | 375 | 100.0% |
School Enrollment by Age by Funding Source in Mulino
Out of a total of 375 students who are enrolled in schools in Mulino, 66 (17.6%) attend a private institution, while the remaining 309 (82.4%) are enrolled in public schools. The age group of 25 to 34 year olds has the highest likelihood of being enrolled in private schools, with 9 (100.0% in the age bracket) enrolled. Conversely, the age group of 18 to 19 year olds has the lowest likelihood of being enrolled in a private school, with 45 (100.0% in the age bracket) attending a public institution.
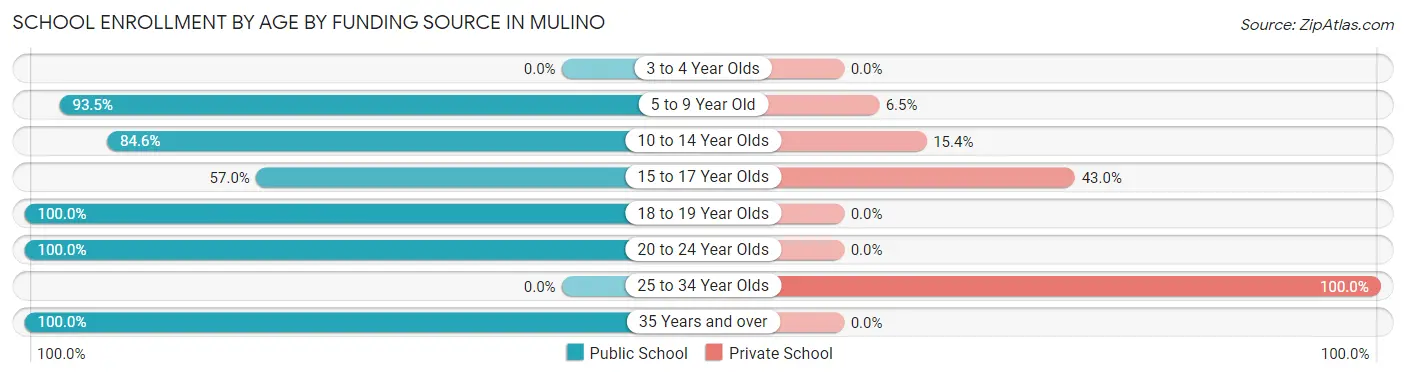
| Age Bracket | Public School | Private School |
| 3 to 4 Year Olds | 0 (0.0%) | 0 (0.0%) |
| 5 to 9 Year Old | 43 (93.5%) | 3 (6.5%) |
| 10 to 14 Year Olds | 110 (84.6%) | 20 (15.4%) |
| 15 to 17 Year Olds | 45 (57.0%) | 34 (43.0%) |
| 18 to 19 Year Olds | 45 (100.0%) | 0 (0.0%) |
| 20 to 24 Year Olds | 26 (100.0%) | 0 (0.0%) |
| 25 to 34 Year Olds | 0 (0.0%) | 9 (100.0%) |
| 35 Years and over | 40 (100.0%) | 0 (0.0%) |
| Total | 309 (82.4%) | 66 (17.6%) |
Educational Attainment by Field of Study in Mulino
Business (111 | 21.3%), social sciences (71 | 13.7%), science & technology (69 | 13.3%), education (43 | 8.3%), and engineering (41 | 7.9%) are the most common fields of study among 520 individuals in Mulino who have obtained a bachelor's degree or higher.
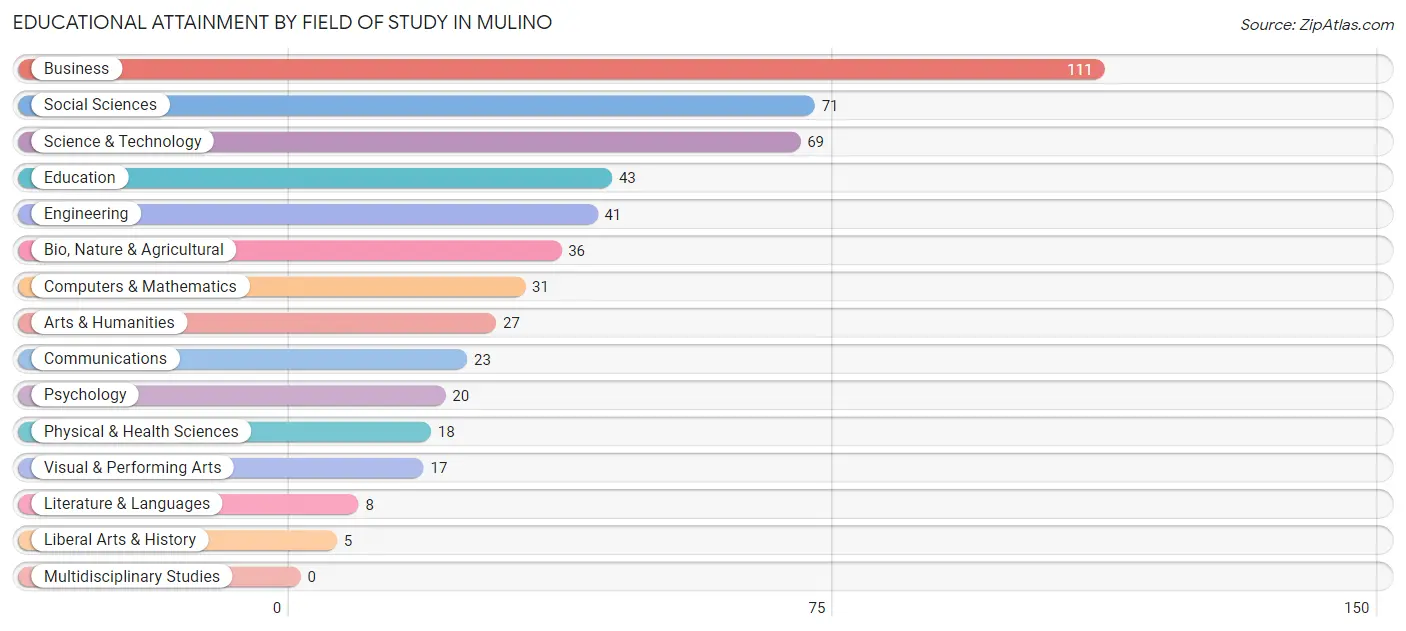
| Field of Study | # Graduates | % Graduates |
| Computers & Mathematics | 31 | 6.0% |
| Bio, Nature & Agricultural | 36 | 6.9% |
| Physical & Health Sciences | 18 | 3.5% |
| Psychology | 20 | 3.8% |
| Social Sciences | 71 | 13.7% |
| Engineering | 41 | 7.9% |
| Multidisciplinary Studies | 0 | 0.0% |
| Science & Technology | 69 | 13.3% |
| Business | 111 | 21.3% |
| Education | 43 | 8.3% |
| Literature & Languages | 8 | 1.5% |
| Liberal Arts & History | 5 | 1.0% |
| Visual & Performing Arts | 17 | 3.3% |
| Communications | 23 | 4.4% |
| Arts & Humanities | 27 | 5.2% |
| Total | 520 | 100.0% |
Transportation & Commute in Mulino
Vehicle Availability by Sex in Mulino
The most prevalent vehicle ownership categories in Mulino are males with 3 vehicles (151, accounting for 30.1%) and females with 3 vehicles (95, making up 32.5%).
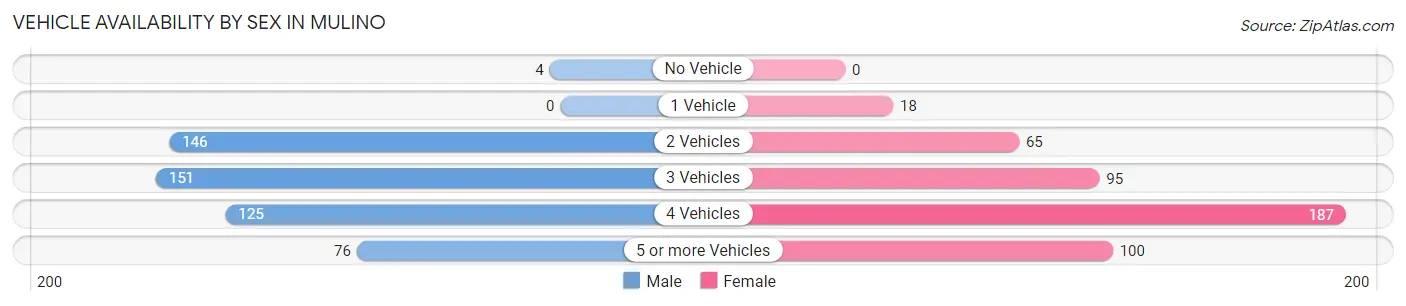
| Vehicles Available | Male | Female |
| No Vehicle | 4 (0.8%) | 0 (0.0%) |
| 1 Vehicle | 0 (0.0%) | 18 (3.9%) |
| 2 Vehicles | 146 (29.1%) | 65 (14.0%) |
| 3 Vehicles | 151 (30.1%) | 95 (20.4%) |
| 4 Vehicles | 125 (24.9%) | 187 (40.2%) |
| 5 or more Vehicles | 76 (15.1%) | 100 (21.5%) |
| Total | 502 (100.0%) | 465 (100.0%) |
Commute Time in Mulino
The most frequently occuring commute durations in Mulino are 30 to 34 minutes (296 commuters, 36.4%), 40 to 44 minutes (83 commuters, 10.2%), and 15 to 19 minutes (80 commuters, 9.9%).
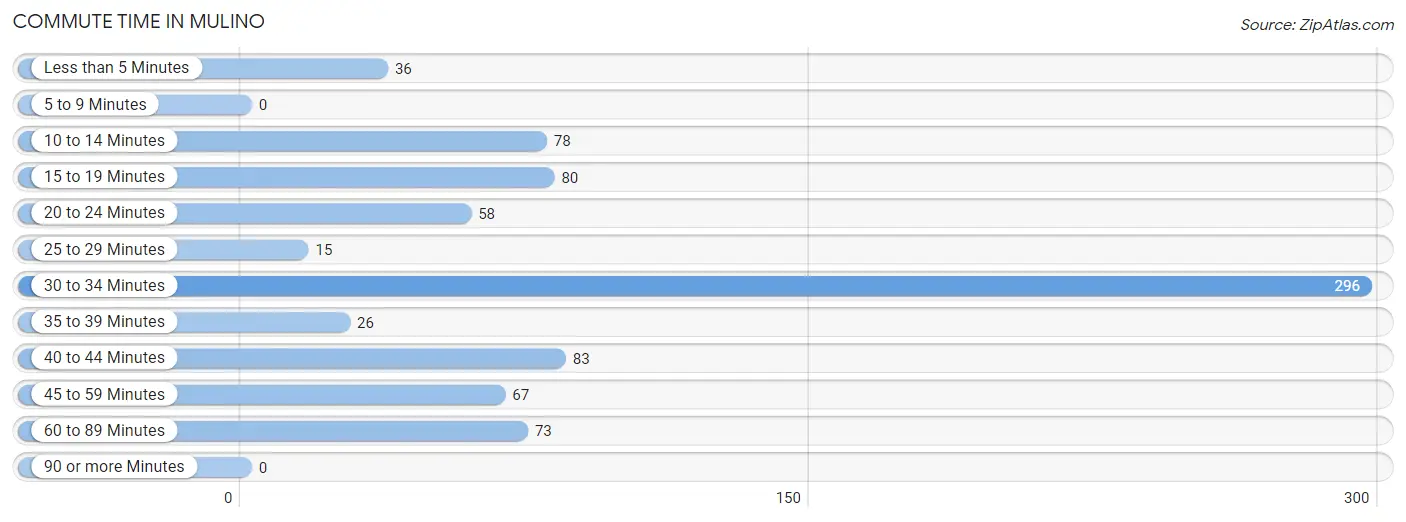
| Commute Time | # Commuters | % Commuters |
| Less than 5 Minutes | 36 | 4.4% |
| 5 to 9 Minutes | 0 | 0.0% |
| 10 to 14 Minutes | 78 | 9.6% |
| 15 to 19 Minutes | 80 | 9.9% |
| 20 to 24 Minutes | 58 | 7.1% |
| 25 to 29 Minutes | 15 | 1.8% |
| 30 to 34 Minutes | 296 | 36.4% |
| 35 to 39 Minutes | 26 | 3.2% |
| 40 to 44 Minutes | 83 | 10.2% |
| 45 to 59 Minutes | 67 | 8.3% |
| 60 to 89 Minutes | 73 | 9.0% |
| 90 or more Minutes | 0 | 0.0% |
Commute Time by Sex in Mulino
The most common commute times in Mulino are 30 to 34 minutes (113 commuters, 29.8%) for males and 30 to 34 minutes (183 commuters, 42.3%) for females.

| Commute Time | Male | Female |
| Less than 5 Minutes | 8 (2.1%) | 28 (6.5%) |
| 5 to 9 Minutes | 0 (0.0%) | 0 (0.0%) |
| 10 to 14 Minutes | 52 (13.7%) | 26 (6.0%) |
| 15 to 19 Minutes | 37 (9.8%) | 43 (9.9%) |
| 20 to 24 Minutes | 26 (6.9%) | 32 (7.4%) |
| 25 to 29 Minutes | 4 (1.1%) | 11 (2.5%) |
| 30 to 34 Minutes | 113 (29.8%) | 183 (42.3%) |
| 35 to 39 Minutes | 15 (4.0%) | 11 (2.5%) |
| 40 to 44 Minutes | 38 (10.0%) | 45 (10.4%) |
| 45 to 59 Minutes | 37 (9.8%) | 30 (6.9%) |
| 60 to 89 Minutes | 49 (12.9%) | 24 (5.5%) |
| 90 or more Minutes | 0 (0.0%) | 0 (0.0%) |
Time of Departure to Work by Sex in Mulino
The most frequent times of departure to work in Mulino are 7:00 AM to 7:29 AM (82, 21.6%) for males and 6:30 AM to 6:59 AM (96, 22.2%) for females.
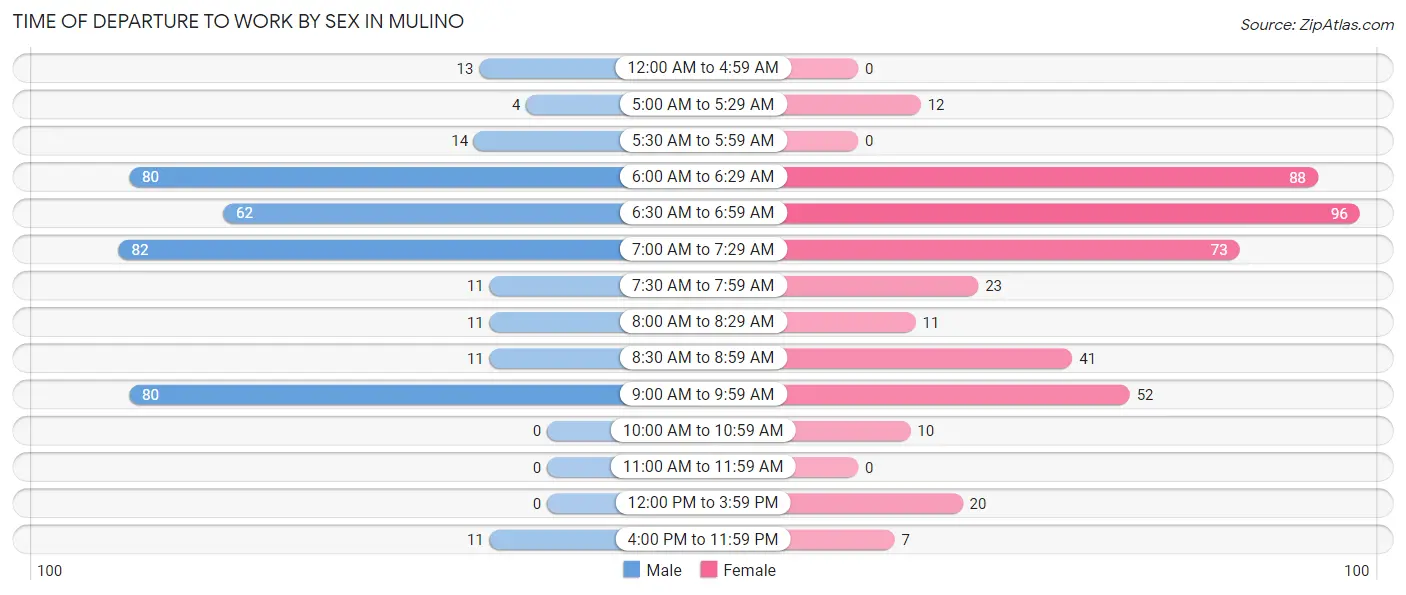
| Time of Departure | Male | Female |
| 12:00 AM to 4:59 AM | 13 (3.4%) | 0 (0.0%) |
| 5:00 AM to 5:29 AM | 4 (1.1%) | 12 (2.8%) |
| 5:30 AM to 5:59 AM | 14 (3.7%) | 0 (0.0%) |
| 6:00 AM to 6:29 AM | 80 (21.1%) | 88 (20.3%) |
| 6:30 AM to 6:59 AM | 62 (16.4%) | 96 (22.2%) |
| 7:00 AM to 7:29 AM | 82 (21.6%) | 73 (16.9%) |
| 7:30 AM to 7:59 AM | 11 (2.9%) | 23 (5.3%) |
| 8:00 AM to 8:29 AM | 11 (2.9%) | 11 (2.5%) |
| 8:30 AM to 8:59 AM | 11 (2.9%) | 41 (9.5%) |
| 9:00 AM to 9:59 AM | 80 (21.1%) | 52 (12.0%) |
| 10:00 AM to 10:59 AM | 0 (0.0%) | 10 (2.3%) |
| 11:00 AM to 11:59 AM | 0 (0.0%) | 0 (0.0%) |
| 12:00 PM to 3:59 PM | 0 (0.0%) | 20 (4.6%) |
| 4:00 PM to 11:59 PM | 11 (2.9%) | 7 (1.6%) |
| Total | 379 (100.0%) | 433 (100.0%) |
Housing Occupancy in Mulino
Occupancy by Ownership in Mulino
Of the total 711 dwellings in Mulino, owner-occupied units account for 635 (89.3%), while renter-occupied units make up 76 (10.7%).
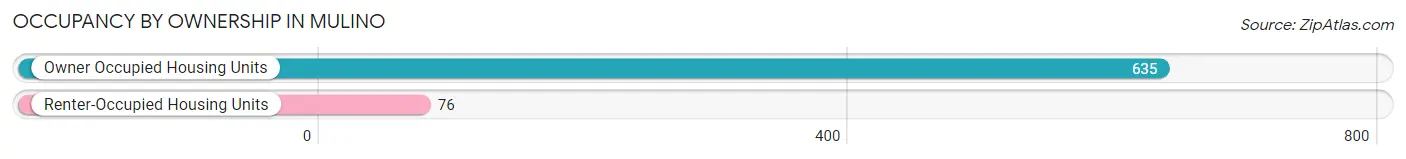
| Occupancy | # Housing Units | % Housing Units |
| Owner Occupied Housing Units | 635 | 89.3% |
| Renter-Occupied Housing Units | 76 | 10.7% |
| Total Occupied Housing Units | 711 | 100.0% |
Occupancy by Household Size in Mulino
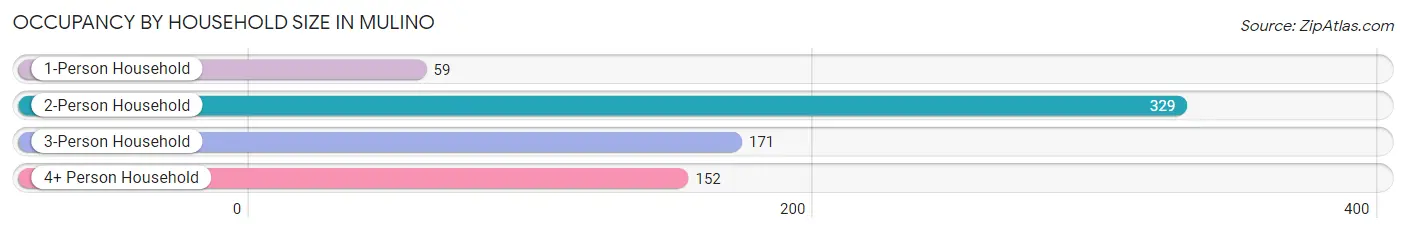
| Household Size | # Housing Units | % Housing Units |
| 1-Person Household | 59 | 8.3% |
| 2-Person Household | 329 | 46.3% |
| 3-Person Household | 171 | 24.0% |
| 4+ Person Household | 152 | 21.4% |
| Total Housing Units | 711 | 100.0% |
Occupancy by Ownership by Household Size in Mulino
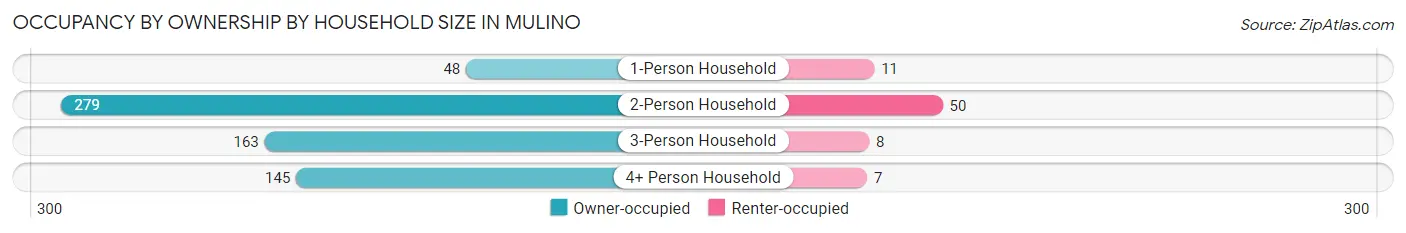
| Household Size | Owner-occupied | Renter-occupied |
| 1-Person Household | 48 (81.4%) | 11 (18.6%) |
| 2-Person Household | 279 (84.8%) | 50 (15.2%) |
| 3-Person Household | 163 (95.3%) | 8 (4.7%) |
| 4+ Person Household | 145 (95.4%) | 7 (4.6%) |
| Total Housing Units | 635 (89.3%) | 76 (10.7%) |
Occupancy by Educational Attainment in Mulino
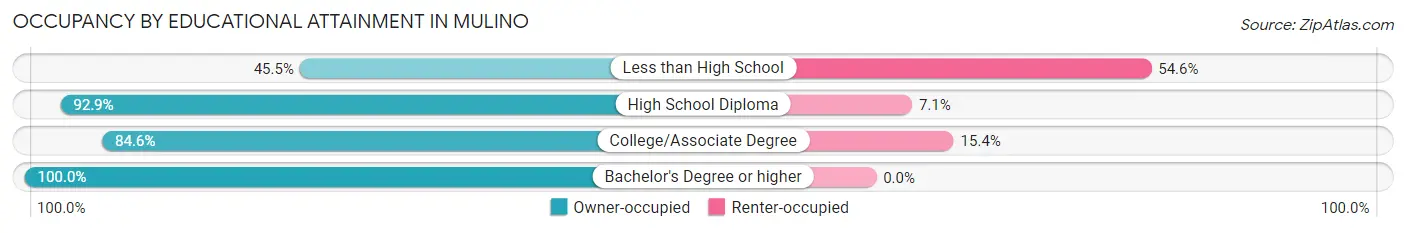
| Household Size | Owner-occupied | Renter-occupied |
| Less than High School | 15 (45.5%) | 18 (54.5%) |
| High School Diploma | 144 (92.9%) | 11 (7.1%) |
| College/Associate Degree | 259 (84.6%) | 47 (15.4%) |
| Bachelor's Degree or higher | 217 (100.0%) | 0 (0.0%) |
Occupancy by Age of Householder in Mulino
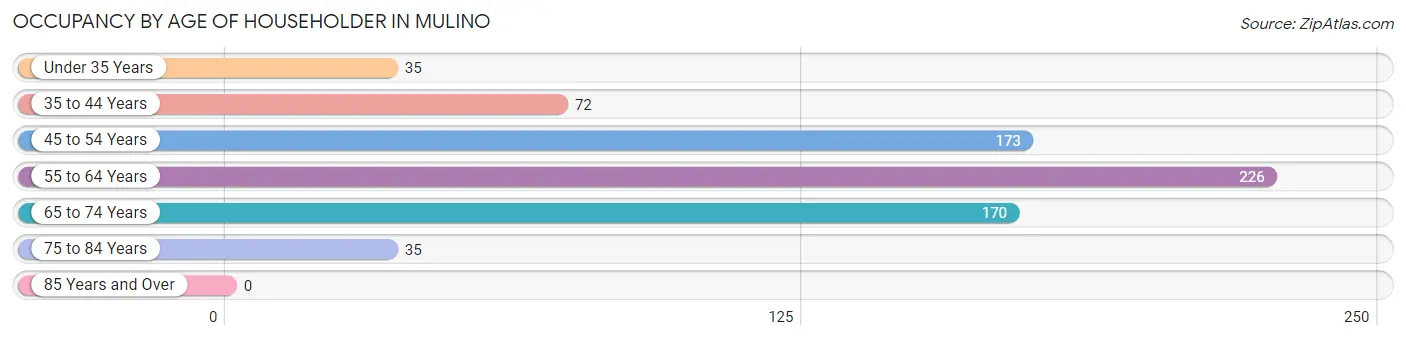
| Age Bracket | # Households | % Households |
| Under 35 Years | 35 | 4.9% |
| 35 to 44 Years | 72 | 10.1% |
| 45 to 54 Years | 173 | 24.3% |
| 55 to 64 Years | 226 | 31.8% |
| 65 to 74 Years | 170 | 23.9% |
| 75 to 84 Years | 35 | 4.9% |
| 85 Years and Over | 0 | 0.0% |
| Total | 711 | 100.0% |
Housing Finances in Mulino
Median Income by Occupancy in Mulino
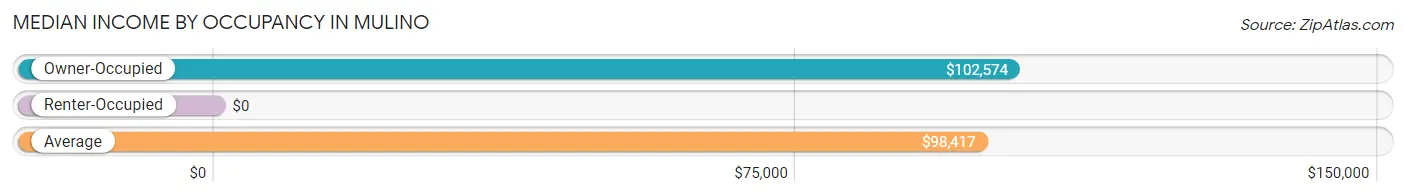
| Occupancy Type | # Households | Median Income |
| Owner-Occupied | 635 (89.3%) | $102,574 |
| Renter-Occupied | 76 (10.7%) | $0 |
| Average | 711 (100.0%) | $98,417 |
Occupancy by Householder Income Bracket in Mulino
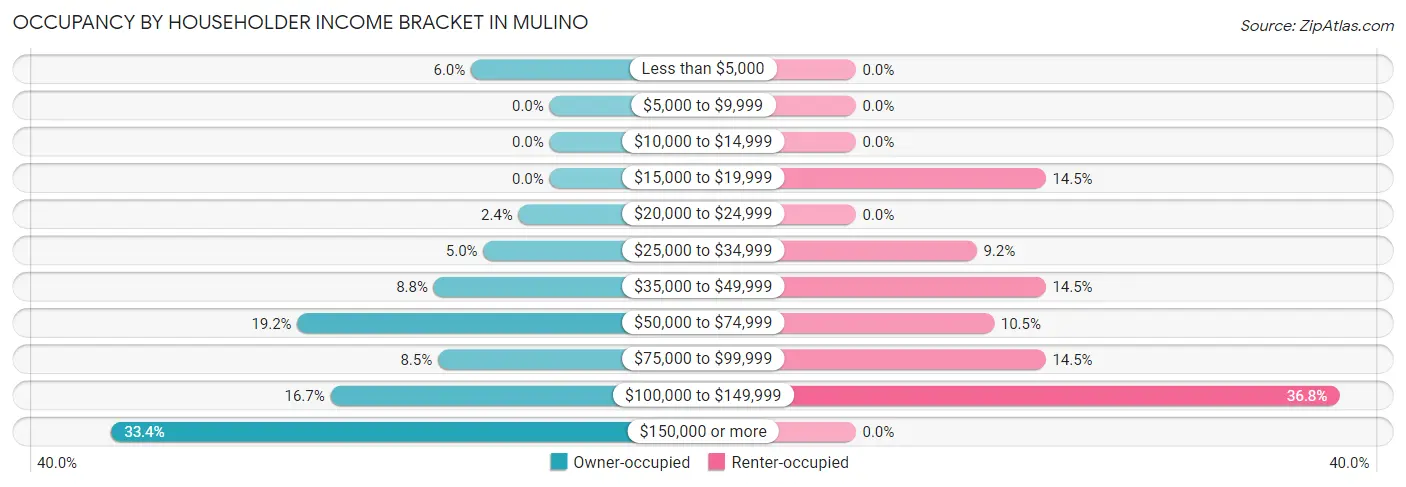
| Income Bracket | Owner-occupied | Renter-occupied |
| Less than $5,000 | 38 (6.0%) | 0 (0.0%) |
| $5,000 to $9,999 | 0 (0.0%) | 0 (0.0%) |
| $10,000 to $14,999 | 0 (0.0%) | 0 (0.0%) |
| $15,000 to $19,999 | 0 (0.0%) | 11 (14.5%) |
| $20,000 to $24,999 | 15 (2.4%) | 0 (0.0%) |
| $25,000 to $34,999 | 32 (5.0%) | 7 (9.2%) |
| $35,000 to $49,999 | 56 (8.8%) | 11 (14.5%) |
| $50,000 to $74,999 | 122 (19.2%) | 8 (10.5%) |
| $75,000 to $99,999 | 54 (8.5%) | 11 (14.5%) |
| $100,000 to $149,999 | 106 (16.7%) | 28 (36.8%) |
| $150,000 or more | 212 (33.4%) | 0 (0.0%) |
| Total | 635 (100.0%) | 76 (100.0%) |
Monthly Housing Cost Tiers in Mulino
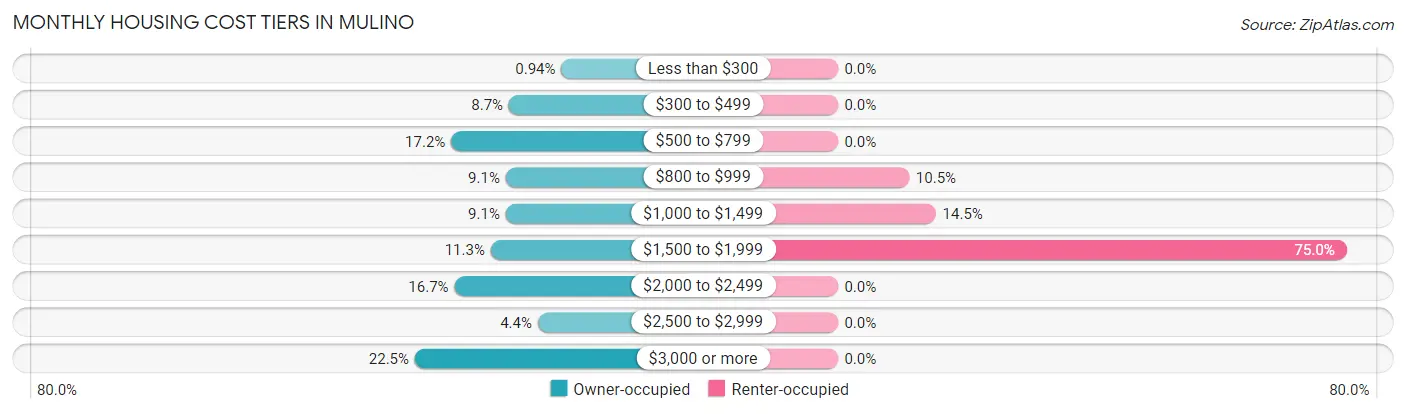
| Monthly Cost | Owner-occupied | Renter-occupied |
| Less than $300 | 6 (0.9%) | 0 (0.0%) |
| $300 to $499 | 55 (8.7%) | 0 (0.0%) |
| $500 to $799 | 109 (17.2%) | 0 (0.0%) |
| $800 to $999 | 58 (9.1%) | 8 (10.5%) |
| $1,000 to $1,499 | 58 (9.1%) | 11 (14.5%) |
| $1,500 to $1,999 | 72 (11.3%) | 57 (75.0%) |
| $2,000 to $2,499 | 106 (16.7%) | 0 (0.0%) |
| $2,500 to $2,999 | 28 (4.4%) | 0 (0.0%) |
| $3,000 or more | 143 (22.5%) | 0 (0.0%) |
| Total | 635 (100.0%) | 76 (100.0%) |
Physical Housing Characteristics in Mulino
Housing Structures in Mulino
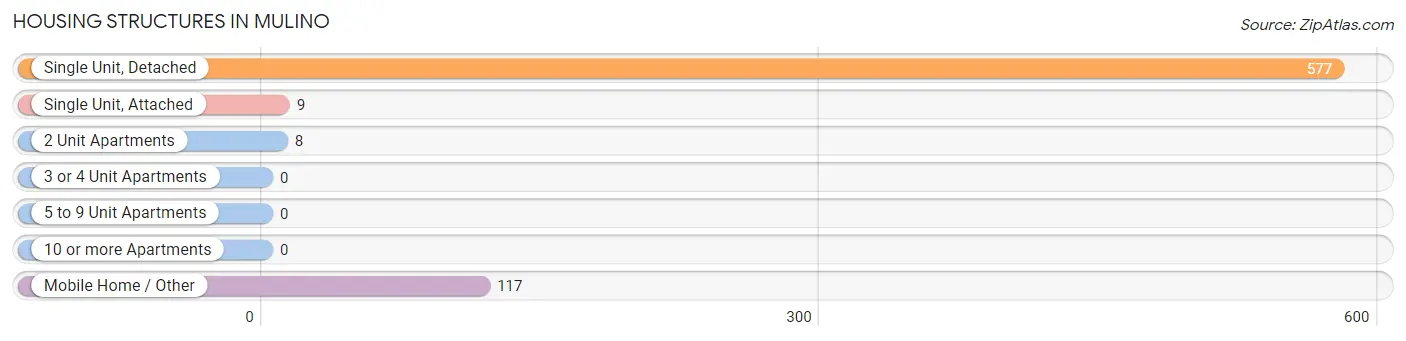
| Structure Type | # Housing Units | % Housing Units |
| Single Unit, Detached | 577 | 81.1% |
| Single Unit, Attached | 9 | 1.3% |
| 2 Unit Apartments | 8 | 1.1% |
| 3 or 4 Unit Apartments | 0 | 0.0% |
| 5 to 9 Unit Apartments | 0 | 0.0% |
| 10 or more Apartments | 0 | 0.0% |
| Mobile Home / Other | 117 | 16.5% |
| Total | 711 | 100.0% |
Housing Structures by Occupancy in Mulino
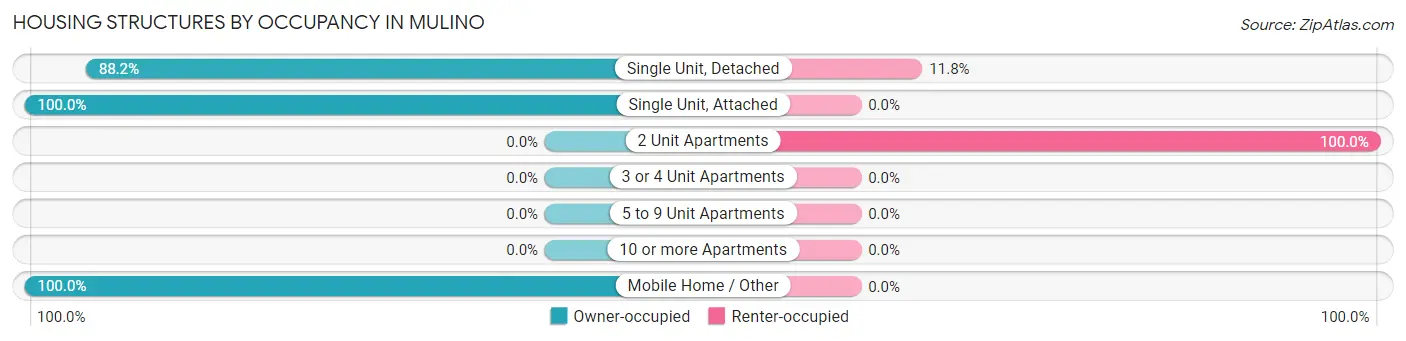
| Structure Type | Owner-occupied | Renter-occupied |
| Single Unit, Detached | 509 (88.2%) | 68 (11.8%) |
| Single Unit, Attached | 9 (100.0%) | 0 (0.0%) |
| 2 Unit Apartments | 0 (0.0%) | 8 (100.0%) |
| 3 or 4 Unit Apartments | 0 (0.0%) | 0 (0.0%) |
| 5 to 9 Unit Apartments | 0 (0.0%) | 0 (0.0%) |
| 10 or more Apartments | 0 (0.0%) | 0 (0.0%) |
| Mobile Home / Other | 117 (100.0%) | 0 (0.0%) |
| Total | 635 (89.3%) | 76 (10.7%) |
Housing Structures by Number of Rooms in Mulino
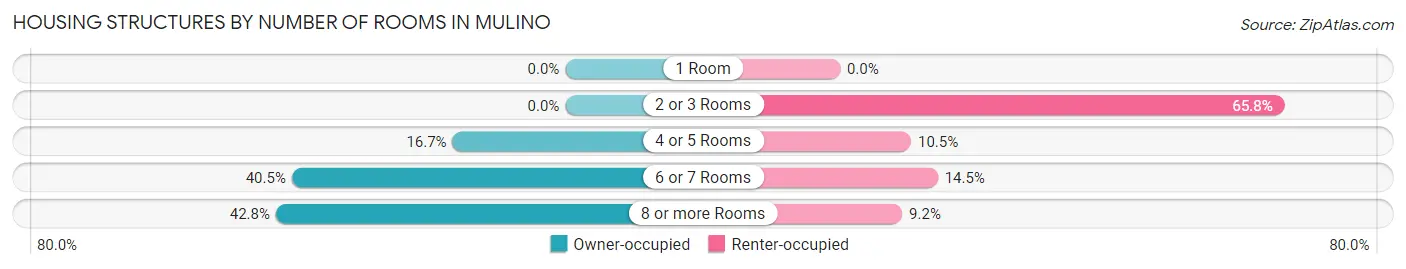
| Number of Rooms | Owner-occupied | Renter-occupied |
| 1 Room | 0 (0.0%) | 0 (0.0%) |
| 2 or 3 Rooms | 0 (0.0%) | 50 (65.8%) |
| 4 or 5 Rooms | 106 (16.7%) | 8 (10.5%) |
| 6 or 7 Rooms | 257 (40.5%) | 11 (14.5%) |
| 8 or more Rooms | 272 (42.8%) | 7 (9.2%) |
| Total | 635 (100.0%) | 76 (100.0%) |
Housing Structure by Heating Type in Mulino
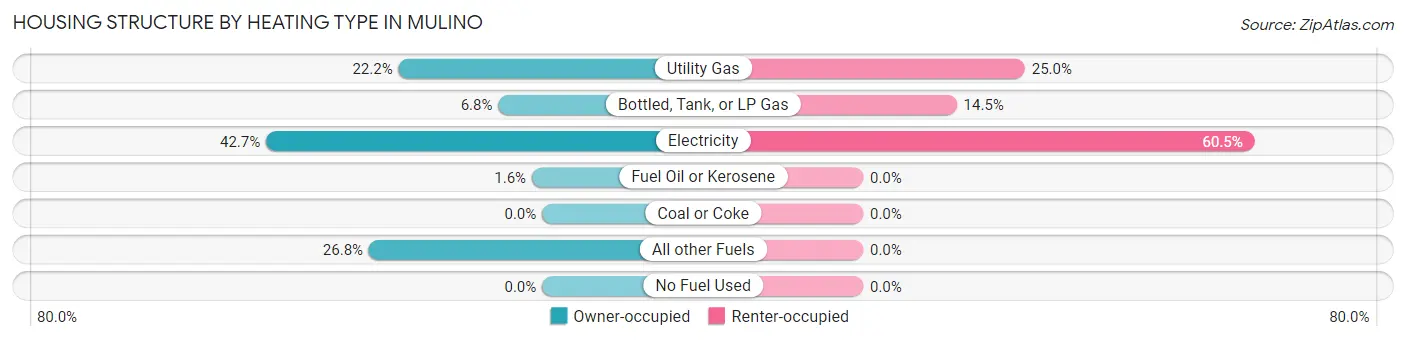
| Heating Type | Owner-occupied | Renter-occupied |
| Utility Gas | 141 (22.2%) | 19 (25.0%) |
| Bottled, Tank, or LP Gas | 43 (6.8%) | 11 (14.5%) |
| Electricity | 271 (42.7%) | 46 (60.5%) |
| Fuel Oil or Kerosene | 10 (1.6%) | 0 (0.0%) |
| Coal or Coke | 0 (0.0%) | 0 (0.0%) |
| All other Fuels | 170 (26.8%) | 0 (0.0%) |
| No Fuel Used | 0 (0.0%) | 0 (0.0%) |
| Total | 635 (100.0%) | 76 (100.0%) |
Household Vehicle Usage in Mulino
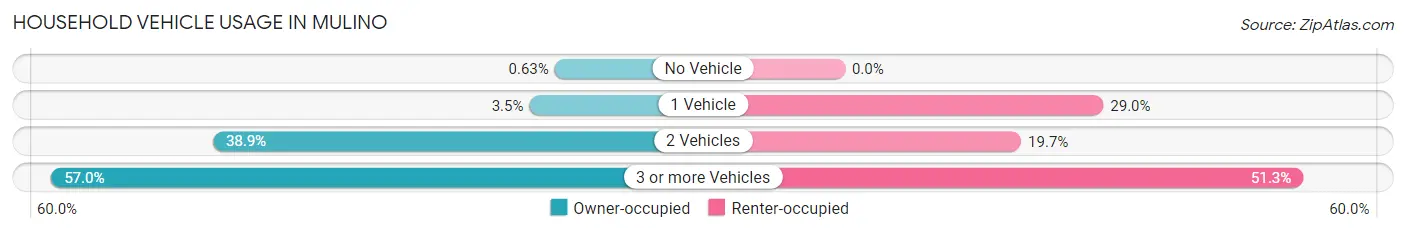
| Vehicles per Household | Owner-occupied | Renter-occupied |
| No Vehicle | 4 (0.6%) | 0 (0.0%) |
| 1 Vehicle | 22 (3.5%) | 22 (28.9%) |
| 2 Vehicles | 247 (38.9%) | 15 (19.7%) |
| 3 or more Vehicles | 362 (57.0%) | 39 (51.3%) |
| Total | 635 (100.0%) | 76 (100.0%) |
Real Estate & Mortgages in Mulino
Real Estate and Mortgage Overview in Mulino
| Characteristic | Without Mortgage | With Mortgage |
| Housing Units | 254 | 381 |
| Median Property Value | $582,700 | $781,400 |
| Median Household Income | $65,833 | $166 |
| Monthly Housing Costs | $738 | $143 |
| Real Estate Taxes | $3,643 | $0 |
Property Value by Mortgage Status in Mulino
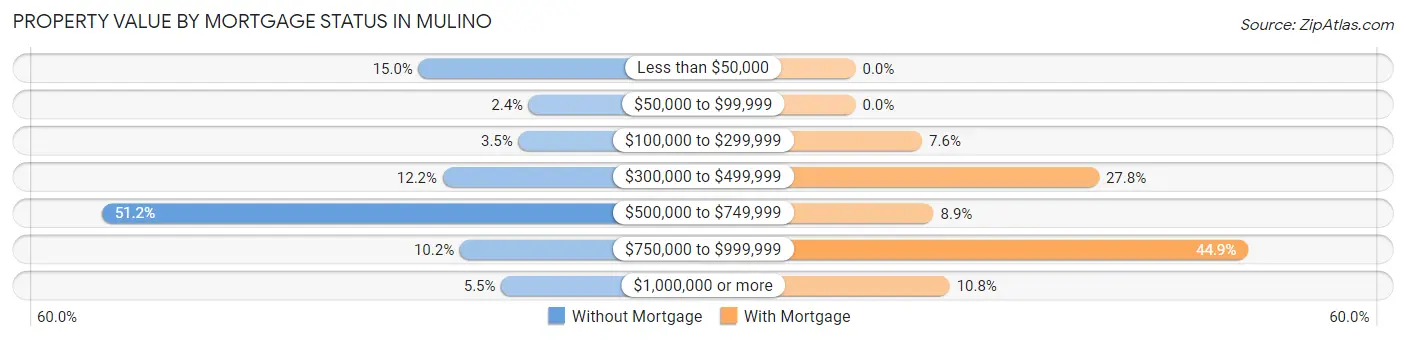
| Property Value | Without Mortgage | With Mortgage |
| Less than $50,000 | 38 (15.0%) | 0 (0.0%) |
| $50,000 to $99,999 | 6 (2.4%) | 0 (0.0%) |
| $100,000 to $299,999 | 9 (3.5%) | 29 (7.6%) |
| $300,000 to $499,999 | 31 (12.2%) | 106 (27.8%) |
| $500,000 to $749,999 | 130 (51.2%) | 34 (8.9%) |
| $750,000 to $999,999 | 26 (10.2%) | 171 (44.9%) |
| $1,000,000 or more | 14 (5.5%) | 41 (10.8%) |
| Total | 254 (100.0%) | 381 (100.0%) |
Household Income by Mortgage Status in Mulino
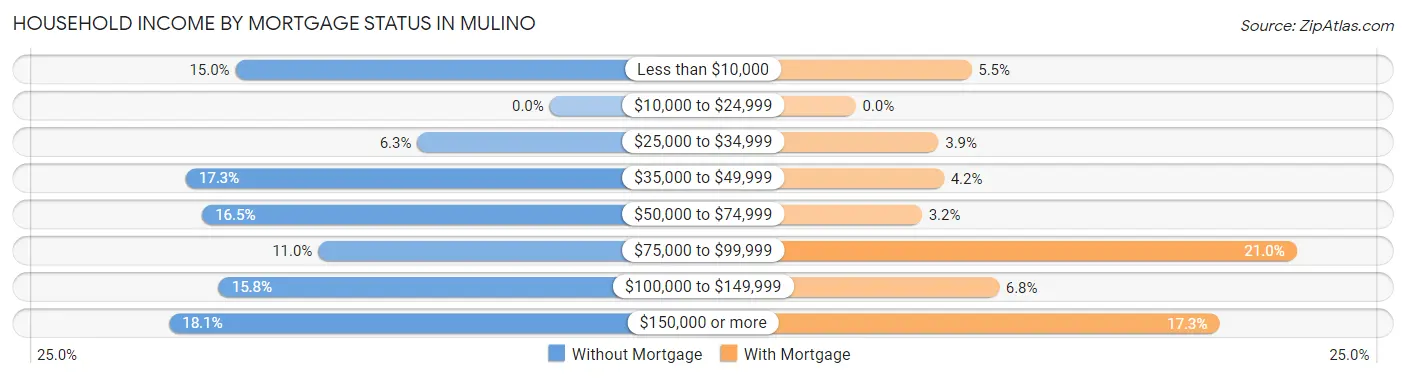
| Household Income | Without Mortgage | With Mortgage |
| Less than $10,000 | 38 (15.0%) | 21 (5.5%) |
| $10,000 to $24,999 | 0 (0.0%) | 0 (0.0%) |
| $25,000 to $34,999 | 16 (6.3%) | 15 (3.9%) |
| $35,000 to $49,999 | 44 (17.3%) | 16 (4.2%) |
| $50,000 to $74,999 | 42 (16.5%) | 12 (3.2%) |
| $75,000 to $99,999 | 28 (11.0%) | 80 (21.0%) |
| $100,000 to $149,999 | 40 (15.8%) | 26 (6.8%) |
| $150,000 or more | 46 (18.1%) | 66 (17.3%) |
| Total | 254 (100.0%) | 381 (100.0%) |
Property Value to Household Income Ratio in Mulino
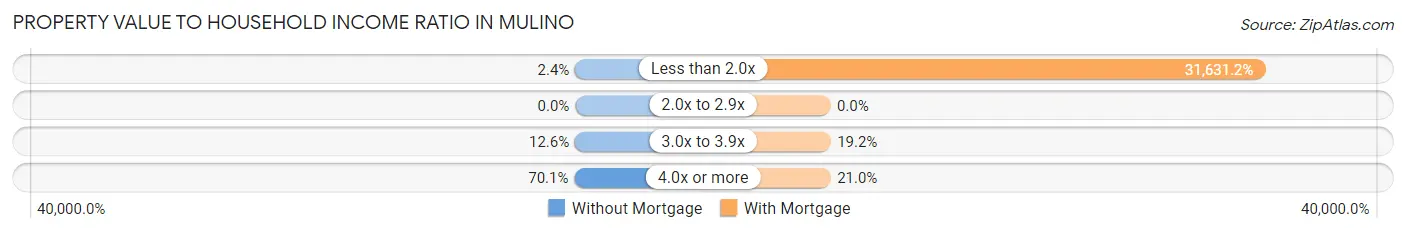
| Value-to-Income Ratio | Without Mortgage | With Mortgage |
| Less than 2.0x | 6 (2.4%) | 120,515 (31,631.2%) |
| 2.0x to 2.9x | 0 (0.0%) | 0 (0.0%) |
| 3.0x to 3.9x | 32 (12.6%) | 73 (19.2%) |
| 4.0x or more | 178 (70.1%) | 80 (21.0%) |
| Total | 254 (100.0%) | 381 (100.0%) |
Real Estate Taxes by Mortgage Status in Mulino
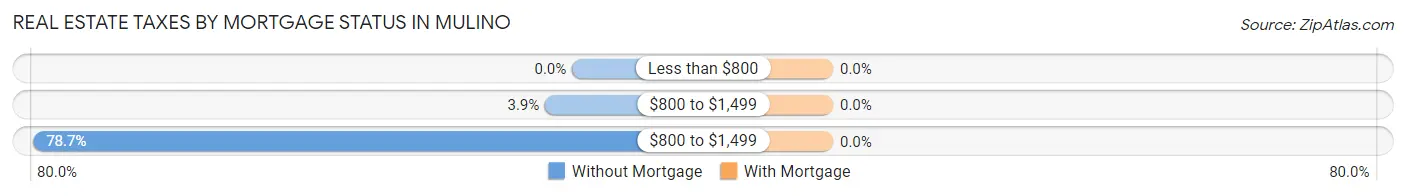
| Property Taxes | Without Mortgage | With Mortgage |
| Less than $800 | 0 (0.0%) | 0 (0.0%) |
| $800 to $1,499 | 10 (3.9%) | 0 (0.0%) |
| $800 to $1,499 | 200 (78.7%) | 0 (0.0%) |
| Total | 254 (100.0%) | 381 (100.0%) |
Health & Disability in Mulino
Health Insurance Coverage by Age in Mulino
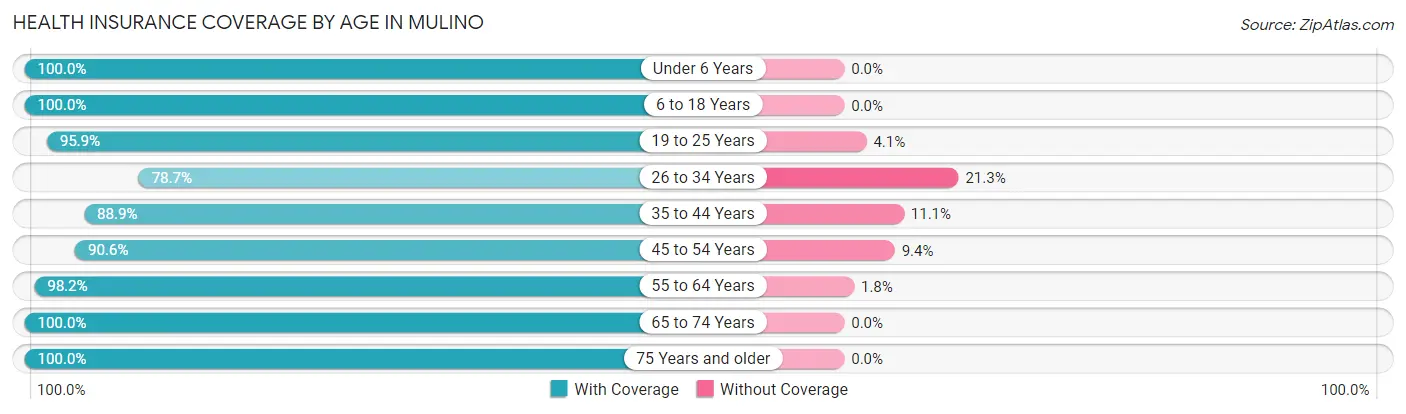
| Age Bracket | With Coverage | Without Coverage |
| Under 6 Years | 41 (100.0%) | 0 (0.0%) |
| 6 to 18 Years | 295 (100.0%) | 0 (0.0%) |
| 19 to 25 Years | 162 (95.9%) | 7 (4.1%) |
| 26 to 34 Years | 244 (78.7%) | 66 (21.3%) |
| 35 to 44 Years | 160 (88.9%) | 20 (11.1%) |
| 45 to 54 Years | 260 (90.6%) | 27 (9.4%) |
| 55 to 64 Years | 377 (98.2%) | 7 (1.8%) |
| 65 to 74 Years | 449 (100.0%) | 0 (0.0%) |
| 75 Years and older | 88 (100.0%) | 0 (0.0%) |
| Total | 2,076 (94.2%) | 127 (5.8%) |
Health Insurance Coverage by Citizenship Status in Mulino
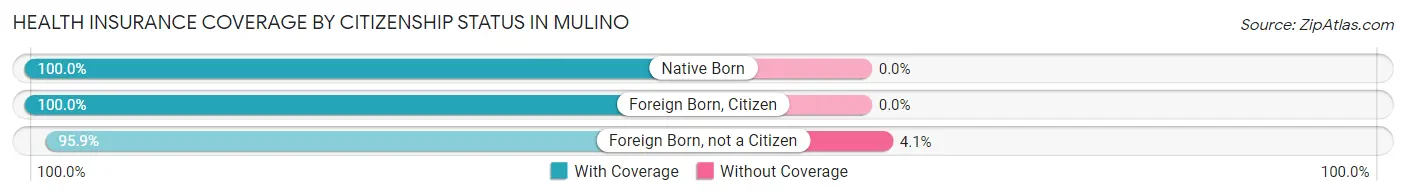
| Citizenship Status | With Coverage | Without Coverage |
| Native Born | 41 (100.0%) | 0 (0.0%) |
| Foreign Born, Citizen | 295 (100.0%) | 0 (0.0%) |
| Foreign Born, not a Citizen | 162 (95.9%) | 7 (4.1%) |
Health Insurance Coverage by Household Income in Mulino
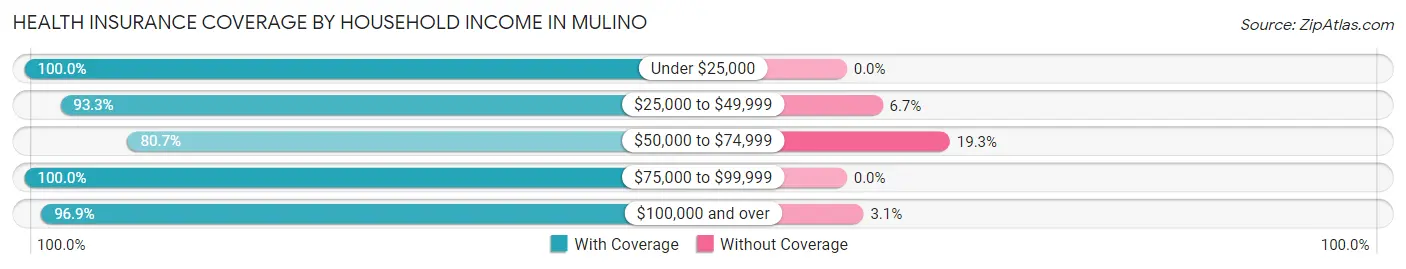
| Household Income | With Coverage | Without Coverage |
| Under $25,000 | 193 (100.0%) | 0 (0.0%) |
| $25,000 to $49,999 | 209 (93.3%) | 15 (6.7%) |
| $50,000 to $74,999 | 305 (80.7%) | 73 (19.3%) |
| $75,000 to $99,999 | 157 (100.0%) | 0 (0.0%) |
| $100,000 and over | 1,212 (96.9%) | 39 (3.1%) |
Public vs Private Health Insurance Coverage by Age in Mulino
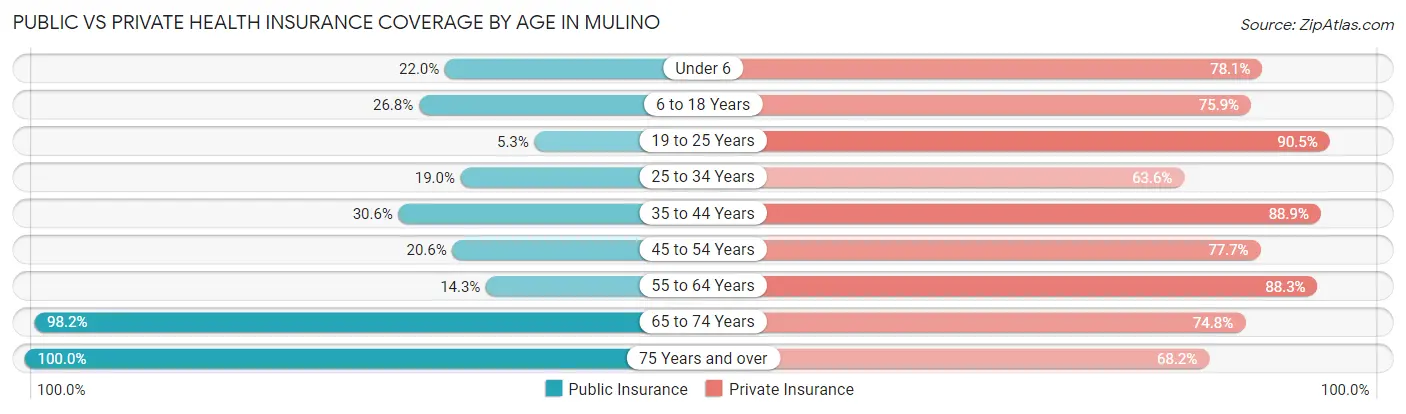
| Age Bracket | Public Insurance | Private Insurance |
| Under 6 | 9 (22.0%) | 32 (78.0%) |
| 6 to 18 Years | 79 (26.8%) | 224 (75.9%) |
| 19 to 25 Years | 9 (5.3%) | 153 (90.5%) |
| 25 to 34 Years | 59 (19.0%) | 197 (63.5%) |
| 35 to 44 Years | 55 (30.6%) | 160 (88.9%) |
| 45 to 54 Years | 59 (20.6%) | 223 (77.7%) |
| 55 to 64 Years | 55 (14.3%) | 339 (88.3%) |
| 65 to 74 Years | 441 (98.2%) | 336 (74.8%) |
| 75 Years and over | 88 (100.0%) | 60 (68.2%) |
| Total | 854 (38.8%) | 1,724 (78.3%) |
Disability Status by Sex by Age in Mulino
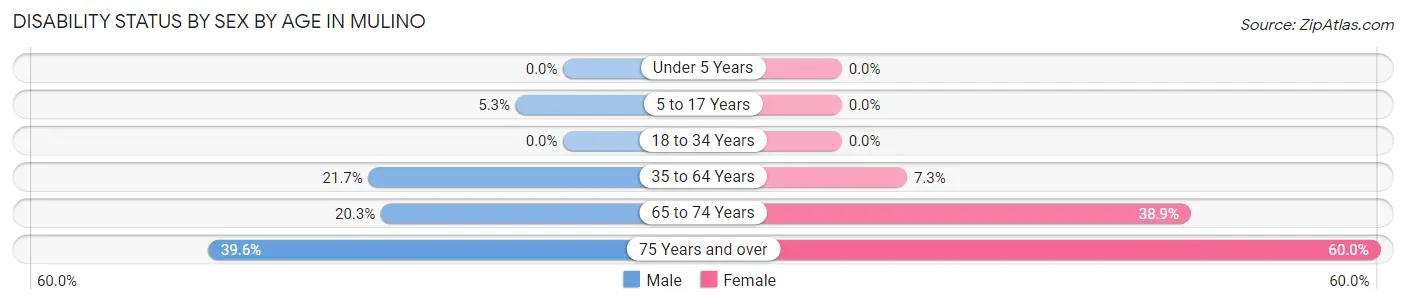
| Age Bracket | Male | Female |
| Under 5 Years | 0 (0.0%) | 0 (0.0%) |
| 5 to 17 Years | 10 (5.3%) | 0 (0.0%) |
| 18 to 34 Years | 0 (0.0%) | 0 (0.0%) |
| 35 to 64 Years | 95 (21.7%) | 30 (7.3%) |
| 65 to 74 Years | 41 (20.3%) | 96 (38.9%) |
| 75 Years and over | 19 (39.6%) | 24 (60.0%) |
Disability Class by Sex by Age in Mulino
Disability Class: Hearing Difficulty
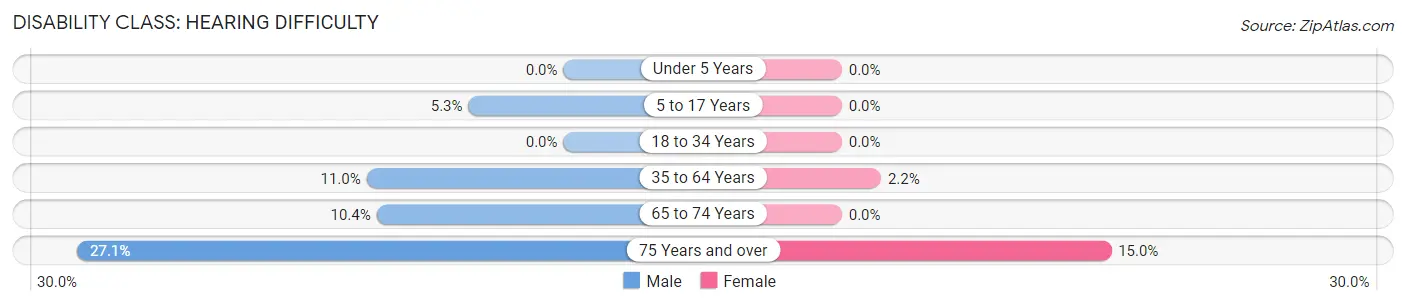
| Age Bracket | Male | Female |
| Under 5 Years | 0 (0.0%) | 0 (0.0%) |
| 5 to 17 Years | 10 (5.3%) | 0 (0.0%) |
| 18 to 34 Years | 0 (0.0%) | 0 (0.0%) |
| 35 to 64 Years | 48 (11.0%) | 9 (2.2%) |
| 65 to 74 Years | 21 (10.4%) | 0 (0.0%) |
| 75 Years and over | 13 (27.1%) | 6 (15.0%) |
Disability Class: Vision Difficulty
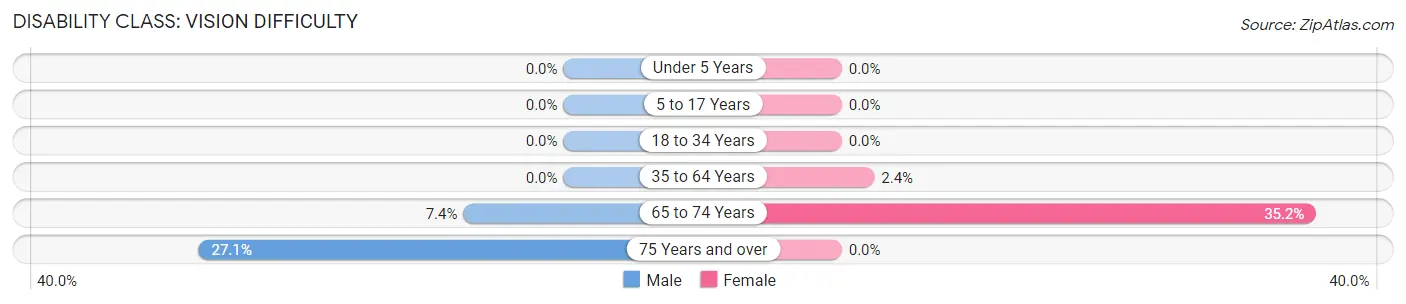
| Age Bracket | Male | Female |
| Under 5 Years | 0 (0.0%) | 0 (0.0%) |
| 5 to 17 Years | 0 (0.0%) | 0 (0.0%) |
| 18 to 34 Years | 0 (0.0%) | 0 (0.0%) |
| 35 to 64 Years | 0 (0.0%) | 10 (2.4%) |
| 65 to 74 Years | 15 (7.4%) | 87 (35.2%) |
| 75 Years and over | 13 (27.1%) | 0 (0.0%) |
Disability Class: Cognitive Difficulty
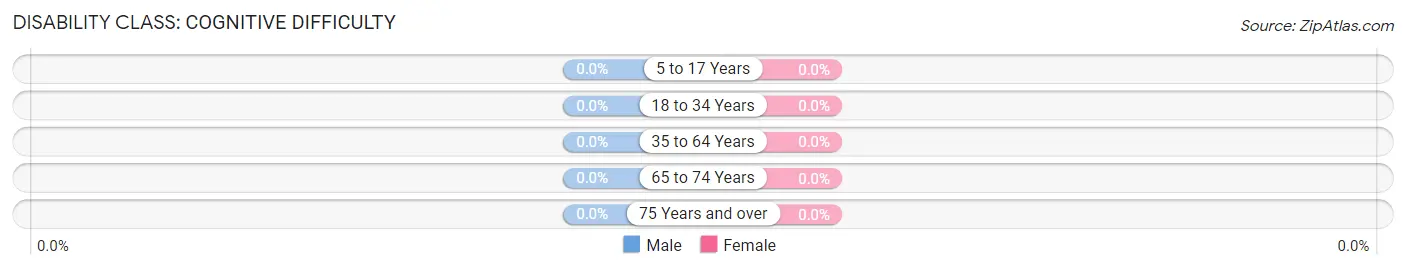
| Age Bracket | Male | Female |
| 5 to 17 Years | 0 (0.0%) | 0 (0.0%) |
| 18 to 34 Years | 0 (0.0%) | 0 (0.0%) |
| 35 to 64 Years | 0 (0.0%) | 0 (0.0%) |
| 65 to 74 Years | 0 (0.0%) | 0 (0.0%) |
| 75 Years and over | 0 (0.0%) | 0 (0.0%) |
Disability Class: Ambulatory Difficulty
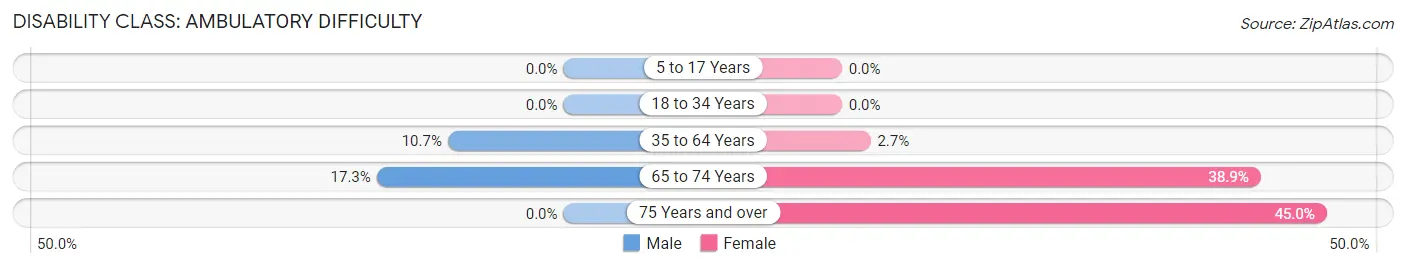
| Age Bracket | Male | Female |
| 5 to 17 Years | 0 (0.0%) | 0 (0.0%) |
| 18 to 34 Years | 0 (0.0%) | 0 (0.0%) |
| 35 to 64 Years | 47 (10.7%) | 11 (2.7%) |
| 65 to 74 Years | 35 (17.3%) | 96 (38.9%) |
| 75 Years and over | 0 (0.0%) | 18 (45.0%) |
Disability Class: Self-Care Difficulty
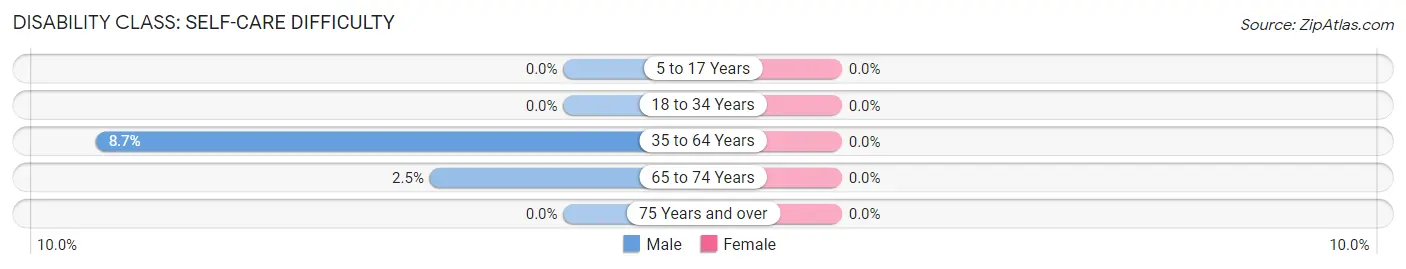
| Age Bracket | Male | Female |
| 5 to 17 Years | 0 (0.0%) | 0 (0.0%) |
| 18 to 34 Years | 0 (0.0%) | 0 (0.0%) |
| 35 to 64 Years | 38 (8.7%) | 0 (0.0%) |
| 65 to 74 Years | 5 (2.5%) | 0 (0.0%) |
| 75 Years and over | 0 (0.0%) | 0 (0.0%) |
Technology Access in Mulino
Computing Device Access in Mulino
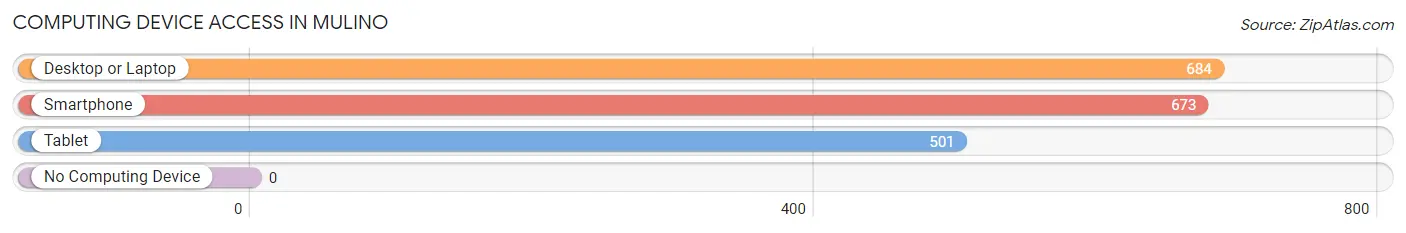
| Device Type | # Households | % Households |
| Desktop or Laptop | 684 | 96.2% |
| Smartphone | 673 | 94.7% |
| Tablet | 501 | 70.5% |
| No Computing Device | 0 | 0.0% |
| Total | 711 | 100.0% |
Internet Access in Mulino
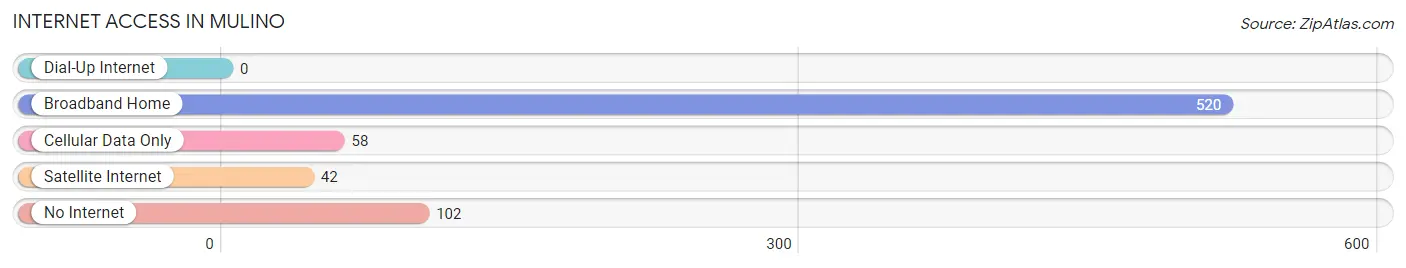
| Internet Type | # Households | % Households |
| Dial-Up Internet | 0 | 0.0% |
| Broadband Home | 520 | 73.1% |
| Cellular Data Only | 58 | 8.2% |
| Satellite Internet | 42 | 5.9% |
| No Internet | 102 | 14.3% |
| Total | 711 | 100.0% |
Mulino Summary
Mulino is an unincorporated community located in Clackamas County, Oregon, United States. It is situated in the foothills of the Cascade Mountains, approximately 20 miles south of Portland. The population of Mulino was 1,845 at the 2010 census.
History
Mulino was originally inhabited by the Kalapuya Native American tribe. The first European settlers arrived in the area in the early 1800s. The community was named after a nearby flour mill, which was built in 1851 by William and Mary Mulino. The mill was powered by the nearby Molalla River and was the first of its kind in the area.
The first post office in Mulino was established in 1854. The town was officially incorporated in 1891. In the early 1900s, the town was a major producer of hops, which were used to make beer. The hops industry declined in the 1920s, and the town shifted its focus to dairy farming and logging.
Geography
Mulino is located in the foothills of the Cascade Mountains, approximately 20 miles south of Portland. The town is situated at an elevation of 545 feet above sea level. The Molalla River runs through the town, providing a source of water for the local farms and businesses.
The climate in Mulino is mild and temperate. Summers are warm and dry, while winters are cool and wet. The average annual temperature is around 50 degrees Fahrenheit.
Economy
Mulino’s economy is largely based on agriculture and logging. The town is home to several dairy farms, as well as a number of small businesses. The town also has a small tourism industry, with visitors coming to enjoy the nearby mountains and rivers.
Demographics
As of the 2010 census, the population of Mulino was 1,845. The racial makeup of the town was 94.3% White, 0.7% African American, 0.7% Native American, 0.7% Asian, 0.2% Pacific Islander, and 2.6% from other races. The median household income was $50,000, and the median family income was $54,000.
Mulino is served by the Molalla River School District. The town is home to two elementary schools, one middle school, and one high school. The town also has a public library and a number of churches.
Conclusion
Mulino is a small, rural community located in the foothills of the Cascade Mountains in Oregon. The town has a long history, dating back to the early 1800s. The economy of Mulino is largely based on agriculture and logging, and the town is home to several dairy farms and small businesses. The population of Mulino was 1,845 at the 2010 census, and the town is served by the Molalla River School District.
Common Questions
What is Per Capita Income in Mulino?
Per Capita income in Mulino is $38,700.
What is the Median Family Income in Mulino?
Median Family Income in Mulino is $105,804.
What is the Median Household income in Mulino?
Median Household Income in Mulino is $98,417.
What is Income or Wage Gap in Mulino?
Income or Wage Gap in Mulino is 57.8%.
Women in Mulino earn 42.2 cents for every dollar earned by a man.
What is Inequality or Gini Index in Mulino?
Inequality or Gini Index in Mulino is 0.38.
What is the Total Population of Mulino?
Total Population of Mulino is 2,203.
What is the Total Male Population of Mulino?
Total Male Population of Mulino is 1,083.
What is the Total Female Population of Mulino?
Total Female Population of Mulino is 1,120.
What is the Ratio of Males per 100 Females in Mulino?
There are 96.70 Males per 100 Females in Mulino.
What is the Ratio of Females per 100 Males in Mulino?
There are 103.42 Females per 100 Males in Mulino.
What is the Median Population Age in Mulino?
Median Population Age in Mulino is 52.1 Years.
What is the Average Family Size in Mulino
Average Family Size in Mulino is 3.0 People.
What is the Average Household Size in Mulino
Average Household Size in Mulino is 3.1 People.
How Large is the Labor Force in Mulino?
There are 1,115 People in the Labor Forcein in Mulino.
What is the Percentage of People in the Labor Force in Mulino?
56.9% of People are in the Labor Force in Mulino.
What is the Unemployment Rate in Mulino?
Unemployment Rate in Mulino is 11.6%.