Roseburg, OR Map & Demographics
Roseburg Map
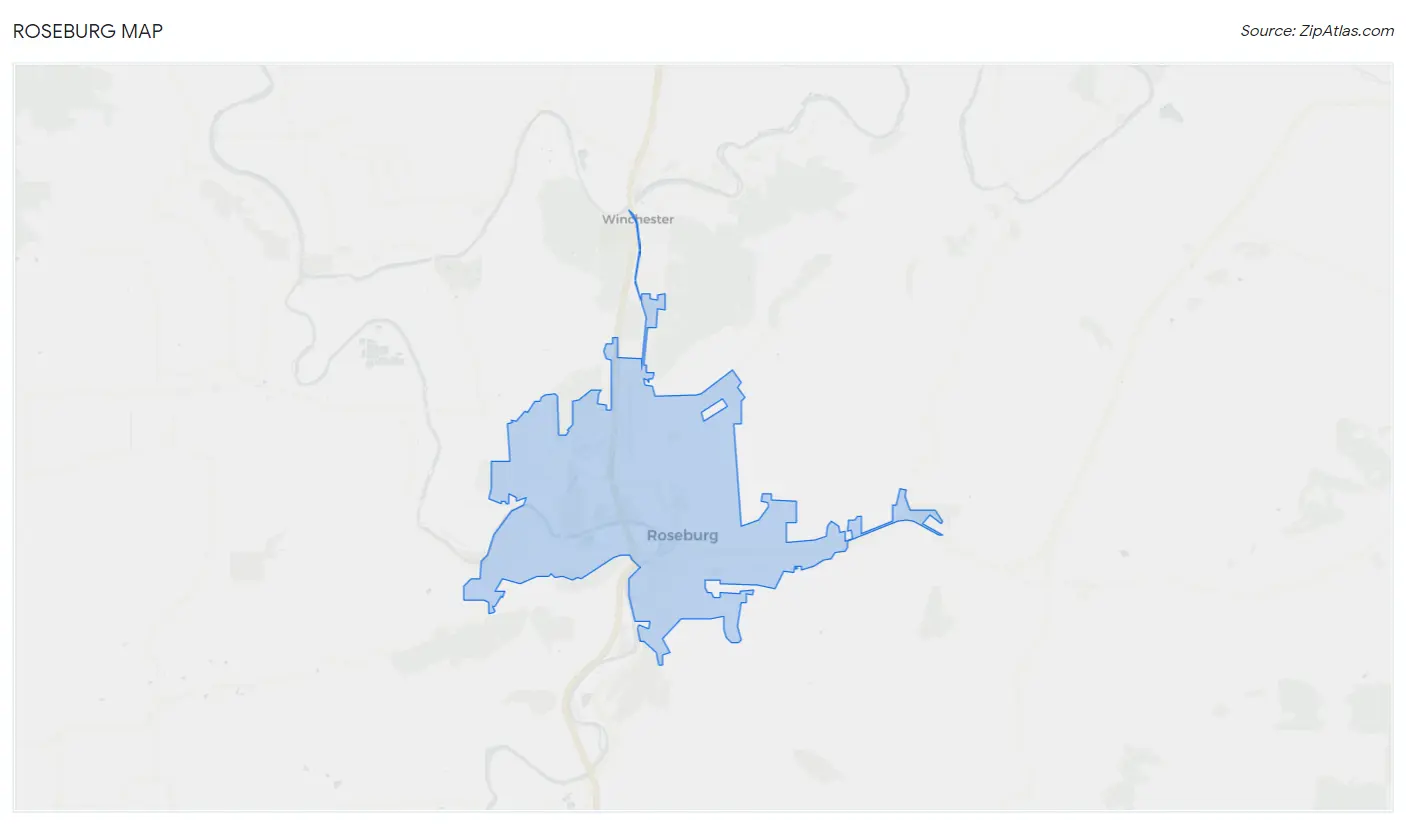
Roseburg Overview
$27,547
PER CAPITA INCOME
$60,777
AVG FAMILY INCOME
$50,297
AVG HOUSEHOLD INCOME
22.2%
WAGE / INCOME GAP [ % ]
77.8¢/ $1
WAGE / INCOME GAP [ $ ]
$11,962
FAMILY INCOME DEFICIT
0.44
INEQUALITY / GINI INDEX
23,657
TOTAL POPULATION
11,792
MALE POPULATION
11,865
FEMALE POPULATION
99.38
MALES / 100 FEMALES
100.62
FEMALES / 100 MALES
40.3
MEDIAN AGE
2.8
AVG FAMILY SIZE
2.3
AVG HOUSEHOLD SIZE
9,820
LABOR FORCE [ PEOPLE ]
51.0%
PERCENT IN LABOR FORCE
5.0%
UNEMPLOYMENT RATE
Roseburg Area Codes
Income in Roseburg
Income Overview in Roseburg
Per Capita Income in Roseburg is $27,547, while median incomes of families and households are $60,777 and $50,297 respectively.
| Characteristic | Number | Measure |
| Per Capita Income | 23,657 | $27,547 |
| Median Family Income | 5,659 | $60,777 |
| Mean Family Income | 5,659 | $77,819 |
| Median Household Income | 9,954 | $50,297 |
| Mean Household Income | 9,954 | $65,780 |
| Income Deficit | 5,659 | $11,962 |
| Wage / Income Gap (%) | 23,657 | 22.17% |
| Wage / Income Gap ($) | 23,657 | 77.83¢ per $1 |
| Gini / Inequality Index | 23,657 | 0.44 |
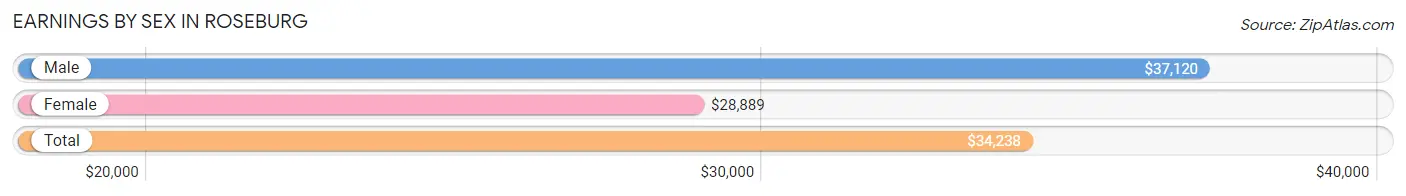
Earnings by Sex in Roseburg
Average Earnings in Roseburg are $34,238, $37,120 for men and $28,889 for women, a difference of 22.2%.
| Sex | Number | Average Earnings |
| Male | 5,390 (50.3%) | $37,120 |
| Female | 5,326 (49.7%) | $28,889 |
| Total | 10,716 (100.0%) | $34,238 |
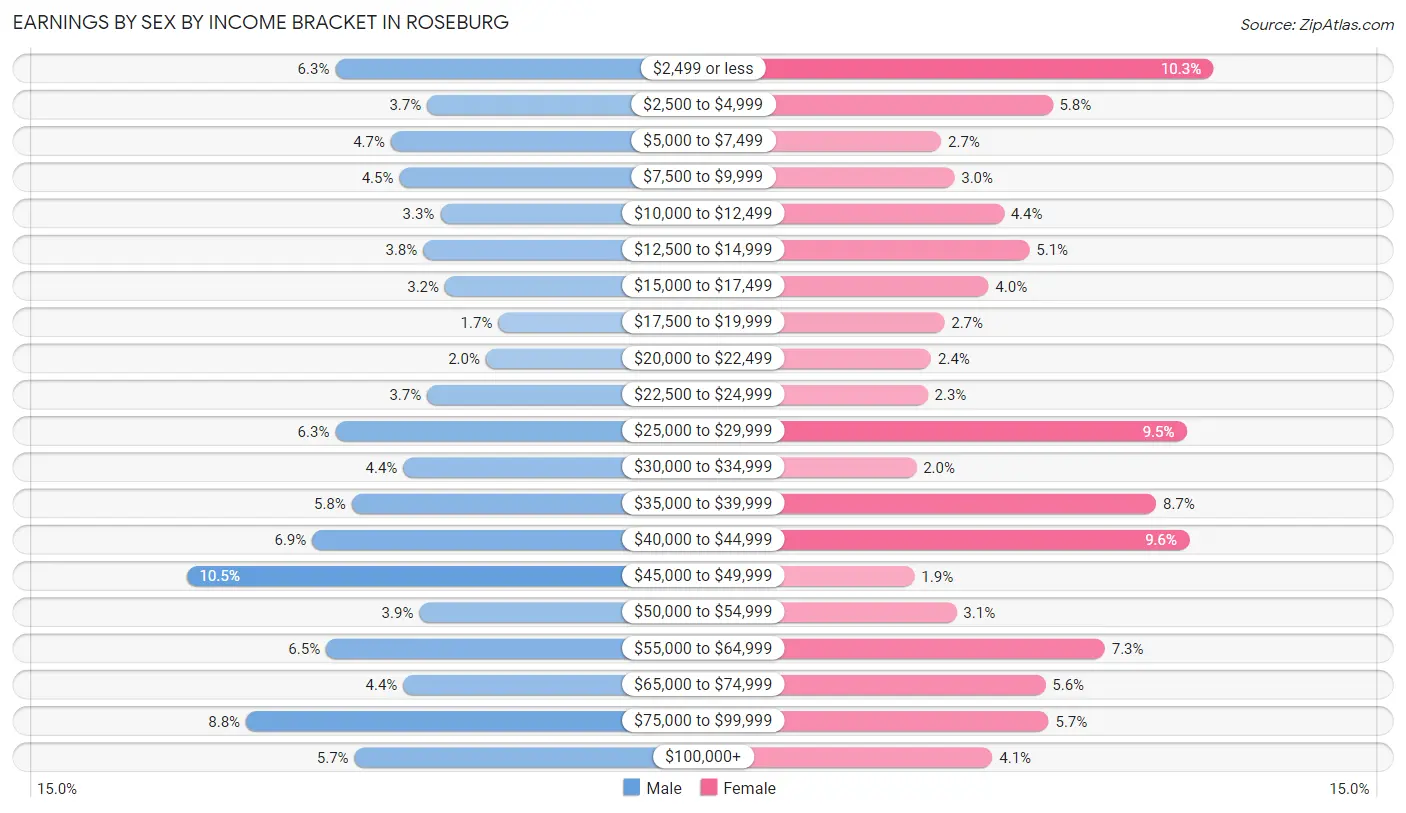
Earnings by Sex by Income Bracket in Roseburg
The most common earnings brackets in Roseburg are $45,000 to $49,999 for men (563 | 10.4%) and $2,499 or less for women (548 | 10.3%).
| Income | Male | Female |
| $2,499 or less | 338 (6.3%) | 548 (10.3%) |
| $2,500 to $4,999 | 199 (3.7%) | 308 (5.8%) |
| $5,000 to $7,499 | 254 (4.7%) | 141 (2.6%) |
| $7,500 to $9,999 | 241 (4.5%) | 161 (3.0%) |
| $10,000 to $12,499 | 179 (3.3%) | 235 (4.4%) |
| $12,500 to $14,999 | 205 (3.8%) | 273 (5.1%) |
| $15,000 to $17,499 | 172 (3.2%) | 212 (4.0%) |
| $17,500 to $19,999 | 91 (1.7%) | 146 (2.7%) |
| $20,000 to $22,499 | 110 (2.0%) | 126 (2.4%) |
| $22,500 to $24,999 | 199 (3.7%) | 121 (2.3%) |
| $25,000 to $29,999 | 338 (6.3%) | 508 (9.5%) |
| $30,000 to $34,999 | 235 (4.4%) | 104 (1.9%) |
| $35,000 to $39,999 | 313 (5.8%) | 463 (8.7%) |
| $40,000 to $44,999 | 373 (6.9%) | 512 (9.6%) |
| $45,000 to $49,999 | 563 (10.4%) | 101 (1.9%) |
| $50,000 to $54,999 | 211 (3.9%) | 164 (3.1%) |
| $55,000 to $64,999 | 352 (6.5%) | 386 (7.2%) |
| $65,000 to $74,999 | 235 (4.4%) | 297 (5.6%) |
| $75,000 to $99,999 | 473 (8.8%) | 302 (5.7%) |
| $100,000+ | 309 (5.7%) | 218 (4.1%) |
| Total | 5,390 (100.0%) | 5,326 (100.0%) |
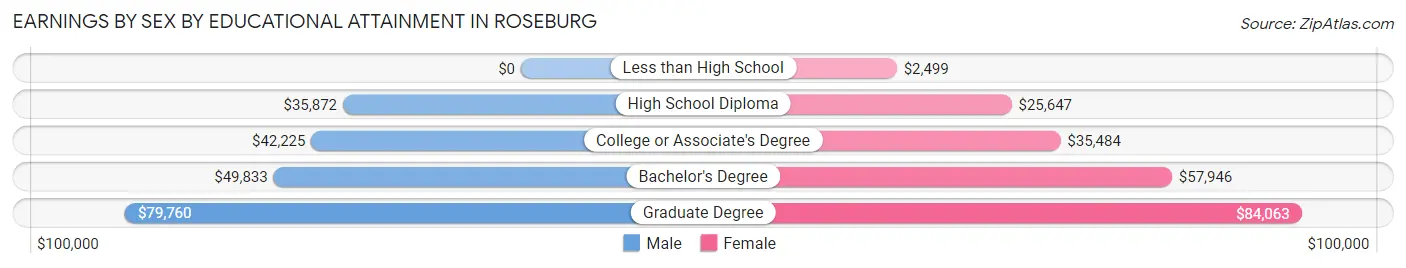
Earnings by Sex by Educational Attainment in Roseburg
Average earnings in Roseburg are $40,449 for men and $36,348 for women, a difference of 10.1%. Men with an educational attainment of graduate degree enjoy the highest average annual earnings of $79,760, while those with high school diploma education earn the least with $35,872. Women with an educational attainment of graduate degree earn the most with the average annual earnings of $84,063, while those with less than high school education have the smallest earnings of $2,499.
| Educational Attainment | Male Income | Female Income |
| Less than High School | - | - |
| High School Diploma | $35,872 | $25,647 |
| College or Associate's Degree | $42,225 | $35,484 |
| Bachelor's Degree | $49,833 | $57,946 |
| Graduate Degree | $79,760 | $84,063 |
| Total | $40,449 | $36,348 |
Family Income in Roseburg
Family Income Brackets in Roseburg
According to the Roseburg family income data, there are 1,398 families falling into the $50,000 to $74,999 income range, which is the most common income bracket and makes up 24.7% of all families. Conversely, the $200,000+ income bracket is the least frequent group with only 164 families (2.9%) belonging to this category.
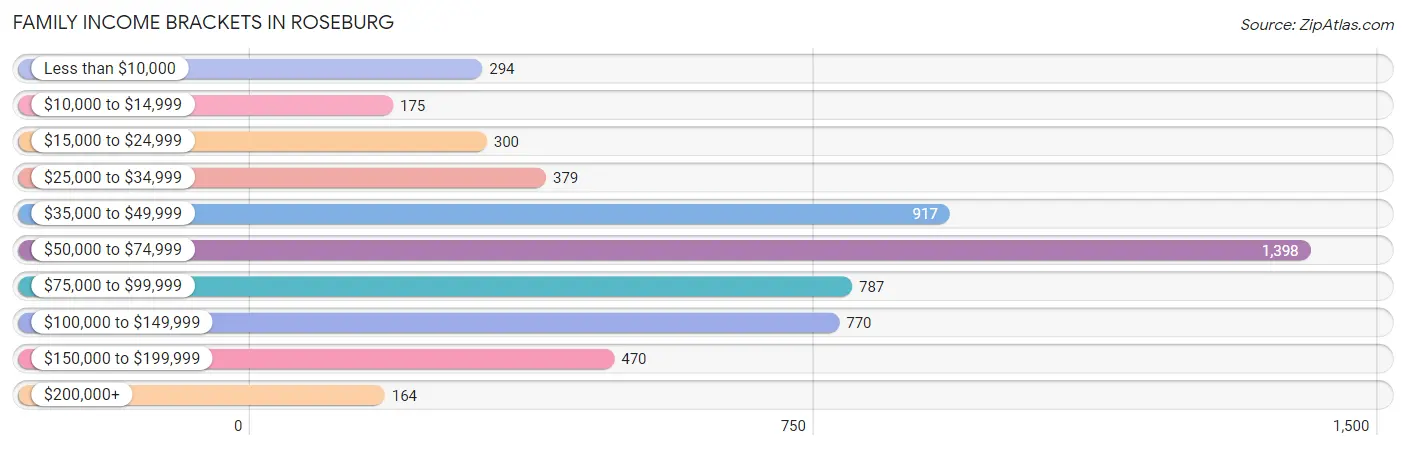
| Income Bracket | # Families | % Families |
| Less than $10,000 | 294 | 5.2% |
| $10,000 to $14,999 | 175 | 3.1% |
| $15,000 to $24,999 | 300 | 5.3% |
| $25,000 to $34,999 | 379 | 6.7% |
| $35,000 to $49,999 | 917 | 16.2% |
| $50,000 to $74,999 | 1,398 | 24.7% |
| $75,000 to $99,999 | 787 | 13.9% |
| $100,000 to $149,999 | 770 | 13.6% |
| $150,000 to $199,999 | 470 | 8.3% |
| $200,000+ | 164 | 2.9% |
Family Income by Famaliy Size in Roseburg
6-person families (149 | 2.6%) account for the highest median family income in Roseburg with $197,894 per family, while 6-person families (149 | 2.6%) have the highest median income of $32,982 per family member.
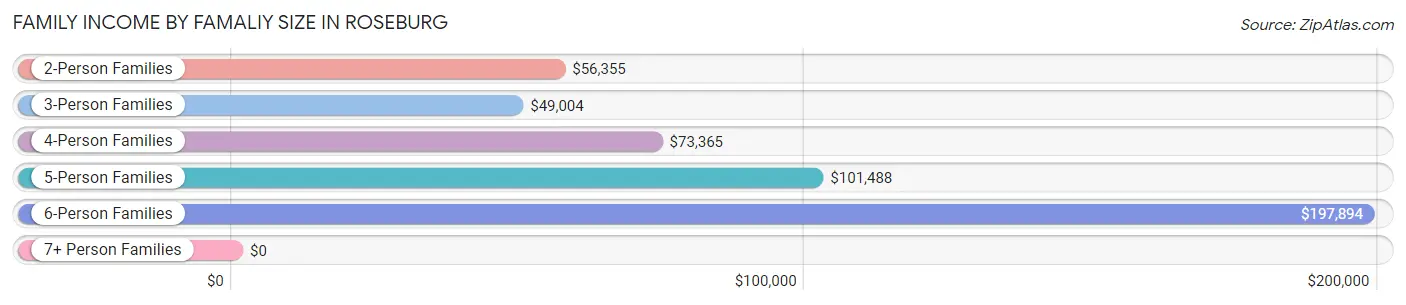
| Income Bracket | # Families | Median Income |
| 2-Person Families | 3,250 (57.4%) | $56,355 |
| 3-Person Families | 970 (17.1%) | $49,004 |
| 4-Person Families | 766 (13.5%) | $73,365 |
| 5-Person Families | 507 (9.0%) | $101,488 |
| 6-Person Families | 149 (2.6%) | $197,894 |
| 7+ Person Families | 17 (0.3%) | $0 |
| Total | 5,659 (100.0%) | $60,777 |
Family Income by Number of Earners in Roseburg
The median family income in Roseburg is $60,777, with families comprising 3+ earners (391) having the highest median family income of $138,083, while families with no earners (1,289) have the lowest median family income of $33,520, accounting for 6.9% and 22.8% of families, respectively.
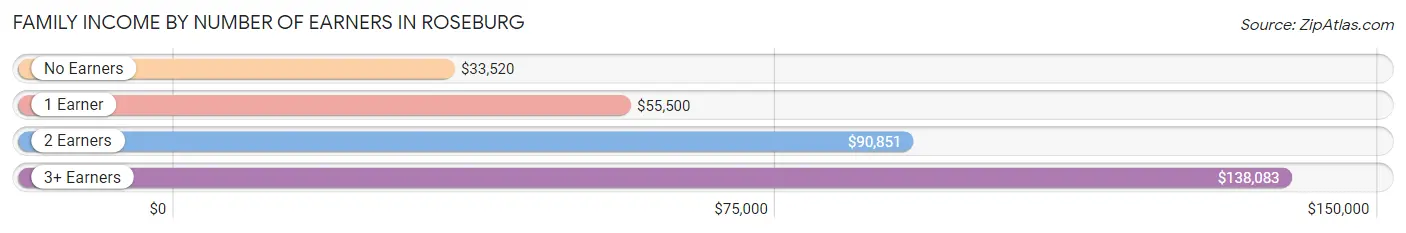
| Number of Earners | # Families | Median Income |
| No Earners | 1,289 (22.8%) | $33,520 |
| 1 Earner | 2,134 (37.7%) | $55,500 |
| 2 Earners | 1,845 (32.6%) | $90,851 |
| 3+ Earners | 391 (6.9%) | $138,083 |
| Total | 5,659 (100.0%) | $60,777 |
Household Income in Roseburg
Household Income Brackets in Roseburg
With 1,941 households falling in the category, the $50,000 to $74,999 income range is the most frequent in Roseburg, accounting for 19.5% of all households. In contrast, only 229 households (2.3%) fall into the $200,000+ income bracket, making it the least populous group.
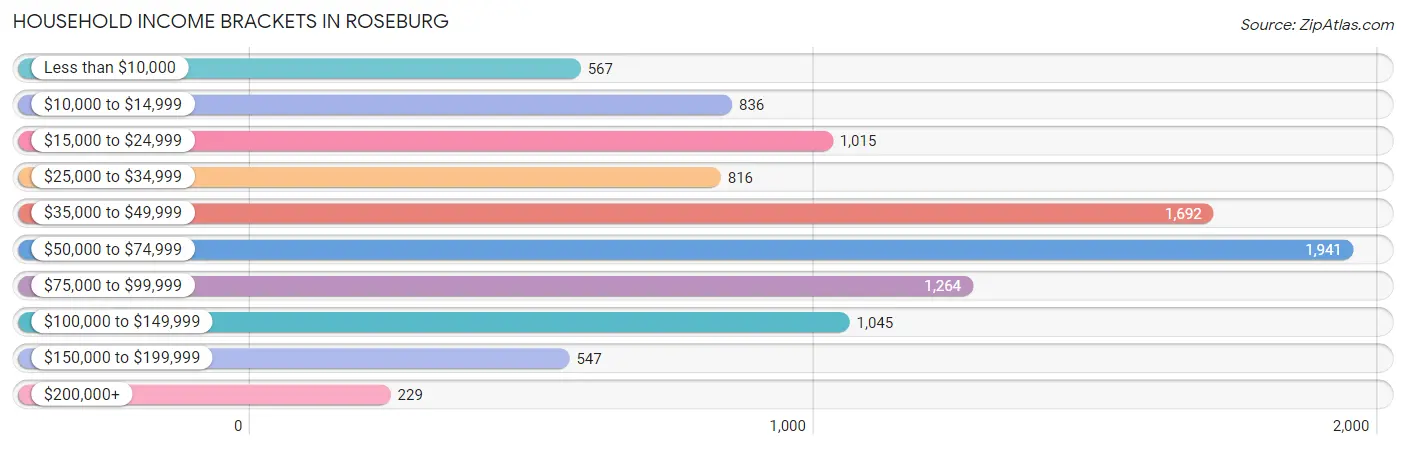
| Income Bracket | # Households | % Households |
| Less than $10,000 | 567 | 5.7% |
| $10,000 to $14,999 | 836 | 8.4% |
| $15,000 to $24,999 | 1,015 | 10.2% |
| $25,000 to $34,999 | 816 | 8.2% |
| $35,000 to $49,999 | 1,692 | 17.0% |
| $50,000 to $74,999 | 1,941 | 19.5% |
| $75,000 to $99,999 | 1,264 | 12.7% |
| $100,000 to $149,999 | 1,045 | 10.5% |
| $150,000 to $199,999 | 547 | 5.5% |
| $200,000+ | 229 | 2.3% |
Household Income by Householder Age in Roseburg
The median household income in Roseburg is $50,297, with the highest median household income of $77,563 found in the 15 to 24 years age bracket for the primary householder. A total of 430 households (4.3%) fall into this category. Meanwhile, the 65+ years age bracket for the primary householder has the lowest median household income of $38,024, with 3,124 households (31.4%) in this group.
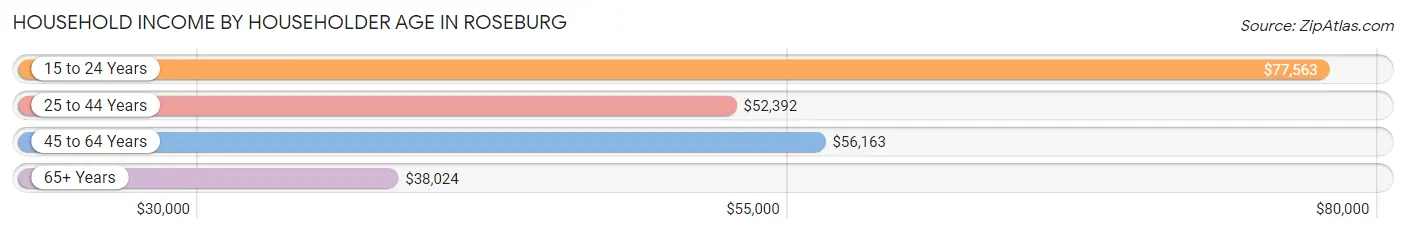
| Income Bracket | # Households | Median Income |
| 15 to 24 Years | 430 (4.3%) | $77,563 |
| 25 to 44 Years | 3,306 (33.2%) | $52,392 |
| 45 to 64 Years | 3,094 (31.1%) | $56,163 |
| 65+ Years | 3,124 (31.4%) | $38,024 |
| Total | 9,954 (100.0%) | $50,297 |
Poverty in Roseburg
Income Below Poverty by Sex and Age in Roseburg
With 20.7% poverty level for males and 19.4% for females among the residents of Roseburg, 5 year old males and 5 year old females are the most vulnerable to poverty, with 55 males (42.3%) and 40 females (40.4%) in their respective age groups living below the poverty level.
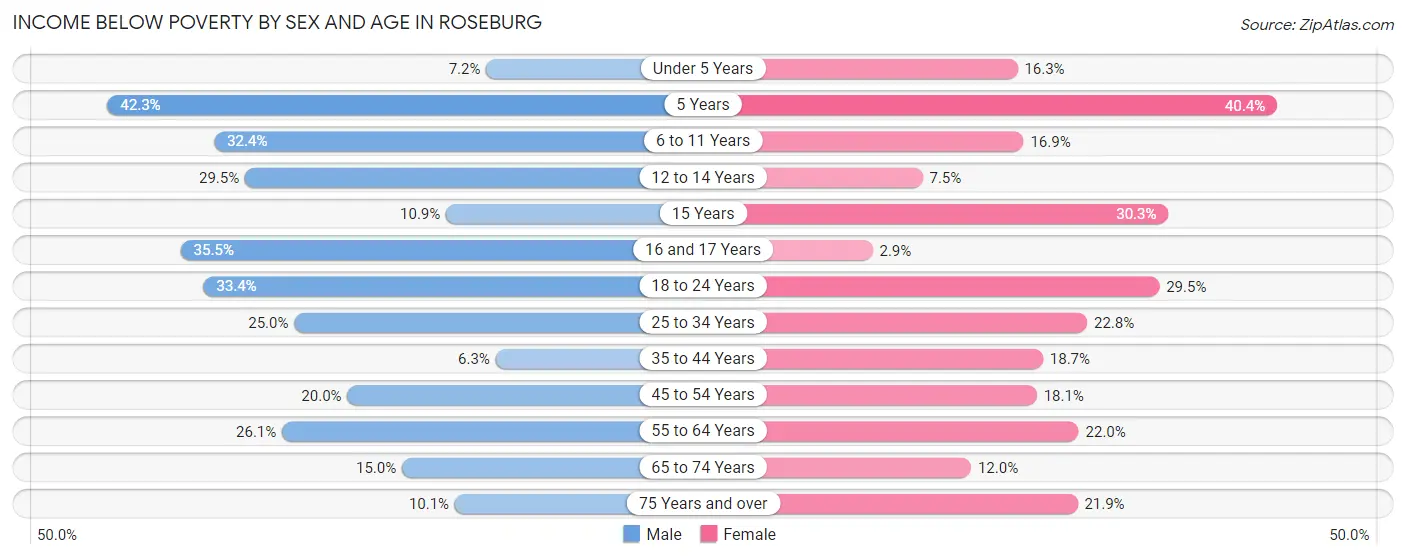
| Age Bracket | Male | Female |
| Under 5 Years | 48 (7.1%) | 82 (16.3%) |
| 5 Years | 55 (42.3%) | 40 (40.4%) |
| 6 to 11 Years | 224 (32.4%) | 101 (16.9%) |
| 12 to 14 Years | 166 (29.5%) | 52 (7.5%) |
| 15 Years | 21 (10.9%) | 40 (30.3%) |
| 16 and 17 Years | 103 (35.5%) | 8 (2.9%) |
| 18 to 24 Years | 313 (33.4%) | 231 (29.5%) |
| 25 to 34 Years | 442 (25.0%) | 411 (22.8%) |
| 35 to 44 Years | 84 (6.3%) | 276 (18.7%) |
| 45 to 54 Years | 269 (20.0%) | 188 (18.1%) |
| 55 to 64 Years | 369 (26.1%) | 377 (22.0%) |
| 65 to 74 Years | 159 (15.0%) | 126 (12.0%) |
| 75 Years and over | 94 (10.1%) | 332 (21.9%) |
| Total | 2,347 (20.7%) | 2,264 (19.4%) |
Income Above Poverty by Sex and Age in Roseburg
According to the poverty statistics in Roseburg, males aged 35 to 44 years and females aged 16 and 17 years are the age groups that are most secure financially, with 93.7% of males and 97.2% of females in these age groups living above the poverty line.
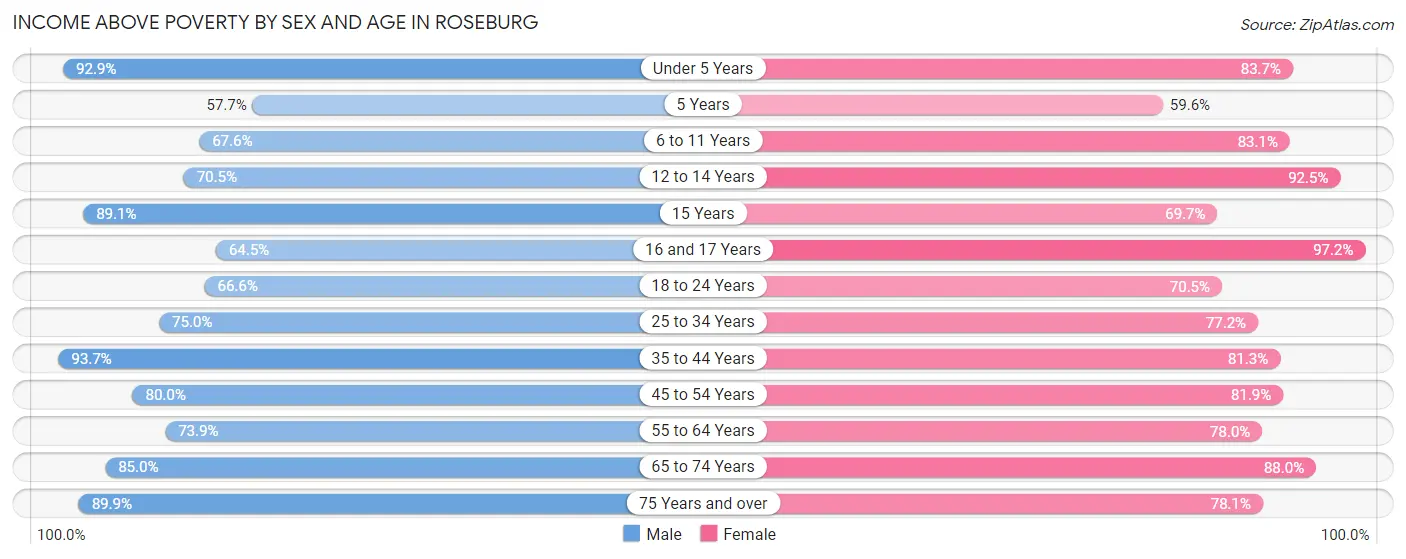
| Age Bracket | Male | Female |
| Under 5 Years | 623 (92.8%) | 421 (83.7%) |
| 5 Years | 75 (57.7%) | 59 (59.6%) |
| 6 to 11 Years | 467 (67.6%) | 498 (83.1%) |
| 12 to 14 Years | 396 (70.5%) | 642 (92.5%) |
| 15 Years | 172 (89.1%) | 92 (69.7%) |
| 16 and 17 Years | 187 (64.5%) | 273 (97.2%) |
| 18 to 24 Years | 624 (66.6%) | 553 (70.5%) |
| 25 to 34 Years | 1,328 (75.0%) | 1,395 (77.2%) |
| 35 to 44 Years | 1,254 (93.7%) | 1,203 (81.3%) |
| 45 to 54 Years | 1,073 (80.0%) | 851 (81.9%) |
| 55 to 64 Years | 1,045 (73.9%) | 1,338 (78.0%) |
| 65 to 74 Years | 903 (85.0%) | 925 (88.0%) |
| 75 Years and over | 840 (89.9%) | 1,186 (78.1%) |
| Total | 8,987 (79.3%) | 9,436 (80.6%) |
Income Below Poverty Among Married-Couple Families in Roseburg
The poverty statistics for married-couple families in Roseburg show that 4.2% or 155 of the total 3,698 families live below the poverty line. Families with no children have the highest poverty rate of 4.3%, comprising of 97 families. On the other hand, families with 3 or 4 children have the lowest poverty rate of 2.4%, which includes 6 families.
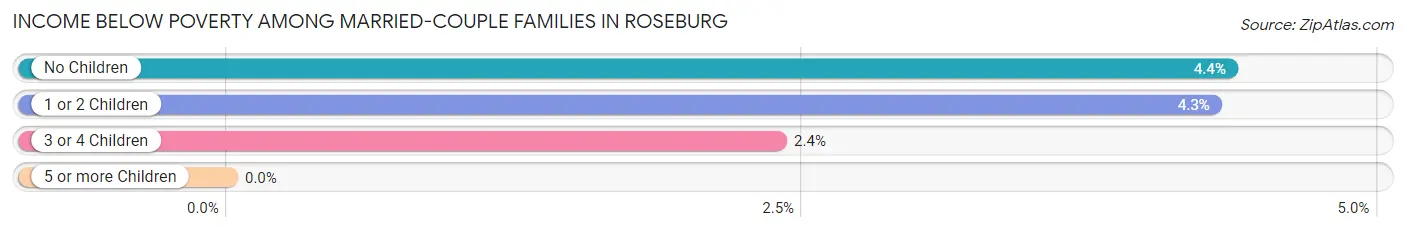
| Children | Above Poverty | Below Poverty |
| No Children | 2,134 (95.7%) | 97 (4.3%) |
| 1 or 2 Children | 1,164 (95.7%) | 52 (4.3%) |
| 3 or 4 Children | 245 (97.6%) | 6 (2.4%) |
| 5 or more Children | 0 (0.0%) | 0 (0.0%) |
| Total | 3,543 (95.8%) | 155 (4.2%) |
Income Below Poverty Among Single-Parent Households in Roseburg
According to the poverty data in Roseburg, 31.6% or 217 single-father households and 22.3% or 284 single-mother households are living below the poverty line. Among single-father households, those with 1 or 2 children have the highest poverty rate, with 191 households (36.6%) experiencing poverty. Likewise, among single-mother households, those with 3 or 4 children have the highest poverty rate, with 70 households (58.8%) falling below the poverty line.
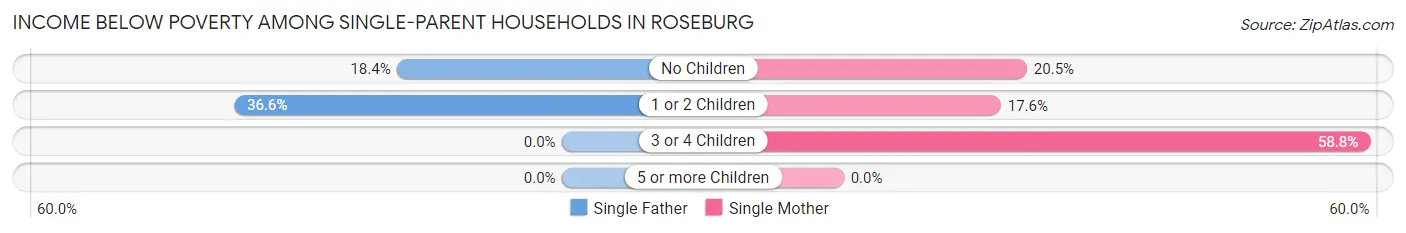
| Children | Single Father | Single Mother |
| No Children | 26 (18.4%) | 77 (20.5%) |
| 1 or 2 Children | 191 (36.6%) | 137 (17.6%) |
| 3 or 4 Children | 0 (0.0%) | 70 (58.8%) |
| 5 or more Children | 0 (0.0%) | 0 (0.0%) |
| Total | 217 (31.6%) | 284 (22.3%) |
Income Below Poverty Among Married-Couple vs Single-Parent Households in Roseburg
The poverty data for Roseburg shows that 155 of the married-couple family households (4.2%) and 501 of the single-parent households (25.6%) are living below the poverty level. Within the married-couple family households, those with no children have the highest poverty rate, with 97 households (4.3%) falling below the poverty line. Among the single-parent households, those with 3 or 4 children have the highest poverty rate, with 70 household (49.3%) living below poverty.
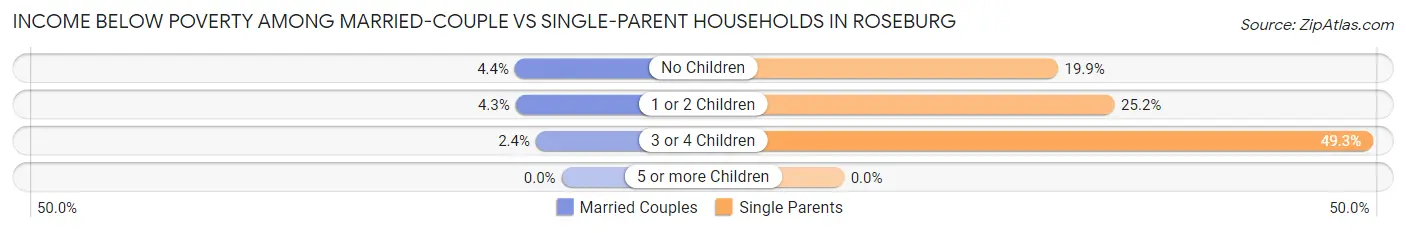
| Children | Married-Couple Families | Single-Parent Households |
| No Children | 97 (4.3%) | 103 (19.9%) |
| 1 or 2 Children | 52 (4.3%) | 328 (25.2%) |
| 3 or 4 Children | 6 (2.4%) | 70 (49.3%) |
| 5 or more Children | 0 (0.0%) | 0 (0.0%) |
| Total | 155 (4.2%) | 501 (25.6%) |
Race in Roseburg
The most populous races in Roseburg are White / Caucasian (21,049 | 89.0%), Two or more Races (1,975 | 8.4%), and Hispanic or Latino (1,425 | 6.0%).
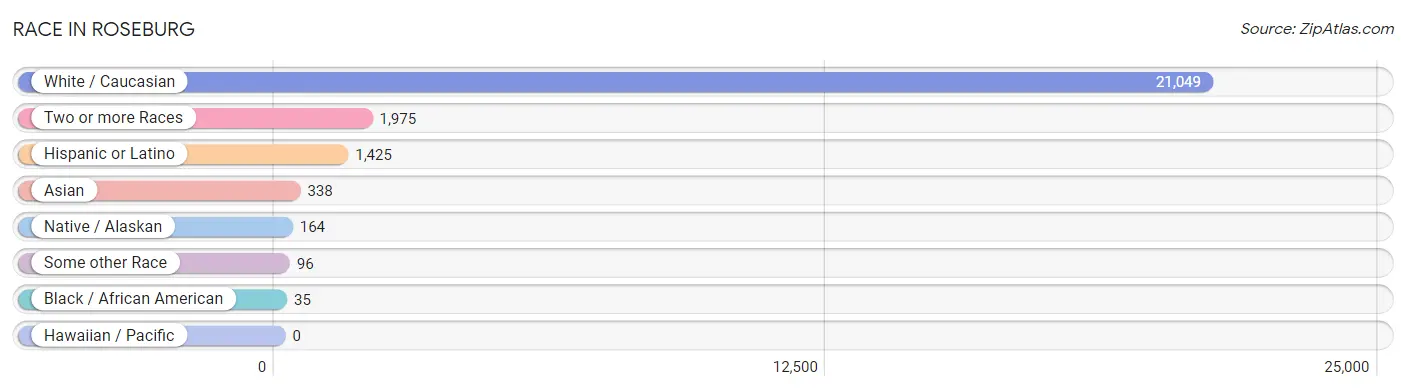
| Race | # Population | % Population |
| Asian | 338 | 1.4% |
| Black / African American | 35 | 0.2% |
| Hawaiian / Pacific | 0 | 0.0% |
| Hispanic or Latino | 1,425 | 6.0% |
| Native / Alaskan | 164 | 0.7% |
| White / Caucasian | 21,049 | 89.0% |
| Two or more Races | 1,975 | 8.4% |
| Some other Race | 96 | 0.4% |
| Total | 23,657 | 100.0% |
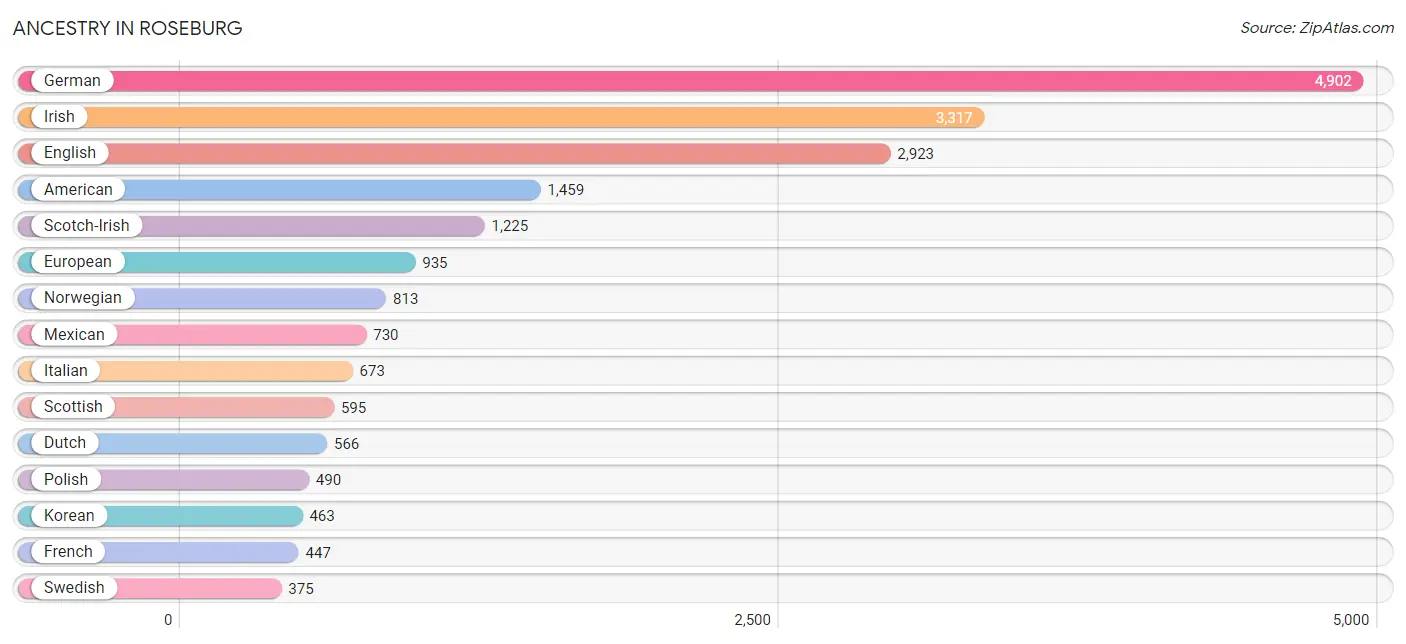
Ancestry in Roseburg
The most populous ancestries reported in Roseburg are German (4,902 | 20.7%), Irish (3,317 | 14.0%), English (2,923 | 12.4%), American (1,459 | 6.2%), and Scotch-Irish (1,225 | 5.2%), together accounting for 58.4% of all Roseburg residents.
| Ancestry | # Population | % Population |
| American | 1,459 | 6.2% |
| Apache | 33 | 0.1% |
| Arab | 85 | 0.4% |
| Armenian | 21 | 0.1% |
| Australian | 28 | 0.1% |
| Austrian | 33 | 0.1% |
| Basque | 8 | 0.0% |
| Belgian | 21 | 0.1% |
| Bhutanese | 20 | 0.1% |
| British | 117 | 0.5% |
| Burmese | 105 | 0.4% |
| Canadian | 109 | 0.5% |
| Celtic | 25 | 0.1% |
| Central American | 107 | 0.4% |
| Cherokee | 350 | 1.5% |
| Chilean | 38 | 0.2% |
| Choctaw | 5 | 0.0% |
| Colombian | 3 | 0.0% |
| Cuban | 30 | 0.1% |
| Czech | 142 | 0.6% |
| Czechoslovakian | 54 | 0.2% |
| Danish | 191 | 0.8% |
| Dutch | 566 | 2.4% |
| Eastern European | 52 | 0.2% |
| Egyptian | 81 | 0.3% |
| English | 2,923 | 12.4% |
| European | 935 | 4.0% |
| Finnish | 9 | 0.0% |
| French | 447 | 1.9% |
| French American Indian | 27 | 0.1% |
| French Canadian | 124 | 0.5% |
| German | 4,902 | 20.7% |
| Greek | 22 | 0.1% |
| Guatemalan | 7 | 0.0% |
| Honduran | 15 | 0.1% |
| Hungarian | 96 | 0.4% |
| Icelander | 16 | 0.1% |
| Indian (Asian) | 30 | 0.1% |
| Irish | 3,317 | 14.0% |
| Iroquois | 31 | 0.1% |
| Italian | 673 | 2.8% |
| Korean | 463 | 2.0% |
| Mexican | 730 | 3.1% |
| Mexican American Indian | 40 | 0.2% |
| Native Hawaiian | 40 | 0.2% |
| Northern European | 86 | 0.4% |
| Norwegian | 813 | 3.4% |
| Pakistani | 40 | 0.2% |
| Polish | 490 | 2.1% |
| Portuguese | 92 | 0.4% |
| Puerto Rican | 318 | 1.3% |
| Romanian | 42 | 0.2% |
| Russian | 16 | 0.1% |
| Salvadoran | 85 | 0.4% |
| Scandinavian | 367 | 1.5% |
| Scotch-Irish | 1,225 | 5.2% |
| Scottish | 595 | 2.5% |
| Sioux | 19 | 0.1% |
| Slavic | 101 | 0.4% |
| South American | 50 | 0.2% |
| Spaniard | 95 | 0.4% |
| Spanish | 51 | 0.2% |
| Spanish American | 19 | 0.1% |
| Sri Lankan | 28 | 0.1% |
| Swedish | 375 | 1.6% |
| Swiss | 49 | 0.2% |
| Thai | 76 | 0.3% |
| Tlingit-Haida | 4 | 0.0% |
| Ukrainian | 52 | 0.2% |
| Venezuelan | 9 | 0.0% |
| Welsh | 305 | 1.3% | View All 71 Rows |
Immigrants in Roseburg
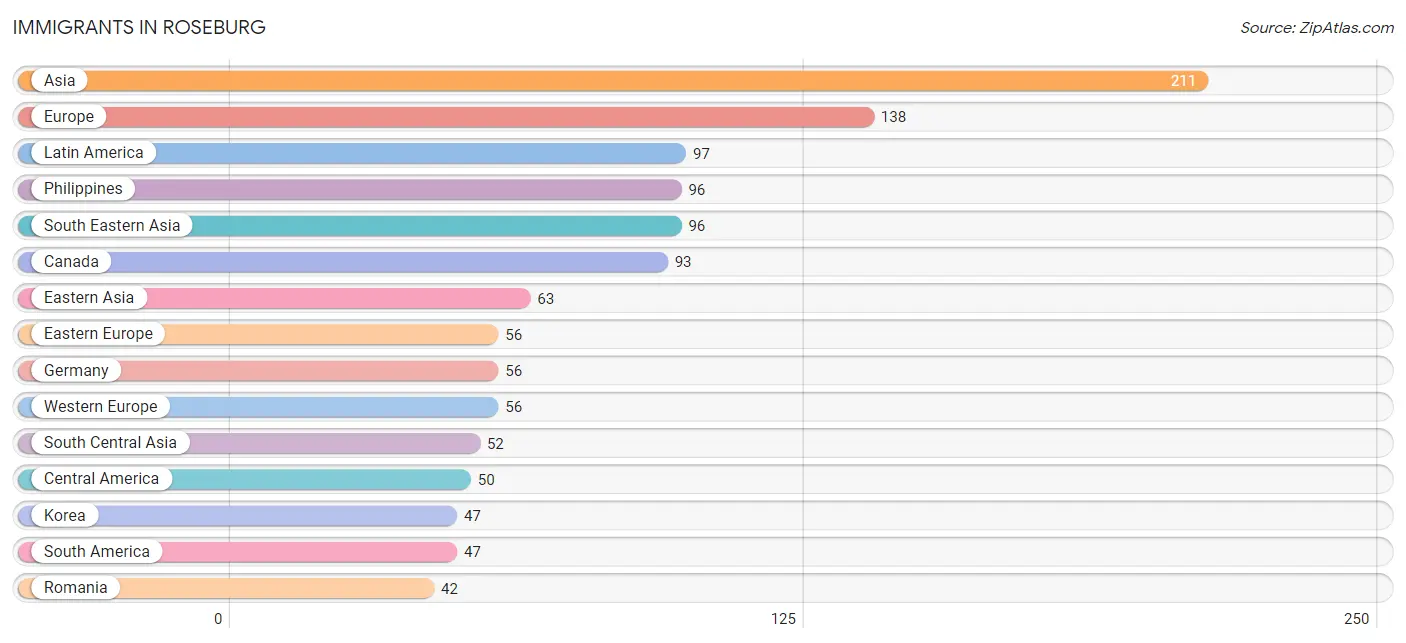
The most numerous immigrant groups reported in Roseburg came from Asia (211 | 0.9%), Europe (138 | 0.6%), Latin America (97 | 0.4%), Philippines (96 | 0.4%), and South Eastern Asia (96 | 0.4%), together accounting for 2.7% of all Roseburg residents.
| Immigration Origin | # Population | % Population |
| Asia | 211 | 0.9% |
| Australia | 12 | 0.1% |
| Canada | 93 | 0.4% |
| Central America | 50 | 0.2% |
| Chile | 38 | 0.2% |
| China | 16 | 0.1% |
| Eastern Asia | 63 | 0.3% |
| Eastern Europe | 56 | 0.2% |
| Europe | 138 | 0.6% |
| Germany | 56 | 0.2% |
| Guatemala | 7 | 0.0% |
| Honduras | 15 | 0.1% |
| India | 34 | 0.1% |
| Italy | 26 | 0.1% |
| Korea | 47 | 0.2% |
| Latin America | 97 | 0.4% |
| Mexico | 28 | 0.1% |
| Oceania | 31 | 0.1% |
| Philippines | 96 | 0.4% |
| Poland | 11 | 0.1% |
| Romania | 42 | 0.2% |
| Russia | 3 | 0.0% |
| South America | 47 | 0.2% |
| South Central Asia | 52 | 0.2% |
| South Eastern Asia | 96 | 0.4% |
| Southern Europe | 26 | 0.1% |
| Taiwan | 11 | 0.1% |
| Venezuela | 9 | 0.0% |
| Western Europe | 56 | 0.2% | View All 29 Rows |
Sex and Age in Roseburg
Sex and Age in Roseburg
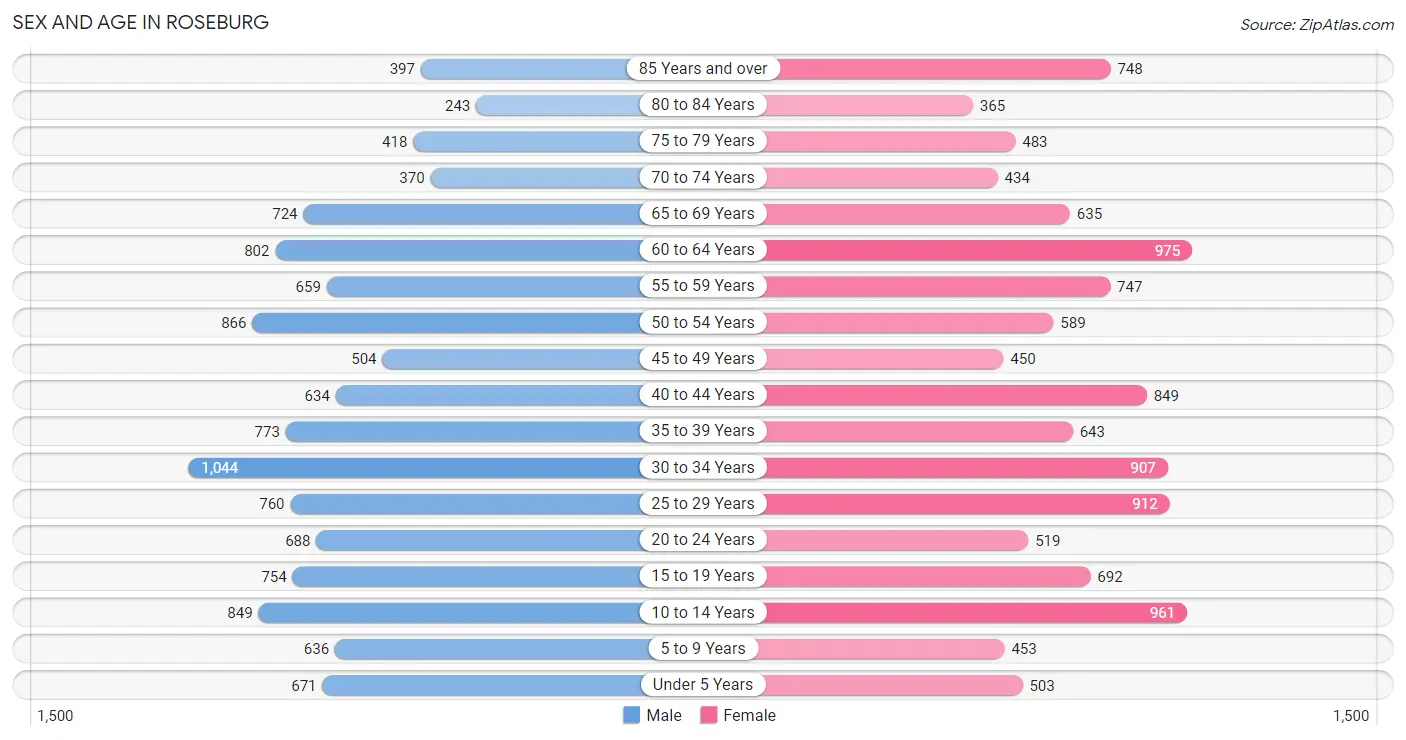
The most populous age groups in Roseburg are 30 to 34 Years (1,044 | 8.8%) for men and 60 to 64 Years (975 | 8.2%) for women.
| Age Bracket | Male | Female |
| Under 5 Years | 671 (5.7%) | 503 (4.2%) |
| 5 to 9 Years | 636 (5.4%) | 453 (3.8%) |
| 10 to 14 Years | 849 (7.2%) | 961 (8.1%) |
| 15 to 19 Years | 754 (6.4%) | 692 (5.8%) |
| 20 to 24 Years | 688 (5.8%) | 519 (4.4%) |
| 25 to 29 Years | 760 (6.5%) | 912 (7.7%) |
| 30 to 34 Years | 1,044 (8.8%) | 907 (7.6%) |
| 35 to 39 Years | 773 (6.6%) | 643 (5.4%) |
| 40 to 44 Years | 634 (5.4%) | 849 (7.2%) |
| 45 to 49 Years | 504 (4.3%) | 450 (3.8%) |
| 50 to 54 Years | 866 (7.3%) | 589 (5.0%) |
| 55 to 59 Years | 659 (5.6%) | 747 (6.3%) |
| 60 to 64 Years | 802 (6.8%) | 975 (8.2%) |
| 65 to 69 Years | 724 (6.1%) | 635 (5.3%) |
| 70 to 74 Years | 370 (3.1%) | 434 (3.7%) |
| 75 to 79 Years | 418 (3.5%) | 483 (4.1%) |
| 80 to 84 Years | 243 (2.1%) | 365 (3.1%) |
| 85 Years and over | 397 (3.4%) | 748 (6.3%) |
| Total | 11,792 (100.0%) | 11,865 (100.0%) |
Families and Households in Roseburg
Median Family Size in Roseburg
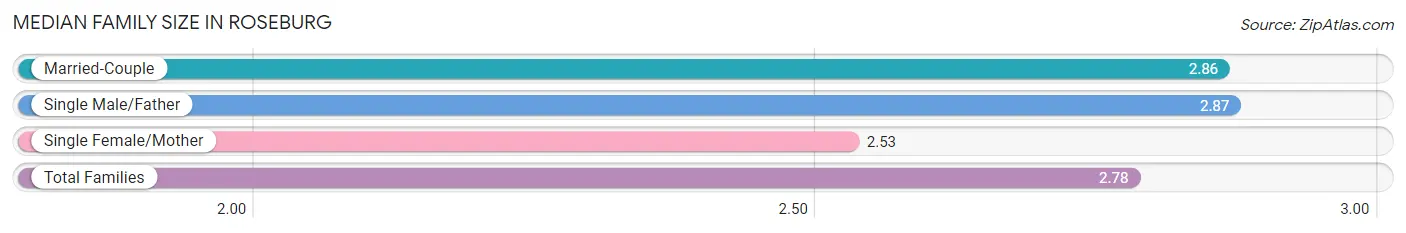
The median family size in Roseburg is 2.78 persons per family, with single male/father families (686 | 12.1%) accounting for the largest median family size of 2.87 persons per family. On the other hand, single female/mother families (1,275 | 22.5%) represent the smallest median family size with 2.53 persons per family.
| Family Type | # Families | Family Size |
| Married-Couple | 3,698 (65.3%) | 2.86 |
| Single Male/Father | 686 (12.1%) | 2.87 |
| Single Female/Mother | 1,275 (22.5%) | 2.53 |
| Total Families | 5,659 (100.0%) | 2.78 |
Median Household Size in Roseburg
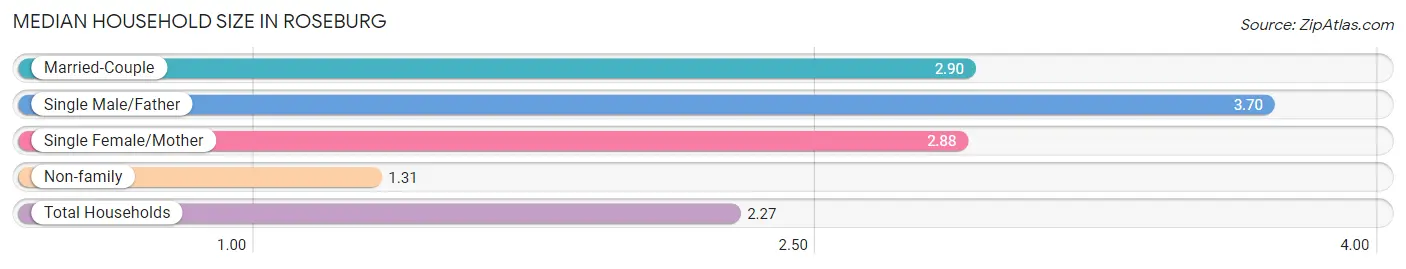
The median household size in Roseburg is 2.27 persons per household, with single male/father households (686 | 6.9%) accounting for the largest median household size of 3.7 persons per household. non-family households (4,295 | 43.1%) represent the smallest median household size with 1.31 persons per household.
| Household Type | # Households | Household Size |
| Married-Couple | 3,698 (37.1%) | 2.90 |
| Single Male/Father | 686 (6.9%) | 3.70 |
| Single Female/Mother | 1,275 (12.8%) | 2.88 |
| Non-family | 4,295 (43.1%) | 1.31 |
| Total Households | 9,954 (100.0%) | 2.27 |
Household Size by Marriage Status in Roseburg
Out of a total of 9,954 households in Roseburg, 5,659 (56.9%) are family households, while 4,295 (43.1%) are nonfamily households. The most numerous type of family households are 2-person households, comprising 2,839, and the most common type of nonfamily households are 1-person households, comprising 3,402.
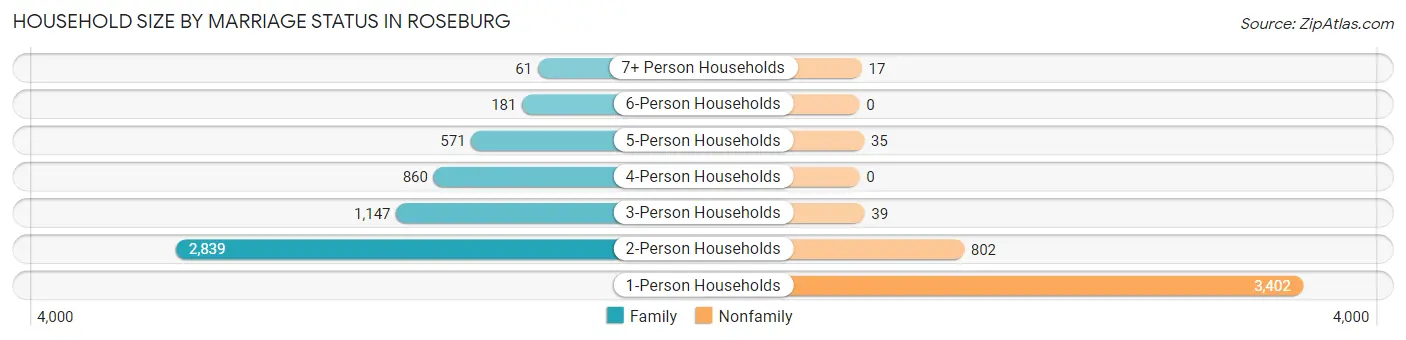
| Household Size | Family Households | Nonfamily Households |
| 1-Person Households | - | 3,402 (34.2%) |
| 2-Person Households | 2,839 (28.5%) | 802 (8.1%) |
| 3-Person Households | 1,147 (11.5%) | 39 (0.4%) |
| 4-Person Households | 860 (8.6%) | 0 (0.0%) |
| 5-Person Households | 571 (5.7%) | 35 (0.4%) |
| 6-Person Households | 181 (1.8%) | 0 (0.0%) |
| 7+ Person Households | 61 (0.6%) | 17 (0.2%) |
| Total | 5,659 (56.9%) | 4,295 (43.1%) |
Female Fertility in Roseburg
Fertility by Age in Roseburg
Average fertility rate in Roseburg is 31.0 births per 1,000 women. Women in the age bracket of 20 to 34 years have the highest fertility rate with 59.0 births per 1,000 women. Women in the age bracket of 20 to 34 years acount for 87.3% of all women with births.
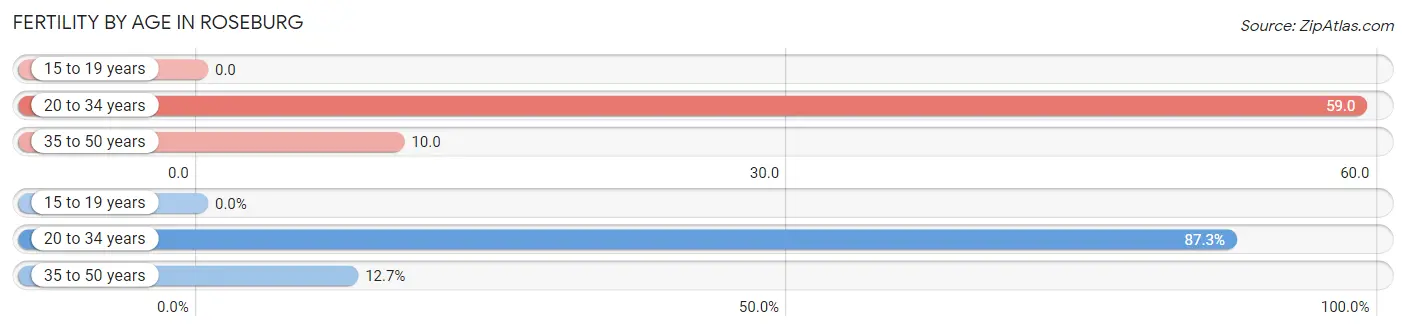
| Age Bracket | Women with Births | Births / 1,000 Women |
| 15 to 19 years | 0 (0.0%) | 0.0 |
| 20 to 34 years | 137 (87.3%) | 59.0 |
| 35 to 50 years | 20 (12.7%) | 10.0 |
| Total | 157 (100.0%) | 31.0 |
Fertility by Age by Marriage Status in Roseburg
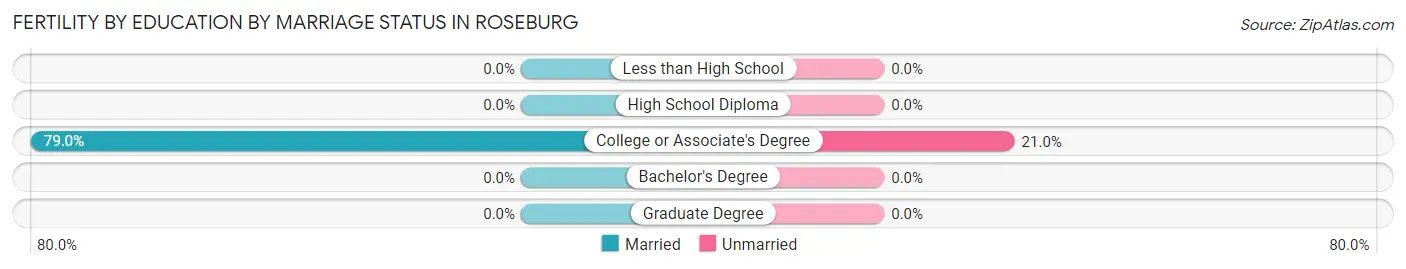
79.0% of women with births (157) in Roseburg are married. The highest percentage of unmarried women with births falls into 20 to 34 years age bracket with 24.1% of them unmarried at the time of birth, while the lowest percentage of unmarried women with births belong to 35 to 50 years age bracket with 0.0% of them unmarried.
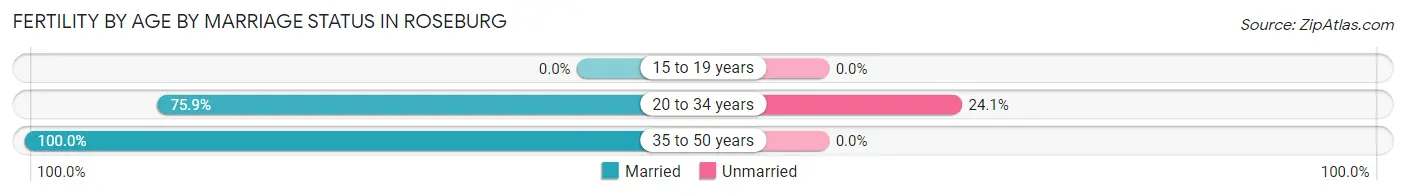
| Age Bracket | Married | Unmarried |
| 15 to 19 years | 0 (0.0%) | 0 (0.0%) |
| 20 to 34 years | 104 (75.9%) | 33 (24.1%) |
| 35 to 50 years | 20 (100.0%) | 0 (0.0%) |
| Total | 124 (79.0%) | 33 (21.0%) |
Fertility by Education in Roseburg
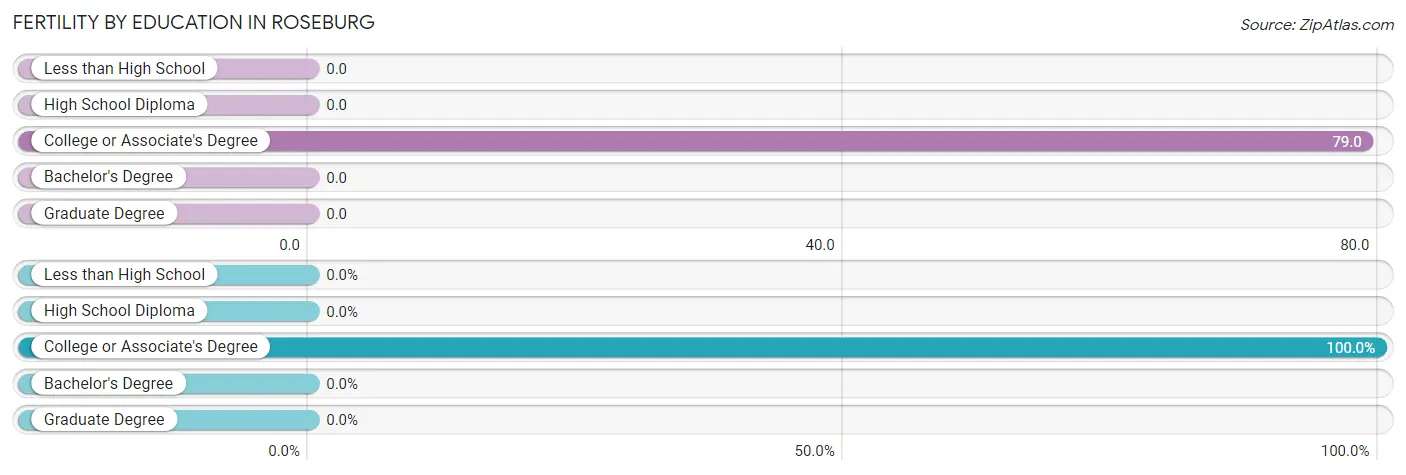
| Educational Attainment | Women with Births | Births / 1,000 Women |
| Less than High School | 0 (0.0%) | 0.0 |
| High School Diploma | 0 (0.0%) | 0.0 |
| College or Associate's Degree | 157 (100.0%) | 79.0 |
| Bachelor's Degree | 0 (0.0%) | 0.0 |
| Graduate Degree | 0 (0.0%) | 0.0 |
| Total | 157 (100.0%) | 31.0 |
Fertility by Education by Marriage Status in Roseburg
21.0% of women with births in Roseburg are unmarried. Women with the educational attainment of college or associate's degree are most likely to be married with 79.0% of them married at childbirth, while women with the educational attainment of college or associate's degree are least likely to be married with 21.0% of them unmarried at childbirth.
| Educational Attainment | Married | Unmarried |
| Less than High School | 0 (0.0%) | 0 (0.0%) |
| High School Diploma | 0 (0.0%) | 0 (0.0%) |
| College or Associate's Degree | 124 (79.0%) | 33 (21.0%) |
| Bachelor's Degree | 0 (0.0%) | 0 (0.0%) |
| Graduate Degree | 0 (0.0%) | 0 (0.0%) |
| Total | 124 (79.0%) | 33 (21.0%) |
Employment Characteristics in Roseburg
Employment by Class of Employer in Roseburg
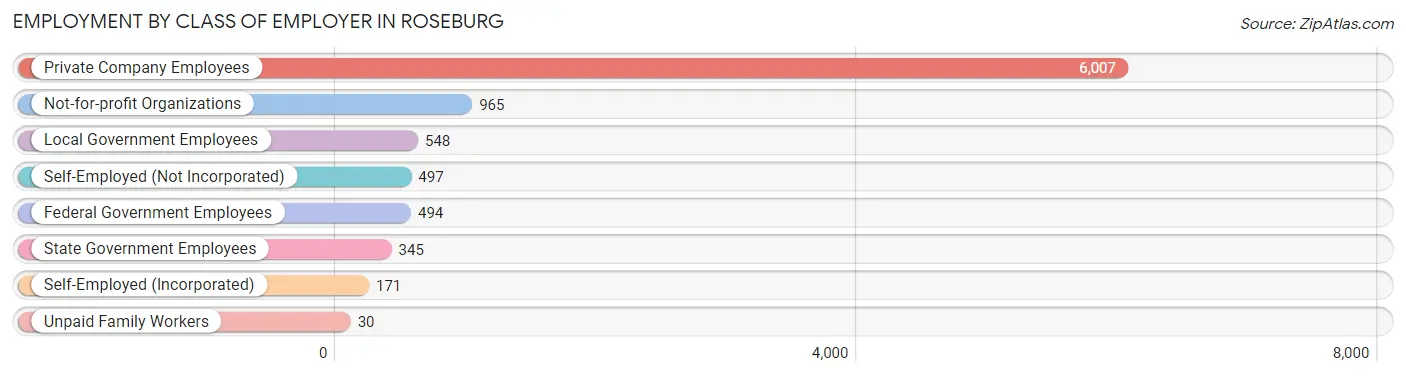
Among the 9,057 employed individuals in Roseburg, private company employees (6,007 | 66.3%), not-for-profit organizations (965 | 10.6%), and local government employees (548 | 6.0%) make up the most common classes of employment.
| Employer Class | # Employees | % Employees |
| Private Company Employees | 6,007 | 66.3% |
| Self-Employed (Incorporated) | 171 | 1.9% |
| Self-Employed (Not Incorporated) | 497 | 5.5% |
| Not-for-profit Organizations | 965 | 10.6% |
| Local Government Employees | 548 | 6.0% |
| State Government Employees | 345 | 3.8% |
| Federal Government Employees | 494 | 5.4% |
| Unpaid Family Workers | 30 | 0.3% |
| Total | 9,057 | 100.0% |
Employment Status by Age in Roseburg
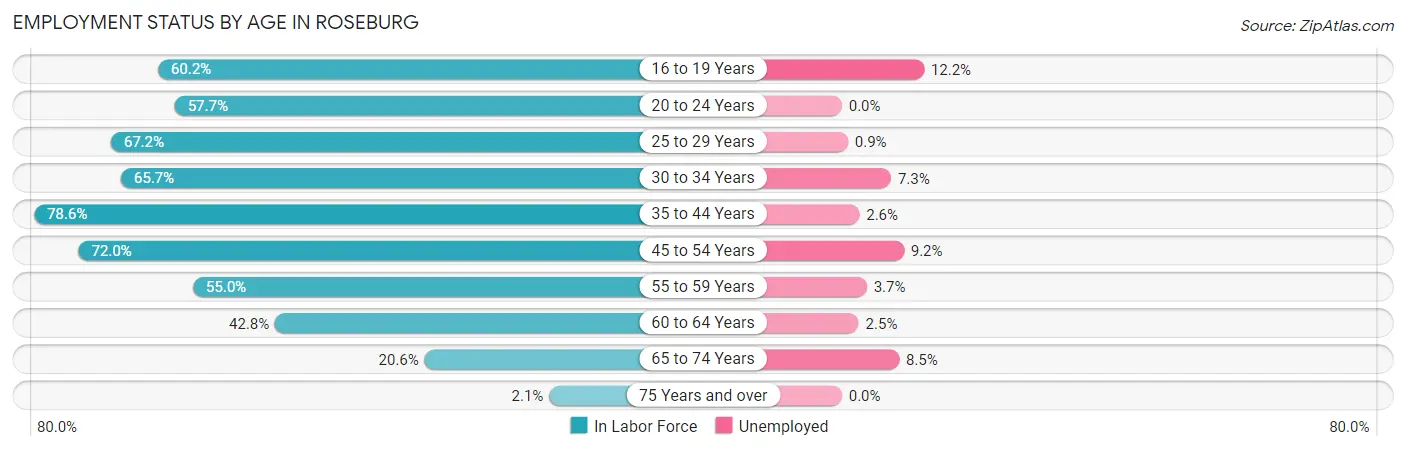
According to the labor force statistics for Roseburg, out of the total population over 16 years of age (19,254), 51.0% or 9,820 individuals are in the labor force, with 5.0% or 491 of them unemployed. The age group with the highest labor force participation rate is 35 to 44 years, with 78.6% or 2,279 individuals in the labor force. Within the labor force, the 16 to 19 years age range has the highest percentage of unemployed individuals, with 12.2% or 82 of them being unemployed.
| Age Bracket | In Labor Force | Unemployed |
| 16 to 19 Years | 672 (60.2%) | 82 (12.2%) |
| 20 to 24 Years | 696 (57.7%) | 0 (0.0%) |
| 25 to 29 Years | 1,124 (67.2%) | 10 (0.9%) |
| 30 to 34 Years | 1,282 (65.7%) | 94 (7.3%) |
| 35 to 44 Years | 2,279 (78.6%) | 59 (2.6%) |
| 45 to 54 Years | 1,734 (72.0%) | 160 (9.2%) |
| 55 to 59 Years | 773 (55.0%) | 29 (3.7%) |
| 60 to 64 Years | 761 (42.8%) | 19 (2.5%) |
| 65 to 74 Years | 446 (20.6%) | 38 (8.5%) |
| 75 Years and over | 56 (2.1%) | 0 (0.0%) |
| Total | 9,820 (51.0%) | 491 (5.0%) |
Employment Status by Educational Attainment in Roseburg
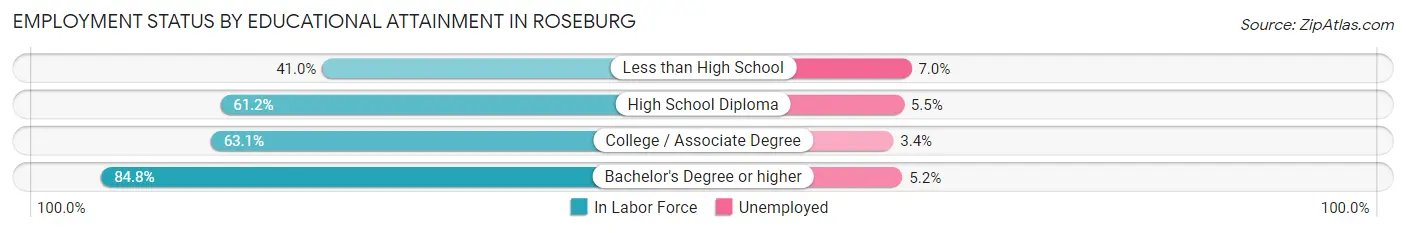
According to labor force statistics for Roseburg, 65.7% of individuals (7,959) out of the total population between 25 and 64 years of age (12,114) are in the labor force, with 4.6% or 366 of them being unemployed. The group with the highest labor force participation rate are those with the educational attainment of bachelor's degree or higher, with 84.8% or 2,113 individuals in the labor force. Within the labor force, individuals with less than high school education have the highest percentage of unemployment, with 7.0% or 21 of them being unemployed.
| Educational Attainment | In Labor Force | Unemployed |
| Less than High School | 299 (41.0%) | 51 (7.0%) |
| High School Diploma | 2,321 (61.2%) | 209 (5.5%) |
| College / Associate Degree | 3,219 (63.1%) | 173 (3.4%) |
| Bachelor's Degree or higher | 2,113 (84.8%) | 130 (5.2%) |
| Total | 7,959 (65.7%) | 557 (4.6%) |
Employment Occupations by Sex in Roseburg
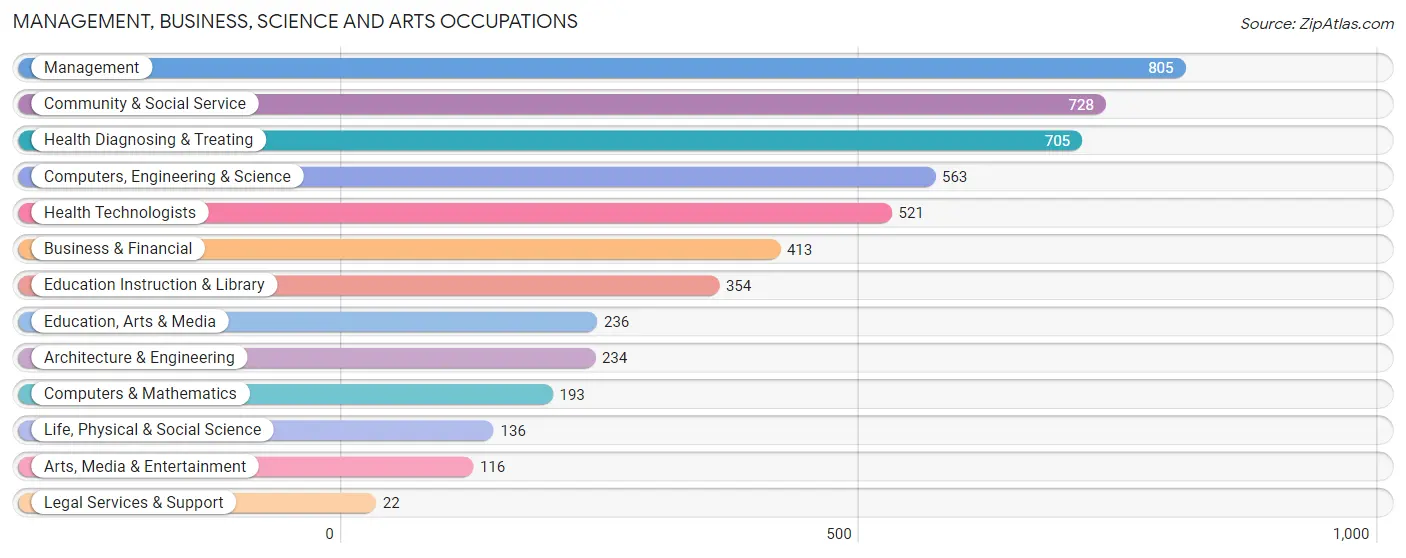
Management, Business, Science and Arts Occupations
The most common Management, Business, Science and Arts occupations in Roseburg are Management (805 | 8.6%), Community & Social Service (728 | 7.8%), Health Diagnosing & Treating (705 | 7.6%), Computers, Engineering & Science (563 | 6.0%), and Health Technologists (521 | 5.6%).
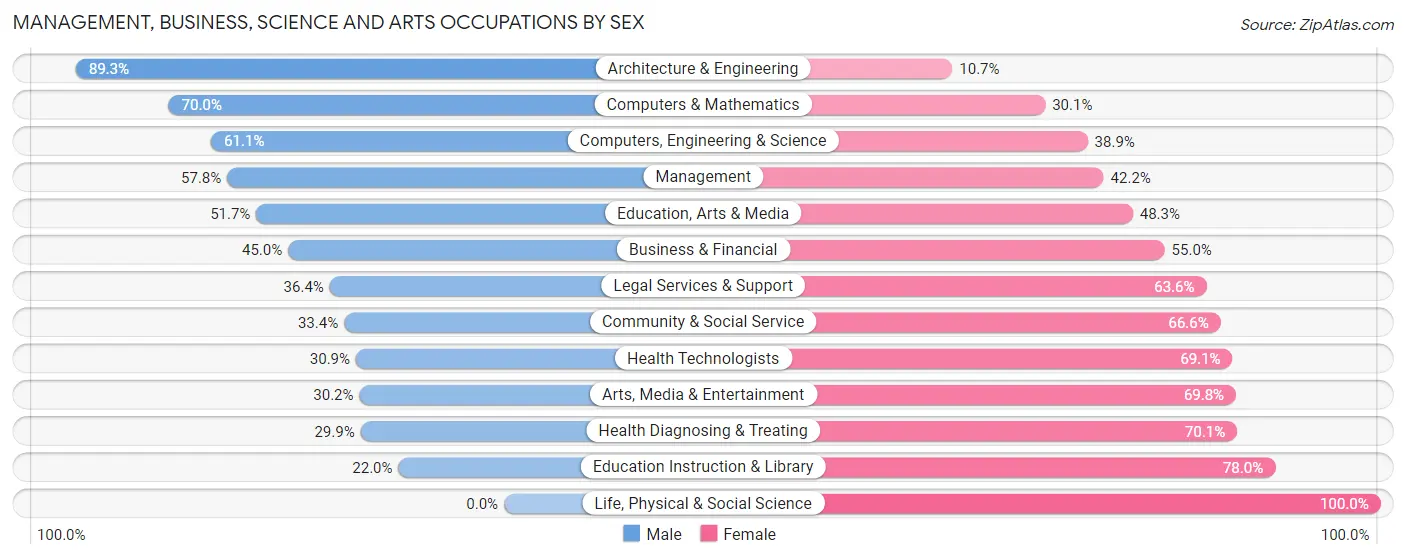
Management, Business, Science and Arts Occupations by Sex
Within the Management, Business, Science and Arts occupations in Roseburg, the most male-oriented occupations are Architecture & Engineering (89.3%), Computers & Mathematics (70.0%), and Computers, Engineering & Science (61.1%), while the most female-oriented occupations are Life, Physical & Social Science (100.0%), Education Instruction & Library (78.0%), and Health Diagnosing & Treating (70.1%).
| Occupation | Male | Female |
| Management | 465 (57.8%) | 340 (42.2%) |
| Business & Financial | 186 (45.0%) | 227 (55.0%) |
| Computers, Engineering & Science | 344 (61.1%) | 219 (38.9%) |
| Computers & Mathematics | 135 (70.0%) | 58 (30.0%) |
| Architecture & Engineering | 209 (89.3%) | 25 (10.7%) |
| Life, Physical & Social Science | 0 (0.0%) | 136 (100.0%) |
| Community & Social Service | 243 (33.4%) | 485 (66.6%) |
| Education, Arts & Media | 122 (51.7%) | 114 (48.3%) |
| Legal Services & Support | 8 (36.4%) | 14 (63.6%) |
| Education Instruction & Library | 78 (22.0%) | 276 (78.0%) |
| Arts, Media & Entertainment | 35 (30.2%) | 81 (69.8%) |
| Health Diagnosing & Treating | 211 (29.9%) | 494 (70.1%) |
| Health Technologists | 161 (30.9%) | 360 (69.1%) |
| Total (Category) | 1,449 (45.1%) | 1,765 (54.9%) |
| Total (Overall) | 4,705 (50.5%) | 4,619 (49.5%) |
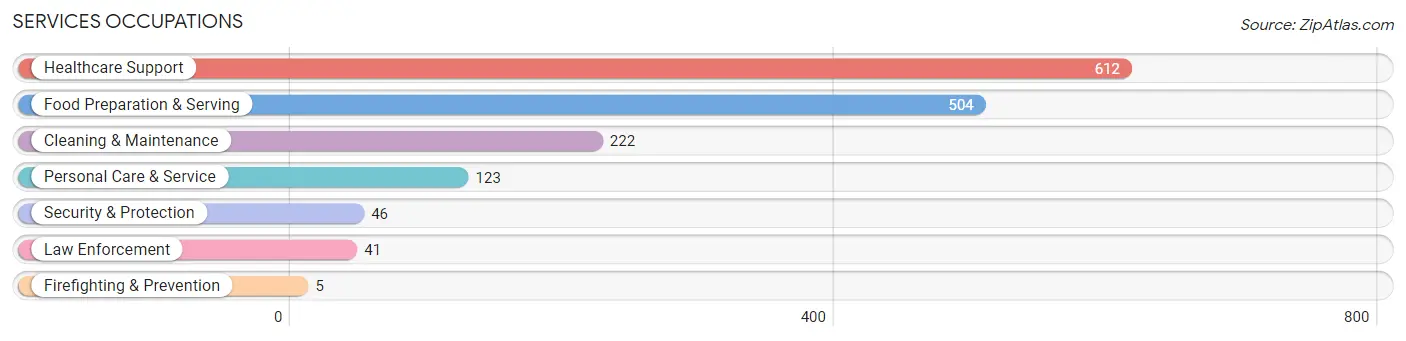
Services Occupations
The most common Services occupations in Roseburg are Healthcare Support (612 | 6.6%), Food Preparation & Serving (504 | 5.4%), Cleaning & Maintenance (222 | 2.4%), Personal Care & Service (123 | 1.3%), and Security & Protection (46 | 0.5%).
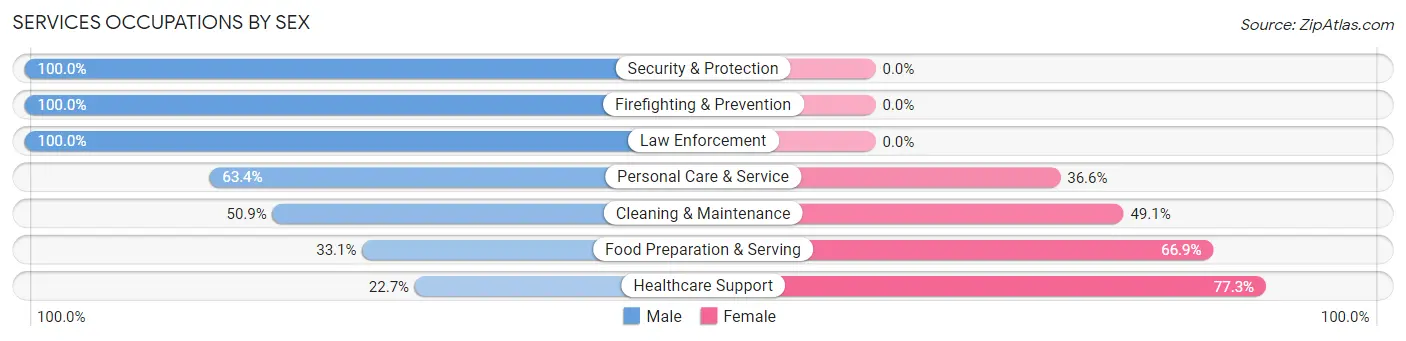
Services Occupations by Sex
Within the Services occupations in Roseburg, the most male-oriented occupations are Security & Protection (100.0%), Firefighting & Prevention (100.0%), and Law Enforcement (100.0%), while the most female-oriented occupations are Healthcare Support (77.3%), Food Preparation & Serving (66.9%), and Cleaning & Maintenance (49.1%).
| Occupation | Male | Female |
| Healthcare Support | 139 (22.7%) | 473 (77.3%) |
| Security & Protection | 46 (100.0%) | 0 (0.0%) |
| Firefighting & Prevention | 5 (100.0%) | 0 (0.0%) |
| Law Enforcement | 41 (100.0%) | 0 (0.0%) |
| Food Preparation & Serving | 167 (33.1%) | 337 (66.9%) |
| Cleaning & Maintenance | 113 (50.9%) | 109 (49.1%) |
| Personal Care & Service | 78 (63.4%) | 45 (36.6%) |
| Total (Category) | 543 (36.0%) | 964 (64.0%) |
| Total (Overall) | 4,705 (50.5%) | 4,619 (49.5%) |
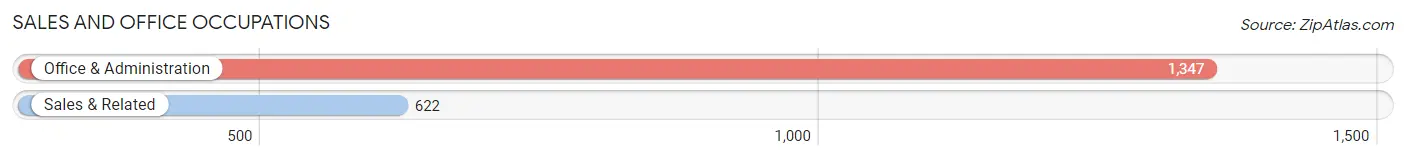
Sales and Office Occupations
The most common Sales and Office occupations in Roseburg are Office & Administration (1,347 | 14.4%), and Sales & Related (622 | 6.7%).
Sales and Office Occupations by Sex
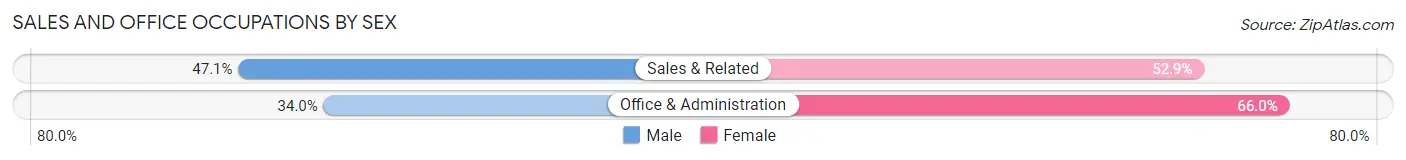
| Occupation | Male | Female |
| Sales & Related | 293 (47.1%) | 329 (52.9%) |
| Office & Administration | 458 (34.0%) | 889 (66.0%) |
| Total (Category) | 751 (38.1%) | 1,218 (61.9%) |
| Total (Overall) | 4,705 (50.5%) | 4,619 (49.5%) |
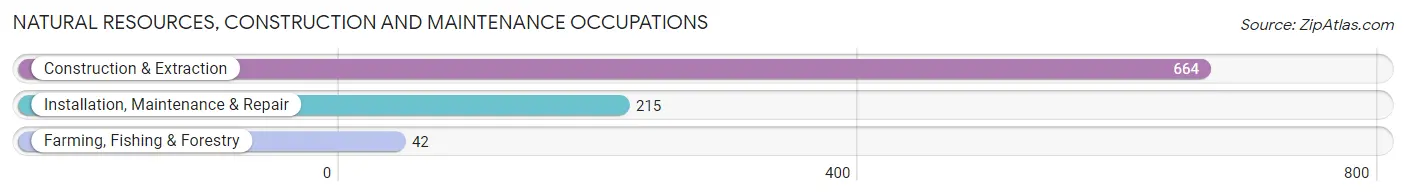
Natural Resources, Construction and Maintenance Occupations
The most common Natural Resources, Construction and Maintenance occupations in Roseburg are Construction & Extraction (664 | 7.1%), Installation, Maintenance & Repair (215 | 2.3%), and Farming, Fishing & Forestry (42 | 0.4%).
Natural Resources, Construction and Maintenance Occupations by Sex
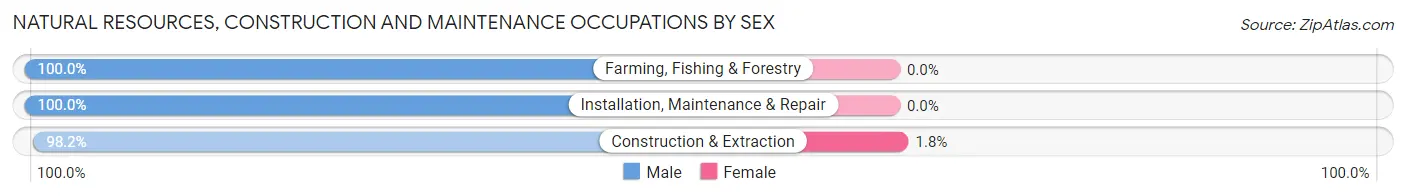
| Occupation | Male | Female |
| Farming, Fishing & Forestry | 42 (100.0%) | 0 (0.0%) |
| Construction & Extraction | 652 (98.2%) | 12 (1.8%) |
| Installation, Maintenance & Repair | 215 (100.0%) | 0 (0.0%) |
| Total (Category) | 909 (98.7%) | 12 (1.3%) |
| Total (Overall) | 4,705 (50.5%) | 4,619 (49.5%) |
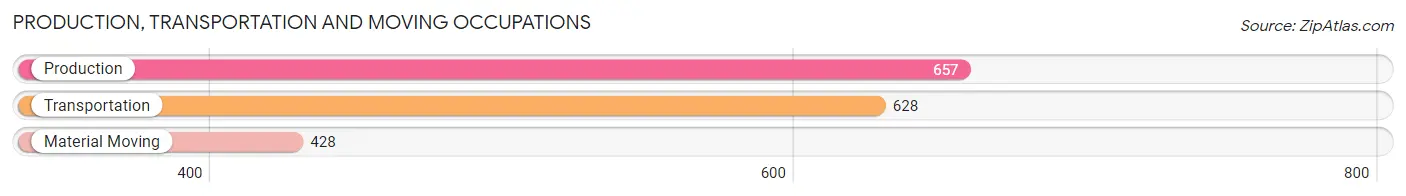
Production, Transportation and Moving Occupations
The most common Production, Transportation and Moving occupations in Roseburg are Production (657 | 7.0%), Transportation (628 | 6.7%), and Material Moving (428 | 4.6%).
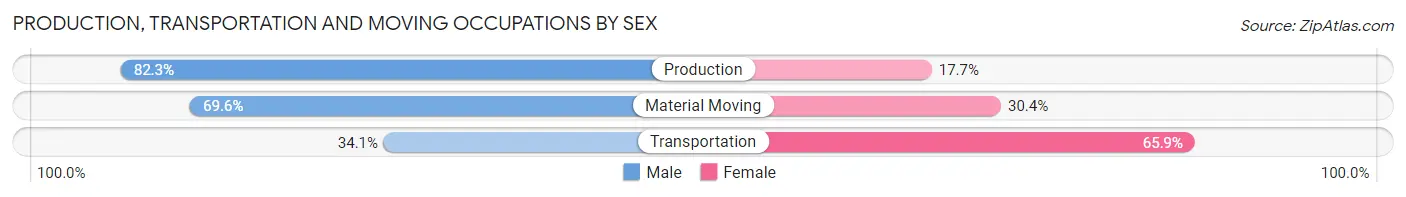
Production, Transportation and Moving Occupations by Sex
| Occupation | Male | Female |
| Production | 541 (82.3%) | 116 (17.7%) |
| Transportation | 214 (34.1%) | 414 (65.9%) |
| Material Moving | 298 (69.6%) | 130 (30.4%) |
| Total (Category) | 1,053 (61.5%) | 660 (38.5%) |
| Total (Overall) | 4,705 (50.5%) | 4,619 (49.5%) |
Employment Industries by Sex in Roseburg
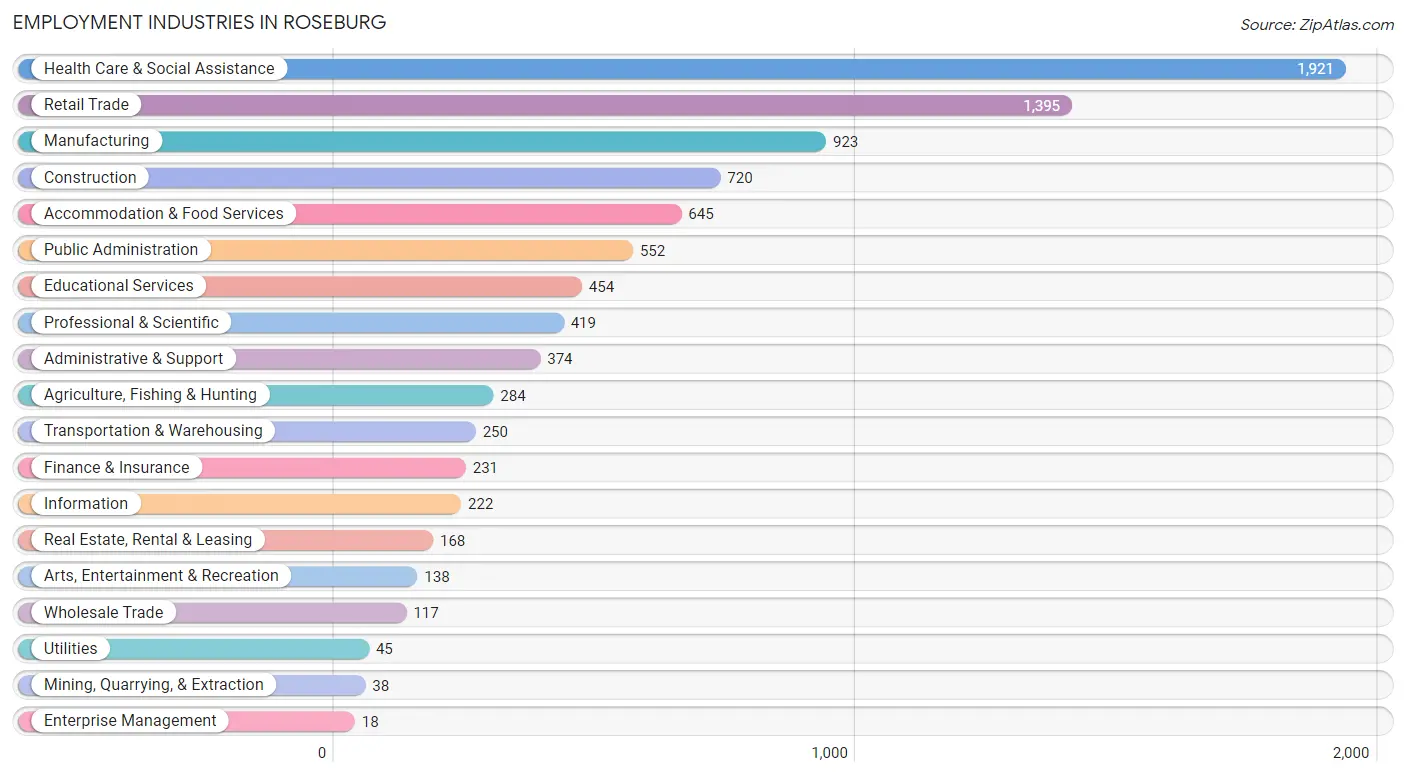
Employment Industries in Roseburg
The major employment industries in Roseburg include Health Care & Social Assistance (1,921 | 20.6%), Retail Trade (1,395 | 15.0%), Manufacturing (923 | 9.9%), Construction (720 | 7.7%), and Accommodation & Food Services (645 | 6.9%).
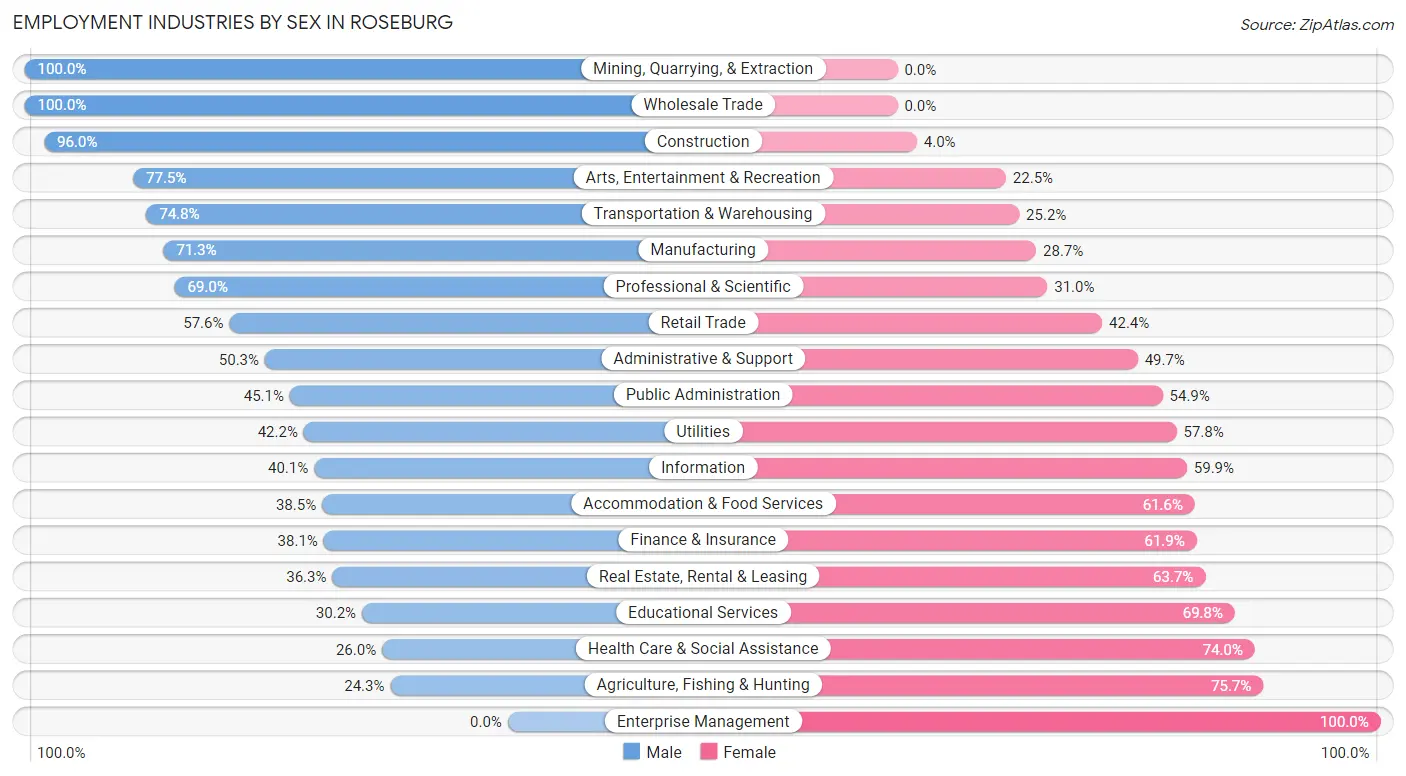
Employment Industries by Sex in Roseburg
The Roseburg industries that see more men than women are Mining, Quarrying, & Extraction (100.0%), Wholesale Trade (100.0%), and Construction (96.0%), whereas the industries that tend to have a higher number of women are Enterprise Management (100.0%), Agriculture, Fishing & Hunting (75.7%), and Health Care & Social Assistance (74.0%).
| Industry | Male | Female |
| Agriculture, Fishing & Hunting | 69 (24.3%) | 215 (75.7%) |
| Mining, Quarrying, & Extraction | 38 (100.0%) | 0 (0.0%) |
| Construction | 691 (96.0%) | 29 (4.0%) |
| Manufacturing | 658 (71.3%) | 265 (28.7%) |
| Wholesale Trade | 117 (100.0%) | 0 (0.0%) |
| Retail Trade | 804 (57.6%) | 591 (42.4%) |
| Transportation & Warehousing | 187 (74.8%) | 63 (25.2%) |
| Utilities | 19 (42.2%) | 26 (57.8%) |
| Information | 89 (40.1%) | 133 (59.9%) |
| Finance & Insurance | 88 (38.1%) | 143 (61.9%) |
| Real Estate, Rental & Leasing | 61 (36.3%) | 107 (63.7%) |
| Professional & Scientific | 289 (69.0%) | 130 (31.0%) |
| Enterprise Management | 0 (0.0%) | 18 (100.0%) |
| Administrative & Support | 188 (50.3%) | 186 (49.7%) |
| Educational Services | 137 (30.2%) | 317 (69.8%) |
| Health Care & Social Assistance | 500 (26.0%) | 1,421 (74.0%) |
| Arts, Entertainment & Recreation | 107 (77.5%) | 31 (22.5%) |
| Accommodation & Food Services | 248 (38.5%) | 397 (61.6%) |
| Public Administration | 249 (45.1%) | 303 (54.9%) |
| Total | 4,705 (50.5%) | 4,619 (49.5%) |
Education in Roseburg
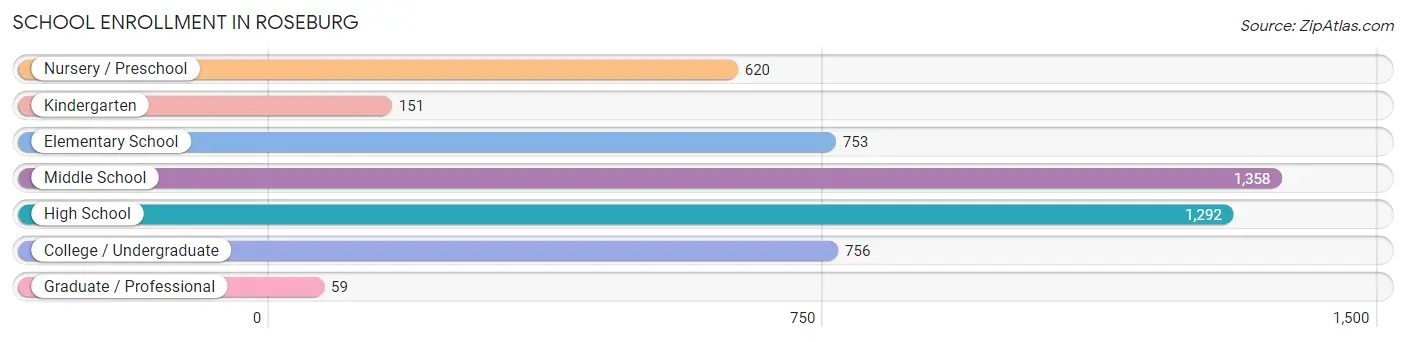
School Enrollment in Roseburg
The most common levels of schooling among the 4,989 students in Roseburg are middle school (1,358 | 27.2%), high school (1,292 | 25.9%), and college / undergraduate (756 | 15.1%).
| School Level | # Students | % Students |
| Nursery / Preschool | 620 | 12.4% |
| Kindergarten | 151 | 3.0% |
| Elementary School | 753 | 15.1% |
| Middle School | 1,358 | 27.2% |
| High School | 1,292 | 25.9% |
| College / Undergraduate | 756 | 15.1% |
| Graduate / Professional | 59 | 1.2% |
| Total | 4,989 | 100.0% |
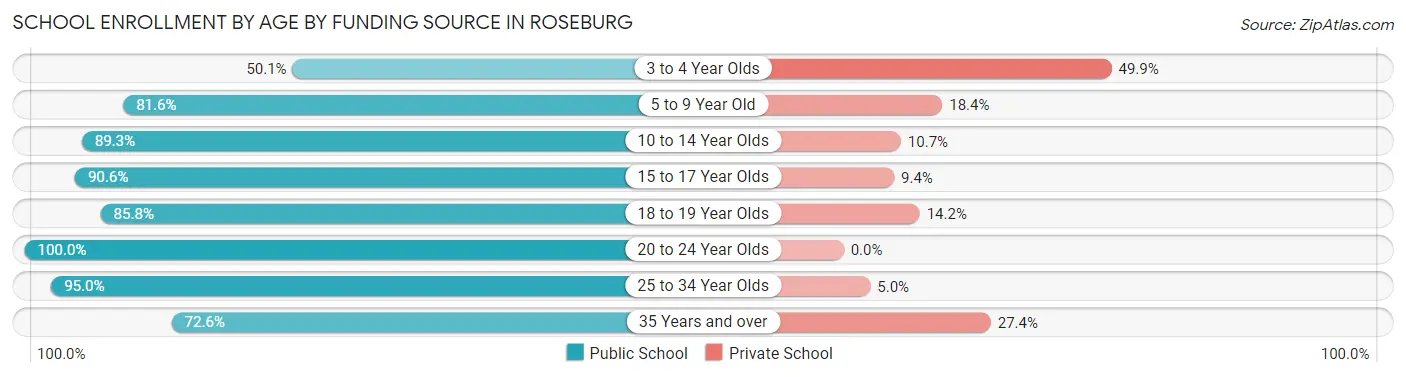
School Enrollment by Age by Funding Source in Roseburg
Out of a total of 4,989 students who are enrolled in schools in Roseburg, 758 (15.2%) attend a private institution, while the remaining 4,231 (84.8%) are enrolled in public schools. The age group of 3 to 4 year olds has the highest likelihood of being enrolled in private schools, with 231 (49.9% in the age bracket) enrolled. Conversely, the age group of 20 to 24 year olds has the lowest likelihood of being enrolled in a private school, with 298 (100.0% in the age bracket) attending a public institution.
| Age Bracket | Public School | Private School |
| 3 to 4 Year Olds | 232 (50.1%) | 231 (49.9%) |
| 5 to 9 Year Old | 769 (81.6%) | 173 (18.4%) |
| 10 to 14 Year Olds | 1,534 (89.3%) | 183 (10.7%) |
| 15 to 17 Year Olds | 762 (90.6%) | 79 (9.4%) |
| 18 to 19 Year Olds | 206 (85.8%) | 34 (14.2%) |
| 20 to 24 Year Olds | 298 (100.0%) | 0 (0.0%) |
| 25 to 34 Year Olds | 325 (95.0%) | 17 (5.0%) |
| 35 Years and over | 106 (72.6%) | 40 (27.4%) |
| Total | 4,231 (84.8%) | 758 (15.2%) |
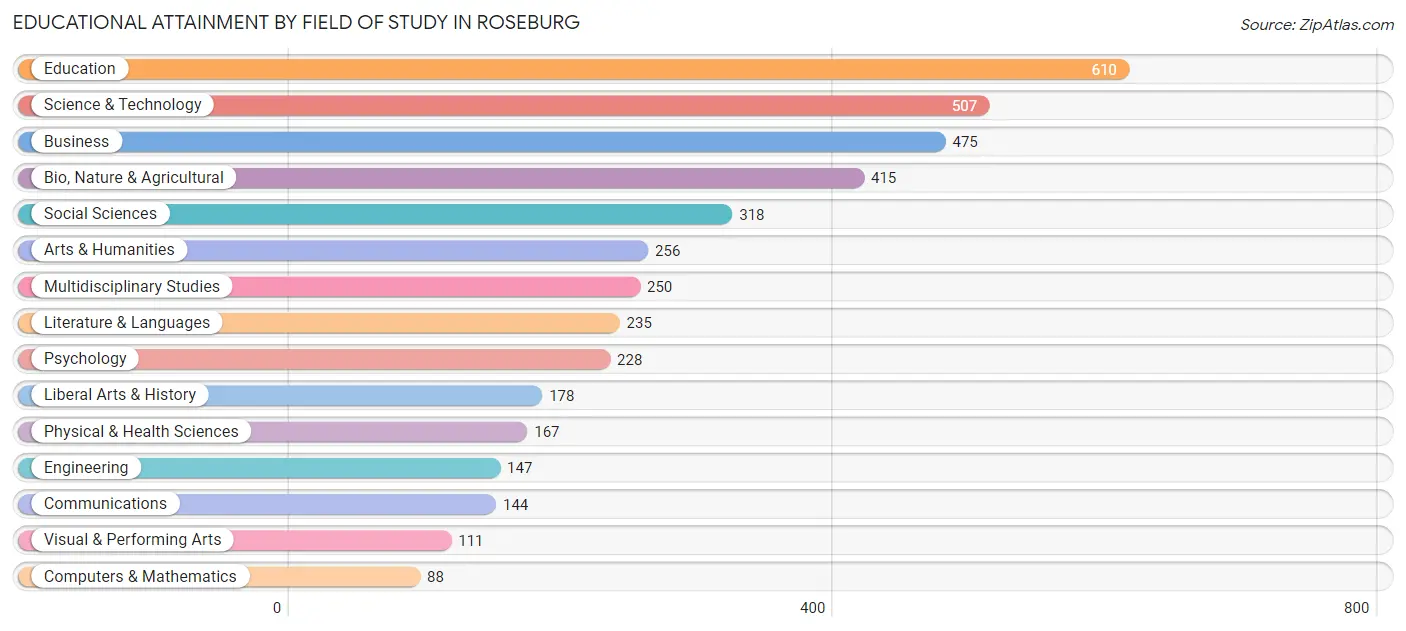
Educational Attainment by Field of Study in Roseburg
Education (610 | 14.8%), science & technology (507 | 12.3%), business (475 | 11.5%), bio, nature & agricultural (415 | 10.1%), and social sciences (318 | 7.7%) are the most common fields of study among 4,129 individuals in Roseburg who have obtained a bachelor's degree or higher.
| Field of Study | # Graduates | % Graduates |
| Computers & Mathematics | 88 | 2.1% |
| Bio, Nature & Agricultural | 415 | 10.1% |
| Physical & Health Sciences | 167 | 4.0% |
| Psychology | 228 | 5.5% |
| Social Sciences | 318 | 7.7% |
| Engineering | 147 | 3.6% |
| Multidisciplinary Studies | 250 | 6.0% |
| Science & Technology | 507 | 12.3% |
| Business | 475 | 11.5% |
| Education | 610 | 14.8% |
| Literature & Languages | 235 | 5.7% |
| Liberal Arts & History | 178 | 4.3% |
| Visual & Performing Arts | 111 | 2.7% |
| Communications | 144 | 3.5% |
| Arts & Humanities | 256 | 6.2% |
| Total | 4,129 | 100.0% |
Transportation & Commute in Roseburg
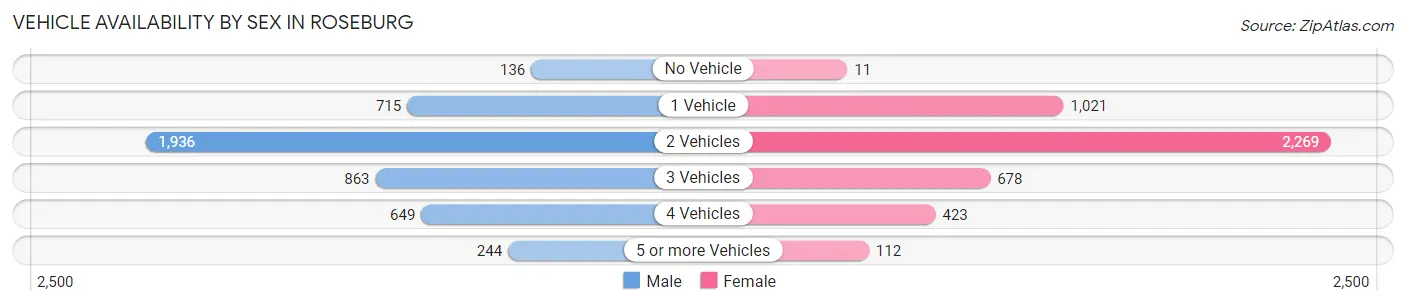
Vehicle Availability by Sex in Roseburg
The most prevalent vehicle ownership categories in Roseburg are males with 2 vehicles (1,936, accounting for 42.6%) and females with 2 vehicles (2,269, making up 42.9%).
| Vehicles Available | Male | Female |
| No Vehicle | 136 (3.0%) | 11 (0.2%) |
| 1 Vehicle | 715 (15.7%) | 1,021 (22.6%) |
| 2 Vehicles | 1,936 (42.6%) | 2,269 (50.3%) |
| 3 Vehicles | 863 (19.0%) | 678 (15.0%) |
| 4 Vehicles | 649 (14.3%) | 423 (9.4%) |
| 5 or more Vehicles | 244 (5.4%) | 112 (2.5%) |
| Total | 4,543 (100.0%) | 4,514 (100.0%) |
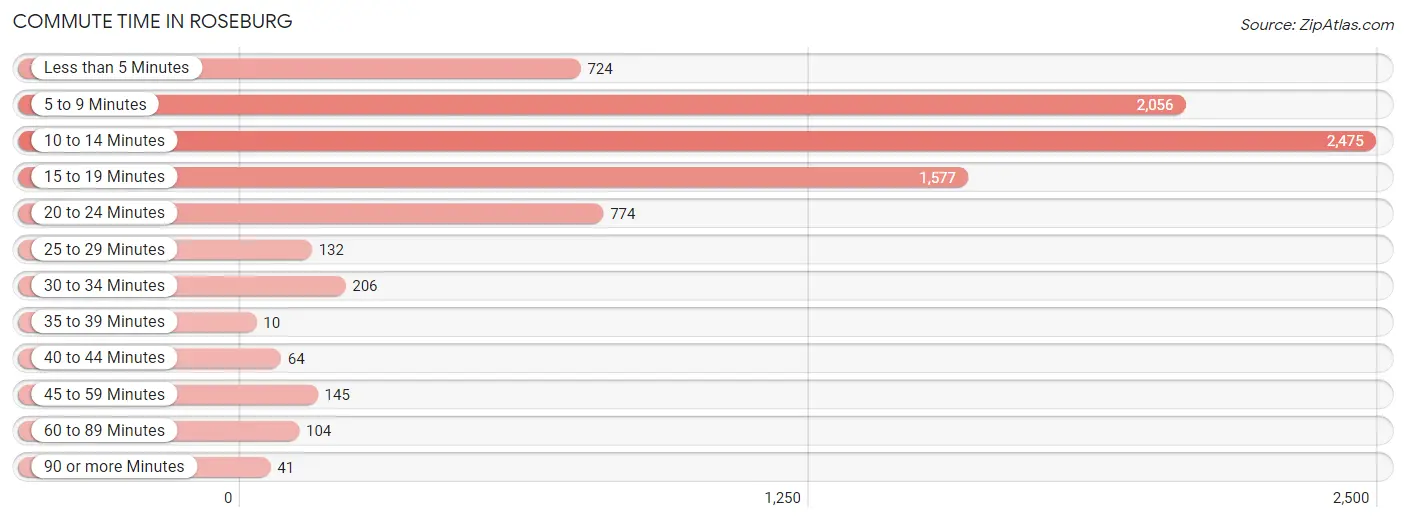
Commute Time in Roseburg
The most frequently occuring commute durations in Roseburg are 10 to 14 minutes (2,475 commuters, 29.8%), 5 to 9 minutes (2,056 commuters, 24.7%), and 15 to 19 minutes (1,577 commuters, 19.0%).
| Commute Time | # Commuters | % Commuters |
| Less than 5 Minutes | 724 | 8.7% |
| 5 to 9 Minutes | 2,056 | 24.7% |
| 10 to 14 Minutes | 2,475 | 29.8% |
| 15 to 19 Minutes | 1,577 | 19.0% |
| 20 to 24 Minutes | 774 | 9.3% |
| 25 to 29 Minutes | 132 | 1.6% |
| 30 to 34 Minutes | 206 | 2.5% |
| 35 to 39 Minutes | 10 | 0.1% |
| 40 to 44 Minutes | 64 | 0.8% |
| 45 to 59 Minutes | 145 | 1.8% |
| 60 to 89 Minutes | 104 | 1.3% |
| 90 or more Minutes | 41 | 0.5% |
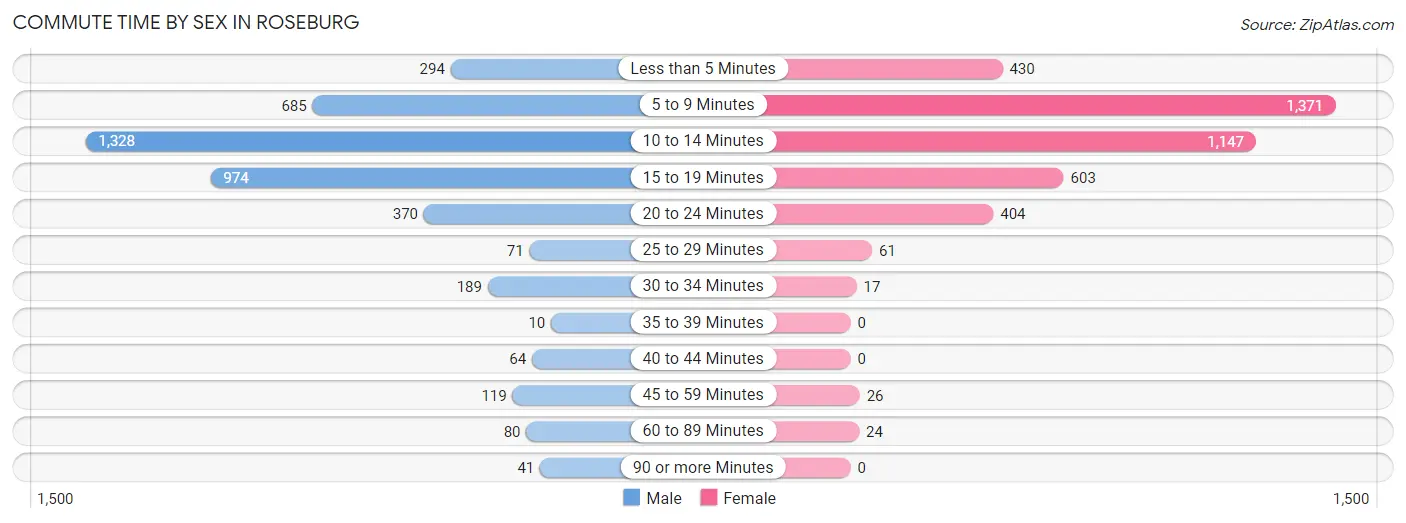
Commute Time by Sex in Roseburg
The most common commute times in Roseburg are 10 to 14 minutes (1,328 commuters, 31.4%) for males and 5 to 9 minutes (1,371 commuters, 33.6%) for females.
| Commute Time | Male | Female |
| Less than 5 Minutes | 294 (7.0%) | 430 (10.5%) |
| 5 to 9 Minutes | 685 (16.2%) | 1,371 (33.6%) |
| 10 to 14 Minutes | 1,328 (31.4%) | 1,147 (28.1%) |
| 15 to 19 Minutes | 974 (23.1%) | 603 (14.8%) |
| 20 to 24 Minutes | 370 (8.8%) | 404 (9.9%) |
| 25 to 29 Minutes | 71 (1.7%) | 61 (1.5%) |
| 30 to 34 Minutes | 189 (4.5%) | 17 (0.4%) |
| 35 to 39 Minutes | 10 (0.2%) | 0 (0.0%) |
| 40 to 44 Minutes | 64 (1.5%) | 0 (0.0%) |
| 45 to 59 Minutes | 119 (2.8%) | 26 (0.6%) |
| 60 to 89 Minutes | 80 (1.9%) | 24 (0.6%) |
| 90 or more Minutes | 41 (1.0%) | 0 (0.0%) |
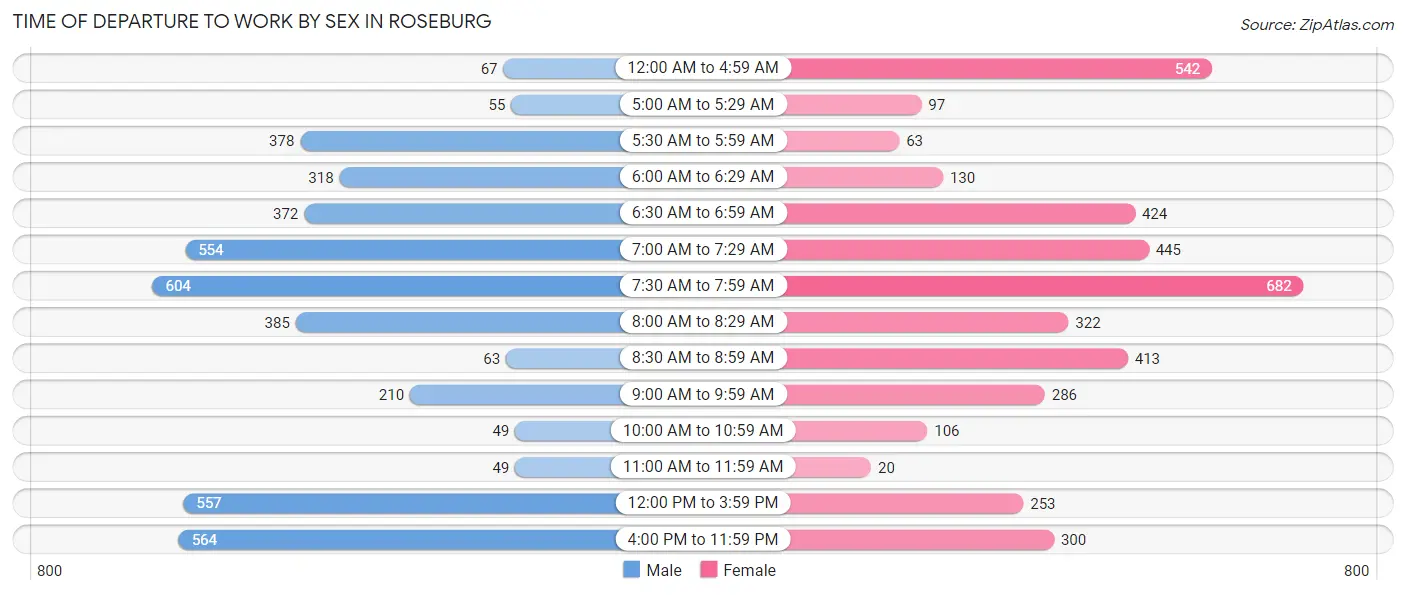
Time of Departure to Work by Sex in Roseburg
The most frequent times of departure to work in Roseburg are 7:30 AM to 7:59 AM (604, 14.3%) for males and 7:30 AM to 7:59 AM (682, 16.7%) for females.
| Time of Departure | Male | Female |
| 12:00 AM to 4:59 AM | 67 (1.6%) | 542 (13.3%) |
| 5:00 AM to 5:29 AM | 55 (1.3%) | 97 (2.4%) |
| 5:30 AM to 5:59 AM | 378 (8.9%) | 63 (1.5%) |
| 6:00 AM to 6:29 AM | 318 (7.5%) | 130 (3.2%) |
| 6:30 AM to 6:59 AM | 372 (8.8%) | 424 (10.4%) |
| 7:00 AM to 7:29 AM | 554 (13.1%) | 445 (10.9%) |
| 7:30 AM to 7:59 AM | 604 (14.3%) | 682 (16.7%) |
| 8:00 AM to 8:29 AM | 385 (9.1%) | 322 (7.9%) |
| 8:30 AM to 8:59 AM | 63 (1.5%) | 413 (10.1%) |
| 9:00 AM to 9:59 AM | 210 (5.0%) | 286 (7.0%) |
| 10:00 AM to 10:59 AM | 49 (1.2%) | 106 (2.6%) |
| 11:00 AM to 11:59 AM | 49 (1.2%) | 20 (0.5%) |
| 12:00 PM to 3:59 PM | 557 (13.2%) | 253 (6.2%) |
| 4:00 PM to 11:59 PM | 564 (13.4%) | 300 (7.3%) |
| Total | 4,225 (100.0%) | 4,083 (100.0%) |
Housing Occupancy in Roseburg
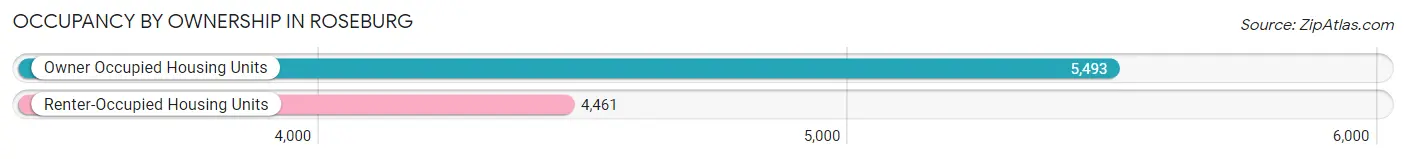
Occupancy by Ownership in Roseburg
Of the total 9,954 dwellings in Roseburg, owner-occupied units account for 5,493 (55.2%), while renter-occupied units make up 4,461 (44.8%).
| Occupancy | # Housing Units | % Housing Units |
| Owner Occupied Housing Units | 5,493 | 55.2% |
| Renter-Occupied Housing Units | 4,461 | 44.8% |
| Total Occupied Housing Units | 9,954 | 100.0% |
Occupancy by Household Size in Roseburg
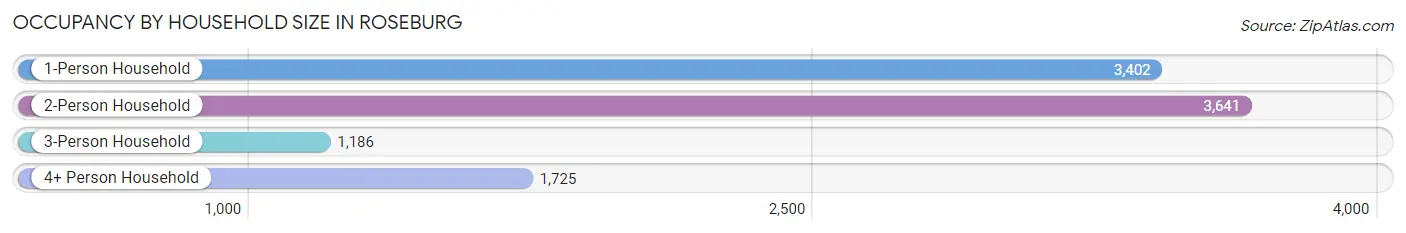
| Household Size | # Housing Units | % Housing Units |
| 1-Person Household | 3,402 | 34.2% |
| 2-Person Household | 3,641 | 36.6% |
| 3-Person Household | 1,186 | 11.9% |
| 4+ Person Household | 1,725 | 17.3% |
| Total Housing Units | 9,954 | 100.0% |
Occupancy by Ownership by Household Size in Roseburg
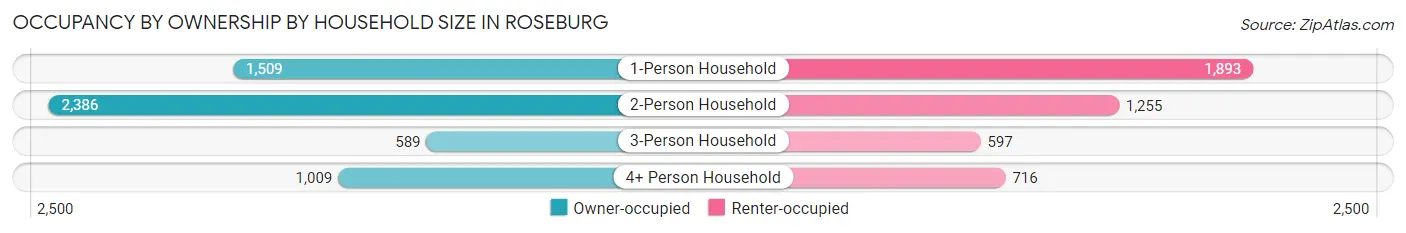
| Household Size | Owner-occupied | Renter-occupied |
| 1-Person Household | 1,509 (44.4%) | 1,893 (55.6%) |
| 2-Person Household | 2,386 (65.5%) | 1,255 (34.5%) |
| 3-Person Household | 589 (49.7%) | 597 (50.3%) |
| 4+ Person Household | 1,009 (58.5%) | 716 (41.5%) |
| Total Housing Units | 5,493 (55.2%) | 4,461 (44.8%) |
Occupancy by Educational Attainment in Roseburg
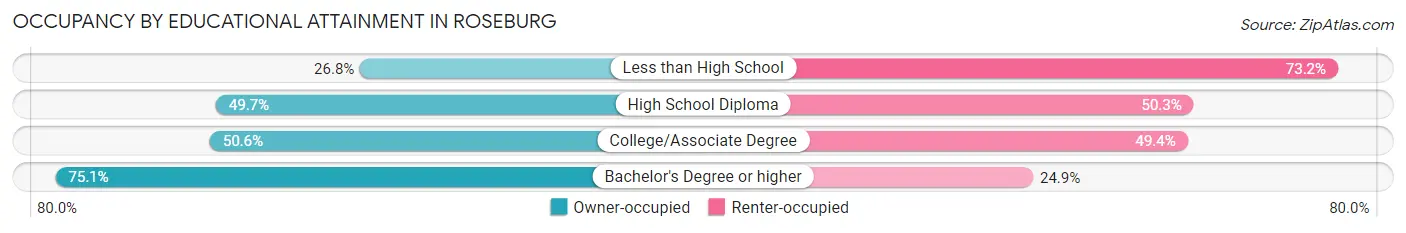
| Household Size | Owner-occupied | Renter-occupied |
| Less than High School | 139 (26.8%) | 380 (73.2%) |
| High School Diploma | 1,375 (49.7%) | 1,394 (50.3%) |
| College/Associate Degree | 2,125 (50.6%) | 2,073 (49.4%) |
| Bachelor's Degree or higher | 1,854 (75.1%) | 614 (24.9%) |
Occupancy by Age of Householder in Roseburg
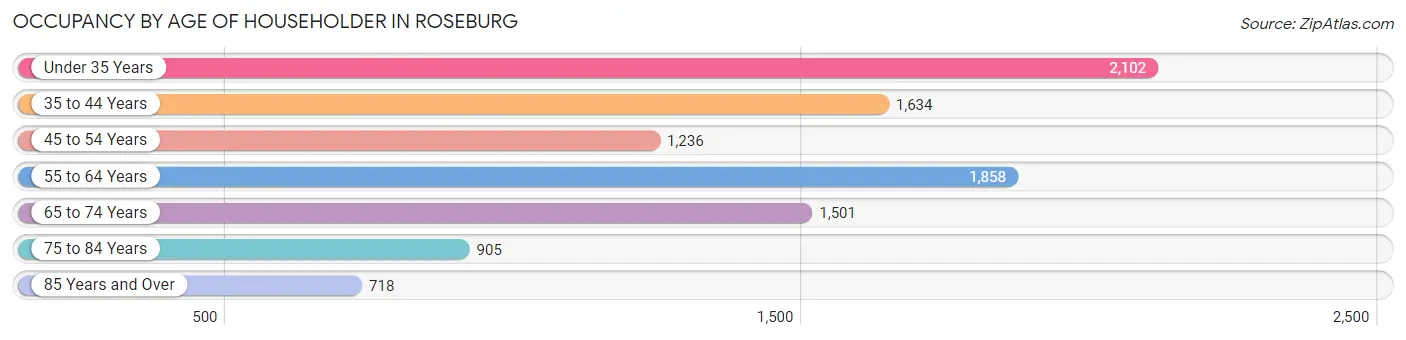
| Age Bracket | # Households | % Households |
| Under 35 Years | 2,102 | 21.1% |
| 35 to 44 Years | 1,634 | 16.4% |
| 45 to 54 Years | 1,236 | 12.4% |
| 55 to 64 Years | 1,858 | 18.7% |
| 65 to 74 Years | 1,501 | 15.1% |
| 75 to 84 Years | 905 | 9.1% |
| 85 Years and Over | 718 | 7.2% |
| Total | 9,954 | 100.0% |
Housing Finances in Roseburg
Median Income by Occupancy in Roseburg
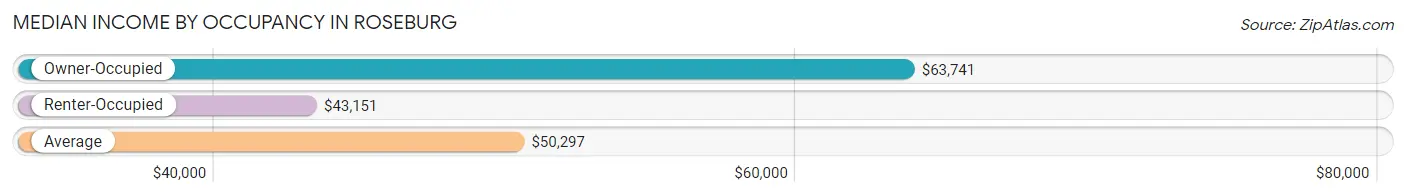
| Occupancy Type | # Households | Median Income |
| Owner-Occupied | 5,493 (55.2%) | $63,741 |
| Renter-Occupied | 4,461 (44.8%) | $43,151 |
| Average | 9,954 (100.0%) | $50,297 |
Occupancy by Householder Income Bracket in Roseburg
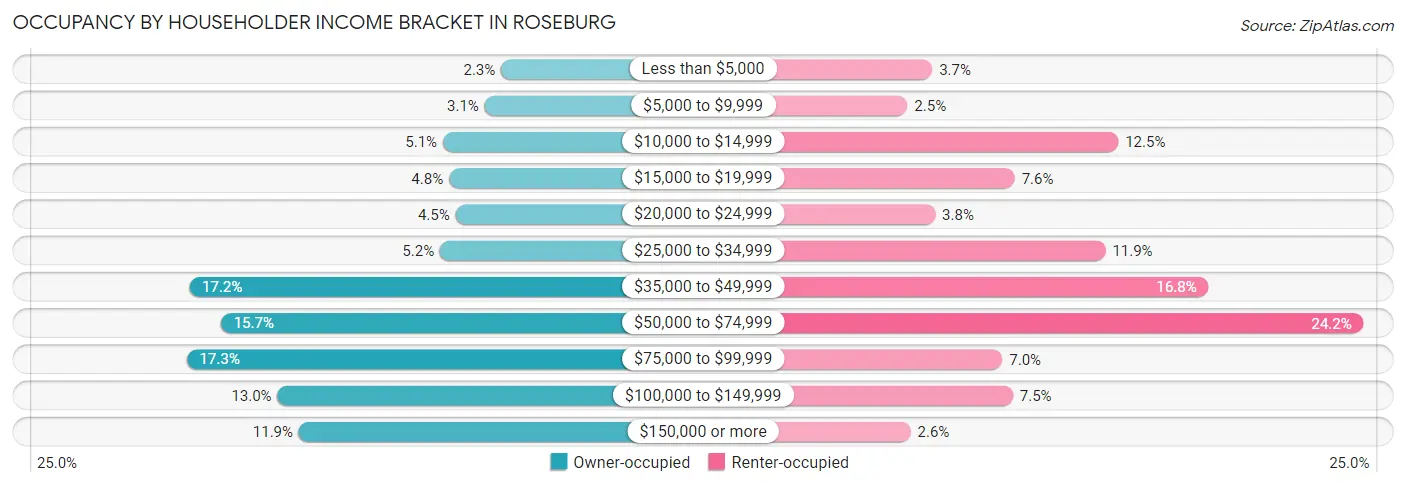
| Income Bracket | Owner-occupied | Renter-occupied |
| Less than $5,000 | 127 (2.3%) | 163 (3.6%) |
| $5,000 to $9,999 | 170 (3.1%) | 110 (2.5%) |
| $10,000 to $14,999 | 279 (5.1%) | 558 (12.5%) |
| $15,000 to $19,999 | 263 (4.8%) | 338 (7.6%) |
| $20,000 to $24,999 | 246 (4.5%) | 169 (3.8%) |
| $25,000 to $34,999 | 287 (5.2%) | 531 (11.9%) |
| $35,000 to $49,999 | 943 (17.2%) | 750 (16.8%) |
| $50,000 to $74,999 | 860 (15.7%) | 1,079 (24.2%) |
| $75,000 to $99,999 | 950 (17.3%) | 312 (7.0%) |
| $100,000 to $149,999 | 712 (13.0%) | 334 (7.5%) |
| $150,000 or more | 656 (11.9%) | 117 (2.6%) |
| Total | 5,493 (100.0%) | 4,461 (100.0%) |
Monthly Housing Cost Tiers in Roseburg
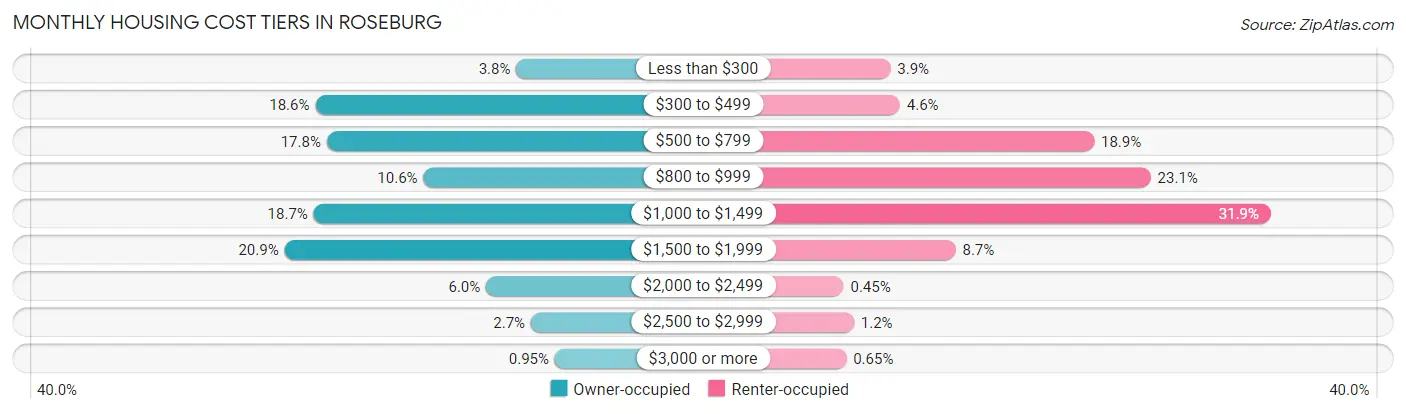
| Monthly Cost | Owner-occupied | Renter-occupied |
| Less than $300 | 208 (3.8%) | 174 (3.9%) |
| $300 to $499 | 1,021 (18.6%) | 205 (4.6%) |
| $500 to $799 | 975 (17.7%) | 843 (18.9%) |
| $800 to $999 | 584 (10.6%) | 1,029 (23.1%) |
| $1,000 to $1,499 | 1,028 (18.7%) | 1,424 (31.9%) |
| $1,500 to $1,999 | 1,146 (20.9%) | 388 (8.7%) |
| $2,000 to $2,499 | 330 (6.0%) | 20 (0.4%) |
| $2,500 to $2,999 | 149 (2.7%) | 54 (1.2%) |
| $3,000 or more | 52 (0.9%) | 29 (0.6%) |
| Total | 5,493 (100.0%) | 4,461 (100.0%) |
Physical Housing Characteristics in Roseburg
Housing Structures in Roseburg
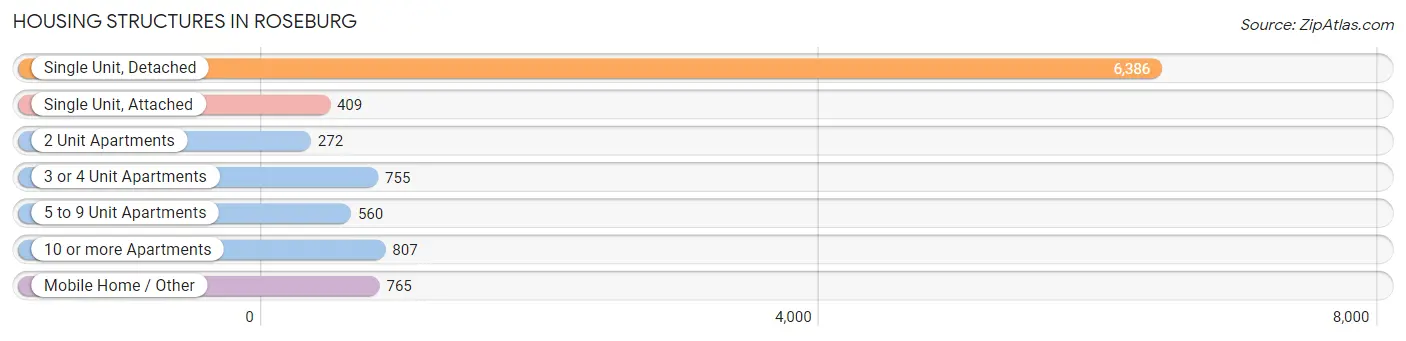
| Structure Type | # Housing Units | % Housing Units |
| Single Unit, Detached | 6,386 | 64.2% |
| Single Unit, Attached | 409 | 4.1% |
| 2 Unit Apartments | 272 | 2.7% |
| 3 or 4 Unit Apartments | 755 | 7.6% |
| 5 to 9 Unit Apartments | 560 | 5.6% |
| 10 or more Apartments | 807 | 8.1% |
| Mobile Home / Other | 765 | 7.7% |
| Total | 9,954 | 100.0% |
Housing Structures by Occupancy in Roseburg
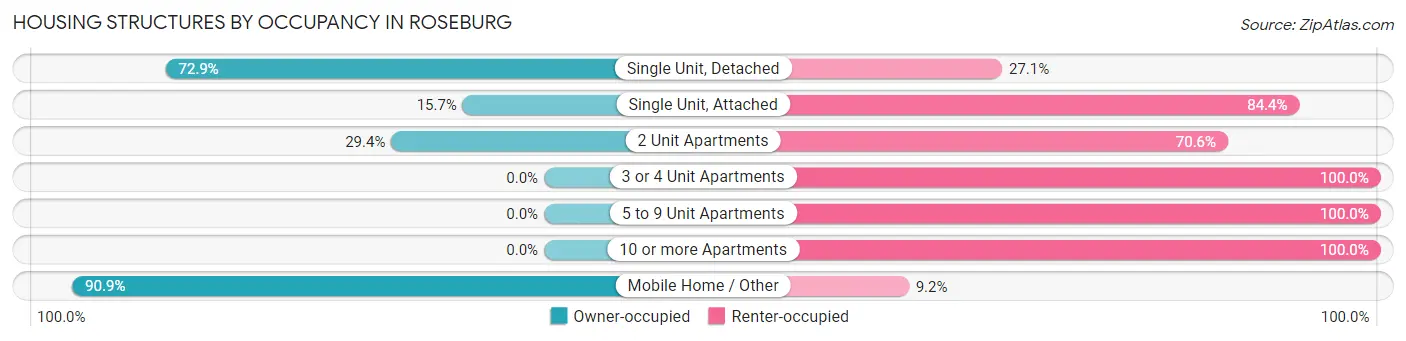
| Structure Type | Owner-occupied | Renter-occupied |
| Single Unit, Detached | 4,654 (72.9%) | 1,732 (27.1%) |
| Single Unit, Attached | 64 (15.7%) | 345 (84.4%) |
| 2 Unit Apartments | 80 (29.4%) | 192 (70.6%) |
| 3 or 4 Unit Apartments | 0 (0.0%) | 755 (100.0%) |
| 5 to 9 Unit Apartments | 0 (0.0%) | 560 (100.0%) |
| 10 or more Apartments | 0 (0.0%) | 807 (100.0%) |
| Mobile Home / Other | 695 (90.8%) | 70 (9.1%) |
| Total | 5,493 (55.2%) | 4,461 (44.8%) |
Housing Structures by Number of Rooms in Roseburg
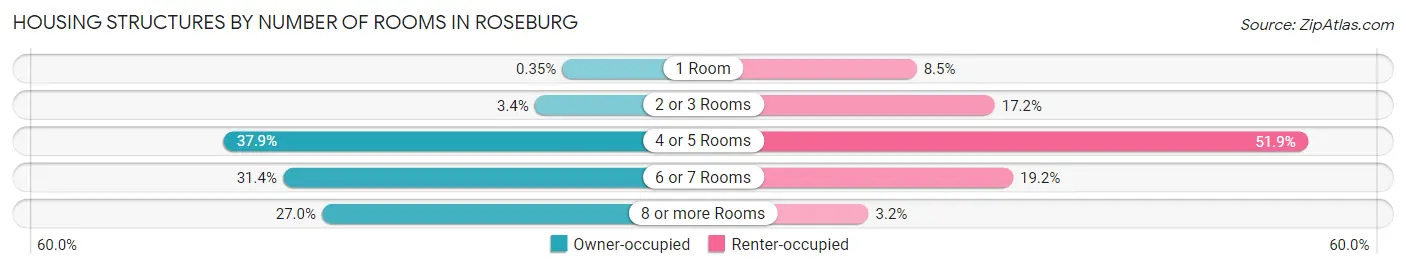
| Number of Rooms | Owner-occupied | Renter-occupied |
| 1 Room | 19 (0.4%) | 380 (8.5%) |
| 2 or 3 Rooms | 187 (3.4%) | 767 (17.2%) |
| 4 or 5 Rooms | 2,081 (37.9%) | 2,315 (51.9%) |
| 6 or 7 Rooms | 1,722 (31.4%) | 857 (19.2%) |
| 8 or more Rooms | 1,484 (27.0%) | 142 (3.2%) |
| Total | 5,493 (100.0%) | 4,461 (100.0%) |
Housing Structure by Heating Type in Roseburg
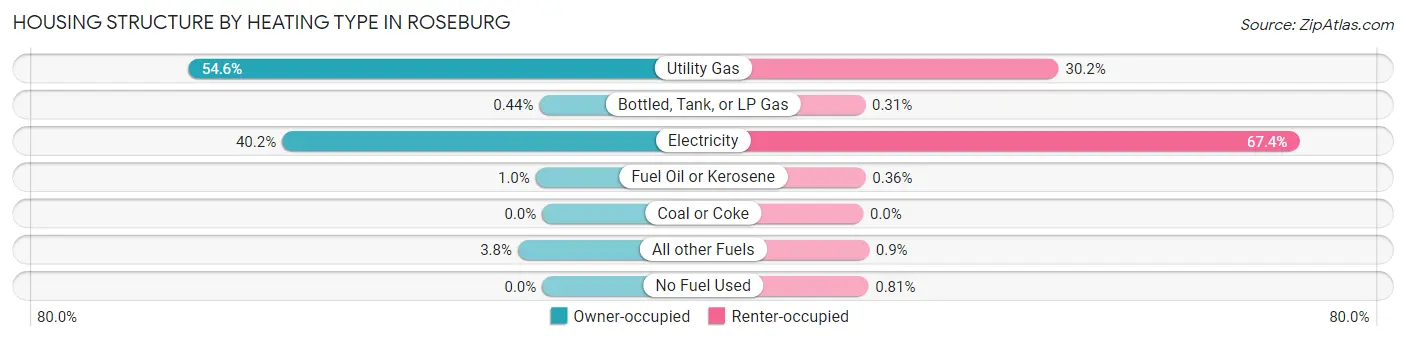
| Heating Type | Owner-occupied | Renter-occupied |
| Utility Gas | 2,999 (54.6%) | 1,348 (30.2%) |
| Bottled, Tank, or LP Gas | 24 (0.4%) | 14 (0.3%) |
| Electricity | 2,209 (40.2%) | 3,007 (67.4%) |
| Fuel Oil or Kerosene | 55 (1.0%) | 16 (0.4%) |
| Coal or Coke | 0 (0.0%) | 0 (0.0%) |
| All other Fuels | 206 (3.7%) | 40 (0.9%) |
| No Fuel Used | 0 (0.0%) | 36 (0.8%) |
| Total | 5,493 (100.0%) | 4,461 (100.0%) |
Household Vehicle Usage in Roseburg
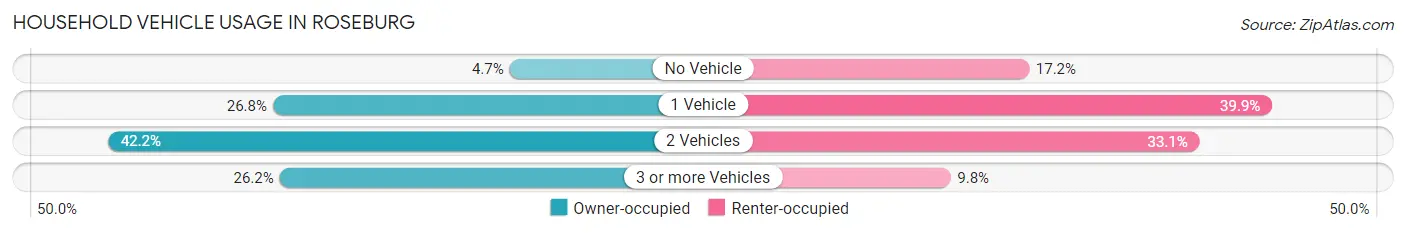
| Vehicles per Household | Owner-occupied | Renter-occupied |
| No Vehicle | 260 (4.7%) | 766 (17.2%) |
| 1 Vehicle | 1,474 (26.8%) | 1,779 (39.9%) |
| 2 Vehicles | 2,320 (42.2%) | 1,477 (33.1%) |
| 3 or more Vehicles | 1,439 (26.2%) | 439 (9.8%) |
| Total | 5,493 (100.0%) | 4,461 (100.0%) |
Real Estate & Mortgages in Roseburg
Real Estate and Mortgage Overview in Roseburg
| Characteristic | Without Mortgage | With Mortgage |
| Housing Units | 2,170 | 3,323 |
| Median Property Value | $223,000 | $269,900 |
| Median Household Income | $39,048 | $580 |
| Monthly Housing Costs | $481 | $52 |
| Real Estate Taxes | $2,204 | $0 |
Property Value by Mortgage Status in Roseburg
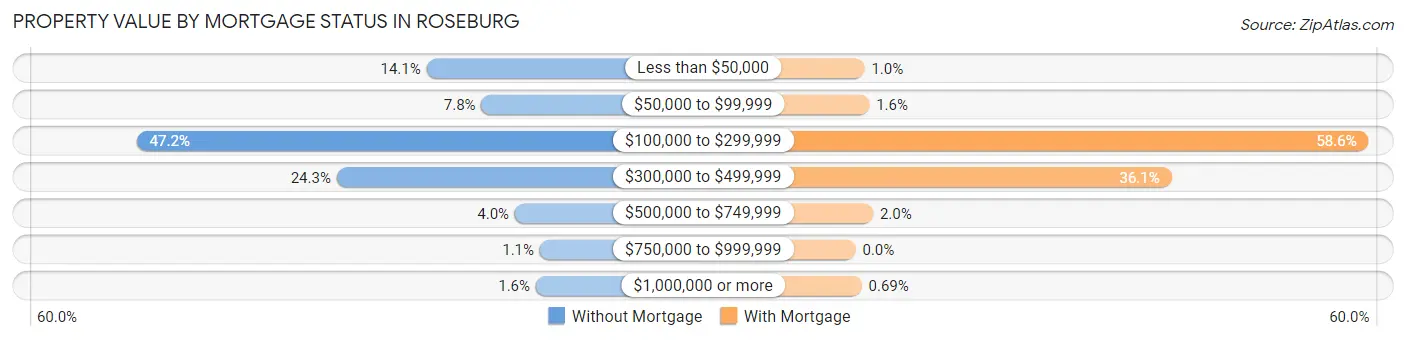
| Property Value | Without Mortgage | With Mortgage |
| Less than $50,000 | 305 (14.1%) | 34 (1.0%) |
| $50,000 to $99,999 | 169 (7.8%) | 52 (1.6%) |
| $100,000 to $299,999 | 1,024 (47.2%) | 1,948 (58.6%) |
| $300,000 to $499,999 | 528 (24.3%) | 1,200 (36.1%) |
| $500,000 to $749,999 | 86 (4.0%) | 66 (2.0%) |
| $750,000 to $999,999 | 24 (1.1%) | 0 (0.0%) |
| $1,000,000 or more | 34 (1.6%) | 23 (0.7%) |
| Total | 2,170 (100.0%) | 3,323 (100.0%) |
Household Income by Mortgage Status in Roseburg
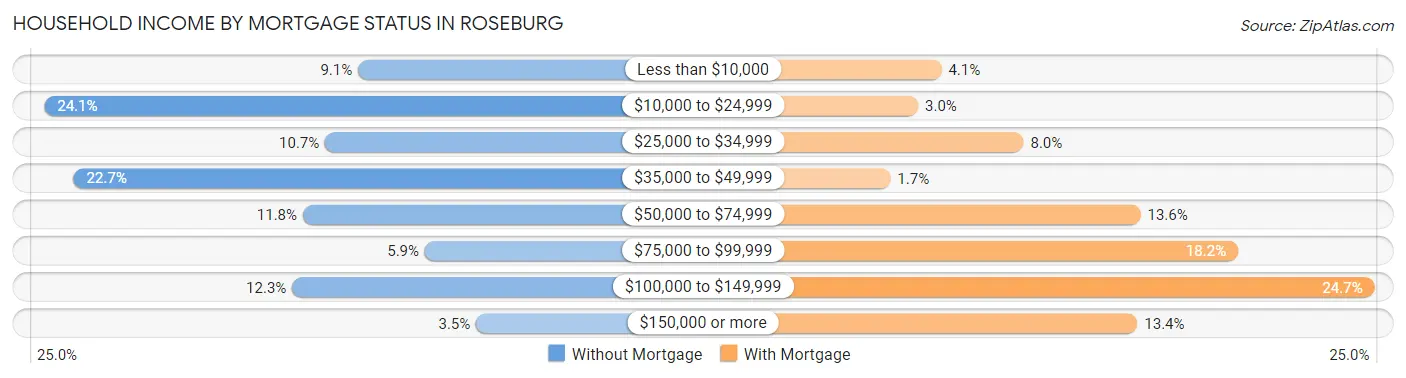
| Household Income | Without Mortgage | With Mortgage |
| Less than $10,000 | 198 (9.1%) | 136 (4.1%) |
| $10,000 to $24,999 | 522 (24.1%) | 99 (3.0%) |
| $25,000 to $34,999 | 232 (10.7%) | 266 (8.0%) |
| $35,000 to $49,999 | 492 (22.7%) | 55 (1.7%) |
| $50,000 to $74,999 | 255 (11.7%) | 451 (13.6%) |
| $75,000 to $99,999 | 129 (5.9%) | 605 (18.2%) |
| $100,000 to $149,999 | 266 (12.3%) | 821 (24.7%) |
| $150,000 or more | 76 (3.5%) | 446 (13.4%) |
| Total | 2,170 (100.0%) | 3,323 (100.0%) |
Property Value to Household Income Ratio in Roseburg
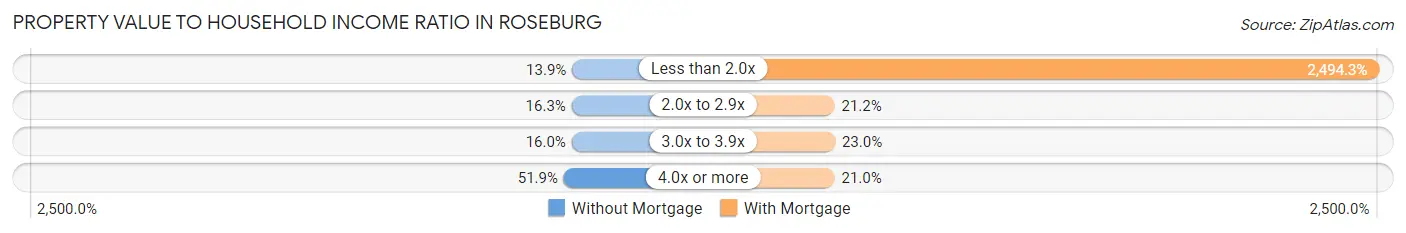
| Value-to-Income Ratio | Without Mortgage | With Mortgage |
| Less than 2.0x | 301 (13.9%) | 82,887 (2,494.3%) |
| 2.0x to 2.9x | 354 (16.3%) | 703 (21.2%) |
| 3.0x to 3.9x | 348 (16.0%) | 765 (23.0%) |
| 4.0x or more | 1,126 (51.9%) | 697 (21.0%) |
| Total | 2,170 (100.0%) | 3,323 (100.0%) |
Real Estate Taxes by Mortgage Status in Roseburg
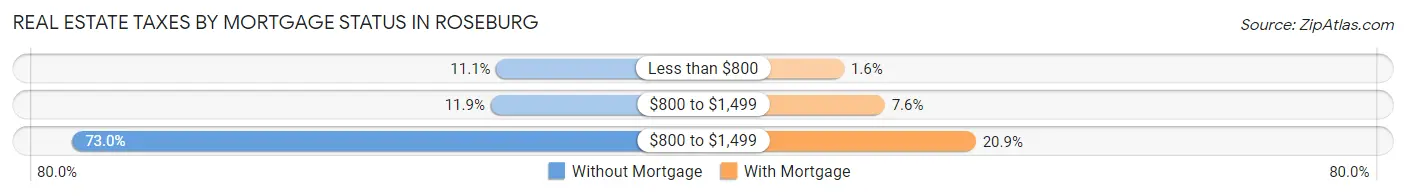
| Property Taxes | Without Mortgage | With Mortgage |
| Less than $800 | 240 (11.1%) | 53 (1.6%) |
| $800 to $1,499 | 258 (11.9%) | 251 (7.5%) |
| $800 to $1,499 | 1,585 (73.0%) | 693 (20.8%) |
| Total | 2,170 (100.0%) | 3,323 (100.0%) |
Health & Disability in Roseburg
Health Insurance Coverage by Age in Roseburg
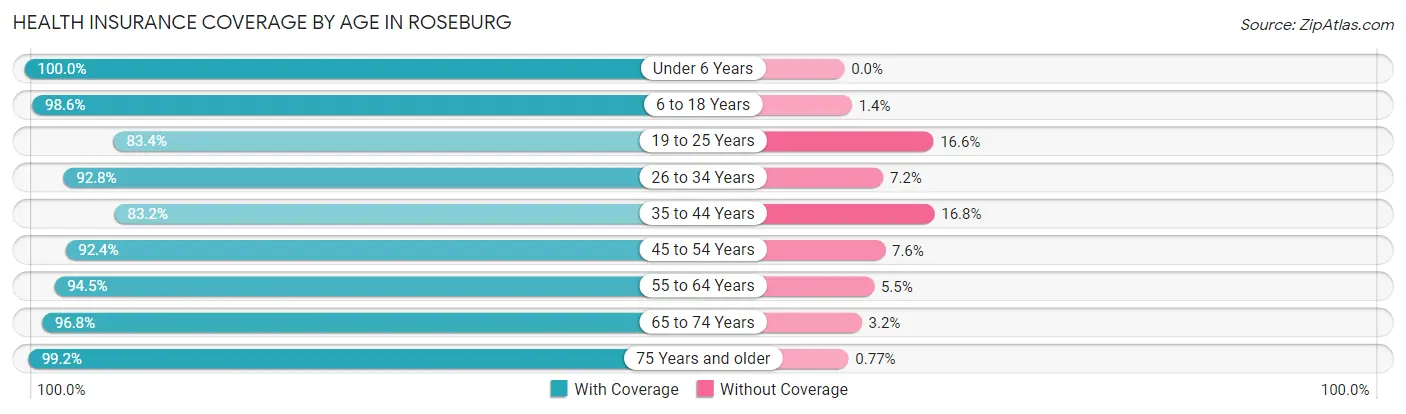
| Age Bracket | With Coverage | Without Coverage |
| Under 6 Years | 1,403 (100.0%) | 0 (0.0%) |
| 6 to 18 Years | 3,764 (98.6%) | 53 (1.4%) |
| 19 to 25 Years | 1,520 (83.4%) | 302 (16.6%) |
| 26 to 34 Years | 2,973 (92.8%) | 232 (7.2%) |
| 35 to 44 Years | 2,344 (83.2%) | 473 (16.8%) |
| 45 to 54 Years | 2,200 (92.4%) | 181 (7.6%) |
| 55 to 64 Years | 2,956 (94.5%) | 173 (5.5%) |
| 65 to 74 Years | 2,045 (96.8%) | 68 (3.2%) |
| 75 Years and older | 2,433 (99.2%) | 19 (0.8%) |
| Total | 21,638 (93.5%) | 1,501 (6.5%) |
Health Insurance Coverage by Citizenship Status in Roseburg
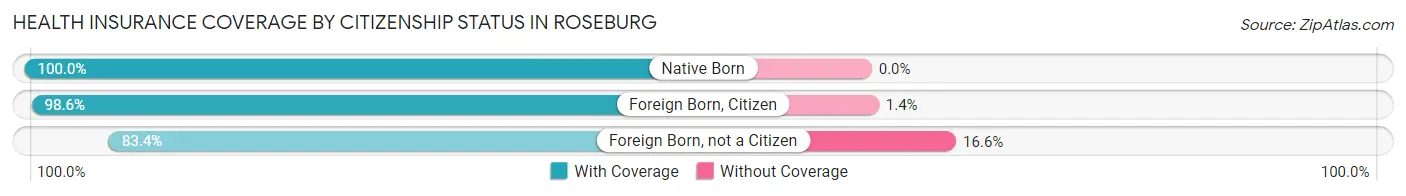
| Citizenship Status | With Coverage | Without Coverage |
| Native Born | 1,403 (100.0%) | 0 (0.0%) |
| Foreign Born, Citizen | 3,764 (98.6%) | 53 (1.4%) |
| Foreign Born, not a Citizen | 1,520 (83.4%) | 302 (16.6%) |
Health Insurance Coverage by Household Income in Roseburg
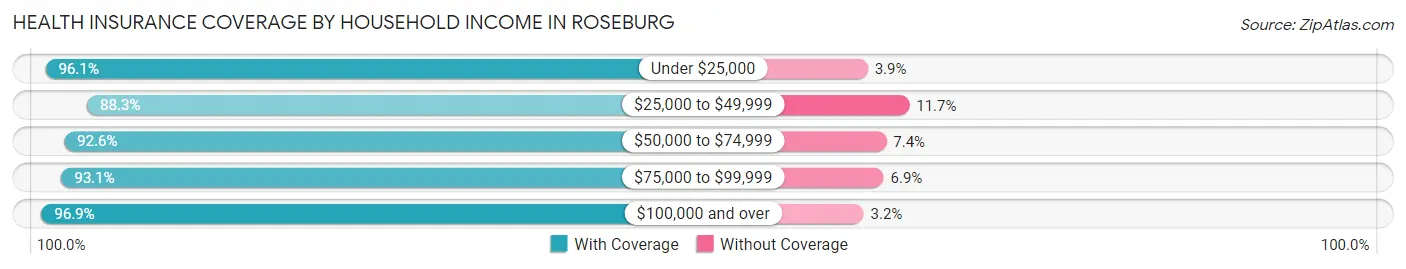
| Household Income | With Coverage | Without Coverage |
| Under $25,000 | 3,605 (96.1%) | 147 (3.9%) |
| $25,000 to $49,999 | 4,380 (88.3%) | 581 (11.7%) |
| $50,000 to $74,999 | 4,047 (92.6%) | 324 (7.4%) |
| $75,000 to $99,999 | 3,367 (93.1%) | 249 (6.9%) |
| $100,000 and over | 5,686 (96.9%) | 185 (3.2%) |
Public vs Private Health Insurance Coverage by Age in Roseburg
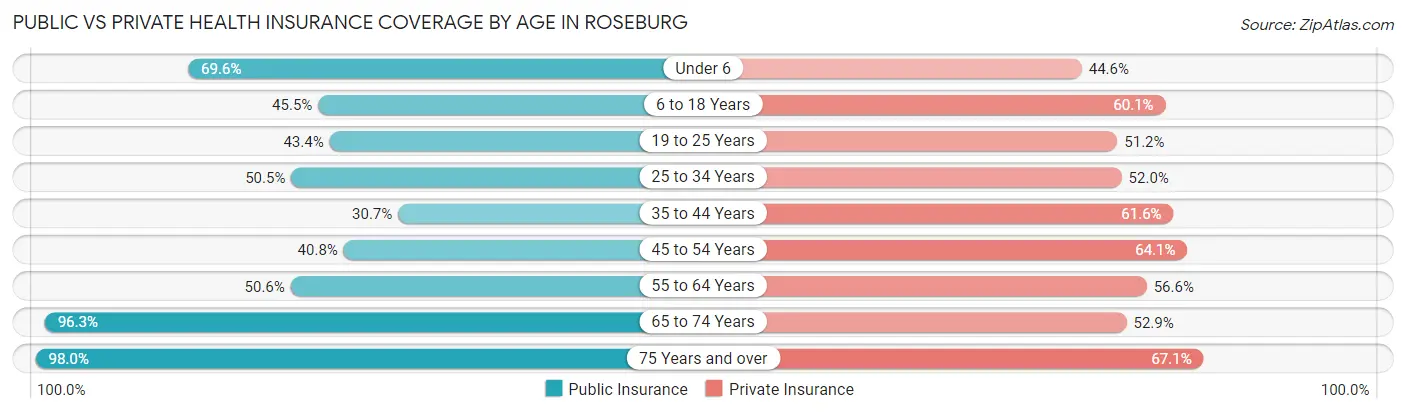
| Age Bracket | Public Insurance | Private Insurance |
| Under 6 | 977 (69.6%) | 625 (44.6%) |
| 6 to 18 Years | 1,737 (45.5%) | 2,293 (60.1%) |
| 19 to 25 Years | 791 (43.4%) | 932 (51.1%) |
| 25 to 34 Years | 1,619 (50.5%) | 1,665 (51.9%) |
| 35 to 44 Years | 864 (30.7%) | 1,734 (61.6%) |
| 45 to 54 Years | 971 (40.8%) | 1,527 (64.1%) |
| 55 to 64 Years | 1,584 (50.6%) | 1,771 (56.6%) |
| 65 to 74 Years | 2,034 (96.3%) | 1,117 (52.9%) |
| 75 Years and over | 2,402 (98.0%) | 1,646 (67.1%) |
| Total | 12,979 (56.1%) | 13,310 (57.5%) |
Disability Status by Sex by Age in Roseburg
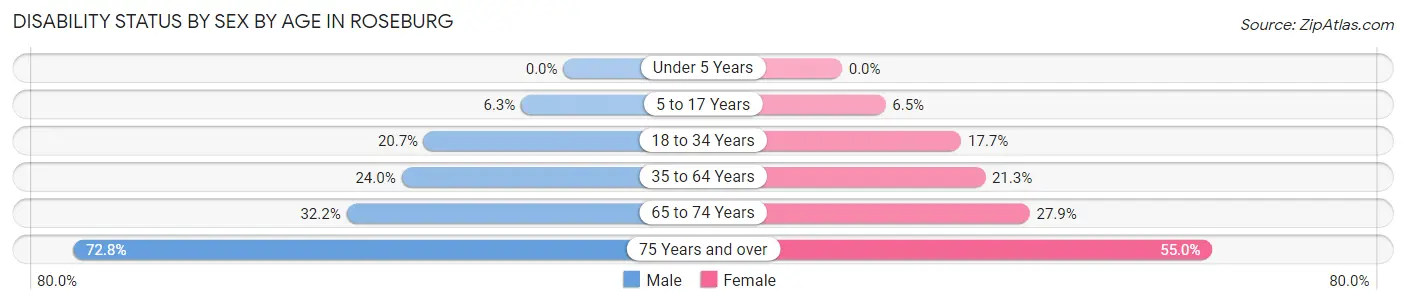
| Age Bracket | Male | Female |
| Under 5 Years | 0 (0.0%) | 0 (0.0%) |
| 5 to 17 Years | 123 (6.3%) | 118 (6.5%) |
| 18 to 34 Years | 558 (20.7%) | 459 (17.7%) |
| 35 to 64 Years | 984 (24.0%) | 900 (21.3%) |
| 65 to 74 Years | 342 (32.2%) | 293 (27.9%) |
| 75 Years and over | 680 (72.8%) | 835 (55.0%) |
Disability Class by Sex by Age in Roseburg
Disability Class: Hearing Difficulty
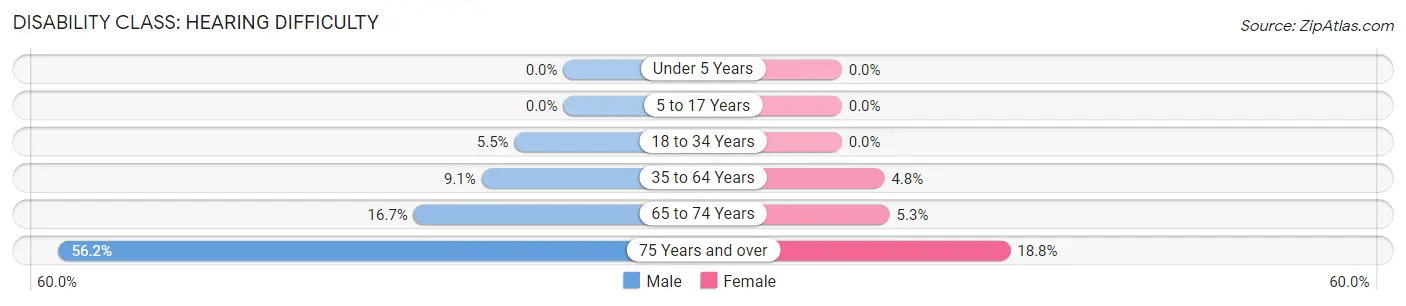
| Age Bracket | Male | Female |
| Under 5 Years | 0 (0.0%) | 0 (0.0%) |
| 5 to 17 Years | 0 (0.0%) | 0 (0.0%) |
| 18 to 34 Years | 147 (5.4%) | 0 (0.0%) |
| 35 to 64 Years | 373 (9.1%) | 201 (4.8%) |
| 65 to 74 Years | 177 (16.7%) | 56 (5.3%) |
| 75 Years and over | 525 (56.2%) | 285 (18.8%) |
Disability Class: Vision Difficulty
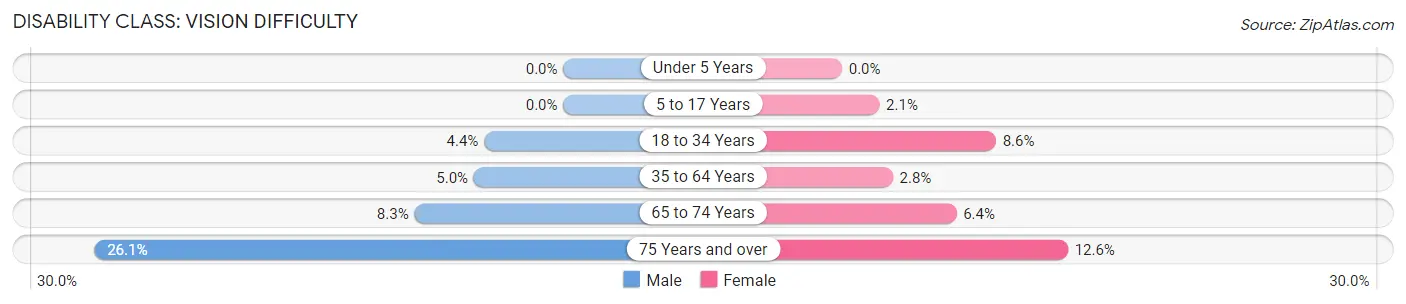
| Age Bracket | Male | Female |
| Under 5 Years | 0 (0.0%) | 0 (0.0%) |
| 5 to 17 Years | 0 (0.0%) | 38 (2.1%) |
| 18 to 34 Years | 119 (4.4%) | 222 (8.6%) |
| 35 to 64 Years | 204 (5.0%) | 120 (2.8%) |
| 65 to 74 Years | 88 (8.3%) | 67 (6.4%) |
| 75 Years and over | 244 (26.1%) | 191 (12.6%) |
Disability Class: Cognitive Difficulty
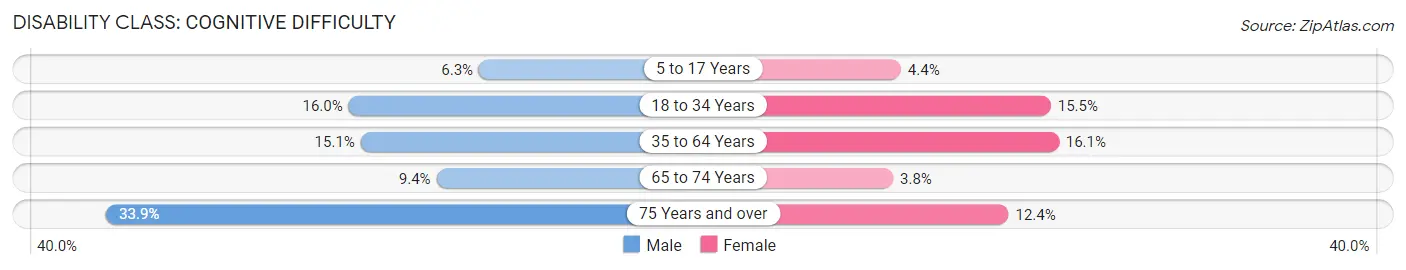
| Age Bracket | Male | Female |
| 5 to 17 Years | 123 (6.3%) | 80 (4.4%) |
| 18 to 34 Years | 430 (16.0%) | 402 (15.5%) |
| 35 to 64 Years | 616 (15.0%) | 682 (16.1%) |
| 65 to 74 Years | 100 (9.4%) | 40 (3.8%) |
| 75 Years and over | 317 (33.9%) | 188 (12.4%) |
Disability Class: Ambulatory Difficulty
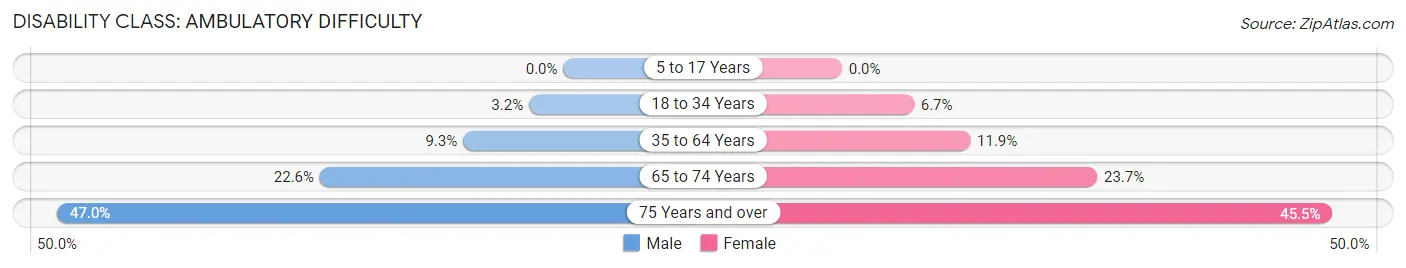
| Age Bracket | Male | Female |
| 5 to 17 Years | 0 (0.0%) | 0 (0.0%) |
| 18 to 34 Years | 86 (3.2%) | 173 (6.7%) |
| 35 to 64 Years | 381 (9.3%) | 504 (11.9%) |
| 65 to 74 Years | 240 (22.6%) | 249 (23.7%) |
| 75 Years and over | 439 (47.0%) | 691 (45.5%) |
Disability Class: Self-Care Difficulty
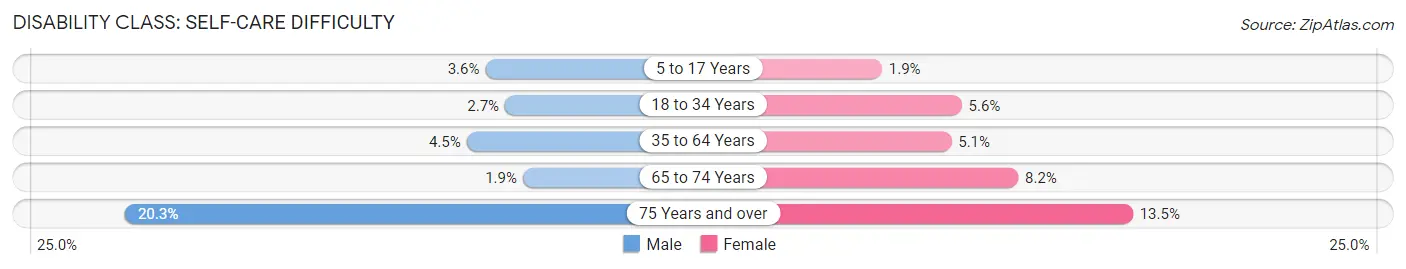
| Age Bracket | Male | Female |
| 5 to 17 Years | 71 (3.6%) | 34 (1.9%) |
| 18 to 34 Years | 73 (2.7%) | 144 (5.6%) |
| 35 to 64 Years | 184 (4.5%) | 215 (5.1%) |
| 65 to 74 Years | 20 (1.9%) | 86 (8.2%) |
| 75 Years and over | 190 (20.3%) | 205 (13.5%) |
Technology Access in Roseburg
Computing Device Access in Roseburg
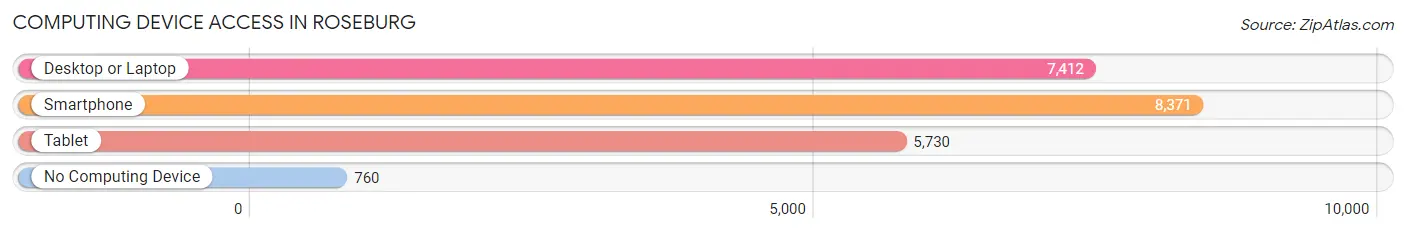
| Device Type | # Households | % Households |
| Desktop or Laptop | 7,412 | 74.5% |
| Smartphone | 8,371 | 84.1% |
| Tablet | 5,730 | 57.6% |
| No Computing Device | 760 | 7.6% |
| Total | 9,954 | 100.0% |
Internet Access in Roseburg
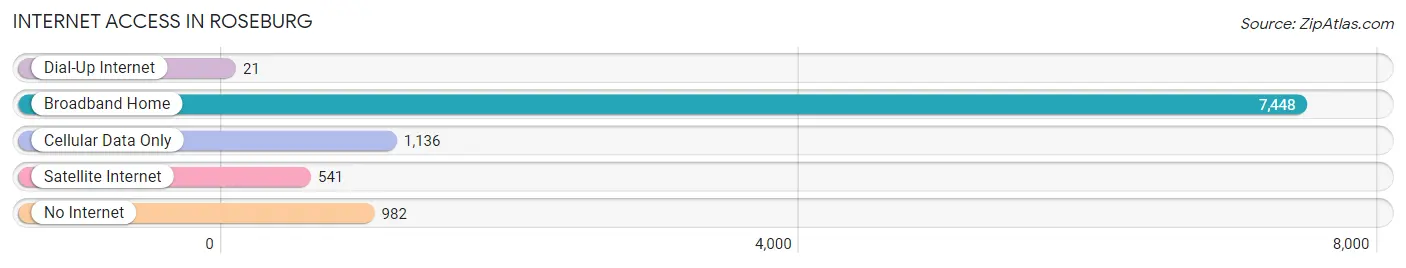
| Internet Type | # Households | % Households |
| Dial-Up Internet | 21 | 0.2% |
| Broadband Home | 7,448 | 74.8% |
| Cellular Data Only | 1,136 | 11.4% |
| Satellite Internet | 541 | 5.4% |
| No Internet | 982 | 9.9% |
| Total | 9,954 | 100.0% |
Roseburg Summary
History
The city of Roseburg, Oregon is located in the Umpqua Valley of southwestern Oregon. The area was first inhabited by the Umpqua Tribe of Native Americans, who lived in the area for thousands of years before the arrival of European settlers. The first Europeans to explore the area were fur traders, who arrived in the early 1800s. The first permanent settlement in the area was established in 1851 by Jesse Applegate and his family. The Applegates named the settlement Roseburgh, after Jesse’s wife Rose. The name was later changed to Roseburg.
In 1853, the Oregon Territorial Legislature created Douglas County, with Roseburg as its county seat. The city was officially incorporated in 1872. During the late 19th century, Roseburg grew rapidly, becoming a major lumber and agricultural center. The city was also home to several large sawmills, which provided employment for many of the city’s residents.
In the early 20th century, Roseburg experienced a period of economic decline. The sawmills closed, and the city’s population began to decline. However, the city’s fortunes began to improve in the 1950s, when the timber industry began to rebound. The city also began to diversify its economy, with the establishment of several new industries, including a paper mill and a plywood plant.
Today, Roseburg is a thriving city with a population of over 21,000. The city is home to several large employers, including Roseburg Forest Products, Umpqua Dairy Products, and the Roseburg VA Medical Center. The city is also home to several educational institutions, including Umpqua Community College and the University of Oregon.
Geography
Roseburg is located in the Umpqua Valley of southwestern Oregon. The city is situated on the banks of the Umpqua River, which flows through the city. The city is surrounded by the Umpqua National Forest, which covers over 1.6 million acres of land. The city is located approximately 80 miles south of Eugene, Oregon, and approximately 150 miles south of Portland, Oregon.
The city has a total area of 8.7 square miles, of which 8.6 square miles is land and 0.1 square miles is water. The city has a mild climate, with warm summers and cool winters. The average annual temperature is 54 degrees Fahrenheit.
Economy
Roseburg’s economy is largely based on the timber industry. The city is home to several large timber companies, including Roseburg Forest Products, Umpqua Dairy Products, and the Roseburg VA Medical Center. The city is also home to several other industries, including a paper mill and a plywood plant.
The city’s economy is also supported by tourism. The city is home to several attractions, including the Umpqua River, the Umpqua National Forest, and the Roseburg VA Medical Center. The city is also home to several educational institutions, including Umpqua Community College and the University of Oregon.
Demographics
As of the 2010 census, the population of Roseburg was 21,181. The city has a population density of 2,400 people per square mile. The median age of the city’s population is 38.7 years. The median household income is $41,945, and the median family income is $50,945.
The city’s population is predominantly white (90.2%), with small percentages of African American (2.2%), Native American (1.2%), Asian (1.1%), and other races (5.3%). The city’s population is also predominantly Christian (77.2%), with small percentages of other religions (2.2%) and those who do not identify with any religion (20.6%).
Common Questions
What is Per Capita Income in Roseburg?
Per Capita income in Roseburg is $27,547.
What is the Median Family Income in Roseburg?
Median Family Income in Roseburg is $60,777.
What is the Median Household income in Roseburg?
Median Household Income in Roseburg is $50,297.
What is Income or Wage Gap in Roseburg?
Income or Wage Gap in Roseburg is 22.2%.
Women in Roseburg earn 77.8 cents for every dollar earned by a man.
What is Family Income Deficit in Roseburg?
Family Income Deficit in Roseburg is $11,962.
Families that are below poverty line in Roseburg earn $11,962 less on average than the poverty threshold level.
What is Inequality or Gini Index in Roseburg?
Inequality or Gini Index in Roseburg is 0.44.
What is the Total Population of Roseburg?
Total Population of Roseburg is 23,657.
What is the Total Male Population of Roseburg?
Total Male Population of Roseburg is 11,792.
What is the Total Female Population of Roseburg?
Total Female Population of Roseburg is 11,865.
What is the Ratio of Males per 100 Females in Roseburg?
There are 99.38 Males per 100 Females in Roseburg.
What is the Ratio of Females per 100 Males in Roseburg?
There are 100.62 Females per 100 Males in Roseburg.
What is the Median Population Age in Roseburg?
Median Population Age in Roseburg is 40.3 Years.
What is the Average Family Size in Roseburg
Average Family Size in Roseburg is 2.8 People.
What is the Average Household Size in Roseburg
Average Household Size in Roseburg is 2.3 People.
How Large is the Labor Force in Roseburg?
There are 9,820 People in the Labor Forcein in Roseburg.
What is the Percentage of People in the Labor Force in Roseburg?
51.0% of People are in the Labor Force in Roseburg.
What is the Unemployment Rate in Roseburg?
Unemployment Rate in Roseburg is 5.0%.