Yachats, OR Map & Demographics
Yachats Map
Yachats Overview
$51,608
PER CAPITA INCOME
$84,833
AVG FAMILY INCOME
$55,313
AVG HOUSEHOLD INCOME
0.51
INEQUALITY / GINI INDEX
772
TOTAL POPULATION
386
MALE POPULATION
386
FEMALE POPULATION
100.00
MALES / 100 FEMALES
100.00
FEMALES / 100 MALES
63.8
MEDIAN AGE
2.4
AVG FAMILY SIZE
1.7
AVG HOUSEHOLD SIZE
314
LABOR FORCE [ PEOPLE ]
42.7%
PERCENT IN LABOR FORCE
11.5%
UNEMPLOYMENT RATE
Yachats Zip Codes
Yachats Area Codes
Income in Yachats
Income Overview in Yachats
Per Capita Income in Yachats is $51,608, while median incomes of families and households are $84,833 and $55,313 respectively.
| Characteristic | Number | Measure |
| Per Capita Income | 772 | $51,608 |
| Median Family Income | 192 | $84,833 |
| Mean Family Income | 192 | $139,014 |
| Median Household Income | 451 | $55,313 |
| Mean Household Income | 451 | $87,596 |
| Income Deficit | 192 | $0 |
| Wage / Income Gap (%) | 772 | 0.00% |
| Wage / Income Gap ($) | 772 | 100.00¢ per $1 |
| Gini / Inequality Index | 772 | 0.51 |
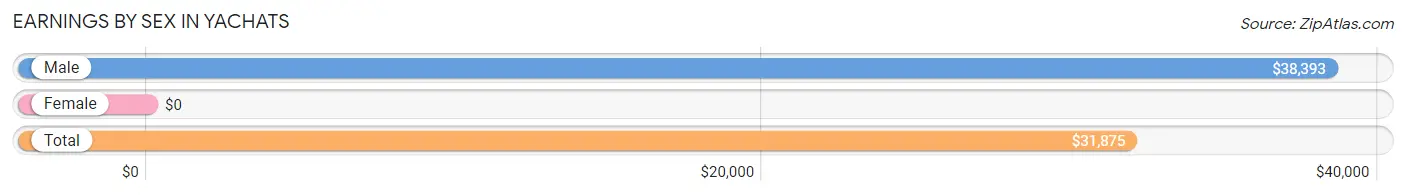
Earnings by Sex in Yachats
| Sex | Number | Average Earnings |
| Male | 179 (53.6%) | $38,393 |
| Female | 155 (46.4%) | $0 |
| Total | 334 (100.0%) | $31,875 |
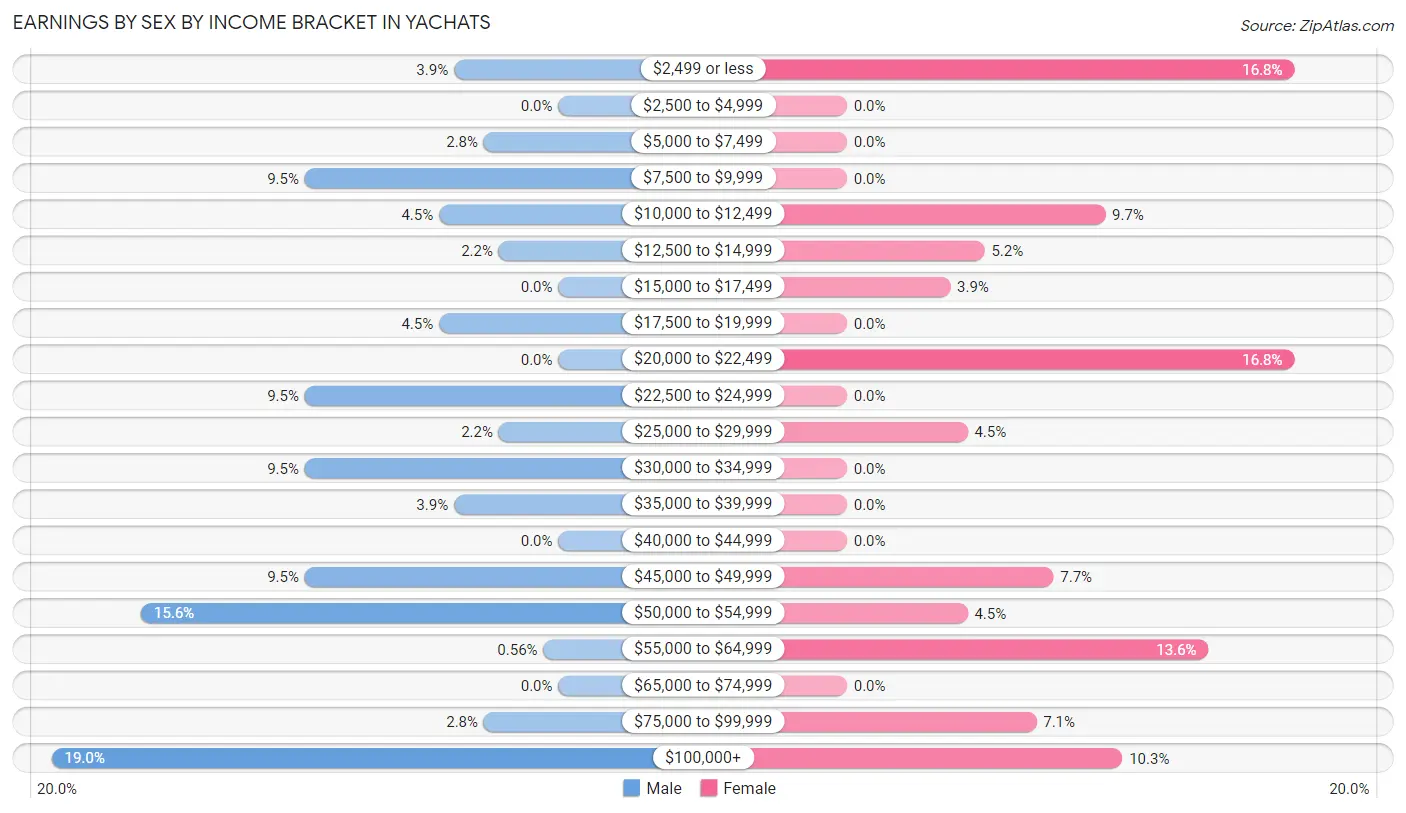
Earnings by Sex by Income Bracket in Yachats
The most common earnings brackets in Yachats are $100,000+ for men (34 | 19.0%) and $2,499 or less for women (26 | 16.8%).
| Income | Male | Female |
| $2,499 or less | 7 (3.9%) | 26 (16.8%) |
| $2,500 to $4,999 | 0 (0.0%) | 0 (0.0%) |
| $5,000 to $7,499 | 5 (2.8%) | 0 (0.0%) |
| $7,500 to $9,999 | 17 (9.5%) | 0 (0.0%) |
| $10,000 to $12,499 | 8 (4.5%) | 15 (9.7%) |
| $12,500 to $14,999 | 4 (2.2%) | 8 (5.2%) |
| $15,000 to $17,499 | 0 (0.0%) | 6 (3.9%) |
| $17,500 to $19,999 | 8 (4.5%) | 0 (0.0%) |
| $20,000 to $22,499 | 0 (0.0%) | 26 (16.8%) |
| $22,500 to $24,999 | 17 (9.5%) | 0 (0.0%) |
| $25,000 to $29,999 | 4 (2.2%) | 7 (4.5%) |
| $30,000 to $34,999 | 17 (9.5%) | 0 (0.0%) |
| $35,000 to $39,999 | 7 (3.9%) | 0 (0.0%) |
| $40,000 to $44,999 | 0 (0.0%) | 0 (0.0%) |
| $45,000 to $49,999 | 17 (9.5%) | 12 (7.7%) |
| $50,000 to $54,999 | 28 (15.6%) | 7 (4.5%) |
| $55,000 to $64,999 | 1 (0.6%) | 21 (13.6%) |
| $65,000 to $74,999 | 0 (0.0%) | 0 (0.0%) |
| $75,000 to $99,999 | 5 (2.8%) | 11 (7.1%) |
| $100,000+ | 34 (19.0%) | 16 (10.3%) |
| Total | 179 (100.0%) | 155 (100.0%) |
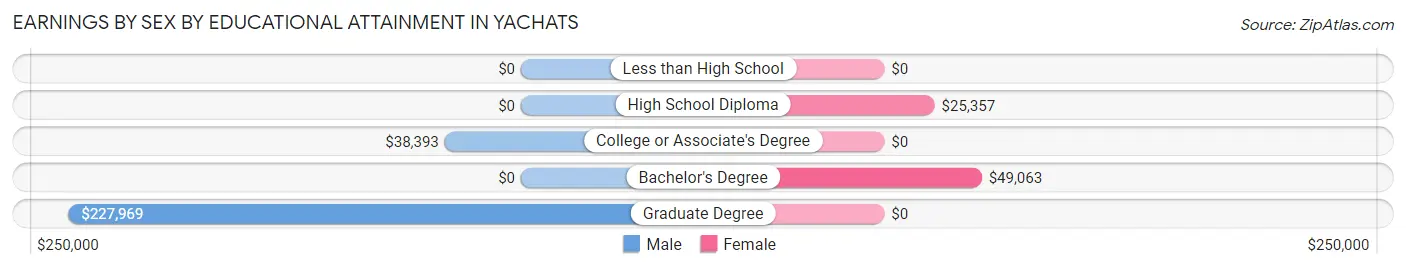
Earnings by Sex by Educational Attainment in Yachats
| Educational Attainment | Male Income | Female Income |
| Less than High School | - | - |
| High School Diploma | - | - |
| College or Associate's Degree | $38,393 | $0 |
| Bachelor's Degree | - | - |
| Graduate Degree | $227,969 | $0 |
| Total | $38,571 | $0 |
Family Income in Yachats
Family Income Brackets in Yachats
According to the Yachats family income data, there are 42 families falling into the $200,000+ income range, which is the most common income bracket and makes up 21.9% of all families.
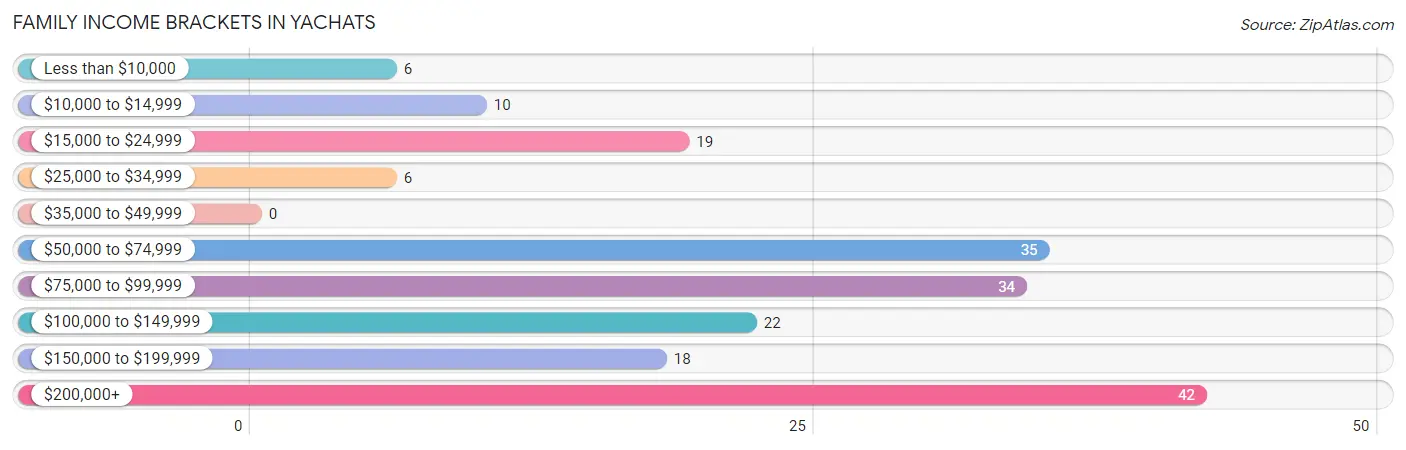
| Income Bracket | # Families | % Families |
| Less than $10,000 | 6 | 3.1% |
| $10,000 to $14,999 | 10 | 5.2% |
| $15,000 to $24,999 | 19 | 9.9% |
| $25,000 to $34,999 | 6 | 3.1% |
| $35,000 to $49,999 | 0 | 0.0% |
| $50,000 to $74,999 | 35 | 18.2% |
| $75,000 to $99,999 | 34 | 17.7% |
| $100,000 to $149,999 | 22 | 11.5% |
| $150,000 to $199,999 | 18 | 9.4% |
| $200,000+ | 42 | 21.9% |
Family Income by Famaliy Size in Yachats
3-person families (45 | 23.4%) account for the highest median family income in Yachats with $59,896 per family, while 3-person families (45 | 23.4%) have the highest median income of $19,965 per family member.
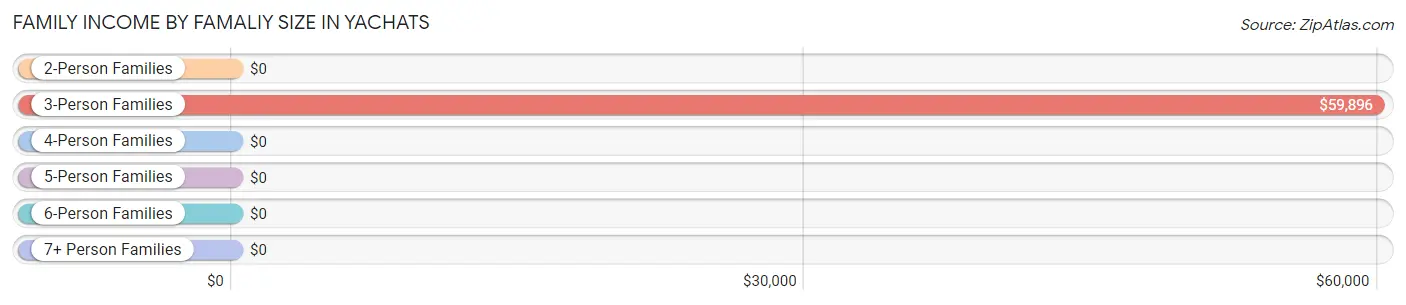
| Income Bracket | # Families | Median Income |
| 2-Person Families | 136 (70.8%) | $0 |
| 3-Person Families | 45 (23.4%) | $59,896 |
| 4-Person Families | 11 (5.7%) | $0 |
| 5-Person Families | 0 (0.0%) | $0 |
| 6-Person Families | 0 (0.0%) | $0 |
| 7+ Person Families | 0 (0.0%) | $0 |
| Total | 192 (100.0%) | $84,833 |
Family Income by Number of Earners in Yachats
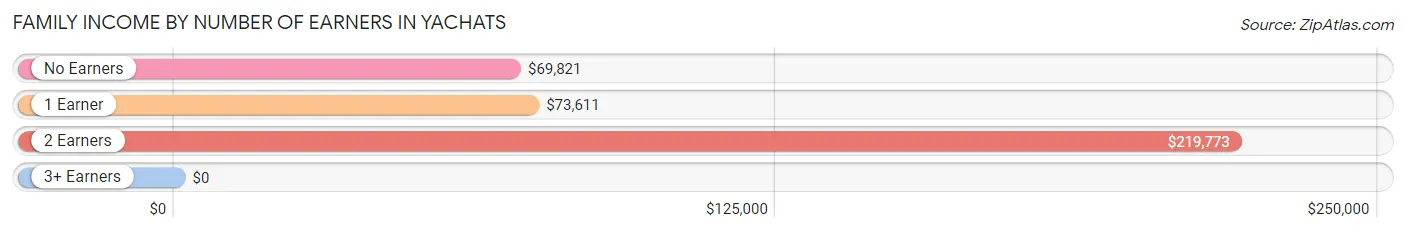
| Number of Earners | # Families | Median Income |
| No Earners | 83 (43.2%) | $69,821 |
| 1 Earner | 34 (17.7%) | $73,611 |
| 2 Earners | 64 (33.3%) | $219,773 |
| 3+ Earners | 11 (5.7%) | $0 |
| Total | 192 (100.0%) | $84,833 |
Household Income in Yachats
Household Income Brackets in Yachats
With 117 households falling in the category, the $50,000 to $74,999 income range is the most frequent in Yachats, accounting for 25.9% of all households. In contrast, only 15 households (3.3%) fall into the less than $10,000 income bracket, making it the least populous group.
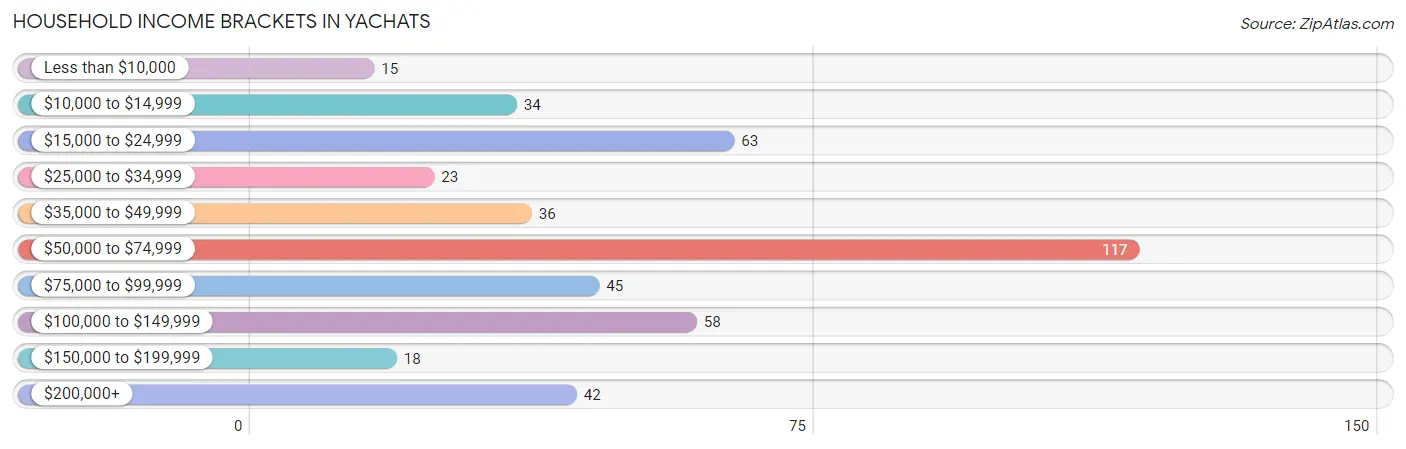
| Income Bracket | # Households | % Households |
| Less than $10,000 | 15 | 3.3% |
| $10,000 to $14,999 | 34 | 7.5% |
| $15,000 to $24,999 | 63 | 14.0% |
| $25,000 to $34,999 | 23 | 5.1% |
| $35,000 to $49,999 | 36 | 8.0% |
| $50,000 to $74,999 | 117 | 25.9% |
| $75,000 to $99,999 | 45 | 10.0% |
| $100,000 to $149,999 | 58 | 12.9% |
| $150,000 to $199,999 | 18 | 4.0% |
| $200,000+ | 42 | 9.3% |
Household Income by Householder Age in Yachats
The median household income in Yachats is $55,313, with the highest median household income of $60,179 found in the 25 to 44 years age bracket for the primary householder. A total of 59 households (13.1%) fall into this category. Meanwhile, the 15 to 24 years age bracket for the primary householder has the lowest median household income of $0, with 11 households (2.4%) in this group.
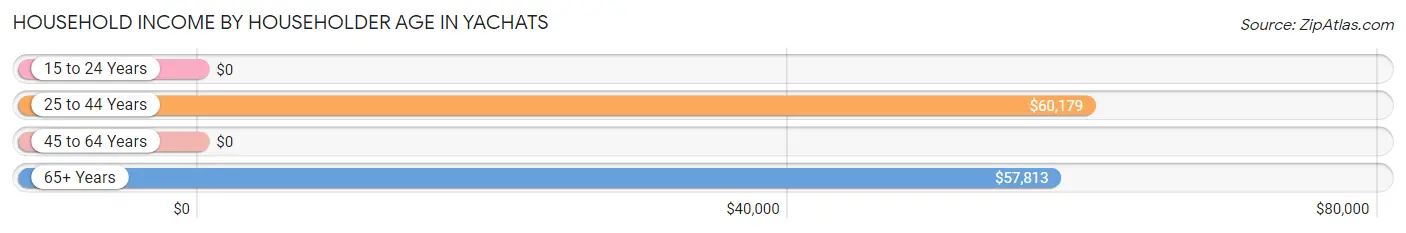
| Income Bracket | # Households | Median Income |
| 15 to 24 Years | 11 (2.4%) | $0 |
| 25 to 44 Years | 59 (13.1%) | $60,179 |
| 45 to 64 Years | 120 (26.6%) | $0 |
| 65+ Years | 261 (57.9%) | $57,813 |
| Total | 451 (100.0%) | $55,313 |
Poverty in Yachats
Income Below Poverty by Sex and Age in Yachats
With 14.2% poverty level for males and 14.6% for females among the residents of Yachats, 55 to 64 year old males and under 5 year old females are the most vulnerable to poverty, with 32 males (47.1%) and 4 females (40.0%) in their respective age groups living below the poverty level.
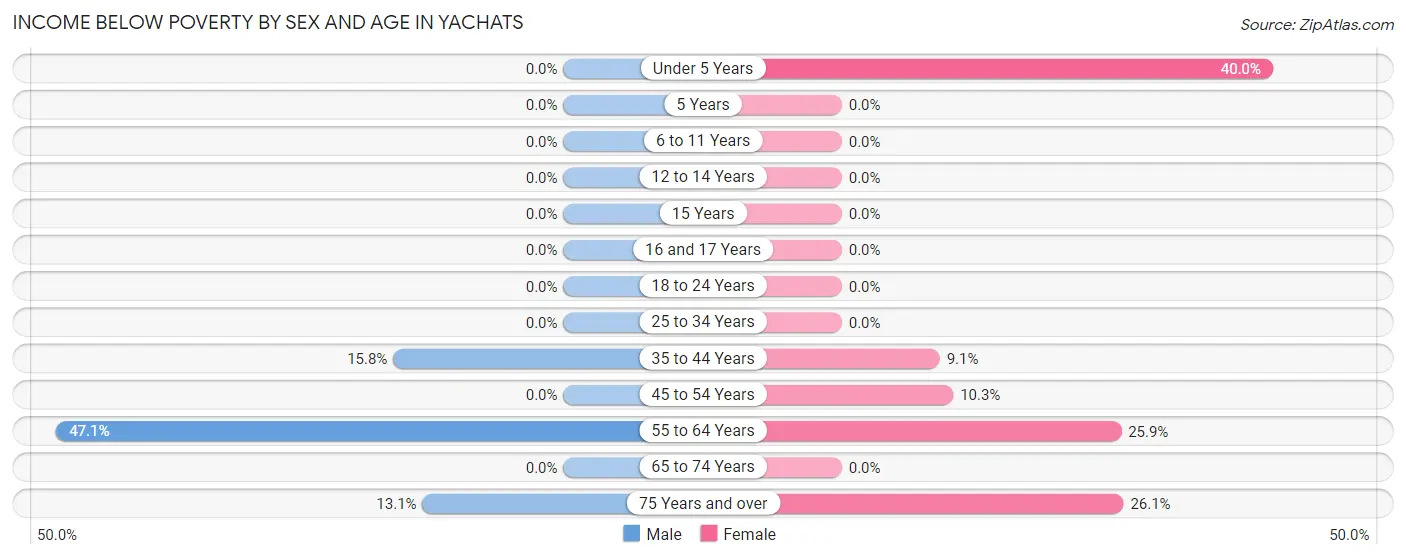
| Age Bracket | Male | Female |
| Under 5 Years | 0 (0.0%) | 4 (40.0%) |
| 5 Years | 0 (0.0%) | 0 (0.0%) |
| 6 to 11 Years | 0 (0.0%) | 0 (0.0%) |
| 12 to 14 Years | 0 (0.0%) | 0 (0.0%) |
| 15 Years | 0 (0.0%) | 0 (0.0%) |
| 16 and 17 Years | 0 (0.0%) | 0 (0.0%) |
| 18 to 24 Years | 0 (0.0%) | 0 (0.0%) |
| 25 to 34 Years | 0 (0.0%) | 0 (0.0%) |
| 35 to 44 Years | 9 (15.8%) | 3 (9.1%) |
| 45 to 54 Years | 0 (0.0%) | 3 (10.3%) |
| 55 to 64 Years | 32 (47.1%) | 21 (25.9%) |
| 65 to 74 Years | 0 (0.0%) | 0 (0.0%) |
| 75 Years and over | 14 (13.1%) | 23 (26.1%) |
| Total | 55 (14.2%) | 54 (14.6%) |
Income Above Poverty by Sex and Age in Yachats
According to the poverty statistics in Yachats, males aged 6 to 11 years and females aged 12 to 14 years are the age groups that are most secure financially, with 100.0% of males and 100.0% of females in these age groups living above the poverty line.
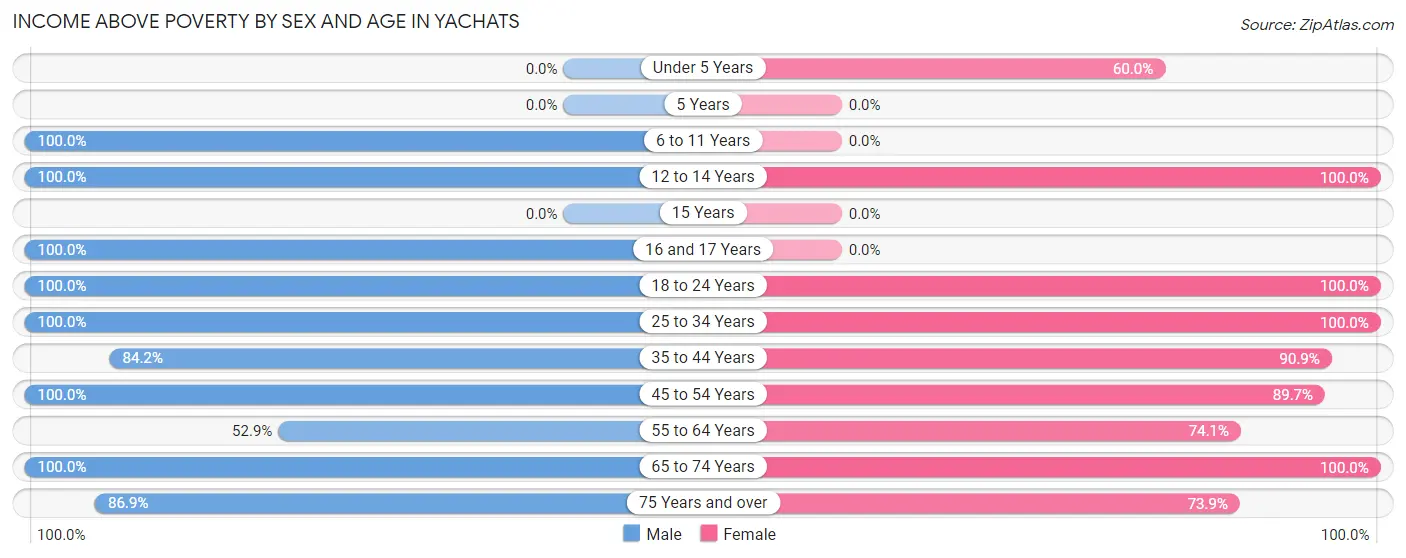
| Age Bracket | Male | Female |
| Under 5 Years | 0 (0.0%) | 6 (60.0%) |
| 5 Years | 0 (0.0%) | 0 (0.0%) |
| 6 to 11 Years | 7 (100.0%) | 0 (0.0%) |
| 12 to 14 Years | 8 (100.0%) | 7 (100.0%) |
| 15 Years | 0 (0.0%) | 0 (0.0%) |
| 16 and 17 Years | 4 (100.0%) | 0 (0.0%) |
| 18 to 24 Years | 23 (100.0%) | 19 (100.0%) |
| 25 to 34 Years | 9 (100.0%) | 13 (100.0%) |
| 35 to 44 Years | 48 (84.2%) | 30 (90.9%) |
| 45 to 54 Years | 28 (100.0%) | 26 (89.7%) |
| 55 to 64 Years | 36 (52.9%) | 60 (74.1%) |
| 65 to 74 Years | 75 (100.0%) | 89 (100.0%) |
| 75 Years and over | 93 (86.9%) | 65 (73.9%) |
| Total | 331 (85.8%) | 315 (85.4%) |
Income Below Poverty Among Married-Couple Families in Yachats
The poverty statistics for married-couple families in Yachats show that 13.9% or 23 of the total 165 families live below the poverty line. Families with no children have the highest poverty rate of 15.3%, comprising of 23 families. On the other hand, families with 1 or 2 children have the lowest poverty rate of 0.0%, which includes 0 families.
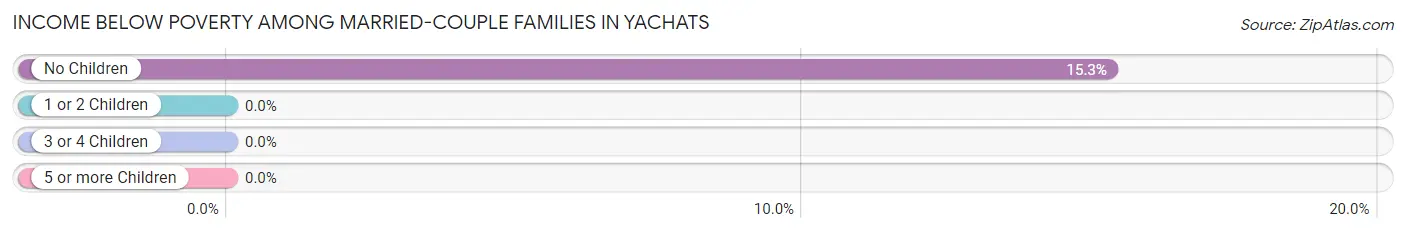
| Children | Above Poverty | Below Poverty |
| No Children | 127 (84.7%) | 23 (15.3%) |
| 1 or 2 Children | 15 (100.0%) | 0 (0.0%) |
| 3 or 4 Children | 0 (0.0%) | 0 (0.0%) |
| 5 or more Children | 0 (0.0%) | 0 (0.0%) |
| Total | 142 (86.1%) | 23 (13.9%) |
Income Below Poverty Among Single-Parent Households in Yachats
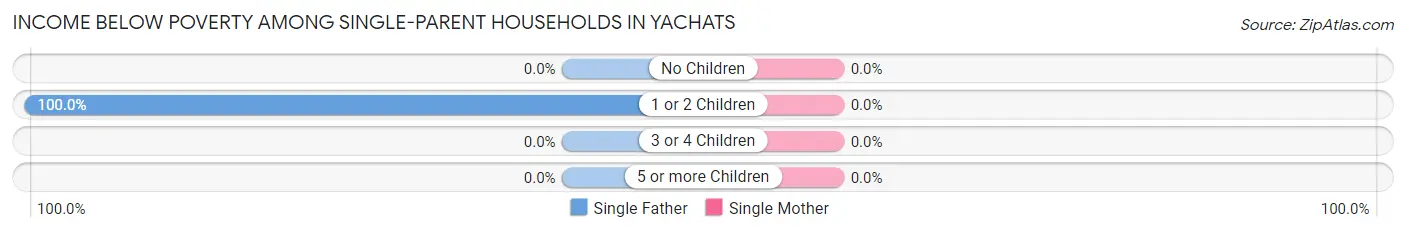
| Children | Single Father | Single Mother |
| No Children | 0 (0.0%) | 0 (0.0%) |
| 1 or 2 Children | 4 (100.0%) | 0 (0.0%) |
| 3 or 4 Children | 0 (0.0%) | 0 (0.0%) |
| 5 or more Children | 0 (0.0%) | 0 (0.0%) |
| Total | 4 (100.0%) | 0 (0.0%) |
Income Below Poverty Among Married-Couple vs Single-Parent Households in Yachats
The poverty data for Yachats shows that 23 of the married-couple family households (13.9%) and 4 of the single-parent households (14.8%) are living below the poverty level. Within the married-couple family households, those with no children have the highest poverty rate, with 23 households (15.3%) falling below the poverty line. Among the single-parent households, those with 1 or 2 children have the highest poverty rate, with 4 household (36.4%) living below poverty.
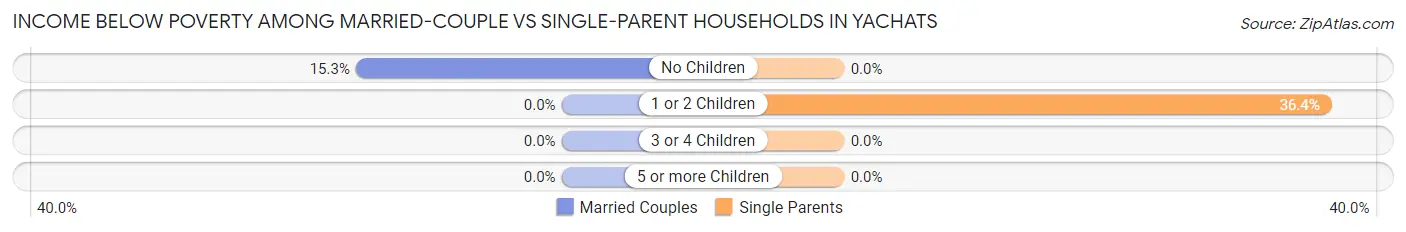
| Children | Married-Couple Families | Single-Parent Households |
| No Children | 23 (15.3%) | 0 (0.0%) |
| 1 or 2 Children | 0 (0.0%) | 4 (36.4%) |
| 3 or 4 Children | 0 (0.0%) | 0 (0.0%) |
| 5 or more Children | 0 (0.0%) | 0 (0.0%) |
| Total | 23 (13.9%) | 4 (14.8%) |
Race in Yachats
The most populous races in Yachats are White / Caucasian (670 | 86.8%), Hispanic or Latino (45 | 5.8%), and Some other Race (44 | 5.7%).
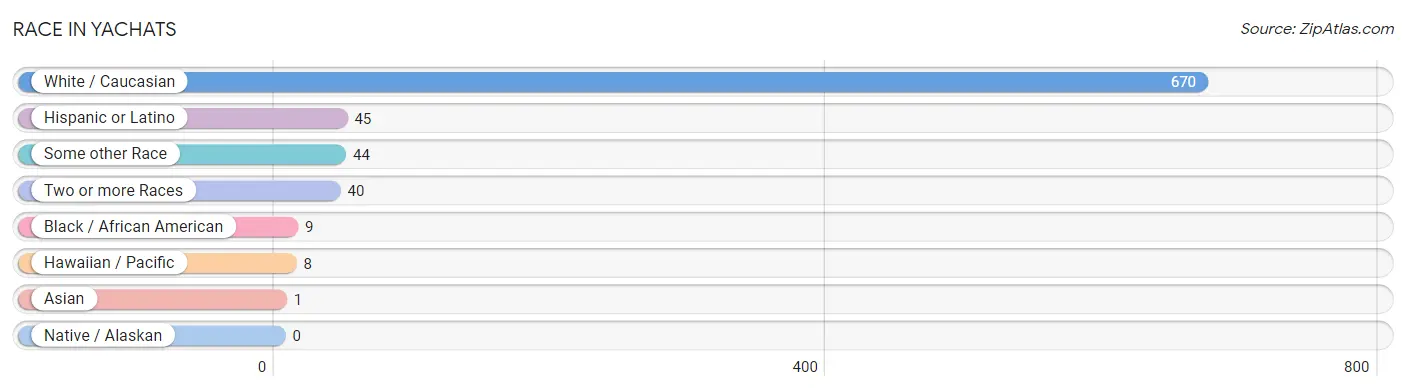
| Race | # Population | % Population |
| Asian | 1 | 0.1% |
| Black / African American | 9 | 1.2% |
| Hawaiian / Pacific | 8 | 1.0% |
| Hispanic or Latino | 45 | 5.8% |
| Native / Alaskan | 0 | 0.0% |
| White / Caucasian | 670 | 86.8% |
| Two or more Races | 40 | 5.2% |
| Some other Race | 44 | 5.7% |
| Total | 772 | 100.0% |
Ancestry in Yachats
The most populous ancestries reported in Yachats are German (115 | 14.9%), English (92 | 11.9%), Irish (50 | 6.5%), Finnish (48 | 6.2%), and Mexican (44 | 5.7%), together accounting for 45.2% of all Yachats residents.
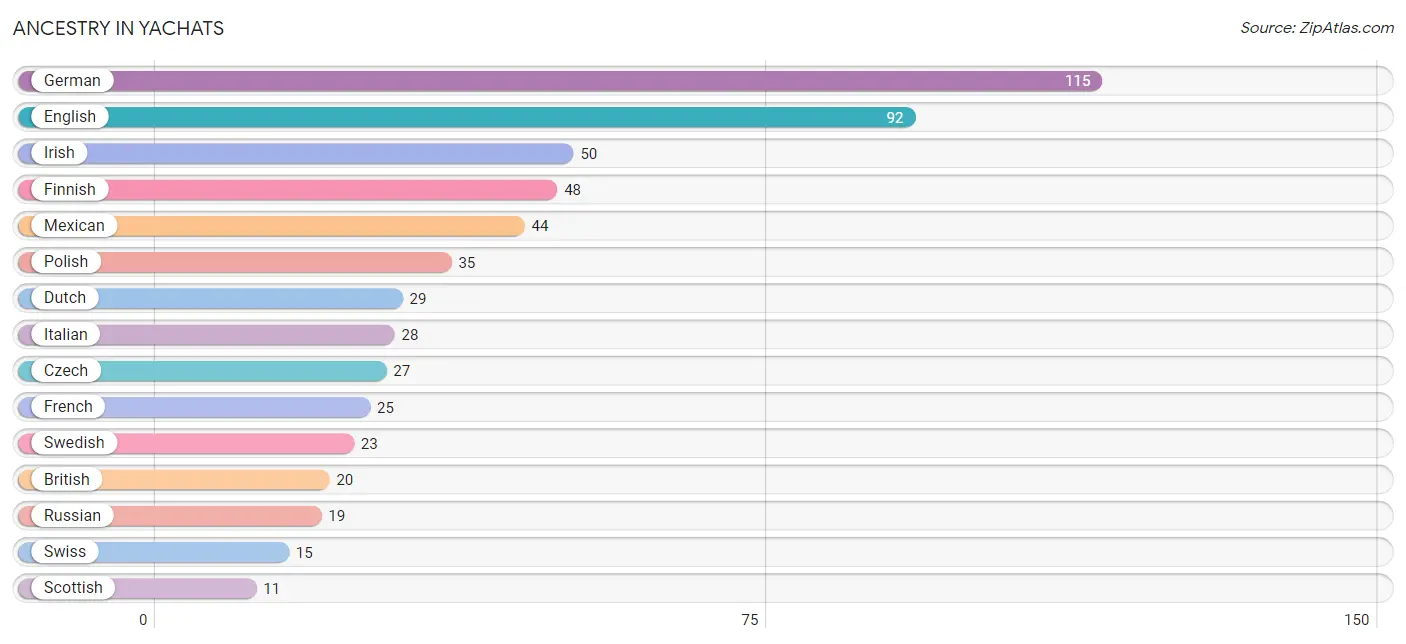
| Ancestry | # Population | % Population |
| Belgian | 7 | 0.9% |
| Bhutanese | 7 | 0.9% |
| British | 20 | 2.6% |
| Canadian | 4 | 0.5% |
| Central American | 1 | 0.1% |
| Czech | 27 | 3.5% |
| Dutch | 29 | 3.8% |
| English | 92 | 11.9% |
| European | 10 | 1.3% |
| Finnish | 48 | 6.2% |
| French | 25 | 3.2% |
| German | 115 | 14.9% |
| Hungarian | 7 | 0.9% |
| Indian (Asian) | 10 | 1.3% |
| Irish | 50 | 6.5% |
| Italian | 28 | 3.6% |
| Lithuanian | 8 | 1.0% |
| Mexican | 44 | 5.7% |
| Native Hawaiian | 8 | 1.0% |
| Panamanian | 1 | 0.1% |
| Polish | 35 | 4.5% |
| Russian | 19 | 2.5% |
| Scandinavian | 1 | 0.1% |
| Scotch-Irish | 7 | 0.9% |
| Scottish | 11 | 1.4% |
| Slavic | 6 | 0.8% |
| Swedish | 23 | 3.0% |
| Swiss | 15 | 1.9% |
| Welsh | 7 | 0.9% | View All 29 Rows |
Immigrants in Yachats
The most numerous immigrant groups reported in Yachats came from Central America (45 | 5.8%), Latin America (45 | 5.8%), Mexico (44 | 5.7%), Asia (10 | 1.3%), and China (10 | 1.3%), together accounting for 20.0% of all Yachats residents.
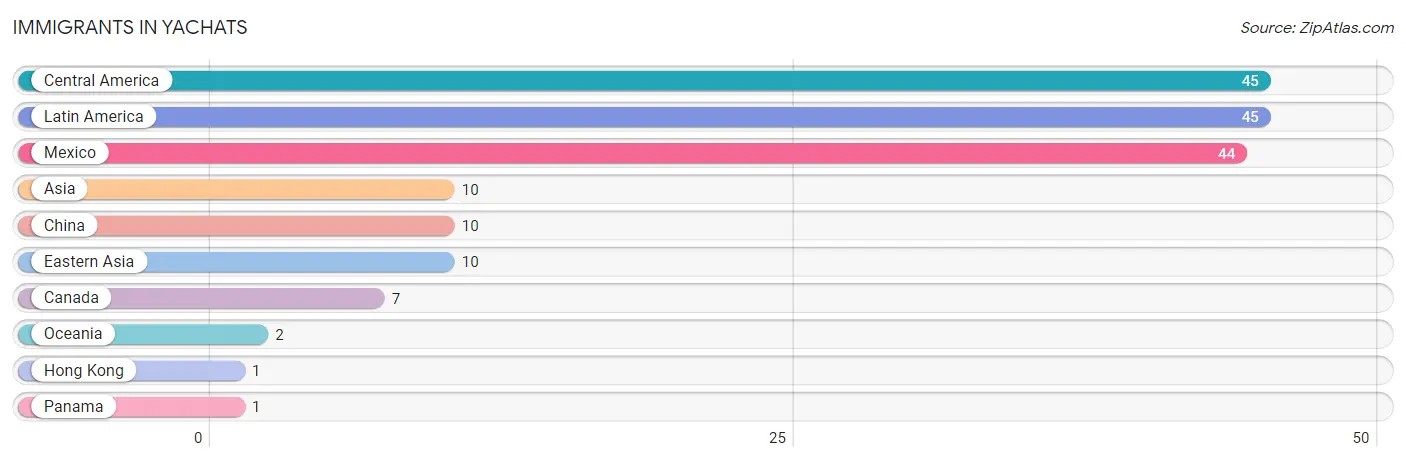
| Immigration Origin | # Population | % Population |
| Asia | 10 | 1.3% |
| Canada | 7 | 0.9% |
| Central America | 45 | 5.8% |
| China | 10 | 1.3% |
| Eastern Asia | 10 | 1.3% |
| Hong Kong | 1 | 0.1% |
| Latin America | 45 | 5.8% |
| Mexico | 44 | 5.7% |
| Oceania | 2 | 0.3% |
| Panama | 1 | 0.1% | View All 10 Rows |
Sex and Age in Yachats
Sex and Age in Yachats
The most populous age groups in Yachats are 60 to 64 Years (46 | 11.9%) for men and 85 Years and over (55 | 14.2%) for women.
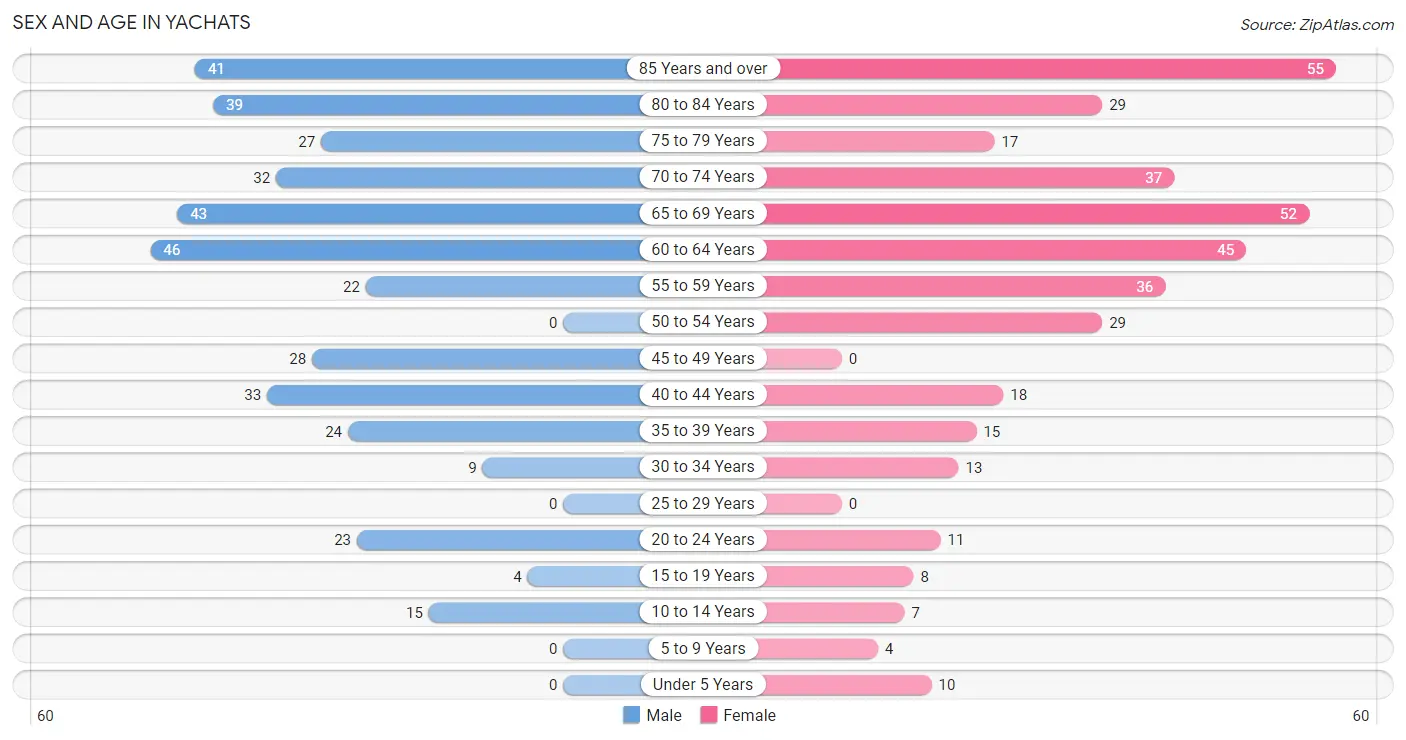
| Age Bracket | Male | Female |
| Under 5 Years | 0 (0.0%) | 10 (2.6%) |
| 5 to 9 Years | 0 (0.0%) | 4 (1.0%) |
| 10 to 14 Years | 15 (3.9%) | 7 (1.8%) |
| 15 to 19 Years | 4 (1.0%) | 8 (2.1%) |
| 20 to 24 Years | 23 (6.0%) | 11 (2.9%) |
| 25 to 29 Years | 0 (0.0%) | 0 (0.0%) |
| 30 to 34 Years | 9 (2.3%) | 13 (3.4%) |
| 35 to 39 Years | 24 (6.2%) | 15 (3.9%) |
| 40 to 44 Years | 33 (8.6%) | 18 (4.7%) |
| 45 to 49 Years | 28 (7.2%) | 0 (0.0%) |
| 50 to 54 Years | 0 (0.0%) | 29 (7.5%) |
| 55 to 59 Years | 22 (5.7%) | 36 (9.3%) |
| 60 to 64 Years | 46 (11.9%) | 45 (11.7%) |
| 65 to 69 Years | 43 (11.1%) | 52 (13.5%) |
| 70 to 74 Years | 32 (8.3%) | 37 (9.6%) |
| 75 to 79 Years | 27 (7.0%) | 17 (4.4%) |
| 80 to 84 Years | 39 (10.1%) | 29 (7.5%) |
| 85 Years and over | 41 (10.6%) | 55 (14.2%) |
| Total | 386 (100.0%) | 386 (100.0%) |
Families and Households in Yachats
Median Family Size in Yachats
The median family size in Yachats is 2.35 persons per family, with single male/father families (4 | 2.1%) accounting for the largest median family size of 3.25 persons per family. On the other hand, single female/mother families (23 | 12.0%) represent the smallest median family size with 2.30 persons per family.
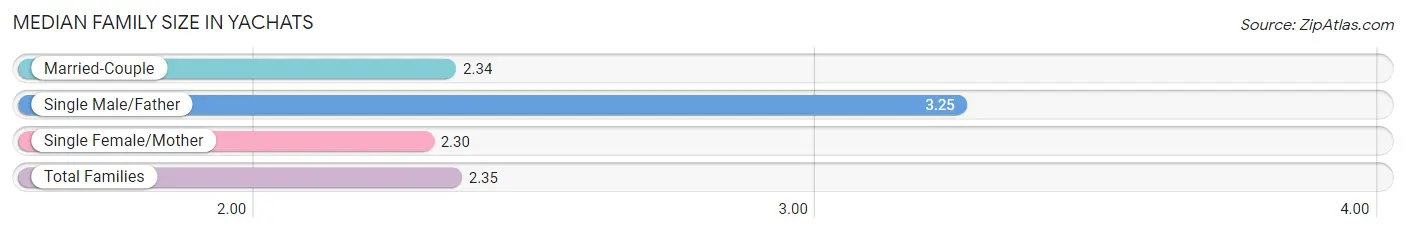
| Family Type | # Families | Family Size |
| Married-Couple | 165 (85.9%) | 2.34 |
| Single Male/Father | 4 (2.1%) | 3.25 |
| Single Female/Mother | 23 (12.0%) | 2.30 |
| Total Families | 192 (100.0%) | 2.35 |
Median Household Size in Yachats
The median household size in Yachats is 1.68 persons per household, with single male/father households (4 | 0.9%) accounting for the largest median household size of 3.25 persons per household. non-family households (259 | 57.4%) represent the smallest median household size with 1.19 persons per household.
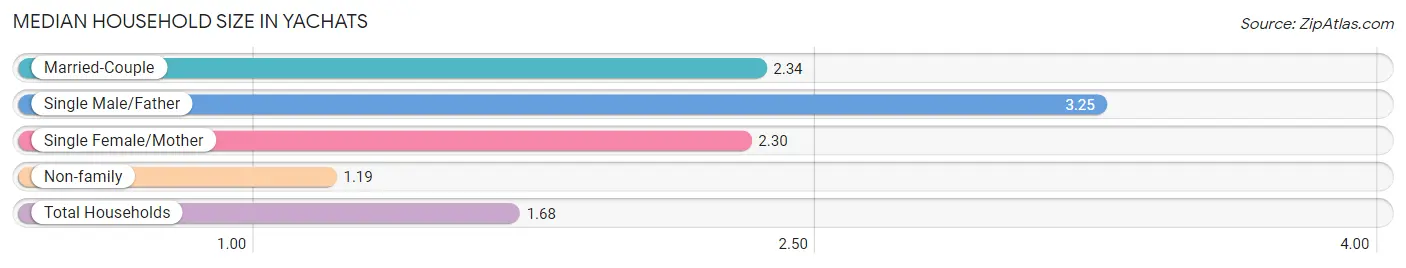
| Household Type | # Households | Household Size |
| Married-Couple | 165 (36.6%) | 2.34 |
| Single Male/Father | 4 (0.9%) | 3.25 |
| Single Female/Mother | 23 (5.1%) | 2.30 |
| Non-family | 259 (57.4%) | 1.19 |
| Total Households | 451 (100.0%) | 1.68 |
Household Size by Marriage Status in Yachats
Out of a total of 451 households in Yachats, 192 (42.6%) are family households, while 259 (57.4%) are nonfamily households. The most numerous type of family households are 2-person households, comprising 136, and the most common type of nonfamily households are 1-person households, comprising 238.
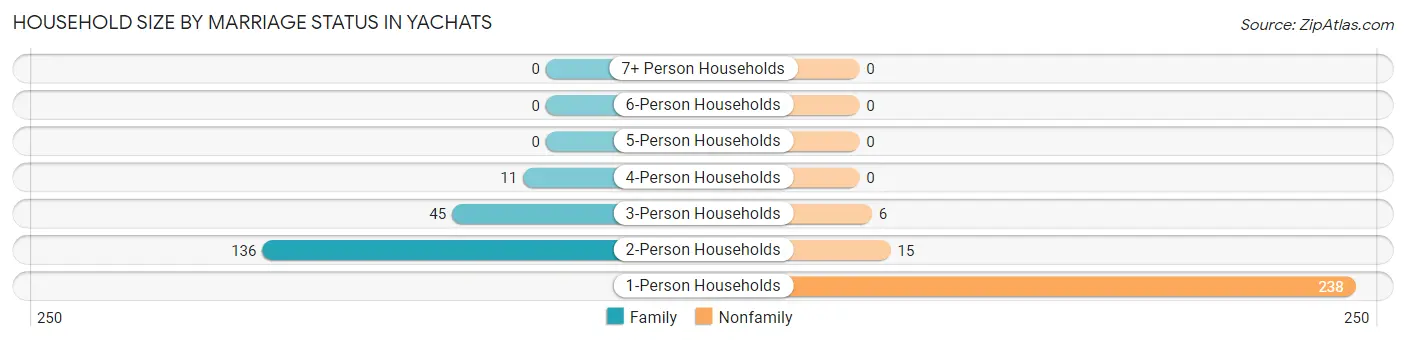
| Household Size | Family Households | Nonfamily Households |
| 1-Person Households | - | 238 (52.8%) |
| 2-Person Households | 136 (30.2%) | 15 (3.3%) |
| 3-Person Households | 45 (10.0%) | 6 (1.3%) |
| 4-Person Households | 11 (2.4%) | 0 (0.0%) |
| 5-Person Households | 0 (0.0%) | 0 (0.0%) |
| 6-Person Households | 0 (0.0%) | 0 (0.0%) |
| 7+ Person Households | 0 (0.0%) | 0 (0.0%) |
| Total | 192 (42.6%) | 259 (57.4%) |
Female Fertility in Yachats
Fertility by Age in Yachats
| Age Bracket | Women with Births | Births / 1,000 Women |
| 15 to 19 years | 0 (0.0%) | 0.0 |
| 20 to 34 years | 0 (0.0%) | 0.0 |
| 35 to 50 years | 0 (0.0%) | 0.0 |
| Total | 0 (0.0%) | 0.0 |
Fertility by Age by Marriage Status in Yachats
| Age Bracket | Married | Unmarried |
| 15 to 19 years | 0 (0.0%) | 0 (0.0%) |
| 20 to 34 years | 0 (0.0%) | 0 (0.0%) |
| 35 to 50 years | 0 (0.0%) | 0 (0.0%) |
| Total | 0 (0.0%) | 0 (0.0%) |
Fertility by Education in Yachats
| Educational Attainment | Women with Births | Births / 1,000 Women |
| Less than High School | 0 (0.0%) | 0.0 |
| High School Diploma | 0 (0.0%) | 0.0 |
| College or Associate's Degree | 0 (0.0%) | 0.0 |
| Bachelor's Degree | 0 (0.0%) | 0.0 |
| Graduate Degree | 0 (0.0%) | 0.0 |
| Total | 0 (0.0%) | 0.0 |
Fertility by Education by Marriage Status in Yachats
| Educational Attainment | Married | Unmarried |
| Less than High School | 0 (0.0%) | 0 (0.0%) |
| High School Diploma | 0 (0.0%) | 0 (0.0%) |
| College or Associate's Degree | 0 (0.0%) | 0 (0.0%) |
| Bachelor's Degree | 0 (0.0%) | 0 (0.0%) |
| Graduate Degree | 0 (0.0%) | 0 (0.0%) |
| Total | 0 (0.0%) | 0 (0.0%) |
Employment Characteristics in Yachats
Employment by Class of Employer in Yachats
Among the 278 employed individuals in Yachats, private company employees (135 | 48.6%), self-employed (not incorporated) (60 | 21.6%), and federal government employees (29 | 10.4%) make up the most common classes of employment.
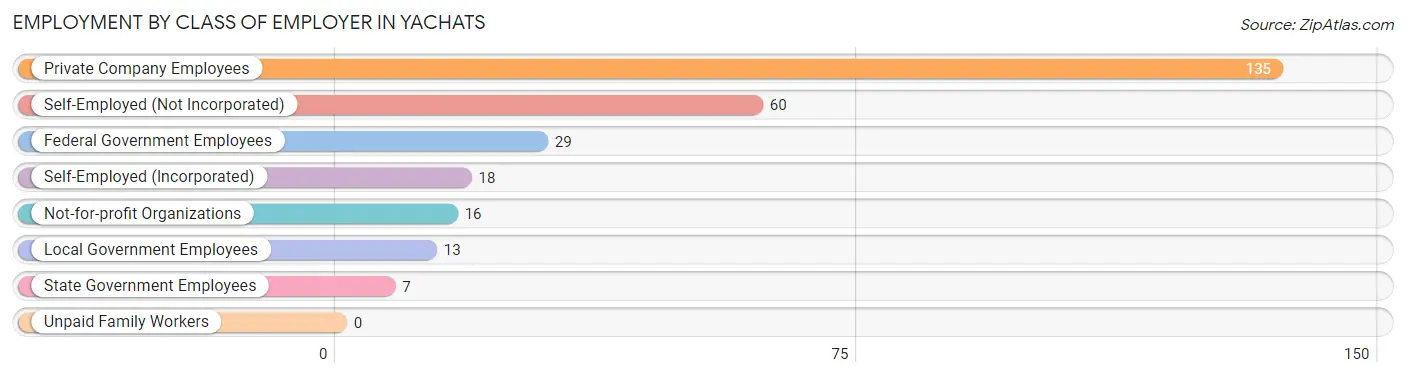
| Employer Class | # Employees | % Employees |
| Private Company Employees | 135 | 48.6% |
| Self-Employed (Incorporated) | 18 | 6.5% |
| Self-Employed (Not Incorporated) | 60 | 21.6% |
| Not-for-profit Organizations | 16 | 5.8% |
| Local Government Employees | 13 | 4.7% |
| State Government Employees | 7 | 2.5% |
| Federal Government Employees | 29 | 10.4% |
| Unpaid Family Workers | 0 | 0.0% |
| Total | 278 | 100.0% |
Employment Status by Age in Yachats
According to the labor force statistics for Yachats, out of the total population over 16 years of age (736), 42.7% or 314 individuals are in the labor force, with 11.5% or 36 of them unemployed. The age group with the highest labor force participation rate is 30 to 34 years, with 100.0% or 22 individuals in the labor force. Within the labor force, the 45 to 54 years age range has the highest percentage of unemployed individuals, with 54.1% or 20 of them being unemployed.
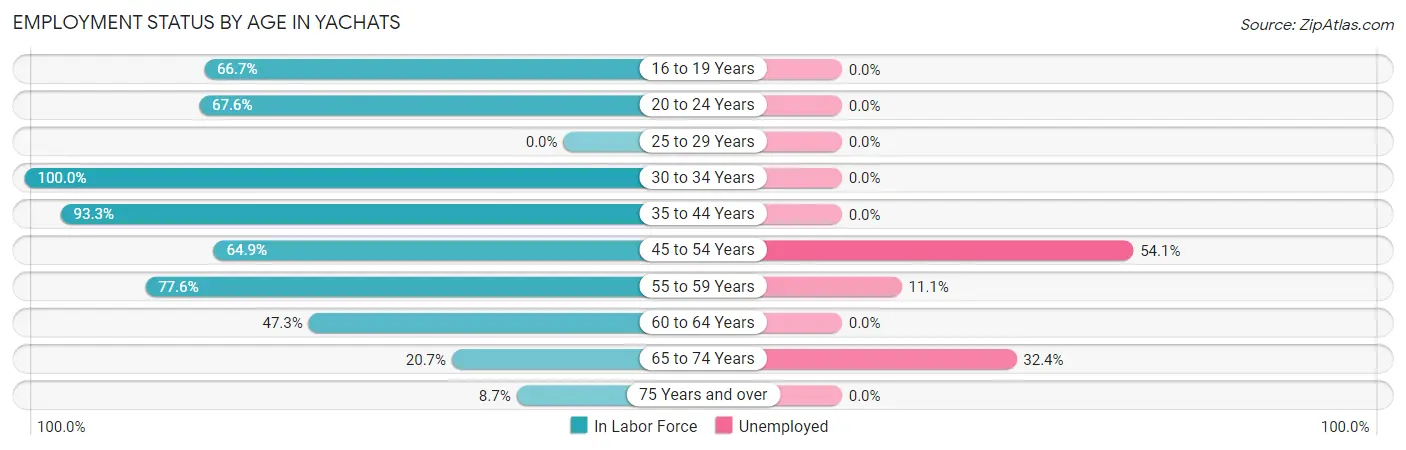
| Age Bracket | In Labor Force | Unemployed |
| 16 to 19 Years | 8 (66.7%) | 0 (0.0%) |
| 20 to 24 Years | 23 (67.6%) | 0 (0.0%) |
| 25 to 29 Years | 0 (0.0%) | 0 (0.0%) |
| 30 to 34 Years | 22 (100.0%) | 0 (0.0%) |
| 35 to 44 Years | 84 (93.3%) | 0 (0.0%) |
| 45 to 54 Years | 37 (64.9%) | 20 (54.1%) |
| 55 to 59 Years | 45 (77.6%) | 5 (11.1%) |
| 60 to 64 Years | 43 (47.3%) | 0 (0.0%) |
| 65 to 74 Years | 34 (20.7%) | 11 (32.4%) |
| 75 Years and over | 18 (8.7%) | 0 (0.0%) |
| Total | 314 (42.7%) | 36 (11.5%) |
Employment Status by Educational Attainment in Yachats
According to labor force statistics for Yachats, 72.6% of individuals (231) out of the total population between 25 and 64 years of age (318) are in the labor force, with 10.8% or 25 of them being unemployed. The group with the highest labor force participation rate are those with the educational attainment of less than high school, with 100.0% or 22 individuals in the labor force. Within the labor force, individuals with college / associate degree education have the highest percentage of unemployment, with 17.5% or 20 of them being unemployed.
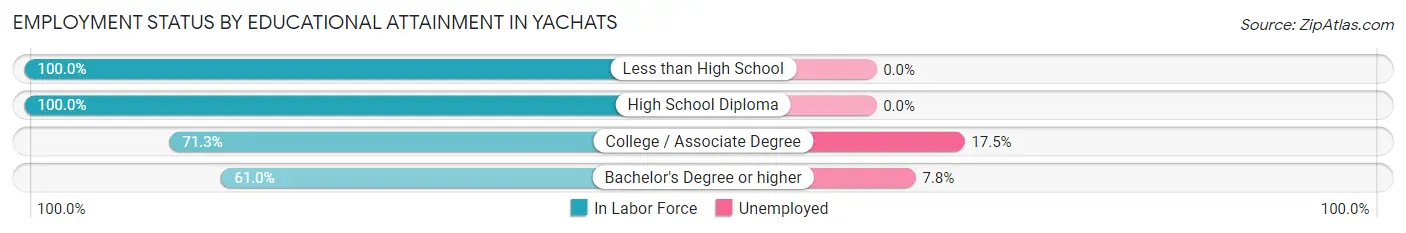
| Educational Attainment | In Labor Force | Unemployed |
| Less than High School | 22 (100.0%) | 0 (0.0%) |
| High School Diploma | 31 (100.0%) | 0 (0.0%) |
| College / Associate Degree | 114 (71.3%) | 28 (17.5%) |
| Bachelor's Degree or higher | 64 (61.0%) | 8 (7.8%) |
| Total | 231 (72.6%) | 34 (10.8%) |
Employment Occupations by Sex in Yachats
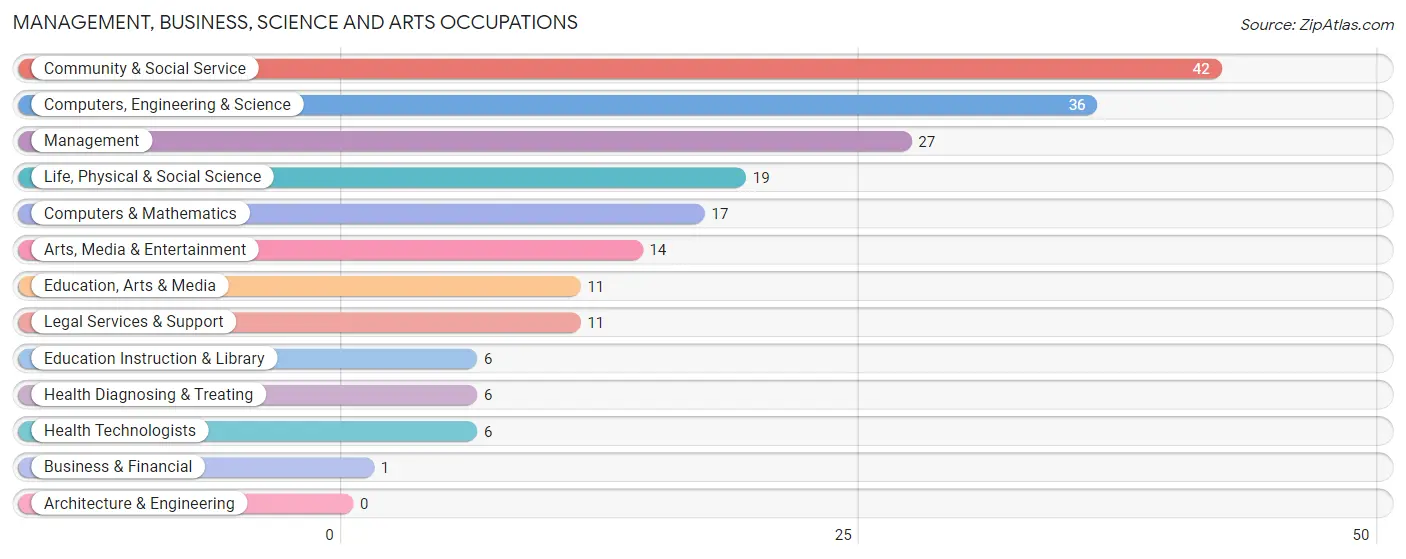
Management, Business, Science and Arts Occupations
The most common Management, Business, Science and Arts occupations in Yachats are Community & Social Service (42 | 15.1%), Computers, Engineering & Science (36 | 13.0%), Management (27 | 9.7%), Life, Physical & Social Science (19 | 6.8%), and Computers & Mathematics (17 | 6.1%).
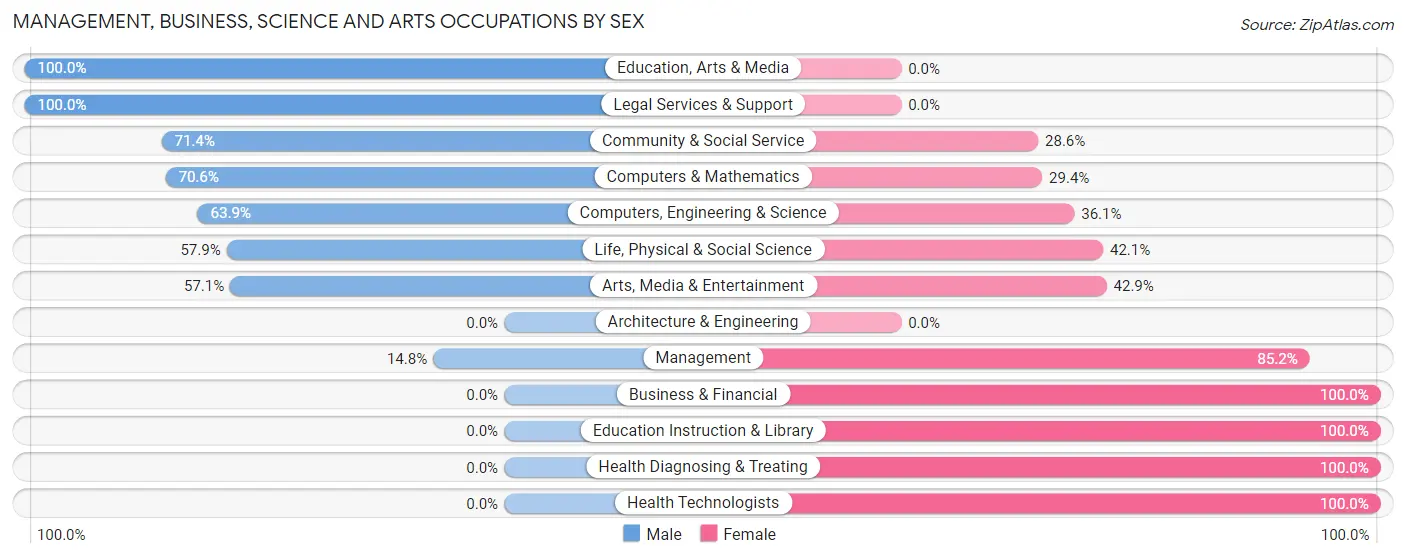
Management, Business, Science and Arts Occupations by Sex
Within the Management, Business, Science and Arts occupations in Yachats, the most male-oriented occupations are Education, Arts & Media (100.0%), Legal Services & Support (100.0%), and Community & Social Service (71.4%), while the most female-oriented occupations are Business & Financial (100.0%), Education Instruction & Library (100.0%), and Health Diagnosing & Treating (100.0%).
| Occupation | Male | Female |
| Management | 4 (14.8%) | 23 (85.2%) |
| Business & Financial | 0 (0.0%) | 1 (100.0%) |
| Computers, Engineering & Science | 23 (63.9%) | 13 (36.1%) |
| Computers & Mathematics | 12 (70.6%) | 5 (29.4%) |
| Architecture & Engineering | 0 (0.0%) | 0 (0.0%) |
| Life, Physical & Social Science | 11 (57.9%) | 8 (42.1%) |
| Community & Social Service | 30 (71.4%) | 12 (28.6%) |
| Education, Arts & Media | 11 (100.0%) | 0 (0.0%) |
| Legal Services & Support | 11 (100.0%) | 0 (0.0%) |
| Education Instruction & Library | 0 (0.0%) | 6 (100.0%) |
| Arts, Media & Entertainment | 8 (57.1%) | 6 (42.9%) |
| Health Diagnosing & Treating | 0 (0.0%) | 6 (100.0%) |
| Health Technologists | 0 (0.0%) | 6 (100.0%) |
| Total (Category) | 57 (50.9%) | 55 (49.1%) |
| Total (Overall) | 150 (54.0%) | 128 (46.0%) |
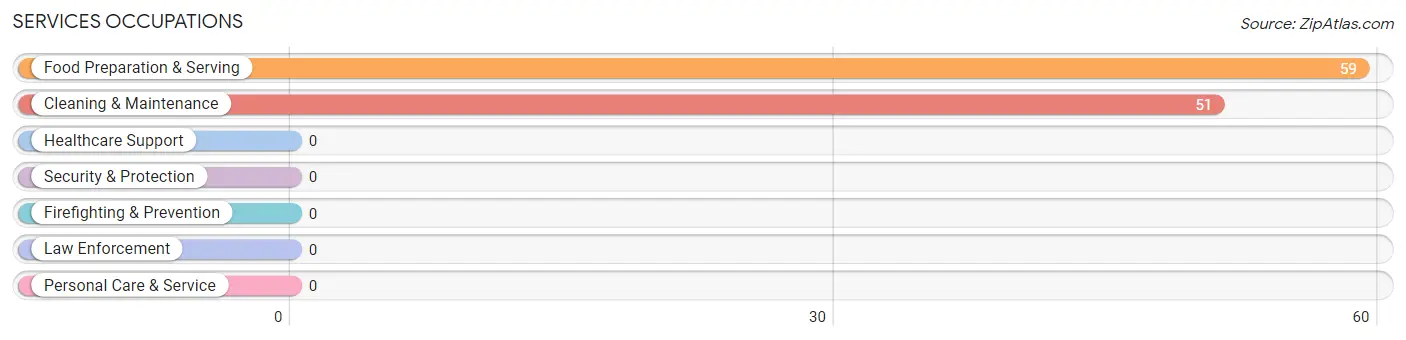
Services Occupations
The most common Services occupations in Yachats are Food Preparation & Serving (59 | 21.2%), and Cleaning & Maintenance (51 | 18.3%).
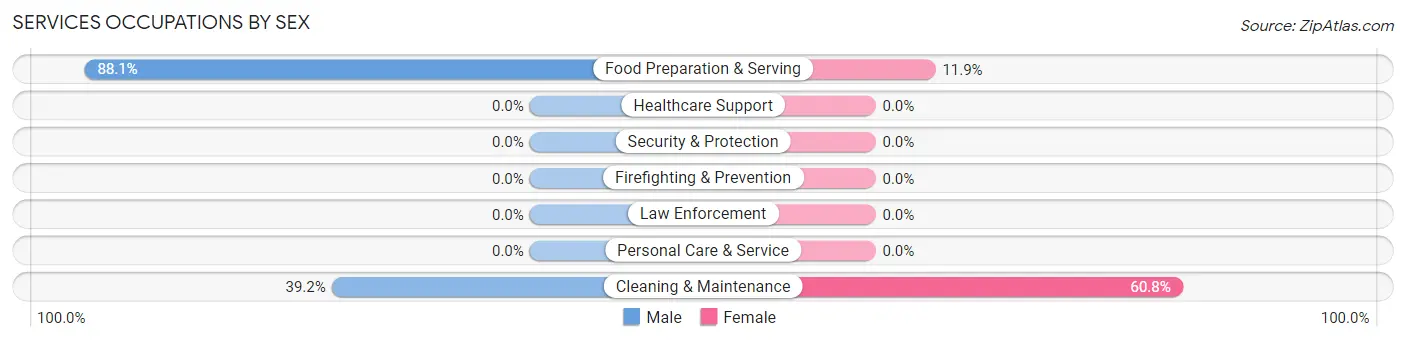
Services Occupations by Sex
Within the Services occupations in Yachats, the most male-oriented occupations are Food Preparation & Serving (88.1%), and Cleaning & Maintenance (39.2%), while the most female-oriented occupations are Cleaning & Maintenance (60.8%), and Food Preparation & Serving (11.9%).
| Occupation | Male | Female |
| Healthcare Support | 0 (0.0%) | 0 (0.0%) |
| Security & Protection | 0 (0.0%) | 0 (0.0%) |
| Firefighting & Prevention | 0 (0.0%) | 0 (0.0%) |
| Law Enforcement | 0 (0.0%) | 0 (0.0%) |
| Food Preparation & Serving | 52 (88.1%) | 7 (11.9%) |
| Cleaning & Maintenance | 20 (39.2%) | 31 (60.8%) |
| Personal Care & Service | 0 (0.0%) | 0 (0.0%) |
| Total (Category) | 72 (65.4%) | 38 (34.5%) |
| Total (Overall) | 150 (54.0%) | 128 (46.0%) |
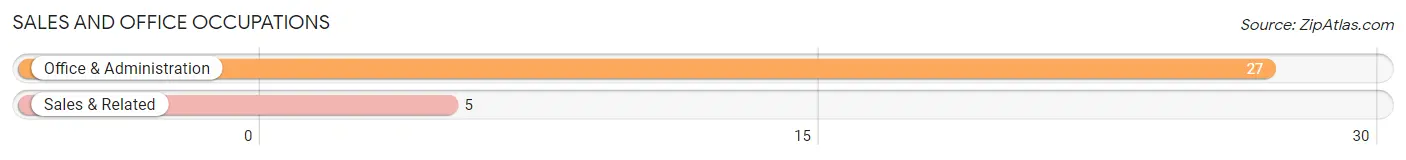
Sales and Office Occupations
The most common Sales and Office occupations in Yachats are Office & Administration (27 | 9.7%), and Sales & Related (5 | 1.8%).
Sales and Office Occupations by Sex
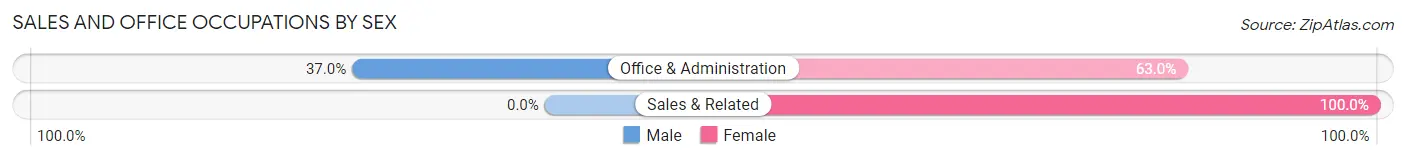
| Occupation | Male | Female |
| Sales & Related | 0 (0.0%) | 5 (100.0%) |
| Office & Administration | 10 (37.0%) | 17 (63.0%) |
| Total (Category) | 10 (31.2%) | 22 (68.8%) |
| Total (Overall) | 150 (54.0%) | 128 (46.0%) |
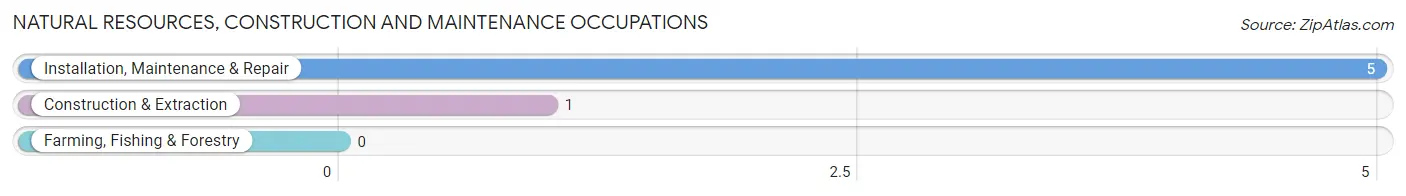
Natural Resources, Construction and Maintenance Occupations
The most common Natural Resources, Construction and Maintenance occupations in Yachats are Installation, Maintenance & Repair (5 | 1.8%), and Construction & Extraction (1 | 0.4%).
Natural Resources, Construction and Maintenance Occupations by Sex
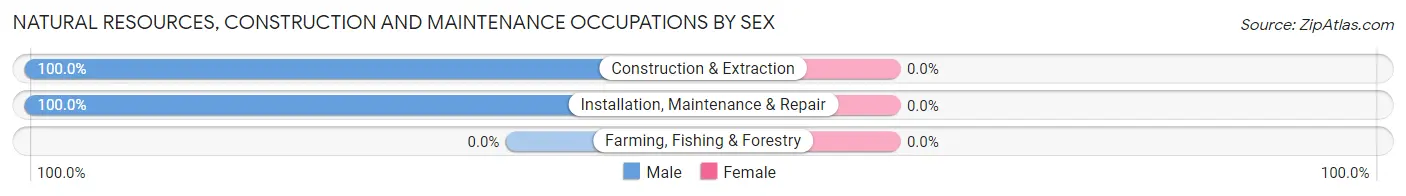
| Occupation | Male | Female |
| Farming, Fishing & Forestry | 0 (0.0%) | 0 (0.0%) |
| Construction & Extraction | 1 (100.0%) | 0 (0.0%) |
| Installation, Maintenance & Repair | 5 (100.0%) | 0 (0.0%) |
| Total (Category) | 6 (100.0%) | 0 (0.0%) |
| Total (Overall) | 150 (54.0%) | 128 (46.0%) |
Production, Transportation and Moving Occupations
The most common Production, Transportation and Moving occupations in Yachats are , and Production (18 | 6.5%).
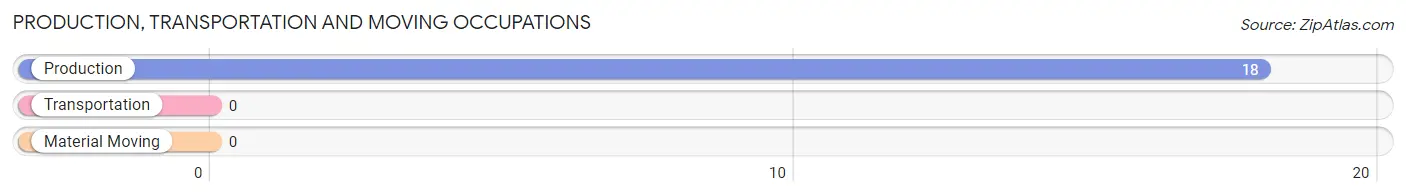
Production, Transportation and Moving Occupations by Sex
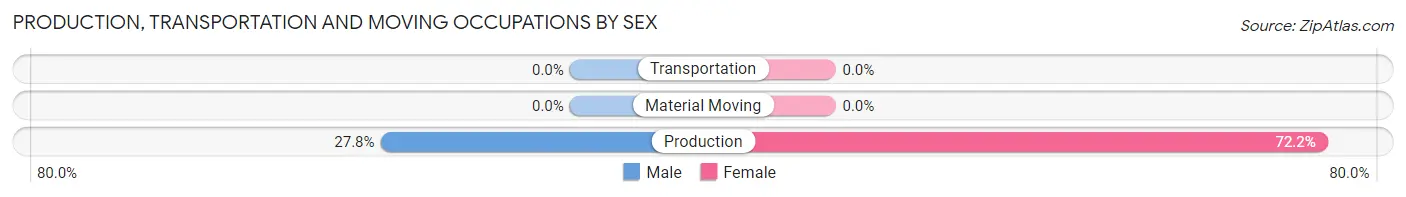
| Occupation | Male | Female |
| Production | 5 (27.8%) | 13 (72.2%) |
| Transportation | 0 (0.0%) | 0 (0.0%) |
| Material Moving | 0 (0.0%) | 0 (0.0%) |
| Total (Category) | 5 (27.8%) | 13 (72.2%) |
| Total (Overall) | 150 (54.0%) | 128 (46.0%) |
Employment Industries by Sex in Yachats
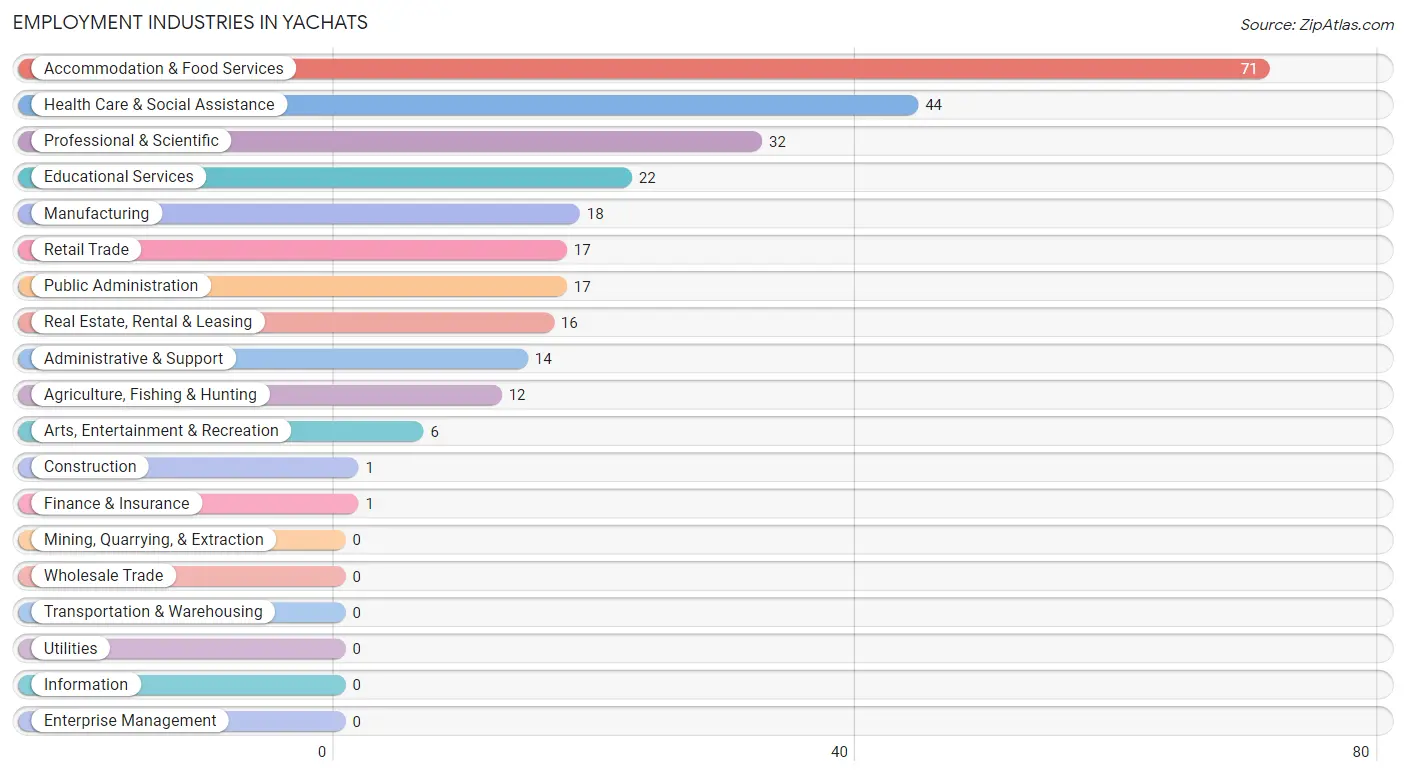
Employment Industries in Yachats
The major employment industries in Yachats include Accommodation & Food Services (71 | 25.5%), Health Care & Social Assistance (44 | 15.8%), Professional & Scientific (32 | 11.5%), Educational Services (22 | 7.9%), and Manufacturing (18 | 6.5%).
Employment Industries by Sex in Yachats
The Yachats industries that see more men than women are Agriculture, Fishing & Hunting (100.0%), Construction (100.0%), and Manufacturing (100.0%), whereas the industries that tend to have a higher number of women are Finance & Insurance (100.0%), Arts, Entertainment & Recreation (100.0%), and Real Estate, Rental & Leasing (68.8%).
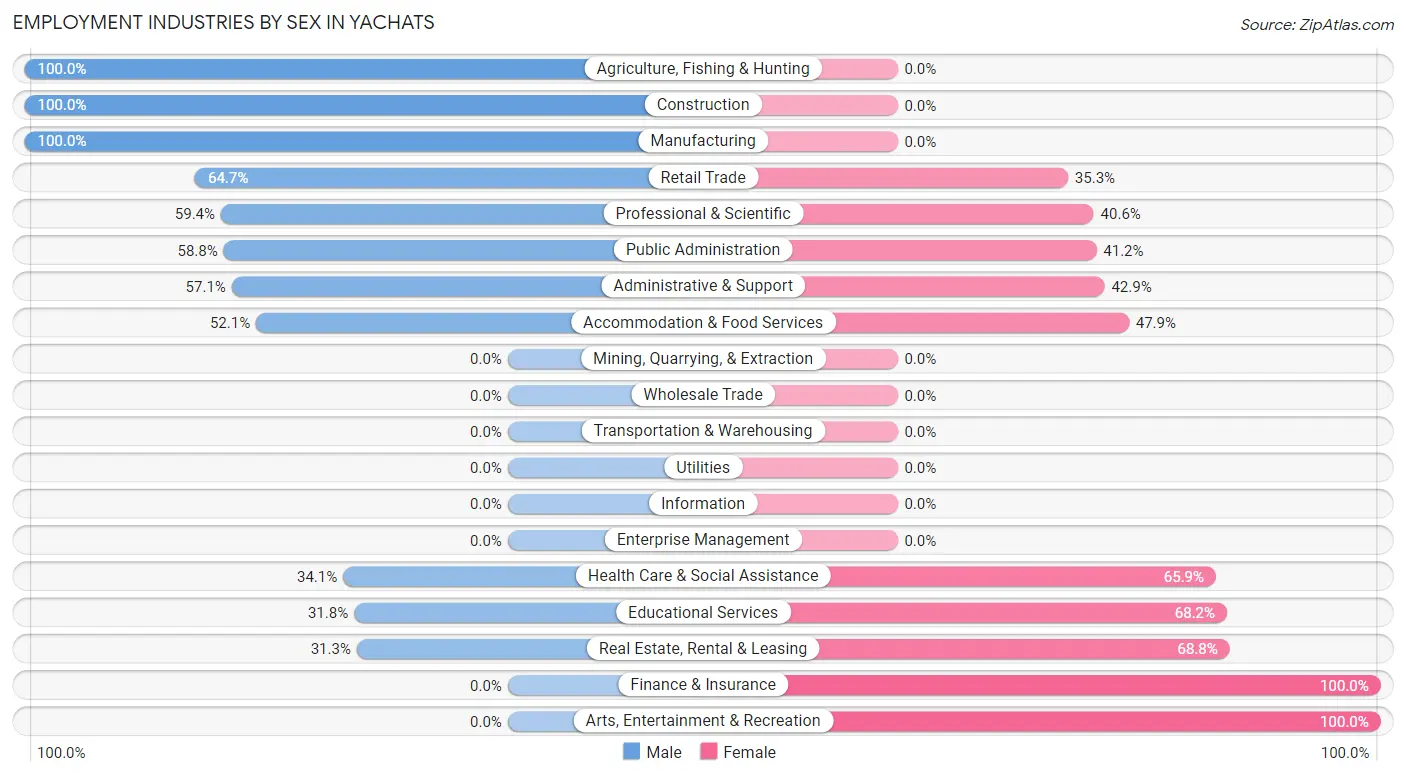
| Industry | Male | Female |
| Agriculture, Fishing & Hunting | 12 (100.0%) | 0 (0.0%) |
| Mining, Quarrying, & Extraction | 0 (0.0%) | 0 (0.0%) |
| Construction | 1 (100.0%) | 0 (0.0%) |
| Manufacturing | 18 (100.0%) | 0 (0.0%) |
| Wholesale Trade | 0 (0.0%) | 0 (0.0%) |
| Retail Trade | 11 (64.7%) | 6 (35.3%) |
| Transportation & Warehousing | 0 (0.0%) | 0 (0.0%) |
| Utilities | 0 (0.0%) | 0 (0.0%) |
| Information | 0 (0.0%) | 0 (0.0%) |
| Finance & Insurance | 0 (0.0%) | 1 (100.0%) |
| Real Estate, Rental & Leasing | 5 (31.2%) | 11 (68.8%) |
| Professional & Scientific | 19 (59.4%) | 13 (40.6%) |
| Enterprise Management | 0 (0.0%) | 0 (0.0%) |
| Administrative & Support | 8 (57.1%) | 6 (42.9%) |
| Educational Services | 7 (31.8%) | 15 (68.2%) |
| Health Care & Social Assistance | 15 (34.1%) | 29 (65.9%) |
| Arts, Entertainment & Recreation | 0 (0.0%) | 6 (100.0%) |
| Accommodation & Food Services | 37 (52.1%) | 34 (47.9%) |
| Public Administration | 10 (58.8%) | 7 (41.2%) |
| Total | 150 (54.0%) | 128 (46.0%) |
Education in Yachats
School Enrollment in Yachats
The most common levels of schooling among the 34 students in Yachats are middle school (22 | 64.7%), nursery / preschool (4 | 11.8%), and elementary school (4 | 11.8%).
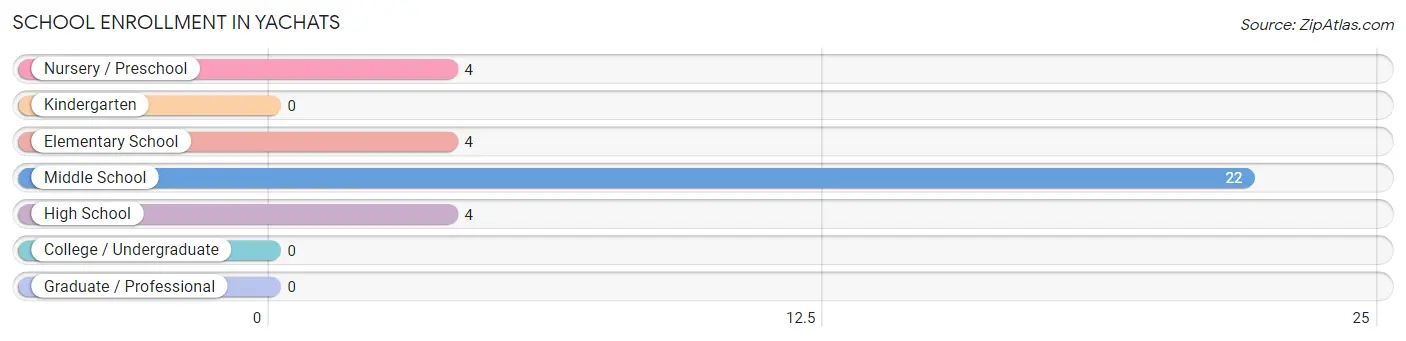
| School Level | # Students | % Students |
| Nursery / Preschool | 4 | 11.8% |
| Kindergarten | 0 | 0.0% |
| Elementary School | 4 | 11.8% |
| Middle School | 22 | 64.7% |
| High School | 4 | 11.8% |
| College / Undergraduate | 0 | 0.0% |
| Graduate / Professional | 0 | 0.0% |
| Total | 34 | 100.0% |
School Enrollment by Age by Funding Source in Yachats
Out of a total of 34 students who are enrolled in schools in Yachats, 15 (44.1%) attend a private institution, while the remaining 19 (55.9%) are enrolled in public schools. The age group of 10 to 14 year olds has the highest likelihood of being enrolled in private schools, with 15 (68.2% in the age bracket) enrolled. Conversely, the age group of 3 to 4 year olds has the lowest likelihood of being enrolled in a private school, with 4 (100.0% in the age bracket) attending a public institution.
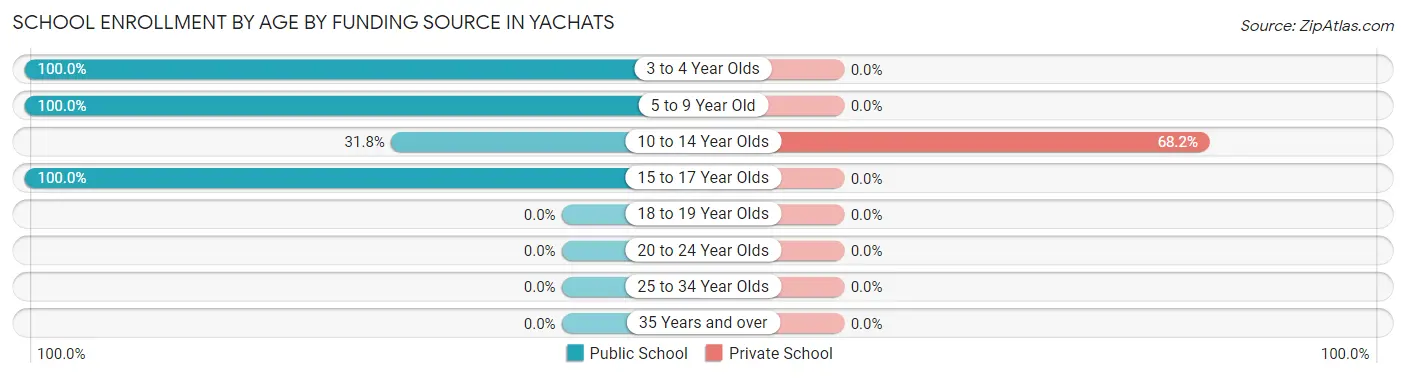
| Age Bracket | Public School | Private School |
| 3 to 4 Year Olds | 4 (100.0%) | 0 (0.0%) |
| 5 to 9 Year Old | 4 (100.0%) | 0 (0.0%) |
| 10 to 14 Year Olds | 7 (31.8%) | 15 (68.2%) |
| 15 to 17 Year Olds | 4 (100.0%) | 0 (0.0%) |
| 18 to 19 Year Olds | 0 (0.0%) | 0 (0.0%) |
| 20 to 24 Year Olds | 0 (0.0%) | 0 (0.0%) |
| 25 to 34 Year Olds | 0 (0.0%) | 0 (0.0%) |
| 35 Years and over | 0 (0.0%) | 0 (0.0%) |
| Total | 19 (55.9%) | 15 (44.1%) |
Educational Attainment by Field of Study in Yachats
Education (63 | 14.9%), physical & health sciences (46 | 10.9%), science & technology (45 | 10.7%), business (42 | 10.0%), and bio, nature & agricultural (39 | 9.2%) are the most common fields of study among 422 individuals in Yachats who have obtained a bachelor's degree or higher.
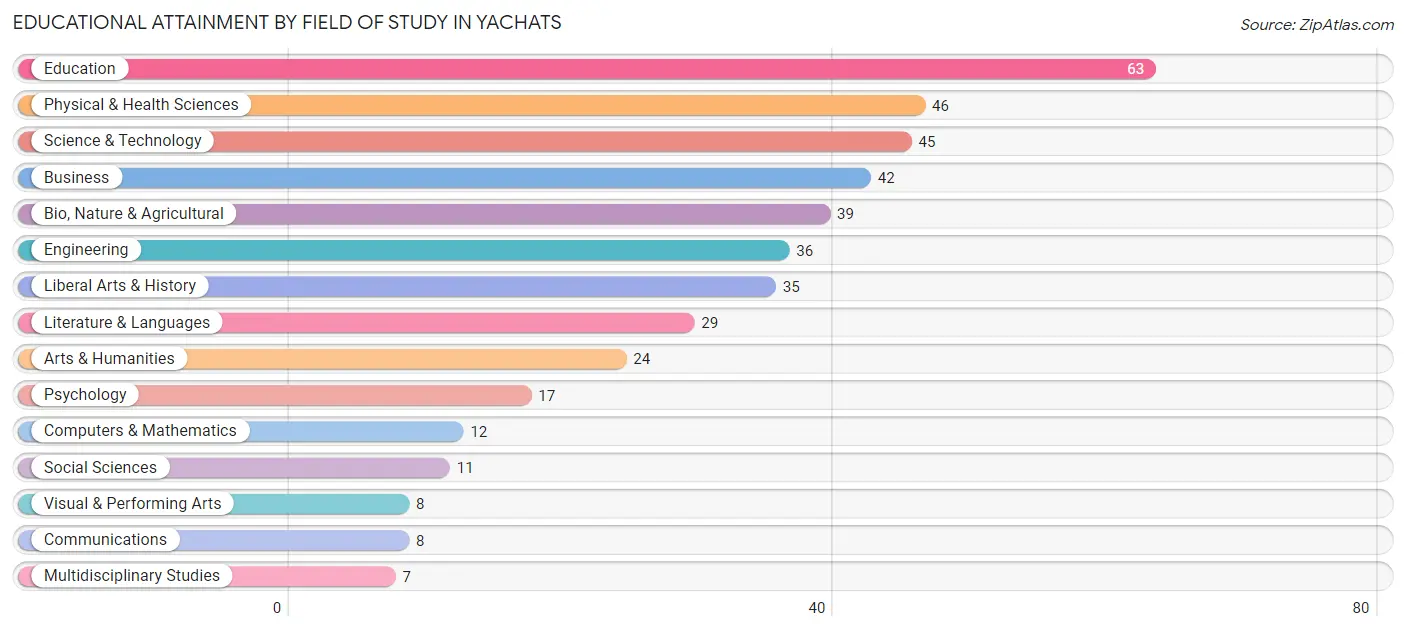
| Field of Study | # Graduates | % Graduates |
| Computers & Mathematics | 12 | 2.8% |
| Bio, Nature & Agricultural | 39 | 9.2% |
| Physical & Health Sciences | 46 | 10.9% |
| Psychology | 17 | 4.0% |
| Social Sciences | 11 | 2.6% |
| Engineering | 36 | 8.5% |
| Multidisciplinary Studies | 7 | 1.7% |
| Science & Technology | 45 | 10.7% |
| Business | 42 | 10.0% |
| Education | 63 | 14.9% |
| Literature & Languages | 29 | 6.9% |
| Liberal Arts & History | 35 | 8.3% |
| Visual & Performing Arts | 8 | 1.9% |
| Communications | 8 | 1.9% |
| Arts & Humanities | 24 | 5.7% |
| Total | 422 | 100.0% |
Transportation & Commute in Yachats
Vehicle Availability by Sex in Yachats
The most prevalent vehicle ownership categories in Yachats are males with 1 vehicle (102, accounting for 68.0%) and females with 1 vehicle (42, making up 79.7%).
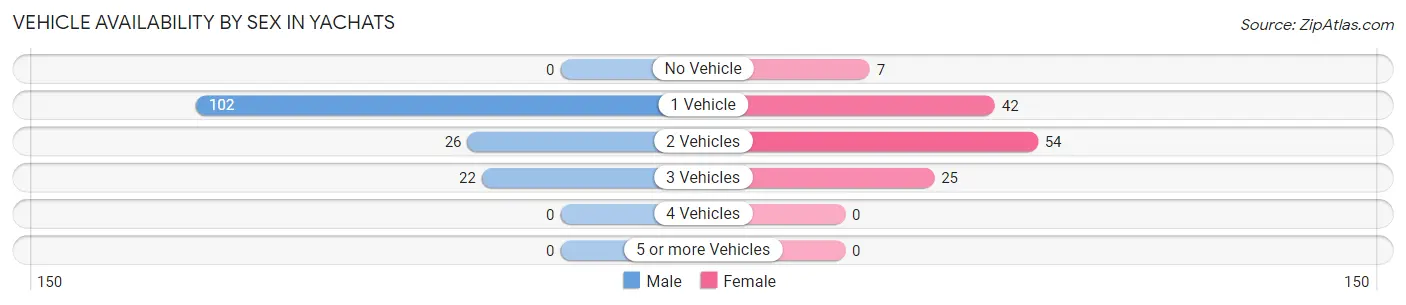
| Vehicles Available | Male | Female |
| No Vehicle | 0 (0.0%) | 7 (5.5%) |
| 1 Vehicle | 102 (68.0%) | 42 (32.8%) |
| 2 Vehicles | 26 (17.3%) | 54 (42.2%) |
| 3 Vehicles | 22 (14.7%) | 25 (19.5%) |
| 4 Vehicles | 0 (0.0%) | 0 (0.0%) |
| 5 or more Vehicles | 0 (0.0%) | 0 (0.0%) |
| Total | 150 (100.0%) | 128 (100.0%) |
Commute Time in Yachats
The most frequently occuring commute durations in Yachats are 5 to 9 minutes (102 commuters, 51.0%), less than 5 minutes (50 commuters, 25.0%), and 10 to 14 minutes (26 commuters, 13.0%).
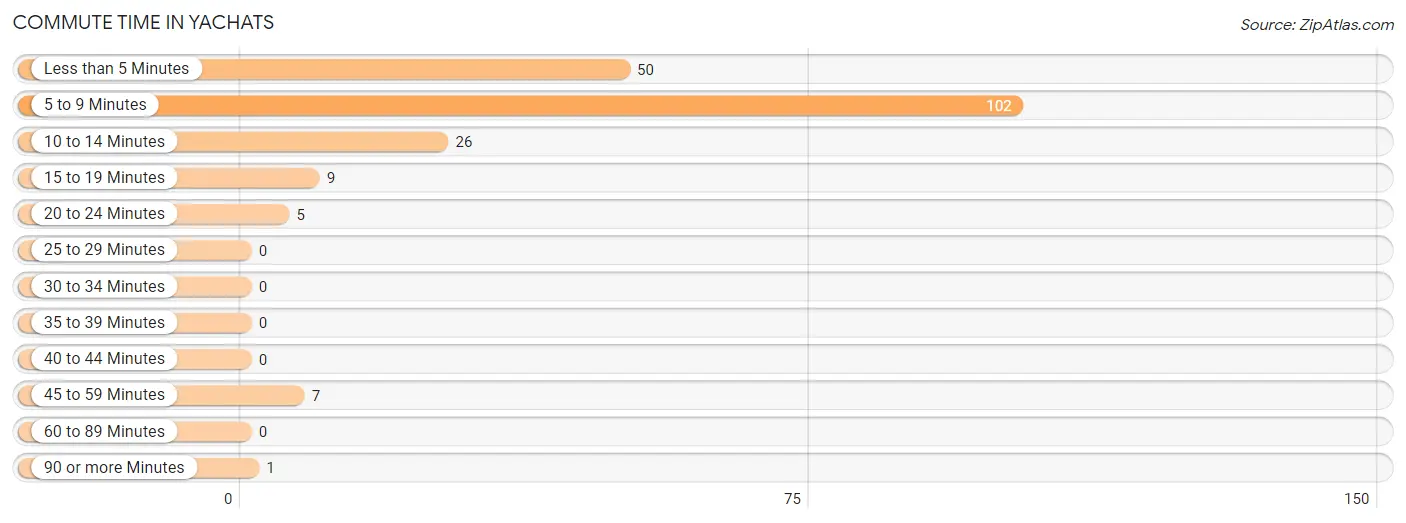
| Commute Time | # Commuters | % Commuters |
| Less than 5 Minutes | 50 | 25.0% |
| 5 to 9 Minutes | 102 | 51.0% |
| 10 to 14 Minutes | 26 | 13.0% |
| 15 to 19 Minutes | 9 | 4.5% |
| 20 to 24 Minutes | 5 | 2.5% |
| 25 to 29 Minutes | 0 | 0.0% |
| 30 to 34 Minutes | 0 | 0.0% |
| 35 to 39 Minutes | 0 | 0.0% |
| 40 to 44 Minutes | 0 | 0.0% |
| 45 to 59 Minutes | 7 | 3.5% |
| 60 to 89 Minutes | 0 | 0.0% |
| 90 or more Minutes | 1 | 0.5% |
Commute Time by Sex in Yachats
The most common commute times in Yachats are 5 to 9 minutes (60 commuters, 51.7%) for males and 5 to 9 minutes (42 commuters, 50.0%) for females.
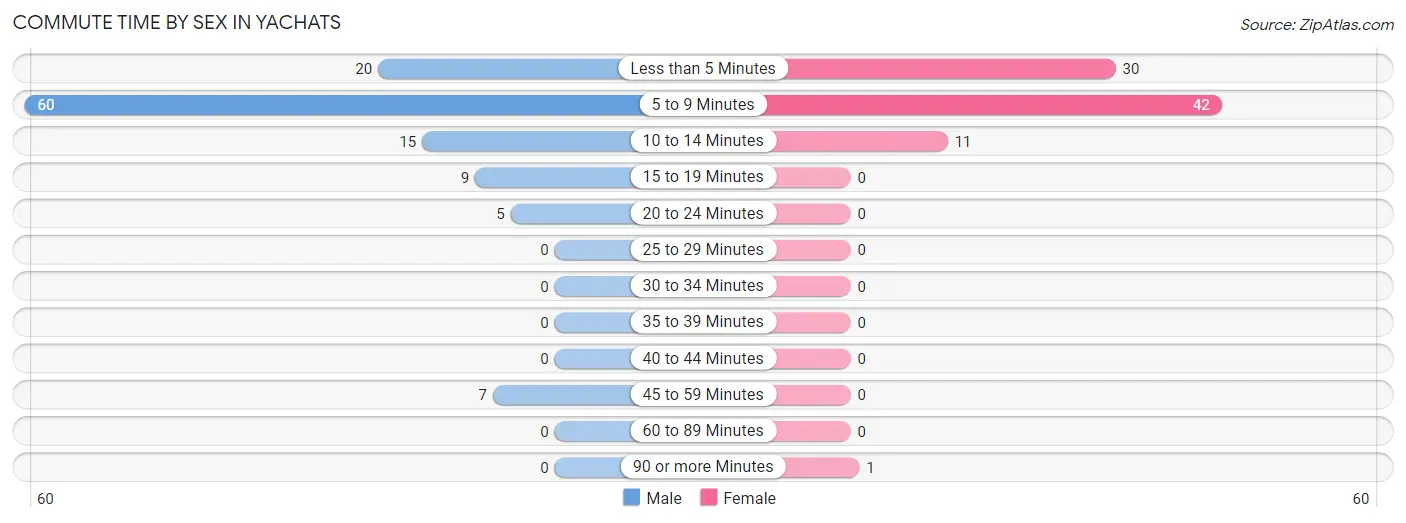
| Commute Time | Male | Female |
| Less than 5 Minutes | 20 (17.2%) | 30 (35.7%) |
| 5 to 9 Minutes | 60 (51.7%) | 42 (50.0%) |
| 10 to 14 Minutes | 15 (12.9%) | 11 (13.1%) |
| 15 to 19 Minutes | 9 (7.8%) | 0 (0.0%) |
| 20 to 24 Minutes | 5 (4.3%) | 0 (0.0%) |
| 25 to 29 Minutes | 0 (0.0%) | 0 (0.0%) |
| 30 to 34 Minutes | 0 (0.0%) | 0 (0.0%) |
| 35 to 39 Minutes | 0 (0.0%) | 0 (0.0%) |
| 40 to 44 Minutes | 0 (0.0%) | 0 (0.0%) |
| 45 to 59 Minutes | 7 (6.0%) | 0 (0.0%) |
| 60 to 89 Minutes | 0 (0.0%) | 0 (0.0%) |
| 90 or more Minutes | 0 (0.0%) | 1 (1.2%) |
Time of Departure to Work by Sex in Yachats
The most frequent times of departure to work in Yachats are 6:00 AM to 6:29 AM (29, 25.0%) for males and 9:00 AM to 9:59 AM (15, 17.9%) for females.
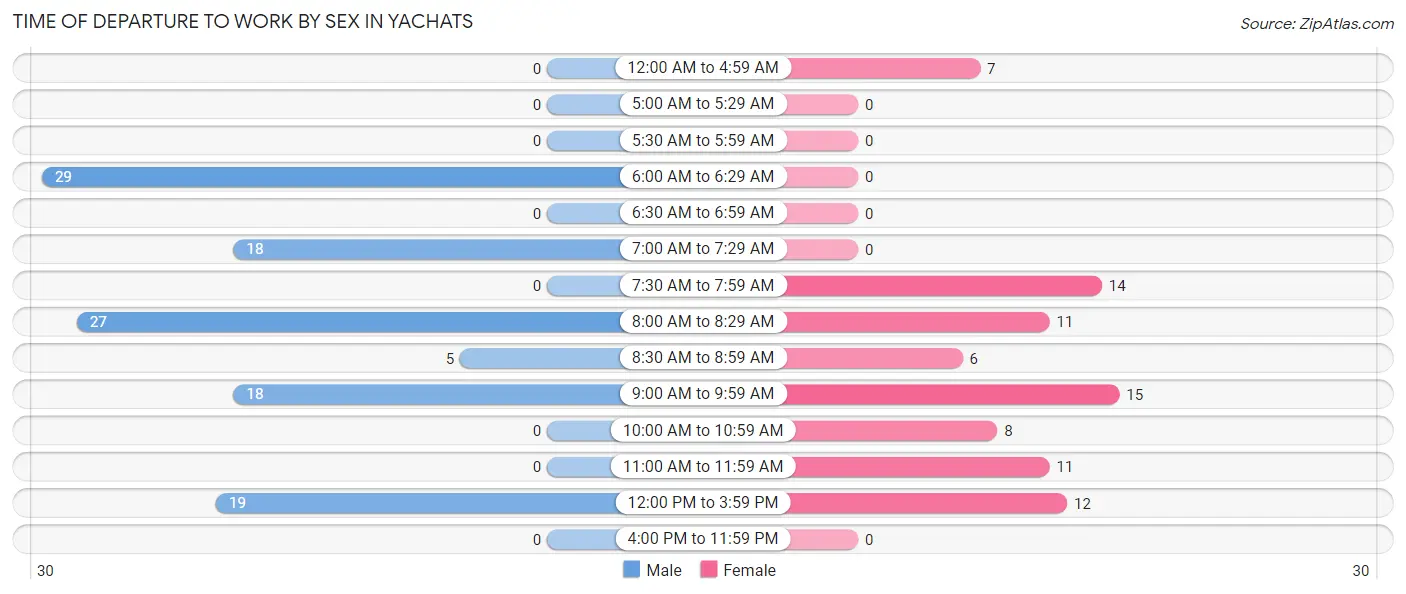
| Time of Departure | Male | Female |
| 12:00 AM to 4:59 AM | 0 (0.0%) | 7 (8.3%) |
| 5:00 AM to 5:29 AM | 0 (0.0%) | 0 (0.0%) |
| 5:30 AM to 5:59 AM | 0 (0.0%) | 0 (0.0%) |
| 6:00 AM to 6:29 AM | 29 (25.0%) | 0 (0.0%) |
| 6:30 AM to 6:59 AM | 0 (0.0%) | 0 (0.0%) |
| 7:00 AM to 7:29 AM | 18 (15.5%) | 0 (0.0%) |
| 7:30 AM to 7:59 AM | 0 (0.0%) | 14 (16.7%) |
| 8:00 AM to 8:29 AM | 27 (23.3%) | 11 (13.1%) |
| 8:30 AM to 8:59 AM | 5 (4.3%) | 6 (7.1%) |
| 9:00 AM to 9:59 AM | 18 (15.5%) | 15 (17.9%) |
| 10:00 AM to 10:59 AM | 0 (0.0%) | 8 (9.5%) |
| 11:00 AM to 11:59 AM | 0 (0.0%) | 11 (13.1%) |
| 12:00 PM to 3:59 PM | 19 (16.4%) | 12 (14.3%) |
| 4:00 PM to 11:59 PM | 0 (0.0%) | 0 (0.0%) |
| Total | 116 (100.0%) | 84 (100.0%) |
Housing Occupancy in Yachats
Occupancy by Ownership in Yachats
Of the total 451 dwellings in Yachats, owner-occupied units account for 278 (61.6%), while renter-occupied units make up 173 (38.4%).
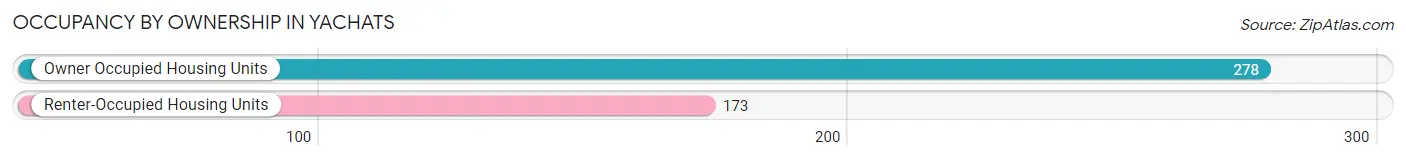
| Occupancy | # Housing Units | % Housing Units |
| Owner Occupied Housing Units | 278 | 61.6% |
| Renter-Occupied Housing Units | 173 | 38.4% |
| Total Occupied Housing Units | 451 | 100.0% |
Occupancy by Household Size in Yachats
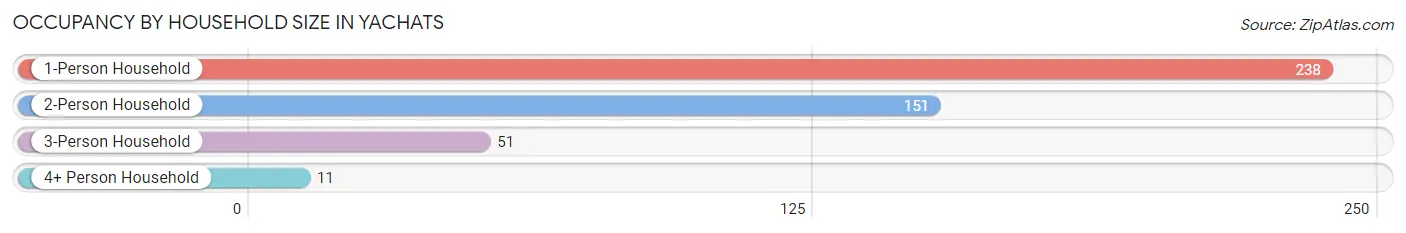
| Household Size | # Housing Units | % Housing Units |
| 1-Person Household | 238 | 52.8% |
| 2-Person Household | 151 | 33.5% |
| 3-Person Household | 51 | 11.3% |
| 4+ Person Household | 11 | 2.4% |
| Total Housing Units | 451 | 100.0% |
Occupancy by Ownership by Household Size in Yachats
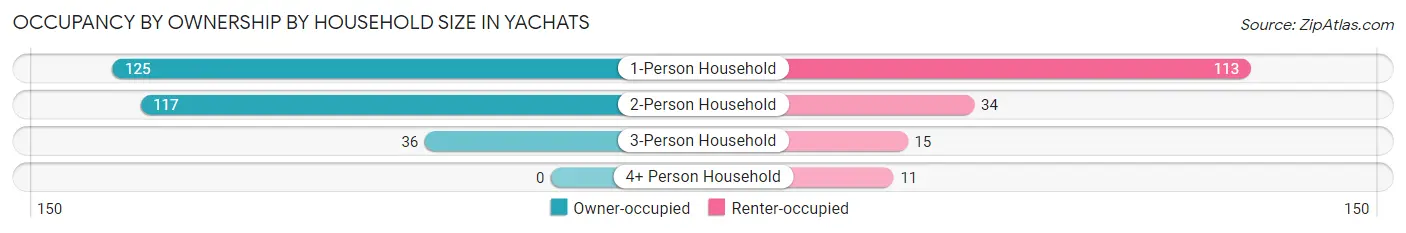
| Household Size | Owner-occupied | Renter-occupied |
| 1-Person Household | 125 (52.5%) | 113 (47.5%) |
| 2-Person Household | 117 (77.5%) | 34 (22.5%) |
| 3-Person Household | 36 (70.6%) | 15 (29.4%) |
| 4+ Person Household | 0 (0.0%) | 11 (100.0%) |
| Total Housing Units | 278 (61.6%) | 173 (38.4%) |
Occupancy by Educational Attainment in Yachats
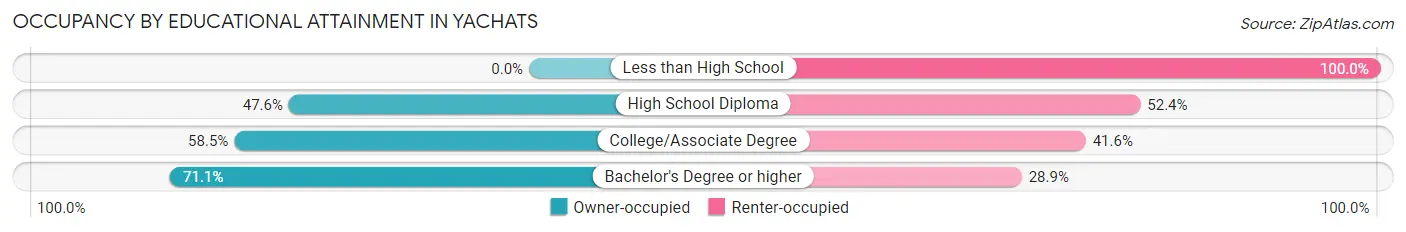
| Household Size | Owner-occupied | Renter-occupied |
| Less than High School | 0 (0.0%) | 21 (100.0%) |
| High School Diploma | 20 (47.6%) | 22 (52.4%) |
| College/Associate Degree | 83 (58.5%) | 59 (41.5%) |
| Bachelor's Degree or higher | 175 (71.1%) | 71 (28.9%) |
Occupancy by Age of Householder in Yachats
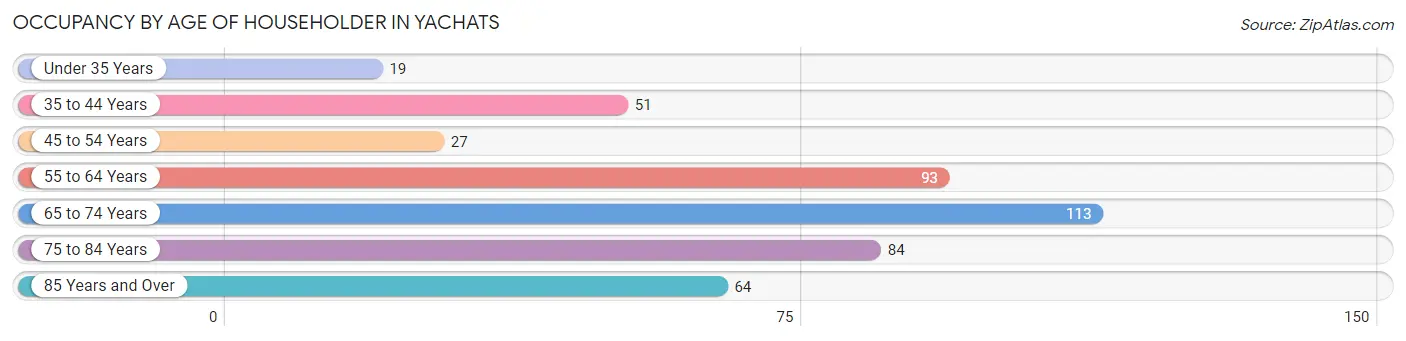
| Age Bracket | # Households | % Households |
| Under 35 Years | 19 | 4.2% |
| 35 to 44 Years | 51 | 11.3% |
| 45 to 54 Years | 27 | 6.0% |
| 55 to 64 Years | 93 | 20.6% |
| 65 to 74 Years | 113 | 25.1% |
| 75 to 84 Years | 84 | 18.6% |
| 85 Years and Over | 64 | 14.2% |
| Total | 451 | 100.0% |
Housing Finances in Yachats
Median Income by Occupancy in Yachats
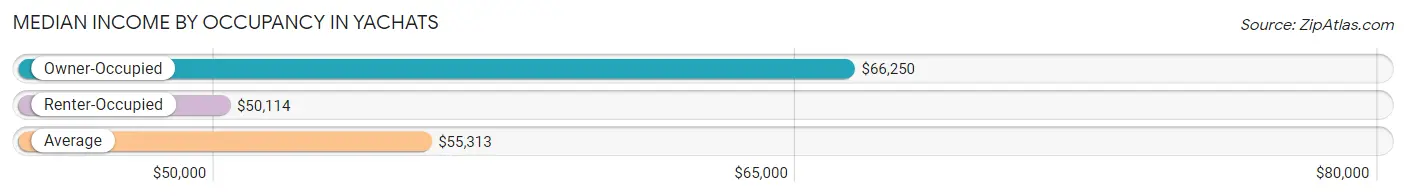
| Occupancy Type | # Households | Median Income |
| Owner-Occupied | 278 (61.6%) | $66,250 |
| Renter-Occupied | 173 (38.4%) | $50,114 |
| Average | 451 (100.0%) | $55,313 |
Occupancy by Householder Income Bracket in Yachats
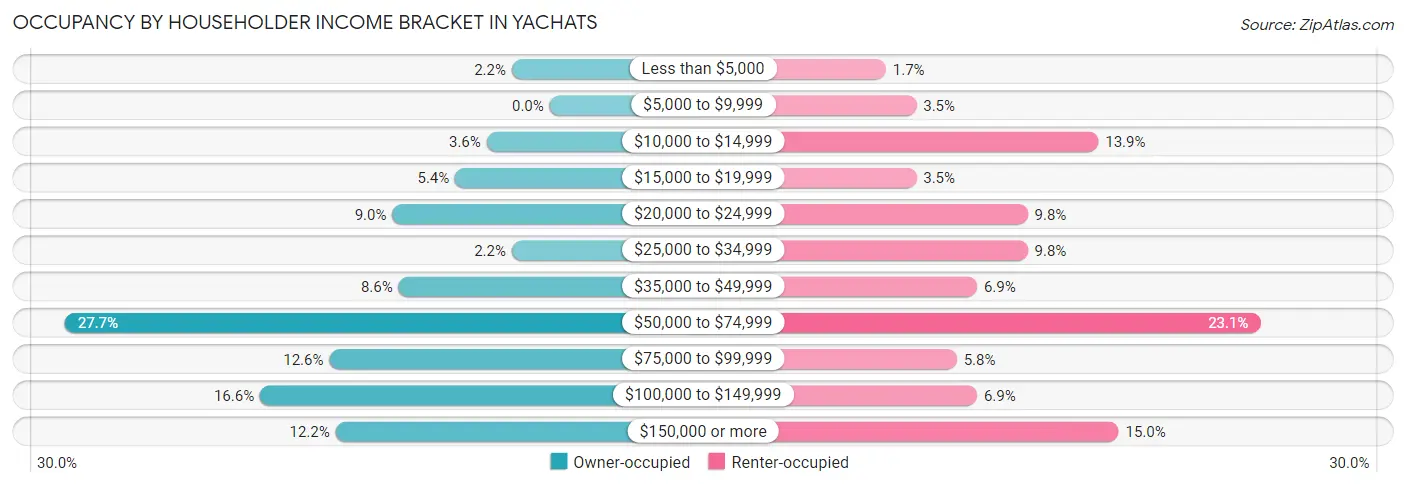
| Income Bracket | Owner-occupied | Renter-occupied |
| Less than $5,000 | 6 (2.2%) | 3 (1.7%) |
| $5,000 to $9,999 | 0 (0.0%) | 6 (3.5%) |
| $10,000 to $14,999 | 10 (3.6%) | 24 (13.9%) |
| $15,000 to $19,999 | 15 (5.4%) | 6 (3.5%) |
| $20,000 to $24,999 | 25 (9.0%) | 17 (9.8%) |
| $25,000 to $34,999 | 6 (2.2%) | 17 (9.8%) |
| $35,000 to $49,999 | 24 (8.6%) | 12 (6.9%) |
| $50,000 to $74,999 | 77 (27.7%) | 40 (23.1%) |
| $75,000 to $99,999 | 35 (12.6%) | 10 (5.8%) |
| $100,000 to $149,999 | 46 (16.6%) | 12 (6.9%) |
| $150,000 or more | 34 (12.2%) | 26 (15.0%) |
| Total | 278 (100.0%) | 173 (100.0%) |
Monthly Housing Cost Tiers in Yachats
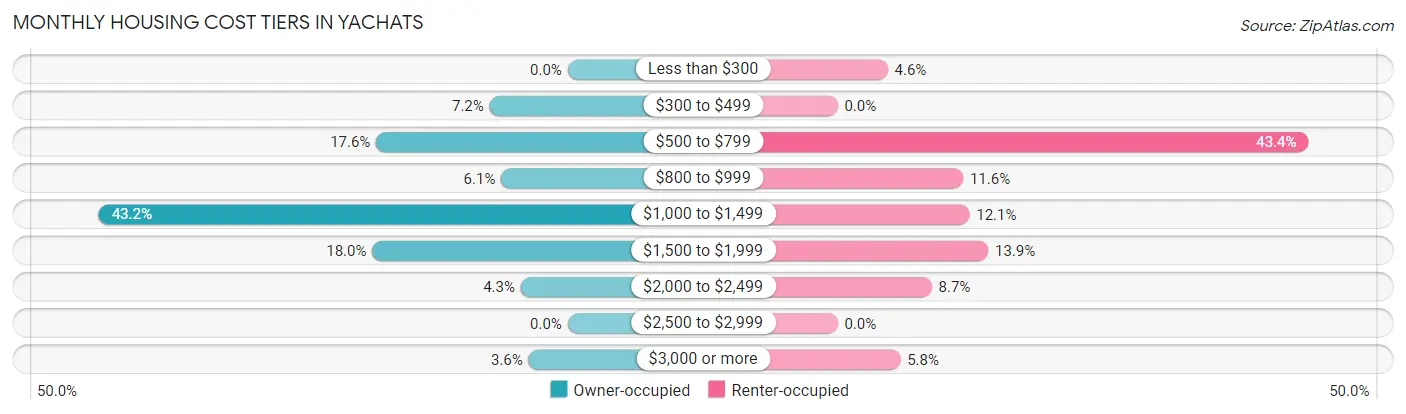
| Monthly Cost | Owner-occupied | Renter-occupied |
| Less than $300 | 0 (0.0%) | 8 (4.6%) |
| $300 to $499 | 20 (7.2%) | 0 (0.0%) |
| $500 to $799 | 49 (17.6%) | 75 (43.3%) |
| $800 to $999 | 17 (6.1%) | 20 (11.6%) |
| $1,000 to $1,499 | 120 (43.2%) | 21 (12.1%) |
| $1,500 to $1,999 | 50 (18.0%) | 24 (13.9%) |
| $2,000 to $2,499 | 12 (4.3%) | 15 (8.7%) |
| $2,500 to $2,999 | 0 (0.0%) | 0 (0.0%) |
| $3,000 or more | 10 (3.6%) | 10 (5.8%) |
| Total | 278 (100.0%) | 173 (100.0%) |
Physical Housing Characteristics in Yachats
Housing Structures in Yachats
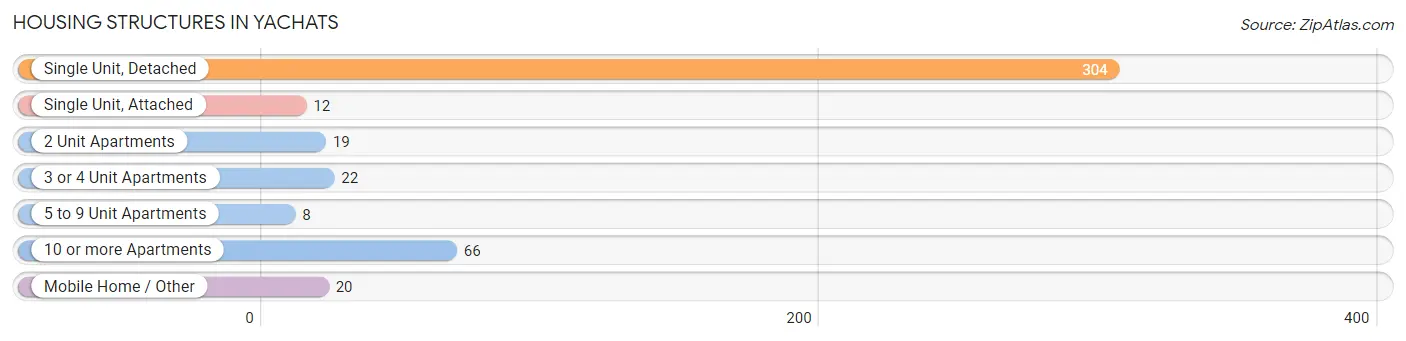
| Structure Type | # Housing Units | % Housing Units |
| Single Unit, Detached | 304 | 67.4% |
| Single Unit, Attached | 12 | 2.7% |
| 2 Unit Apartments | 19 | 4.2% |
| 3 or 4 Unit Apartments | 22 | 4.9% |
| 5 to 9 Unit Apartments | 8 | 1.8% |
| 10 or more Apartments | 66 | 14.6% |
| Mobile Home / Other | 20 | 4.4% |
| Total | 451 | 100.0% |
Housing Structures by Occupancy in Yachats
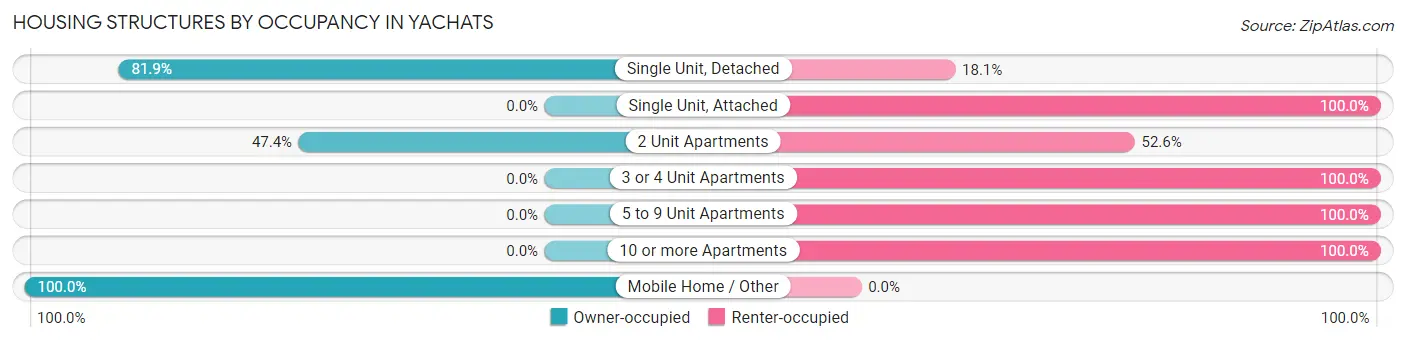
| Structure Type | Owner-occupied | Renter-occupied |
| Single Unit, Detached | 249 (81.9%) | 55 (18.1%) |
| Single Unit, Attached | 0 (0.0%) | 12 (100.0%) |
| 2 Unit Apartments | 9 (47.4%) | 10 (52.6%) |
| 3 or 4 Unit Apartments | 0 (0.0%) | 22 (100.0%) |
| 5 to 9 Unit Apartments | 0 (0.0%) | 8 (100.0%) |
| 10 or more Apartments | 0 (0.0%) | 66 (100.0%) |
| Mobile Home / Other | 20 (100.0%) | 0 (0.0%) |
| Total | 278 (61.6%) | 173 (38.4%) |
Housing Structures by Number of Rooms in Yachats
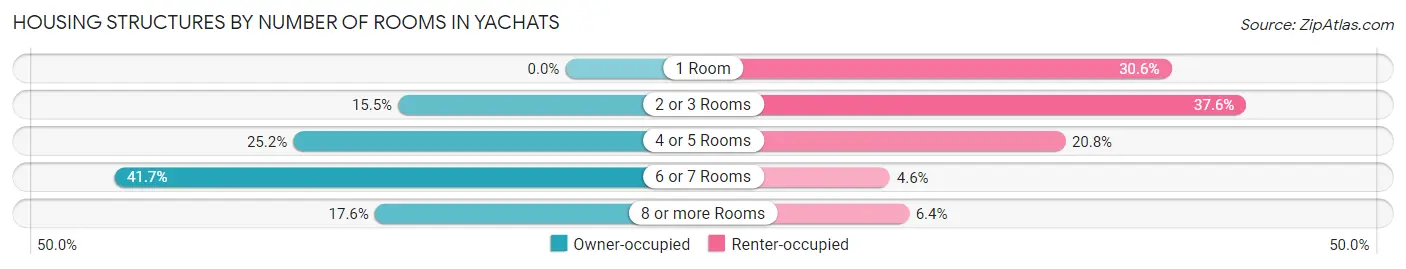
| Number of Rooms | Owner-occupied | Renter-occupied |
| 1 Room | 0 (0.0%) | 53 (30.6%) |
| 2 or 3 Rooms | 43 (15.5%) | 65 (37.6%) |
| 4 or 5 Rooms | 70 (25.2%) | 36 (20.8%) |
| 6 or 7 Rooms | 116 (41.7%) | 8 (4.6%) |
| 8 or more Rooms | 49 (17.6%) | 11 (6.4%) |
| Total | 278 (100.0%) | 173 (100.0%) |
Housing Structure by Heating Type in Yachats
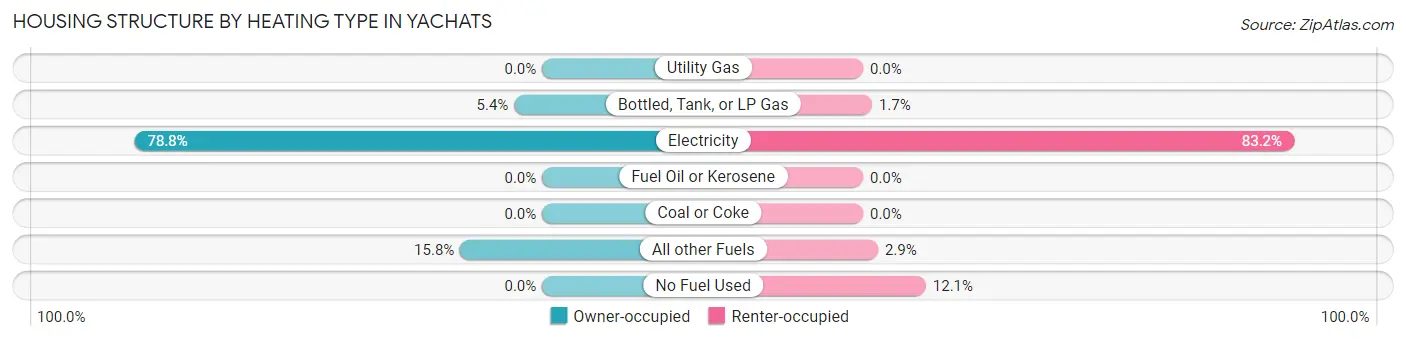
| Heating Type | Owner-occupied | Renter-occupied |
| Utility Gas | 0 (0.0%) | 0 (0.0%) |
| Bottled, Tank, or LP Gas | 15 (5.4%) | 3 (1.7%) |
| Electricity | 219 (78.8%) | 144 (83.2%) |
| Fuel Oil or Kerosene | 0 (0.0%) | 0 (0.0%) |
| Coal or Coke | 0 (0.0%) | 0 (0.0%) |
| All other Fuels | 44 (15.8%) | 5 (2.9%) |
| No Fuel Used | 0 (0.0%) | 21 (12.1%) |
| Total | 278 (100.0%) | 173 (100.0%) |
Household Vehicle Usage in Yachats
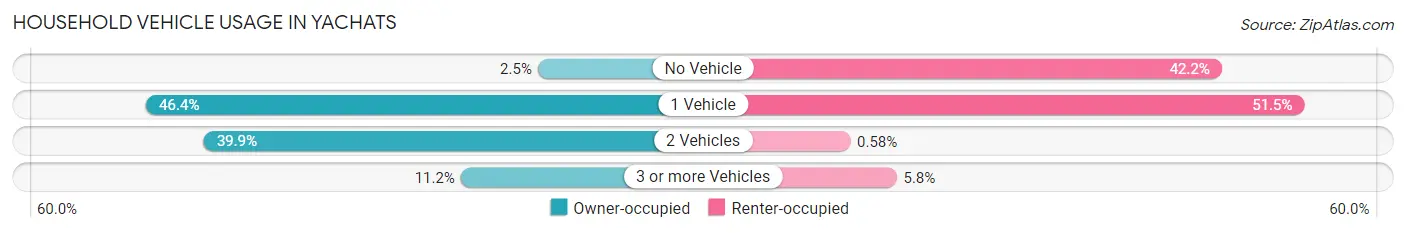
| Vehicles per Household | Owner-occupied | Renter-occupied |
| No Vehicle | 7 (2.5%) | 73 (42.2%) |
| 1 Vehicle | 129 (46.4%) | 89 (51.4%) |
| 2 Vehicles | 111 (39.9%) | 1 (0.6%) |
| 3 or more Vehicles | 31 (11.2%) | 10 (5.8%) |
| Total | 278 (100.0%) | 173 (100.0%) |
Real Estate & Mortgages in Yachats
Real Estate and Mortgage Overview in Yachats
| Characteristic | Without Mortgage | With Mortgage |
| Housing Units | 156 | 122 |
| Median Property Value | $552,300 | $391,300 |
| Median Household Income | $72,083 | $4 |
| Monthly Housing Costs | $890 | $10 |
| Real Estate Taxes | $5,036 | $0 |
Property Value by Mortgage Status in Yachats
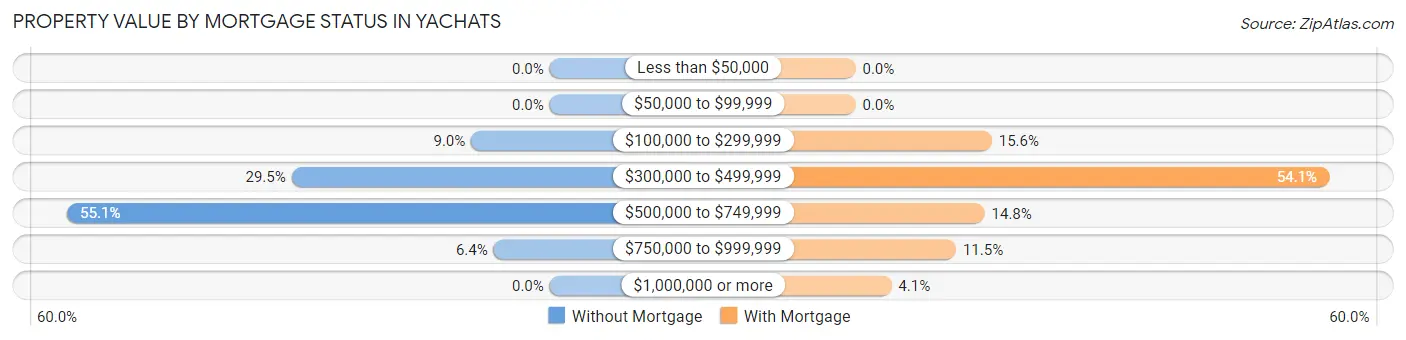
| Property Value | Without Mortgage | With Mortgage |
| Less than $50,000 | 0 (0.0%) | 0 (0.0%) |
| $50,000 to $99,999 | 0 (0.0%) | 0 (0.0%) |
| $100,000 to $299,999 | 14 (9.0%) | 19 (15.6%) |
| $300,000 to $499,999 | 46 (29.5%) | 66 (54.1%) |
| $500,000 to $749,999 | 86 (55.1%) | 18 (14.7%) |
| $750,000 to $999,999 | 10 (6.4%) | 14 (11.5%) |
| $1,000,000 or more | 0 (0.0%) | 5 (4.1%) |
| Total | 156 (100.0%) | 122 (100.0%) |
Household Income by Mortgage Status in Yachats
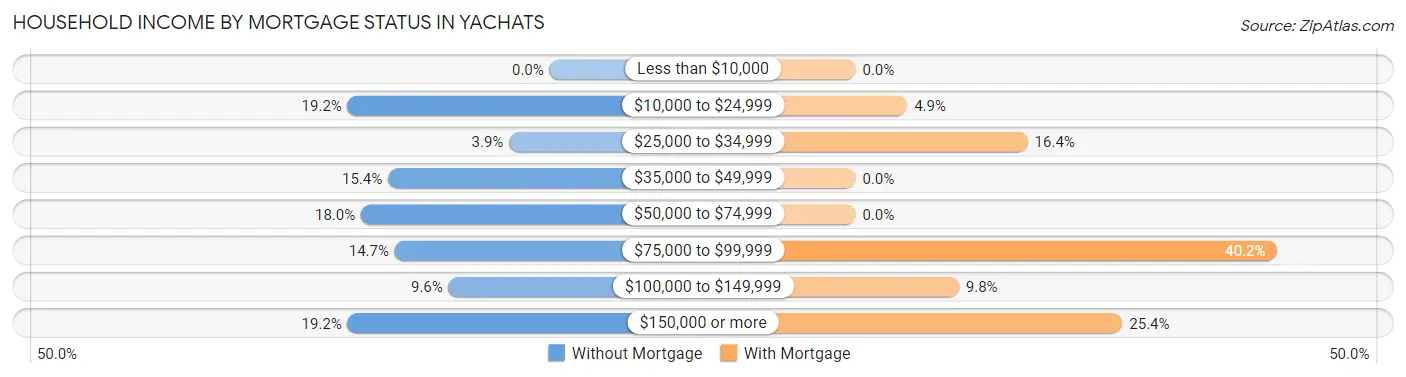
| Household Income | Without Mortgage | With Mortgage |
| Less than $10,000 | 0 (0.0%) | 0 (0.0%) |
| $10,000 to $24,999 | 30 (19.2%) | 6 (4.9%) |
| $25,000 to $34,999 | 6 (3.8%) | 20 (16.4%) |
| $35,000 to $49,999 | 24 (15.4%) | 0 (0.0%) |
| $50,000 to $74,999 | 28 (17.9%) | 0 (0.0%) |
| $75,000 to $99,999 | 23 (14.7%) | 49 (40.2%) |
| $100,000 to $149,999 | 15 (9.6%) | 12 (9.8%) |
| $150,000 or more | 30 (19.2%) | 31 (25.4%) |
| Total | 156 (100.0%) | 122 (100.0%) |
Property Value to Household Income Ratio in Yachats
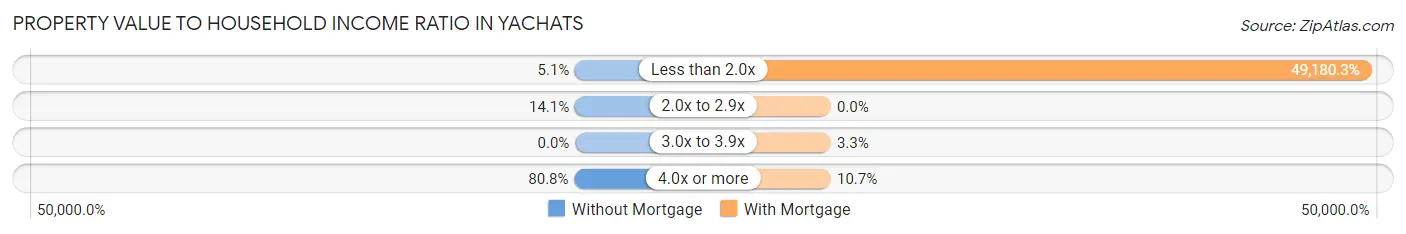
| Value-to-Income Ratio | Without Mortgage | With Mortgage |
| Less than 2.0x | 8 (5.1%) | 60,000 (49,180.3%) |
| 2.0x to 2.9x | 22 (14.1%) | 0 (0.0%) |
| 3.0x to 3.9x | 0 (0.0%) | 4 (3.3%) |
| 4.0x or more | 126 (80.8%) | 13 (10.7%) |
| Total | 156 (100.0%) | 122 (100.0%) |
Real Estate Taxes by Mortgage Status in Yachats
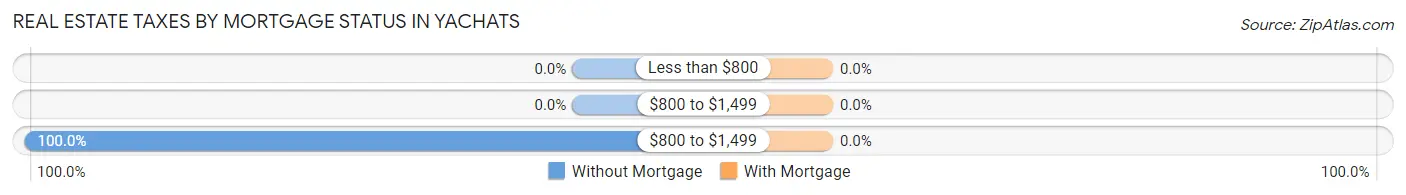
| Property Taxes | Without Mortgage | With Mortgage |
| Less than $800 | 0 (0.0%) | 0 (0.0%) |
| $800 to $1,499 | 0 (0.0%) | 0 (0.0%) |
| $800 to $1,499 | 156 (100.0%) | 0 (0.0%) |
| Total | 156 (100.0%) | 122 (100.0%) |
Health & Disability in Yachats
Health Insurance Coverage by Age in Yachats
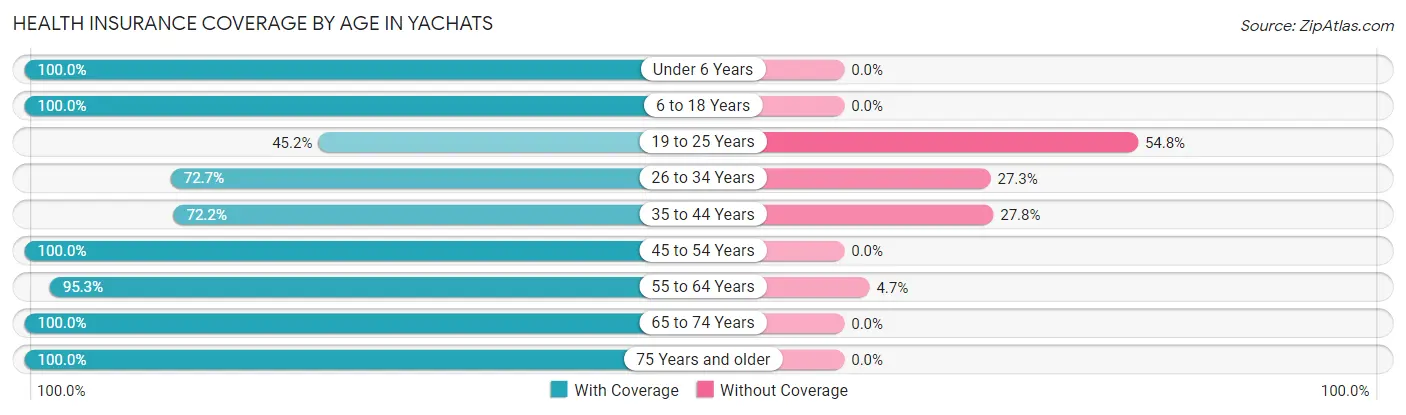
| Age Bracket | With Coverage | Without Coverage |
| Under 6 Years | 10 (100.0%) | 0 (0.0%) |
| 6 to 18 Years | 30 (100.0%) | 0 (0.0%) |
| 19 to 25 Years | 19 (45.2%) | 23 (54.8%) |
| 26 to 34 Years | 16 (72.7%) | 6 (27.3%) |
| 35 to 44 Years | 65 (72.2%) | 25 (27.8%) |
| 45 to 54 Years | 57 (100.0%) | 0 (0.0%) |
| 55 to 64 Years | 142 (95.3%) | 7 (4.7%) |
| 65 to 74 Years | 164 (100.0%) | 0 (0.0%) |
| 75 Years and older | 195 (100.0%) | 0 (0.0%) |
| Total | 698 (92.0%) | 61 (8.0%) |
Health Insurance Coverage by Citizenship Status in Yachats
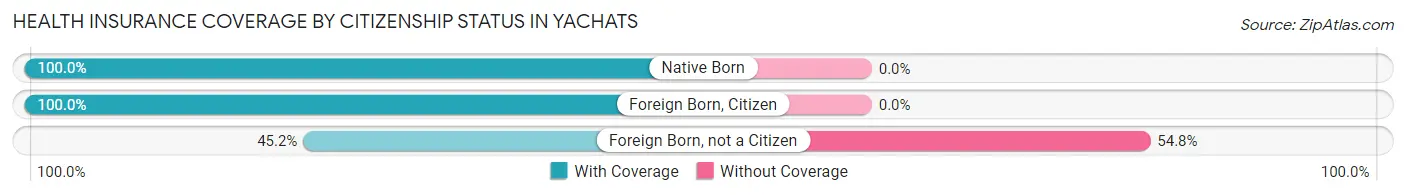
| Citizenship Status | With Coverage | Without Coverage |
| Native Born | 10 (100.0%) | 0 (0.0%) |
| Foreign Born, Citizen | 30 (100.0%) | 0 (0.0%) |
| Foreign Born, not a Citizen | 19 (45.2%) | 23 (54.8%) |
Health Insurance Coverage by Household Income in Yachats
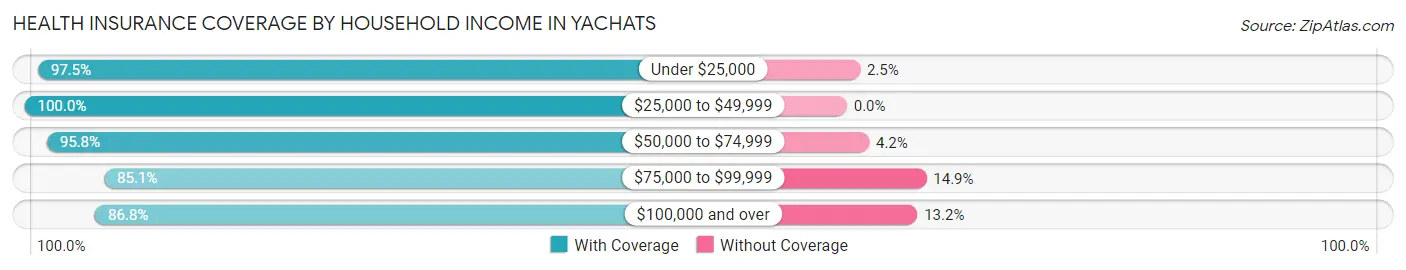
| Household Income | With Coverage | Without Coverage |
| Under $25,000 | 157 (97.5%) | 4 (2.5%) |
| $25,000 to $49,999 | 66 (100.0%) | 0 (0.0%) |
| $50,000 to $74,999 | 161 (95.8%) | 7 (4.2%) |
| $75,000 to $99,999 | 97 (85.1%) | 17 (14.9%) |
| $100,000 and over | 217 (86.8%) | 33 (13.2%) |
Public vs Private Health Insurance Coverage by Age in Yachats
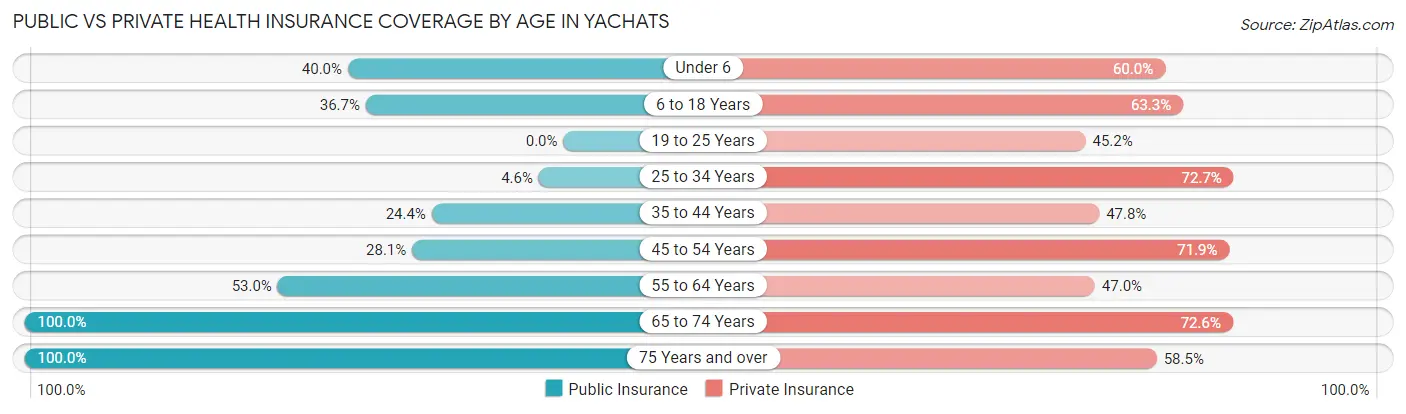
| Age Bracket | Public Insurance | Private Insurance |
| Under 6 | 4 (40.0%) | 6 (60.0%) |
| 6 to 18 Years | 11 (36.7%) | 19 (63.3%) |
| 19 to 25 Years | 0 (0.0%) | 19 (45.2%) |
| 25 to 34 Years | 1 (4.5%) | 16 (72.7%) |
| 35 to 44 Years | 22 (24.4%) | 43 (47.8%) |
| 45 to 54 Years | 16 (28.1%) | 41 (71.9%) |
| 55 to 64 Years | 79 (53.0%) | 70 (47.0%) |
| 65 to 74 Years | 164 (100.0%) | 119 (72.6%) |
| 75 Years and over | 195 (100.0%) | 114 (58.5%) |
| Total | 492 (64.8%) | 447 (58.9%) |
Disability Status by Sex by Age in Yachats
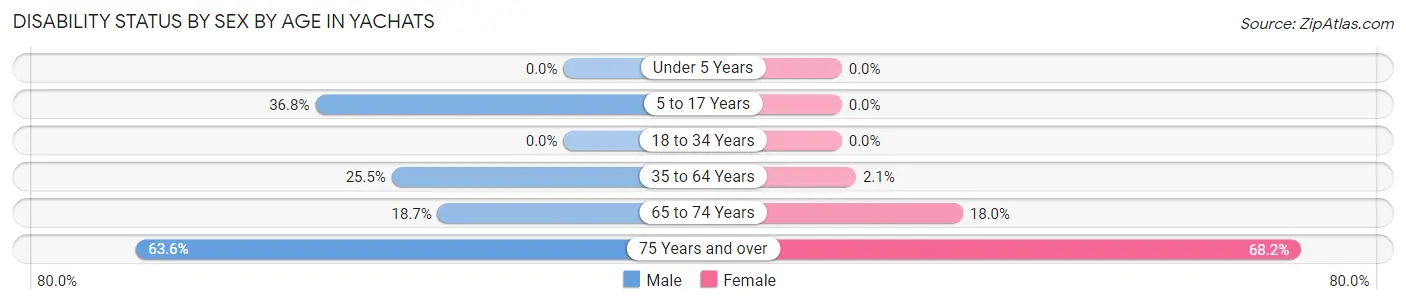
| Age Bracket | Male | Female |
| Under 5 Years | 0 (0.0%) | 0 (0.0%) |
| 5 to 17 Years | 7 (36.8%) | 0 (0.0%) |
| 18 to 34 Years | 0 (0.0%) | 0 (0.0%) |
| 35 to 64 Years | 39 (25.5%) | 3 (2.1%) |
| 65 to 74 Years | 14 (18.7%) | 16 (18.0%) |
| 75 Years and over | 68 (63.5%) | 60 (68.2%) |
Disability Class by Sex by Age in Yachats
Disability Class: Hearing Difficulty
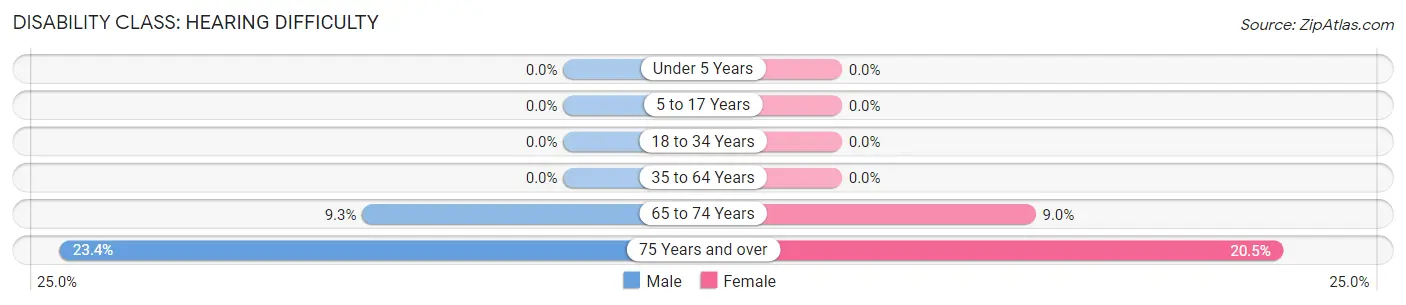
| Age Bracket | Male | Female |
| Under 5 Years | 0 (0.0%) | 0 (0.0%) |
| 5 to 17 Years | 0 (0.0%) | 0 (0.0%) |
| 18 to 34 Years | 0 (0.0%) | 0 (0.0%) |
| 35 to 64 Years | 0 (0.0%) | 0 (0.0%) |
| 65 to 74 Years | 7 (9.3%) | 8 (9.0%) |
| 75 Years and over | 25 (23.4%) | 18 (20.4%) |
Disability Class: Vision Difficulty
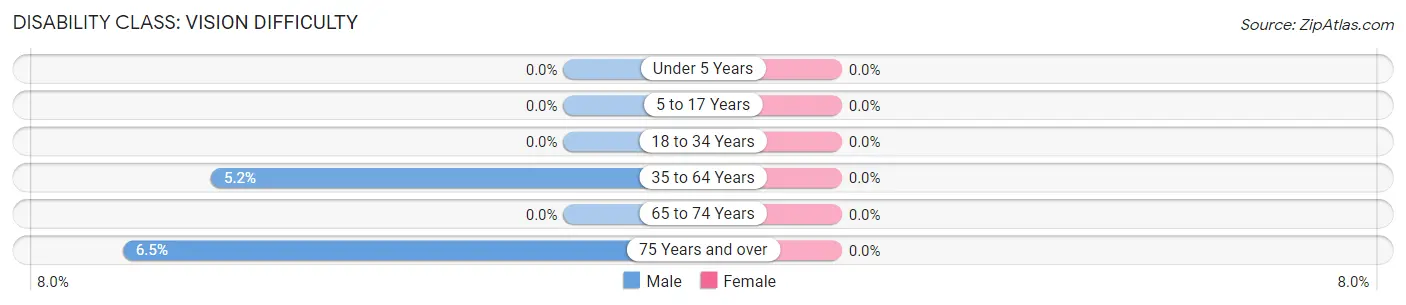
| Age Bracket | Male | Female |
| Under 5 Years | 0 (0.0%) | 0 (0.0%) |
| 5 to 17 Years | 0 (0.0%) | 0 (0.0%) |
| 18 to 34 Years | 0 (0.0%) | 0 (0.0%) |
| 35 to 64 Years | 8 (5.2%) | 0 (0.0%) |
| 65 to 74 Years | 0 (0.0%) | 0 (0.0%) |
| 75 Years and over | 7 (6.5%) | 0 (0.0%) |
Disability Class: Cognitive Difficulty
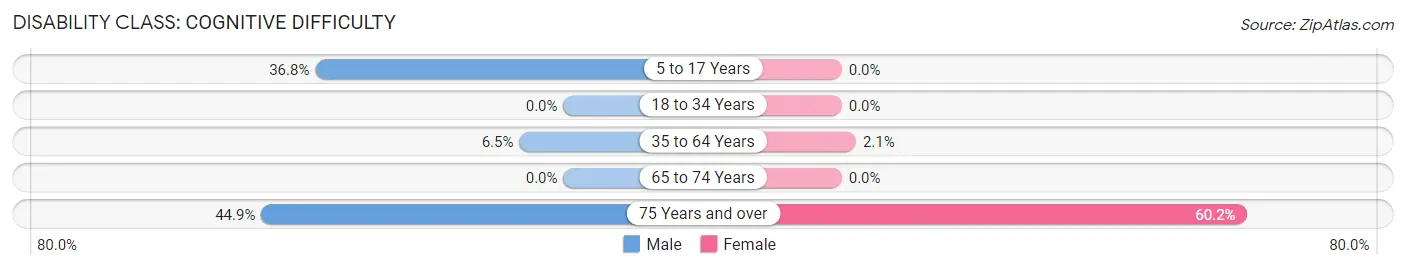
| Age Bracket | Male | Female |
| 5 to 17 Years | 7 (36.8%) | 0 (0.0%) |
| 18 to 34 Years | 0 (0.0%) | 0 (0.0%) |
| 35 to 64 Years | 10 (6.5%) | 3 (2.1%) |
| 65 to 74 Years | 0 (0.0%) | 0 (0.0%) |
| 75 Years and over | 48 (44.9%) | 53 (60.2%) |
Disability Class: Ambulatory Difficulty
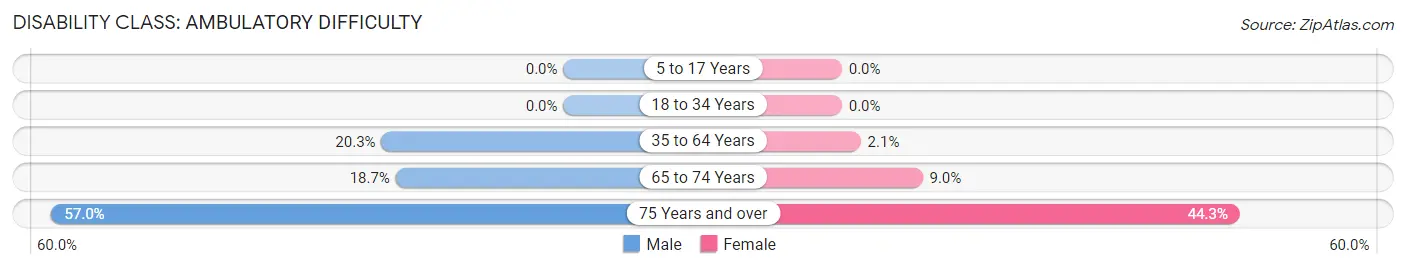
| Age Bracket | Male | Female |
| 5 to 17 Years | 0 (0.0%) | 0 (0.0%) |
| 18 to 34 Years | 0 (0.0%) | 0 (0.0%) |
| 35 to 64 Years | 31 (20.3%) | 3 (2.1%) |
| 65 to 74 Years | 14 (18.7%) | 8 (9.0%) |
| 75 Years and over | 61 (57.0%) | 39 (44.3%) |
Disability Class: Self-Care Difficulty
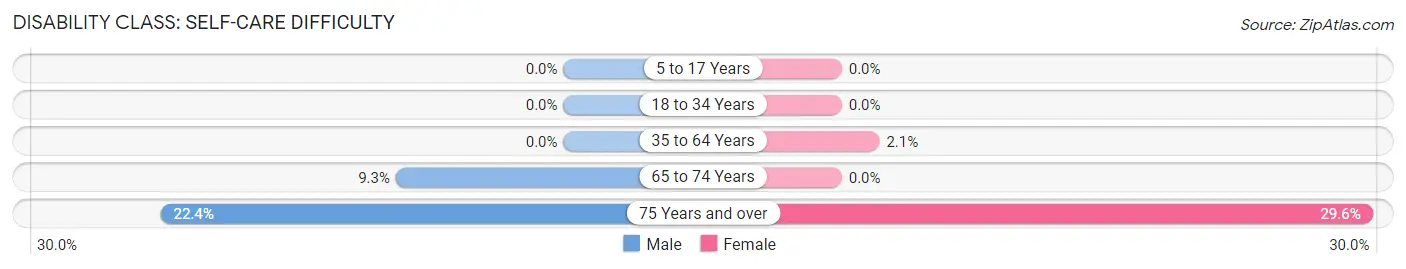
| Age Bracket | Male | Female |
| 5 to 17 Years | 0 (0.0%) | 0 (0.0%) |
| 18 to 34 Years | 0 (0.0%) | 0 (0.0%) |
| 35 to 64 Years | 0 (0.0%) | 3 (2.1%) |
| 65 to 74 Years | 7 (9.3%) | 0 (0.0%) |
| 75 Years and over | 24 (22.4%) | 26 (29.5%) |
Technology Access in Yachats
Computing Device Access in Yachats
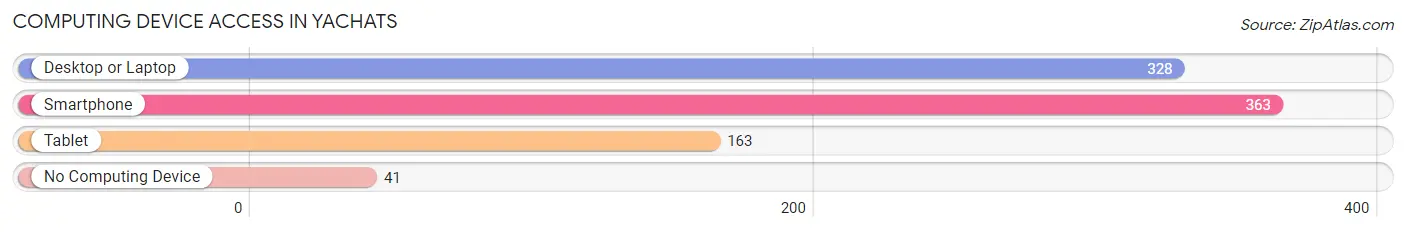
| Device Type | # Households | % Households |
| Desktop or Laptop | 328 | 72.7% |
| Smartphone | 363 | 80.5% |
| Tablet | 163 | 36.1% |
| No Computing Device | 41 | 9.1% |
| Total | 451 | 100.0% |
Internet Access in Yachats
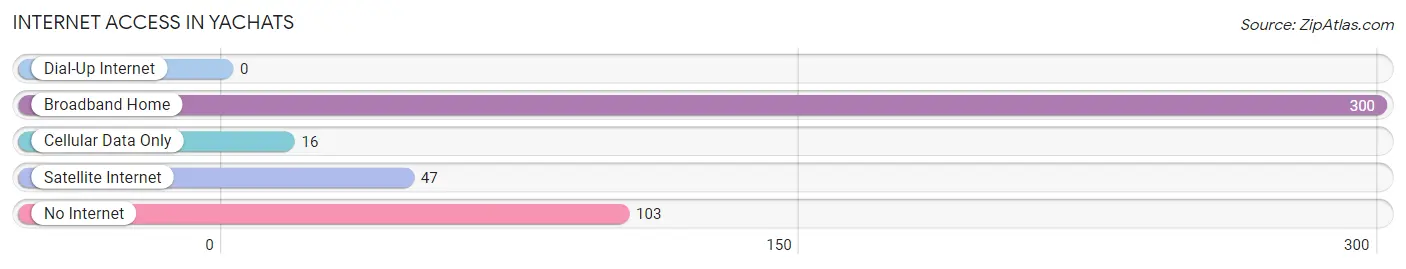
| Internet Type | # Households | % Households |
| Dial-Up Internet | 0 | 0.0% |
| Broadband Home | 300 | 66.5% |
| Cellular Data Only | 16 | 3.5% |
| Satellite Internet | 47 | 10.4% |
| No Internet | 103 | 22.8% |
| Total | 451 | 100.0% |
Yachats Summary
Yachats is a small coastal city located in Lincoln County, Oregon, United States. It is situated on the Pacific Ocean, 8 miles south of Waldport and about 80 miles west of Eugene. The population of Yachats was 690 at the 2010 census.
Geography
Yachats is located at the mouth of the Yachats River, which flows into the Pacific Ocean. The city is situated on a rocky headland, with steep cliffs on either side. The city is surrounded by the Siuslaw National Forest, which provides a variety of outdoor activities, including hiking, camping, and fishing. The city is also home to several beaches, including Yachats Beach, Smelt Sands State Park, and Yachats State Recreation Area.
History
The area around Yachats has been inhabited by Native Americans for thousands of years. The first European settlers arrived in the area in the late 1800s, and the town was officially incorporated in 1908. The name Yachats is derived from the Siletz language, and means "dark water at the foot of the mountain."
Economy
Yachats is a popular tourist destination, and the city's economy is largely based on tourism. The city is home to several hotels, restaurants, and shops, as well as a variety of outdoor activities. The city is also home to several art galleries, and hosts several festivals throughout the year.
Demographics
As of the 2010 census, the population of Yachats was 690. The racial makeup of the city was 94.3% White, 0.3% African American, 0.7% Native American, 0.7% Asian, 0.3% Pacific Islander, 0.7% from other races, and 2.7% from two or more races. Hispanic or Latino of any race were 2.3% of the population.
The median income for a household in Yachats was $37,500, and the median income for a family was $45,000. The per capita income for the city was $20,945. About 11.3% of families and 14.3% of the population were below the poverty line, including 18.2% of those under age 18 and 8.3% of those age 65 or over.
Conclusion
Yachats is a small coastal city located in Lincoln County, Oregon. It is situated on the Pacific Ocean, 8 miles south of Waldport and about 80 miles west of Eugene. The city is surrounded by the Siuslaw National Forest, and is a popular tourist destination. The population of Yachats was 690 at the 2010 census, and the city's economy is largely based on tourism. The median income for a household in Yachats was $37,500, and the median income for a family was $45,000. The per capita income for the city was $20,945.
Common Questions
What is Per Capita Income in Yachats?
Per Capita income in Yachats is $51,608.
What is the Median Family Income in Yachats?
Median Family Income in Yachats is $84,833.
What is the Median Household income in Yachats?
Median Household Income in Yachats is $55,313.
What is Inequality or Gini Index in Yachats?
Inequality or Gini Index in Yachats is 0.51.
What is the Total Population of Yachats?
Total Population of Yachats is 772.
What is the Total Male Population of Yachats?
Total Male Population of Yachats is 386.
What is the Total Female Population of Yachats?
Total Female Population of Yachats is 386.
What is the Ratio of Males per 100 Females in Yachats?
There are 100.00 Males per 100 Females in Yachats.
What is the Ratio of Females per 100 Males in Yachats?
There are 100.00 Females per 100 Males in Yachats.
What is the Median Population Age in Yachats?
Median Population Age in Yachats is 63.8 Years.
What is the Average Family Size in Yachats
Average Family Size in Yachats is 2.4 People.
What is the Average Household Size in Yachats
Average Household Size in Yachats is 1.7 People.
How Large is the Labor Force in Yachats?
There are 314 People in the Labor Forcein in Yachats.
What is the Percentage of People in the Labor Force in Yachats?
42.7% of People are in the Labor Force in Yachats.
What is the Unemployment Rate in Yachats?
Unemployment Rate in Yachats is 11.5%.