Westfir, OR Map & Demographics
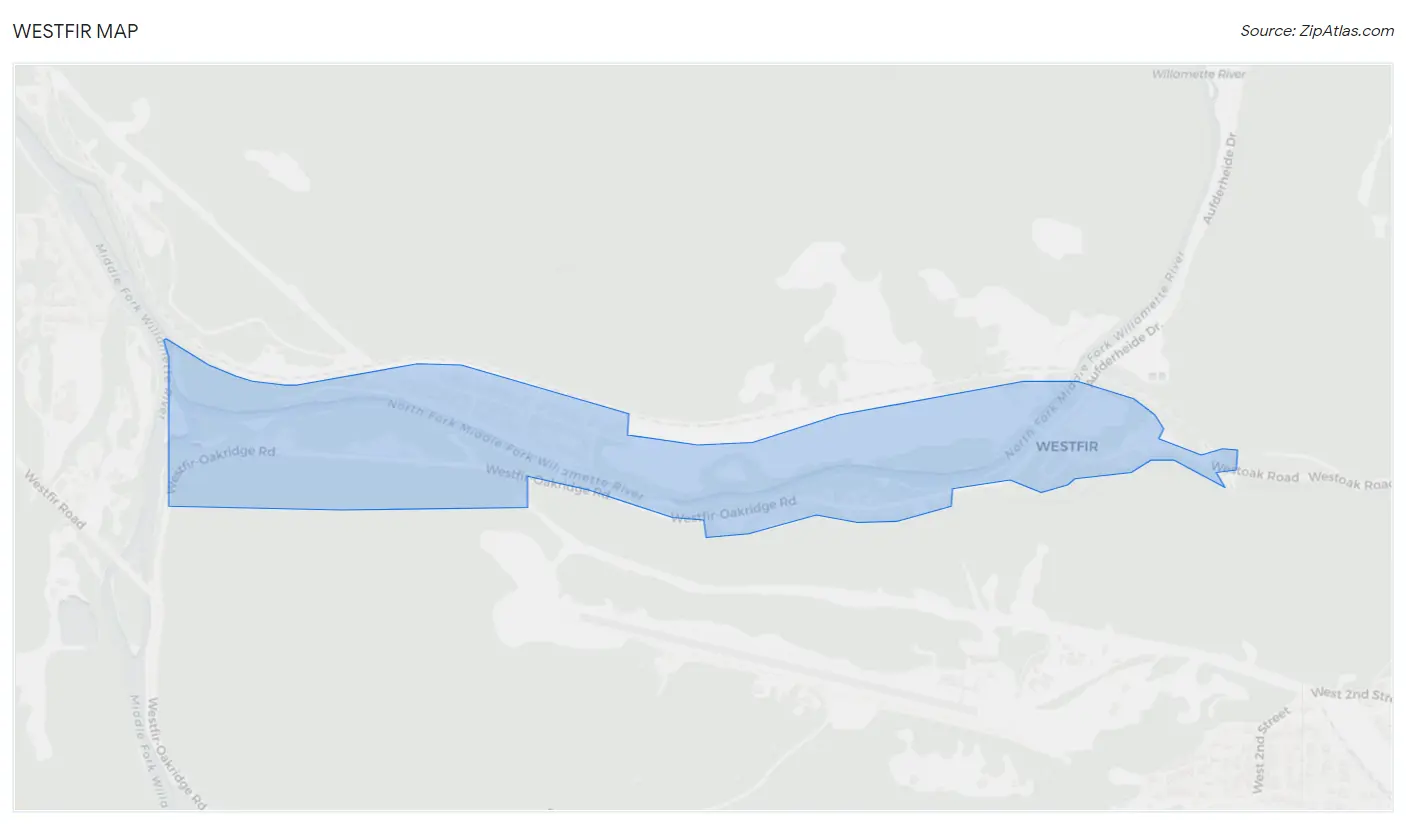
Westfir Map
Westfir Overview
$25,861
PER CAPITA INCOME
$68,393
AVG FAMILY INCOME
$61,250
AVG HOUSEHOLD INCOME
14.8%
WAGE / INCOME GAP [ % ]
85.2¢/ $1
WAGE / INCOME GAP [ $ ]
0.31
INEQUALITY / GINI INDEX
394
TOTAL POPULATION
209
MALE POPULATION
185
FEMALE POPULATION
112.97
MALES / 100 FEMALES
88.52
FEMALES / 100 MALES
39.8
MEDIAN AGE
3.2
AVG FAMILY SIZE
2.6
AVG HOUSEHOLD SIZE
145
LABOR FORCE [ PEOPLE ]
50.2%
PERCENT IN LABOR FORCE
12.4%
UNEMPLOYMENT RATE
Westfir Zip Codes
Westfir Area Codes
Income in Westfir
Income Overview in Westfir
Per Capita Income in Westfir is $25,861, while median incomes of families and households are $68,393 and $61,250 respectively.
| Characteristic | Number | Measure |
| Per Capita Income | 394 | $25,861 |
| Median Family Income | 98 | $68,393 |
| Mean Family Income | 98 | $71,818 |
| Median Household Income | 151 | $61,250 |
| Mean Household Income | 151 | $67,947 |
| Income Deficit | 98 | $0 |
| Wage / Income Gap (%) | 394 | 14.80% |
| Wage / Income Gap ($) | 394 | 85.20¢ per $1 |
| Gini / Inequality Index | 394 | 0.31 |
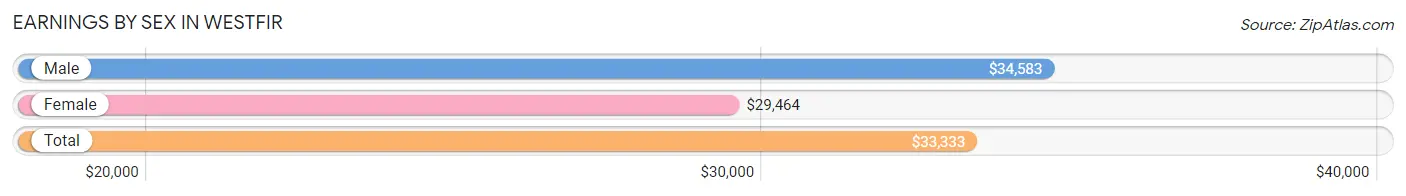
Earnings by Sex in Westfir
Average Earnings in Westfir are $33,333, $34,583 for men and $29,464 for women, a difference of 14.8%.
| Sex | Number | Average Earnings |
| Male | 96 (64.9%) | $34,583 |
| Female | 52 (35.1%) | $29,464 |
| Total | 148 (100.0%) | $33,333 |
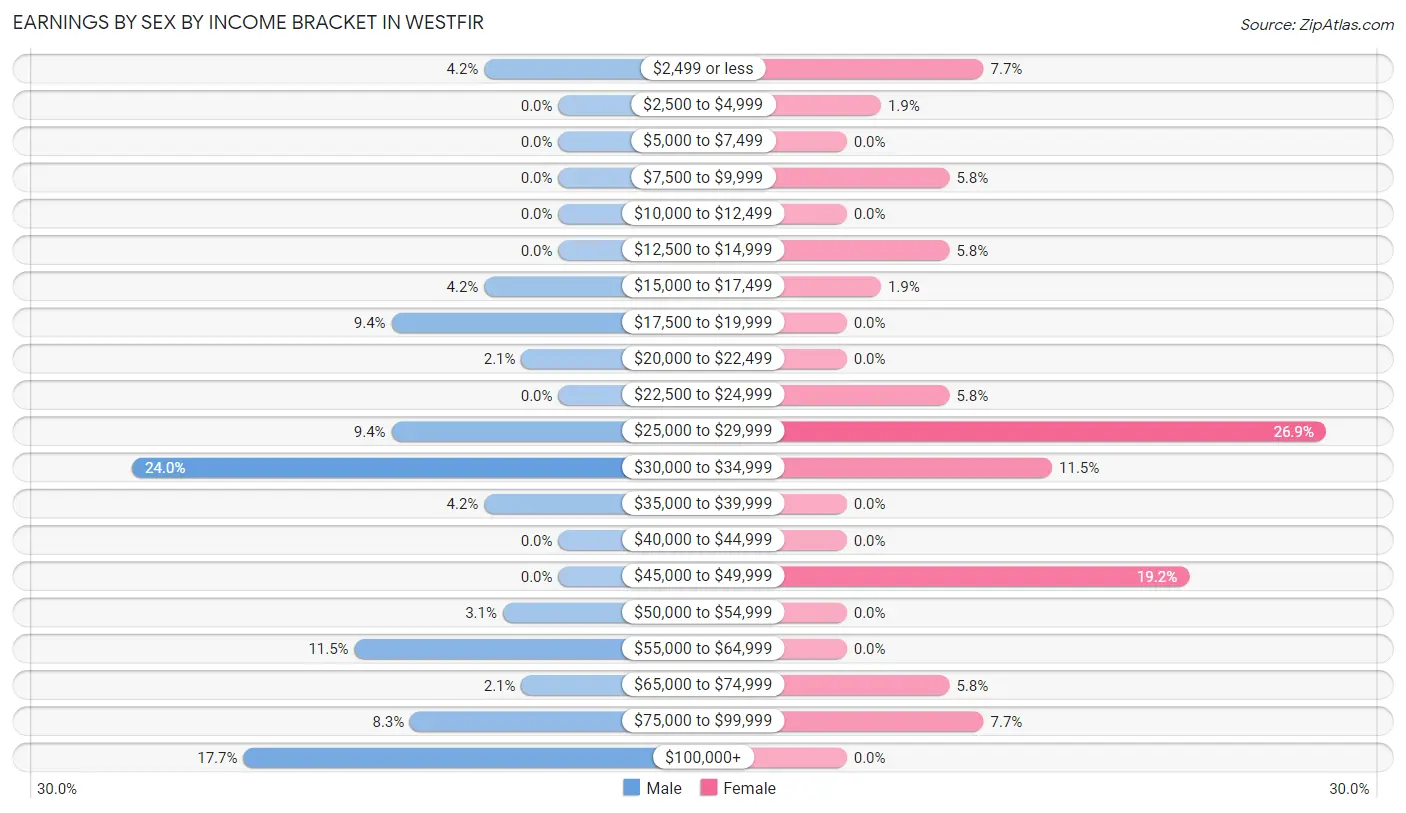
Earnings by Sex by Income Bracket in Westfir
The most common earnings brackets in Westfir are $30,000 to $34,999 for men (23 | 24.0%) and $25,000 to $29,999 for women (14 | 26.9%).
| Income | Male | Female |
| $2,499 or less | 4 (4.2%) | 4 (7.7%) |
| $2,500 to $4,999 | 0 (0.0%) | 1 (1.9%) |
| $5,000 to $7,499 | 0 (0.0%) | 0 (0.0%) |
| $7,500 to $9,999 | 0 (0.0%) | 3 (5.8%) |
| $10,000 to $12,499 | 0 (0.0%) | 0 (0.0%) |
| $12,500 to $14,999 | 0 (0.0%) | 3 (5.8%) |
| $15,000 to $17,499 | 4 (4.2%) | 1 (1.9%) |
| $17,500 to $19,999 | 9 (9.4%) | 0 (0.0%) |
| $20,000 to $22,499 | 2 (2.1%) | 0 (0.0%) |
| $22,500 to $24,999 | 0 (0.0%) | 3 (5.8%) |
| $25,000 to $29,999 | 9 (9.4%) | 14 (26.9%) |
| $30,000 to $34,999 | 23 (24.0%) | 6 (11.5%) |
| $35,000 to $39,999 | 4 (4.2%) | 0 (0.0%) |
| $40,000 to $44,999 | 0 (0.0%) | 0 (0.0%) |
| $45,000 to $49,999 | 0 (0.0%) | 10 (19.2%) |
| $50,000 to $54,999 | 3 (3.1%) | 0 (0.0%) |
| $55,000 to $64,999 | 11 (11.5%) | 0 (0.0%) |
| $65,000 to $74,999 | 2 (2.1%) | 3 (5.8%) |
| $75,000 to $99,999 | 8 (8.3%) | 4 (7.7%) |
| $100,000+ | 17 (17.7%) | 0 (0.0%) |
| Total | 96 (100.0%) | 52 (100.0%) |
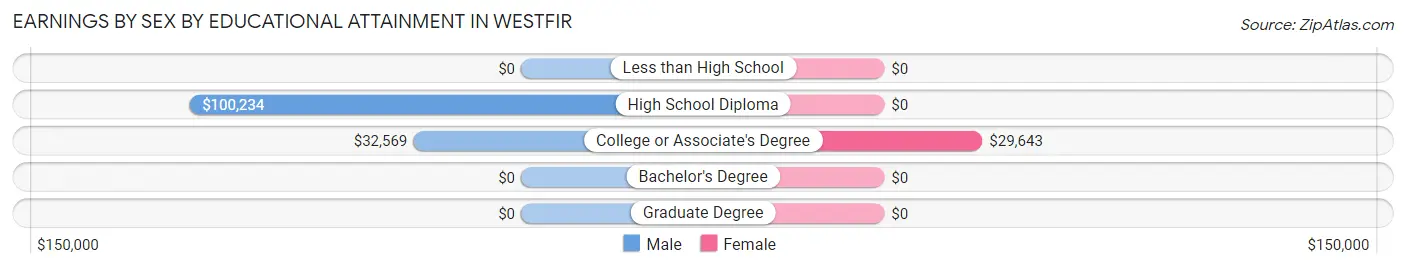
Earnings by Sex by Educational Attainment in Westfir
Average earnings in Westfir are $34,583 for men and $29,732 for women, a difference of 14.0%. Men with an educational attainment of high school diploma enjoy the highest average annual earnings of $100,234, while those with college or associate's degree education earn the least with $32,569. Women with an educational attainment of college or associate's degree earn the most with the average annual earnings of $29,643, while those with college or associate's degree education have the smallest earnings of $29,643.
| Educational Attainment | Male Income | Female Income |
| Less than High School | - | - |
| High School Diploma | $100,234 | $0 |
| College or Associate's Degree | $32,569 | $29,643 |
| Bachelor's Degree | - | - |
| Graduate Degree | - | - |
| Total | $34,583 | $29,732 |
Family Income in Westfir
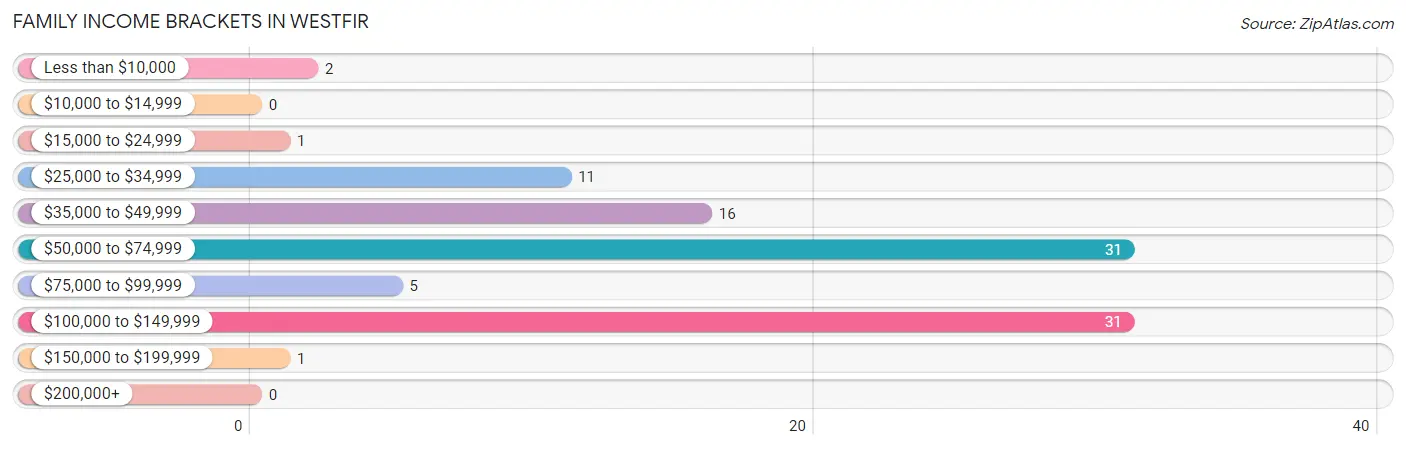
Family Income Brackets in Westfir
According to the Westfir family income data, there are 31 families falling into the $50,000 to $74,999 income range, which is the most common income bracket and makes up 31.6% of all families.
| Income Bracket | # Families | % Families |
| Less than $10,000 | 2 | 2.0% |
| $10,000 to $14,999 | 0 | 0.0% |
| $15,000 to $24,999 | 1 | 1.0% |
| $25,000 to $34,999 | 11 | 11.2% |
| $35,000 to $49,999 | 16 | 16.3% |
| $50,000 to $74,999 | 31 | 31.6% |
| $75,000 to $99,999 | 5 | 5.1% |
| $100,000 to $149,999 | 31 | 31.6% |
| $150,000 to $199,999 | 1 | 1.0% |
| $200,000+ | 0 | 0.0% |
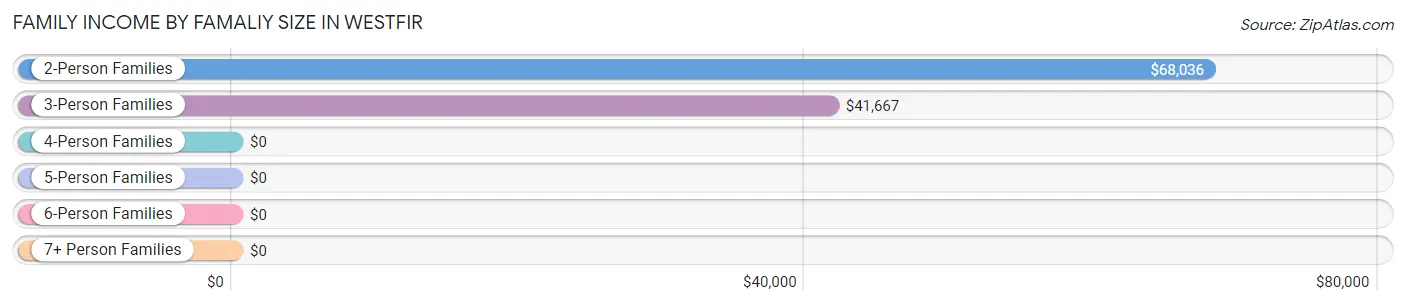
Family Income by Famaliy Size in Westfir
2-person families (54 | 55.1%) account for the highest median family income in Westfir with $68,036 per family, while 2-person families (54 | 55.1%) have the highest median income of $34,018 per family member.
| Income Bracket | # Families | Median Income |
| 2-Person Families | 54 (55.1%) | $68,036 |
| 3-Person Families | 18 (18.4%) | $41,667 |
| 4-Person Families | 10 (10.2%) | $0 |
| 5-Person Families | 0 (0.0%) | $0 |
| 6-Person Families | 0 (0.0%) | $0 |
| 7+ Person Families | 16 (16.3%) | $0 |
| Total | 98 (100.0%) | $68,393 |
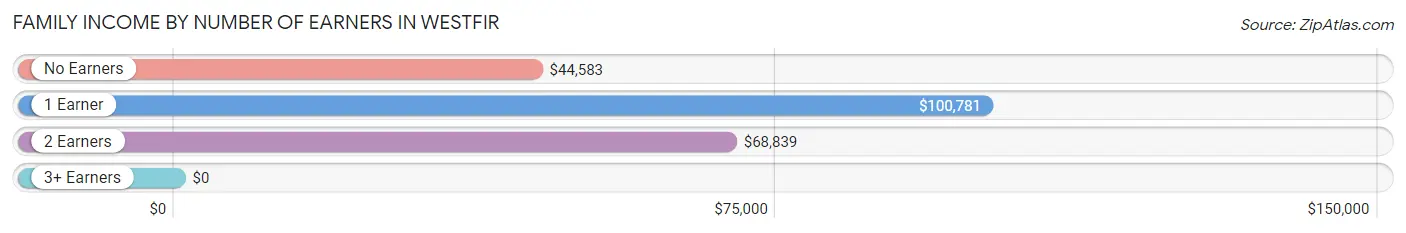
Family Income by Number of Earners in Westfir
| Number of Earners | # Families | Median Income |
| No Earners | 27 (27.6%) | $44,583 |
| 1 Earner | 38 (38.8%) | $100,781 |
| 2 Earners | 33 (33.7%) | $68,839 |
| 3+ Earners | 0 (0.0%) | $0 |
| Total | 98 (100.0%) | $68,393 |
Household Income in Westfir
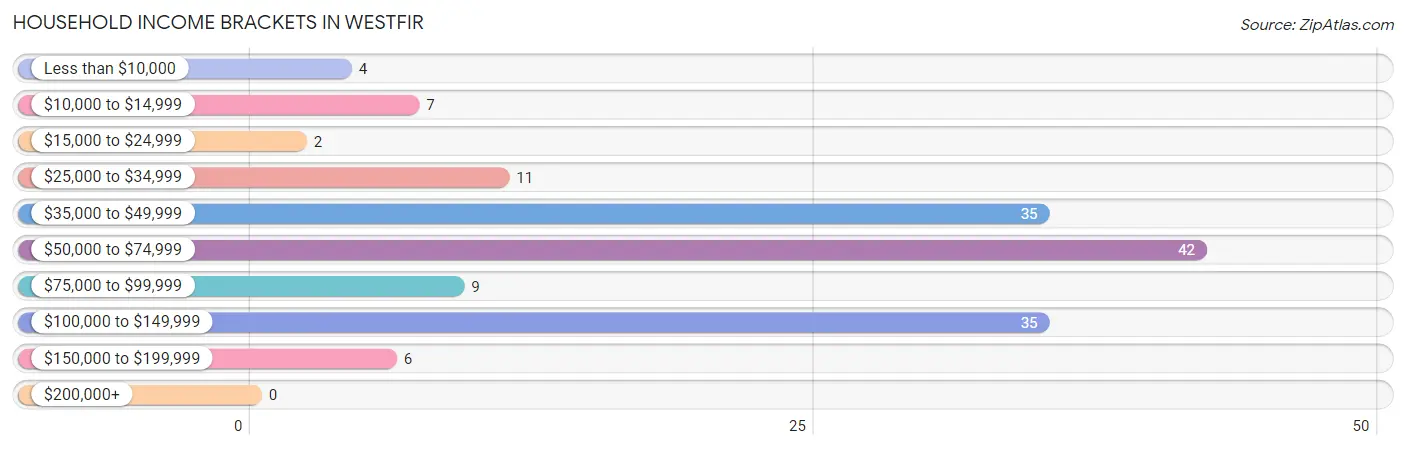
Household Income Brackets in Westfir
With 42 households falling in the category, the $50,000 to $74,999 income range is the most frequent in Westfir, accounting for 27.8% of all households.
| Income Bracket | # Households | % Households |
| Less than $10,000 | 4 | 2.6% |
| $10,000 to $14,999 | 7 | 4.6% |
| $15,000 to $24,999 | 2 | 1.3% |
| $25,000 to $34,999 | 11 | 7.3% |
| $35,000 to $49,999 | 35 | 23.2% |
| $50,000 to $74,999 | 42 | 27.8% |
| $75,000 to $99,999 | 9 | 6.0% |
| $100,000 to $149,999 | 35 | 23.2% |
| $150,000 to $199,999 | 6 | 4.0% |
| $200,000+ | 0 | 0.0% |
Household Income by Householder Age in Westfir
The median household income in Westfir is $61,250, with the highest median household income of $101,250 found in the 25 to 44 years age bracket for the primary householder. A total of 42 households (27.8%) fall into this category.
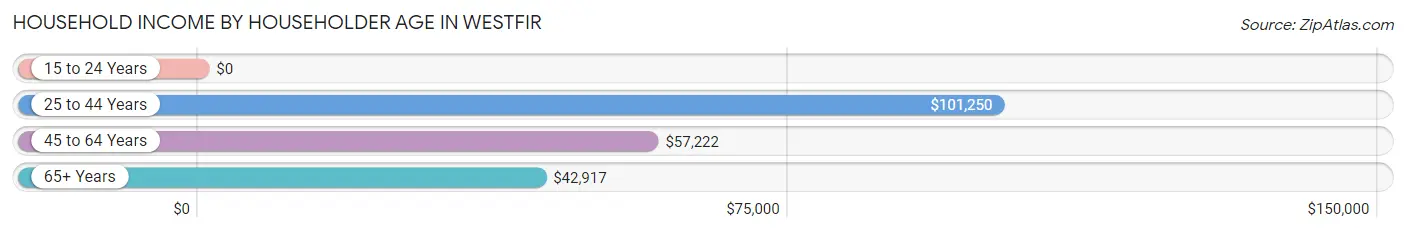
| Income Bracket | # Households | Median Income |
| 15 to 24 Years | 0 (0.0%) | $0 |
| 25 to 44 Years | 42 (27.8%) | $101,250 |
| 45 to 64 Years | 52 (34.4%) | $57,222 |
| 65+ Years | 57 (37.8%) | $42,917 |
| Total | 151 (100.0%) | $61,250 |
Poverty in Westfir
Income Below Poverty by Sex and Age in Westfir
With 8.1% poverty level for males and 13.0% for females among the residents of Westfir, 6 to 11 year old males and 65 to 74 year old females are the most vulnerable to poverty, with 3 males (100.0%) and 8 females (26.7%) in their respective age groups living below the poverty level.
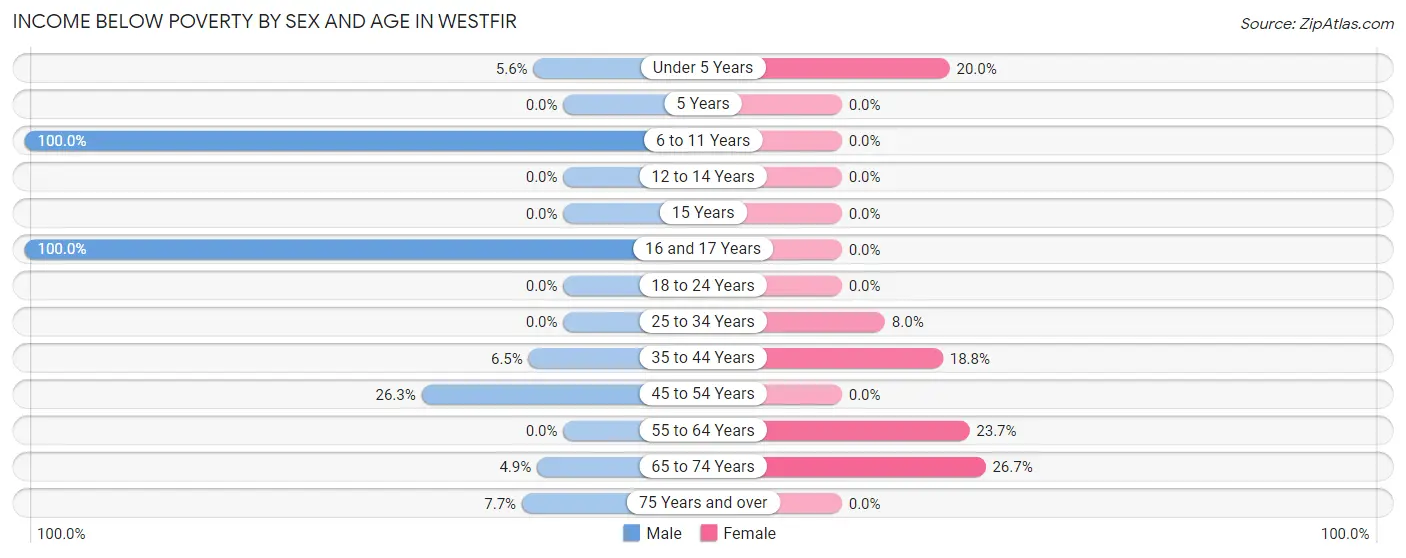
| Age Bracket | Male | Female |
| Under 5 Years | 2 (5.6%) | 2 (20.0%) |
| 5 Years | 0 (0.0%) | 0 (0.0%) |
| 6 to 11 Years | 3 (100.0%) | 0 (0.0%) |
| 12 to 14 Years | 0 (0.0%) | 0 (0.0%) |
| 15 Years | 0 (0.0%) | 0 (0.0%) |
| 16 and 17 Years | 2 (100.0%) | 0 (0.0%) |
| 18 to 24 Years | 0 (0.0%) | 0 (0.0%) |
| 25 to 34 Years | 0 (0.0%) | 2 (8.0%) |
| 35 to 44 Years | 2 (6.5%) | 3 (18.8%) |
| 45 to 54 Years | 5 (26.3%) | 0 (0.0%) |
| 55 to 64 Years | 0 (0.0%) | 9 (23.7%) |
| 65 to 74 Years | 2 (4.9%) | 8 (26.7%) |
| 75 Years and over | 1 (7.7%) | 0 (0.0%) |
| Total | 17 (8.1%) | 24 (13.0%) |
Income Above Poverty by Sex and Age in Westfir
According to the poverty statistics in Westfir, males aged 12 to 14 years and females aged 6 to 11 years are the age groups that are most secure financially, with 100.0% of males and 100.0% of females in these age groups living above the poverty line.
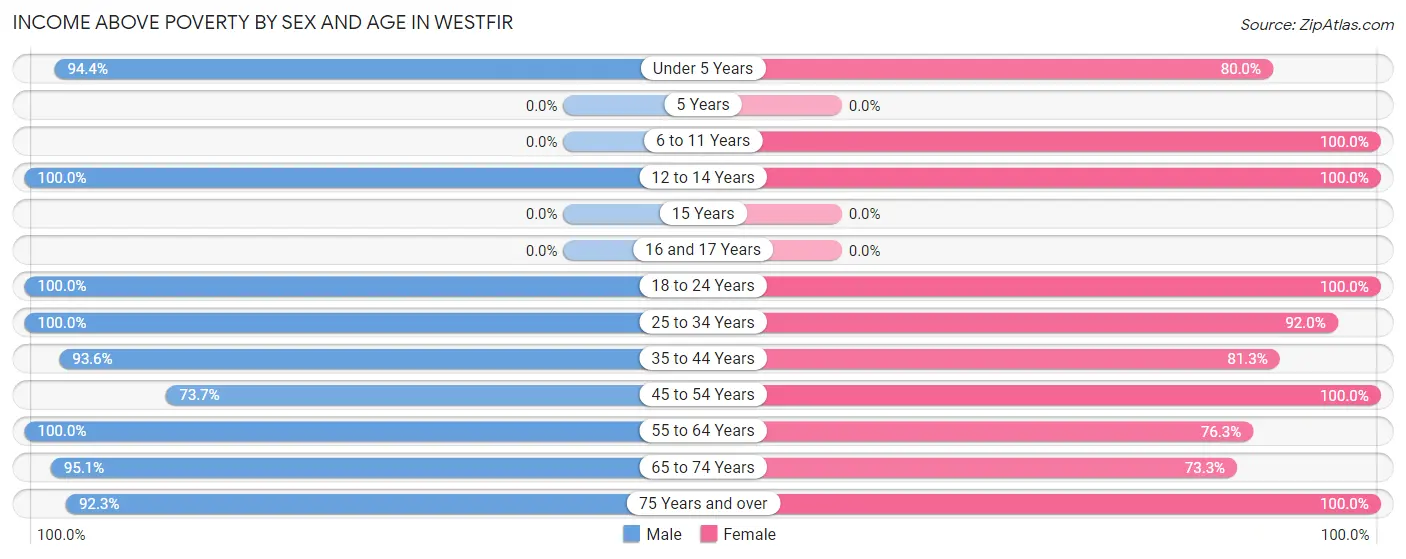
| Age Bracket | Male | Female |
| Under 5 Years | 34 (94.4%) | 8 (80.0%) |
| 5 Years | 0 (0.0%) | 0 (0.0%) |
| 6 to 11 Years | 0 (0.0%) | 36 (100.0%) |
| 12 to 14 Years | 4 (100.0%) | 16 (100.0%) |
| 15 Years | 0 (0.0%) | 0 (0.0%) |
| 16 and 17 Years | 0 (0.0%) | 0 (0.0%) |
| 18 to 24 Years | 8 (100.0%) | 3 (100.0%) |
| 25 to 34 Years | 23 (100.0%) | 23 (92.0%) |
| 35 to 44 Years | 29 (93.5%) | 13 (81.2%) |
| 45 to 54 Years | 14 (73.7%) | 6 (100.0%) |
| 55 to 64 Years | 29 (100.0%) | 29 (76.3%) |
| 65 to 74 Years | 39 (95.1%) | 22 (73.3%) |
| 75 Years and over | 12 (92.3%) | 5 (100.0%) |
| Total | 192 (91.9%) | 161 (87.0%) |
Income Below Poverty Among Married-Couple Families in Westfir
The poverty statistics for married-couple families in Westfir show that 7.8% or 7 of the total 90 families live below the poverty line. Families with 1 or 2 children have the highest poverty rate of 43.8%, comprising of 7 families. On the other hand, families with no children have the lowest poverty rate of 0.0%, which includes 0 families.
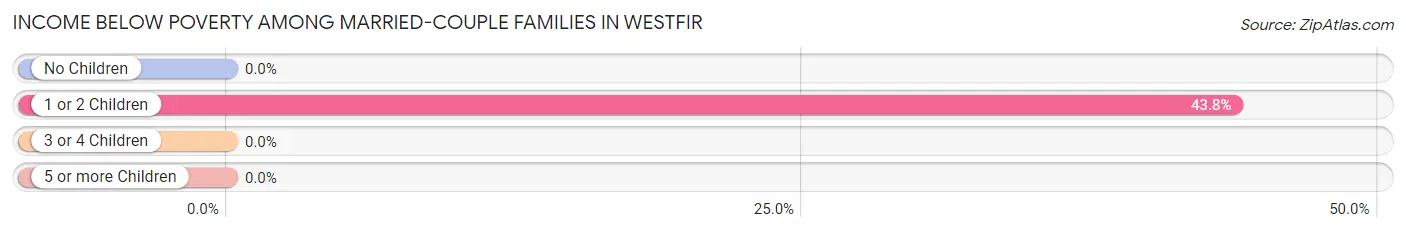
| Children | Above Poverty | Below Poverty |
| No Children | 58 (100.0%) | 0 (0.0%) |
| 1 or 2 Children | 9 (56.2%) | 7 (43.8%) |
| 3 or 4 Children | 0 (0.0%) | 0 (0.0%) |
| 5 or more Children | 16 (100.0%) | 0 (0.0%) |
| Total | 83 (92.2%) | 7 (7.8%) |
Income Below Poverty Among Single-Parent Households in Westfir
| Children | Single Father | Single Mother |
| No Children | 0 (0.0%) | 0 (0.0%) |
| 1 or 2 Children | 0 (0.0%) | 0 (0.0%) |
| 3 or 4 Children | 0 (0.0%) | 0 (0.0%) |
| 5 or more Children | 0 (0.0%) | 0 (0.0%) |
| Total | 0 (0.0%) | 0 (0.0%) |
Income Below Poverty Among Married-Couple vs Single-Parent Households in Westfir
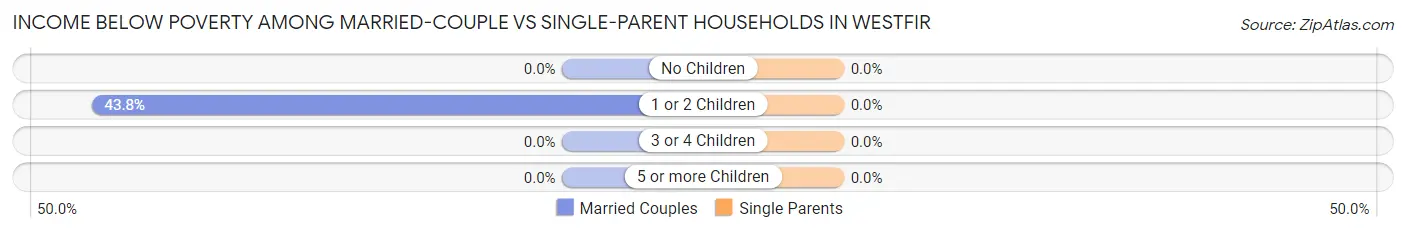
| Children | Married-Couple Families | Single-Parent Households |
| No Children | 0 (0.0%) | 0 (0.0%) |
| 1 or 2 Children | 7 (43.8%) | 0 (0.0%) |
| 3 or 4 Children | 0 (0.0%) | 0 (0.0%) |
| 5 or more Children | 0 (0.0%) | 0 (0.0%) |
| Total | 7 (7.8%) | 0 (0.0%) |
Race in Westfir
The most populous races in Westfir are White / Caucasian (389 | 98.7%), Hispanic or Latino (16 | 4.1%), and Some other Race (4 | 1.0%).
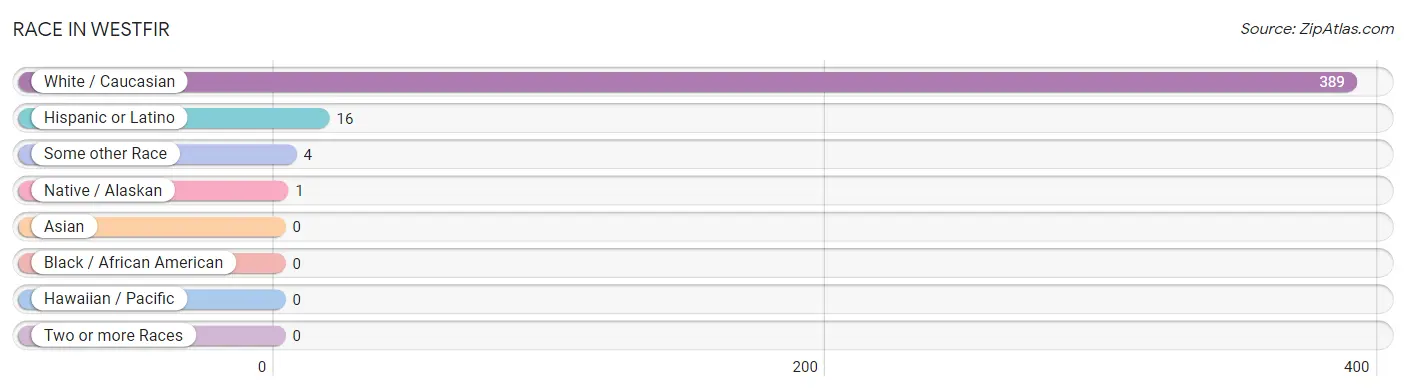
| Race | # Population | % Population |
| Asian | 0 | 0.0% |
| Black / African American | 0 | 0.0% |
| Hawaiian / Pacific | 0 | 0.0% |
| Hispanic or Latino | 16 | 4.1% |
| Native / Alaskan | 1 | 0.3% |
| White / Caucasian | 389 | 98.7% |
| Two or more Races | 0 | 0.0% |
| Some other Race | 4 | 1.0% |
| Total | 394 | 100.0% |
Ancestry in Westfir
The most populous ancestries reported in Westfir are German (165 | 41.9%), Portuguese (82 | 20.8%), English (77 | 19.5%), Irish (45 | 11.4%), and Swedish (23 | 5.8%), together accounting for 99.5% of all Westfir residents.
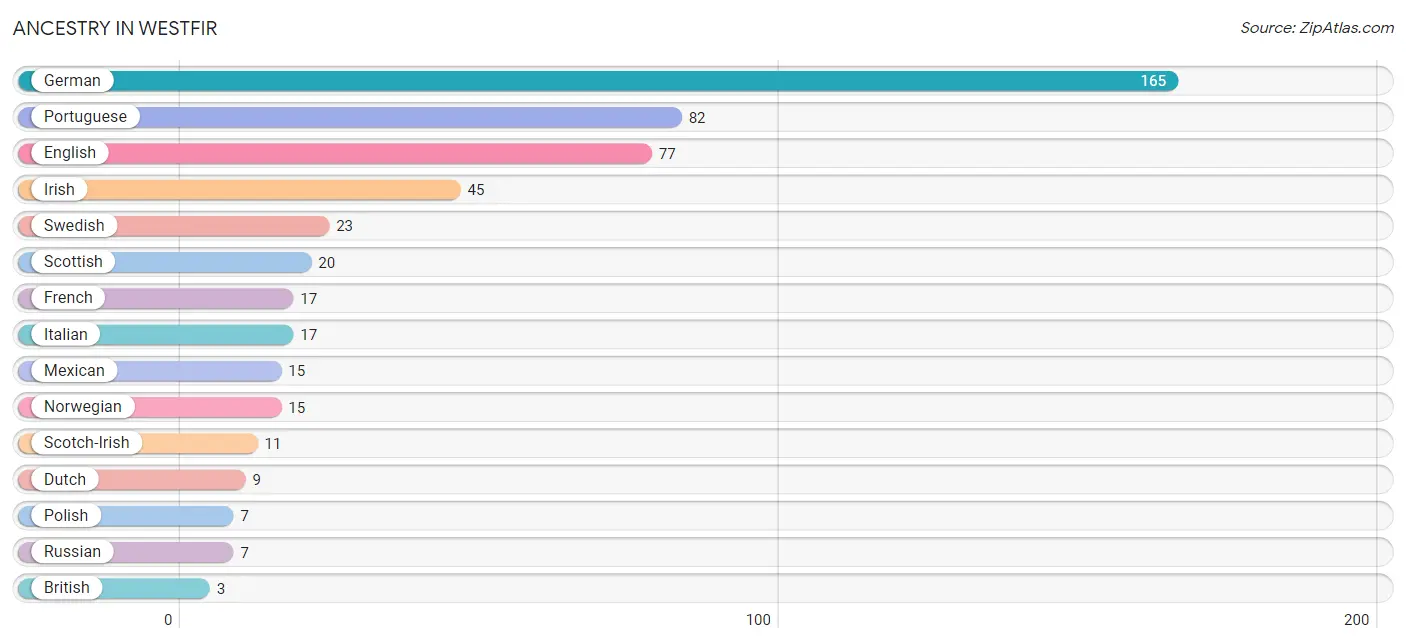
| Ancestry | # Population | % Population |
| American | 2 | 0.5% |
| British | 3 | 0.8% |
| Danish | 2 | 0.5% |
| Dutch | 9 | 2.3% |
| Eastern European | 1 | 0.3% |
| English | 77 | 19.5% |
| Finnish | 1 | 0.3% |
| French | 17 | 4.3% |
| French Canadian | 2 | 0.5% |
| German | 165 | 41.9% |
| Irish | 45 | 11.4% |
| Italian | 17 | 4.3% |
| Mexican | 15 | 3.8% |
| Northern European | 1 | 0.3% |
| Norwegian | 15 | 3.8% |
| Polish | 7 | 1.8% |
| Portuguese | 82 | 20.8% |
| Russian | 7 | 1.8% |
| Scandinavian | 1 | 0.3% |
| Scotch-Irish | 11 | 2.8% |
| Scottish | 20 | 5.1% |
| Spaniard | 1 | 0.3% |
| Swedish | 23 | 5.8% |
| Welsh | 3 | 0.8% | View All 24 Rows |
Immigrants in Westfir
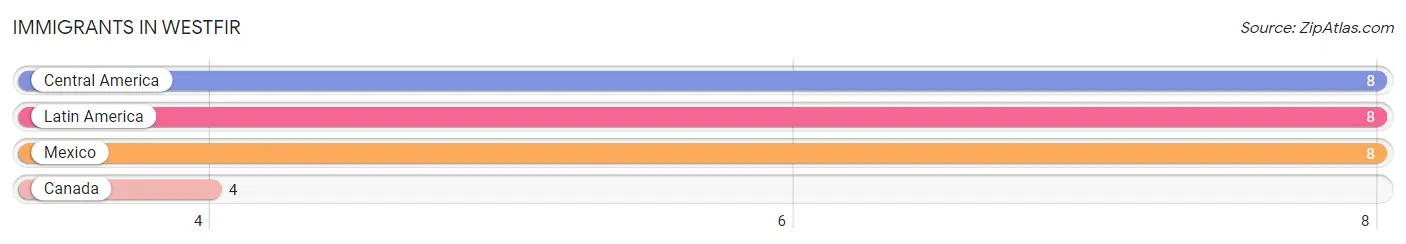
The most numerous immigrant groups reported in Westfir came from Central America (8 | 2.0%), Latin America (8 | 2.0%), Mexico (8 | 2.0%), and Canada (4 | 1.0%), together accounting for 7.1% of all Westfir residents.
| Immigration Origin | # Population | % Population |
| Canada | 4 | 1.0% |
| Central America | 8 | 2.0% |
| Latin America | 8 | 2.0% |
| Mexico | 8 | 2.0% | View All 4 Rows |
Sex and Age in Westfir
Sex and Age in Westfir
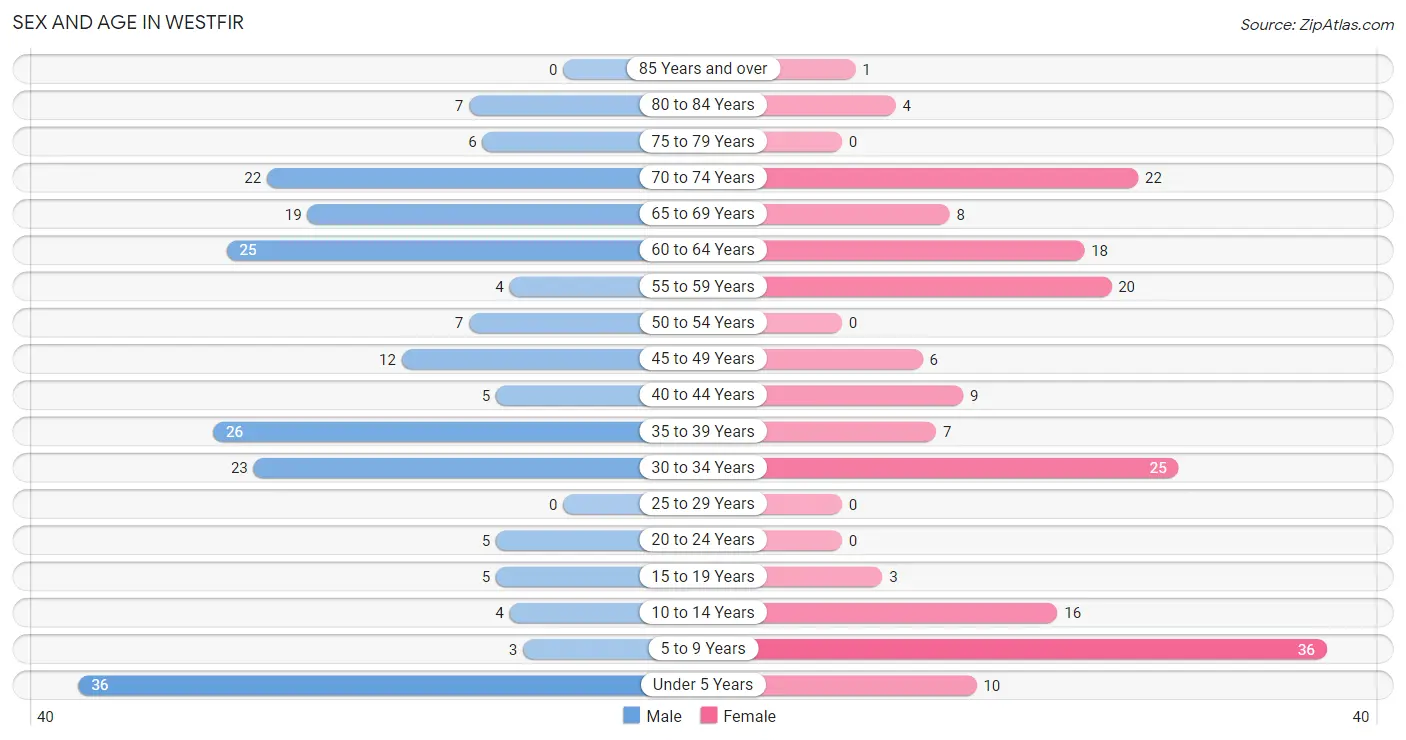
The most populous age groups in Westfir are Under 5 Years (36 | 17.2%) for men and 5 to 9 Years (36 | 19.5%) for women.
| Age Bracket | Male | Female |
| Under 5 Years | 36 (17.2%) | 10 (5.4%) |
| 5 to 9 Years | 3 (1.4%) | 36 (19.5%) |
| 10 to 14 Years | 4 (1.9%) | 16 (8.6%) |
| 15 to 19 Years | 5 (2.4%) | 3 (1.6%) |
| 20 to 24 Years | 5 (2.4%) | 0 (0.0%) |
| 25 to 29 Years | 0 (0.0%) | 0 (0.0%) |
| 30 to 34 Years | 23 (11.0%) | 25 (13.5%) |
| 35 to 39 Years | 26 (12.4%) | 7 (3.8%) |
| 40 to 44 Years | 5 (2.4%) | 9 (4.9%) |
| 45 to 49 Years | 12 (5.7%) | 6 (3.2%) |
| 50 to 54 Years | 7 (3.4%) | 0 (0.0%) |
| 55 to 59 Years | 4 (1.9%) | 20 (10.8%) |
| 60 to 64 Years | 25 (12.0%) | 18 (9.7%) |
| 65 to 69 Years | 19 (9.1%) | 8 (4.3%) |
| 70 to 74 Years | 22 (10.5%) | 22 (11.9%) |
| 75 to 79 Years | 6 (2.9%) | 0 (0.0%) |
| 80 to 84 Years | 7 (3.4%) | 4 (2.2%) |
| 85 Years and over | 0 (0.0%) | 1 (0.5%) |
| Total | 209 (100.0%) | 185 (100.0%) |
Families and Households in Westfir
Median Family Size in Westfir
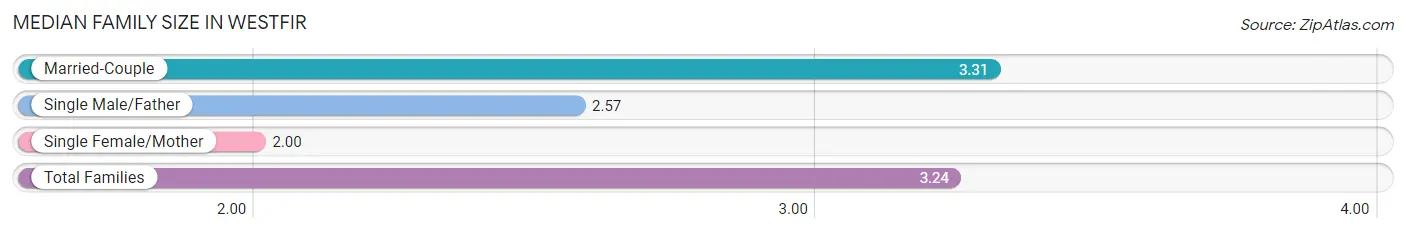
The median family size in Westfir is 3.24 persons per family, with married-couple families (90 | 91.8%) accounting for the largest median family size of 3.31 persons per family. On the other hand, single female/mother families (1 | 1.0%) represent the smallest median family size with 2.00 persons per family.
| Family Type | # Families | Family Size |
| Married-Couple | 90 (91.8%) | 3.31 |
| Single Male/Father | 7 (7.1%) | 2.57 |
| Single Female/Mother | 1 (1.0%) | 2.00 |
| Total Families | 98 (100.0%) | 3.24 |
Median Household Size in Westfir
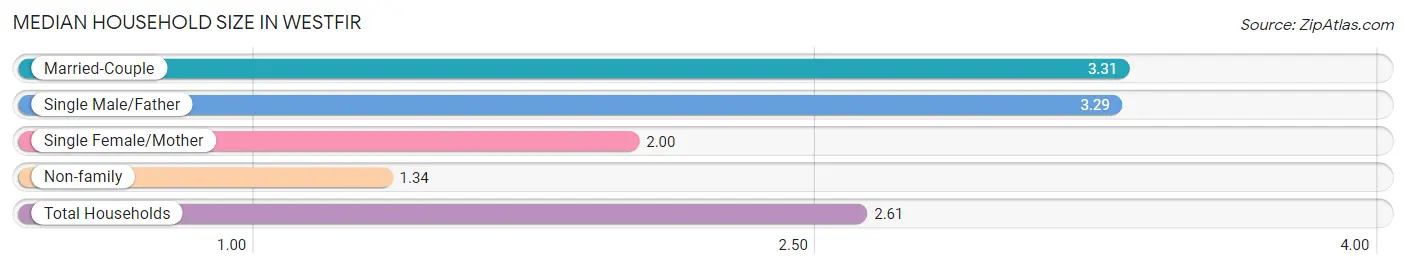
The median household size in Westfir is 2.61 persons per household, with married-couple households (90 | 59.6%) accounting for the largest median household size of 3.31 persons per household. non-family households (53 | 35.1%) represent the smallest median household size with 1.34 persons per household.
| Household Type | # Households | Household Size |
| Married-Couple | 90 (59.6%) | 3.31 |
| Single Male/Father | 7 (4.6%) | 3.29 |
| Single Female/Mother | 1 (0.7%) | 2.00 |
| Non-family | 53 (35.1%) | 1.34 |
| Total Households | 151 (100.0%) | 2.61 |
Household Size by Marriage Status in Westfir
Out of a total of 151 households in Westfir, 98 (64.9%) are family households, while 53 (35.1%) are nonfamily households. The most numerous type of family households are 2-person households, comprising 54, and the most common type of nonfamily households are 1-person households, comprising 34.
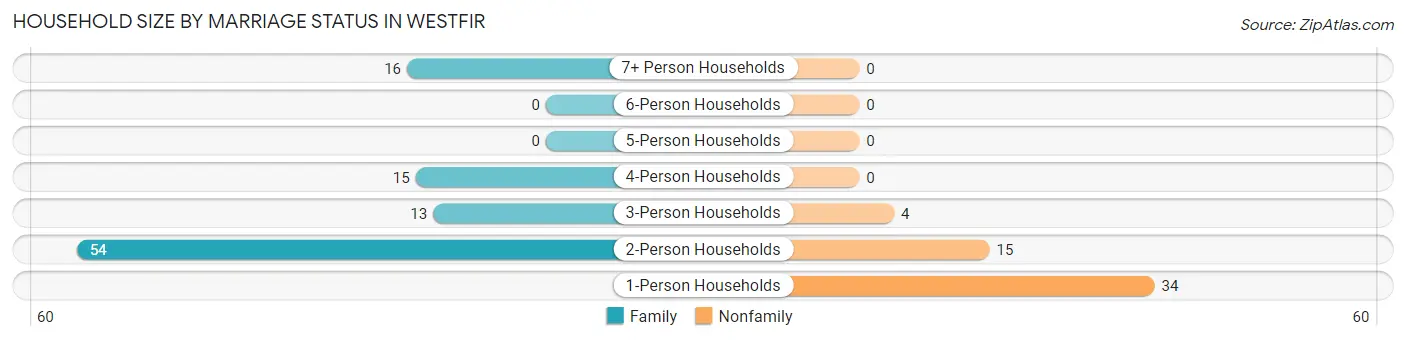
| Household Size | Family Households | Nonfamily Households |
| 1-Person Households | - | 34 (22.5%) |
| 2-Person Households | 54 (35.8%) | 15 (9.9%) |
| 3-Person Households | 13 (8.6%) | 4 (2.6%) |
| 4-Person Households | 15 (9.9%) | 0 (0.0%) |
| 5-Person Households | 0 (0.0%) | 0 (0.0%) |
| 6-Person Households | 0 (0.0%) | 0 (0.0%) |
| 7+ Person Households | 16 (10.6%) | 0 (0.0%) |
| Total | 98 (64.9%) | 53 (35.1%) |
Female Fertility in Westfir
Fertility by Age in Westfir
| Age Bracket | Women with Births | Births / 1,000 Women |
| 15 to 19 years | 0 (0.0%) | 0.0 |
| 20 to 34 years | 0 (0.0%) | 0.0 |
| 35 to 50 years | 0 (0.0%) | 0.0 |
| Total | 0 (0.0%) | 0.0 |
Fertility by Age by Marriage Status in Westfir
| Age Bracket | Married | Unmarried |
| 15 to 19 years | 0 (0.0%) | 0 (0.0%) |
| 20 to 34 years | 0 (0.0%) | 0 (0.0%) |
| 35 to 50 years | 0 (0.0%) | 0 (0.0%) |
| Total | 0 (0.0%) | 0 (0.0%) |
Fertility by Education in Westfir
| Educational Attainment | Women with Births | Births / 1,000 Women |
| Less than High School | 0 (0.0%) | 0.0 |
| High School Diploma | 0 (0.0%) | 0.0 |
| College or Associate's Degree | 0 (0.0%) | 0.0 |
| Bachelor's Degree | 0 (0.0%) | 0.0 |
| Graduate Degree | 0 (0.0%) | 0.0 |
| Total | 0 (0.0%) | 0.0 |
Fertility by Education by Marriage Status in Westfir
| Educational Attainment | Married | Unmarried |
| Less than High School | 0 (0.0%) | 0 (0.0%) |
| High School Diploma | 0 (0.0%) | 0 (0.0%) |
| College or Associate's Degree | 0 (0.0%) | 0 (0.0%) |
| Bachelor's Degree | 0 (0.0%) | 0 (0.0%) |
| Graduate Degree | 0 (0.0%) | 0 (0.0%) |
| Total | 0 (0.0%) | 0 (0.0%) |
Employment Characteristics in Westfir
Employment by Class of Employer in Westfir
Among the 116 employed individuals in Westfir, private company employees (54 | 46.6%), self-employed (not incorporated) (38 | 32.8%), and not-for-profit organizations (12 | 10.3%) make up the most common classes of employment.
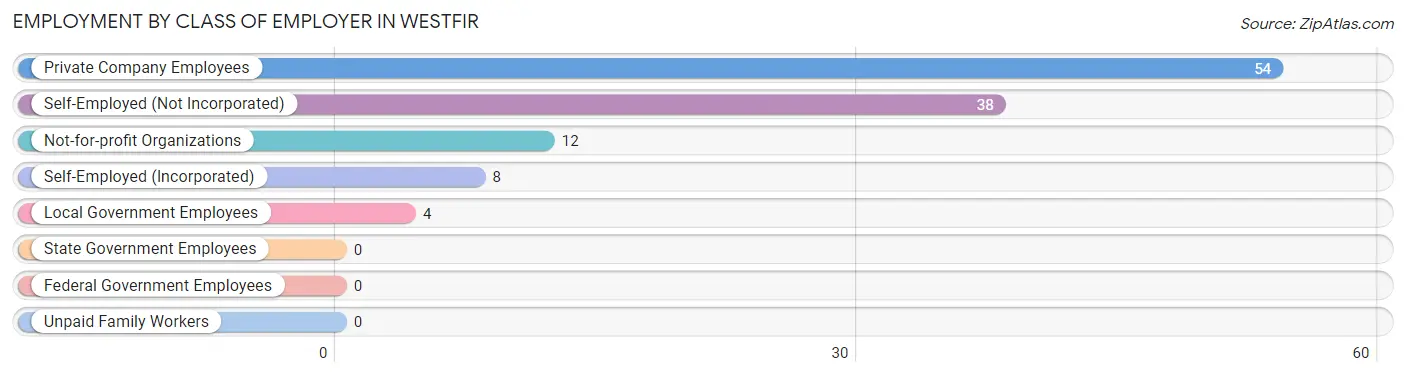
| Employer Class | # Employees | % Employees |
| Private Company Employees | 54 | 46.6% |
| Self-Employed (Incorporated) | 8 | 6.9% |
| Self-Employed (Not Incorporated) | 38 | 32.8% |
| Not-for-profit Organizations | 12 | 10.3% |
| Local Government Employees | 4 | 3.5% |
| State Government Employees | 0 | 0.0% |
| Federal Government Employees | 0 | 0.0% |
| Unpaid Family Workers | 0 | 0.0% |
| Total | 116 | 100.0% |
Employment Status by Age in Westfir
According to the labor force statistics for Westfir, out of the total population over 16 years of age (289), 50.2% or 145 individuals are in the labor force, with 12.4% or 18 of them unemployed. The age group with the highest labor force participation rate is 55 to 59 years, with 95.8% or 23 individuals in the labor force. Within the labor force, the 35 to 44 years age range has the highest percentage of unemployed individuals, with 31.6% or 12 of them being unemployed.
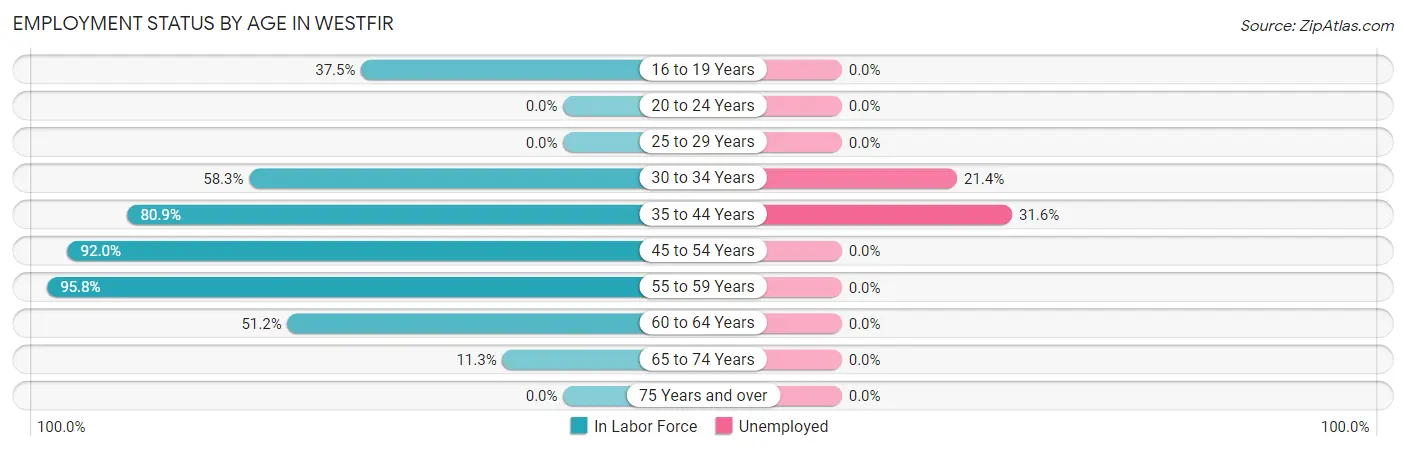
| Age Bracket | In Labor Force | Unemployed |
| 16 to 19 Years | 3 (37.5%) | 0 (0.0%) |
| 20 to 24 Years | 0 (0.0%) | 0 (0.0%) |
| 25 to 29 Years | 0 (0.0%) | 0 (0.0%) |
| 30 to 34 Years | 28 (58.3%) | 6 (21.4%) |
| 35 to 44 Years | 38 (80.9%) | 12 (31.6%) |
| 45 to 54 Years | 23 (92.0%) | 0 (0.0%) |
| 55 to 59 Years | 23 (95.8%) | 0 (0.0%) |
| 60 to 64 Years | 22 (51.2%) | 0 (0.0%) |
| 65 to 74 Years | 8 (11.3%) | 0 (0.0%) |
| 75 Years and over | 0 (0.0%) | 0 (0.0%) |
| Total | 145 (50.2%) | 18 (12.4%) |
Employment Status by Educational Attainment in Westfir
According to labor force statistics for Westfir, 71.7% of individuals (134) out of the total population between 25 and 64 years of age (187) are in the labor force, with 13.4% or 18 of them being unemployed. The group with the highest labor force participation rate are those with the educational attainment of bachelor's degree or higher, with 85.7% or 12 individuals in the labor force. Within the labor force, individuals with less than high school education have the highest percentage of unemployment, with 37.5% or 6 of them being unemployed.
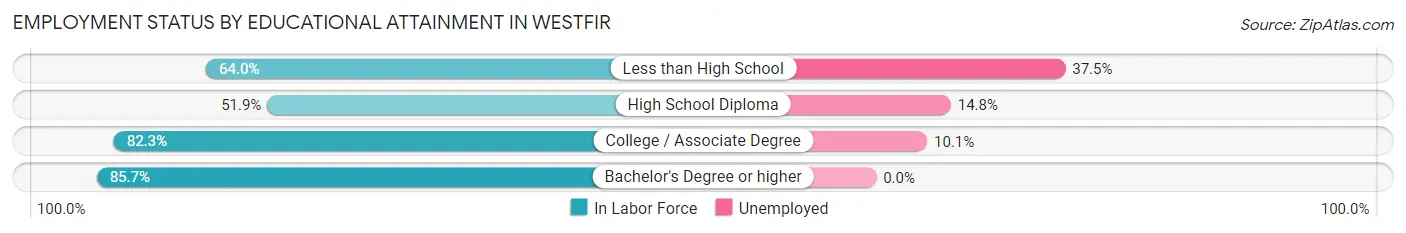
| Educational Attainment | In Labor Force | Unemployed |
| Less than High School | 16 (64.0%) | 9 (37.5%) |
| High School Diploma | 27 (51.9%) | 8 (14.8%) |
| College / Associate Degree | 79 (82.3%) | 10 (10.1%) |
| Bachelor's Degree or higher | 12 (85.7%) | 0 (0.0%) |
| Total | 134 (71.7%) | 25 (13.4%) |
Employment Occupations by Sex in Westfir
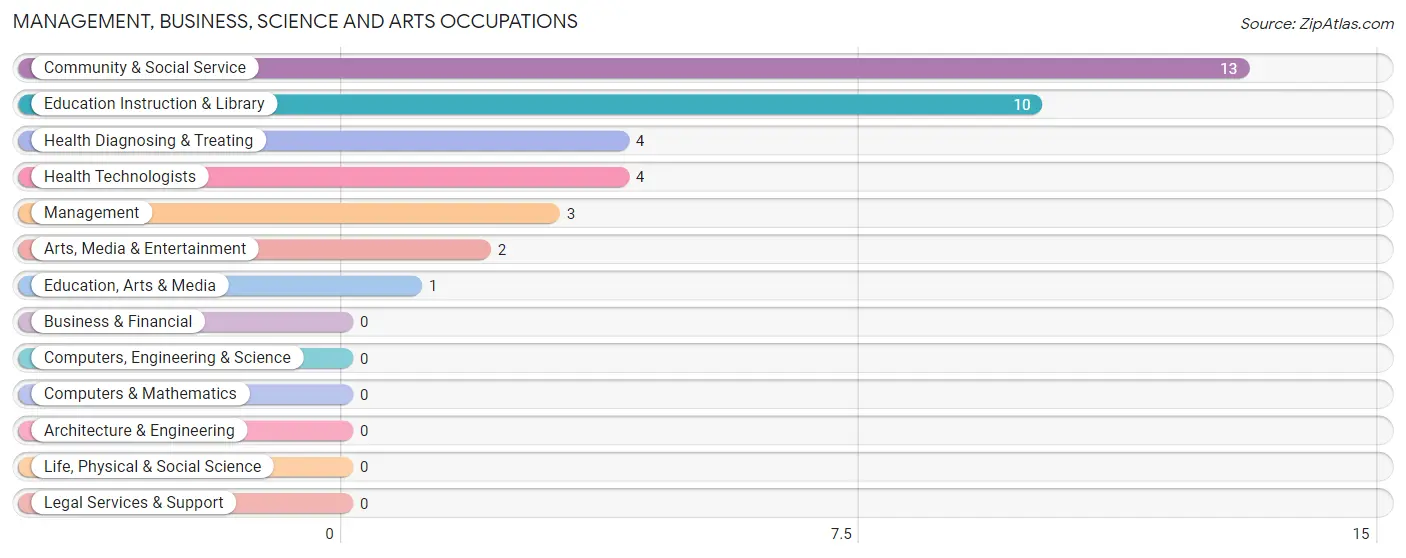
Management, Business, Science and Arts Occupations
The most common Management, Business, Science and Arts occupations in Westfir are Community & Social Service (13 | 10.2%), Education Instruction & Library (10 | 7.9%), Health Diagnosing & Treating (4 | 3.2%), Health Technologists (4 | 3.2%), and Management (3 | 2.4%).
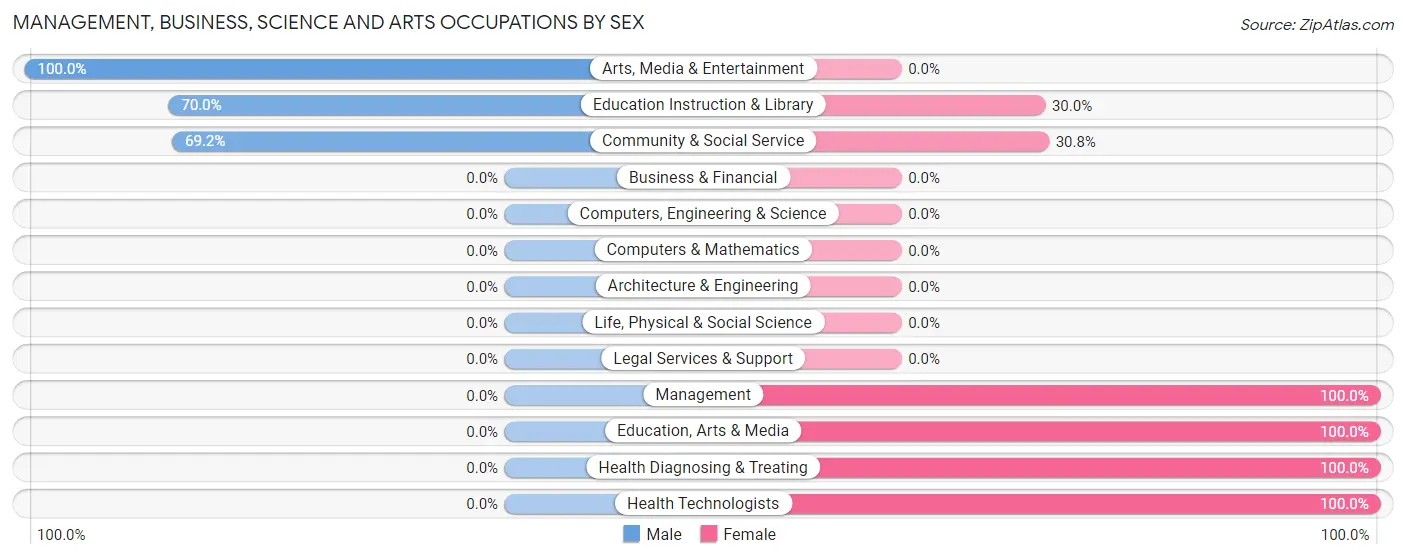
Management, Business, Science and Arts Occupations by Sex
Within the Management, Business, Science and Arts occupations in Westfir, the most male-oriented occupations are Arts, Media & Entertainment (100.0%), Education Instruction & Library (70.0%), and Community & Social Service (69.2%), while the most female-oriented occupations are Management (100.0%), Education, Arts & Media (100.0%), and Health Diagnosing & Treating (100.0%).
| Occupation | Male | Female |
| Management | 0 (0.0%) | 3 (100.0%) |
| Business & Financial | 0 (0.0%) | 0 (0.0%) |
| Computers, Engineering & Science | 0 (0.0%) | 0 (0.0%) |
| Computers & Mathematics | 0 (0.0%) | 0 (0.0%) |
| Architecture & Engineering | 0 (0.0%) | 0 (0.0%) |
| Life, Physical & Social Science | 0 (0.0%) | 0 (0.0%) |
| Community & Social Service | 9 (69.2%) | 4 (30.8%) |
| Education, Arts & Media | 0 (0.0%) | 1 (100.0%) |
| Legal Services & Support | 0 (0.0%) | 0 (0.0%) |
| Education Instruction & Library | 7 (70.0%) | 3 (30.0%) |
| Arts, Media & Entertainment | 2 (100.0%) | 0 (0.0%) |
| Health Diagnosing & Treating | 0 (0.0%) | 4 (100.0%) |
| Health Technologists | 0 (0.0%) | 4 (100.0%) |
| Total (Category) | 9 (45.0%) | 11 (55.0%) |
| Total (Overall) | 80 (63.0%) | 47 (37.0%) |
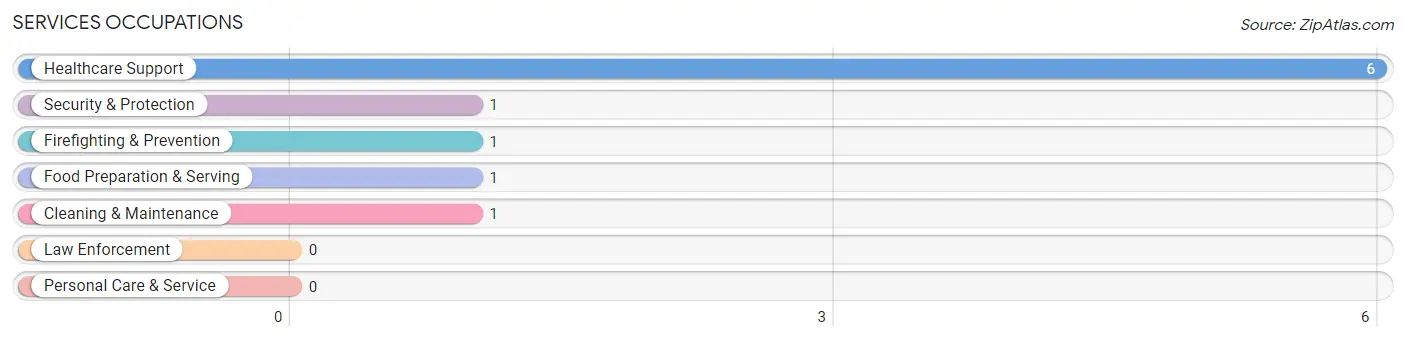
Services Occupations
The most common Services occupations in Westfir are Healthcare Support (6 | 4.7%), Security & Protection (1 | 0.8%), Firefighting & Prevention (1 | 0.8%), Food Preparation & Serving (1 | 0.8%), and Cleaning & Maintenance (1 | 0.8%).
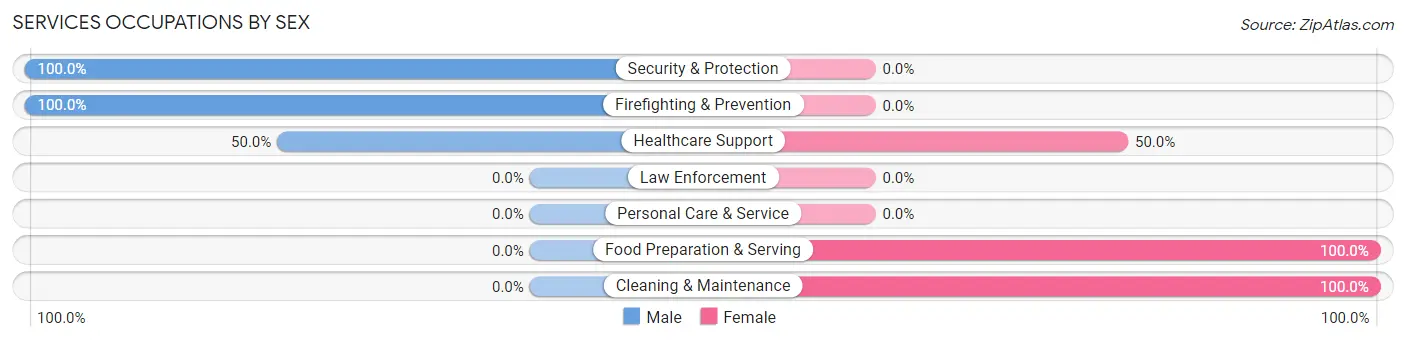
Services Occupations by Sex
Within the Services occupations in Westfir, the most male-oriented occupations are Security & Protection (100.0%), Firefighting & Prevention (100.0%), and Healthcare Support (50.0%), while the most female-oriented occupations are Food Preparation & Serving (100.0%), Cleaning & Maintenance (100.0%), and Healthcare Support (50.0%).
| Occupation | Male | Female |
| Healthcare Support | 3 (50.0%) | 3 (50.0%) |
| Security & Protection | 1 (100.0%) | 0 (0.0%) |
| Firefighting & Prevention | 1 (100.0%) | 0 (0.0%) |
| Law Enforcement | 0 (0.0%) | 0 (0.0%) |
| Food Preparation & Serving | 0 (0.0%) | 1 (100.0%) |
| Cleaning & Maintenance | 0 (0.0%) | 1 (100.0%) |
| Personal Care & Service | 0 (0.0%) | 0 (0.0%) |
| Total (Category) | 4 (44.4%) | 5 (55.6%) |
| Total (Overall) | 80 (63.0%) | 47 (37.0%) |
Sales and Office Occupations
The most common Sales and Office occupations in Westfir are Office & Administration (20 | 15.8%), and Sales & Related (10 | 7.9%).
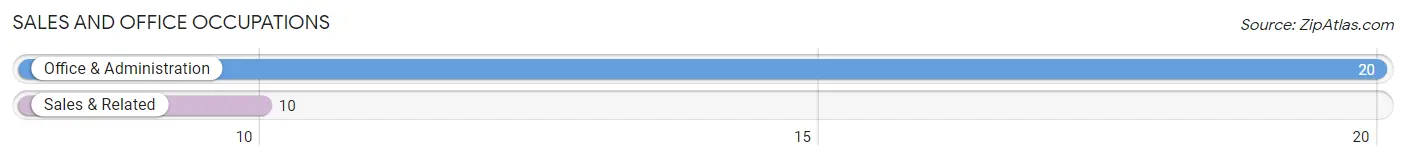
Sales and Office Occupations by Sex
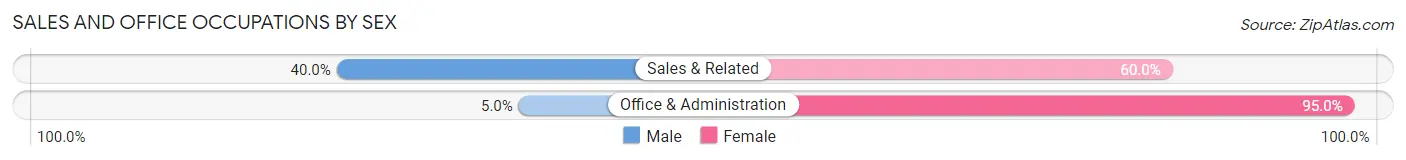
| Occupation | Male | Female |
| Sales & Related | 4 (40.0%) | 6 (60.0%) |
| Office & Administration | 1 (5.0%) | 19 (95.0%) |
| Total (Category) | 5 (16.7%) | 25 (83.3%) |
| Total (Overall) | 80 (63.0%) | 47 (37.0%) |
Natural Resources, Construction and Maintenance Occupations
The most common Natural Resources, Construction and Maintenance occupations in Westfir are Construction & Extraction (25 | 19.7%), and Farming, Fishing & Forestry (7 | 5.5%).
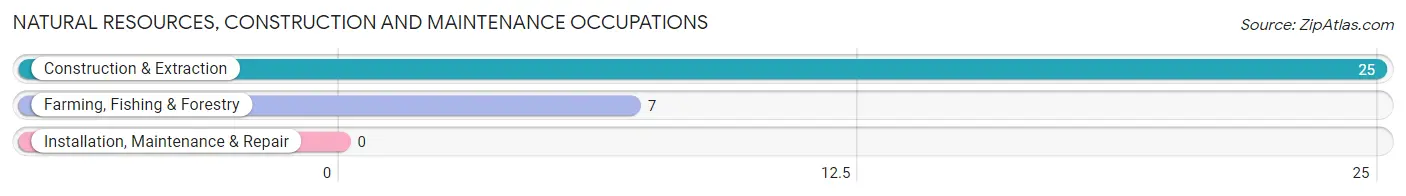
Natural Resources, Construction and Maintenance Occupations by Sex
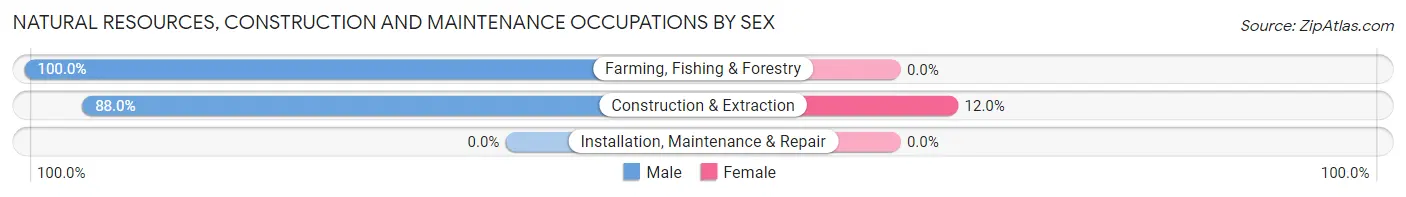
| Occupation | Male | Female |
| Farming, Fishing & Forestry | 7 (100.0%) | 0 (0.0%) |
| Construction & Extraction | 22 (88.0%) | 3 (12.0%) |
| Installation, Maintenance & Repair | 0 (0.0%) | 0 (0.0%) |
| Total (Category) | 29 (90.6%) | 3 (9.4%) |
| Total (Overall) | 80 (63.0%) | 47 (37.0%) |
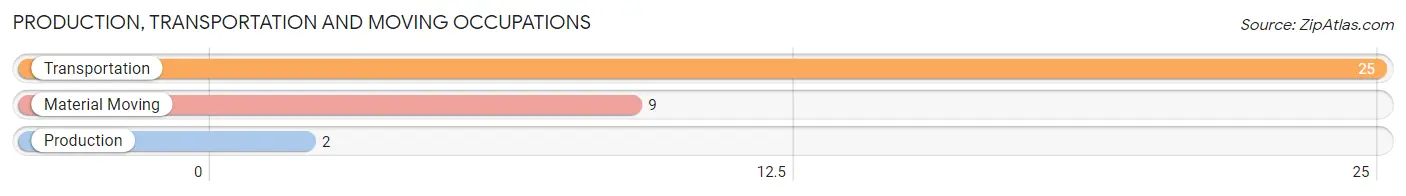
Production, Transportation and Moving Occupations
The most common Production, Transportation and Moving occupations in Westfir are Transportation (25 | 19.7%), Material Moving (9 | 7.1%), and Production (2 | 1.6%).
Production, Transportation and Moving Occupations by Sex
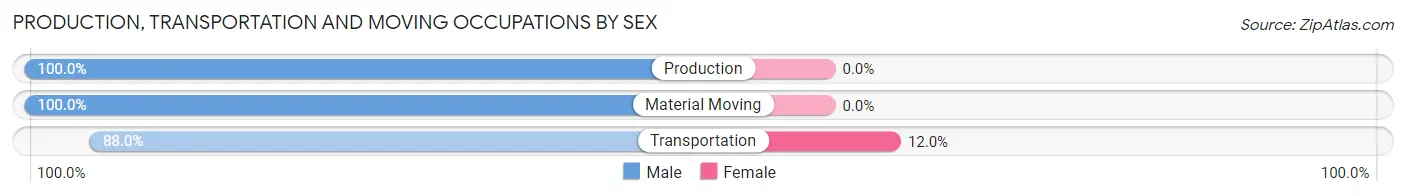
| Occupation | Male | Female |
| Production | 2 (100.0%) | 0 (0.0%) |
| Transportation | 22 (88.0%) | 3 (12.0%) |
| Material Moving | 9 (100.0%) | 0 (0.0%) |
| Total (Category) | 33 (91.7%) | 3 (8.3%) |
| Total (Overall) | 80 (63.0%) | 47 (37.0%) |
Employment Industries by Sex in Westfir
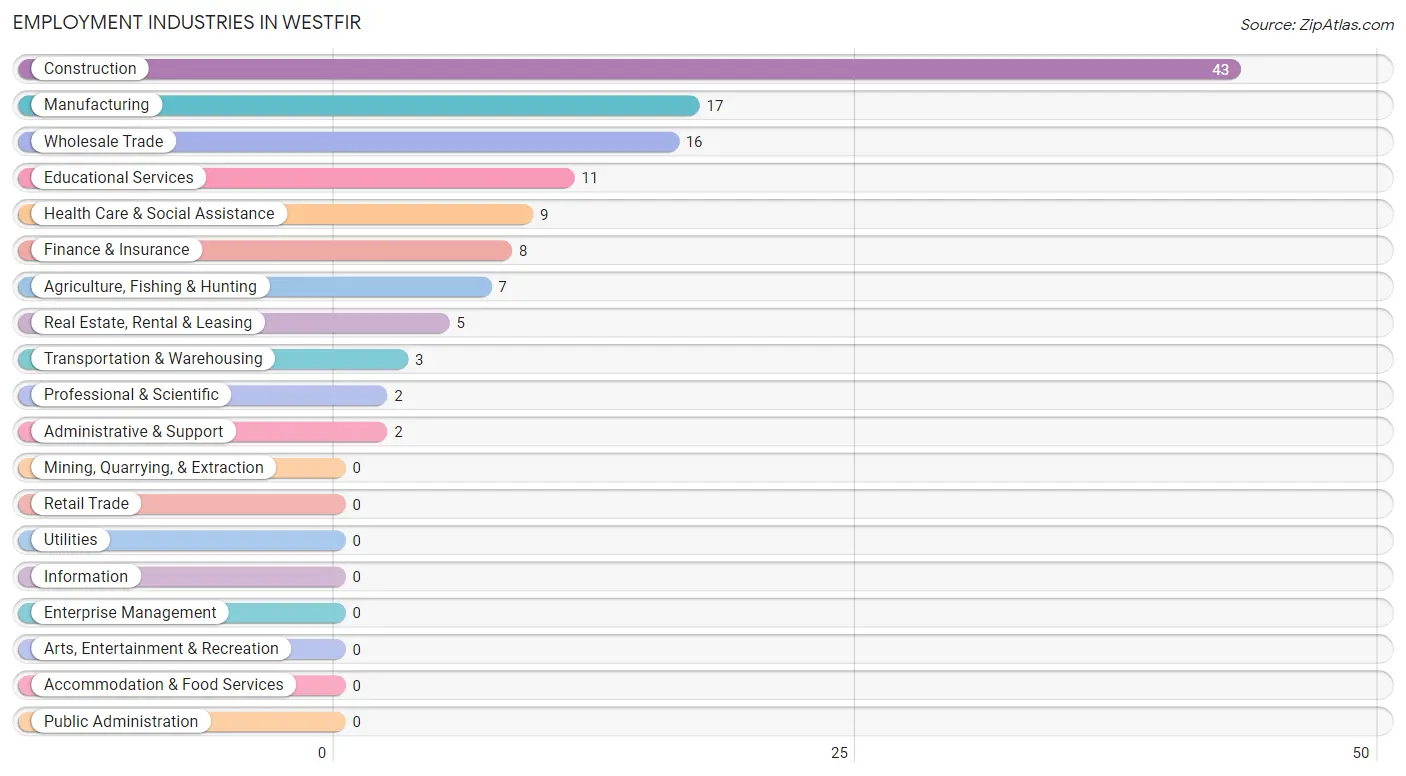
Employment Industries in Westfir
The major employment industries in Westfir include Construction (43 | 33.9%), Manufacturing (17 | 13.4%), Wholesale Trade (16 | 12.6%), Educational Services (11 | 8.7%), and Health Care & Social Assistance (9 | 7.1%).
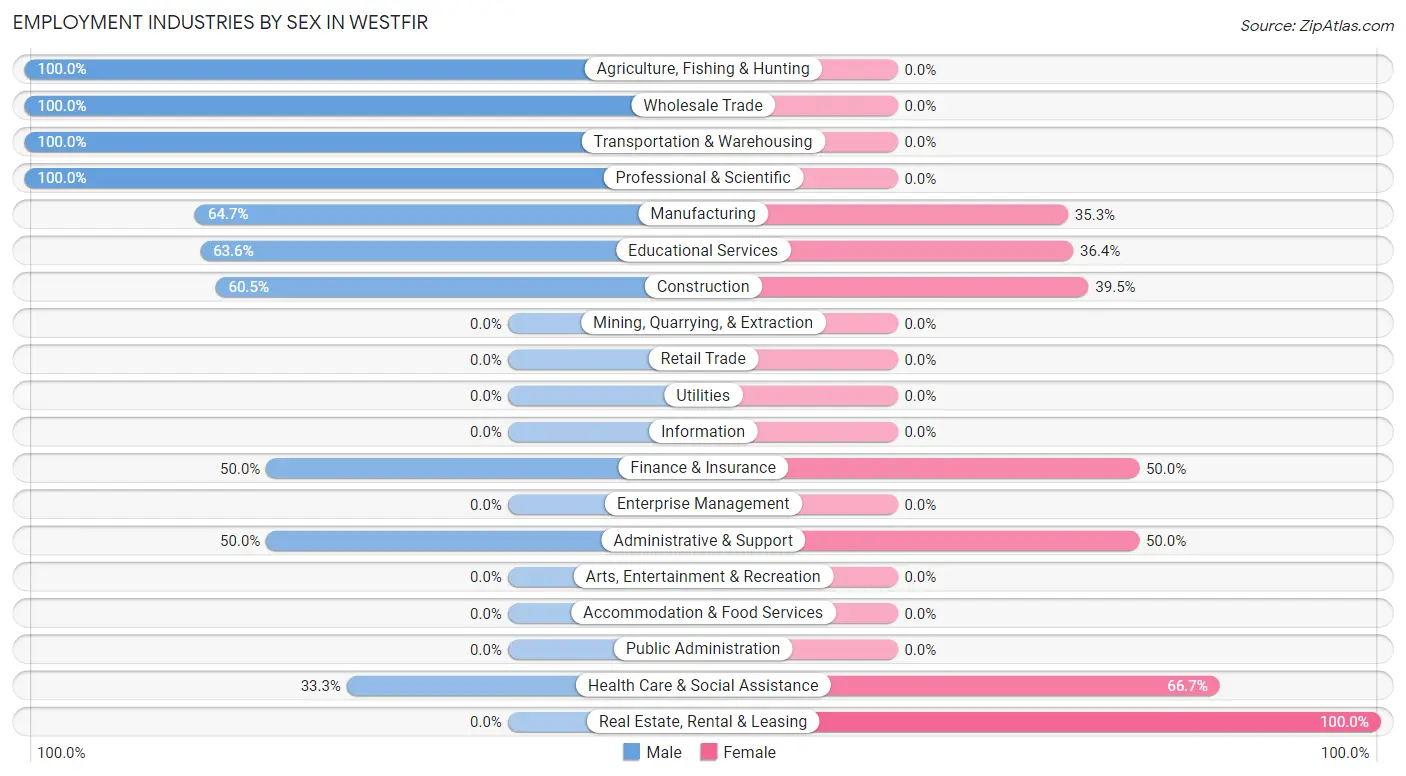
Employment Industries by Sex in Westfir
The Westfir industries that see more men than women are Agriculture, Fishing & Hunting (100.0%), Wholesale Trade (100.0%), and Transportation & Warehousing (100.0%), whereas the industries that tend to have a higher number of women are Real Estate, Rental & Leasing (100.0%), Health Care & Social Assistance (66.7%), and Finance & Insurance (50.0%).
| Industry | Male | Female |
| Agriculture, Fishing & Hunting | 7 (100.0%) | 0 (0.0%) |
| Mining, Quarrying, & Extraction | 0 (0.0%) | 0 (0.0%) |
| Construction | 26 (60.5%) | 17 (39.5%) |
| Manufacturing | 11 (64.7%) | 6 (35.3%) |
| Wholesale Trade | 16 (100.0%) | 0 (0.0%) |
| Retail Trade | 0 (0.0%) | 0 (0.0%) |
| Transportation & Warehousing | 3 (100.0%) | 0 (0.0%) |
| Utilities | 0 (0.0%) | 0 (0.0%) |
| Information | 0 (0.0%) | 0 (0.0%) |
| Finance & Insurance | 4 (50.0%) | 4 (50.0%) |
| Real Estate, Rental & Leasing | 0 (0.0%) | 5 (100.0%) |
| Professional & Scientific | 2 (100.0%) | 0 (0.0%) |
| Enterprise Management | 0 (0.0%) | 0 (0.0%) |
| Administrative & Support | 1 (50.0%) | 1 (50.0%) |
| Educational Services | 7 (63.6%) | 4 (36.4%) |
| Health Care & Social Assistance | 3 (33.3%) | 6 (66.7%) |
| Arts, Entertainment & Recreation | 0 (0.0%) | 0 (0.0%) |
| Accommodation & Food Services | 0 (0.0%) | 0 (0.0%) |
| Public Administration | 0 (0.0%) | 0 (0.0%) |
| Total | 80 (63.0%) | 47 (37.0%) |
Education in Westfir
School Enrollment in Westfir
The most common levels of schooling among the 65 students in Westfir are middle school (36 | 55.4%), kindergarten (16 | 24.6%), and elementary school (7 | 10.8%).
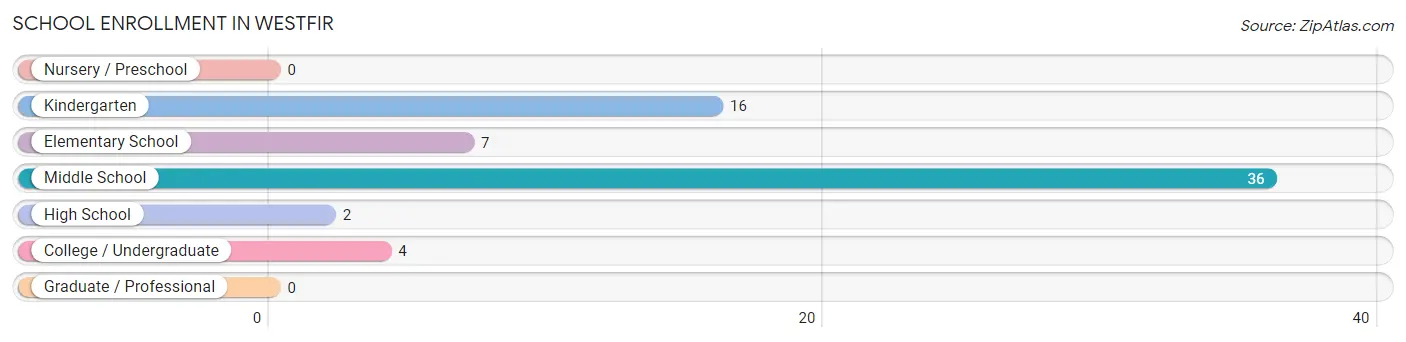
| School Level | # Students | % Students |
| Nursery / Preschool | 0 | 0.0% |
| Kindergarten | 16 | 24.6% |
| Elementary School | 7 | 10.8% |
| Middle School | 36 | 55.4% |
| High School | 2 | 3.1% |
| College / Undergraduate | 4 | 6.1% |
| Graduate / Professional | 0 | 0.0% |
| Total | 65 | 100.0% |
School Enrollment by Age by Funding Source in Westfir
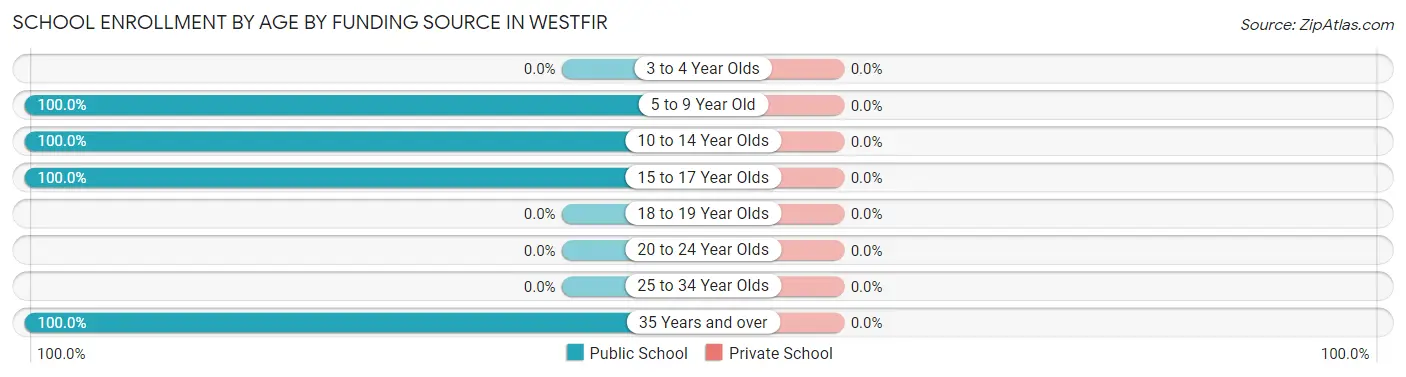
| Age Bracket | Public School | Private School |
| 3 to 4 Year Olds | 0 (0.0%) | 0 (0.0%) |
| 5 to 9 Year Old | 39 (100.0%) | 0 (0.0%) |
| 10 to 14 Year Olds | 20 (100.0%) | 0 (0.0%) |
| 15 to 17 Year Olds | 2 (100.0%) | 0 (0.0%) |
| 18 to 19 Year Olds | 0 (0.0%) | 0 (0.0%) |
| 20 to 24 Year Olds | 0 (0.0%) | 0 (0.0%) |
| 25 to 34 Year Olds | 0 (0.0%) | 0 (0.0%) |
| 35 Years and over | 4 (100.0%) | 0 (0.0%) |
| Total | 65 (100.0%) | 0 (0.0%) |
Educational Attainment by Field of Study in Westfir
Psychology (9 | 32.1%), business (7 | 25.0%), science & technology (4 | 14.3%), social sciences (3 | 10.7%), and arts & humanities (3 | 10.7%) are the most common fields of study among 28 individuals in Westfir who have obtained a bachelor's degree or higher.
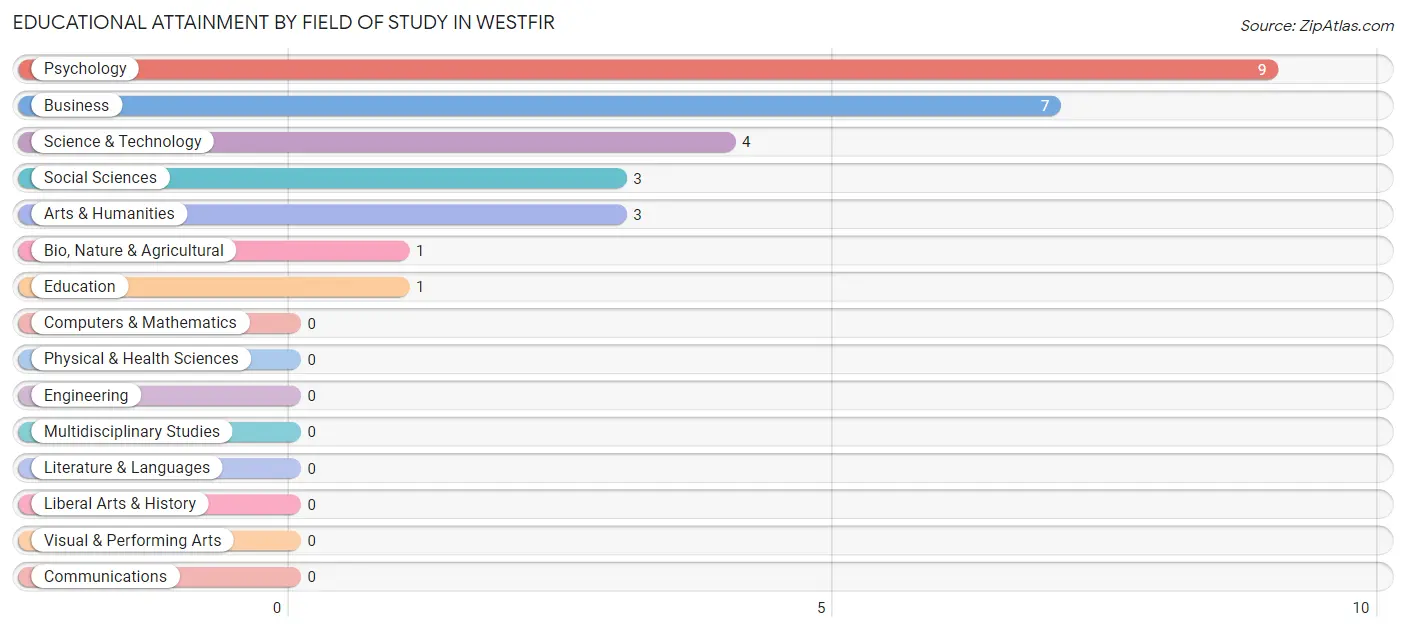
| Field of Study | # Graduates | % Graduates |
| Computers & Mathematics | 0 | 0.0% |
| Bio, Nature & Agricultural | 1 | 3.6% |
| Physical & Health Sciences | 0 | 0.0% |
| Psychology | 9 | 32.1% |
| Social Sciences | 3 | 10.7% |
| Engineering | 0 | 0.0% |
| Multidisciplinary Studies | 0 | 0.0% |
| Science & Technology | 4 | 14.3% |
| Business | 7 | 25.0% |
| Education | 1 | 3.6% |
| Literature & Languages | 0 | 0.0% |
| Liberal Arts & History | 0 | 0.0% |
| Visual & Performing Arts | 0 | 0.0% |
| Communications | 0 | 0.0% |
| Arts & Humanities | 3 | 10.7% |
| Total | 28 | 100.0% |
Transportation & Commute in Westfir
Vehicle Availability by Sex in Westfir
The most prevalent vehicle ownership categories in Westfir are males with 2 vehicles (34, accounting for 44.7%) and females with 2 vehicles (17, making up 85.0%).
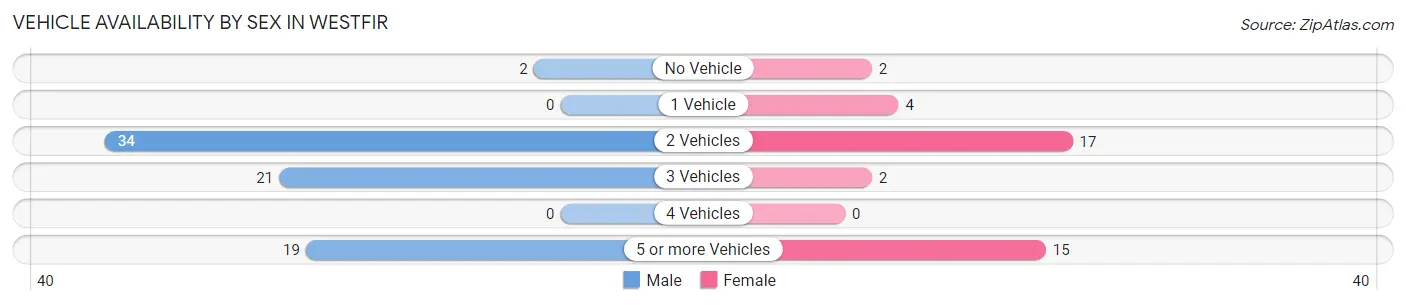
| Vehicles Available | Male | Female |
| No Vehicle | 2 (2.6%) | 2 (5.0%) |
| 1 Vehicle | 0 (0.0%) | 4 (10.0%) |
| 2 Vehicles | 34 (44.7%) | 17 (42.5%) |
| 3 Vehicles | 21 (27.6%) | 2 (5.0%) |
| 4 Vehicles | 0 (0.0%) | 0 (0.0%) |
| 5 or more Vehicles | 19 (25.0%) | 15 (37.5%) |
| Total | 76 (100.0%) | 40 (100.0%) |
Commute Time in Westfir
The most frequently occuring commute durations in Westfir are 5 to 9 minutes (32 commuters, 32.7%), 90 or more minutes (18 commuters, 18.4%), and 45 to 59 minutes (16 commuters, 16.3%).
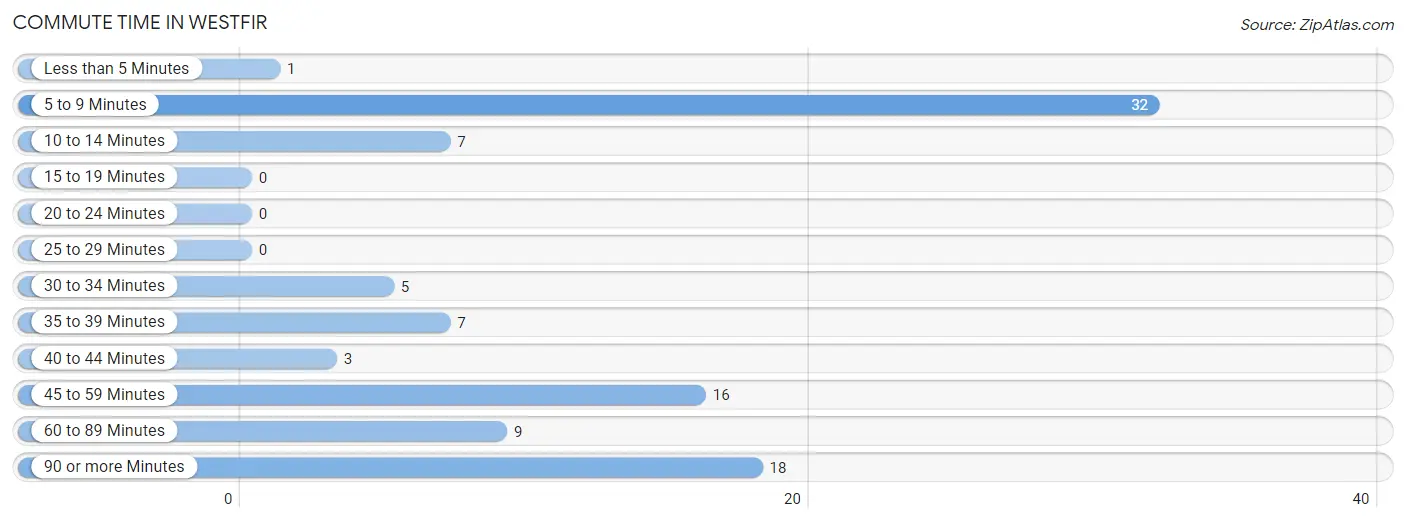
| Commute Time | # Commuters | % Commuters |
| Less than 5 Minutes | 1 | 1.0% |
| 5 to 9 Minutes | 32 | 32.7% |
| 10 to 14 Minutes | 7 | 7.1% |
| 15 to 19 Minutes | 0 | 0.0% |
| 20 to 24 Minutes | 0 | 0.0% |
| 25 to 29 Minutes | 0 | 0.0% |
| 30 to 34 Minutes | 5 | 5.1% |
| 35 to 39 Minutes | 7 | 7.1% |
| 40 to 44 Minutes | 3 | 3.1% |
| 45 to 59 Minutes | 16 | 16.3% |
| 60 to 89 Minutes | 9 | 9.2% |
| 90 or more Minutes | 18 | 18.4% |
Commute Time by Sex in Westfir
The most common commute times in Westfir are 5 to 9 minutes (18 commuters, 27.7%) for males and 5 to 9 minutes (14 commuters, 42.4%) for females.
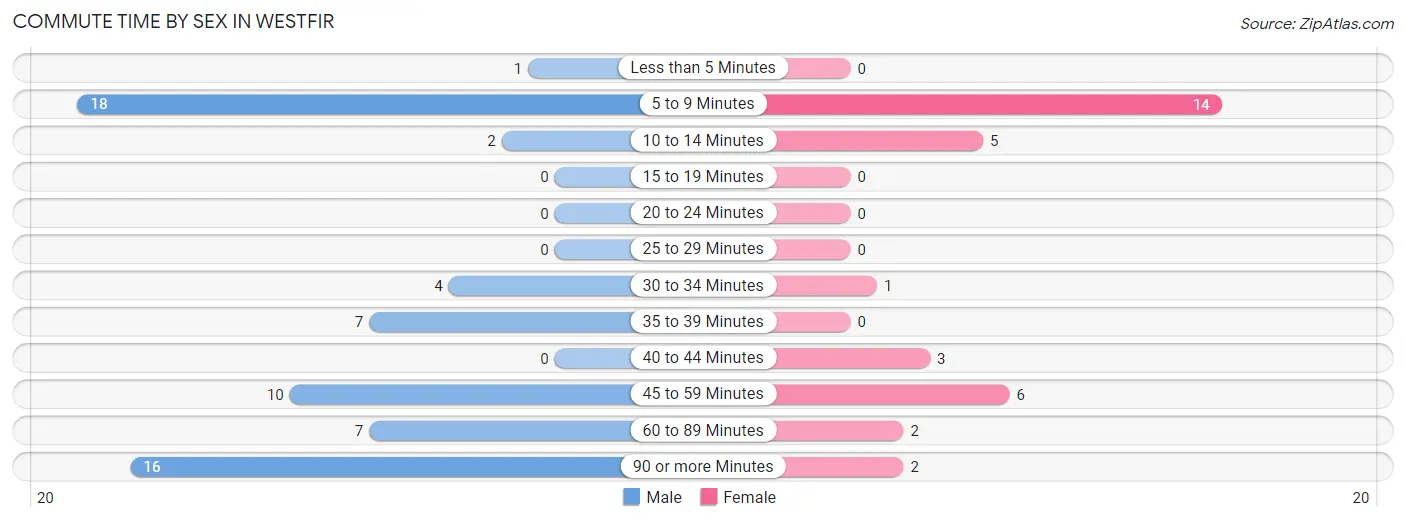
| Commute Time | Male | Female |
| Less than 5 Minutes | 1 (1.5%) | 0 (0.0%) |
| 5 to 9 Minutes | 18 (27.7%) | 14 (42.4%) |
| 10 to 14 Minutes | 2 (3.1%) | 5 (15.1%) |
| 15 to 19 Minutes | 0 (0.0%) | 0 (0.0%) |
| 20 to 24 Minutes | 0 (0.0%) | 0 (0.0%) |
| 25 to 29 Minutes | 0 (0.0%) | 0 (0.0%) |
| 30 to 34 Minutes | 4 (6.1%) | 1 (3.0%) |
| 35 to 39 Minutes | 7 (10.8%) | 0 (0.0%) |
| 40 to 44 Minutes | 0 (0.0%) | 3 (9.1%) |
| 45 to 59 Minutes | 10 (15.4%) | 6 (18.2%) |
| 60 to 89 Minutes | 7 (10.8%) | 2 (6.1%) |
| 90 or more Minutes | 16 (24.6%) | 2 (6.1%) |
Time of Departure to Work by Sex in Westfir
The most frequent times of departure to work in Westfir are 12:00 AM to 4:59 AM (24, 36.9%) for males and 9:00 AM to 9:59 AM (14, 42.4%) for females.
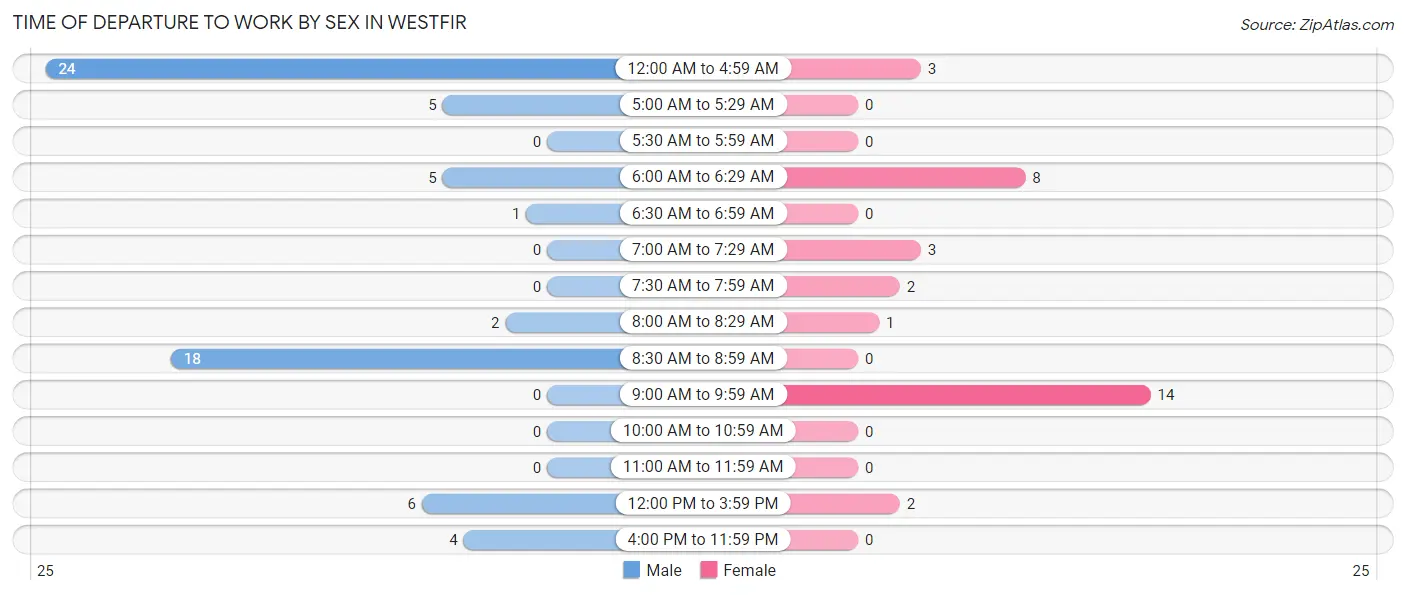
| Time of Departure | Male | Female |
| 12:00 AM to 4:59 AM | 24 (36.9%) | 3 (9.1%) |
| 5:00 AM to 5:29 AM | 5 (7.7%) | 0 (0.0%) |
| 5:30 AM to 5:59 AM | 0 (0.0%) | 0 (0.0%) |
| 6:00 AM to 6:29 AM | 5 (7.7%) | 8 (24.2%) |
| 6:30 AM to 6:59 AM | 1 (1.5%) | 0 (0.0%) |
| 7:00 AM to 7:29 AM | 0 (0.0%) | 3 (9.1%) |
| 7:30 AM to 7:59 AM | 0 (0.0%) | 2 (6.1%) |
| 8:00 AM to 8:29 AM | 2 (3.1%) | 1 (3.0%) |
| 8:30 AM to 8:59 AM | 18 (27.7%) | 0 (0.0%) |
| 9:00 AM to 9:59 AM | 0 (0.0%) | 14 (42.4%) |
| 10:00 AM to 10:59 AM | 0 (0.0%) | 0 (0.0%) |
| 11:00 AM to 11:59 AM | 0 (0.0%) | 0 (0.0%) |
| 12:00 PM to 3:59 PM | 6 (9.2%) | 2 (6.1%) |
| 4:00 PM to 11:59 PM | 4 (6.1%) | 0 (0.0%) |
| Total | 65 (100.0%) | 33 (100.0%) |
Housing Occupancy in Westfir
Occupancy by Ownership in Westfir
Of the total 151 dwellings in Westfir, owner-occupied units account for 137 (90.7%), while renter-occupied units make up 14 (9.3%).
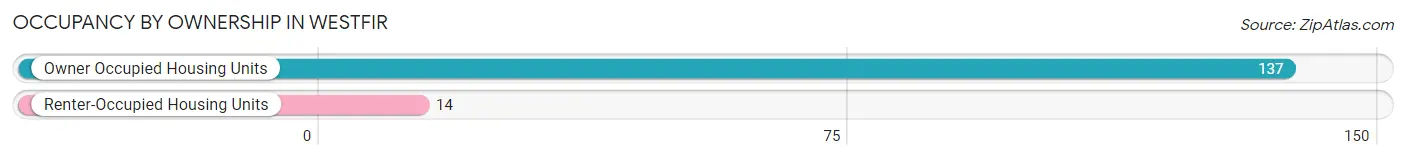
| Occupancy | # Housing Units | % Housing Units |
| Owner Occupied Housing Units | 137 | 90.7% |
| Renter-Occupied Housing Units | 14 | 9.3% |
| Total Occupied Housing Units | 151 | 100.0% |
Occupancy by Household Size in Westfir
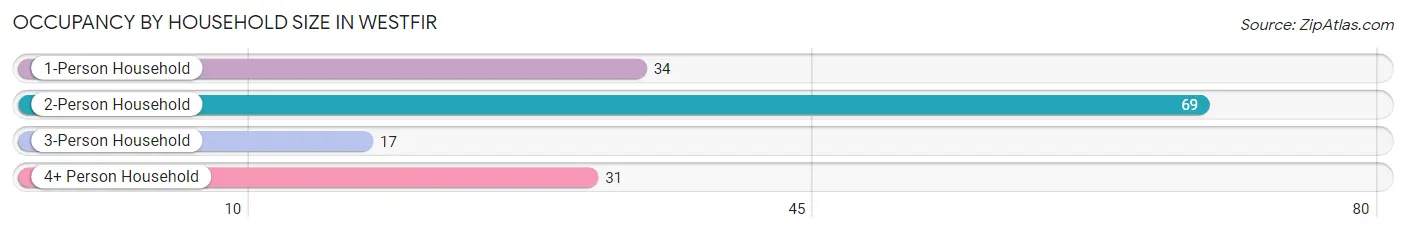
| Household Size | # Housing Units | % Housing Units |
| 1-Person Household | 34 | 22.5% |
| 2-Person Household | 69 | 45.7% |
| 3-Person Household | 17 | 11.3% |
| 4+ Person Household | 31 | 20.5% |
| Total Housing Units | 151 | 100.0% |
Occupancy by Ownership by Household Size in Westfir
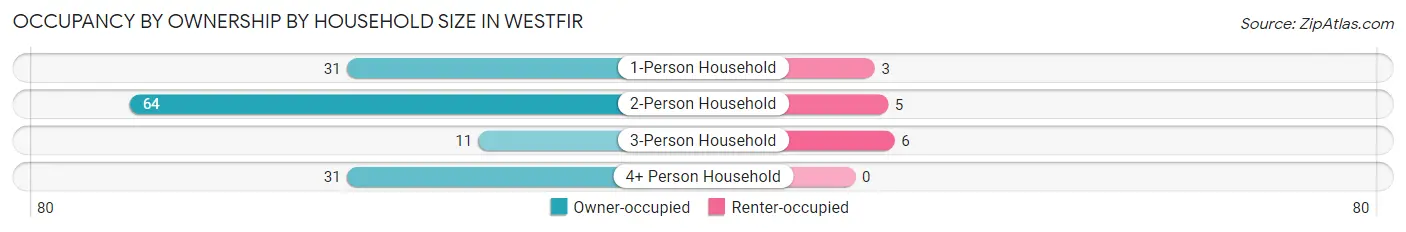
| Household Size | Owner-occupied | Renter-occupied |
| 1-Person Household | 31 (91.2%) | 3 (8.8%) |
| 2-Person Household | 64 (92.7%) | 5 (7.2%) |
| 3-Person Household | 11 (64.7%) | 6 (35.3%) |
| 4+ Person Household | 31 (100.0%) | 0 (0.0%) |
| Total Housing Units | 137 (90.7%) | 14 (9.3%) |
Occupancy by Educational Attainment in Westfir
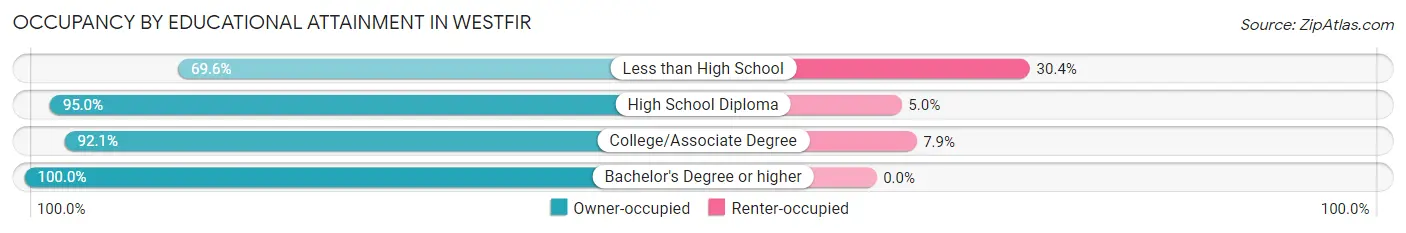
| Household Size | Owner-occupied | Renter-occupied |
| Less than High School | 16 (69.6%) | 7 (30.4%) |
| High School Diploma | 38 (95.0%) | 2 (5.0%) |
| College/Associate Degree | 58 (92.1%) | 5 (7.9%) |
| Bachelor's Degree or higher | 25 (100.0%) | 0 (0.0%) |
Occupancy by Age of Householder in Westfir
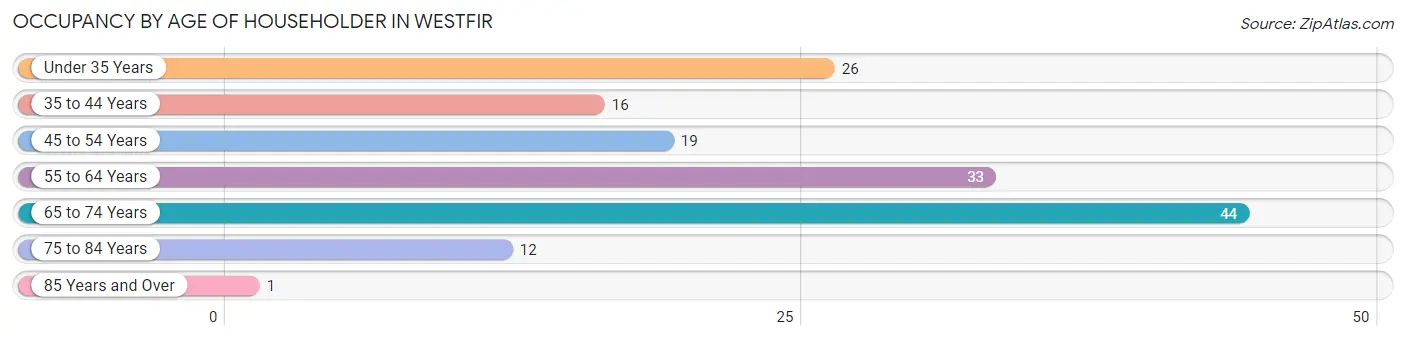
| Age Bracket | # Households | % Households |
| Under 35 Years | 26 | 17.2% |
| 35 to 44 Years | 16 | 10.6% |
| 45 to 54 Years | 19 | 12.6% |
| 55 to 64 Years | 33 | 21.8% |
| 65 to 74 Years | 44 | 29.1% |
| 75 to 84 Years | 12 | 8.0% |
| 85 Years and Over | 1 | 0.7% |
| Total | 151 | 100.0% |
Housing Finances in Westfir
Median Income by Occupancy in Westfir
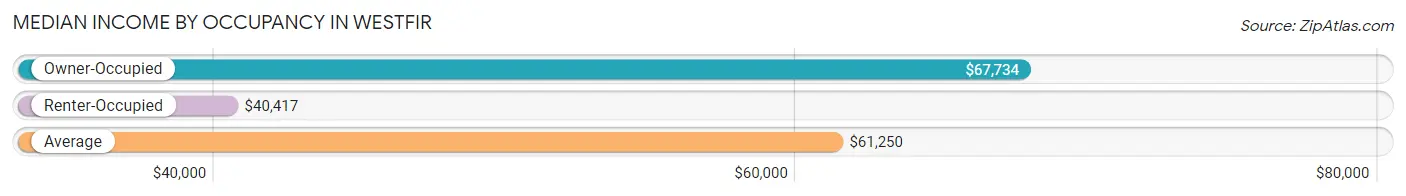
| Occupancy Type | # Households | Median Income |
| Owner-Occupied | 137 (90.7%) | $67,734 |
| Renter-Occupied | 14 (9.3%) | $40,417 |
| Average | 151 (100.0%) | $61,250 |
Occupancy by Householder Income Bracket in Westfir
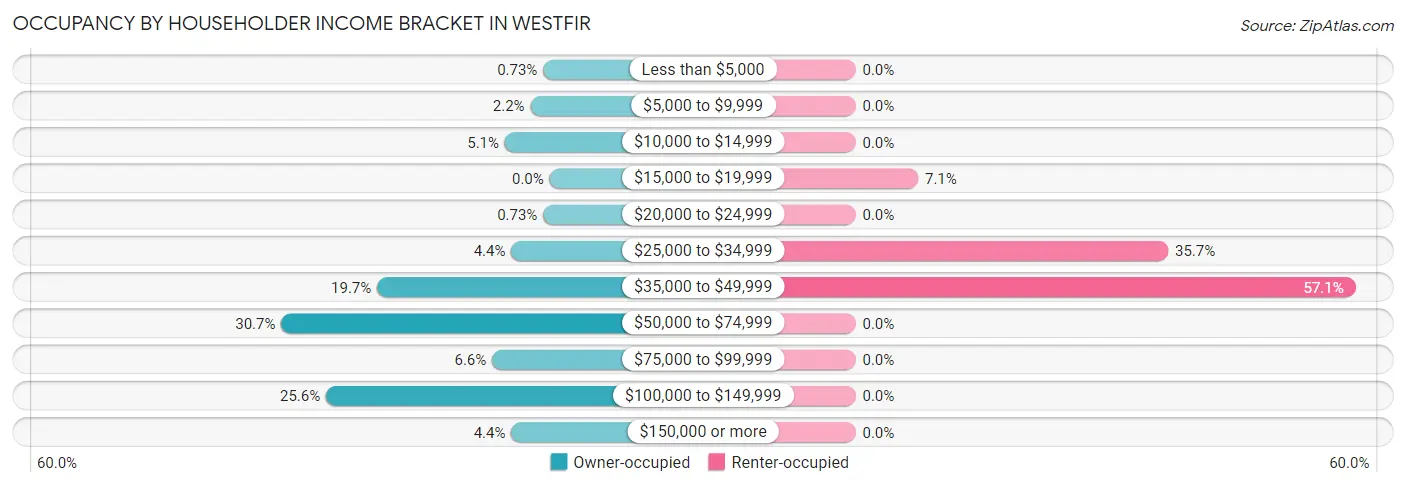
| Income Bracket | Owner-occupied | Renter-occupied |
| Less than $5,000 | 1 (0.7%) | 0 (0.0%) |
| $5,000 to $9,999 | 3 (2.2%) | 0 (0.0%) |
| $10,000 to $14,999 | 7 (5.1%) | 0 (0.0%) |
| $15,000 to $19,999 | 0 (0.0%) | 1 (7.1%) |
| $20,000 to $24,999 | 1 (0.7%) | 0 (0.0%) |
| $25,000 to $34,999 | 6 (4.4%) | 5 (35.7%) |
| $35,000 to $49,999 | 27 (19.7%) | 8 (57.1%) |
| $50,000 to $74,999 | 42 (30.7%) | 0 (0.0%) |
| $75,000 to $99,999 | 9 (6.6%) | 0 (0.0%) |
| $100,000 to $149,999 | 35 (25.6%) | 0 (0.0%) |
| $150,000 or more | 6 (4.4%) | 0 (0.0%) |
| Total | 137 (100.0%) | 14 (100.0%) |
Monthly Housing Cost Tiers in Westfir
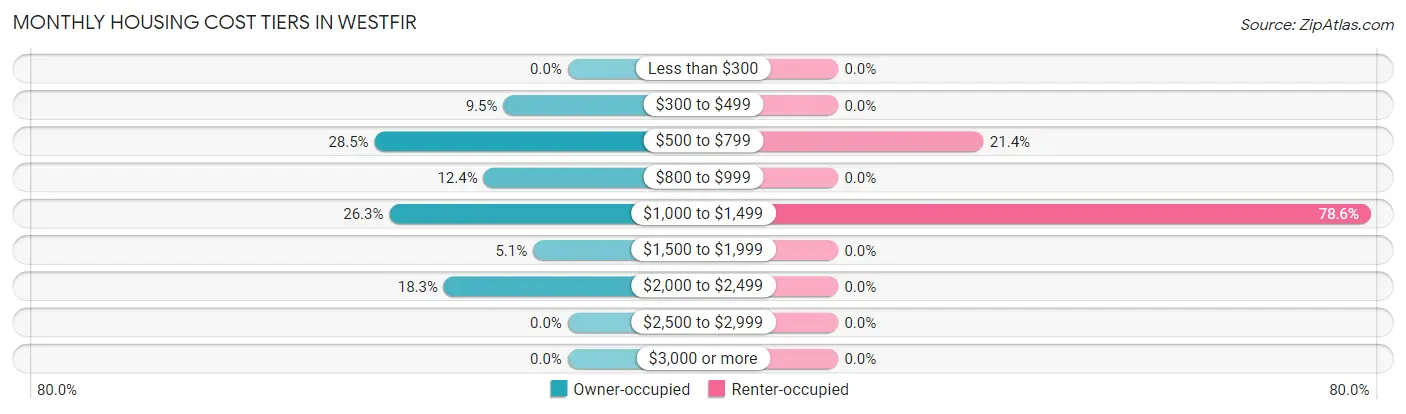
| Monthly Cost | Owner-occupied | Renter-occupied |
| Less than $300 | 0 (0.0%) | 0 (0.0%) |
| $300 to $499 | 13 (9.5%) | 0 (0.0%) |
| $500 to $799 | 39 (28.5%) | 3 (21.4%) |
| $800 to $999 | 17 (12.4%) | 0 (0.0%) |
| $1,000 to $1,499 | 36 (26.3%) | 11 (78.6%) |
| $1,500 to $1,999 | 7 (5.1%) | 0 (0.0%) |
| $2,000 to $2,499 | 25 (18.2%) | 0 (0.0%) |
| $2,500 to $2,999 | 0 (0.0%) | 0 (0.0%) |
| $3,000 or more | 0 (0.0%) | 0 (0.0%) |
| Total | 137 (100.0%) | 14 (100.0%) |
Physical Housing Characteristics in Westfir
Housing Structures in Westfir
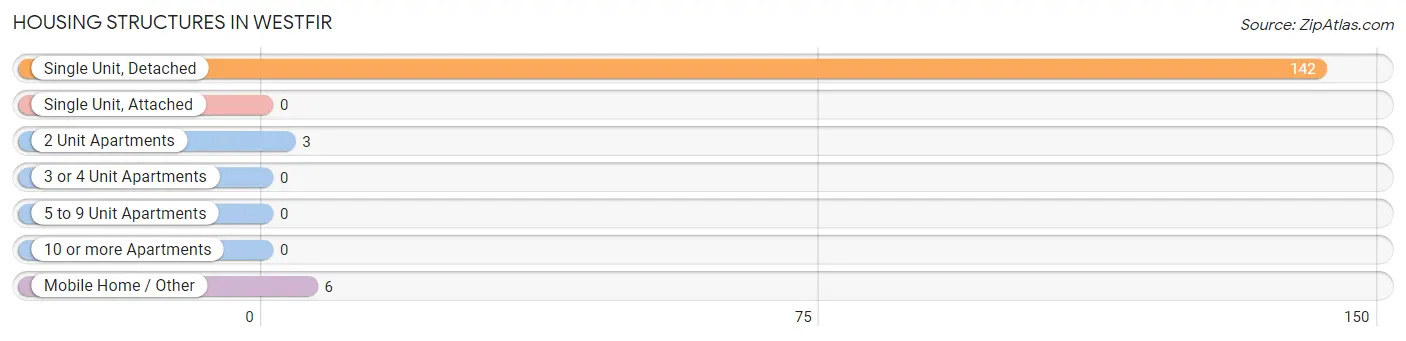
| Structure Type | # Housing Units | % Housing Units |
| Single Unit, Detached | 142 | 94.0% |
| Single Unit, Attached | 0 | 0.0% |
| 2 Unit Apartments | 3 | 2.0% |
| 3 or 4 Unit Apartments | 0 | 0.0% |
| 5 to 9 Unit Apartments | 0 | 0.0% |
| 10 or more Apartments | 0 | 0.0% |
| Mobile Home / Other | 6 | 4.0% |
| Total | 151 | 100.0% |
Housing Structures by Occupancy in Westfir
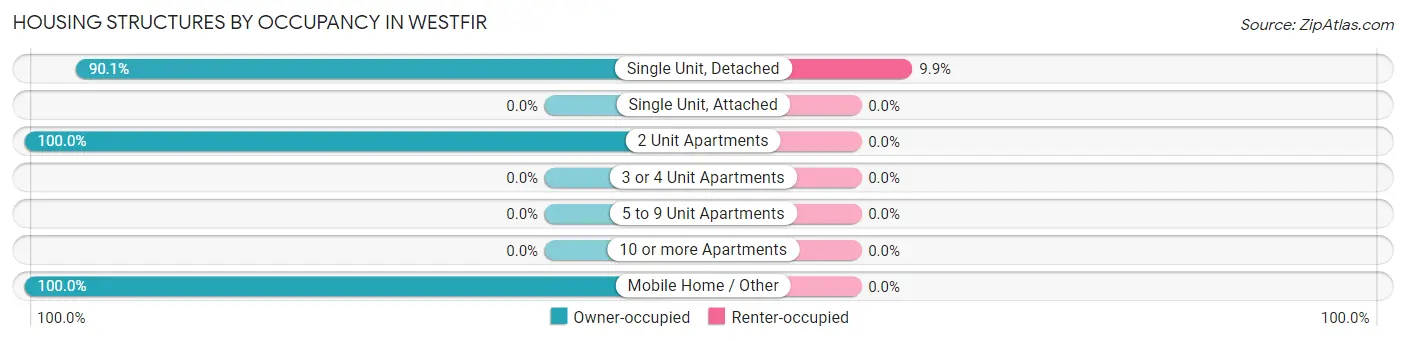
| Structure Type | Owner-occupied | Renter-occupied |
| Single Unit, Detached | 128 (90.1%) | 14 (9.9%) |
| Single Unit, Attached | 0 (0.0%) | 0 (0.0%) |
| 2 Unit Apartments | 3 (100.0%) | 0 (0.0%) |
| 3 or 4 Unit Apartments | 0 (0.0%) | 0 (0.0%) |
| 5 to 9 Unit Apartments | 0 (0.0%) | 0 (0.0%) |
| 10 or more Apartments | 0 (0.0%) | 0 (0.0%) |
| Mobile Home / Other | 6 (100.0%) | 0 (0.0%) |
| Total | 137 (90.7%) | 14 (9.3%) |
Housing Structures by Number of Rooms in Westfir
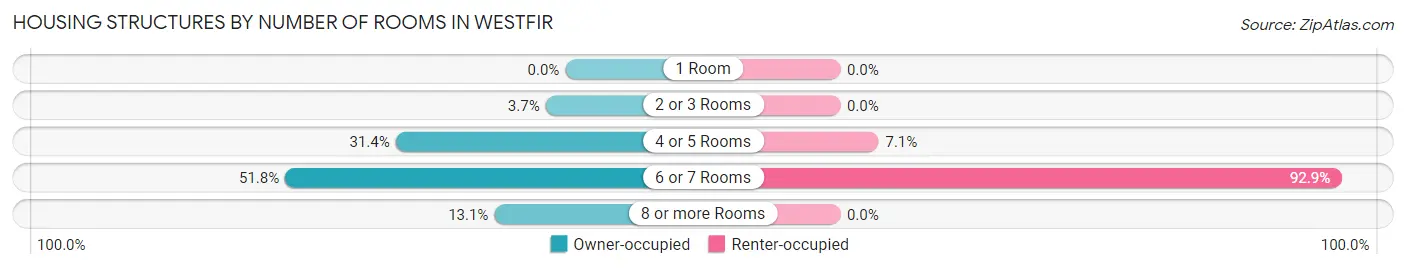
| Number of Rooms | Owner-occupied | Renter-occupied |
| 1 Room | 0 (0.0%) | 0 (0.0%) |
| 2 or 3 Rooms | 5 (3.6%) | 0 (0.0%) |
| 4 or 5 Rooms | 43 (31.4%) | 1 (7.1%) |
| 6 or 7 Rooms | 71 (51.8%) | 13 (92.9%) |
| 8 or more Rooms | 18 (13.1%) | 0 (0.0%) |
| Total | 137 (100.0%) | 14 (100.0%) |
Housing Structure by Heating Type in Westfir
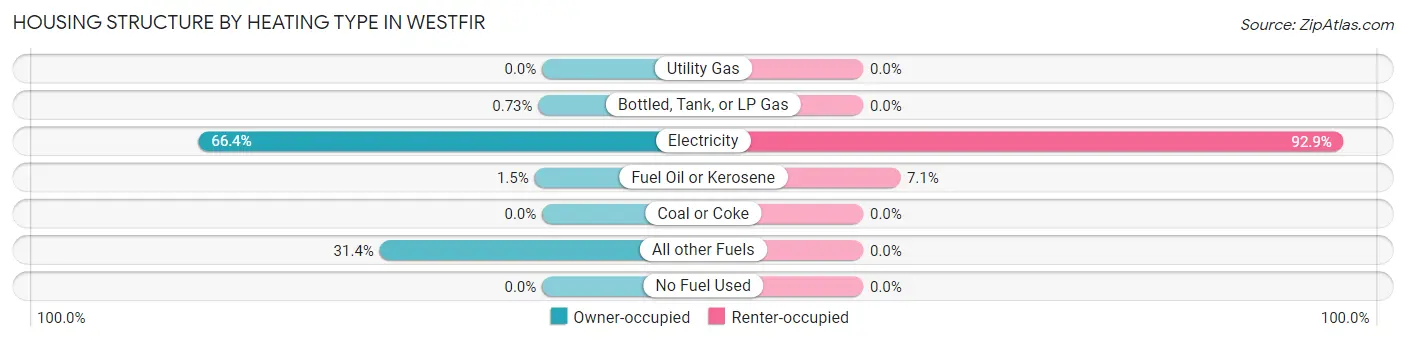
| Heating Type | Owner-occupied | Renter-occupied |
| Utility Gas | 0 (0.0%) | 0 (0.0%) |
| Bottled, Tank, or LP Gas | 1 (0.7%) | 0 (0.0%) |
| Electricity | 91 (66.4%) | 13 (92.9%) |
| Fuel Oil or Kerosene | 2 (1.5%) | 1 (7.1%) |
| Coal or Coke | 0 (0.0%) | 0 (0.0%) |
| All other Fuels | 43 (31.4%) | 0 (0.0%) |
| No Fuel Used | 0 (0.0%) | 0 (0.0%) |
| Total | 137 (100.0%) | 14 (100.0%) |
Household Vehicle Usage in Westfir
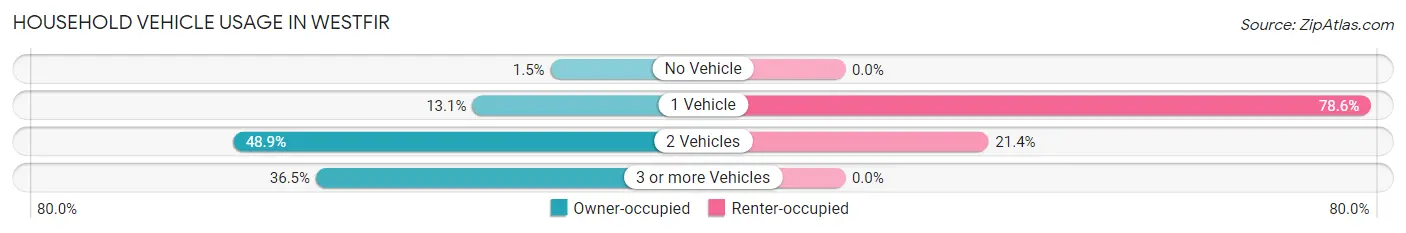
| Vehicles per Household | Owner-occupied | Renter-occupied |
| No Vehicle | 2 (1.5%) | 0 (0.0%) |
| 1 Vehicle | 18 (13.1%) | 11 (78.6%) |
| 2 Vehicles | 67 (48.9%) | 3 (21.4%) |
| 3 or more Vehicles | 50 (36.5%) | 0 (0.0%) |
| Total | 137 (100.0%) | 14 (100.0%) |
Real Estate & Mortgages in Westfir
Real Estate and Mortgage Overview in Westfir
| Characteristic | Without Mortgage | With Mortgage |
| Housing Units | 58 | 79 |
| Median Property Value | - | - |
| Median Household Income | $45,000 | $5 |
| Monthly Housing Costs | $716 | $0 |
| Real Estate Taxes | $2,563 | $0 |
Property Value by Mortgage Status in Westfir
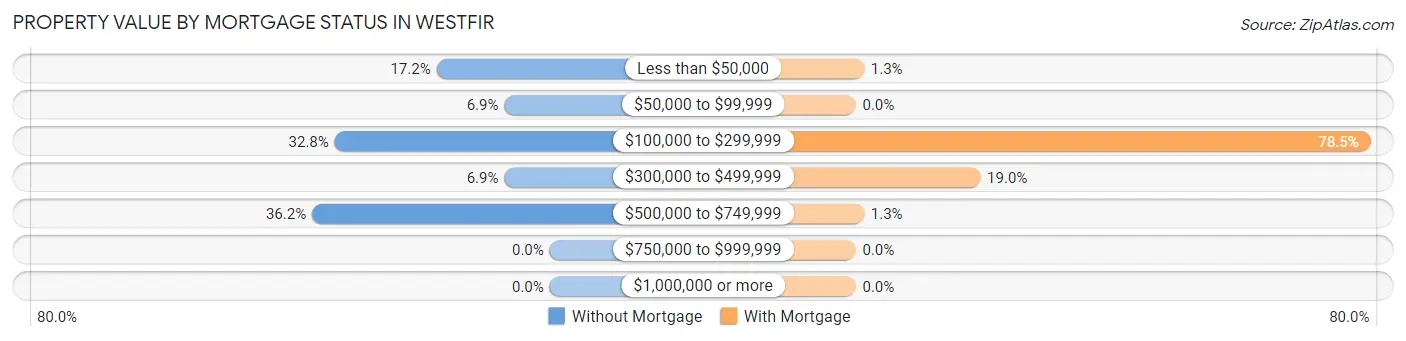
| Property Value | Without Mortgage | With Mortgage |
| Less than $50,000 | 10 (17.2%) | 1 (1.3%) |
| $50,000 to $99,999 | 4 (6.9%) | 0 (0.0%) |
| $100,000 to $299,999 | 19 (32.8%) | 62 (78.5%) |
| $300,000 to $499,999 | 4 (6.9%) | 15 (19.0%) |
| $500,000 to $749,999 | 21 (36.2%) | 1 (1.3%) |
| $750,000 to $999,999 | 0 (0.0%) | 0 (0.0%) |
| $1,000,000 or more | 0 (0.0%) | 0 (0.0%) |
| Total | 58 (100.0%) | 79 (100.0%) |
Household Income by Mortgage Status in Westfir
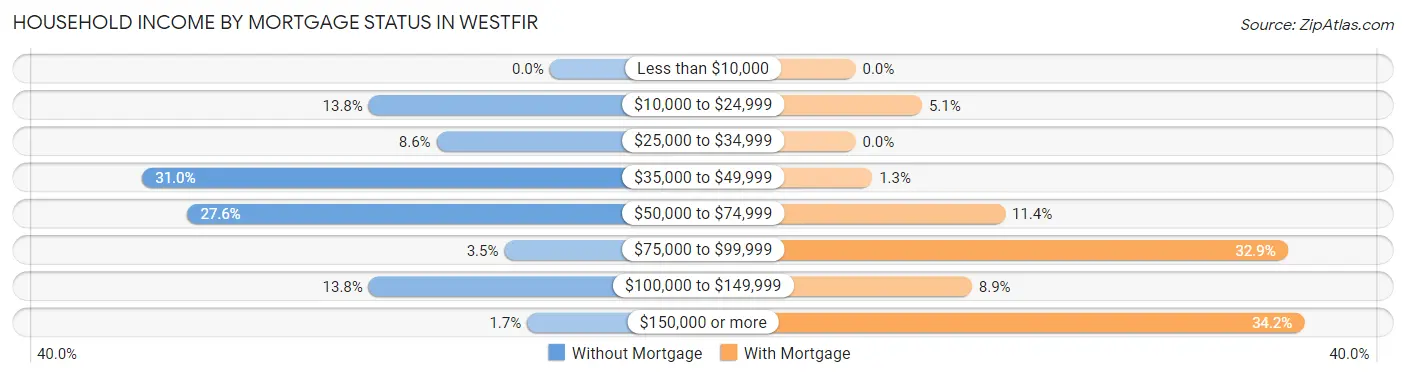
| Household Income | Without Mortgage | With Mortgage |
| Less than $10,000 | 0 (0.0%) | 0 (0.0%) |
| $10,000 to $24,999 | 8 (13.8%) | 4 (5.1%) |
| $25,000 to $34,999 | 5 (8.6%) | 0 (0.0%) |
| $35,000 to $49,999 | 18 (31.0%) | 1 (1.3%) |
| $50,000 to $74,999 | 16 (27.6%) | 9 (11.4%) |
| $75,000 to $99,999 | 2 (3.5%) | 26 (32.9%) |
| $100,000 to $149,999 | 8 (13.8%) | 7 (8.9%) |
| $150,000 or more | 1 (1.7%) | 27 (34.2%) |
| Total | 58 (100.0%) | 79 (100.0%) |
Property Value to Household Income Ratio in Westfir
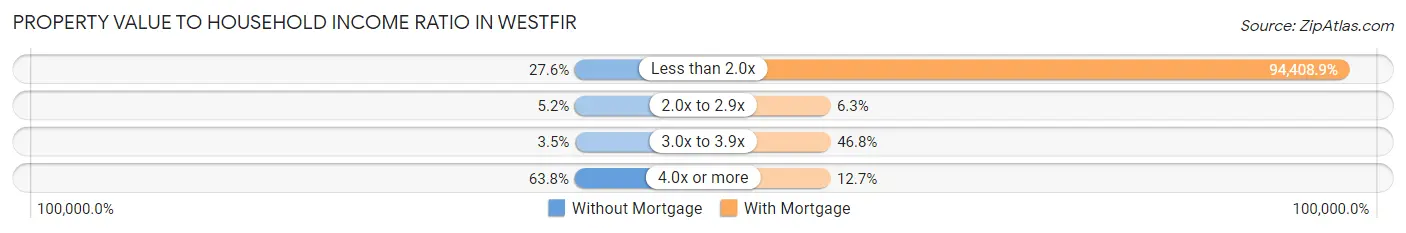
| Value-to-Income Ratio | Without Mortgage | With Mortgage |
| Less than 2.0x | 16 (27.6%) | 74,583 (94,408.9%) |
| 2.0x to 2.9x | 3 (5.2%) | 5 (6.3%) |
| 3.0x to 3.9x | 2 (3.5%) | 37 (46.8%) |
| 4.0x or more | 37 (63.8%) | 10 (12.7%) |
| Total | 58 (100.0%) | 79 (100.0%) |
Real Estate Taxes by Mortgage Status in Westfir
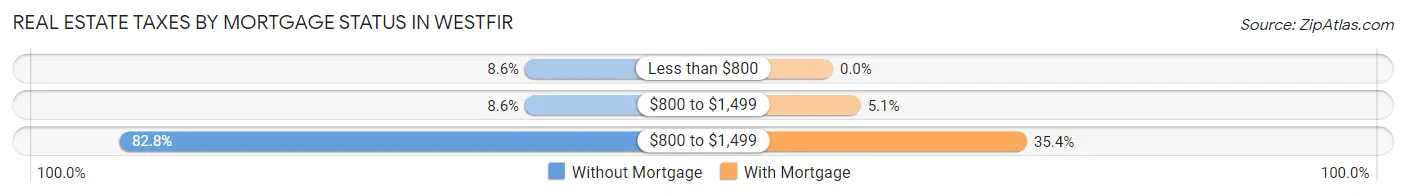
| Property Taxes | Without Mortgage | With Mortgage |
| Less than $800 | 5 (8.6%) | 0 (0.0%) |
| $800 to $1,499 | 5 (8.6%) | 4 (5.1%) |
| $800 to $1,499 | 48 (82.8%) | 28 (35.4%) |
| Total | 58 (100.0%) | 79 (100.0%) |
Health & Disability in Westfir
Health Insurance Coverage by Age in Westfir
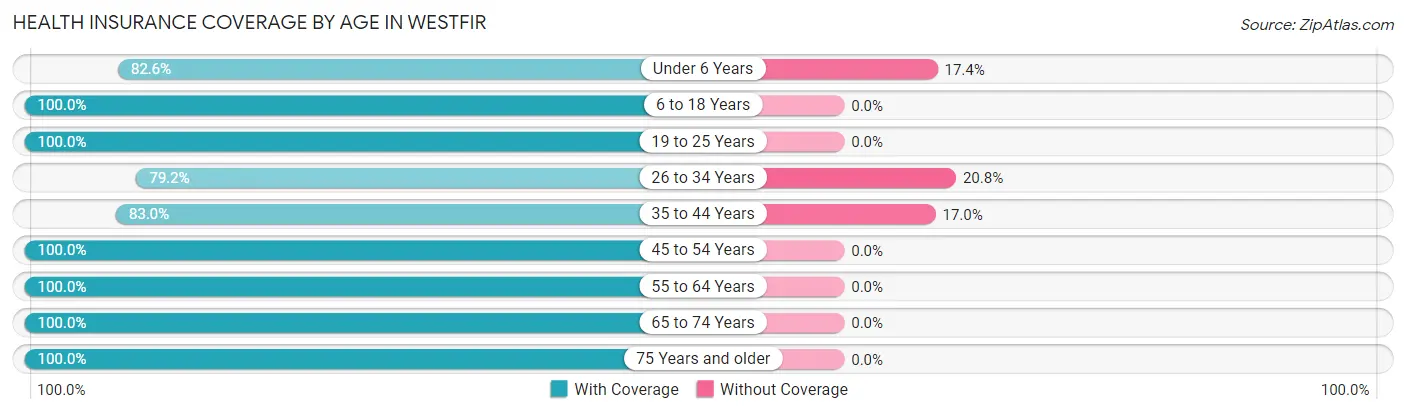
| Age Bracket | With Coverage | Without Coverage |
| Under 6 Years | 38 (82.6%) | 8 (17.4%) |
| 6 to 18 Years | 64 (100.0%) | 0 (0.0%) |
| 19 to 25 Years | 8 (100.0%) | 0 (0.0%) |
| 26 to 34 Years | 38 (79.2%) | 10 (20.8%) |
| 35 to 44 Years | 39 (83.0%) | 8 (17.0%) |
| 45 to 54 Years | 25 (100.0%) | 0 (0.0%) |
| 55 to 64 Years | 67 (100.0%) | 0 (0.0%) |
| 65 to 74 Years | 71 (100.0%) | 0 (0.0%) |
| 75 Years and older | 18 (100.0%) | 0 (0.0%) |
| Total | 368 (93.4%) | 26 (6.6%) |
Health Insurance Coverage by Citizenship Status in Westfir
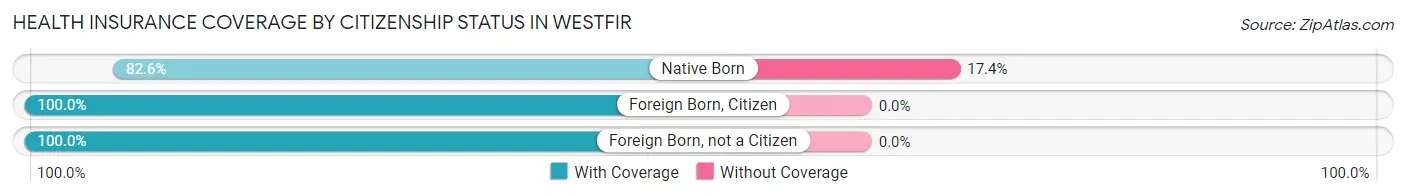
| Citizenship Status | With Coverage | Without Coverage |
| Native Born | 38 (82.6%) | 8 (17.4%) |
| Foreign Born, Citizen | 64 (100.0%) | 0 (0.0%) |
| Foreign Born, not a Citizen | 8 (100.0%) | 0 (0.0%) |
Health Insurance Coverage by Household Income in Westfir
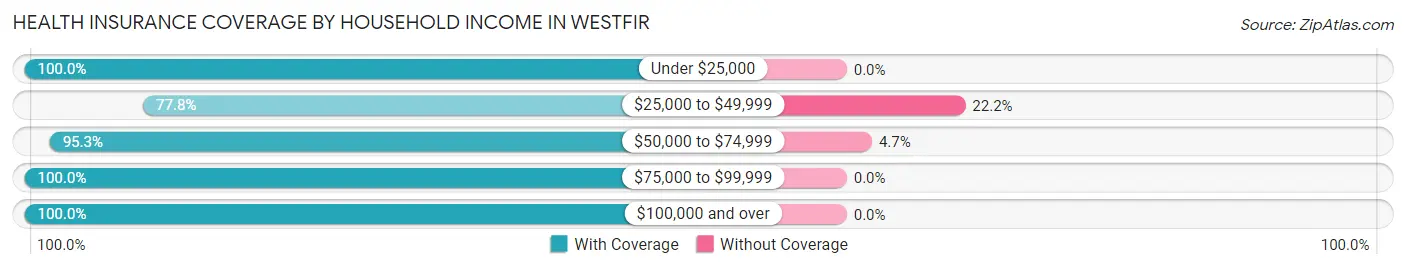
| Household Income | With Coverage | Without Coverage |
| Under $25,000 | 20 (100.0%) | 0 (0.0%) |
| $25,000 to $49,999 | 77 (77.8%) | 22 (22.2%) |
| $50,000 to $74,999 | 81 (95.3%) | 4 (4.7%) |
| $75,000 to $99,999 | 25 (100.0%) | 0 (0.0%) |
| $100,000 and over | 165 (100.0%) | 0 (0.0%) |
Public vs Private Health Insurance Coverage by Age in Westfir
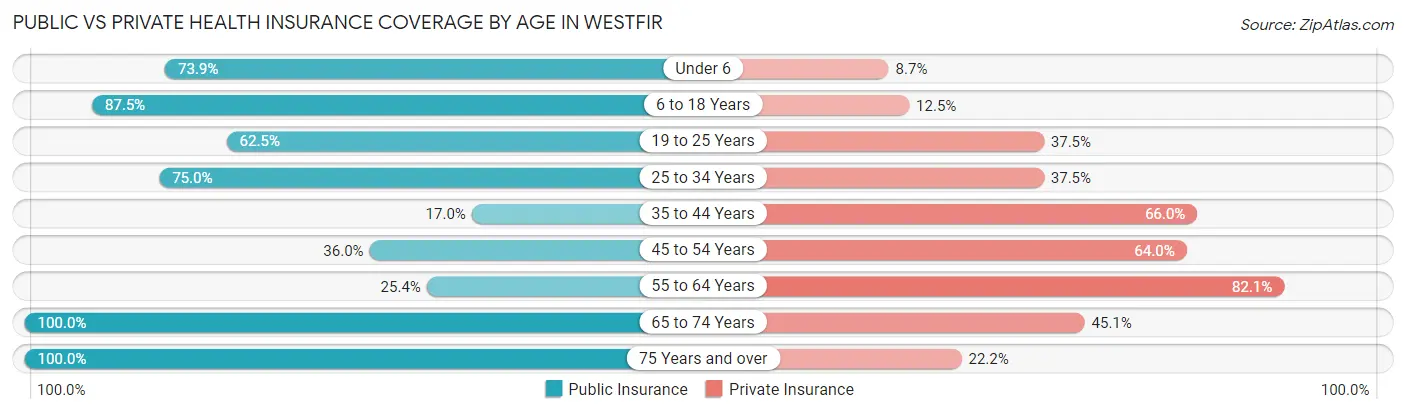
| Age Bracket | Public Insurance | Private Insurance |
| Under 6 | 34 (73.9%) | 4 (8.7%) |
| 6 to 18 Years | 56 (87.5%) | 8 (12.5%) |
| 19 to 25 Years | 5 (62.5%) | 3 (37.5%) |
| 25 to 34 Years | 36 (75.0%) | 18 (37.5%) |
| 35 to 44 Years | 8 (17.0%) | 31 (66.0%) |
| 45 to 54 Years | 9 (36.0%) | 16 (64.0%) |
| 55 to 64 Years | 17 (25.4%) | 55 (82.1%) |
| 65 to 74 Years | 71 (100.0%) | 32 (45.1%) |
| 75 Years and over | 18 (100.0%) | 4 (22.2%) |
| Total | 254 (64.5%) | 171 (43.4%) |
Disability Status by Sex by Age in Westfir
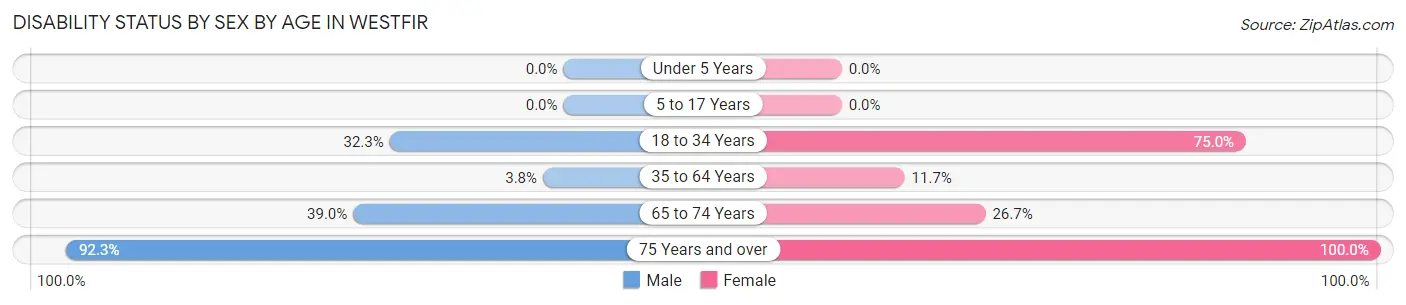
| Age Bracket | Male | Female |
| Under 5 Years | 0 (0.0%) | 0 (0.0%) |
| 5 to 17 Years | 0 (0.0%) | 0 (0.0%) |
| 18 to 34 Years | 10 (32.3%) | 21 (75.0%) |
| 35 to 64 Years | 3 (3.8%) | 7 (11.7%) |
| 65 to 74 Years | 16 (39.0%) | 8 (26.7%) |
| 75 Years and over | 12 (92.3%) | 5 (100.0%) |
Disability Class by Sex by Age in Westfir
Disability Class: Hearing Difficulty
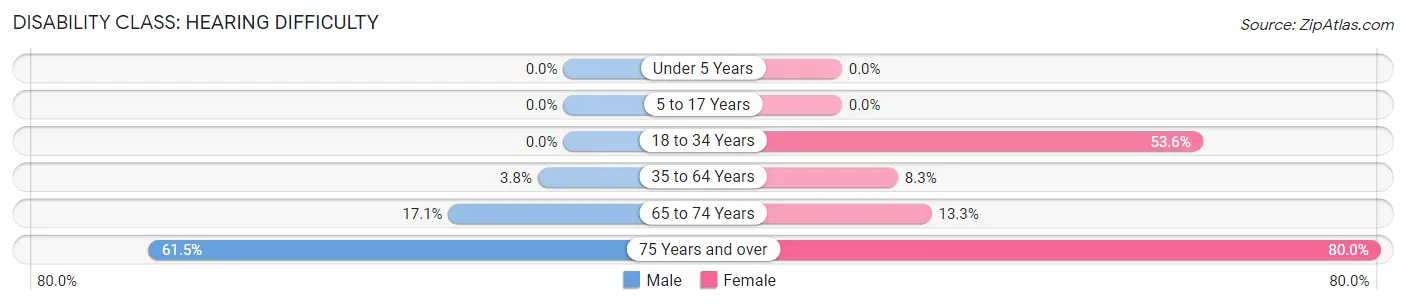
| Age Bracket | Male | Female |
| Under 5 Years | 0 (0.0%) | 0 (0.0%) |
| 5 to 17 Years | 0 (0.0%) | 0 (0.0%) |
| 18 to 34 Years | 0 (0.0%) | 15 (53.6%) |
| 35 to 64 Years | 3 (3.8%) | 5 (8.3%) |
| 65 to 74 Years | 7 (17.1%) | 4 (13.3%) |
| 75 Years and over | 8 (61.5%) | 4 (80.0%) |
Disability Class: Vision Difficulty
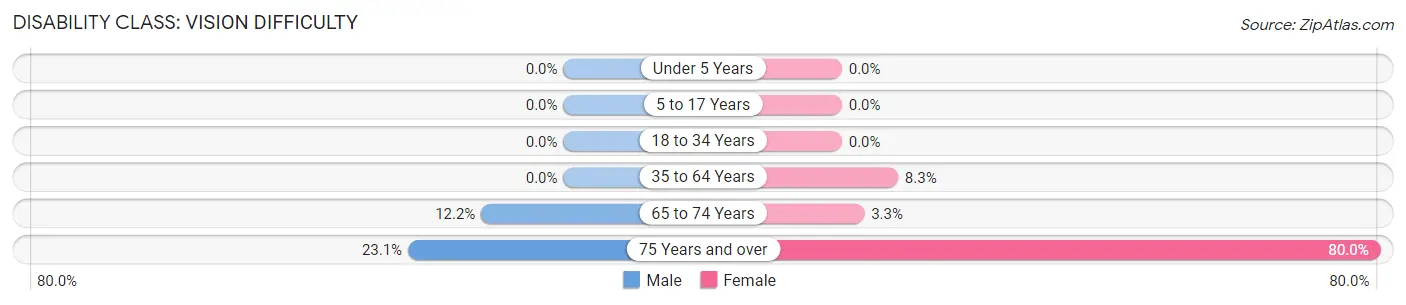
| Age Bracket | Male | Female |
| Under 5 Years | 0 (0.0%) | 0 (0.0%) |
| 5 to 17 Years | 0 (0.0%) | 0 (0.0%) |
| 18 to 34 Years | 0 (0.0%) | 0 (0.0%) |
| 35 to 64 Years | 0 (0.0%) | 5 (8.3%) |
| 65 to 74 Years | 5 (12.2%) | 1 (3.3%) |
| 75 Years and over | 3 (23.1%) | 4 (80.0%) |
Disability Class: Cognitive Difficulty
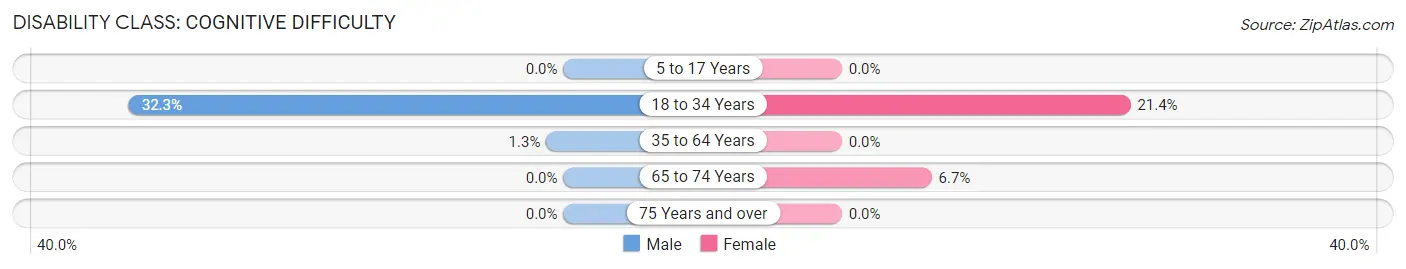
| Age Bracket | Male | Female |
| 5 to 17 Years | 0 (0.0%) | 0 (0.0%) |
| 18 to 34 Years | 10 (32.3%) | 6 (21.4%) |
| 35 to 64 Years | 1 (1.3%) | 0 (0.0%) |
| 65 to 74 Years | 0 (0.0%) | 2 (6.7%) |
| 75 Years and over | 0 (0.0%) | 0 (0.0%) |
Disability Class: Ambulatory Difficulty
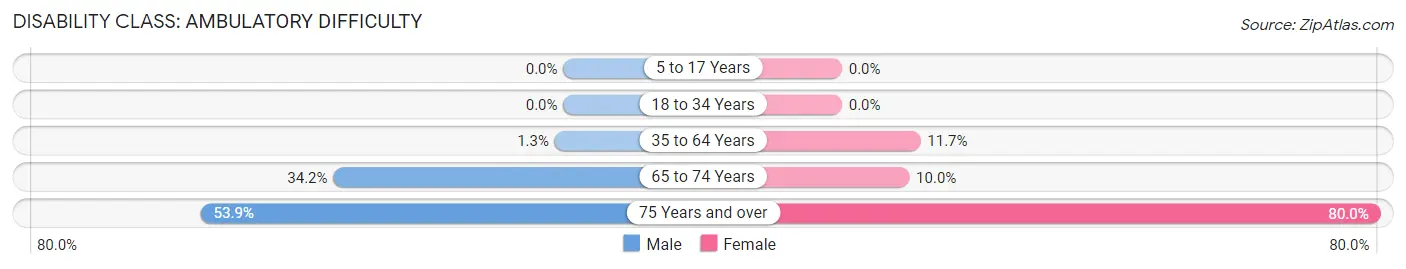
| Age Bracket | Male | Female |
| 5 to 17 Years | 0 (0.0%) | 0 (0.0%) |
| 18 to 34 Years | 0 (0.0%) | 0 (0.0%) |
| 35 to 64 Years | 1 (1.3%) | 7 (11.7%) |
| 65 to 74 Years | 14 (34.2%) | 3 (10.0%) |
| 75 Years and over | 7 (53.8%) | 4 (80.0%) |
Disability Class: Self-Care Difficulty
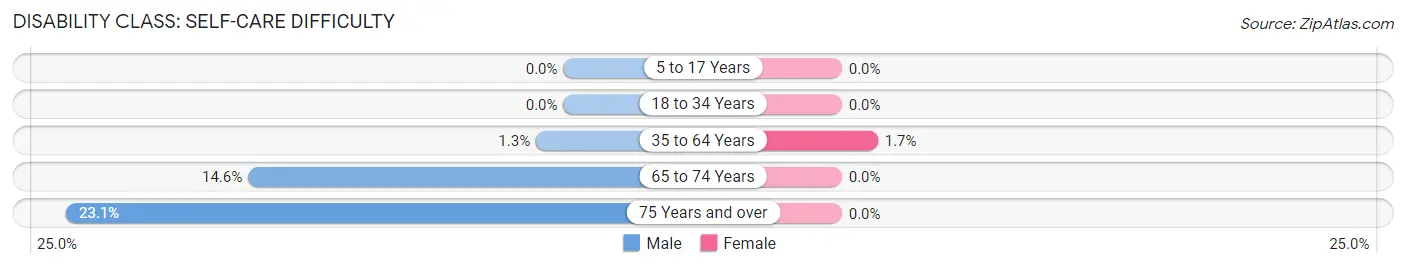
| Age Bracket | Male | Female |
| 5 to 17 Years | 0 (0.0%) | 0 (0.0%) |
| 18 to 34 Years | 0 (0.0%) | 0 (0.0%) |
| 35 to 64 Years | 1 (1.3%) | 1 (1.7%) |
| 65 to 74 Years | 6 (14.6%) | 0 (0.0%) |
| 75 Years and over | 3 (23.1%) | 0 (0.0%) |
Technology Access in Westfir
Computing Device Access in Westfir
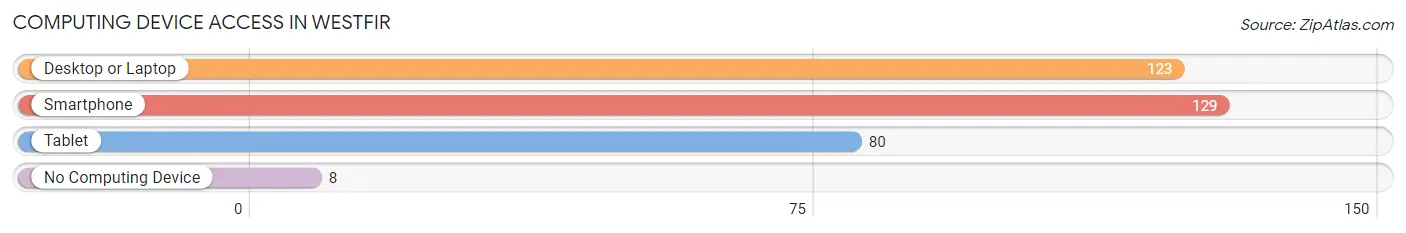
| Device Type | # Households | % Households |
| Desktop or Laptop | 123 | 81.5% |
| Smartphone | 129 | 85.4% |
| Tablet | 80 | 53.0% |
| No Computing Device | 8 | 5.3% |
| Total | 151 | 100.0% |
Internet Access in Westfir
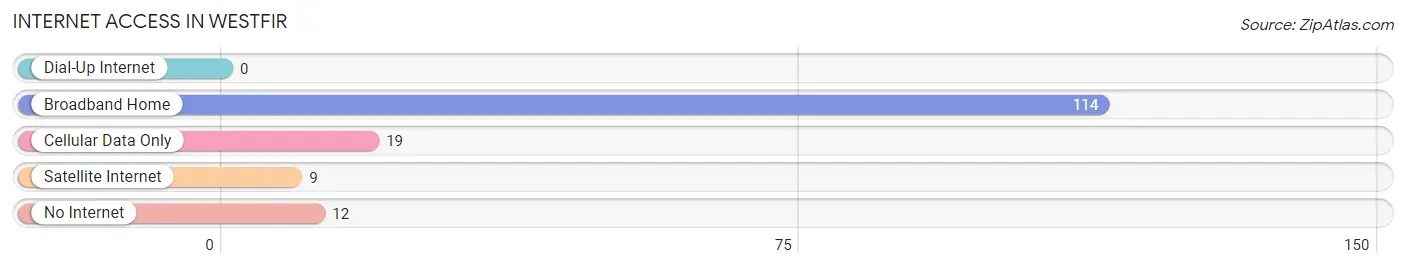
| Internet Type | # Households | % Households |
| Dial-Up Internet | 0 | 0.0% |
| Broadband Home | 114 | 75.5% |
| Cellular Data Only | 19 | 12.6% |
| Satellite Internet | 9 | 6.0% |
| No Internet | 12 | 8.0% |
| Total | 151 | 100.0% |
Westfir Summary
Westfir is a small unincorporated community located in Lane County, Oregon, United States. It is situated in the foothills of the Cascade Mountains, approximately 20 miles east of Eugene and 25 miles west of Oakridge. The population of Westfir was estimated to be around 200 in 2020.
History
Westfir was founded in the late 1800s by a group of settlers from the Midwest. The settlers were attracted to the area by the abundance of timber and the potential for logging. The first post office in Westfir was established in 1891.
The town was named after the Westfir Lumber Company, which was founded in 1892. The company was the first to begin logging operations in the area. The company was successful and the town grew rapidly. By the early 1900s, Westfir had become a bustling logging town with a population of over 500.
The town continued to grow until the Great Depression, when the logging industry began to decline. The population of Westfir dropped to around 200 by the 1940s. The town remained relatively unchanged until the 1970s, when the logging industry began to revive.
Geography
Westfir is located in the foothills of the Cascade Mountains, approximately 20 miles east of Eugene and 25 miles west of Oakridge. The town is situated at an elevation of 1,400 feet and is surrounded by lush forests and rolling hills. The nearby Willamette River provides a scenic backdrop to the town.
The climate in Westfir is mild and temperate, with warm summers and cool winters. The average annual temperature is around 50 degrees Fahrenheit. The average annual precipitation is around 40 inches.
Economy
The economy of Westfir is largely based on logging and timber production. The town is home to several lumber mills and sawmills, which provide employment for many of the town’s residents.
In addition to logging, Westfir is also home to several small businesses, including a grocery store, a hardware store, and a restaurant. The town also has a post office and a library.
Demographics
The population of Westfir was estimated to be around 200 in 2020. The town is predominantly white, with a small Hispanic population. The median household income is around $40,000. The median age is around 40 years old.
Common Questions
What is Per Capita Income in Westfir?
Per Capita income in Westfir is $25,861.
What is the Median Family Income in Westfir?
Median Family Income in Westfir is $68,393.
What is the Median Household income in Westfir?
Median Household Income in Westfir is $61,250.
What is Income or Wage Gap in Westfir?
Income or Wage Gap in Westfir is 14.8%.
Women in Westfir earn 85.2 cents for every dollar earned by a man.
What is Inequality or Gini Index in Westfir?
Inequality or Gini Index in Westfir is 0.31.
What is the Total Population of Westfir?
Total Population of Westfir is 394.
What is the Total Male Population of Westfir?
Total Male Population of Westfir is 209.
What is the Total Female Population of Westfir?
Total Female Population of Westfir is 185.
What is the Ratio of Males per 100 Females in Westfir?
There are 112.97 Males per 100 Females in Westfir.
What is the Ratio of Females per 100 Males in Westfir?
There are 88.52 Females per 100 Males in Westfir.
What is the Median Population Age in Westfir?
Median Population Age in Westfir is 39.8 Years.
What is the Average Family Size in Westfir
Average Family Size in Westfir is 3.2 People.
What is the Average Household Size in Westfir
Average Household Size in Westfir is 2.6 People.
How Large is the Labor Force in Westfir?
There are 145 People in the Labor Forcein in Westfir.
What is the Percentage of People in the Labor Force in Westfir?
50.2% of People are in the Labor Force in Westfir.
What is the Unemployment Rate in Westfir?
Unemployment Rate in Westfir is 12.4%.