Union, OR Map & Demographics
Union Map

Union Overview
$29,117
PER CAPITA INCOME
$61,053
AVG FAMILY INCOME
$60,385
AVG HOUSEHOLD INCOME
48.5%
WAGE / INCOME GAP [ % ]
51.5¢/ $1
WAGE / INCOME GAP [ $ ]
0.42
INEQUALITY / GINI INDEX
2,209
TOTAL POPULATION
1,112
MALE POPULATION
1,097
FEMALE POPULATION
101.37
MALES / 100 FEMALES
98.65
FEMALES / 100 MALES
41.7
MEDIAN AGE
2.8
AVG FAMILY SIZE
2.2
AVG HOUSEHOLD SIZE
1,088
LABOR FORCE [ PEOPLE ]
60.2%
PERCENT IN LABOR FORCE
2.5%
UNEMPLOYMENT RATE
Union Zip Codes
Union Area Codes
Income in Union
Income Overview in Union
Per Capita Income in Union is $29,117, while median incomes of families and households are $61,053 and $60,385 respectively.
| Characteristic | Number | Measure |
| Per Capita Income | 2,209 | $29,117 |
| Median Family Income | 606 | $61,053 |
| Mean Family Income | 606 | $80,743 |
| Median Household Income | 978 | $60,385 |
| Mean Household Income | 978 | $67,562 |
| Income Deficit | 606 | $0 |
| Wage / Income Gap (%) | 2,209 | 48.53% |
| Wage / Income Gap ($) | 2,209 | 51.47¢ per $1 |
| Gini / Inequality Index | 2,209 | 0.42 |
Earnings by Sex in Union
Average Earnings in Union are $36,203, $46,385 for men and $23,873 for women, a difference of 48.5%.
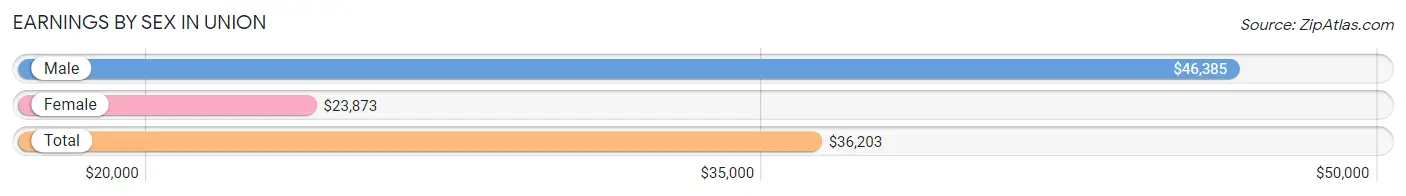
| Sex | Number | Average Earnings |
| Male | 627 (54.6%) | $46,385 |
| Female | 522 (45.4%) | $23,873 |
| Total | 1,149 (100.0%) | $36,203 |
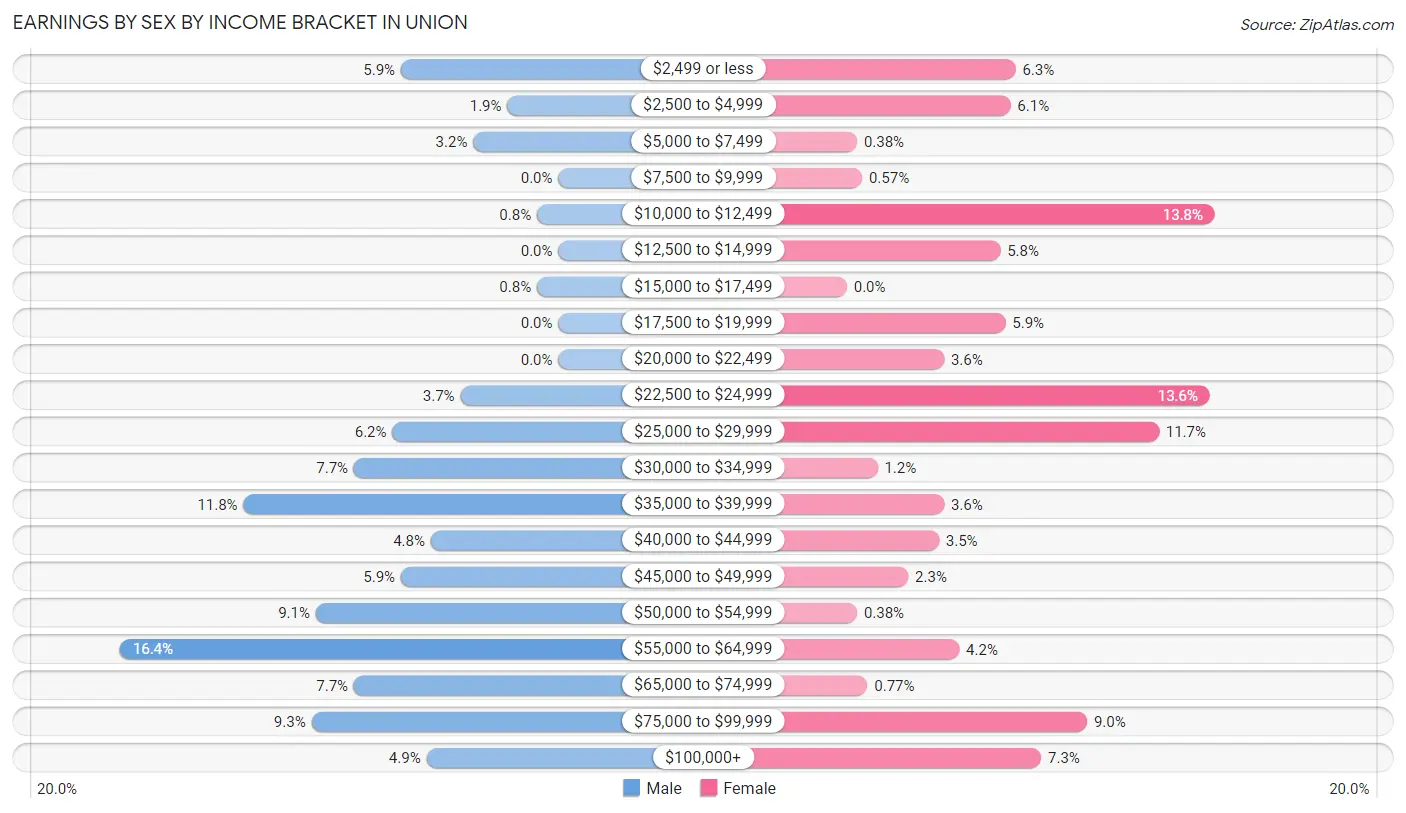
Earnings by Sex by Income Bracket in Union
The most common earnings brackets in Union are $55,000 to $64,999 for men (103 | 16.4%) and $10,000 to $12,499 for women (72 | 13.8%).
| Income | Male | Female |
| $2,499 or less | 37 (5.9%) | 33 (6.3%) |
| $2,500 to $4,999 | 12 (1.9%) | 32 (6.1%) |
| $5,000 to $7,499 | 20 (3.2%) | 2 (0.4%) |
| $7,500 to $9,999 | 0 (0.0%) | 3 (0.6%) |
| $10,000 to $12,499 | 5 (0.8%) | 72 (13.8%) |
| $12,500 to $14,999 | 0 (0.0%) | 30 (5.8%) |
| $15,000 to $17,499 | 5 (0.8%) | 0 (0.0%) |
| $17,500 to $19,999 | 0 (0.0%) | 31 (5.9%) |
| $20,000 to $22,499 | 0 (0.0%) | 19 (3.6%) |
| $22,500 to $24,999 | 23 (3.7%) | 71 (13.6%) |
| $25,000 to $29,999 | 39 (6.2%) | 61 (11.7%) |
| $30,000 to $34,999 | 48 (7.7%) | 6 (1.1%) |
| $35,000 to $39,999 | 74 (11.8%) | 19 (3.6%) |
| $40,000 to $44,999 | 30 (4.8%) | 18 (3.5%) |
| $45,000 to $49,999 | 37 (5.9%) | 12 (2.3%) |
| $50,000 to $54,999 | 57 (9.1%) | 2 (0.4%) |
| $55,000 to $64,999 | 103 (16.4%) | 22 (4.2%) |
| $65,000 to $74,999 | 48 (7.7%) | 4 (0.8%) |
| $75,000 to $99,999 | 58 (9.2%) | 47 (9.0%) |
| $100,000+ | 31 (4.9%) | 38 (7.3%) |
| Total | 627 (100.0%) | 522 (100.0%) |
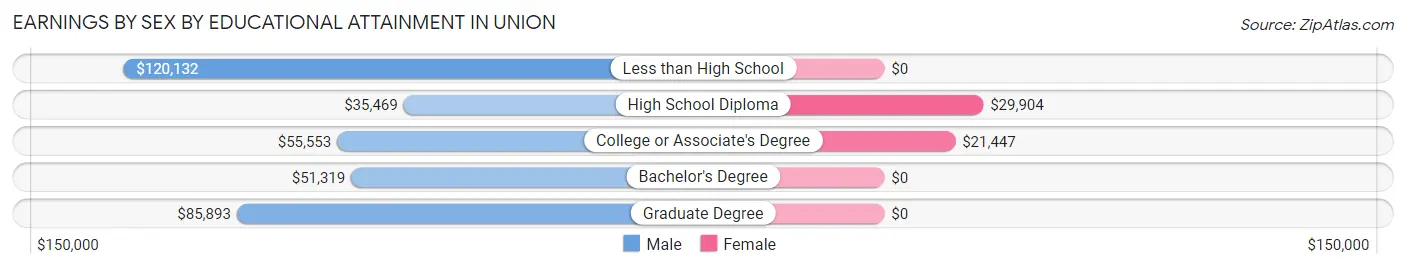
Earnings by Sex by Educational Attainment in Union
Average earnings in Union are $47,399 for men and $27,589 for women, a difference of 41.8%. Men with an educational attainment of less than high school enjoy the highest average annual earnings of $120,132, while those with high school diploma education earn the least with $35,469. Women with an educational attainment of high school diploma earn the most with the average annual earnings of $29,904, while those with college or associate's degree education have the smallest earnings of $21,447.
| Educational Attainment | Male Income | Female Income |
| Less than High School | $120,132 | $0 |
| High School Diploma | $35,469 | $29,904 |
| College or Associate's Degree | $55,553 | $21,447 |
| Bachelor's Degree | $51,319 | $0 |
| Graduate Degree | $85,893 | $0 |
| Total | $47,399 | $27,589 |
Family Income in Union
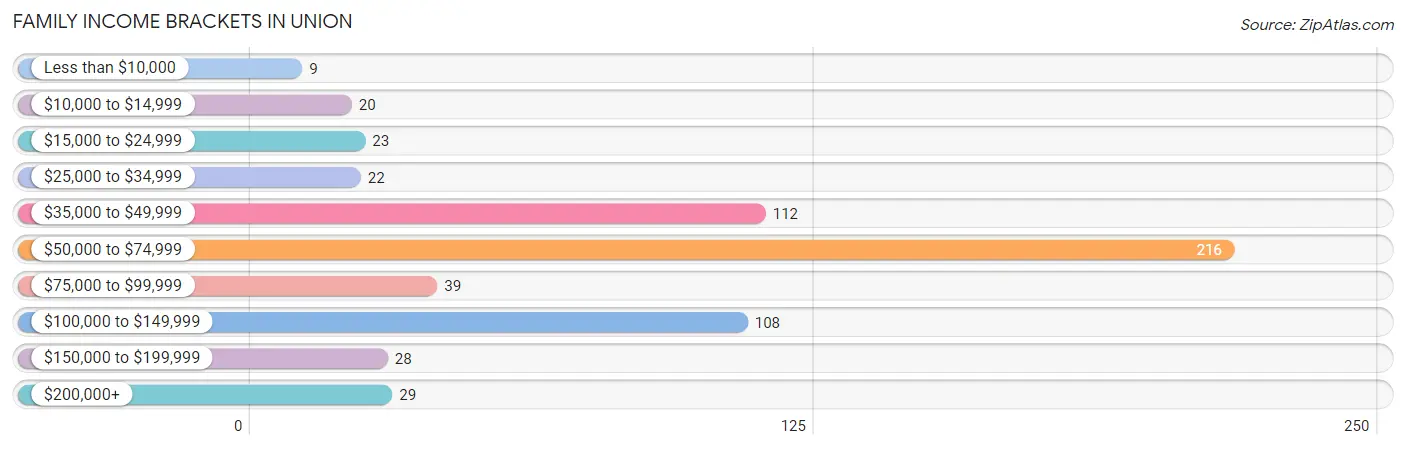
Family Income Brackets in Union
According to the Union family income data, there are 216 families falling into the $50,000 to $74,999 income range, which is the most common income bracket and makes up 35.6% of all families. Conversely, the less than $10,000 income bracket is the least frequent group with only 9 families (1.5%) belonging to this category.
| Income Bracket | # Families | % Families |
| Less than $10,000 | 9 | 1.5% |
| $10,000 to $14,999 | 20 | 3.3% |
| $15,000 to $24,999 | 23 | 3.8% |
| $25,000 to $34,999 | 22 | 3.6% |
| $35,000 to $49,999 | 112 | 18.5% |
| $50,000 to $74,999 | 216 | 35.6% |
| $75,000 to $99,999 | 39 | 6.4% |
| $100,000 to $149,999 | 108 | 17.8% |
| $150,000 to $199,999 | 28 | 4.6% |
| $200,000+ | 29 | 4.8% |
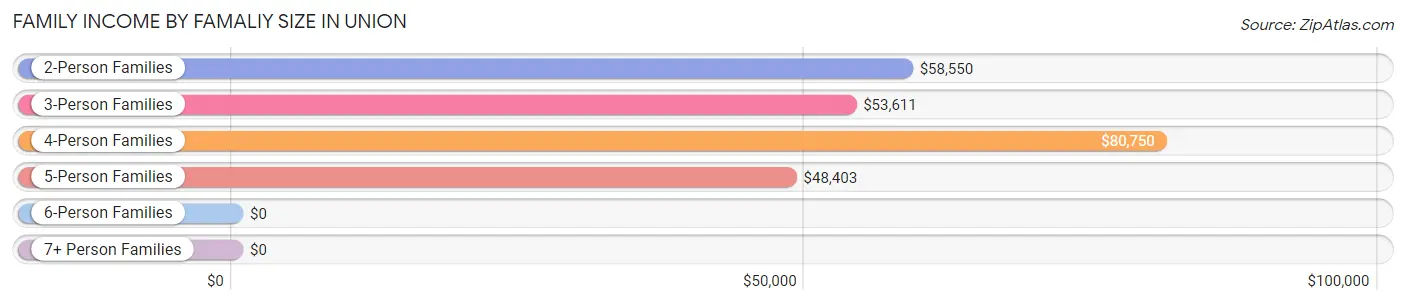
Family Income by Famaliy Size in Union
4-person families (105 | 17.3%) account for the highest median family income in Union with $80,750 per family, while 2-person families (381 | 62.9%) have the highest median income of $29,275 per family member.
| Income Bracket | # Families | Median Income |
| 2-Person Families | 381 (62.9%) | $58,550 |
| 3-Person Families | 70 (11.6%) | $53,611 |
| 4-Person Families | 105 (17.3%) | $80,750 |
| 5-Person Families | 49 (8.1%) | $48,403 |
| 6-Person Families | 0 (0.0%) | $0 |
| 7+ Person Families | 1 (0.2%) | $0 |
| Total | 606 (100.0%) | $61,053 |
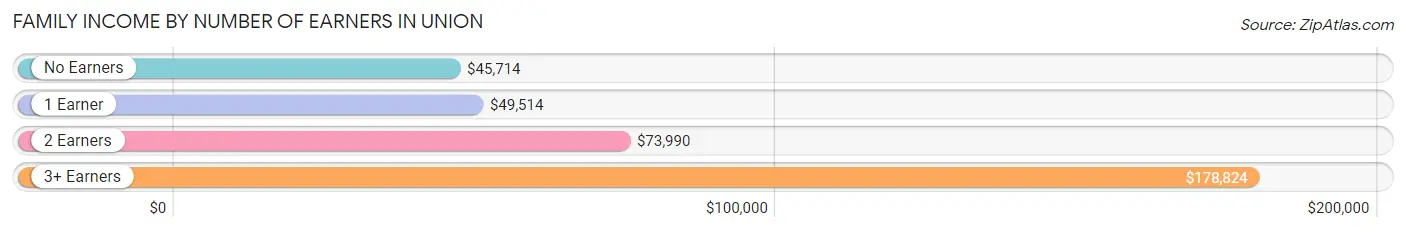
Family Income by Number of Earners in Union
The median family income in Union is $61,053, with families comprising 3+ earners (20) having the highest median family income of $178,824, while families with no earners (70) have the lowest median family income of $45,714, accounting for 3.3% and 11.6% of families, respectively.
| Number of Earners | # Families | Median Income |
| No Earners | 70 (11.6%) | $45,714 |
| 1 Earner | 233 (38.5%) | $49,514 |
| 2 Earners | 283 (46.7%) | $73,990 |
| 3+ Earners | 20 (3.3%) | $178,824 |
| Total | 606 (100.0%) | $61,053 |
Household Income in Union
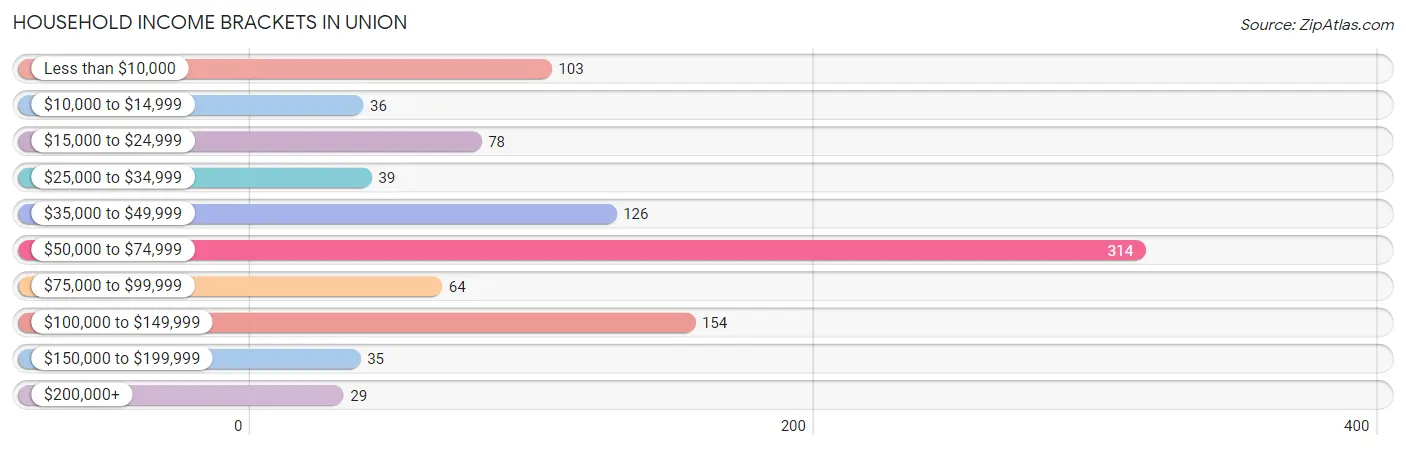
Household Income Brackets in Union
With 314 households falling in the category, the $50,000 to $74,999 income range is the most frequent in Union, accounting for 32.1% of all households. In contrast, only 29 households (3.0%) fall into the $200,000+ income bracket, making it the least populous group.
| Income Bracket | # Households | % Households |
| Less than $10,000 | 103 | 10.5% |
| $10,000 to $14,999 | 36 | 3.7% |
| $15,000 to $24,999 | 78 | 8.0% |
| $25,000 to $34,999 | 39 | 4.0% |
| $35,000 to $49,999 | 126 | 12.9% |
| $50,000 to $74,999 | 314 | 32.1% |
| $75,000 to $99,999 | 64 | 6.5% |
| $100,000 to $149,999 | 154 | 15.7% |
| $150,000 to $199,999 | 35 | 3.6% |
| $200,000+ | 29 | 3.0% |
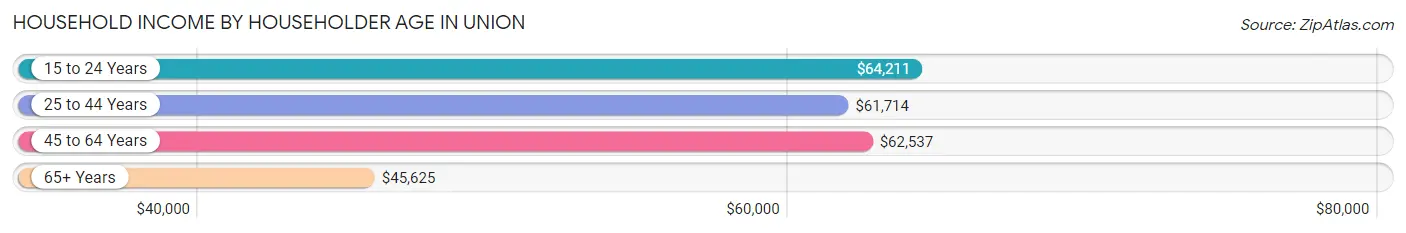
Household Income by Householder Age in Union
The median household income in Union is $60,385, with the highest median household income of $64,211 found in the 15 to 24 years age bracket for the primary householder. A total of 78 households (8.0%) fall into this category. Meanwhile, the 65+ years age bracket for the primary householder has the lowest median household income of $45,625, with 333 households (34.1%) in this group.
| Income Bracket | # Households | Median Income |
| 15 to 24 Years | 78 (8.0%) | $64,211 |
| 25 to 44 Years | 284 (29.0%) | $61,714 |
| 45 to 64 Years | 283 (28.9%) | $62,537 |
| 65+ Years | 333 (34.1%) | $45,625 |
| Total | 978 (100.0%) | $60,385 |
Poverty in Union
Income Below Poverty by Sex and Age in Union
With 12.1% poverty level for males and 24.7% for females among the residents of Union, 12 to 14 year old males and 25 to 34 year old females are the most vulnerable to poverty, with 29 males (90.6%) and 86 females (52.4%) in their respective age groups living below the poverty level.
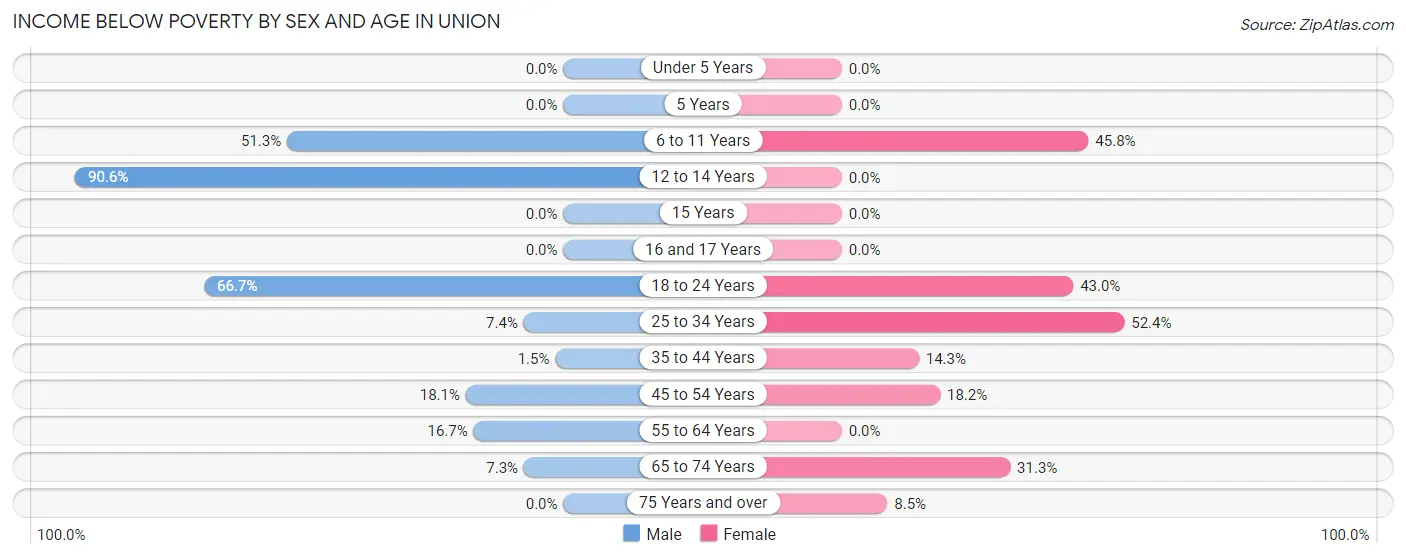
| Age Bracket | Male | Female |
| Under 5 Years | 0 (0.0%) | 0 (0.0%) |
| 5 Years | 0 (0.0%) | 0 (0.0%) |
| 6 to 11 Years | 20 (51.3%) | 38 (45.8%) |
| 12 to 14 Years | 29 (90.6%) | 0 (0.0%) |
| 15 Years | 0 (0.0%) | 0 (0.0%) |
| 16 and 17 Years | 0 (0.0%) | 0 (0.0%) |
| 18 to 24 Years | 20 (66.7%) | 64 (42.9%) |
| 25 to 34 Years | 10 (7.3%) | 86 (52.4%) |
| 35 to 44 Years | 3 (1.5%) | 16 (14.3%) |
| 45 to 54 Years | 23 (18.1%) | 31 (18.2%) |
| 55 to 64 Years | 20 (16.7%) | 0 (0.0%) |
| 65 to 74 Years | 9 (7.3%) | 25 (31.2%) |
| 75 Years and over | 0 (0.0%) | 11 (8.5%) |
| Total | 134 (12.1%) | 271 (24.7%) |
Income Above Poverty by Sex and Age in Union
According to the poverty statistics in Union, males aged under 5 years and females aged under 5 years are the age groups that are most secure financially, with 100.0% of males and 100.0% of females in these age groups living above the poverty line.
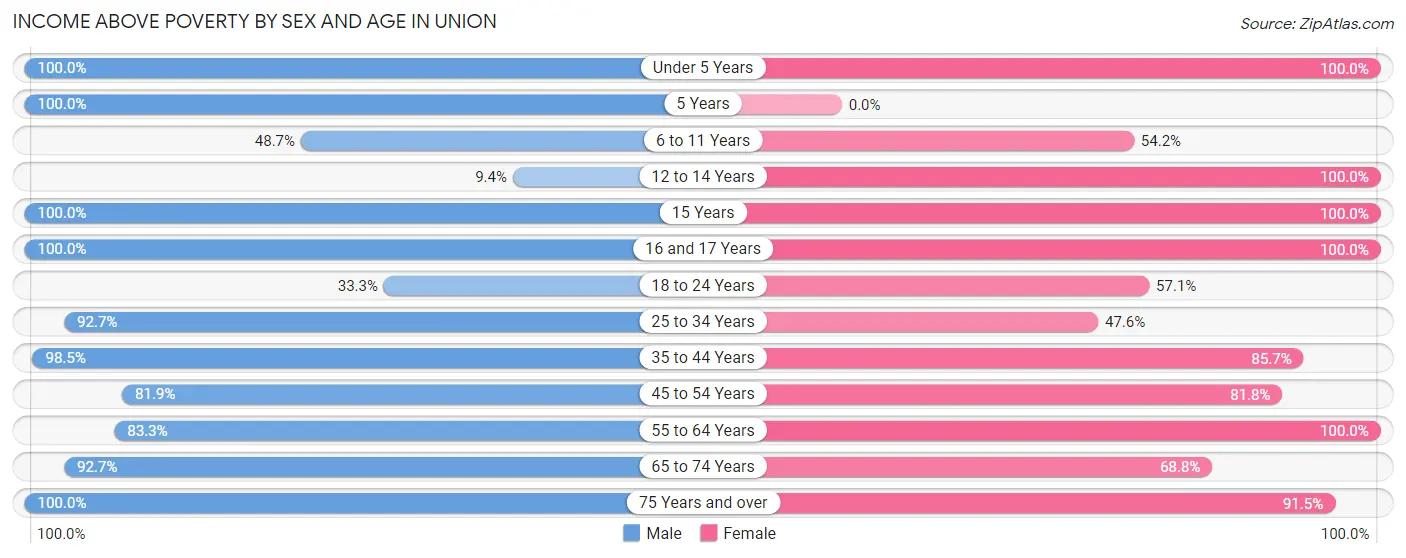
| Age Bracket | Male | Female |
| Under 5 Years | 114 (100.0%) | 58 (100.0%) |
| 5 Years | 24 (100.0%) | 0 (0.0%) |
| 6 to 11 Years | 19 (48.7%) | 45 (54.2%) |
| 12 to 14 Years | 3 (9.4%) | 27 (100.0%) |
| 15 Years | 16 (100.0%) | 8 (100.0%) |
| 16 and 17 Years | 33 (100.0%) | 9 (100.0%) |
| 18 to 24 Years | 10 (33.3%) | 85 (57.1%) |
| 25 to 34 Years | 126 (92.6%) | 78 (47.6%) |
| 35 to 44 Years | 198 (98.5%) | 96 (85.7%) |
| 45 to 54 Years | 104 (81.9%) | 139 (81.8%) |
| 55 to 64 Years | 100 (83.3%) | 107 (100.0%) |
| 65 to 74 Years | 114 (92.7%) | 55 (68.8%) |
| 75 Years and over | 114 (100.0%) | 119 (91.5%) |
| Total | 975 (87.9%) | 826 (75.3%) |
Income Below Poverty Among Married-Couple Families in Union
The poverty statistics for married-couple families in Union show that 2.0% or 9 of the total 447 families live below the poverty line. Families with no children have the highest poverty rate of 2.6%, comprising of 9 families. On the other hand, families with 1 or 2 children have the lowest poverty rate of 0.0%, which includes 0 families.
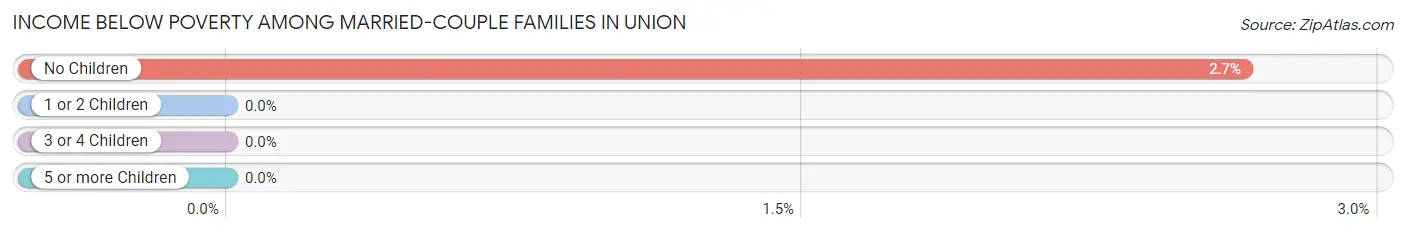
| Children | Above Poverty | Below Poverty |
| No Children | 331 (97.4%) | 9 (2.6%) |
| 1 or 2 Children | 93 (100.0%) | 0 (0.0%) |
| 3 or 4 Children | 14 (100.0%) | 0 (0.0%) |
| 5 or more Children | 0 (0.0%) | 0 (0.0%) |
| Total | 438 (98.0%) | 9 (2.0%) |
Income Below Poverty Among Single-Parent Households in Union
According to the poverty data in Union, 39.3% or 33 single-father households and 22.7% or 17 single-mother households are living below the poverty line. Among single-father households, those with 1 or 2 children have the highest poverty rate, with 15 households (62.5%) experiencing poverty. Likewise, among single-mother households, those with no children have the highest poverty rate, with 12 households (36.4%) falling below the poverty line.
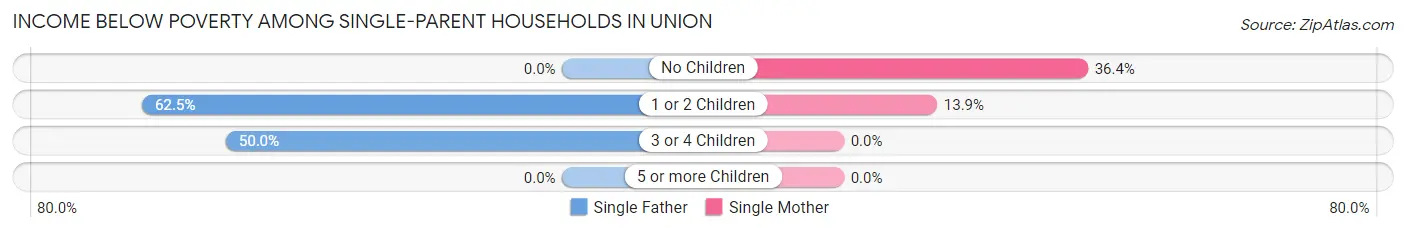
| Children | Single Father | Single Mother |
| No Children | 0 (0.0%) | 12 (36.4%) |
| 1 or 2 Children | 15 (62.5%) | 5 (13.9%) |
| 3 or 4 Children | 18 (50.0%) | 0 (0.0%) |
| 5 or more Children | 0 (0.0%) | 0 (0.0%) |
| Total | 33 (39.3%) | 17 (22.7%) |
Income Below Poverty Among Married-Couple vs Single-Parent Households in Union
The poverty data for Union shows that 9 of the married-couple family households (2.0%) and 50 of the single-parent households (31.5%) are living below the poverty level. Within the married-couple family households, those with no children have the highest poverty rate, with 9 households (2.6%) falling below the poverty line. Among the single-parent households, those with 3 or 4 children have the highest poverty rate, with 18 household (42.9%) living below poverty.
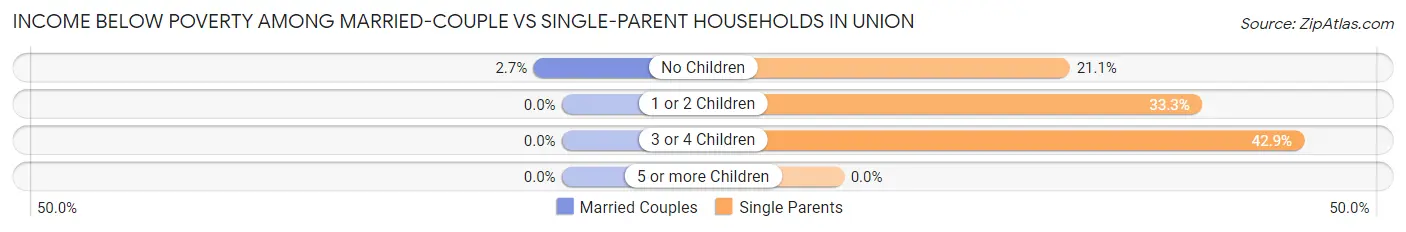
| Children | Married-Couple Families | Single-Parent Households |
| No Children | 9 (2.6%) | 12 (21.0%) |
| 1 or 2 Children | 0 (0.0%) | 20 (33.3%) |
| 3 or 4 Children | 0 (0.0%) | 18 (42.9%) |
| 5 or more Children | 0 (0.0%) | 0 (0.0%) |
| Total | 9 (2.0%) | 50 (31.5%) |
Race in Union
The most populous races in Union are White / Caucasian (1,952 | 88.4%), Two or more Races (134 | 6.1%), and Hispanic or Latino (130 | 5.9%).
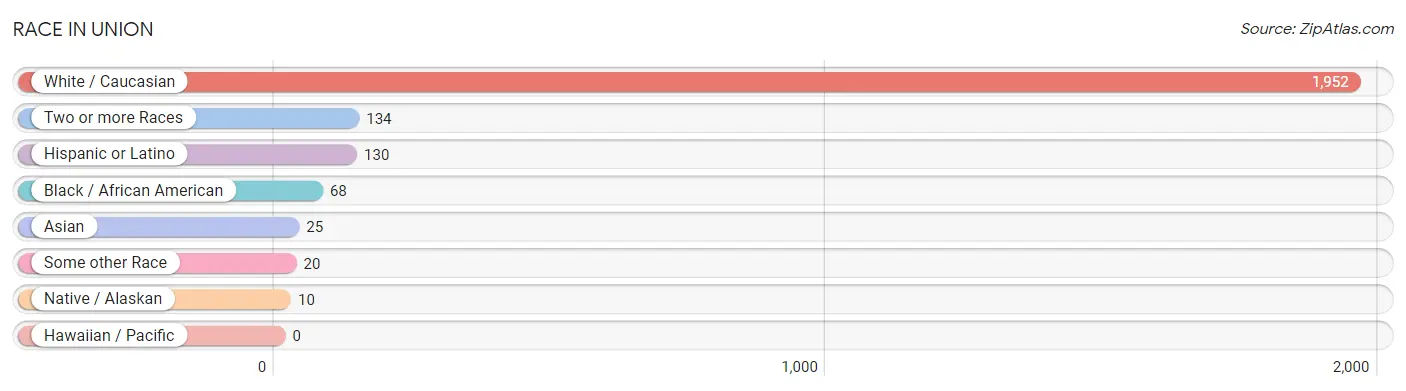
| Race | # Population | % Population |
| Asian | 25 | 1.1% |
| Black / African American | 68 | 3.1% |
| Hawaiian / Pacific | 0 | 0.0% |
| Hispanic or Latino | 130 | 5.9% |
| Native / Alaskan | 10 | 0.4% |
| White / Caucasian | 1,952 | 88.4% |
| Two or more Races | 134 | 6.1% |
| Some other Race | 20 | 0.9% |
| Total | 2,209 | 100.0% |
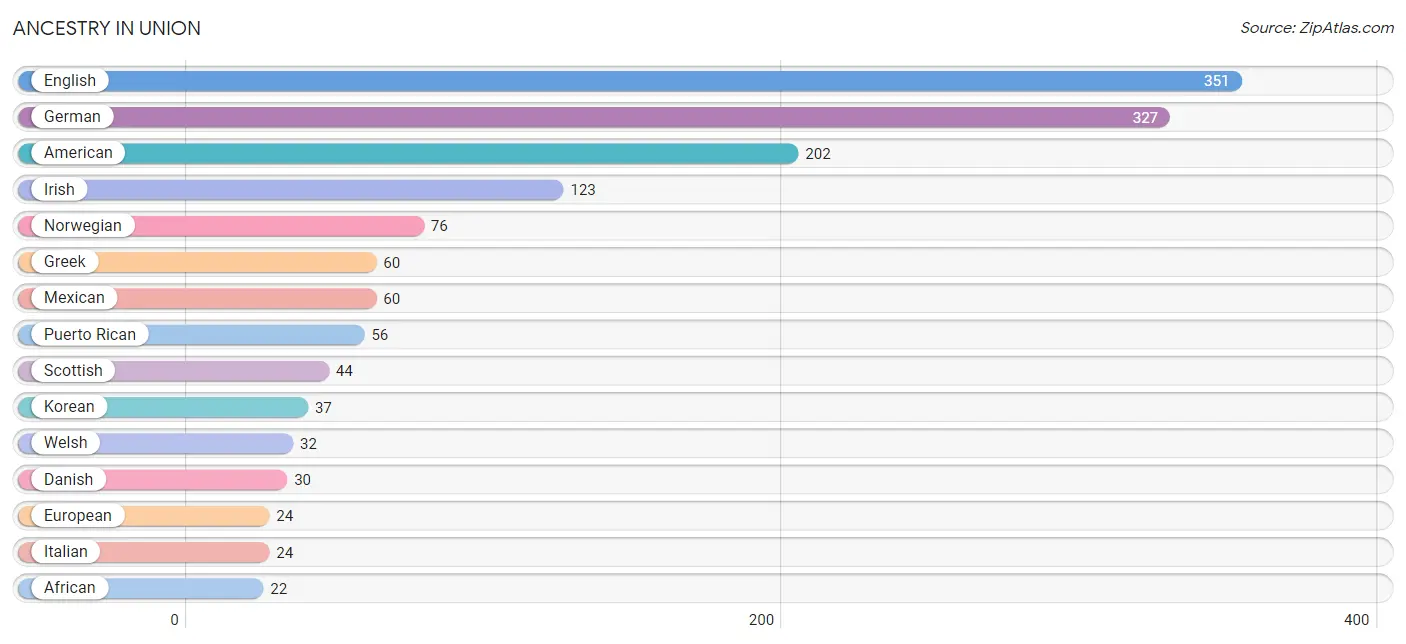
Ancestry in Union
The most populous ancestries reported in Union are English (351 | 15.9%), German (327 | 14.8%), American (202 | 9.1%), Irish (123 | 5.6%), and Norwegian (76 | 3.4%), together accounting for 48.8% of all Union residents.
| Ancestry | # Population | % Population |
| African | 22 | 1.0% |
| American | 202 | 9.1% |
| Belgian | 10 | 0.4% |
| British | 5 | 0.2% |
| Burmese | 4 | 0.2% |
| Central American | 14 | 0.6% |
| Cherokee | 1 | 0.1% |
| Chippewa | 10 | 0.4% |
| Czech | 5 | 0.2% |
| Danish | 30 | 1.4% |
| Dutch | 20 | 0.9% |
| English | 351 | 15.9% |
| European | 24 | 1.1% |
| French | 5 | 0.2% |
| German | 327 | 14.8% |
| Greek | 60 | 2.7% |
| Hopi | 4 | 0.2% |
| Irish | 123 | 5.6% |
| Italian | 24 | 1.1% |
| Korean | 37 | 1.7% |
| Mexican | 60 | 2.7% |
| Norwegian | 76 | 3.4% |
| Portuguese | 4 | 0.2% |
| Puerto Rican | 56 | 2.5% |
| Russian | 1 | 0.1% |
| Salvadoran | 14 | 0.6% |
| Scandinavian | 10 | 0.4% |
| Scotch-Irish | 20 | 0.9% |
| Scottish | 44 | 2.0% |
| Slovak | 5 | 0.2% |
| Slovene | 5 | 0.2% |
| Subsaharan African | 22 | 1.0% |
| Swedish | 20 | 0.9% |
| Swiss | 17 | 0.8% |
| Welsh | 32 | 1.5% |
| Yup'ik | 1 | 0.1% | View All 36 Rows |
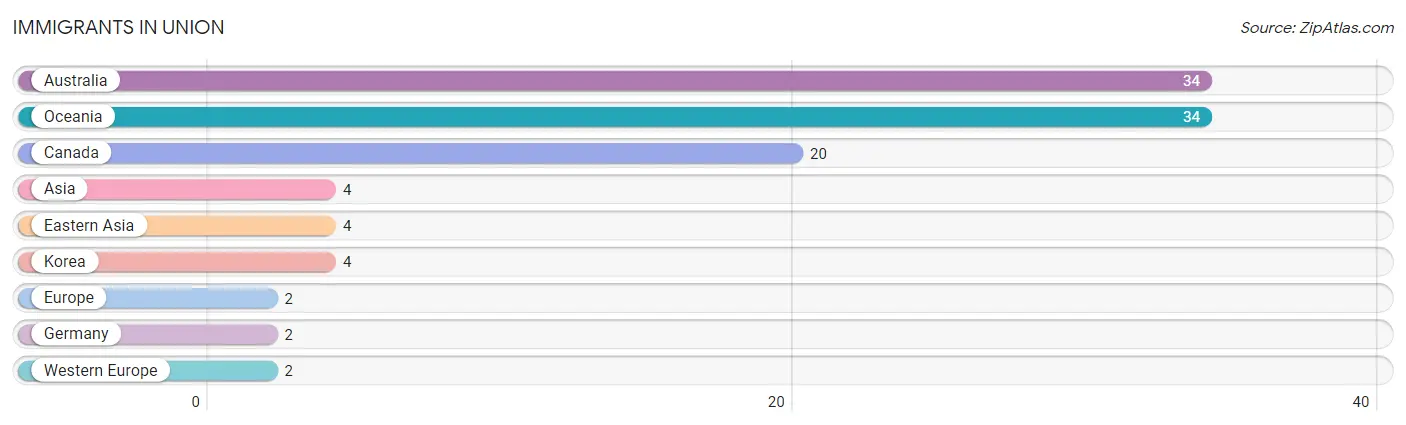
Immigrants in Union
The most numerous immigrant groups reported in Union came from Australia (34 | 1.5%), Oceania (34 | 1.5%), Canada (20 | 0.9%), Asia (4 | 0.2%), and Eastern Asia (4 | 0.2%), together accounting for 4.4% of all Union residents.
| Immigration Origin | # Population | % Population |
| Asia | 4 | 0.2% |
| Australia | 34 | 1.5% |
| Canada | 20 | 0.9% |
| Eastern Asia | 4 | 0.2% |
| Europe | 2 | 0.1% |
| Germany | 2 | 0.1% |
| Korea | 4 | 0.2% |
| Oceania | 34 | 1.5% |
| Western Europe | 2 | 0.1% | View All 9 Rows |
Sex and Age in Union
Sex and Age in Union
The most populous age groups in Union are 40 to 44 Years (143 | 12.9%) for men and 20 to 24 Years (137 | 12.5%) for women.
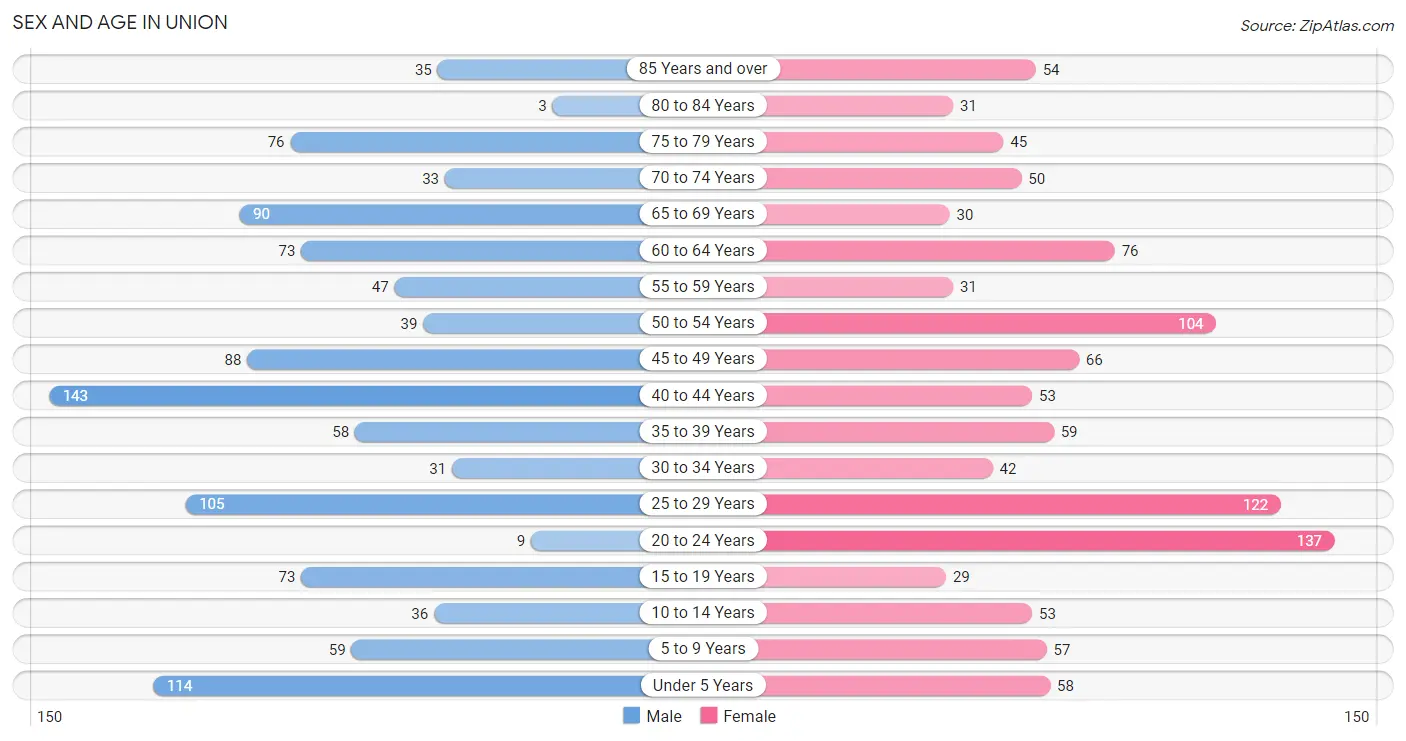
| Age Bracket | Male | Female |
| Under 5 Years | 114 (10.2%) | 58 (5.3%) |
| 5 to 9 Years | 59 (5.3%) | 57 (5.2%) |
| 10 to 14 Years | 36 (3.2%) | 53 (4.8%) |
| 15 to 19 Years | 73 (6.6%) | 29 (2.6%) |
| 20 to 24 Years | 9 (0.8%) | 137 (12.5%) |
| 25 to 29 Years | 105 (9.4%) | 122 (11.1%) |
| 30 to 34 Years | 31 (2.8%) | 42 (3.8%) |
| 35 to 39 Years | 58 (5.2%) | 59 (5.4%) |
| 40 to 44 Years | 143 (12.9%) | 53 (4.8%) |
| 45 to 49 Years | 88 (7.9%) | 66 (6.0%) |
| 50 to 54 Years | 39 (3.5%) | 104 (9.5%) |
| 55 to 59 Years | 47 (4.2%) | 31 (2.8%) |
| 60 to 64 Years | 73 (6.6%) | 76 (6.9%) |
| 65 to 69 Years | 90 (8.1%) | 30 (2.7%) |
| 70 to 74 Years | 33 (3.0%) | 50 (4.6%) |
| 75 to 79 Years | 76 (6.8%) | 45 (4.1%) |
| 80 to 84 Years | 3 (0.3%) | 31 (2.8%) |
| 85 Years and over | 35 (3.2%) | 54 (4.9%) |
| Total | 1,112 (100.0%) | 1,097 (100.0%) |
Families and Households in Union
Median Family Size in Union
The median family size in Union is 2.75 persons per family, with single male/father families (84 | 13.9%) accounting for the largest median family size of 3.15 persons per family. On the other hand, single female/mother families (75 | 12.4%) represent the smallest median family size with 2.43 persons per family.
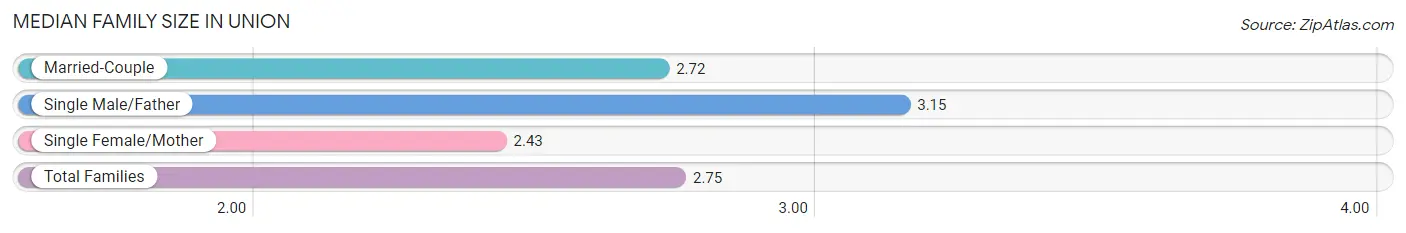
| Family Type | # Families | Family Size |
| Married-Couple | 447 (73.8%) | 2.72 |
| Single Male/Father | 84 (13.9%) | 3.15 |
| Single Female/Mother | 75 (12.4%) | 2.43 |
| Total Families | 606 (100.0%) | 2.75 |
Median Household Size in Union
The median household size in Union is 2.25 persons per household, with single male/father households (84 | 8.6%) accounting for the largest median household size of 3.62 persons per household. non-family households (372 | 38.0%) represent the smallest median household size with 1.20 persons per household.
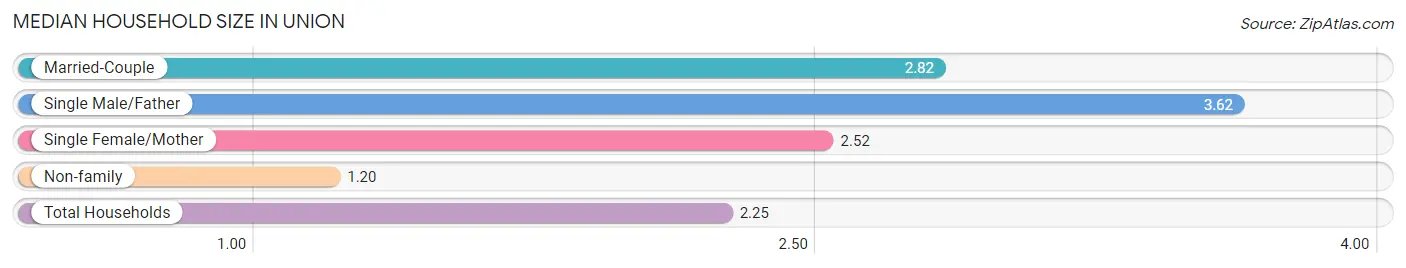
| Household Type | # Households | Household Size |
| Married-Couple | 447 (45.7%) | 2.82 |
| Single Male/Father | 84 (8.6%) | 3.62 |
| Single Female/Mother | 75 (7.7%) | 2.52 |
| Non-family | 372 (38.0%) | 1.20 |
| Total Households | 978 (100.0%) | 2.25 |
Household Size by Marriage Status in Union
Out of a total of 978 households in Union, 606 (62.0%) are family households, while 372 (38.0%) are nonfamily households. The most numerous type of family households are 2-person households, comprising 333, and the most common type of nonfamily households are 1-person households, comprising 275.
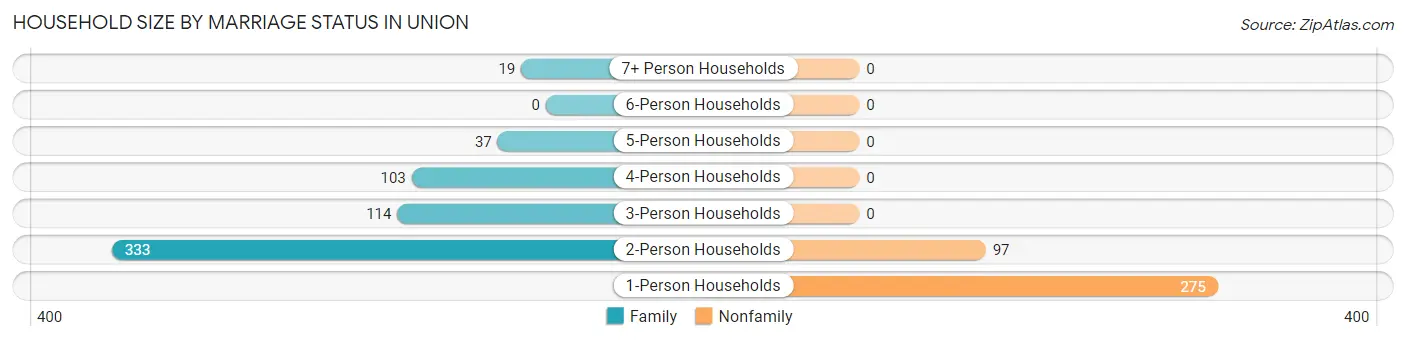
| Household Size | Family Households | Nonfamily Households |
| 1-Person Households | - | 275 (28.1%) |
| 2-Person Households | 333 (34.1%) | 97 (9.9%) |
| 3-Person Households | 114 (11.7%) | 0 (0.0%) |
| 4-Person Households | 103 (10.5%) | 0 (0.0%) |
| 5-Person Households | 37 (3.8%) | 0 (0.0%) |
| 6-Person Households | 0 (0.0%) | 0 (0.0%) |
| 7+ Person Households | 19 (1.9%) | 0 (0.0%) |
| Total | 606 (62.0%) | 372 (38.0%) |
Female Fertility in Union
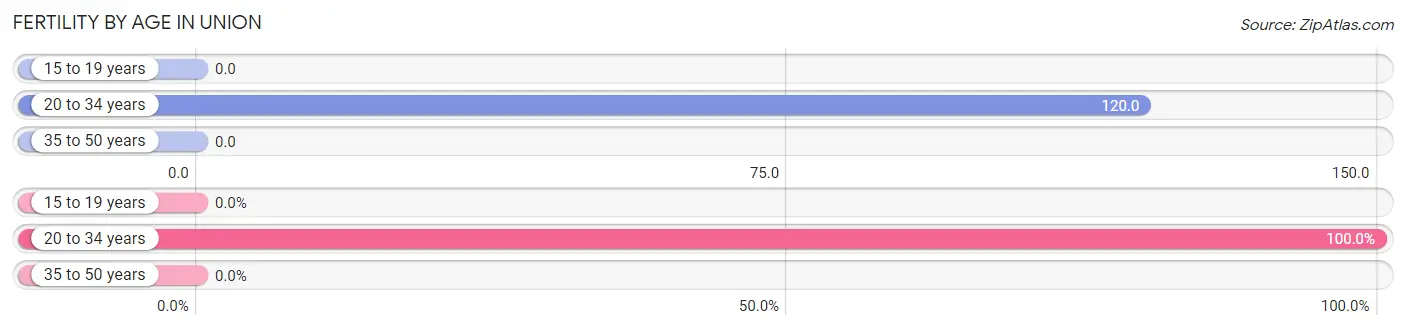
Fertility by Age in Union
Average fertility rate in Union is 65.0 births per 1,000 women. Women in the age bracket of 20 to 34 years have the highest fertility rate with 120.0 births per 1,000 women. Women in the age bracket of 20 to 34 years acount for 100.0% of all women with births.
| Age Bracket | Women with Births | Births / 1,000 Women |
| 15 to 19 years | 0 (0.0%) | 0.0 |
| 20 to 34 years | 36 (100.0%) | 120.0 |
| 35 to 50 years | 0 (0.0%) | 0.0 |
| Total | 36 (100.0%) | 65.0 |
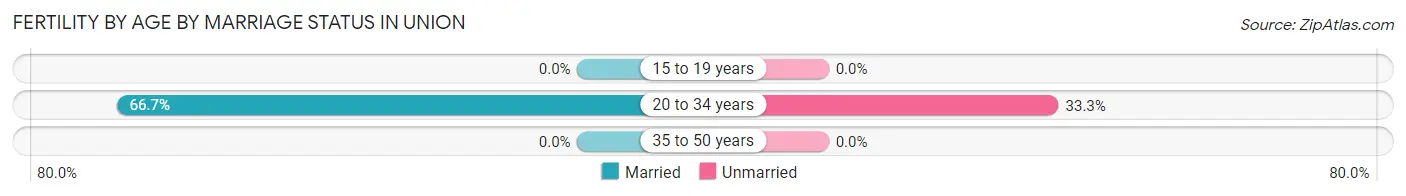
Fertility by Age by Marriage Status in Union
66.7% of women with births (36) in Union are married. The highest percentage of unmarried women with births falls into 20 to 34 years age bracket with 33.3% of them unmarried at the time of birth, while the lowest percentage of unmarried women with births belong to 20 to 34 years age bracket with 33.3% of them unmarried.
| Age Bracket | Married | Unmarried |
| 15 to 19 years | 0 (0.0%) | 0 (0.0%) |
| 20 to 34 years | 24 (66.7%) | 12 (33.3%) |
| 35 to 50 years | 0 (0.0%) | 0 (0.0%) |
| Total | 24 (66.7%) | 12 (33.3%) |
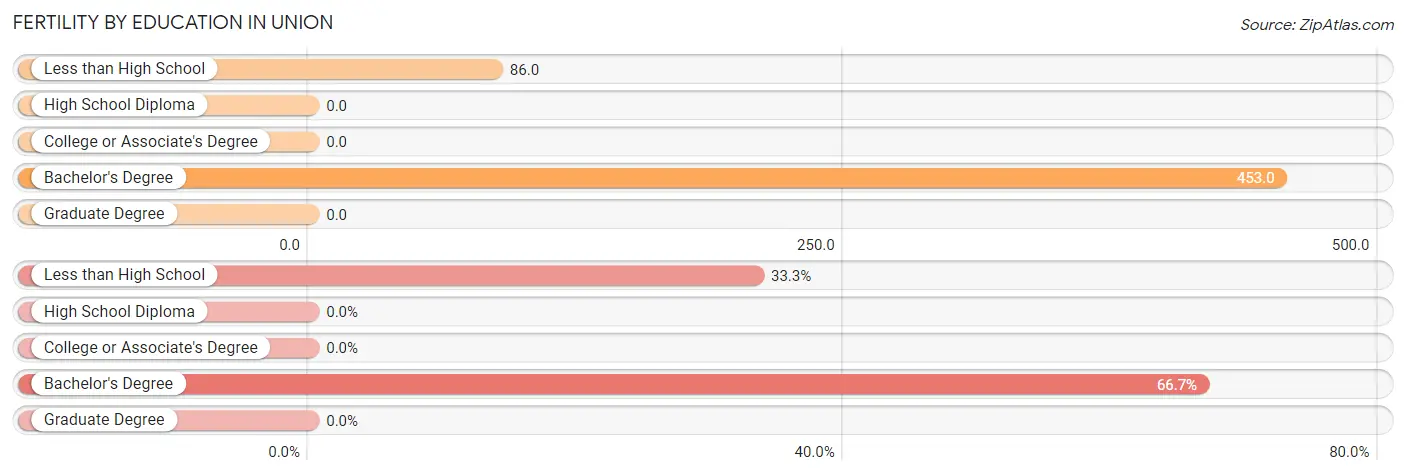
Fertility by Education in Union
| Educational Attainment | Women with Births | Births / 1,000 Women |
| Less than High School | 12 (33.3%) | 86.0 |
| High School Diploma | 0 (0.0%) | 0.0 |
| College or Associate's Degree | 0 (0.0%) | 0.0 |
| Bachelor's Degree | 24 (66.7%) | 453.0 |
| Graduate Degree | 0 (0.0%) | 0.0 |
| Total | 36 (100.0%) | 65.0 |
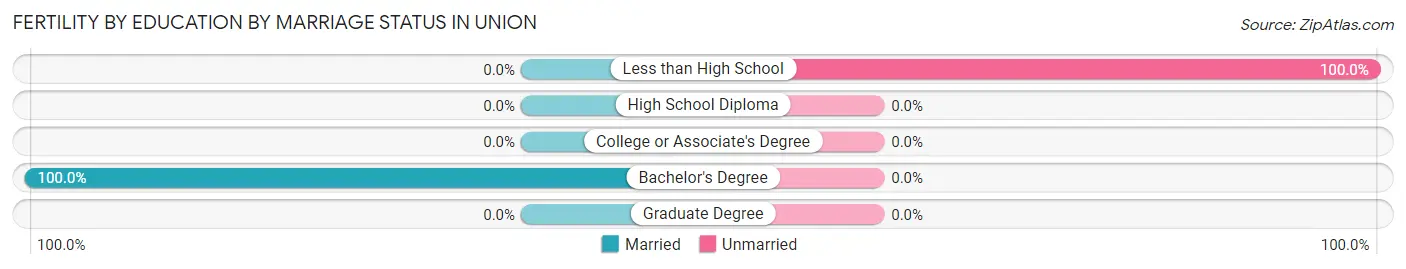
Fertility by Education by Marriage Status in Union
33.3% of women with births in Union are unmarried. Women with the educational attainment of bachelor's degree are most likely to be married with 100.0% of them married at childbirth, while women with the educational attainment of less than high school are least likely to be married with 100.0% of them unmarried at childbirth.
| Educational Attainment | Married | Unmarried |
| Less than High School | 0 (0.0%) | 12 (100.0%) |
| High School Diploma | 0 (0.0%) | 0 (0.0%) |
| College or Associate's Degree | 0 (0.0%) | 0 (0.0%) |
| Bachelor's Degree | 24 (100.0%) | 0 (0.0%) |
| Graduate Degree | 0 (0.0%) | 0 (0.0%) |
| Total | 24 (66.7%) | 12 (33.3%) |
Employment Characteristics in Union
Employment by Class of Employer in Union
Among the 1,061 employed individuals in Union, private company employees (749 | 70.6%), local government employees (94 | 8.9%), and state government employees (63 | 5.9%) make up the most common classes of employment.
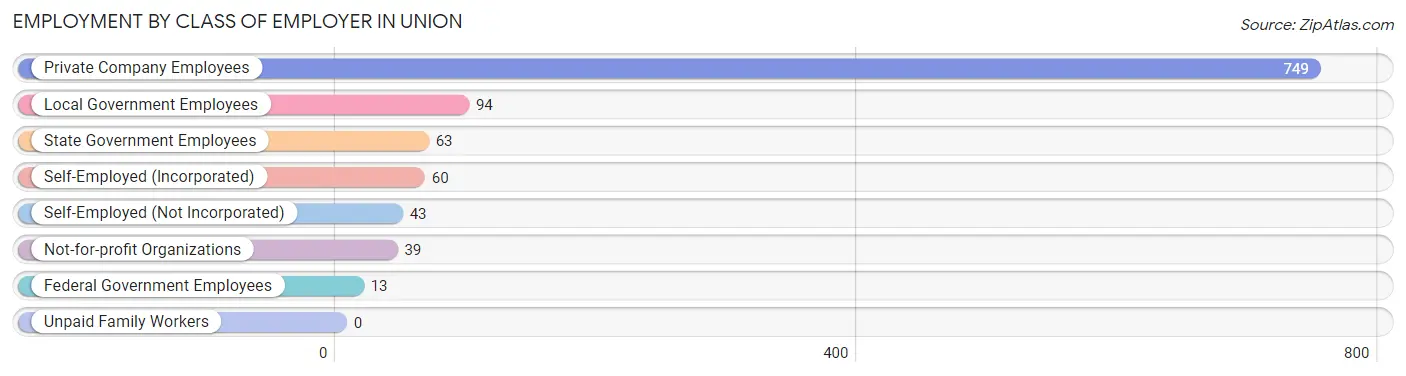
| Employer Class | # Employees | % Employees |
| Private Company Employees | 749 | 70.6% |
| Self-Employed (Incorporated) | 60 | 5.7% |
| Self-Employed (Not Incorporated) | 43 | 4.1% |
| Not-for-profit Organizations | 39 | 3.7% |
| Local Government Employees | 94 | 8.9% |
| State Government Employees | 63 | 5.9% |
| Federal Government Employees | 13 | 1.2% |
| Unpaid Family Workers | 0 | 0.0% |
| Total | 1,061 | 100.0% |
Employment Status by Age in Union
According to the labor force statistics for Union, out of the total population over 16 years of age (1,808), 60.2% or 1,088 individuals are in the labor force, with 2.5% or 27 of them unemployed. The age group with the highest labor force participation rate is 45 to 54 years, with 85.9% or 255 individuals in the labor force. Within the labor force, the 16 to 19 years age range has the highest percentage of unemployed individuals, with 26.8% or 14 of them being unemployed.
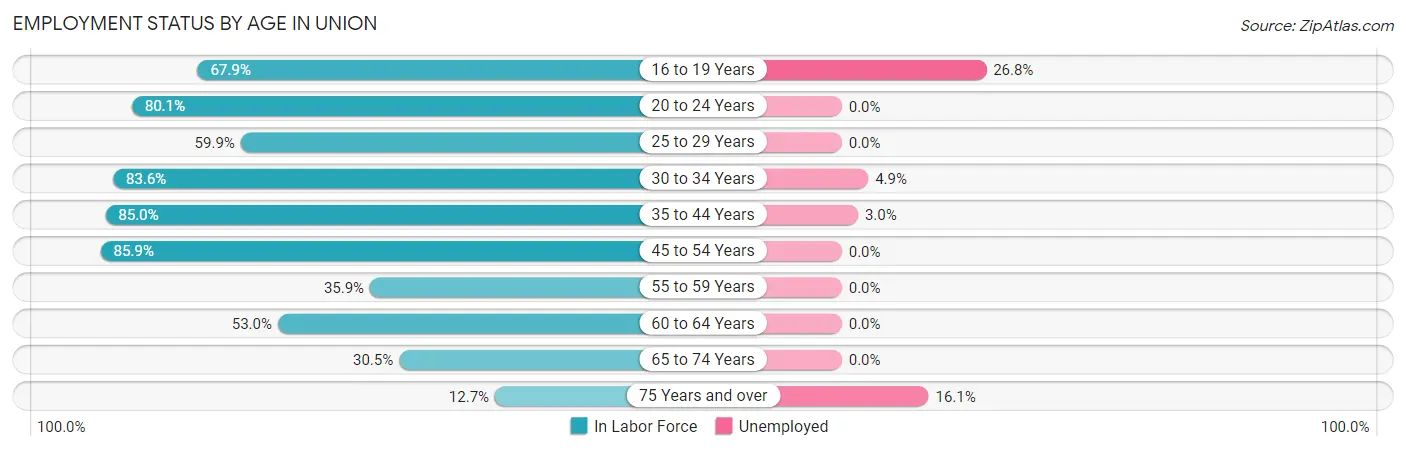
| Age Bracket | In Labor Force | Unemployed |
| 16 to 19 Years | 53 (67.9%) | 14 (26.8%) |
| 20 to 24 Years | 117 (80.1%) | 0 (0.0%) |
| 25 to 29 Years | 136 (59.9%) | 0 (0.0%) |
| 30 to 34 Years | 61 (83.6%) | 3 (4.9%) |
| 35 to 44 Years | 266 (85.0%) | 8 (3.0%) |
| 45 to 54 Years | 255 (85.9%) | 0 (0.0%) |
| 55 to 59 Years | 28 (35.9%) | 0 (0.0%) |
| 60 to 64 Years | 79 (53.0%) | 0 (0.0%) |
| 65 to 74 Years | 62 (30.5%) | 0 (0.0%) |
| 75 Years and over | 31 (12.7%) | 5 (16.1%) |
| Total | 1,088 (60.2%) | 27 (2.5%) |
Employment Status by Educational Attainment in Union
According to labor force statistics for Union, 72.6% of individuals (825) out of the total population between 25 and 64 years of age (1,137) are in the labor force, with 1.3% or 11 of them being unemployed. The group with the highest labor force participation rate are those with the educational attainment of high school diploma, with 85.2% or 317 individuals in the labor force. Within the labor force, individuals with college / associate degree education have the highest percentage of unemployment, with 2.8% or 11 of them being unemployed.
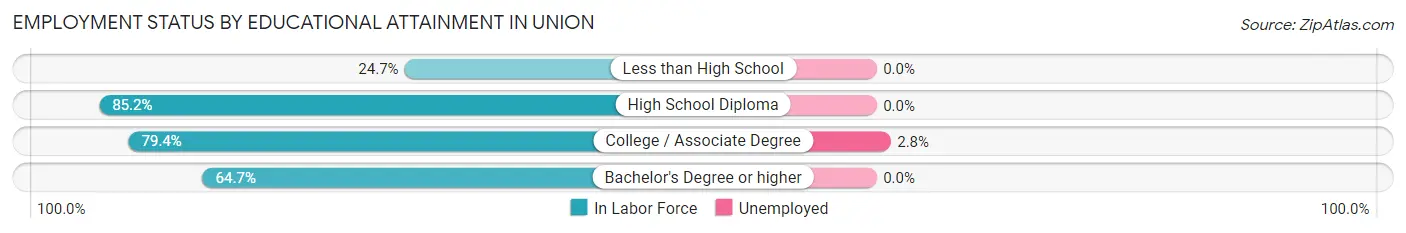
| Educational Attainment | In Labor Force | Unemployed |
| Less than High School | 36 (24.7%) | 0 (0.0%) |
| High School Diploma | 317 (85.2%) | 0 (0.0%) |
| College / Associate Degree | 386 (79.4%) | 14 (2.8%) |
| Bachelor's Degree or higher | 86 (64.7%) | 0 (0.0%) |
| Total | 825 (72.6%) | 15 (1.3%) |
Employment Occupations by Sex in Union
Management, Business, Science and Arts Occupations
The most common Management, Business, Science and Arts occupations in Union are Management (121 | 11.5%), Computers, Engineering & Science (56 | 5.3%), Community & Social Service (54 | 5.1%), Education Instruction & Library (47 | 4.5%), and Business & Financial (39 | 3.7%).
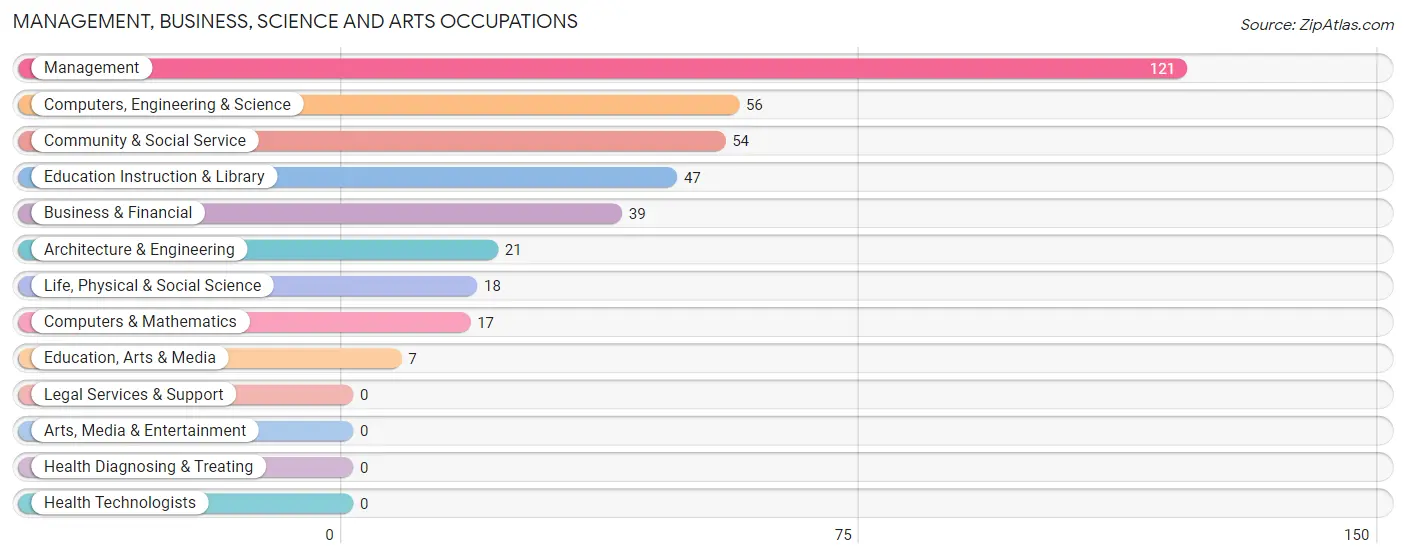
Management, Business, Science and Arts Occupations by Sex
Within the Management, Business, Science and Arts occupations in Union, the most male-oriented occupations are Computers & Mathematics (100.0%), Education, Arts & Media (100.0%), and Architecture & Engineering (85.7%), while the most female-oriented occupations are Education Instruction & Library (100.0%), Community & Social Service (87.0%), and Life, Physical & Social Science (33.3%).
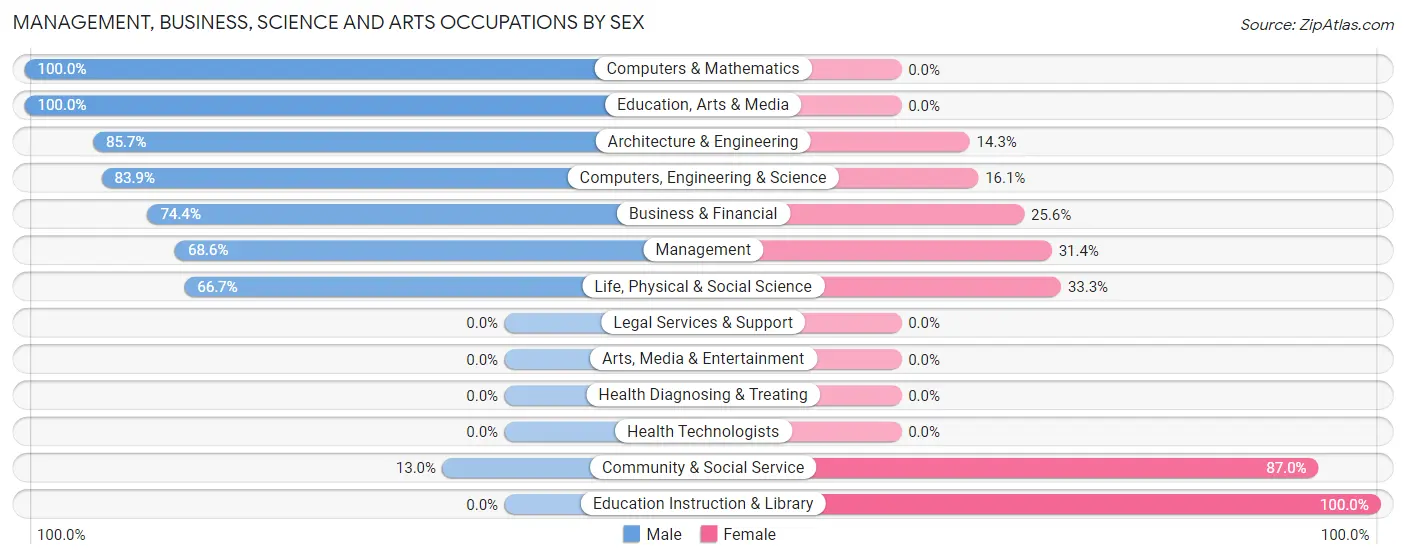
| Occupation | Male | Female |
| Management | 83 (68.6%) | 38 (31.4%) |
| Business & Financial | 29 (74.4%) | 10 (25.6%) |
| Computers, Engineering & Science | 47 (83.9%) | 9 (16.1%) |
| Computers & Mathematics | 17 (100.0%) | 0 (0.0%) |
| Architecture & Engineering | 18 (85.7%) | 3 (14.3%) |
| Life, Physical & Social Science | 12 (66.7%) | 6 (33.3%) |
| Community & Social Service | 7 (13.0%) | 47 (87.0%) |
| Education, Arts & Media | 7 (100.0%) | 0 (0.0%) |
| Legal Services & Support | 0 (0.0%) | 0 (0.0%) |
| Education Instruction & Library | 0 (0.0%) | 47 (100.0%) |
| Arts, Media & Entertainment | 0 (0.0%) | 0 (0.0%) |
| Health Diagnosing & Treating | 0 (0.0%) | 0 (0.0%) |
| Health Technologists | 0 (0.0%) | 0 (0.0%) |
| Total (Category) | 166 (61.5%) | 104 (38.5%) |
| Total (Overall) | 581 (55.4%) | 468 (44.6%) |
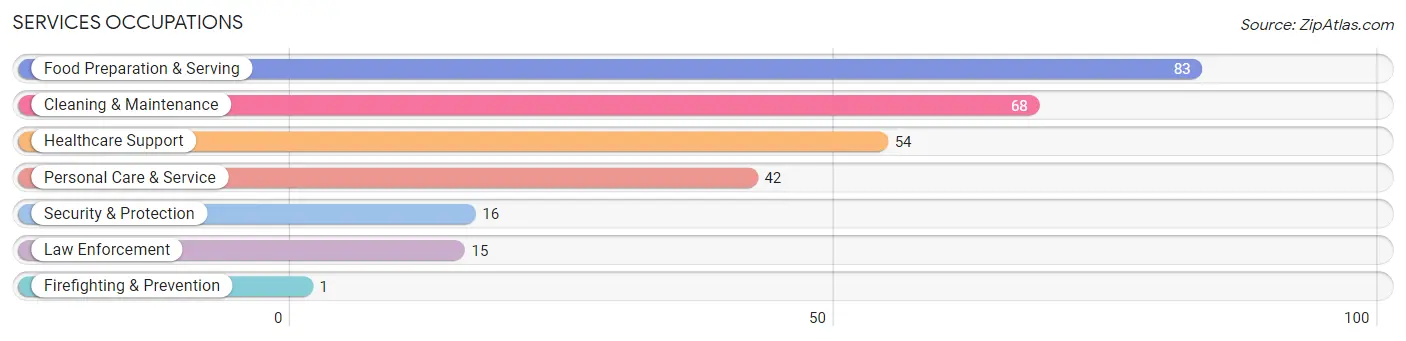
Services Occupations
The most common Services occupations in Union are Food Preparation & Serving (83 | 7.9%), Cleaning & Maintenance (68 | 6.5%), Healthcare Support (54 | 5.1%), Personal Care & Service (42 | 4.0%), and Security & Protection (16 | 1.5%).
Services Occupations by Sex
Within the Services occupations in Union, the most male-oriented occupations are Security & Protection (100.0%), Firefighting & Prevention (100.0%), and Law Enforcement (100.0%), while the most female-oriented occupations are Personal Care & Service (100.0%), Food Preparation & Serving (71.1%), and Healthcare Support (63.0%).
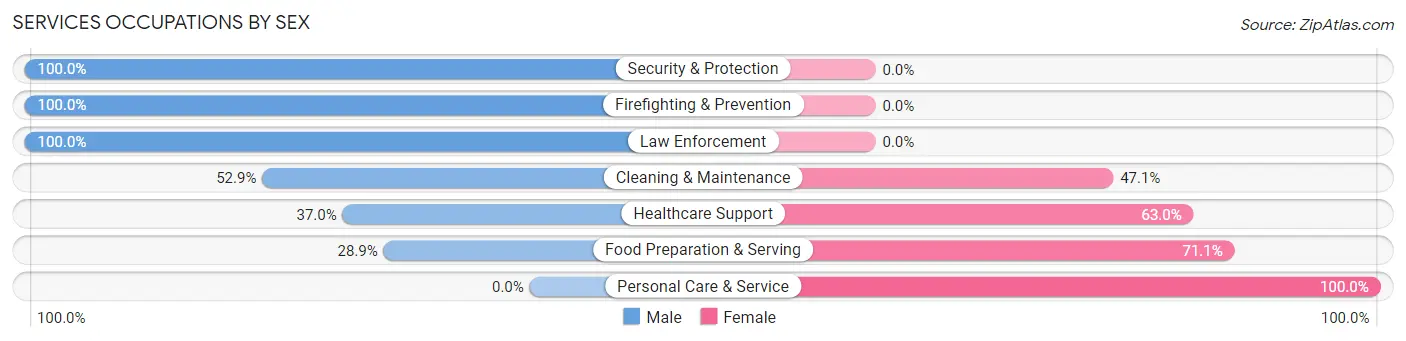
| Occupation | Male | Female |
| Healthcare Support | 20 (37.0%) | 34 (63.0%) |
| Security & Protection | 16 (100.0%) | 0 (0.0%) |
| Firefighting & Prevention | 1 (100.0%) | 0 (0.0%) |
| Law Enforcement | 15 (100.0%) | 0 (0.0%) |
| Food Preparation & Serving | 24 (28.9%) | 59 (71.1%) |
| Cleaning & Maintenance | 36 (52.9%) | 32 (47.1%) |
| Personal Care & Service | 0 (0.0%) | 42 (100.0%) |
| Total (Category) | 96 (36.5%) | 167 (63.5%) |
| Total (Overall) | 581 (55.4%) | 468 (44.6%) |
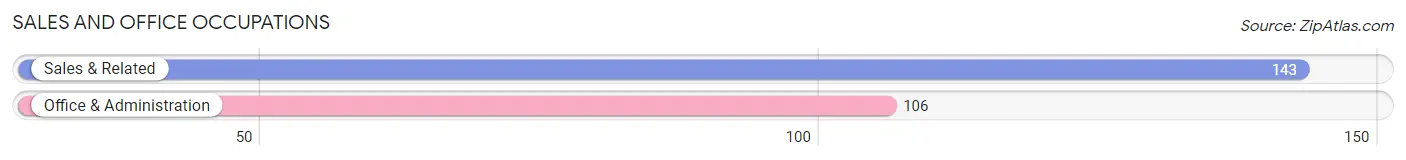
Sales and Office Occupations
The most common Sales and Office occupations in Union are Sales & Related (143 | 13.6%), and Office & Administration (106 | 10.1%).
Sales and Office Occupations by Sex
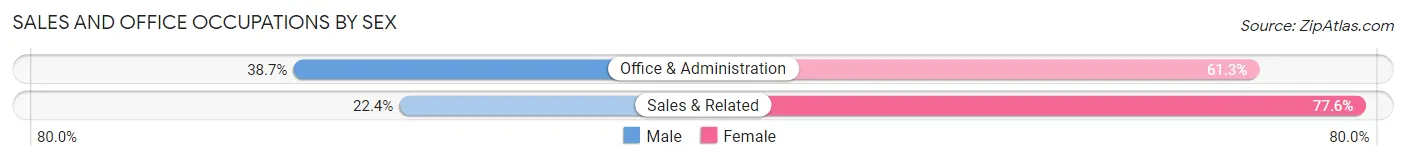
| Occupation | Male | Female |
| Sales & Related | 32 (22.4%) | 111 (77.6%) |
| Office & Administration | 41 (38.7%) | 65 (61.3%) |
| Total (Category) | 73 (29.3%) | 176 (70.7%) |
| Total (Overall) | 581 (55.4%) | 468 (44.6%) |
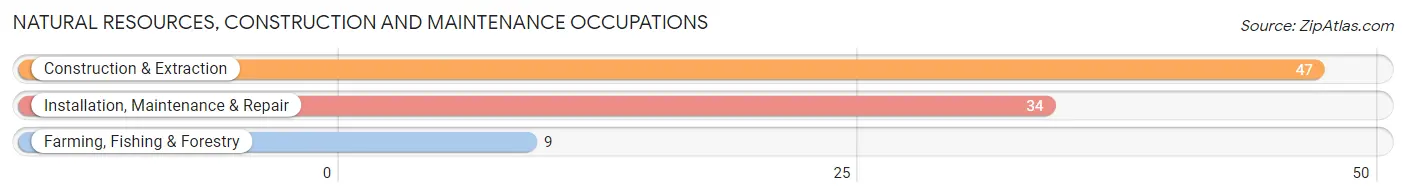
Natural Resources, Construction and Maintenance Occupations
The most common Natural Resources, Construction and Maintenance occupations in Union are Construction & Extraction (47 | 4.5%), Installation, Maintenance & Repair (34 | 3.2%), and Farming, Fishing & Forestry (9 | 0.9%).
Natural Resources, Construction and Maintenance Occupations by Sex
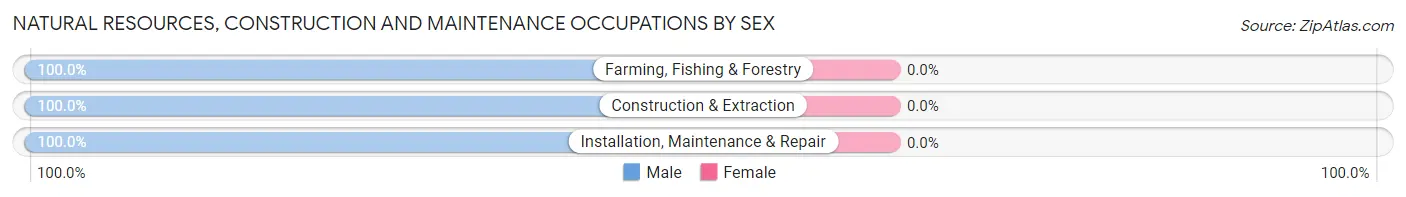
| Occupation | Male | Female |
| Farming, Fishing & Forestry | 9 (100.0%) | 0 (0.0%) |
| Construction & Extraction | 47 (100.0%) | 0 (0.0%) |
| Installation, Maintenance & Repair | 34 (100.0%) | 0 (0.0%) |
| Total (Category) | 90 (100.0%) | 0 (0.0%) |
| Total (Overall) | 581 (55.4%) | 468 (44.6%) |
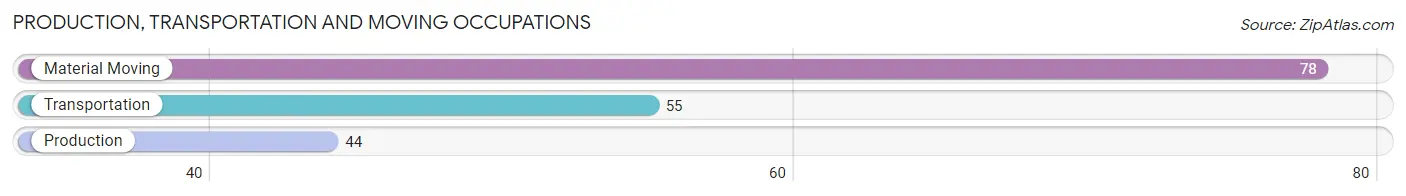
Production, Transportation and Moving Occupations
The most common Production, Transportation and Moving occupations in Union are Material Moving (78 | 7.4%), Transportation (55 | 5.2%), and Production (44 | 4.2%).
Production, Transportation and Moving Occupations by Sex
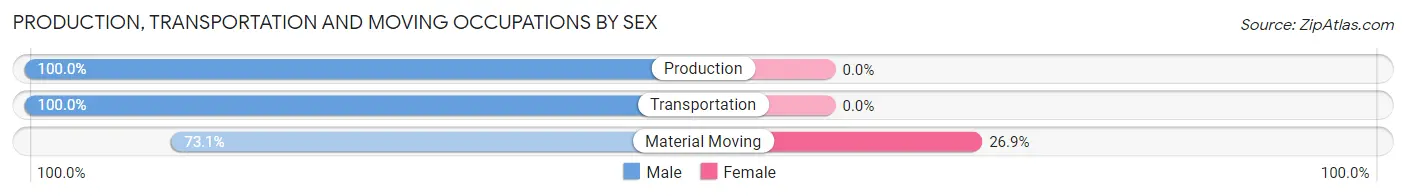
| Occupation | Male | Female |
| Production | 44 (100.0%) | 0 (0.0%) |
| Transportation | 55 (100.0%) | 0 (0.0%) |
| Material Moving | 57 (73.1%) | 21 (26.9%) |
| Total (Category) | 156 (88.1%) | 21 (11.9%) |
| Total (Overall) | 581 (55.4%) | 468 (44.6%) |
Employment Industries by Sex in Union
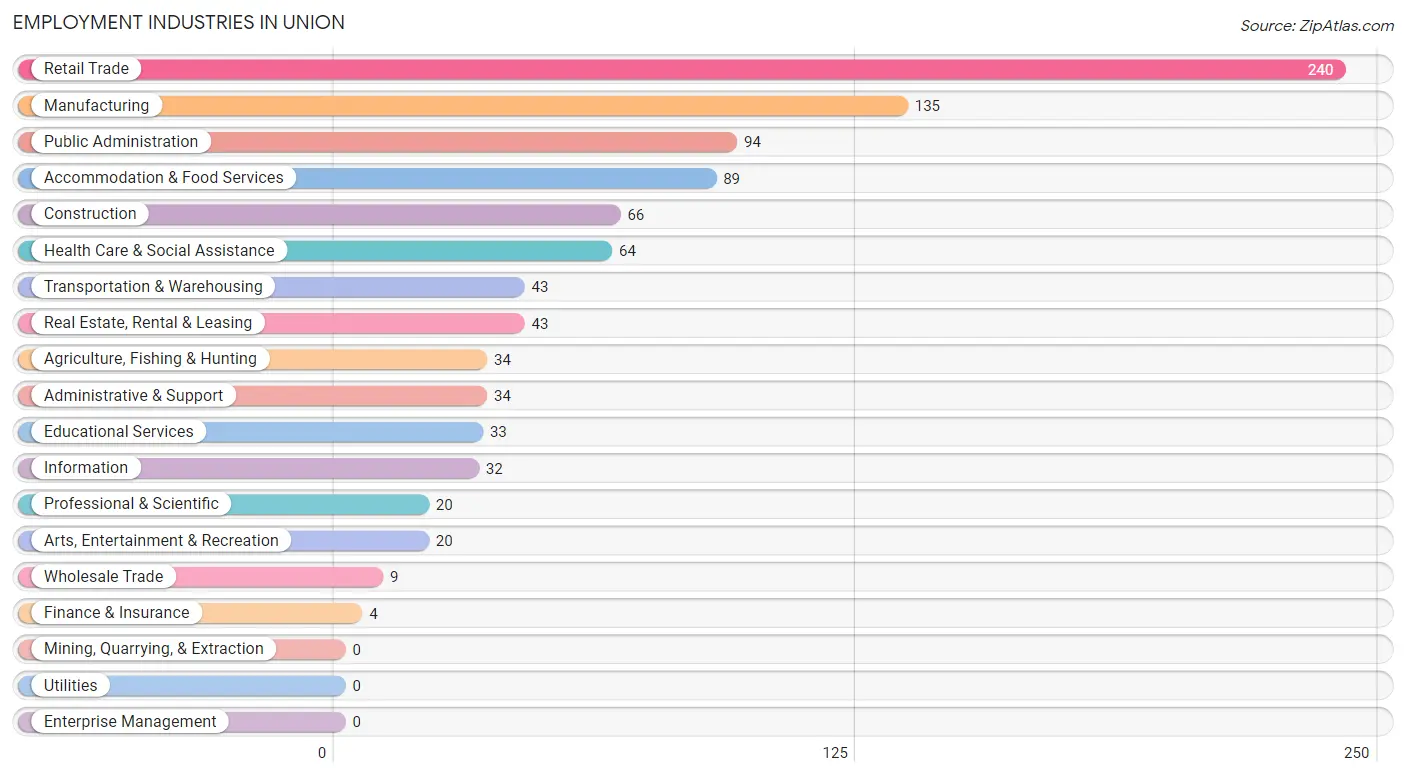
Employment Industries in Union
The major employment industries in Union include Retail Trade (240 | 22.9%), Manufacturing (135 | 12.9%), Public Administration (94 | 9.0%), Accommodation & Food Services (89 | 8.5%), and Construction (66 | 6.3%).
Employment Industries by Sex in Union
The Union industries that see more men than women are Wholesale Trade (100.0%), Transportation & Warehousing (100.0%), and Real Estate, Rental & Leasing (100.0%), whereas the industries that tend to have a higher number of women are Educational Services (97.0%), Accommodation & Food Services (66.3%), and Retail Trade (65.8%).
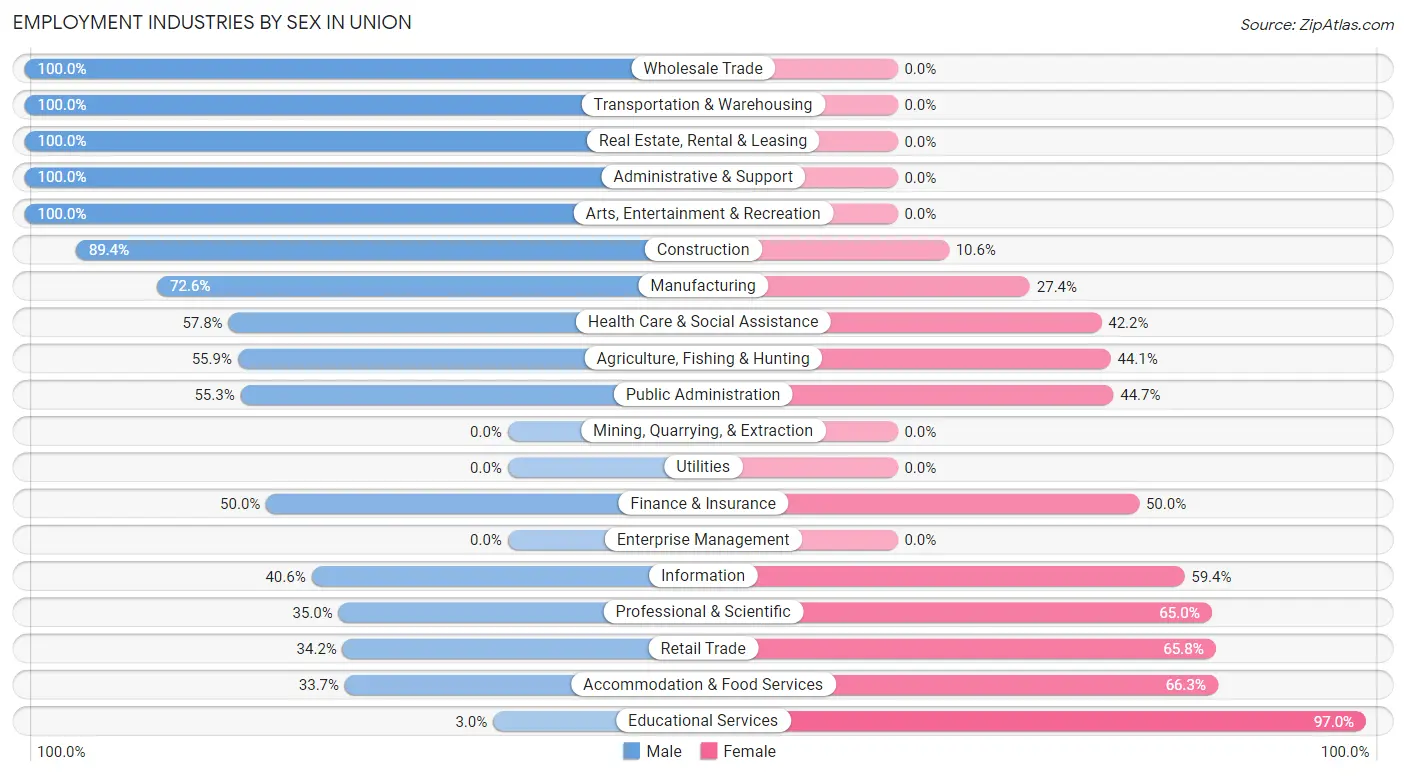
| Industry | Male | Female |
| Agriculture, Fishing & Hunting | 19 (55.9%) | 15 (44.1%) |
| Mining, Quarrying, & Extraction | 0 (0.0%) | 0 (0.0%) |
| Construction | 59 (89.4%) | 7 (10.6%) |
| Manufacturing | 98 (72.6%) | 37 (27.4%) |
| Wholesale Trade | 9 (100.0%) | 0 (0.0%) |
| Retail Trade | 82 (34.2%) | 158 (65.8%) |
| Transportation & Warehousing | 43 (100.0%) | 0 (0.0%) |
| Utilities | 0 (0.0%) | 0 (0.0%) |
| Information | 13 (40.6%) | 19 (59.4%) |
| Finance & Insurance | 2 (50.0%) | 2 (50.0%) |
| Real Estate, Rental & Leasing | 43 (100.0%) | 0 (0.0%) |
| Professional & Scientific | 7 (35.0%) | 13 (65.0%) |
| Enterprise Management | 0 (0.0%) | 0 (0.0%) |
| Administrative & Support | 34 (100.0%) | 0 (0.0%) |
| Educational Services | 1 (3.0%) | 32 (97.0%) |
| Health Care & Social Assistance | 37 (57.8%) | 27 (42.2%) |
| Arts, Entertainment & Recreation | 20 (100.0%) | 0 (0.0%) |
| Accommodation & Food Services | 30 (33.7%) | 59 (66.3%) |
| Public Administration | 52 (55.3%) | 42 (44.7%) |
| Total | 581 (55.4%) | 468 (44.6%) |
Education in Union
School Enrollment in Union
The most common levels of schooling among the 365 students in Union are elementary school (89 | 24.4%), middle school (85 | 23.3%), and high school (73 | 20.0%).
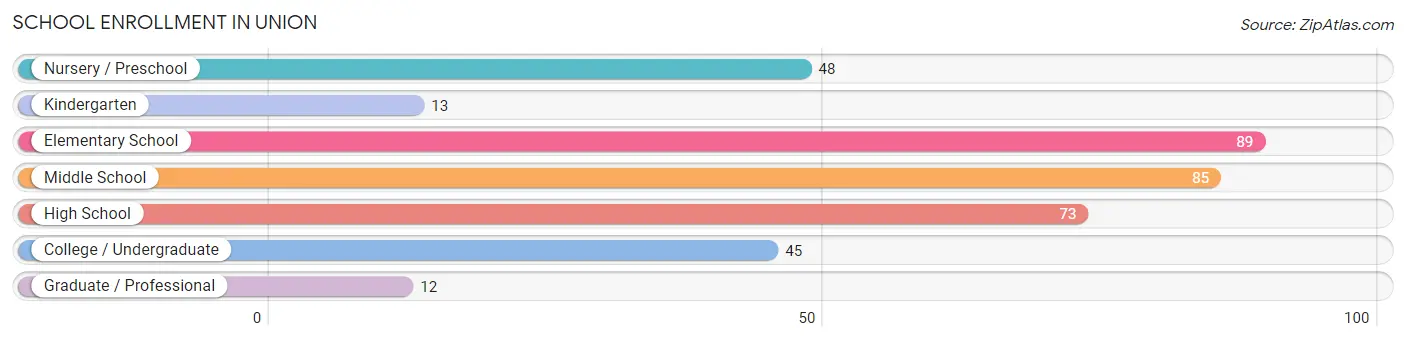
| School Level | # Students | % Students |
| Nursery / Preschool | 48 | 13.2% |
| Kindergarten | 13 | 3.6% |
| Elementary School | 89 | 24.4% |
| Middle School | 85 | 23.3% |
| High School | 73 | 20.0% |
| College / Undergraduate | 45 | 12.3% |
| Graduate / Professional | 12 | 3.3% |
| Total | 365 | 100.0% |
School Enrollment by Age by Funding Source in Union
Out of a total of 365 students who are enrolled in schools in Union, 40 (11.0%) attend a private institution, while the remaining 325 (89.0%) are enrolled in public schools. The age group of 18 to 19 year olds has the highest likelihood of being enrolled in private schools, with 20 (90.9% in the age bracket) enrolled. Conversely, the age group of 3 to 4 year olds has the lowest likelihood of being enrolled in a private school, with 30 (100.0% in the age bracket) attending a public institution.
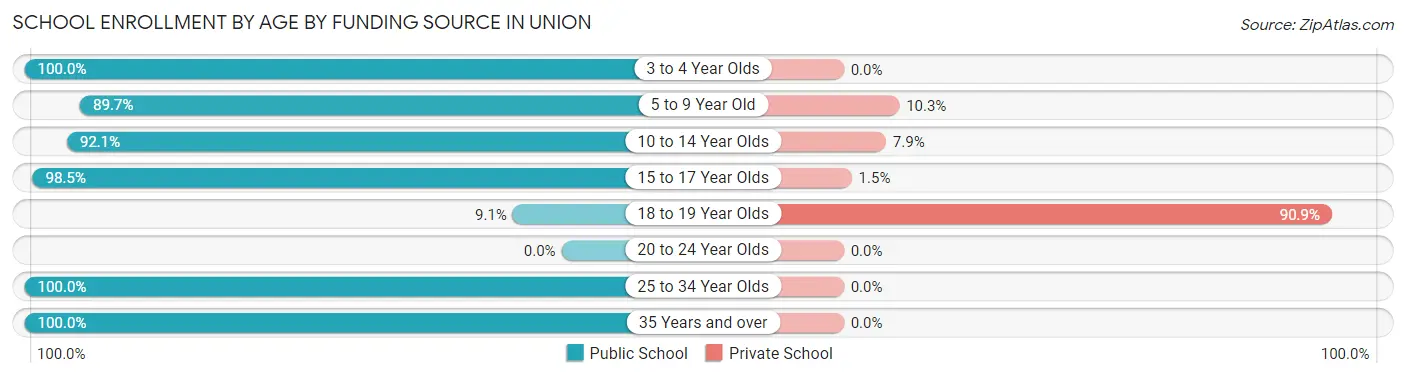
| Age Bracket | Public School | Private School |
| 3 to 4 Year Olds | 30 (100.0%) | 0 (0.0%) |
| 5 to 9 Year Old | 104 (89.7%) | 12 (10.3%) |
| 10 to 14 Year Olds | 82 (92.1%) | 7 (7.9%) |
| 15 to 17 Year Olds | 66 (98.5%) | 1 (1.5%) |
| 18 to 19 Year Olds | 2 (9.1%) | 20 (90.9%) |
| 20 to 24 Year Olds | 0 (0.0%) | 0 (0.0%) |
| 25 to 34 Year Olds | 12 (100.0%) | 0 (0.0%) |
| 35 Years and over | 29 (100.0%) | 0 (0.0%) |
| Total | 325 (89.0%) | 40 (11.0%) |
Educational Attainment by Field of Study in Union
Education (44 | 22.8%), liberal arts & history (35 | 18.1%), science & technology (30 | 15.5%), business (22 | 11.4%), and bio, nature & agricultural (16 | 8.3%) are the most common fields of study among 193 individuals in Union who have obtained a bachelor's degree or higher.
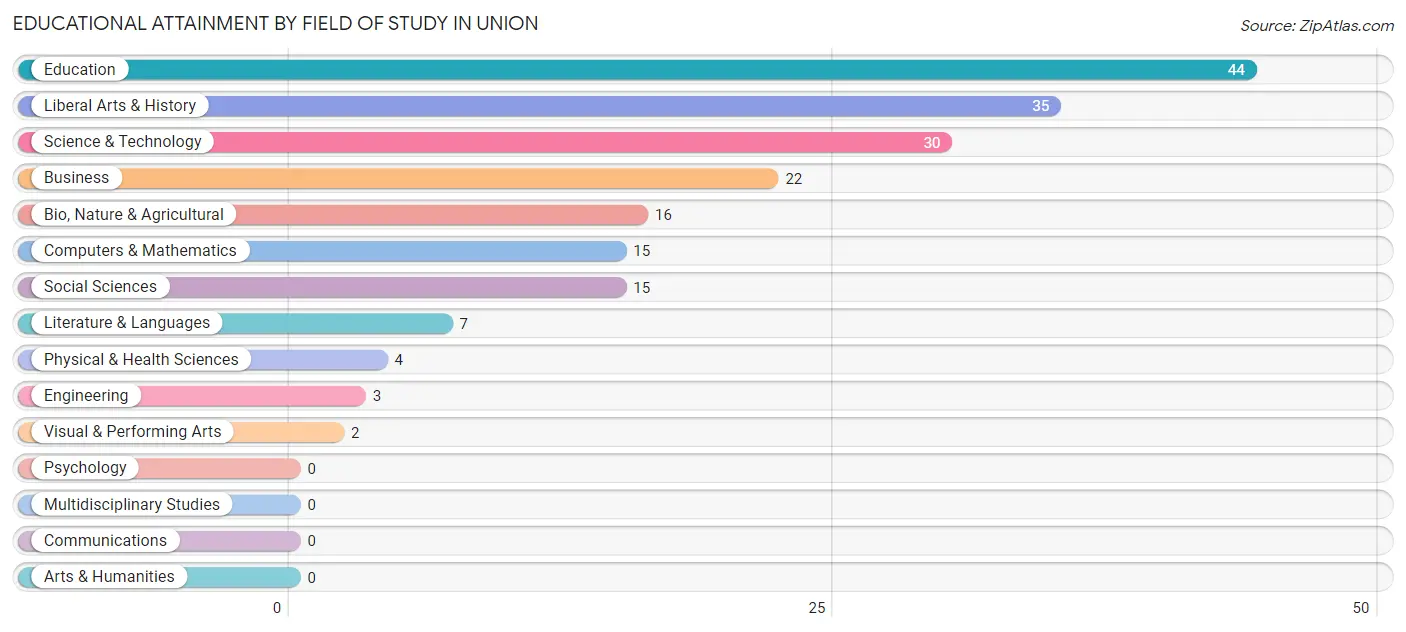
| Field of Study | # Graduates | % Graduates |
| Computers & Mathematics | 15 | 7.8% |
| Bio, Nature & Agricultural | 16 | 8.3% |
| Physical & Health Sciences | 4 | 2.1% |
| Psychology | 0 | 0.0% |
| Social Sciences | 15 | 7.8% |
| Engineering | 3 | 1.5% |
| Multidisciplinary Studies | 0 | 0.0% |
| Science & Technology | 30 | 15.5% |
| Business | 22 | 11.4% |
| Education | 44 | 22.8% |
| Literature & Languages | 7 | 3.6% |
| Liberal Arts & History | 35 | 18.1% |
| Visual & Performing Arts | 2 | 1.0% |
| Communications | 0 | 0.0% |
| Arts & Humanities | 0 | 0.0% |
| Total | 193 | 100.0% |
Transportation & Commute in Union
Vehicle Availability by Sex in Union
The most prevalent vehicle ownership categories in Union are males with 2 vehicles (252, accounting for 43.4%) and females with 2 vehicles (206, making up 52.5%).
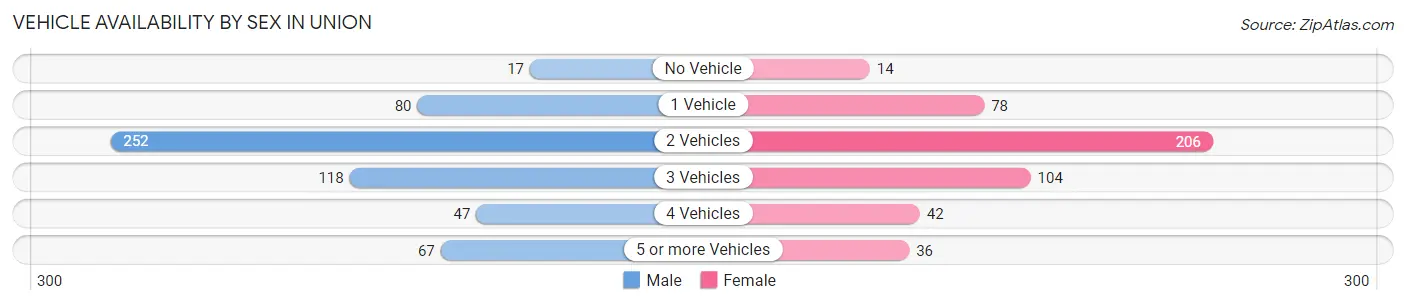
| Vehicles Available | Male | Female |
| No Vehicle | 17 (2.9%) | 14 (2.9%) |
| 1 Vehicle | 80 (13.8%) | 78 (16.3%) |
| 2 Vehicles | 252 (43.4%) | 206 (42.9%) |
| 3 Vehicles | 118 (20.3%) | 104 (21.7%) |
| 4 Vehicles | 47 (8.1%) | 42 (8.7%) |
| 5 or more Vehicles | 67 (11.5%) | 36 (7.5%) |
| Total | 581 (100.0%) | 480 (100.0%) |
Commute Time in Union
The most frequently occuring commute durations in Union are 20 to 24 minutes (229 commuters, 23.2%), 15 to 19 minutes (207 commuters, 21.0%), and less than 5 minutes (158 commuters, 16.0%).
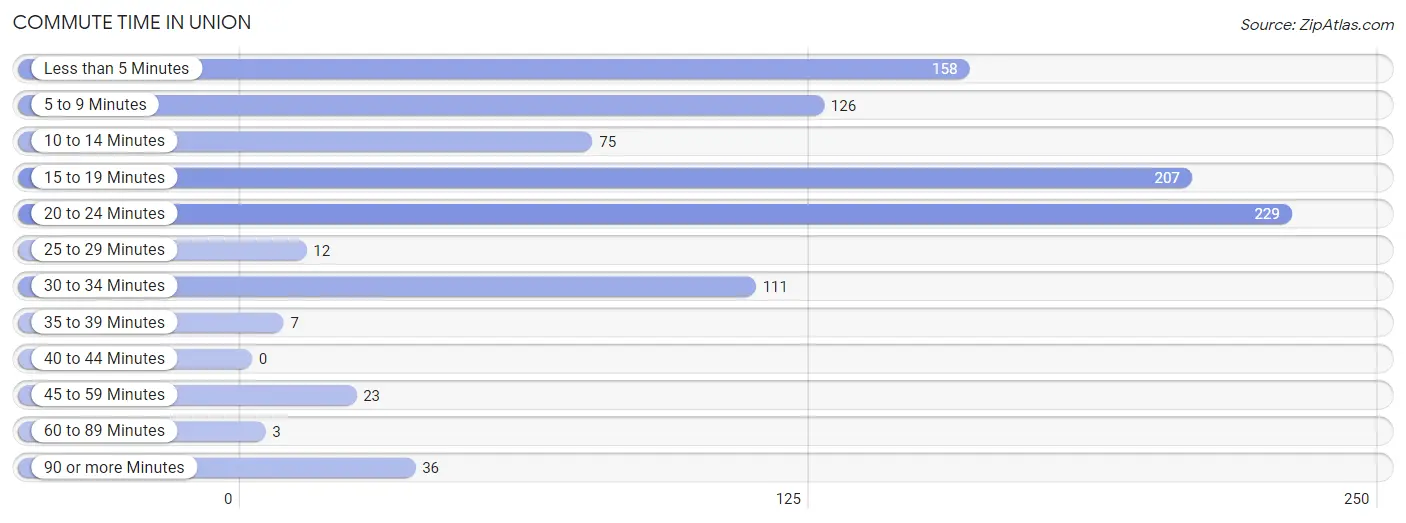
| Commute Time | # Commuters | % Commuters |
| Less than 5 Minutes | 158 | 16.0% |
| 5 to 9 Minutes | 126 | 12.8% |
| 10 to 14 Minutes | 75 | 7.6% |
| 15 to 19 Minutes | 207 | 21.0% |
| 20 to 24 Minutes | 229 | 23.2% |
| 25 to 29 Minutes | 12 | 1.2% |
| 30 to 34 Minutes | 111 | 11.3% |
| 35 to 39 Minutes | 7 | 0.7% |
| 40 to 44 Minutes | 0 | 0.0% |
| 45 to 59 Minutes | 23 | 2.3% |
| 60 to 89 Minutes | 3 | 0.3% |
| 90 or more Minutes | 36 | 3.6% |
Commute Time by Sex in Union
The most common commute times in Union are 20 to 24 minutes (137 commuters, 25.3%) for males and less than 5 minutes (121 commuters, 27.2%) for females.
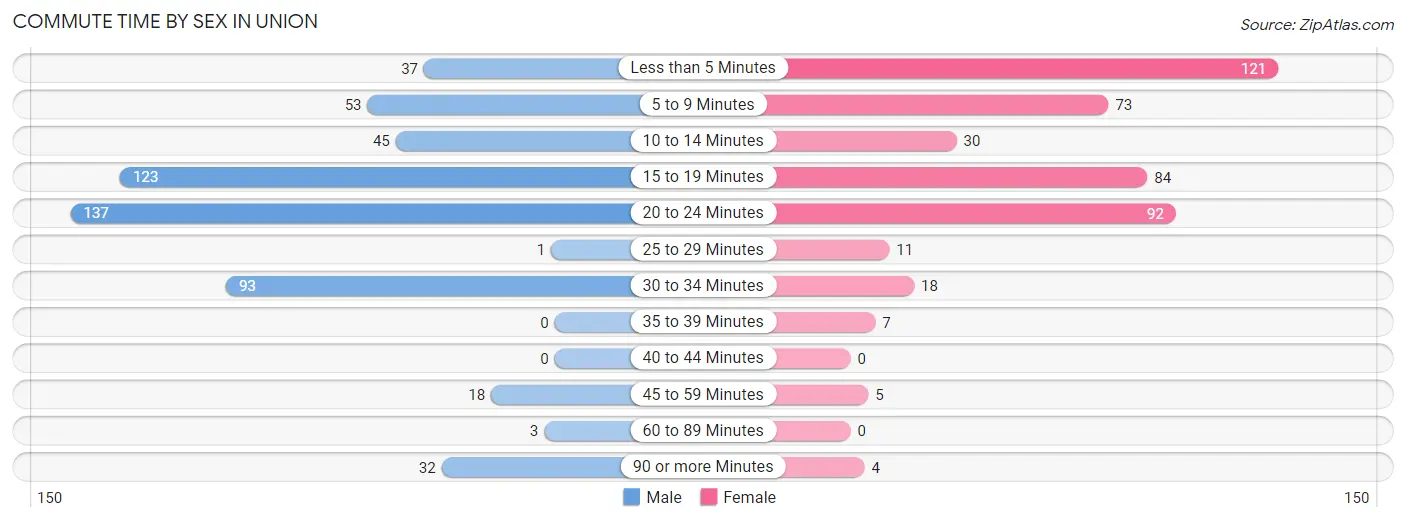
| Commute Time | Male | Female |
| Less than 5 Minutes | 37 (6.8%) | 121 (27.2%) |
| 5 to 9 Minutes | 53 (9.8%) | 73 (16.4%) |
| 10 to 14 Minutes | 45 (8.3%) | 30 (6.7%) |
| 15 to 19 Minutes | 123 (22.7%) | 84 (18.9%) |
| 20 to 24 Minutes | 137 (25.3%) | 92 (20.7%) |
| 25 to 29 Minutes | 1 (0.2%) | 11 (2.5%) |
| 30 to 34 Minutes | 93 (17.2%) | 18 (4.0%) |
| 35 to 39 Minutes | 0 (0.0%) | 7 (1.6%) |
| 40 to 44 Minutes | 0 (0.0%) | 0 (0.0%) |
| 45 to 59 Minutes | 18 (3.3%) | 5 (1.1%) |
| 60 to 89 Minutes | 3 (0.5%) | 0 (0.0%) |
| 90 or more Minutes | 32 (5.9%) | 4 (0.9%) |
Time of Departure to Work by Sex in Union
The most frequent times of departure to work in Union are 6:30 AM to 6:59 AM (129, 23.8%) for males and 8:30 AM to 8:59 AM (95, 21.3%) for females.
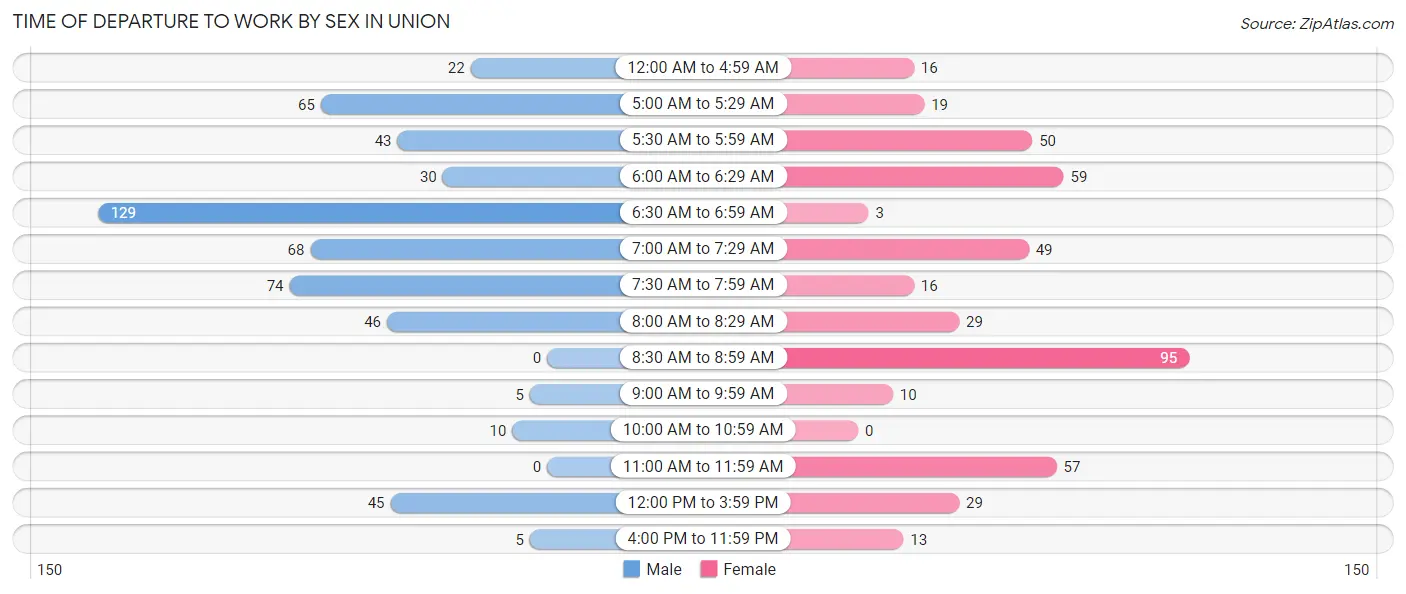
| Time of Departure | Male | Female |
| 12:00 AM to 4:59 AM | 22 (4.1%) | 16 (3.6%) |
| 5:00 AM to 5:29 AM | 65 (12.0%) | 19 (4.3%) |
| 5:30 AM to 5:59 AM | 43 (7.9%) | 50 (11.2%) |
| 6:00 AM to 6:29 AM | 30 (5.5%) | 59 (13.3%) |
| 6:30 AM to 6:59 AM | 129 (23.8%) | 3 (0.7%) |
| 7:00 AM to 7:29 AM | 68 (12.6%) | 49 (11.0%) |
| 7:30 AM to 7:59 AM | 74 (13.7%) | 16 (3.6%) |
| 8:00 AM to 8:29 AM | 46 (8.5%) | 29 (6.5%) |
| 8:30 AM to 8:59 AM | 0 (0.0%) | 95 (21.3%) |
| 9:00 AM to 9:59 AM | 5 (0.9%) | 10 (2.2%) |
| 10:00 AM to 10:59 AM | 10 (1.8%) | 0 (0.0%) |
| 11:00 AM to 11:59 AM | 0 (0.0%) | 57 (12.8%) |
| 12:00 PM to 3:59 PM | 45 (8.3%) | 29 (6.5%) |
| 4:00 PM to 11:59 PM | 5 (0.9%) | 13 (2.9%) |
| Total | 542 (100.0%) | 445 (100.0%) |
Housing Occupancy in Union
Occupancy by Ownership in Union
Of the total 978 dwellings in Union, owner-occupied units account for 665 (68.0%), while renter-occupied units make up 313 (32.0%).
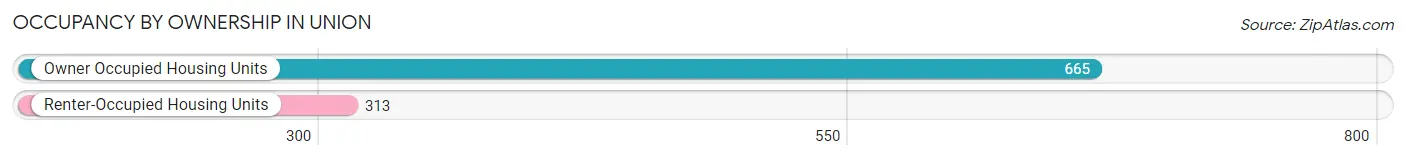
| Occupancy | # Housing Units | % Housing Units |
| Owner Occupied Housing Units | 665 | 68.0% |
| Renter-Occupied Housing Units | 313 | 32.0% |
| Total Occupied Housing Units | 978 | 100.0% |
Occupancy by Household Size in Union
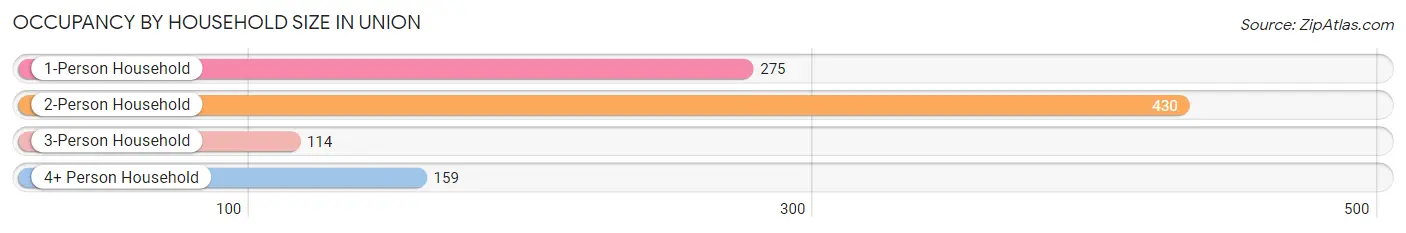
| Household Size | # Housing Units | % Housing Units |
| 1-Person Household | 275 | 28.1% |
| 2-Person Household | 430 | 44.0% |
| 3-Person Household | 114 | 11.7% |
| 4+ Person Household | 159 | 16.3% |
| Total Housing Units | 978 | 100.0% |
Occupancy by Ownership by Household Size in Union
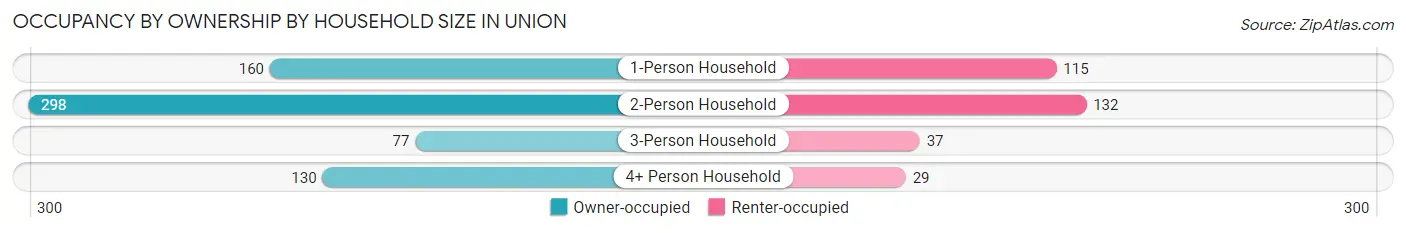
| Household Size | Owner-occupied | Renter-occupied |
| 1-Person Household | 160 (58.2%) | 115 (41.8%) |
| 2-Person Household | 298 (69.3%) | 132 (30.7%) |
| 3-Person Household | 77 (67.5%) | 37 (32.5%) |
| 4+ Person Household | 130 (81.8%) | 29 (18.2%) |
| Total Housing Units | 665 (68.0%) | 313 (32.0%) |
Occupancy by Educational Attainment in Union
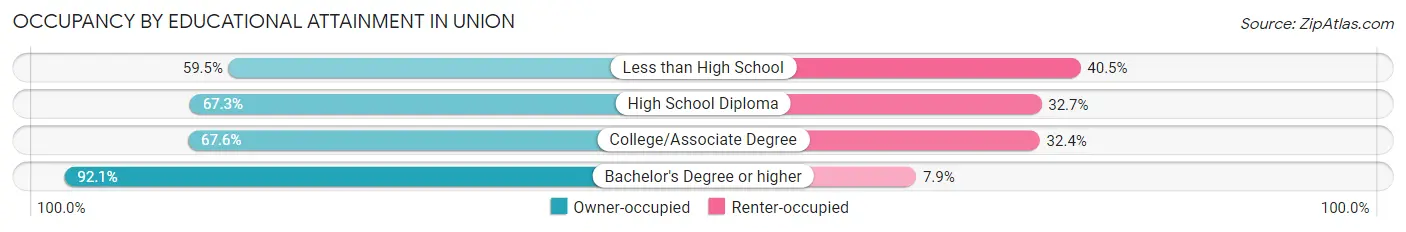
| Household Size | Owner-occupied | Renter-occupied |
| Less than High School | 100 (59.5%) | 68 (40.5%) |
| High School Diploma | 228 (67.3%) | 111 (32.7%) |
| College/Associate Degree | 267 (67.6%) | 128 (32.4%) |
| Bachelor's Degree or higher | 70 (92.1%) | 6 (7.9%) |
Occupancy by Age of Householder in Union
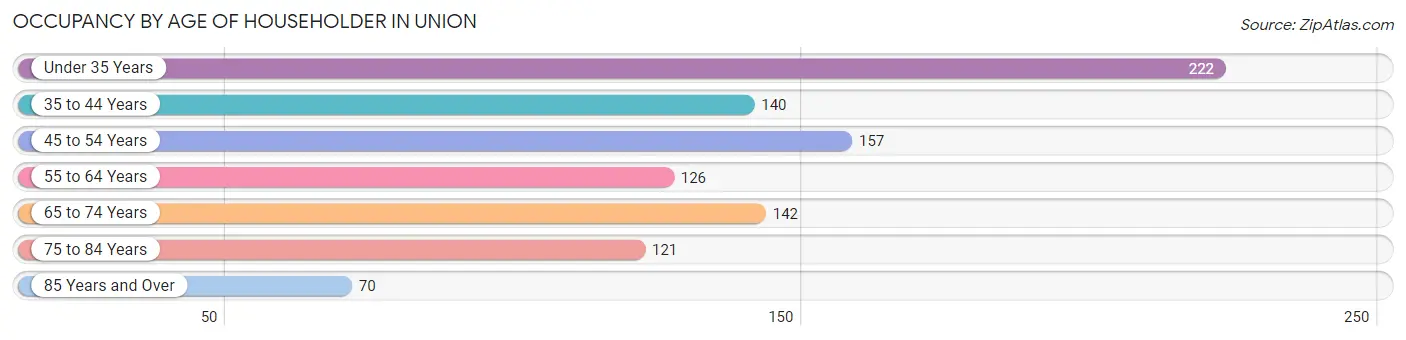
| Age Bracket | # Households | % Households |
| Under 35 Years | 222 | 22.7% |
| 35 to 44 Years | 140 | 14.3% |
| 45 to 54 Years | 157 | 16.1% |
| 55 to 64 Years | 126 | 12.9% |
| 65 to 74 Years | 142 | 14.5% |
| 75 to 84 Years | 121 | 12.4% |
| 85 Years and Over | 70 | 7.2% |
| Total | 978 | 100.0% |
Housing Finances in Union
Median Income by Occupancy in Union
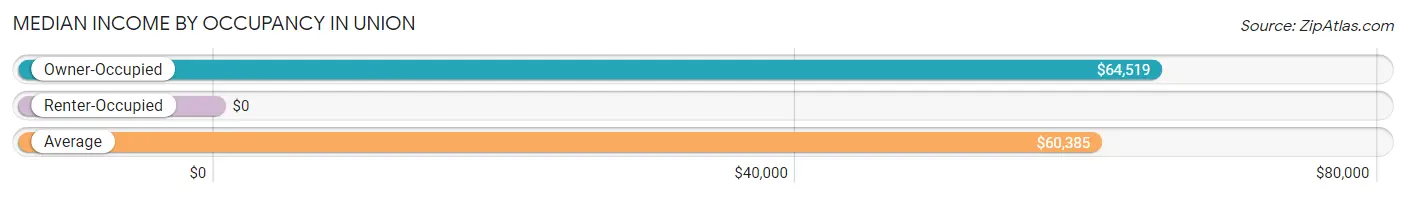
| Occupancy Type | # Households | Median Income |
| Owner-Occupied | 665 (68.0%) | $64,519 |
| Renter-Occupied | 313 (32.0%) | $0 |
| Average | 978 (100.0%) | $60,385 |
Occupancy by Householder Income Bracket in Union
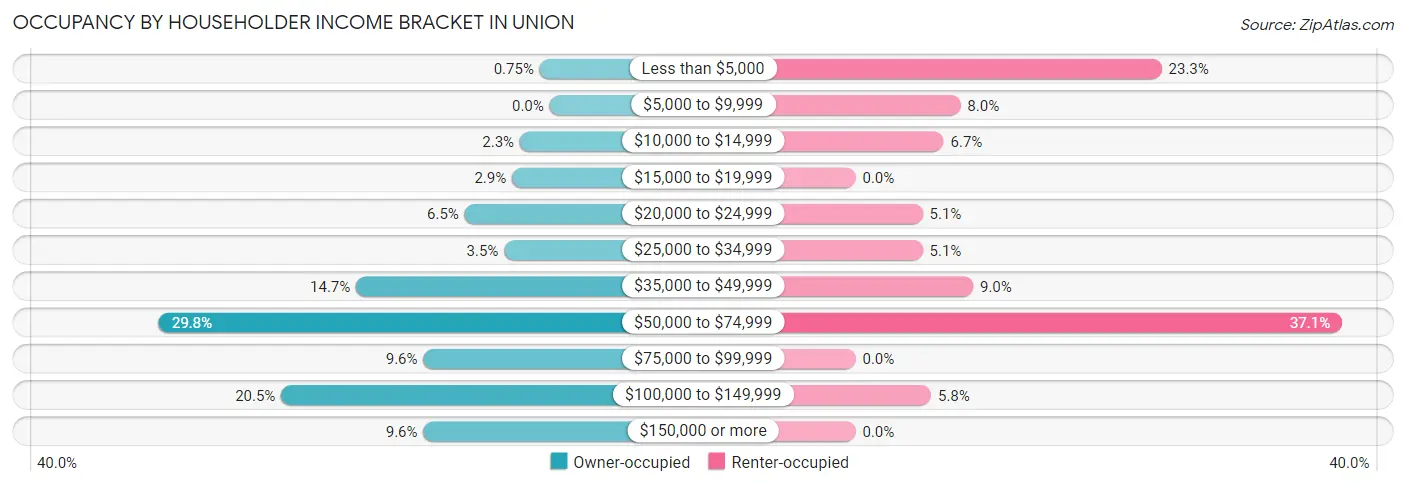
| Income Bracket | Owner-occupied | Renter-occupied |
| Less than $5,000 | 5 (0.7%) | 73 (23.3%) |
| $5,000 to $9,999 | 0 (0.0%) | 25 (8.0%) |
| $10,000 to $14,999 | 15 (2.3%) | 21 (6.7%) |
| $15,000 to $19,999 | 19 (2.9%) | 0 (0.0%) |
| $20,000 to $24,999 | 43 (6.5%) | 16 (5.1%) |
| $25,000 to $34,999 | 23 (3.5%) | 16 (5.1%) |
| $35,000 to $49,999 | 98 (14.7%) | 28 (8.9%) |
| $50,000 to $74,999 | 198 (29.8%) | 116 (37.1%) |
| $75,000 to $99,999 | 64 (9.6%) | 0 (0.0%) |
| $100,000 to $149,999 | 136 (20.4%) | 18 (5.8%) |
| $150,000 or more | 64 (9.6%) | 0 (0.0%) |
| Total | 665 (100.0%) | 313 (100.0%) |
Monthly Housing Cost Tiers in Union
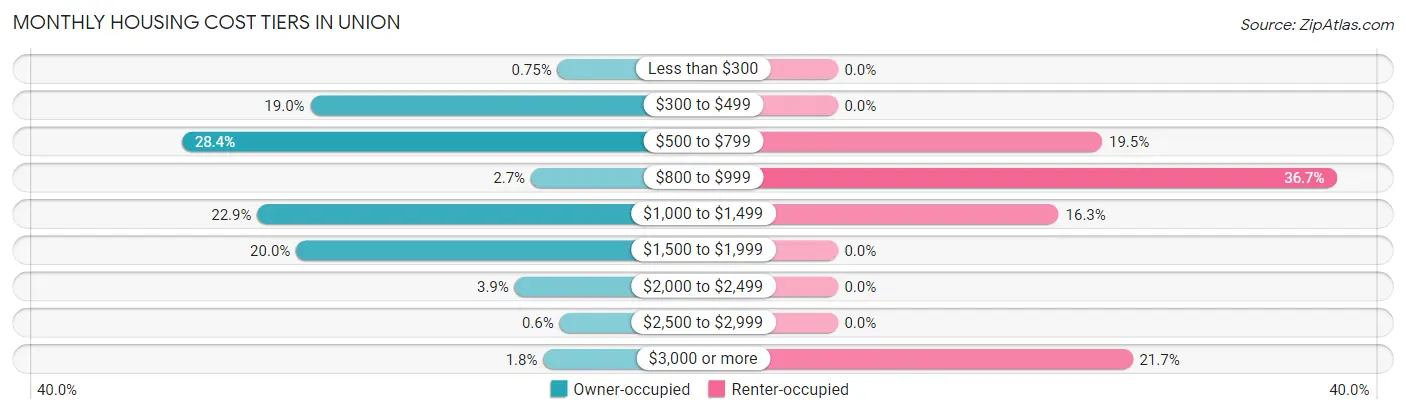
| Monthly Cost | Owner-occupied | Renter-occupied |
| Less than $300 | 5 (0.7%) | 0 (0.0%) |
| $300 to $499 | 126 (19.0%) | 0 (0.0%) |
| $500 to $799 | 189 (28.4%) | 61 (19.5%) |
| $800 to $999 | 18 (2.7%) | 115 (36.7%) |
| $1,000 to $1,499 | 152 (22.9%) | 51 (16.3%) |
| $1,500 to $1,999 | 133 (20.0%) | 0 (0.0%) |
| $2,000 to $2,499 | 26 (3.9%) | 0 (0.0%) |
| $2,500 to $2,999 | 4 (0.6%) | 0 (0.0%) |
| $3,000 or more | 12 (1.8%) | 68 (21.7%) |
| Total | 665 (100.0%) | 313 (100.0%) |
Physical Housing Characteristics in Union
Housing Structures in Union
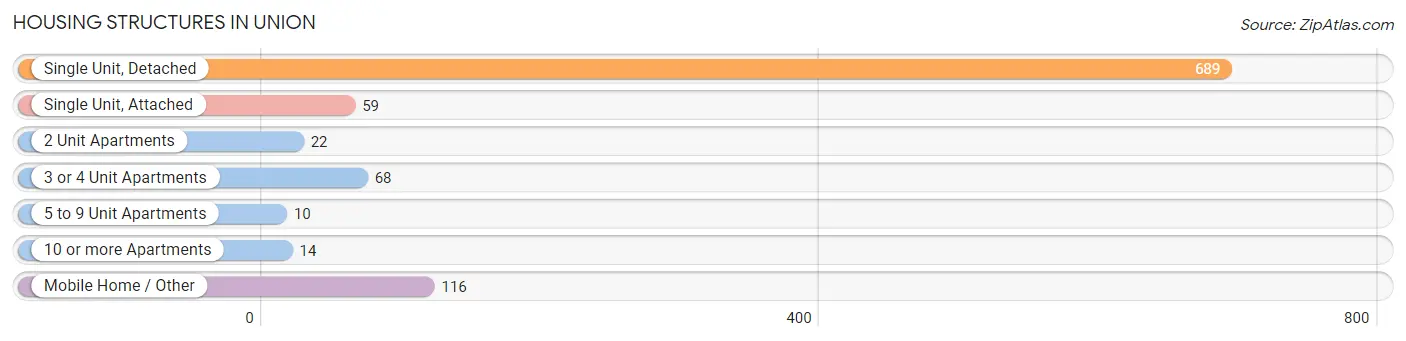
| Structure Type | # Housing Units | % Housing Units |
| Single Unit, Detached | 689 | 70.5% |
| Single Unit, Attached | 59 | 6.0% |
| 2 Unit Apartments | 22 | 2.2% |
| 3 or 4 Unit Apartments | 68 | 7.0% |
| 5 to 9 Unit Apartments | 10 | 1.0% |
| 10 or more Apartments | 14 | 1.4% |
| Mobile Home / Other | 116 | 11.9% |
| Total | 978 | 100.0% |
Housing Structures by Occupancy in Union
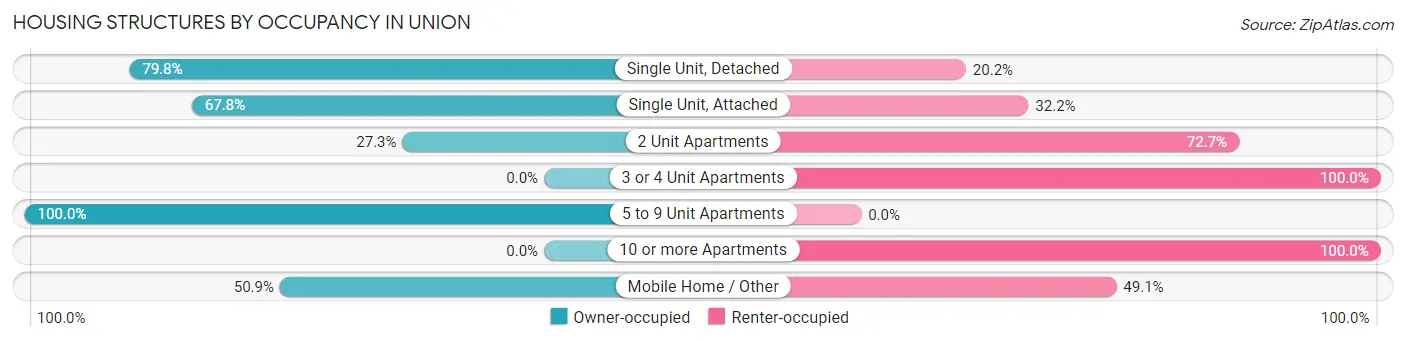
| Structure Type | Owner-occupied | Renter-occupied |
| Single Unit, Detached | 550 (79.8%) | 139 (20.2%) |
| Single Unit, Attached | 40 (67.8%) | 19 (32.2%) |
| 2 Unit Apartments | 6 (27.3%) | 16 (72.7%) |
| 3 or 4 Unit Apartments | 0 (0.0%) | 68 (100.0%) |
| 5 to 9 Unit Apartments | 10 (100.0%) | 0 (0.0%) |
| 10 or more Apartments | 0 (0.0%) | 14 (100.0%) |
| Mobile Home / Other | 59 (50.9%) | 57 (49.1%) |
| Total | 665 (68.0%) | 313 (32.0%) |
Housing Structures by Number of Rooms in Union
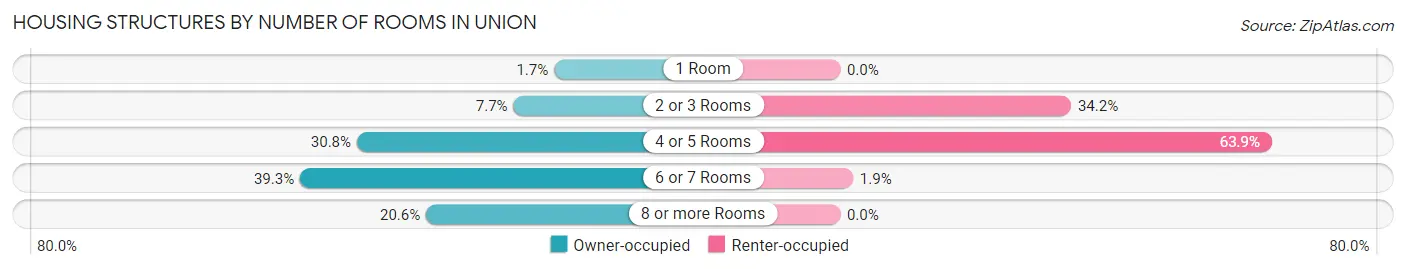
| Number of Rooms | Owner-occupied | Renter-occupied |
| 1 Room | 11 (1.7%) | 0 (0.0%) |
| 2 or 3 Rooms | 51 (7.7%) | 107 (34.2%) |
| 4 or 5 Rooms | 205 (30.8%) | 200 (63.9%) |
| 6 or 7 Rooms | 261 (39.3%) | 6 (1.9%) |
| 8 or more Rooms | 137 (20.6%) | 0 (0.0%) |
| Total | 665 (100.0%) | 313 (100.0%) |
Housing Structure by Heating Type in Union
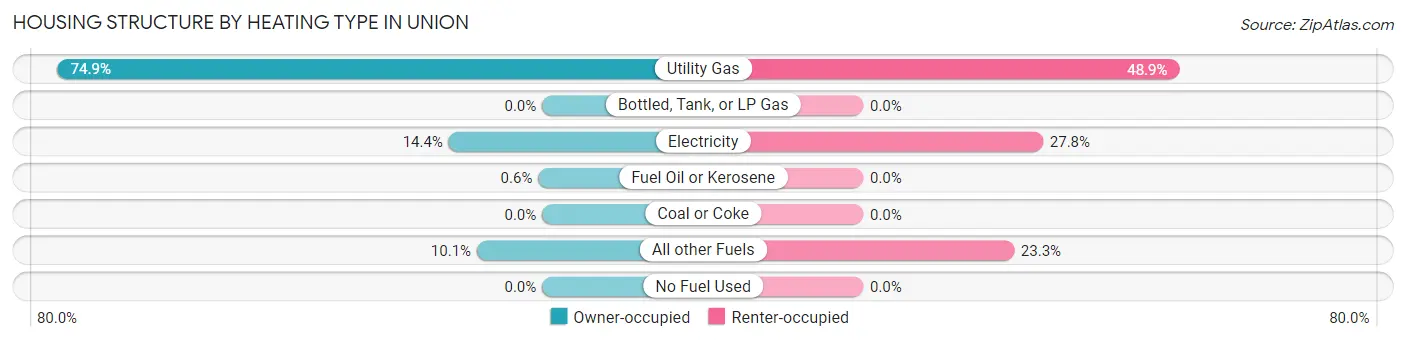
| Heating Type | Owner-occupied | Renter-occupied |
| Utility Gas | 498 (74.9%) | 153 (48.9%) |
| Bottled, Tank, or LP Gas | 0 (0.0%) | 0 (0.0%) |
| Electricity | 96 (14.4%) | 87 (27.8%) |
| Fuel Oil or Kerosene | 4 (0.6%) | 0 (0.0%) |
| Coal or Coke | 0 (0.0%) | 0 (0.0%) |
| All other Fuels | 67 (10.1%) | 73 (23.3%) |
| No Fuel Used | 0 (0.0%) | 0 (0.0%) |
| Total | 665 (100.0%) | 313 (100.0%) |
Household Vehicle Usage in Union
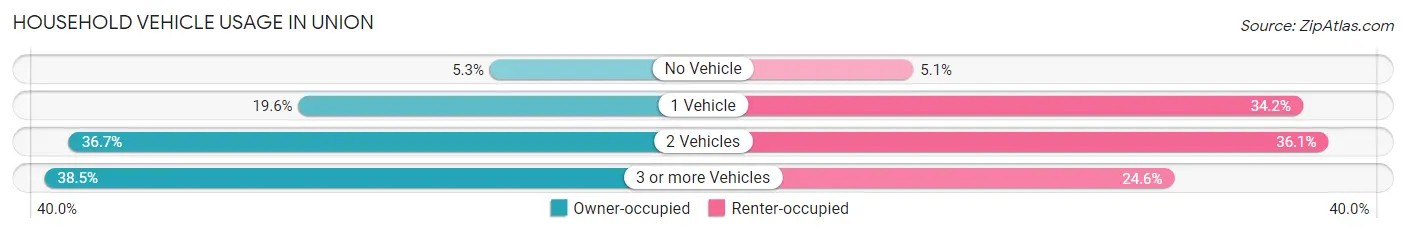
| Vehicles per Household | Owner-occupied | Renter-occupied |
| No Vehicle | 35 (5.3%) | 16 (5.1%) |
| 1 Vehicle | 130 (19.6%) | 107 (34.2%) |
| 2 Vehicles | 244 (36.7%) | 113 (36.1%) |
| 3 or more Vehicles | 256 (38.5%) | 77 (24.6%) |
| Total | 665 (100.0%) | 313 (100.0%) |
Real Estate & Mortgages in Union
Real Estate and Mortgage Overview in Union
| Characteristic | Without Mortgage | With Mortgage |
| Housing Units | 213 | 452 |
| Median Property Value | $170,600 | $216,500 |
| Median Household Income | $52,538 | $61 |
| Monthly Housing Costs | $458 | $12 |
| Real Estate Taxes | $1,211 | $0 |
Property Value by Mortgage Status in Union
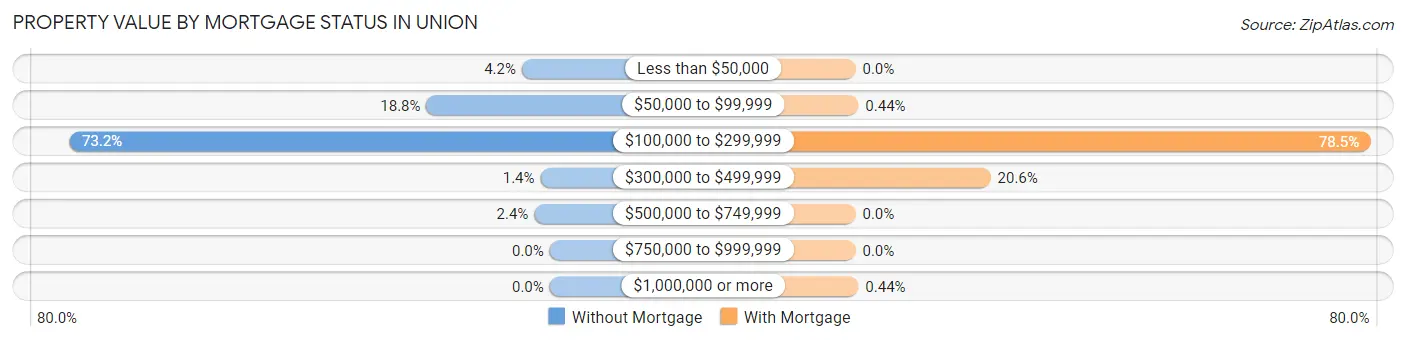
| Property Value | Without Mortgage | With Mortgage |
| Less than $50,000 | 9 (4.2%) | 0 (0.0%) |
| $50,000 to $99,999 | 40 (18.8%) | 2 (0.4%) |
| $100,000 to $299,999 | 156 (73.2%) | 355 (78.5%) |
| $300,000 to $499,999 | 3 (1.4%) | 93 (20.6%) |
| $500,000 to $749,999 | 5 (2.4%) | 0 (0.0%) |
| $750,000 to $999,999 | 0 (0.0%) | 0 (0.0%) |
| $1,000,000 or more | 0 (0.0%) | 2 (0.4%) |
| Total | 213 (100.0%) | 452 (100.0%) |
Household Income by Mortgage Status in Union
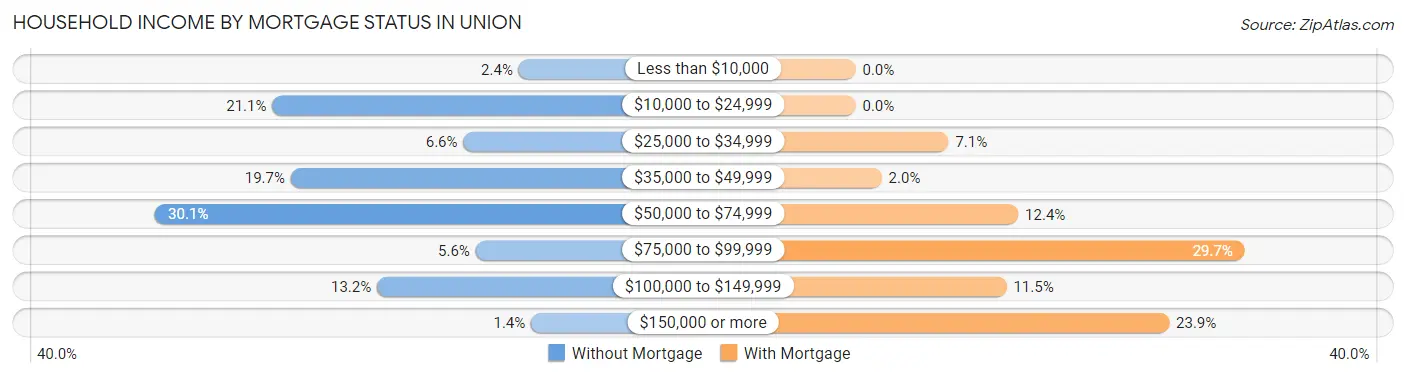
| Household Income | Without Mortgage | With Mortgage |
| Less than $10,000 | 5 (2.4%) | 0 (0.0%) |
| $10,000 to $24,999 | 45 (21.1%) | 0 (0.0%) |
| $25,000 to $34,999 | 14 (6.6%) | 32 (7.1%) |
| $35,000 to $49,999 | 42 (19.7%) | 9 (2.0%) |
| $50,000 to $74,999 | 64 (30.0%) | 56 (12.4%) |
| $75,000 to $99,999 | 12 (5.6%) | 134 (29.6%) |
| $100,000 to $149,999 | 28 (13.2%) | 52 (11.5%) |
| $150,000 or more | 3 (1.4%) | 108 (23.9%) |
| Total | 213 (100.0%) | 452 (100.0%) |
Property Value to Household Income Ratio in Union
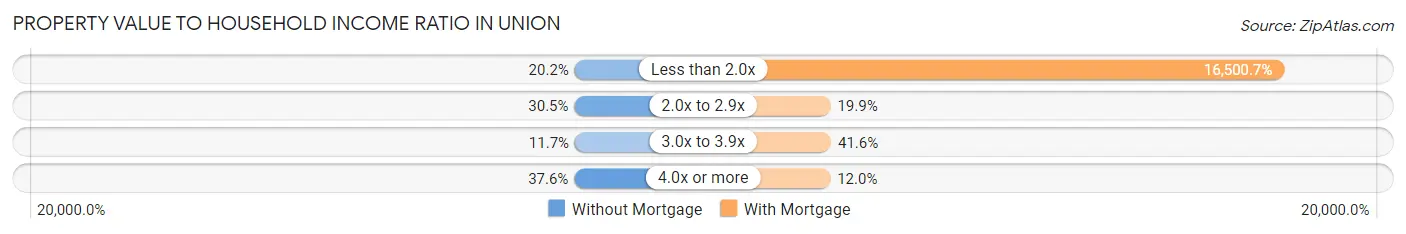
| Value-to-Income Ratio | Without Mortgage | With Mortgage |
| Less than 2.0x | 43 (20.2%) | 74,583 (16,500.7%) |
| 2.0x to 2.9x | 65 (30.5%) | 90 (19.9%) |
| 3.0x to 3.9x | 25 (11.7%) | 188 (41.6%) |
| 4.0x or more | 80 (37.6%) | 54 (11.9%) |
| Total | 213 (100.0%) | 452 (100.0%) |
Real Estate Taxes by Mortgage Status in Union
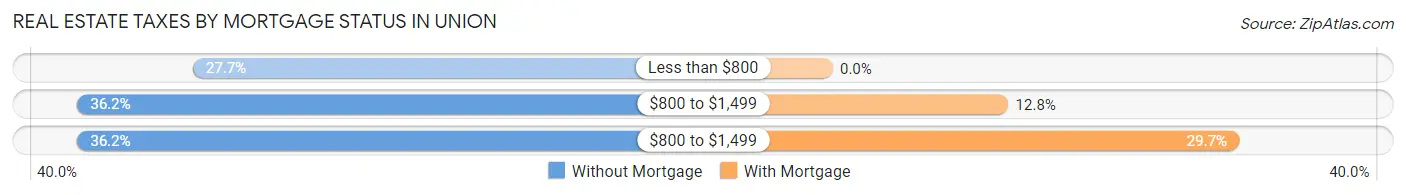
| Property Taxes | Without Mortgage | With Mortgage |
| Less than $800 | 59 (27.7%) | 0 (0.0%) |
| $800 to $1,499 | 77 (36.1%) | 58 (12.8%) |
| $800 to $1,499 | 77 (36.1%) | 134 (29.6%) |
| Total | 213 (100.0%) | 452 (100.0%) |
Health & Disability in Union
Health Insurance Coverage by Age in Union
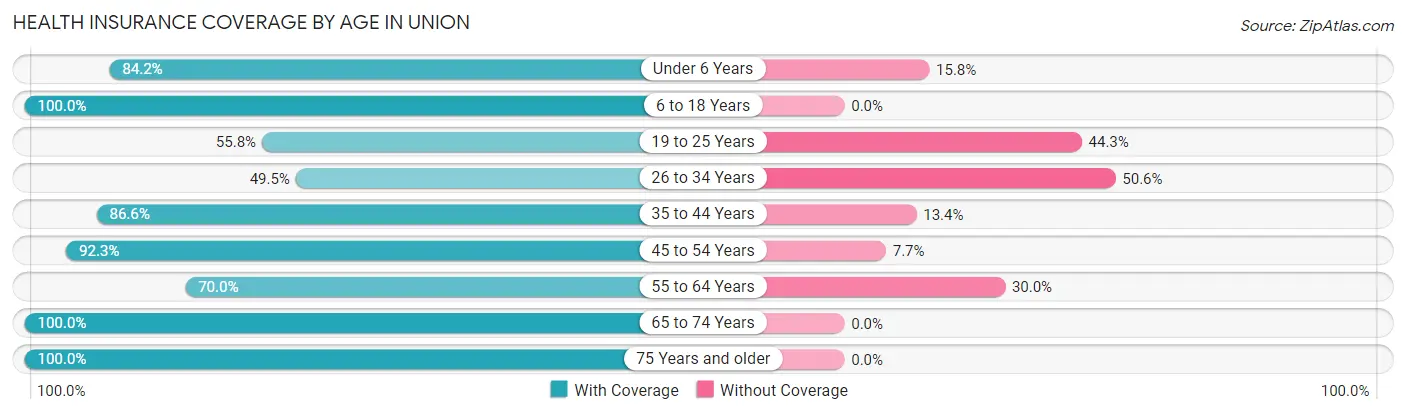
| Age Bracket | With Coverage | Without Coverage |
| Under 6 Years | 165 (84.2%) | 31 (15.8%) |
| 6 to 18 Years | 267 (100.0%) | 0 (0.0%) |
| 19 to 25 Years | 97 (55.7%) | 77 (44.3%) |
| 26 to 34 Years | 135 (49.4%) | 138 (50.5%) |
| 35 to 44 Years | 271 (86.6%) | 42 (13.4%) |
| 45 to 54 Years | 274 (92.3%) | 23 (7.7%) |
| 55 to 64 Years | 159 (70.0%) | 68 (30.0%) |
| 65 to 74 Years | 203 (100.0%) | 0 (0.0%) |
| 75 Years and older | 244 (100.0%) | 0 (0.0%) |
| Total | 1,815 (82.7%) | 379 (17.3%) |
Health Insurance Coverage by Citizenship Status in Union
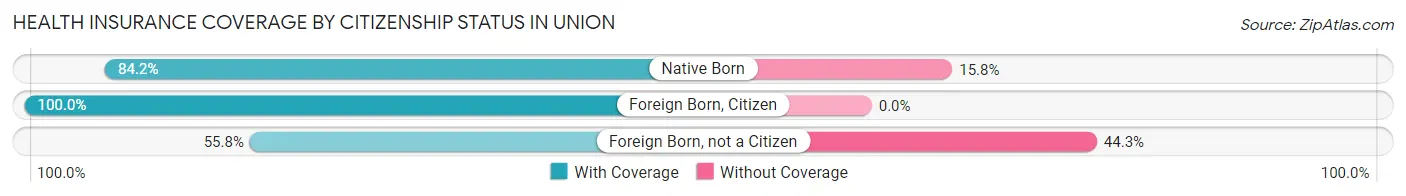
| Citizenship Status | With Coverage | Without Coverage |
| Native Born | 165 (84.2%) | 31 (15.8%) |
| Foreign Born, Citizen | 267 (100.0%) | 0 (0.0%) |
| Foreign Born, not a Citizen | 97 (55.7%) | 77 (44.3%) |
Health Insurance Coverage by Household Income in Union
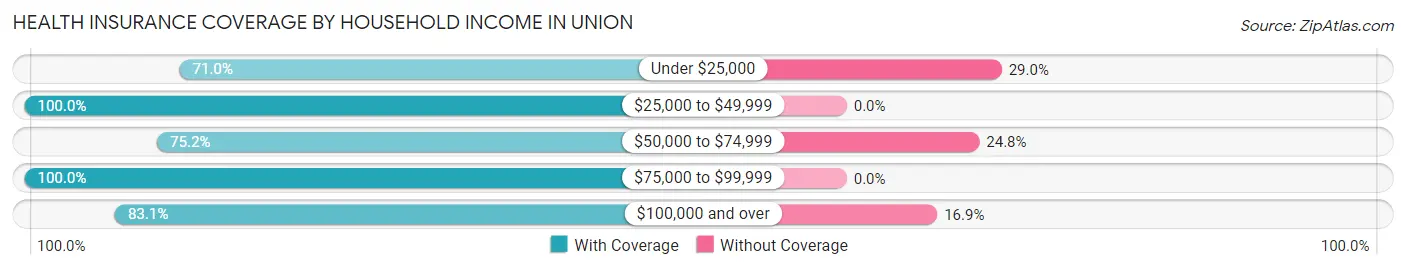
| Household Income | With Coverage | Without Coverage |
| Under $25,000 | 198 (71.0%) | 81 (29.0%) |
| $25,000 to $49,999 | 333 (100.0%) | 0 (0.0%) |
| $50,000 to $74,999 | 584 (75.2%) | 193 (24.8%) |
| $75,000 to $99,999 | 179 (100.0%) | 0 (0.0%) |
| $100,000 and over | 515 (83.1%) | 105 (16.9%) |
Public vs Private Health Insurance Coverage by Age in Union
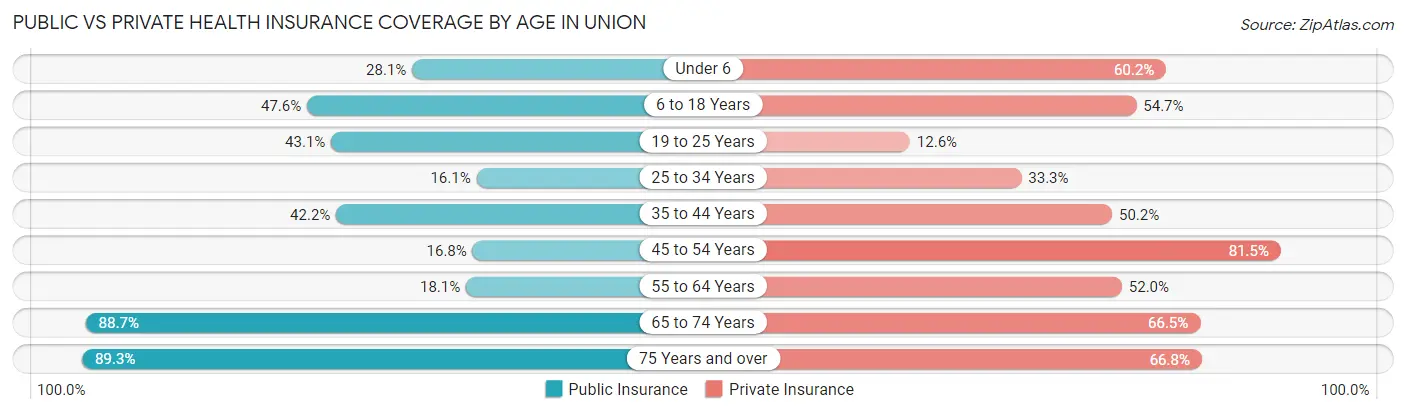
| Age Bracket | Public Insurance | Private Insurance |
| Under 6 | 55 (28.1%) | 118 (60.2%) |
| 6 to 18 Years | 127 (47.6%) | 146 (54.7%) |
| 19 to 25 Years | 75 (43.1%) | 22 (12.6%) |
| 25 to 34 Years | 44 (16.1%) | 91 (33.3%) |
| 35 to 44 Years | 132 (42.2%) | 157 (50.2%) |
| 45 to 54 Years | 50 (16.8%) | 242 (81.5%) |
| 55 to 64 Years | 41 (18.1%) | 118 (52.0%) |
| 65 to 74 Years | 180 (88.7%) | 135 (66.5%) |
| 75 Years and over | 218 (89.3%) | 163 (66.8%) |
| Total | 922 (42.0%) | 1,192 (54.3%) |
Disability Status by Sex by Age in Union
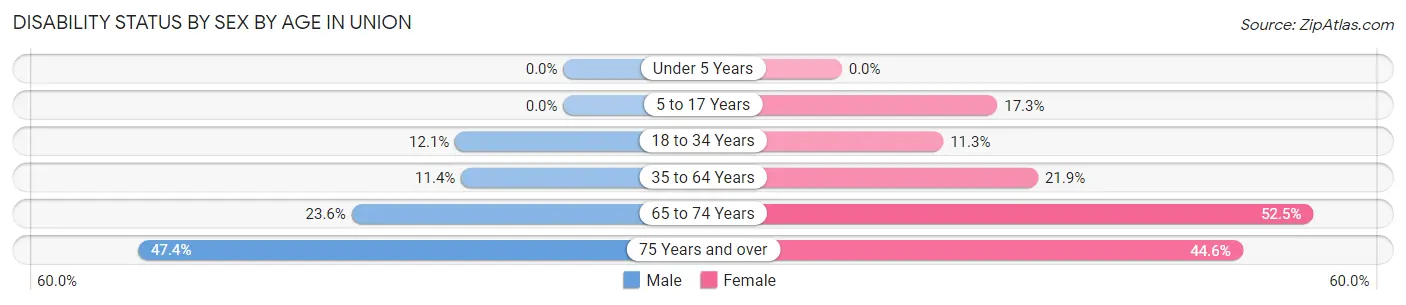
| Age Bracket | Male | Female |
| Under 5 Years | 0 (0.0%) | 0 (0.0%) |
| 5 to 17 Years | 0 (0.0%) | 22 (17.3%) |
| 18 to 34 Years | 20 (12.0%) | 34 (11.3%) |
| 35 to 64 Years | 51 (11.4%) | 85 (21.8%) |
| 65 to 74 Years | 29 (23.6%) | 42 (52.5%) |
| 75 Years and over | 54 (47.4%) | 58 (44.6%) |
Disability Class by Sex by Age in Union
Disability Class: Hearing Difficulty
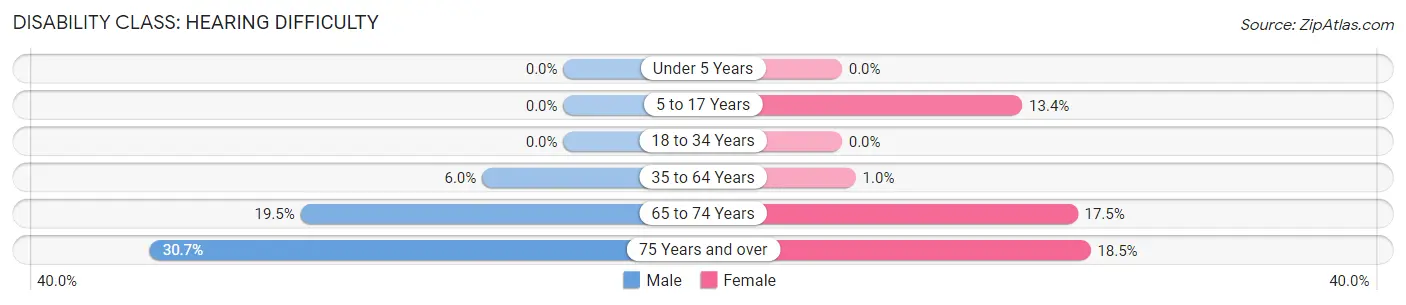
| Age Bracket | Male | Female |
| Under 5 Years | 0 (0.0%) | 0 (0.0%) |
| 5 to 17 Years | 0 (0.0%) | 17 (13.4%) |
| 18 to 34 Years | 0 (0.0%) | 0 (0.0%) |
| 35 to 64 Years | 27 (6.0%) | 4 (1.0%) |
| 65 to 74 Years | 24 (19.5%) | 14 (17.5%) |
| 75 Years and over | 35 (30.7%) | 24 (18.5%) |
Disability Class: Vision Difficulty
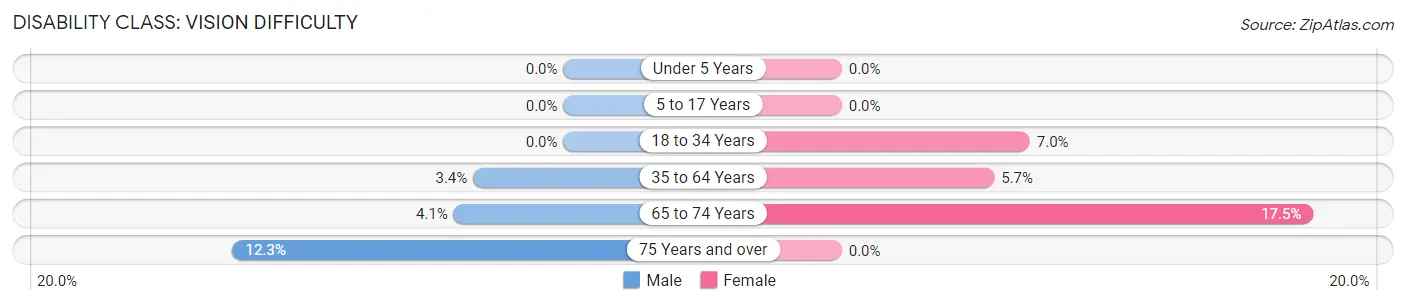
| Age Bracket | Male | Female |
| Under 5 Years | 0 (0.0%) | 0 (0.0%) |
| 5 to 17 Years | 0 (0.0%) | 0 (0.0%) |
| 18 to 34 Years | 0 (0.0%) | 21 (7.0%) |
| 35 to 64 Years | 15 (3.4%) | 22 (5.7%) |
| 65 to 74 Years | 5 (4.1%) | 14 (17.5%) |
| 75 Years and over | 14 (12.3%) | 0 (0.0%) |
Disability Class: Cognitive Difficulty
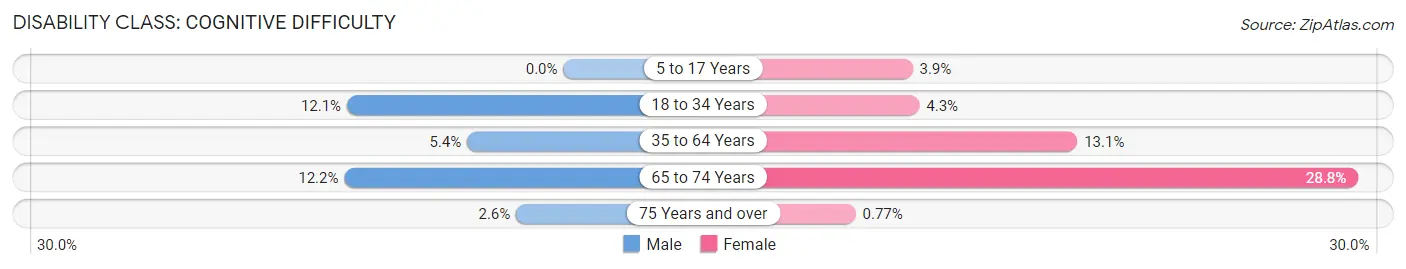
| Age Bracket | Male | Female |
| 5 to 17 Years | 0 (0.0%) | 5 (3.9%) |
| 18 to 34 Years | 20 (12.0%) | 13 (4.3%) |
| 35 to 64 Years | 24 (5.4%) | 51 (13.1%) |
| 65 to 74 Years | 15 (12.2%) | 23 (28.7%) |
| 75 Years and over | 3 (2.6%) | 1 (0.8%) |
Disability Class: Ambulatory Difficulty
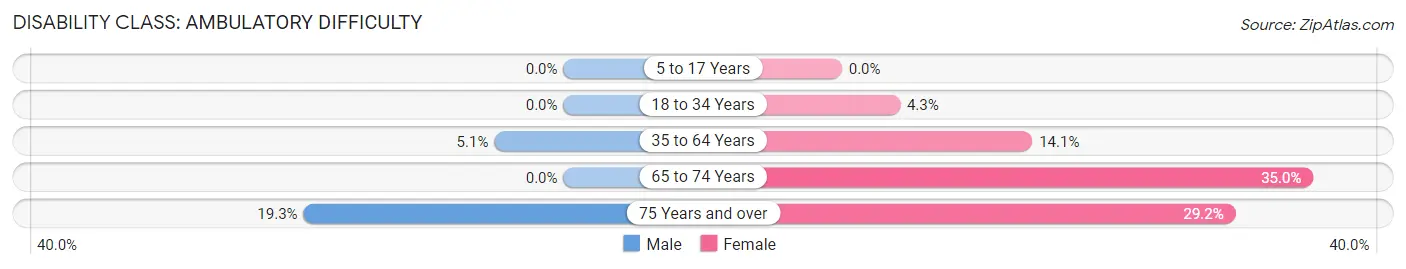
| Age Bracket | Male | Female |
| 5 to 17 Years | 0 (0.0%) | 0 (0.0%) |
| 18 to 34 Years | 0 (0.0%) | 13 (4.3%) |
| 35 to 64 Years | 23 (5.1%) | 55 (14.1%) |
| 65 to 74 Years | 0 (0.0%) | 28 (35.0%) |
| 75 Years and over | 22 (19.3%) | 38 (29.2%) |
Disability Class: Self-Care Difficulty
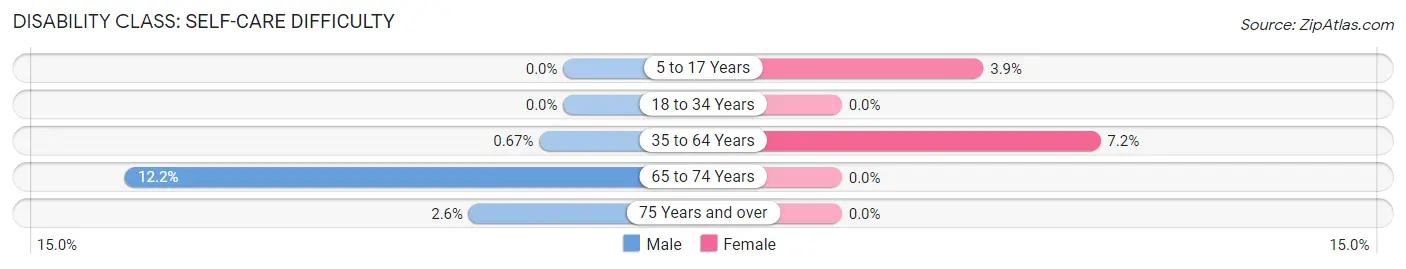
| Age Bracket | Male | Female |
| 5 to 17 Years | 0 (0.0%) | 5 (3.9%) |
| 18 to 34 Years | 0 (0.0%) | 0 (0.0%) |
| 35 to 64 Years | 3 (0.7%) | 28 (7.2%) |
| 65 to 74 Years | 15 (12.2%) | 0 (0.0%) |
| 75 Years and over | 3 (2.6%) | 0 (0.0%) |
Technology Access in Union
Computing Device Access in Union
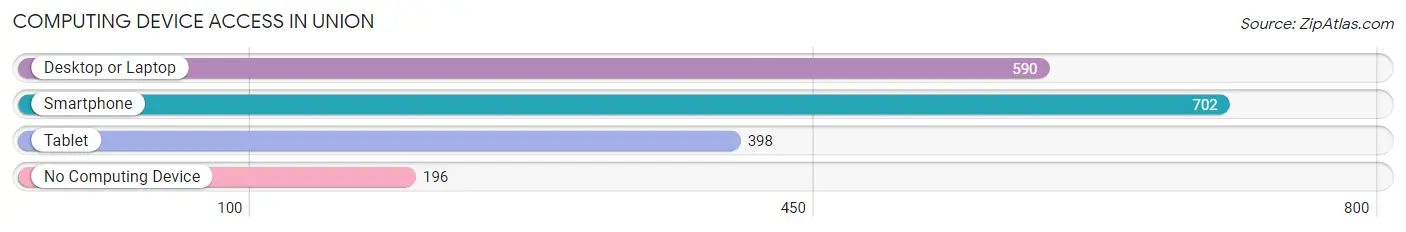
| Device Type | # Households | % Households |
| Desktop or Laptop | 590 | 60.3% |
| Smartphone | 702 | 71.8% |
| Tablet | 398 | 40.7% |
| No Computing Device | 196 | 20.0% |
| Total | 978 | 100.0% |
Internet Access in Union
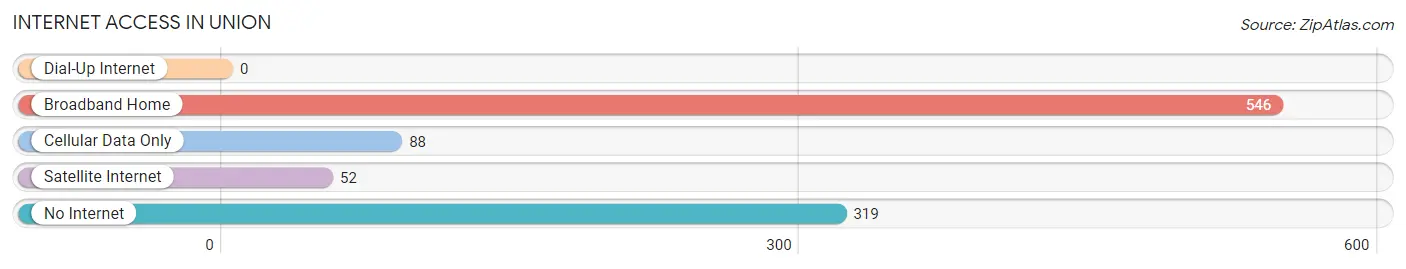
| Internet Type | # Households | % Households |
| Dial-Up Internet | 0 | 0.0% |
| Broadband Home | 546 | 55.8% |
| Cellular Data Only | 88 | 9.0% |
| Satellite Internet | 52 | 5.3% |
| No Internet | 319 | 32.6% |
| Total | 978 | 100.0% |
Union Summary
Union is a city located in Union County, Oregon, United States. The population was 1,845 at the 2010 census. It is the county seat of Union County.
History
The area that is now Union was first settled in 1864 by a group of miners from California. The miners named the settlement Union because of the unity of the miners in the area. The town was officially incorporated in 1887.
In the early 1900s, Union was a major center for logging and timber production. The town was home to several sawmills and lumber companies, and the timber industry was the main source of employment for the town's residents.
In the 1950s, Union began to experience a decline in the timber industry. This led to a decrease in population and economic activity in the town. In the 1970s, the town began to experience a resurgence in population and economic activity due to the development of the nearby Grande Ronde Valley.
Geography
Union is located in the Grande Ronde Valley in the foothills of the Blue Mountains. The city is situated at an elevation of 1,845 feet (562 m) above sea level. The city is located at the intersection of Oregon Route 203 and Oregon Route 237.
The city is surrounded by rolling hills and is located near the Grande Ronde River. The city is located approximately 30 miles (48 km) east of La Grande and 40 miles (64 km) west of Baker City.
Economy
Union's economy is largely based on agriculture and timber production. The city is home to several farms and ranches, as well as several timber companies. The city is also home to several small businesses, including restaurants, retail stores, and service providers.
The city is also home to several manufacturing companies, including a furniture manufacturer, a metal fabrication company, and a plastics manufacturer.
Demographics
As of the 2010 census, there were 1,845 people, 745 households, and 486 families residing in the city. The population density was 1,092.3 people per square mile (422.2/km2). There were 817 housing units at an average density of 478.3 per square mile (184.7/km2). The racial makeup of the city was 94.2% White, 0.3% African American, 0.7% Native American, 0.3% Asian, 0.1% Pacific Islander, 1.7% from other races, and 2.1% from two or more races. Hispanic or Latino of any race were 4.2% of the population.
There were 745 households, out of which 28.2% had children under the age of 18 living with them, 48.2% were married couples living together, 11.2% had a female householder with no husband present, and 35.2% were non-families. 29.2% of all households were made up of individuals, and 14.2% had someone living alone who was 65 years of age or older. The average household size was 2.45 and the average family size was 3.02.
In the city, the population was spread out, with 25.3% under the age of 18, 8.2% from 18 to 24, 24.2% from 25 to 44, 25.2% from 45 to 64, and 17.1% who were 65 years of age or older. The median age was 39 years. For every 100 females, there were 97.2 males. For every 100 females age 18 and over, there were 94.2 males.
The median income for a household in the city was $30,938, and the median income for a family was $37,500. Males had a median income of $30,000 versus $20,000 for females. The per capita income for the city was $15,945. About 11.2% of families and 14.2% of the population were below the poverty line, including 19.2% of those under age 18 and 8.2% of those age 65 or over.
Common Questions
What is Per Capita Income in Union?
Per Capita income in Union is $29,117.
What is the Median Family Income in Union?
Median Family Income in Union is $61,053.
What is the Median Household income in Union?
Median Household Income in Union is $60,385.
What is Income or Wage Gap in Union?
Income or Wage Gap in Union is 48.5%.
Women in Union earn 51.5 cents for every dollar earned by a man.
What is Inequality or Gini Index in Union?
Inequality or Gini Index in Union is 0.42.
What is the Total Population of Union?
Total Population of Union is 2,209.
What is the Total Male Population of Union?
Total Male Population of Union is 1,112.
What is the Total Female Population of Union?
Total Female Population of Union is 1,097.
What is the Ratio of Males per 100 Females in Union?
There are 101.37 Males per 100 Females in Union.
What is the Ratio of Females per 100 Males in Union?
There are 98.65 Females per 100 Males in Union.
What is the Median Population Age in Union?
Median Population Age in Union is 41.7 Years.
What is the Average Family Size in Union
Average Family Size in Union is 2.8 People.
What is the Average Household Size in Union
Average Household Size in Union is 2.2 People.
How Large is the Labor Force in Union?
There are 1,088 People in the Labor Forcein in Union.
What is the Percentage of People in the Labor Force in Union?
60.2% of People are in the Labor Force in Union.
What is the Unemployment Rate in Union?
Unemployment Rate in Union is 2.5%.