Cities with the Highest Percentage of Immigrants from Canada in New Mexico
RELATED REPORTS & OPTIONS
Canada
New Mexico
Compare Cities
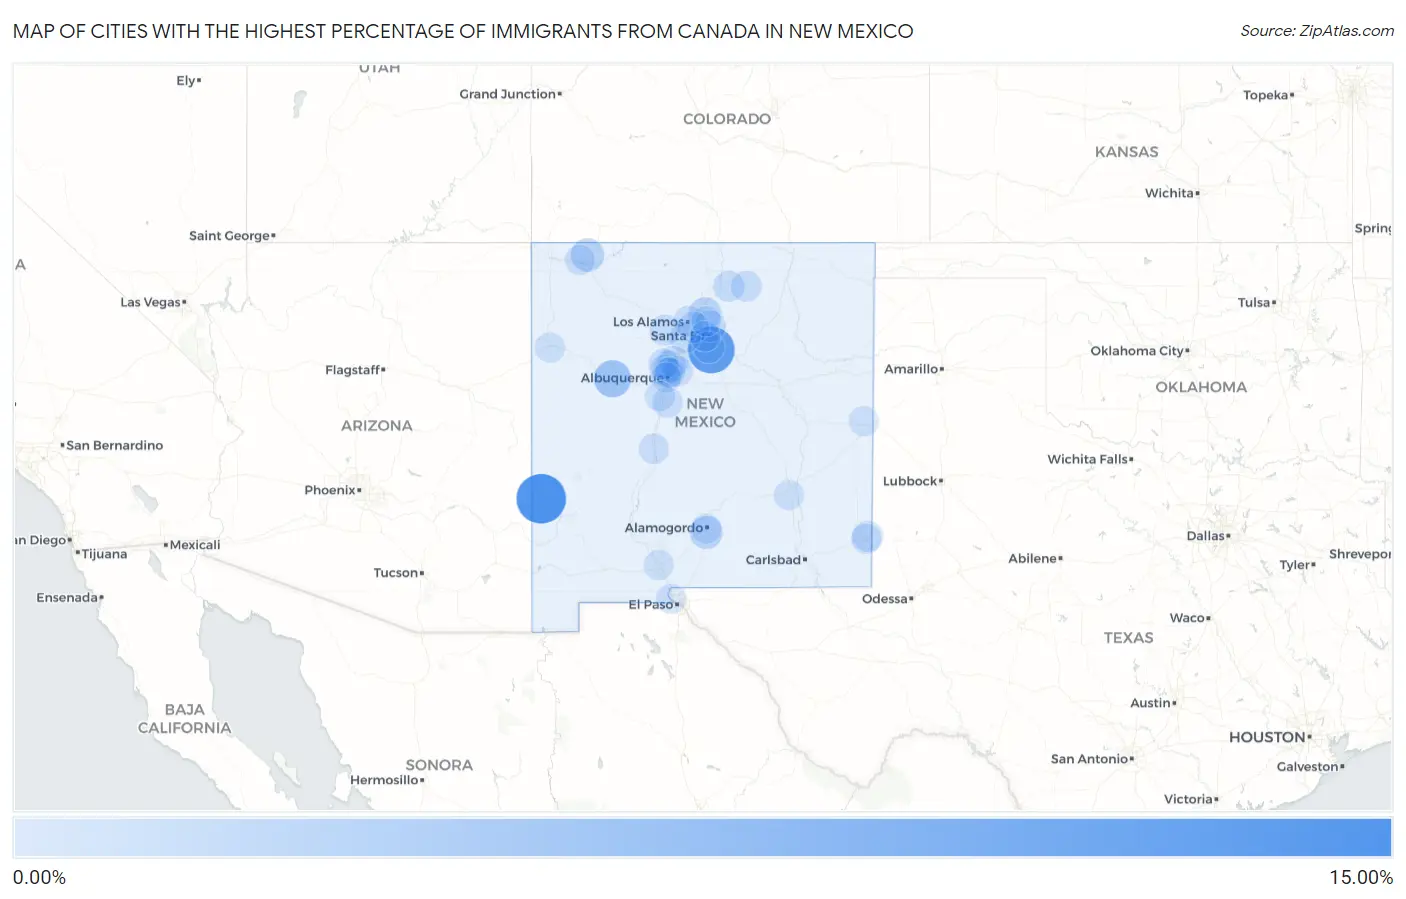
Map of Cities with the Highest Percentage of Immigrants from Canada in New Mexico
0.00%
15.00%
Cities with the Highest Percentage of Immigrants from Canada in New Mexico
| City | Canada | vs State | vs National | |
| 1. | Glenwood | 14.81% | 0.10%(+14.7)#-1 | 0.25%(+14.6)#0 |
| 2. | Lamy | 12.71% | 0.10%(+12.6)#0 | 0.25%(+12.5)#1 |
| 3. | Acomita Lake | 5.08% | 0.10%(+4.98)#1 | 0.25%(+4.83)#2 |
| 4. | Spencerville | 2.30% | 0.10%(+2.20)#2 | 0.25%(+2.05)#3 |
| 5. | Boles Acres | 1.97% | 0.10%(+1.86)#3 | 0.25%(+1.72)#4 |
| 6. | La Puebla | 1.93% | 0.10%(+1.83)#4 | 0.25%(+1.68)#5 |
| 7. | Las Campanas | 1.58% | 0.10%(+1.47)#5 | 0.25%(+1.33)#6 |
| 8. | Santa Fe Foothills | 1.34% | 0.10%(+1.23)#6 | 0.25%(+1.09)#7 |
| 9. | Chupadero | 1.05% | 0.10%(+0.949)#7 | 0.25%(+0.804)#8 |
| 10. | Eldorado At Santa Fe | 0.80% | 0.10%(+0.700)#8 | 0.25%(+0.556)#2,414 |
| 11. | Placitas Cdp Sandoval County | 0.76% | 0.10%(+0.659)#9 | 0.25%(+0.514)#2,415 |
| 12. | Tres Arroyos | 0.76% | 0.10%(+0.654)#10 | 0.25%(+0.509)#2,416 |
| 13. | White Rock | 0.73% | 0.10%(+0.629)#11 | 0.25%(+0.485)#2,417 |
| 14. | Cochiti Lake | 0.64% | 0.10%(+0.540)#12 | 0.25%(+0.396)#2,418 |
| 15. | Taos | 0.63% | 0.10%(+0.531)#13 | 0.25%(+0.387)#2,419 |
| 16. | North Hobbs | 0.58% | 0.10%(+0.476)#14 | 0.25%(+0.332)#2,420 |
| 17. | Jemez Springs | 0.57% | 0.10%(+0.464)#15 | 0.25%(+0.320)#2,421 |
| 18. | Los Alamos | 0.51% | 0.10%(+0.409)#16 | 0.25%(+0.264)#2,422 |
| 19. | Corrales | 0.51% | 0.10%(+0.402)#17 | 0.25%(+0.258)#2,423 |
| 20. | Bernalillo | 0.51% | 0.10%(+0.402)#18 | 0.25%(+0.258)#2,424 |
| 21. | Angel Fire | 0.42% | 0.10%(+0.311)#19 | 0.25%(+0.167)#2,425 |
| 22. | Paradise Hills | 0.34% | 0.10%(+0.234)#20 | 0.25%(+0.090)#2,426 |
| 23. | Santa Fe | 0.26% | 0.10%(+0.160)#21 | 0.25%(+0.015)#3,381 |
| 24. | Kirtland Afb | 0.23% | 0.10%(+0.131)#22 | 0.25%(-0.014)#3,382 |
| 25. | Sandia Heights | 0.19% | 0.10%(+0.083)#23 | 0.25%(-0.061)#3,383 |
| 26. | Socorro | 0.19% | 0.10%(+0.082)#24 | 0.25%(-0.062)#3,384 |
| 27. | Los Ranchos De Albuquerque | 0.17% | 0.10%(+0.066)#25 | 0.25%(-0.079)#3,385 |
| 28. | Las Maravillas | 0.17% | 0.10%(+0.063)#26 | 0.25%(-0.081)#3,386 |
| 29. | Farmington | 0.14% | 0.10%(+0.038)#27 | 0.25%(-0.106)#3,387 |
| 30. | Rio Rancho | 0.12% | 0.10%(+0.021)#28 | 0.25%(-0.124)#3,388 |
| 31. | North Valley | 0.12% | 0.10%(+0.020)#29 | 0.25%(-0.124)#3,389 |
| 32. | Crouch Mesa | 0.12% | 0.10%(+0.020)#30 | 0.25%(-0.124)#3,390 |
| 33. | Albuquerque | 0.12% | 0.10%(+0.016)#31 | 0.25%(-0.128)#3,391 |
| 34. | Las Cruces | 0.094% | 0.10%(-0.010)#32 | 0.25%(-0.154)#3,392 |
| 35. | Nambe | 0.092% | 0.10%(-0.012)#33 | 0.25%(-0.156)#3,393 |
| 36. | Alamogordo | 0.081% | 0.10%(-0.023)#34 | 0.25%(-0.168)#3,394 |
| 37. | Hobbs | 0.065% | 0.10%(-0.039)#35 | 0.25%(-0.183)#3,395 |
| 38. | Gallup | 0.060% | 0.10%(-0.044)#36 | 0.25%(-0.188)#3,396 |
| 39. | Clovis | 0.060% | 0.10%(-0.044)#37 | 0.25%(-0.188)#3,397 |
| 40. | Los Lunas | 0.057% | 0.10%(-0.047)#38 | 0.25%(-0.191)#3,398 |
| 41. | Sunland Park | 0.024% | 0.10%(-0.080)#39 | 0.25%(-0.224)#3,399 |
| 42. | Roswell | 0.015% | 0.10%(-0.089)#40 | 0.25%(-0.234)#3,400 |
Common Questions
What are the Top 10 Cities with the Highest Percentage of Immigrants from Canada in New Mexico?
Top 10 Cities with the Highest Percentage of Immigrants from Canada in New Mexico are:
#1
14.81%
#2
12.71%
#3
5.08%
#4
2.30%
#5
1.97%
#6
1.93%
#7
1.05%
#8
0.80%
#9
0.73%
#10
0.64%
What city has the Highest Percentage of Immigrants from Canada in New Mexico?
Glenwood has the Highest Percentage of Immigrants from Canada in New Mexico with 14.81%.
What is the Percentage of Immigrants from Canada in the State of New Mexico?
Percentage of Immigrants from Canada in New Mexico is 0.10%.
What is the Percentage of Immigrants from Canada in the United States?
Percentage of Immigrants from Canada in the United States is 0.25%.