Tillamook, OR Map & Demographics
Tillamook Map
Tillamook Overview
$26,657
PER CAPITA INCOME
$70,177
AVG FAMILY INCOME
$53,711
AVG HOUSEHOLD INCOME
29.5%
WAGE / INCOME GAP [ % ]
70.5¢/ $1
WAGE / INCOME GAP [ $ ]
0.38
INEQUALITY / GINI INDEX
5,215
TOTAL POPULATION
2,648
MALE POPULATION
2,567
FEMALE POPULATION
103.16
MALES / 100 FEMALES
96.94
FEMALES / 100 MALES
37.3
MEDIAN AGE
3.3
AVG FAMILY SIZE
2.5
AVG HOUSEHOLD SIZE
2,292
LABOR FORCE [ PEOPLE ]
58.2%
PERCENT IN LABOR FORCE
5.0%
UNEMPLOYMENT RATE
Tillamook Zip Codes
Income in Tillamook
Income Overview in Tillamook
Per Capita Income in Tillamook is $26,657, while median incomes of families and households are $70,177 and $53,711 respectively.
| Characteristic | Number | Measure |
| Per Capita Income | 5,215 | $26,657 |
| Median Family Income | 1,217 | $70,177 |
| Mean Family Income | 1,217 | $75,629 |
| Median Household Income | 2,074 | $53,711 |
| Mean Household Income | 2,074 | $63,540 |
| Income Deficit | 1,217 | $0 |
| Wage / Income Gap (%) | 5,215 | 29.47% |
| Wage / Income Gap ($) | 5,215 | 70.53¢ per $1 |
| Gini / Inequality Index | 5,215 | 0.38 |
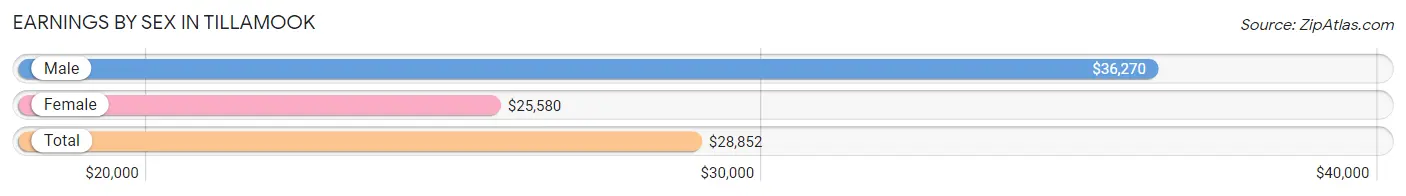
Earnings by Sex in Tillamook
Average Earnings in Tillamook are $28,852, $36,270 for men and $25,580 for women, a difference of 29.5%.
| Sex | Number | Average Earnings |
| Male | 1,347 (52.3%) | $36,270 |
| Female | 1,229 (47.7%) | $25,580 |
| Total | 2,576 (100.0%) | $28,852 |
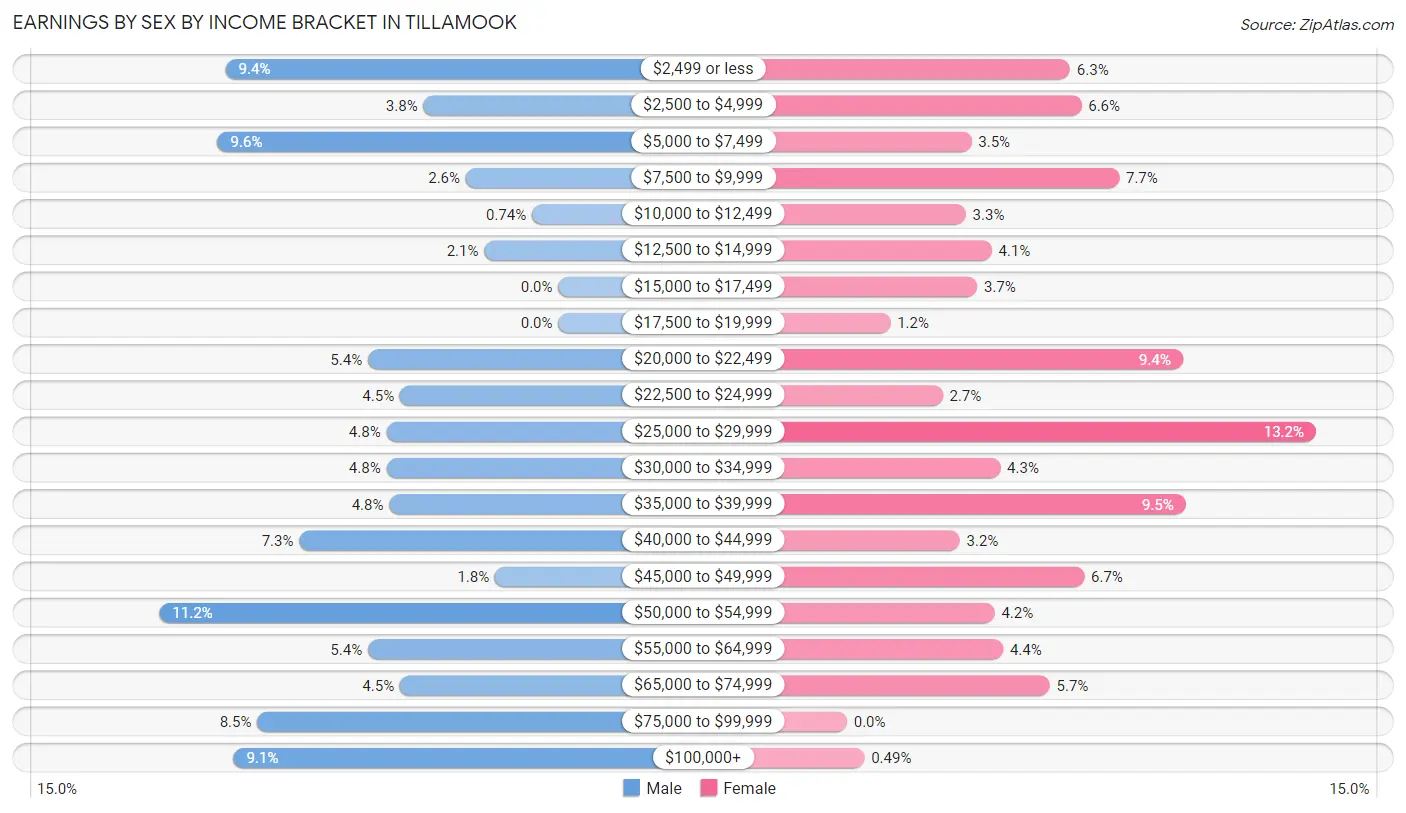
Earnings by Sex by Income Bracket in Tillamook
The most common earnings brackets in Tillamook are $50,000 to $54,999 for men (151 | 11.2%) and $25,000 to $29,999 for women (162 | 13.2%).
| Income | Male | Female |
| $2,499 or less | 126 (9.3%) | 77 (6.3%) |
| $2,500 to $4,999 | 51 (3.8%) | 81 (6.6%) |
| $5,000 to $7,499 | 129 (9.6%) | 43 (3.5%) |
| $7,500 to $9,999 | 35 (2.6%) | 94 (7.6%) |
| $10,000 to $12,499 | 10 (0.7%) | 41 (3.3%) |
| $12,500 to $14,999 | 28 (2.1%) | 50 (4.1%) |
| $15,000 to $17,499 | 0 (0.0%) | 45 (3.7%) |
| $17,500 to $19,999 | 0 (0.0%) | 15 (1.2%) |
| $20,000 to $22,499 | 72 (5.3%) | 116 (9.4%) |
| $22,500 to $24,999 | 60 (4.4%) | 33 (2.7%) |
| $25,000 to $29,999 | 65 (4.8%) | 162 (13.2%) |
| $30,000 to $34,999 | 65 (4.8%) | 53 (4.3%) |
| $35,000 to $39,999 | 64 (4.8%) | 117 (9.5%) |
| $40,000 to $44,999 | 98 (7.3%) | 39 (3.2%) |
| $45,000 to $49,999 | 24 (1.8%) | 82 (6.7%) |
| $50,000 to $54,999 | 151 (11.2%) | 51 (4.2%) |
| $55,000 to $64,999 | 72 (5.3%) | 54 (4.4%) |
| $65,000 to $74,999 | 60 (4.4%) | 70 (5.7%) |
| $75,000 to $99,999 | 114 (8.5%) | 0 (0.0%) |
| $100,000+ | 123 (9.1%) | 6 (0.5%) |
| Total | 1,347 (100.0%) | 1,229 (100.0%) |
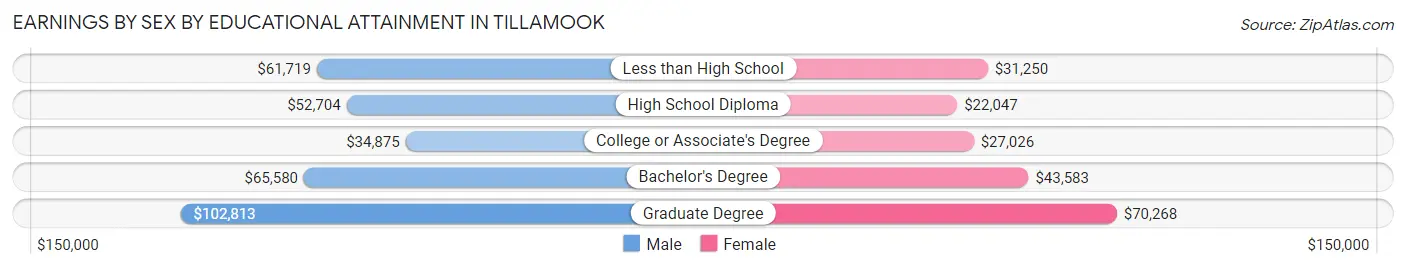
Earnings by Sex by Educational Attainment in Tillamook
Average earnings in Tillamook are $52,400 for men and $26,622 for women, a difference of 49.2%. Men with an educational attainment of graduate degree enjoy the highest average annual earnings of $102,813, while those with college or associate's degree education earn the least with $34,875. Women with an educational attainment of graduate degree earn the most with the average annual earnings of $70,268, while those with high school diploma education have the smallest earnings of $22,047.
| Educational Attainment | Male Income | Female Income |
| Less than High School | $61,719 | $31,250 |
| High School Diploma | $52,704 | $22,047 |
| College or Associate's Degree | $34,875 | $27,026 |
| Bachelor's Degree | $65,580 | $43,583 |
| Graduate Degree | $102,813 | $70,268 |
| Total | $52,400 | $26,622 |
Family Income in Tillamook
Family Income Brackets in Tillamook
According to the Tillamook family income data, there are 331 families falling into the $50,000 to $74,999 income range, which is the most common income bracket and makes up 27.2% of all families.
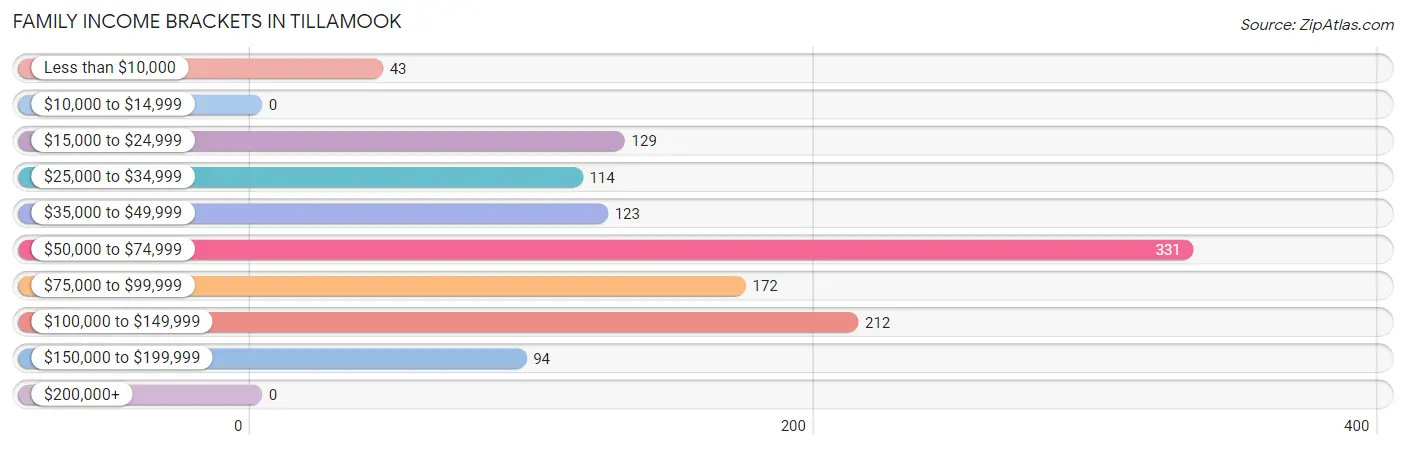
| Income Bracket | # Families | % Families |
| Less than $10,000 | 43 | 3.5% |
| $10,000 to $14,999 | 0 | 0.0% |
| $15,000 to $24,999 | 129 | 10.6% |
| $25,000 to $34,999 | 114 | 9.4% |
| $35,000 to $49,999 | 123 | 10.1% |
| $50,000 to $74,999 | 331 | 27.2% |
| $75,000 to $99,999 | 172 | 14.1% |
| $100,000 to $149,999 | 212 | 17.4% |
| $150,000 to $199,999 | 94 | 7.7% |
| $200,000+ | 0 | 0.0% |
Family Income by Famaliy Size in Tillamook
5-person families (150 | 12.3%) account for the highest median family income in Tillamook with $116,468 per family, while 2-person families (529 | 43.5%) have the highest median income of $26,820 per family member.
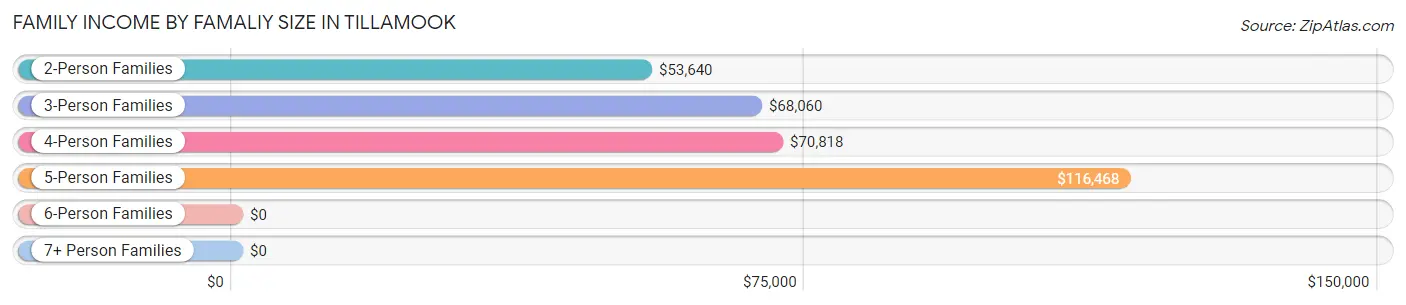
| Income Bracket | # Families | Median Income |
| 2-Person Families | 529 (43.5%) | $53,640 |
| 3-Person Families | 159 (13.1%) | $68,060 |
| 4-Person Families | 334 (27.4%) | $70,818 |
| 5-Person Families | 150 (12.3%) | $116,468 |
| 6-Person Families | 31 (2.5%) | $0 |
| 7+ Person Families | 14 (1.1%) | $0 |
| Total | 1,217 (100.0%) | $70,177 |
Family Income by Number of Earners in Tillamook
The median family income in Tillamook is $70,177, with families comprising 2 earners (338) having the highest median family income of $93,750, while families with 1 earner (461) have the lowest median family income of $38,750, accounting for 27.8% and 37.9% of families, respectively.
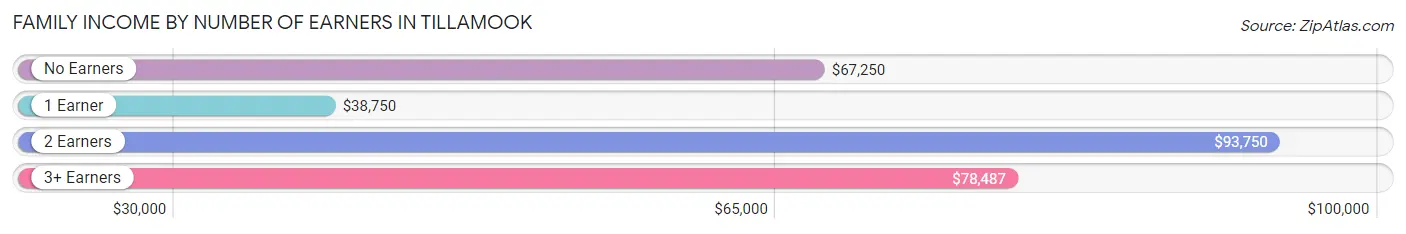
| Number of Earners | # Families | Median Income |
| No Earners | 183 (15.0%) | $67,250 |
| 1 Earner | 461 (37.9%) | $38,750 |
| 2 Earners | 338 (27.8%) | $93,750 |
| 3+ Earners | 235 (19.3%) | $78,487 |
| Total | 1,217 (100.0%) | $70,177 |
Household Income in Tillamook
Household Income Brackets in Tillamook
With 552 households falling in the category, the $50,000 to $74,999 income range is the most frequent in Tillamook, accounting for 26.6% of all households. In contrast, only 6 households (0.3%) fall into the $200,000+ income bracket, making it the least populous group.
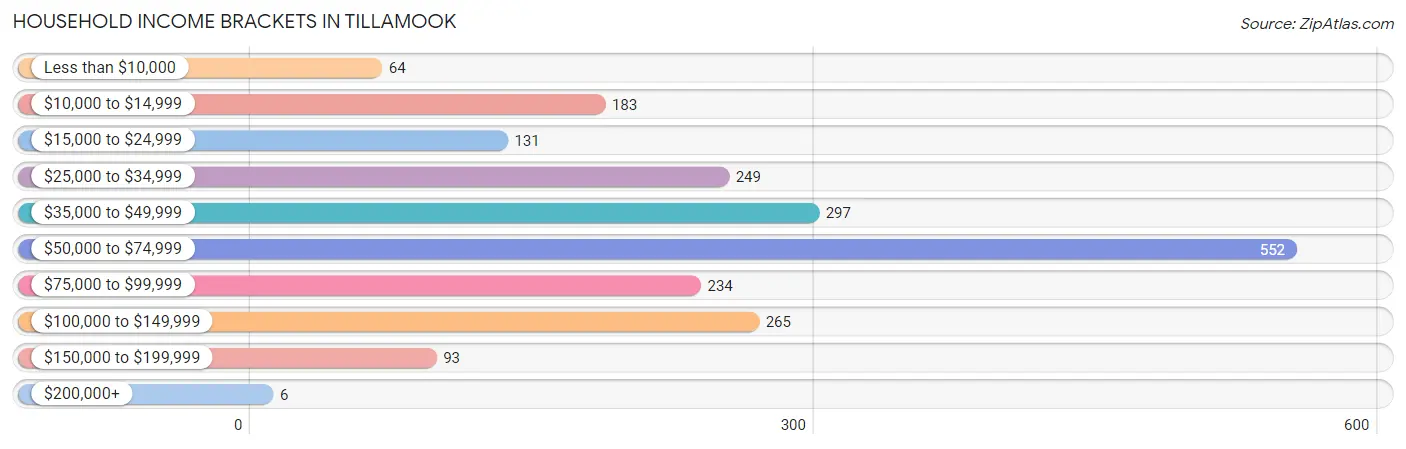
| Income Bracket | # Households | % Households |
| Less than $10,000 | 64 | 3.1% |
| $10,000 to $14,999 | 183 | 8.8% |
| $15,000 to $24,999 | 131 | 6.3% |
| $25,000 to $34,999 | 249 | 12.0% |
| $35,000 to $49,999 | 297 | 14.3% |
| $50,000 to $74,999 | 552 | 26.6% |
| $75,000 to $99,999 | 234 | 11.3% |
| $100,000 to $149,999 | 265 | 12.8% |
| $150,000 to $199,999 | 93 | 4.5% |
| $200,000+ | 6 | 0.3% |
Household Income by Householder Age in Tillamook
The median household income in Tillamook is $53,711, with the highest median household income of $66,314 found in the 25 to 44 years age bracket for the primary householder. A total of 741 households (35.7%) fall into this category. Meanwhile, the 15 to 24 years age bracket for the primary householder has the lowest median household income of $0, with 30 households (1.5%) in this group.
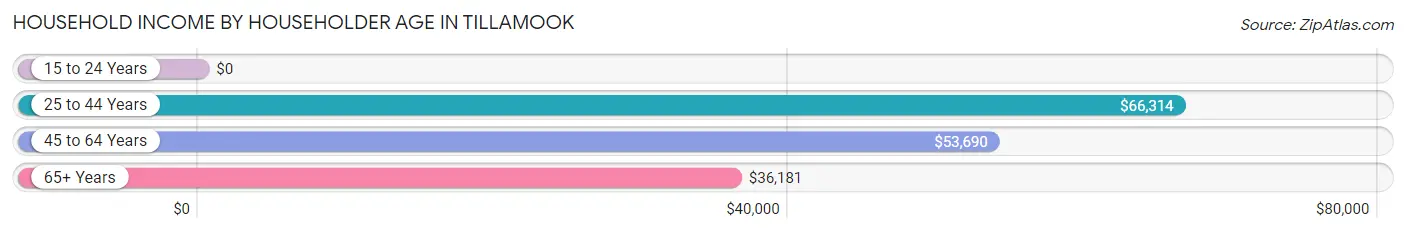
| Income Bracket | # Households | Median Income |
| 15 to 24 Years | 30 (1.5%) | $0 |
| 25 to 44 Years | 741 (35.7%) | $66,314 |
| 45 to 64 Years | 554 (26.7%) | $53,690 |
| 65+ Years | 749 (36.1%) | $36,181 |
| Total | 2,074 (100.0%) | $53,711 |
Poverty in Tillamook
Income Below Poverty by Sex and Age in Tillamook
With 11.4% poverty level for males and 10.2% for females among the residents of Tillamook, 5 year old males and 12 to 14 year old females are the most vulnerable to poverty, with 35 males (100.0%) and 26 females (46.4%) in their respective age groups living below the poverty level.
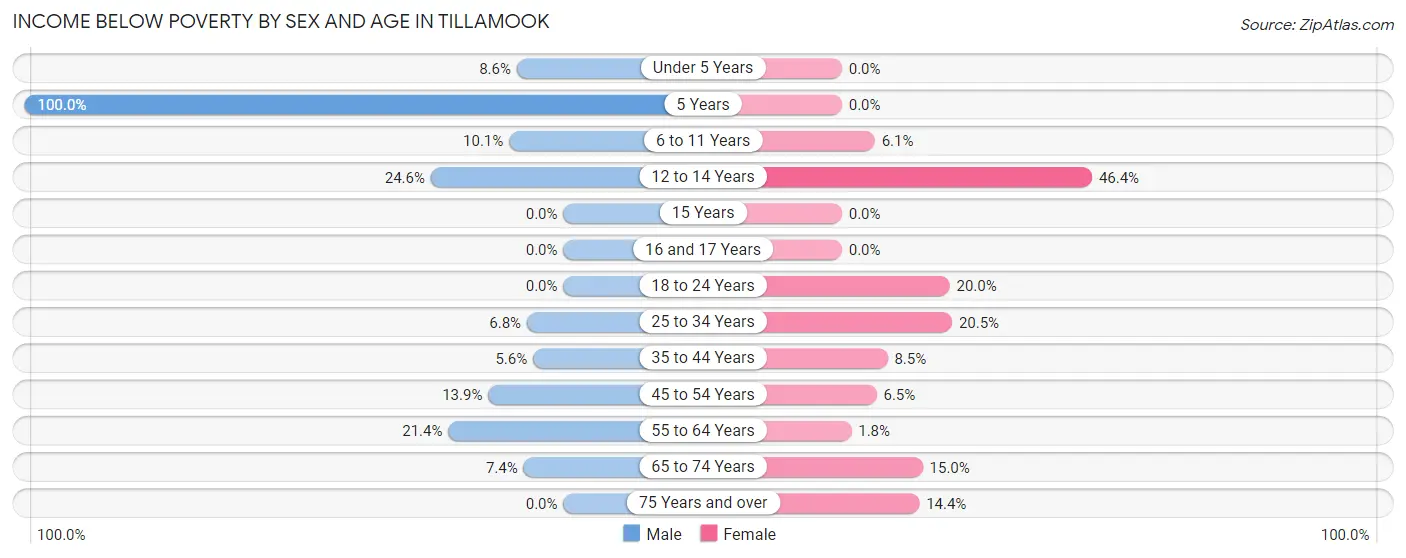
| Age Bracket | Male | Female |
| Under 5 Years | 14 (8.6%) | 0 (0.0%) |
| 5 Years | 35 (100.0%) | 0 (0.0%) |
| 6 to 11 Years | 30 (10.1%) | 19 (6.1%) |
| 12 to 14 Years | 46 (24.6%) | 26 (46.4%) |
| 15 Years | 0 (0.0%) | 0 (0.0%) |
| 16 and 17 Years | 0 (0.0%) | 0 (0.0%) |
| 18 to 24 Years | 0 (0.0%) | 13 (20.0%) |
| 25 to 34 Years | 19 (6.8%) | 54 (20.4%) |
| 35 to 44 Years | 17 (5.6%) | 42 (8.5%) |
| 45 to 54 Years | 35 (13.9%) | 18 (6.5%) |
| 55 to 64 Years | 79 (21.3%) | 5 (1.8%) |
| 65 to 74 Years | 21 (7.4%) | 33 (15.0%) |
| 75 Years and over | 0 (0.0%) | 50 (14.4%) |
| Total | 296 (11.4%) | 260 (10.2%) |
Income Above Poverty by Sex and Age in Tillamook
According to the poverty statistics in Tillamook, males aged 16 and 17 years and females aged under 5 years are the age groups that are most secure financially, with 100.0% of males and 100.0% of females in these age groups living above the poverty line.
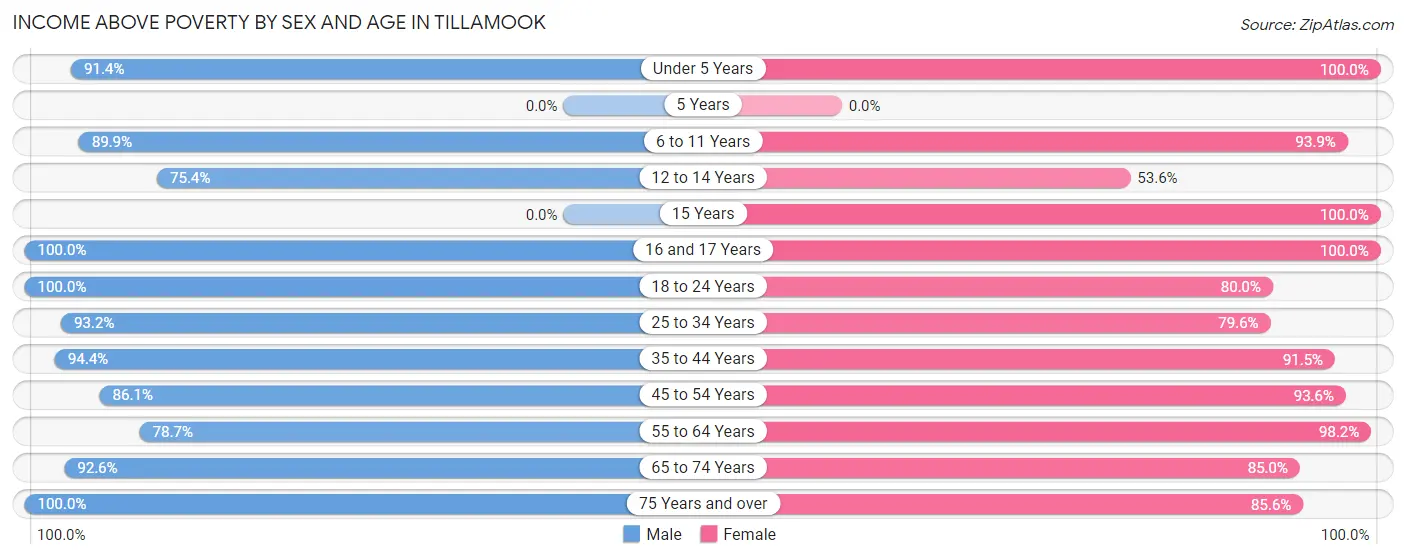
| Age Bracket | Male | Female |
| Under 5 Years | 148 (91.4%) | 123 (100.0%) |
| 5 Years | 0 (0.0%) | 0 (0.0%) |
| 6 to 11 Years | 268 (89.9%) | 292 (93.9%) |
| 12 to 14 Years | 141 (75.4%) | 30 (53.6%) |
| 15 Years | 0 (0.0%) | 28 (100.0%) |
| 16 and 17 Years | 40 (100.0%) | 65 (100.0%) |
| 18 to 24 Years | 336 (100.0%) | 52 (80.0%) |
| 25 to 34 Years | 262 (93.2%) | 210 (79.5%) |
| 35 to 44 Years | 285 (94.4%) | 454 (91.5%) |
| 45 to 54 Years | 216 (86.1%) | 261 (93.5%) |
| 55 to 64 Years | 291 (78.6%) | 279 (98.2%) |
| 65 to 74 Years | 263 (92.6%) | 187 (85.0%) |
| 75 Years and over | 54 (100.0%) | 298 (85.6%) |
| Total | 2,304 (88.6%) | 2,279 (89.8%) |
Income Below Poverty Among Married-Couple Families in Tillamook
The poverty statistics for married-couple families in Tillamook show that 2.1% or 14 of the total 672 families live below the poverty line. Families with 5 or more children have the highest poverty rate of 100.0%, comprising of 14 families. On the other hand, families with no children have the lowest poverty rate of 0.0%, which includes 0 families.
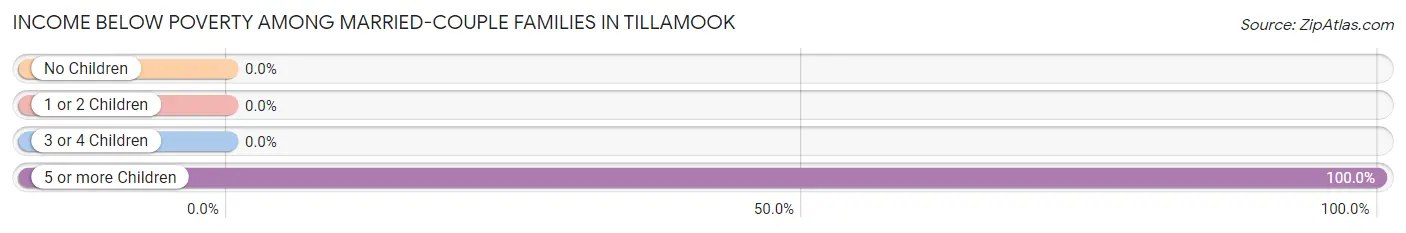
| Children | Above Poverty | Below Poverty |
| No Children | 345 (100.0%) | 0 (0.0%) |
| 1 or 2 Children | 201 (100.0%) | 0 (0.0%) |
| 3 or 4 Children | 112 (100.0%) | 0 (0.0%) |
| 5 or more Children | 0 (0.0%) | 14 (100.0%) |
| Total | 658 (97.9%) | 14 (2.1%) |
Income Below Poverty Among Single-Parent Households in Tillamook
According to the poverty data in Tillamook, 10.8% or 19 single-father households and 6.5% or 24 single-mother households are living below the poverty line. Among single-father households, those with 3 or 4 children have the highest poverty rate, with 19 households (38.8%) experiencing poverty. Likewise, among single-mother households, those with 1 or 2 children have the highest poverty rate, with 24 households (10.4%) falling below the poverty line.
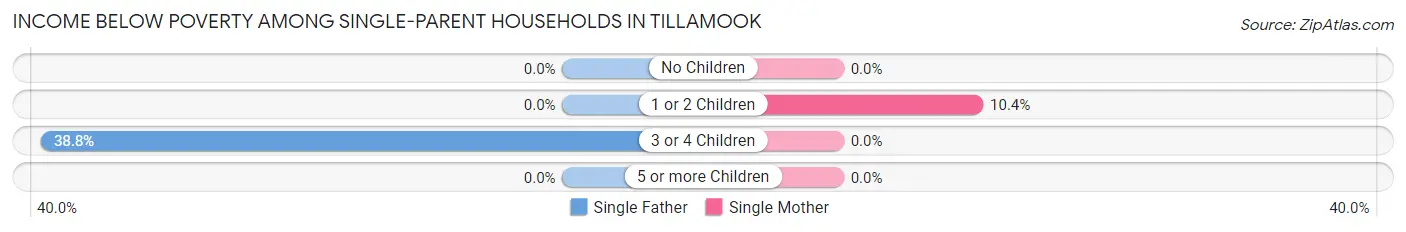
| Children | Single Father | Single Mother |
| No Children | 0 (0.0%) | 0 (0.0%) |
| 1 or 2 Children | 0 (0.0%) | 24 (10.4%) |
| 3 or 4 Children | 19 (38.8%) | 0 (0.0%) |
| 5 or more Children | 0 (0.0%) | 0 (0.0%) |
| Total | 19 (10.8%) | 24 (6.5%) |
Income Below Poverty Among Married-Couple vs Single-Parent Households in Tillamook
The poverty data for Tillamook shows that 14 of the married-couple family households (2.1%) and 43 of the single-parent households (7.9%) are living below the poverty level. Within the married-couple family households, those with 5 or more children have the highest poverty rate, with 14 households (100.0%) falling below the poverty line. Among the single-parent households, those with 3 or 4 children have the highest poverty rate, with 19 household (23.2%) living below poverty.
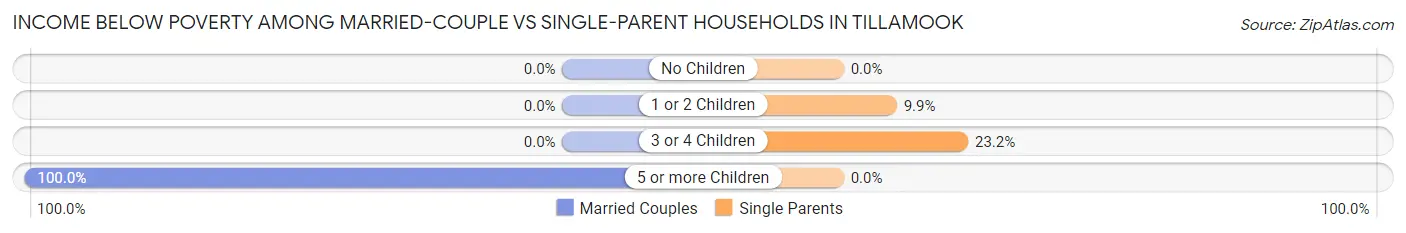
| Children | Married-Couple Families | Single-Parent Households |
| No Children | 0 (0.0%) | 0 (0.0%) |
| 1 or 2 Children | 0 (0.0%) | 24 (9.9%) |
| 3 or 4 Children | 0 (0.0%) | 19 (23.2%) |
| 5 or more Children | 14 (100.0%) | 0 (0.0%) |
| Total | 14 (2.1%) | 43 (7.9%) |
Race in Tillamook
The most populous races in Tillamook are White / Caucasian (3,881 | 74.4%), Hispanic or Latino (1,352 | 25.9%), and Two or more Races (678 | 13.0%).
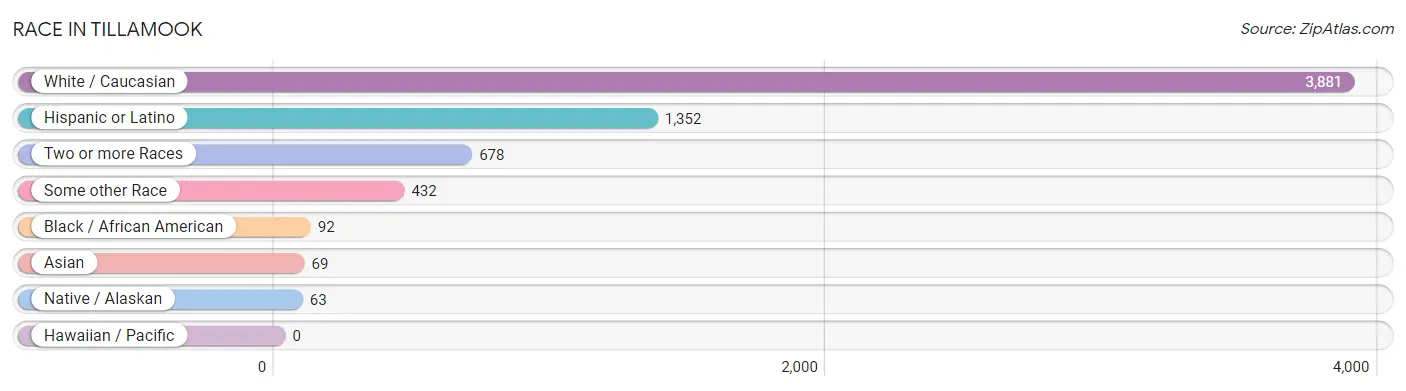
| Race | # Population | % Population |
| Asian | 69 | 1.3% |
| Black / African American | 92 | 1.8% |
| Hawaiian / Pacific | 0 | 0.0% |
| Hispanic or Latino | 1,352 | 25.9% |
| Native / Alaskan | 63 | 1.2% |
| White / Caucasian | 3,881 | 74.4% |
| Two or more Races | 678 | 13.0% |
| Some other Race | 432 | 8.3% |
| Total | 5,215 | 100.0% |
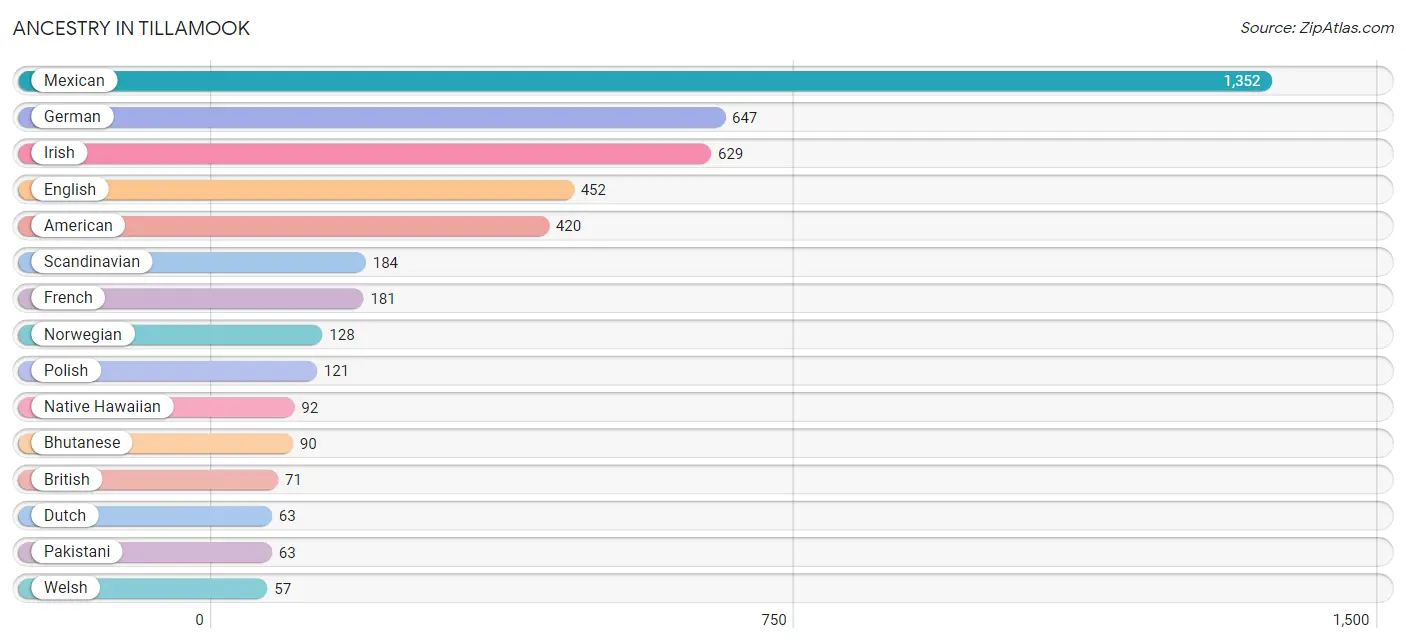
Ancestry in Tillamook
The most populous ancestries reported in Tillamook are Mexican (1,352 | 25.9%), German (647 | 12.4%), Irish (629 | 12.1%), English (452 | 8.7%), and American (420 | 8.1%), together accounting for 67.1% of all Tillamook residents.
| Ancestry | # Population | % Population |
| African | 14 | 0.3% |
| American | 420 | 8.1% |
| Apache | 5 | 0.1% |
| Arab | 13 | 0.3% |
| Armenian | 4 | 0.1% |
| Bhutanese | 90 | 1.7% |
| Blackfeet | 2 | 0.0% |
| British | 71 | 1.4% |
| Canadian | 11 | 0.2% |
| Cherokee | 6 | 0.1% |
| Colville | 35 | 0.7% |
| Czechoslovakian | 10 | 0.2% |
| Danish | 16 | 0.3% |
| Dutch | 63 | 1.2% |
| Eastern European | 17 | 0.3% |
| English | 452 | 8.7% |
| European | 53 | 1.0% |
| Finnish | 8 | 0.2% |
| French | 181 | 3.5% |
| French Canadian | 29 | 0.6% |
| German | 647 | 12.4% |
| Greek | 6 | 0.1% |
| Hungarian | 9 | 0.2% |
| Irish | 629 | 12.1% |
| Italian | 33 | 0.6% |
| Korean | 9 | 0.2% |
| Mexican | 1,352 | 25.9% |
| Mongolian | 6 | 0.1% |
| Native Hawaiian | 92 | 1.8% |
| Navajo | 24 | 0.5% |
| Norwegian | 128 | 2.5% |
| Pakistani | 63 | 1.2% |
| Polish | 121 | 2.3% |
| Russian | 37 | 0.7% |
| Scandinavian | 184 | 3.5% |
| Scotch-Irish | 55 | 1.1% |
| Scottish | 19 | 0.4% |
| Subsaharan African | 14 | 0.3% |
| Swedish | 37 | 0.7% |
| Swiss | 39 | 0.7% |
| Welsh | 57 | 1.1% | View All 41 Rows |
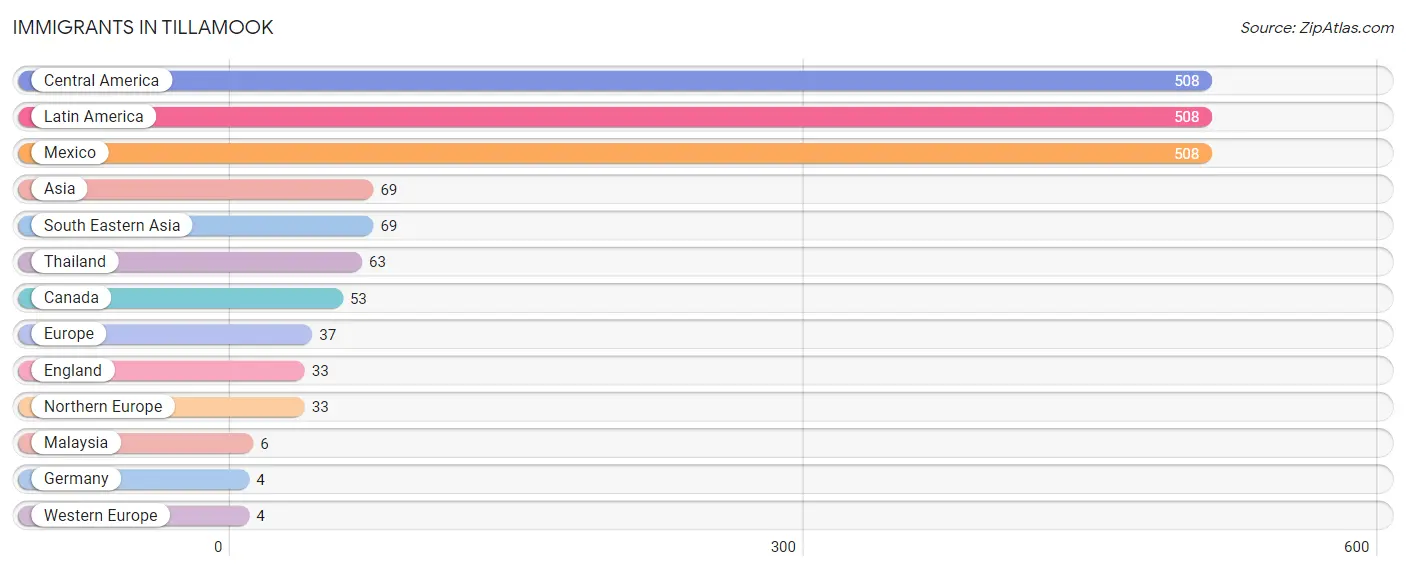
Immigrants in Tillamook
The most numerous immigrant groups reported in Tillamook came from Central America (508 | 9.7%), Latin America (508 | 9.7%), Mexico (508 | 9.7%), Asia (69 | 1.3%), and South Eastern Asia (69 | 1.3%), together accounting for 31.9% of all Tillamook residents.
| Immigration Origin | # Population | % Population |
| Asia | 69 | 1.3% |
| Canada | 53 | 1.0% |
| Central America | 508 | 9.7% |
| England | 33 | 0.6% |
| Europe | 37 | 0.7% |
| Germany | 4 | 0.1% |
| Latin America | 508 | 9.7% |
| Malaysia | 6 | 0.1% |
| Mexico | 508 | 9.7% |
| Northern Europe | 33 | 0.6% |
| South Eastern Asia | 69 | 1.3% |
| Thailand | 63 | 1.2% |
| Western Europe | 4 | 0.1% | View All 13 Rows |
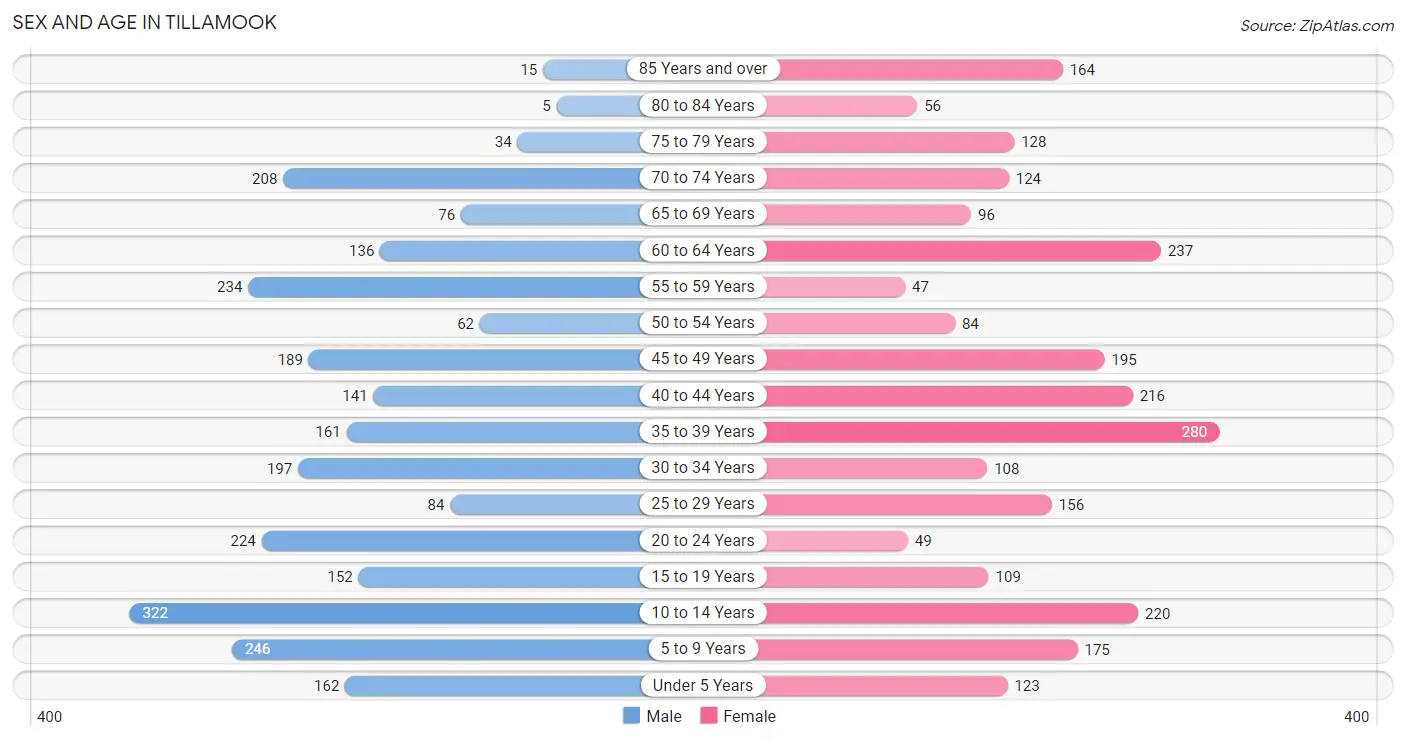
Sex and Age in Tillamook
Sex and Age in Tillamook
The most populous age groups in Tillamook are 10 to 14 Years (322 | 12.2%) for men and 35 to 39 Years (280 | 10.9%) for women.
| Age Bracket | Male | Female |
| Under 5 Years | 162 (6.1%) | 123 (4.8%) |
| 5 to 9 Years | 246 (9.3%) | 175 (6.8%) |
| 10 to 14 Years | 322 (12.2%) | 220 (8.6%) |
| 15 to 19 Years | 152 (5.7%) | 109 (4.3%) |
| 20 to 24 Years | 224 (8.5%) | 49 (1.9%) |
| 25 to 29 Years | 84 (3.2%) | 156 (6.1%) |
| 30 to 34 Years | 197 (7.4%) | 108 (4.2%) |
| 35 to 39 Years | 161 (6.1%) | 280 (10.9%) |
| 40 to 44 Years | 141 (5.3%) | 216 (8.4%) |
| 45 to 49 Years | 189 (7.1%) | 195 (7.6%) |
| 50 to 54 Years | 62 (2.3%) | 84 (3.3%) |
| 55 to 59 Years | 234 (8.8%) | 47 (1.8%) |
| 60 to 64 Years | 136 (5.1%) | 237 (9.2%) |
| 65 to 69 Years | 76 (2.9%) | 96 (3.7%) |
| 70 to 74 Years | 208 (7.9%) | 124 (4.8%) |
| 75 to 79 Years | 34 (1.3%) | 128 (5.0%) |
| 80 to 84 Years | 5 (0.2%) | 56 (2.2%) |
| 85 Years and over | 15 (0.6%) | 164 (6.4%) |
| Total | 2,648 (100.0%) | 2,567 (100.0%) |
Families and Households in Tillamook
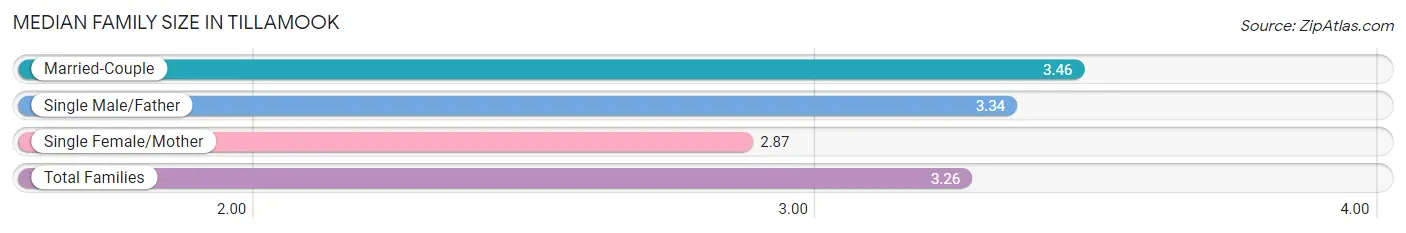
Median Family Size in Tillamook
The median family size in Tillamook is 3.26 persons per family, with married-couple families (672 | 55.2%) accounting for the largest median family size of 3.46 persons per family. On the other hand, single female/mother families (369 | 30.3%) represent the smallest median family size with 2.87 persons per family.
| Family Type | # Families | Family Size |
| Married-Couple | 672 (55.2%) | 3.46 |
| Single Male/Father | 176 (14.5%) | 3.34 |
| Single Female/Mother | 369 (30.3%) | 2.87 |
| Total Families | 1,217 (100.0%) | 3.26 |
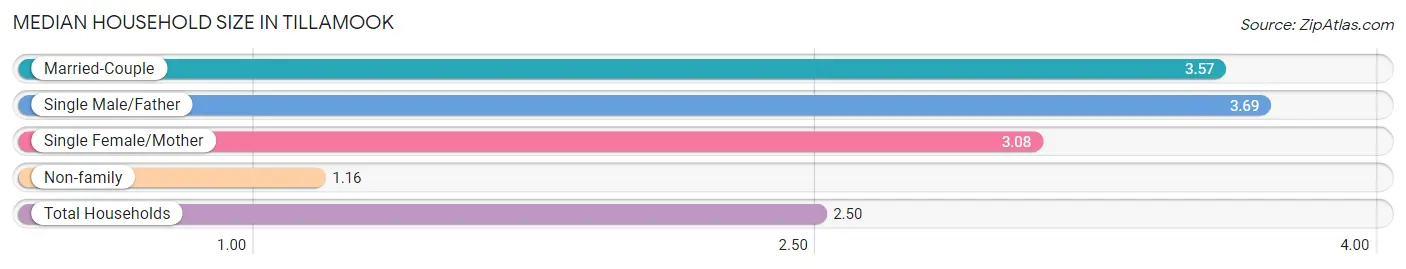
Median Household Size in Tillamook
The median household size in Tillamook is 2.50 persons per household, with single male/father households (176 | 8.5%) accounting for the largest median household size of 3.69 persons per household. non-family households (857 | 41.3%) represent the smallest median household size with 1.16 persons per household.
| Household Type | # Households | Household Size |
| Married-Couple | 672 (32.4%) | 3.57 |
| Single Male/Father | 176 (8.5%) | 3.69 |
| Single Female/Mother | 369 (17.8%) | 3.08 |
| Non-family | 857 (41.3%) | 1.16 |
| Total Households | 2,074 (100.0%) | 2.50 |
Household Size by Marriage Status in Tillamook
Out of a total of 2,074 households in Tillamook, 1,217 (58.7%) are family households, while 857 (41.3%) are nonfamily households. The most numerous type of family households are 2-person households, comprising 431, and the most common type of nonfamily households are 1-person households, comprising 736.
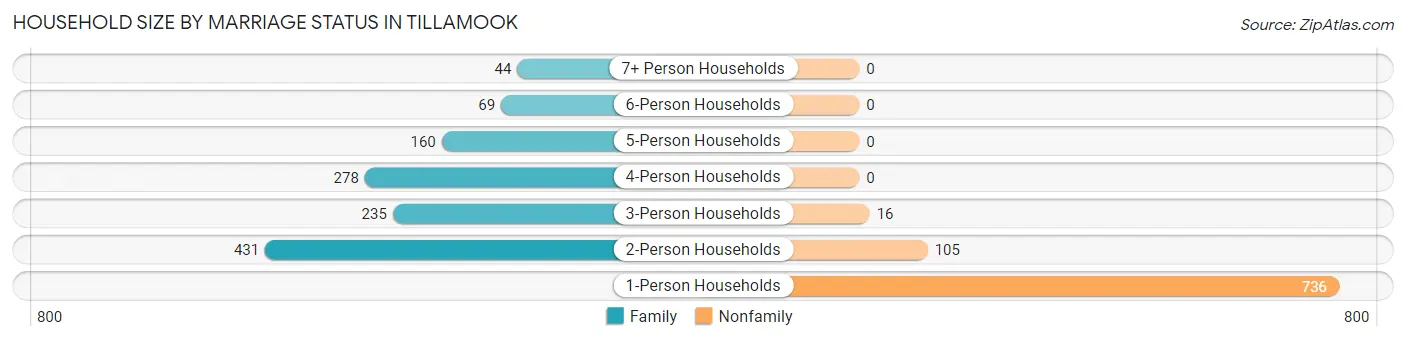
| Household Size | Family Households | Nonfamily Households |
| 1-Person Households | - | 736 (35.5%) |
| 2-Person Households | 431 (20.8%) | 105 (5.1%) |
| 3-Person Households | 235 (11.3%) | 16 (0.8%) |
| 4-Person Households | 278 (13.4%) | 0 (0.0%) |
| 5-Person Households | 160 (7.7%) | 0 (0.0%) |
| 6-Person Households | 69 (3.3%) | 0 (0.0%) |
| 7+ Person Households | 44 (2.1%) | 0 (0.0%) |
| Total | 1,217 (58.7%) | 857 (41.3%) |
Female Fertility in Tillamook
Fertility by Age in Tillamook
Average fertility rate in Tillamook is 63.0 births per 1,000 women. Women in the age bracket of 20 to 34 years have the highest fertility rate with 115.0 births per 1,000 women. Women in the age bracket of 20 to 34 years acount for 51.4% of all women with births.
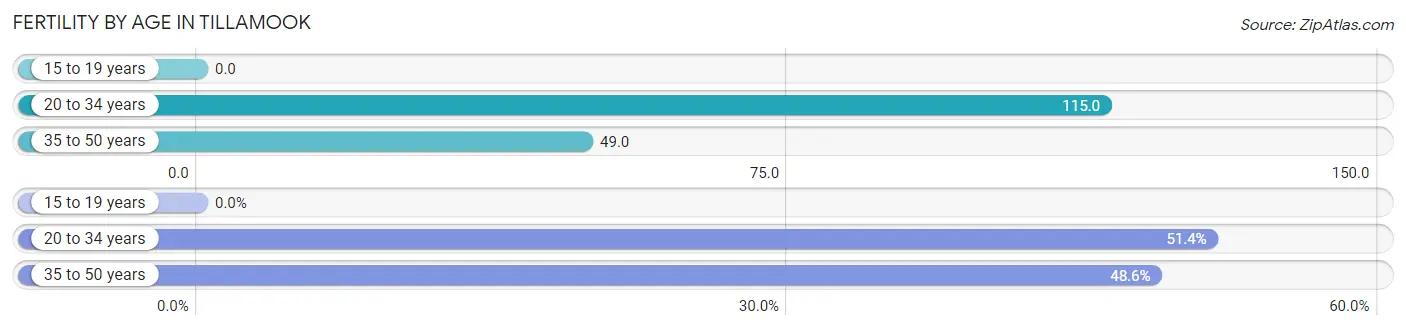
| Age Bracket | Women with Births | Births / 1,000 Women |
| 15 to 19 years | 0 (0.0%) | 0.0 |
| 20 to 34 years | 36 (51.4%) | 115.0 |
| 35 to 50 years | 34 (48.6%) | 49.0 |
| Total | 70 (100.0%) | 63.0 |
Fertility by Age by Marriage Status in Tillamook
54.3% of women with births (70) in Tillamook are married. The highest percentage of unmarried women with births falls into 20 to 34 years age bracket with 88.9% of them unmarried at the time of birth, while the lowest percentage of unmarried women with births belong to 35 to 50 years age bracket with 0.0% of them unmarried.
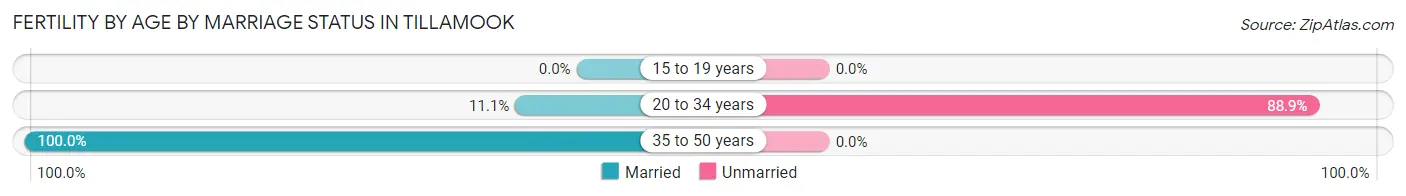
| Age Bracket | Married | Unmarried |
| 15 to 19 years | 0 (0.0%) | 0 (0.0%) |
| 20 to 34 years | 4 (11.1%) | 32 (88.9%) |
| 35 to 50 years | 34 (100.0%) | 0 (0.0%) |
| Total | 38 (54.3%) | 32 (45.7%) |
Fertility by Education in Tillamook
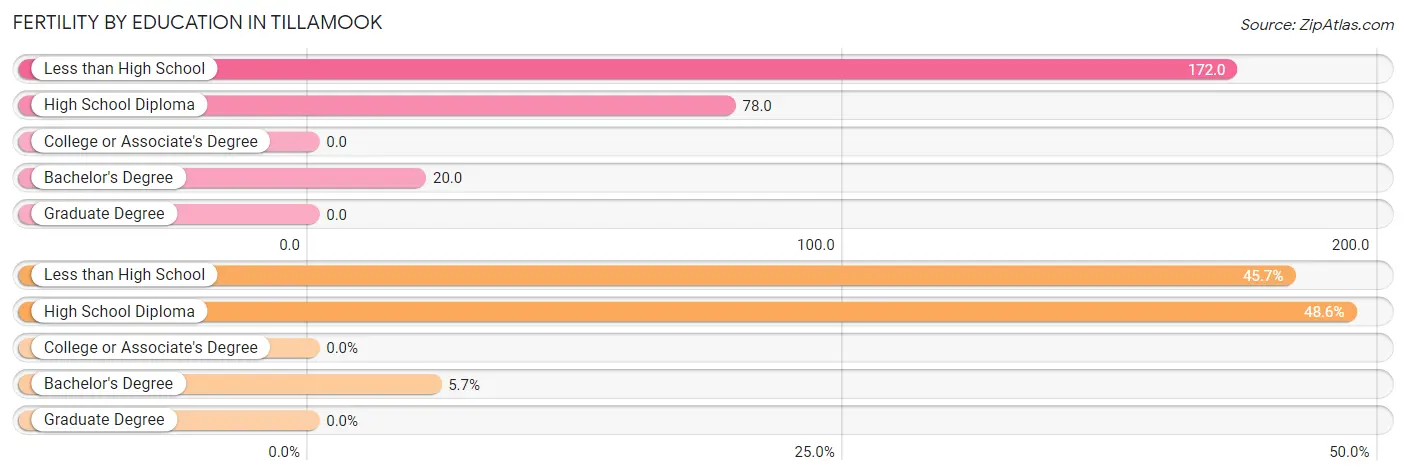
| Educational Attainment | Women with Births | Births / 1,000 Women |
| Less than High School | 32 (45.7%) | 172.0 |
| High School Diploma | 34 (48.6%) | 78.0 |
| College or Associate's Degree | 0 (0.0%) | 0.0 |
| Bachelor's Degree | 4 (5.7%) | 20.0 |
| Graduate Degree | 0 (0.0%) | 0.0 |
| Total | 70 (100.0%) | 63.0 |
Fertility by Education by Marriage Status in Tillamook
45.7% of women with births in Tillamook are unmarried. Women with the educational attainment of high school diploma are most likely to be married with 100.0% of them married at childbirth, while women with the educational attainment of less than high school are least likely to be married with 100.0% of them unmarried at childbirth.
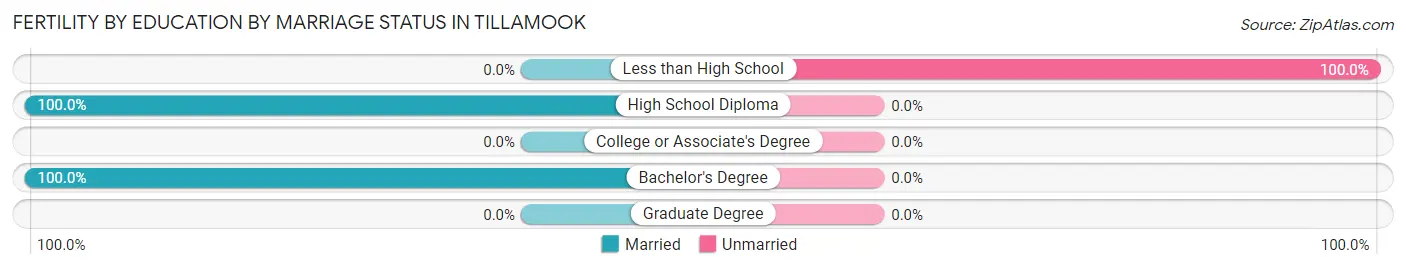
| Educational Attainment | Married | Unmarried |
| Less than High School | 0 (0.0%) | 32 (100.0%) |
| High School Diploma | 34 (100.0%) | 0 (0.0%) |
| College or Associate's Degree | 0 (0.0%) | 0 (0.0%) |
| Bachelor's Degree | 4 (100.0%) | 0 (0.0%) |
| Graduate Degree | 0 (0.0%) | 0 (0.0%) |
| Total | 38 (54.3%) | 32 (45.7%) |
Employment Characteristics in Tillamook
Employment by Class of Employer in Tillamook
Among the 2,141 employed individuals in Tillamook, private company employees (1,328 | 62.0%), self-employed (not incorporated) (234 | 10.9%), and not-for-profit organizations (201 | 9.4%) make up the most common classes of employment.
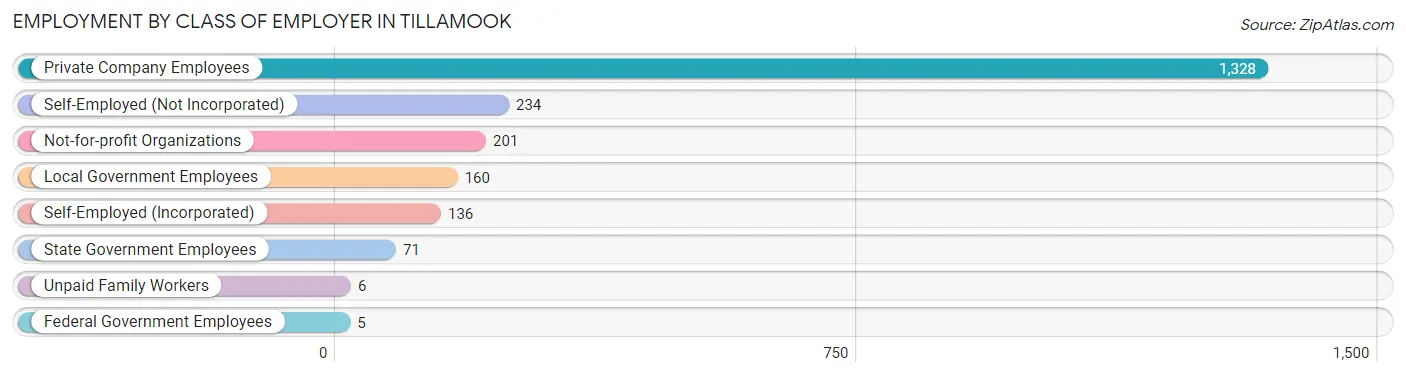
| Employer Class | # Employees | % Employees |
| Private Company Employees | 1,328 | 62.0% |
| Self-Employed (Incorporated) | 136 | 6.4% |
| Self-Employed (Not Incorporated) | 234 | 10.9% |
| Not-for-profit Organizations | 201 | 9.4% |
| Local Government Employees | 160 | 7.5% |
| State Government Employees | 71 | 3.3% |
| Federal Government Employees | 5 | 0.2% |
| Unpaid Family Workers | 6 | 0.3% |
| Total | 2,141 | 100.0% |
Employment Status by Age in Tillamook
According to the labor force statistics for Tillamook, out of the total population over 16 years of age (3,939), 58.2% or 2,292 individuals are in the labor force, with 5.0% or 115 of them unemployed. The age group with the highest labor force participation rate is 20 to 24 years, with 93.8% or 256 individuals in the labor force. Within the labor force, the 16 to 19 years age range has the highest percentage of unemployed individuals, with 76.1% or 70 of them being unemployed.
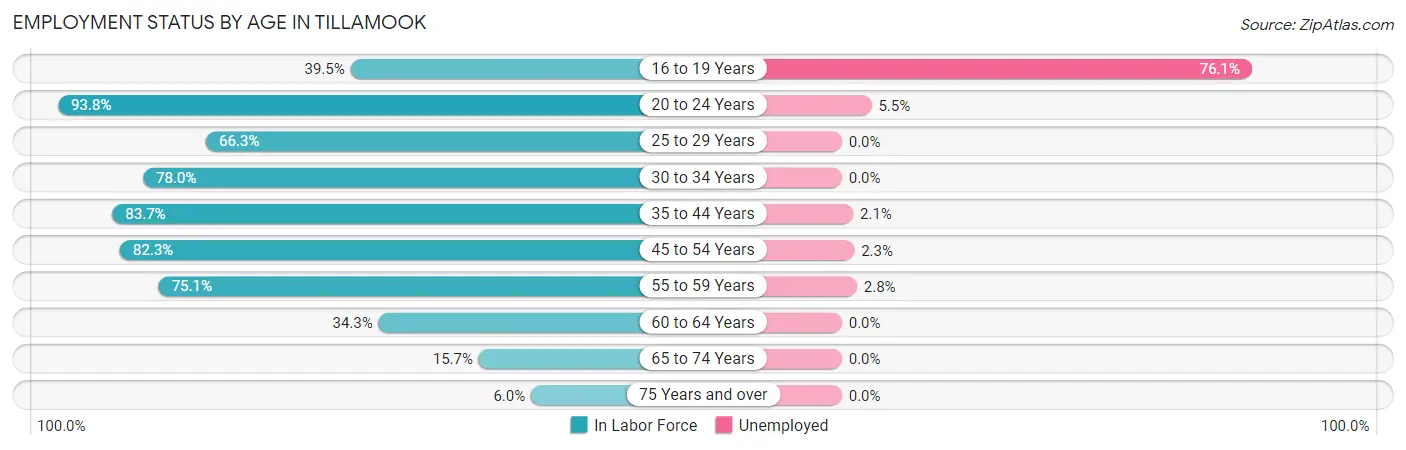
| Age Bracket | In Labor Force | Unemployed |
| 16 to 19 Years | 92 (39.5%) | 70 (76.1%) |
| 20 to 24 Years | 256 (93.8%) | 14 (5.5%) |
| 25 to 29 Years | 159 (66.3%) | 0 (0.0%) |
| 30 to 34 Years | 238 (78.0%) | 0 (0.0%) |
| 35 to 44 Years | 668 (83.7%) | 14 (2.1%) |
| 45 to 54 Years | 436 (82.3%) | 10 (2.3%) |
| 55 to 59 Years | 211 (75.1%) | 6 (2.8%) |
| 60 to 64 Years | 128 (34.3%) | 0 (0.0%) |
| 65 to 74 Years | 79 (15.7%) | 0 (0.0%) |
| 75 Years and over | 24 (6.0%) | 0 (0.0%) |
| Total | 2,292 (58.2%) | 115 (5.0%) |
Employment Status by Educational Attainment in Tillamook
According to labor force statistics for Tillamook, 72.8% of individuals (1,840) out of the total population between 25 and 64 years of age (2,527) are in the labor force, with 1.6% or 29 of them being unemployed. The group with the highest labor force participation rate are those with the educational attainment of bachelor's degree or higher, with 89.5% or 341 individuals in the labor force. Within the labor force, individuals with bachelor's degree or higher education have the highest percentage of unemployment, with 4.1% or 14 of them being unemployed.
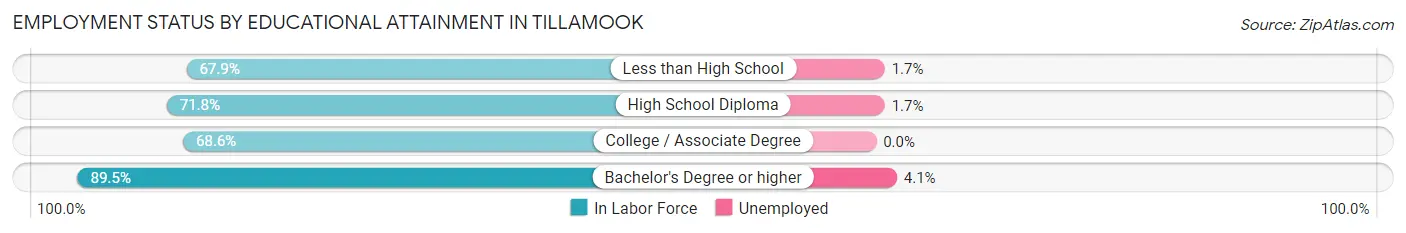
| Educational Attainment | In Labor Force | Unemployed |
| Less than High School | 294 (67.9%) | 7 (1.7%) |
| High School Diploma | 660 (71.8%) | 16 (1.7%) |
| College / Associate Degree | 545 (68.6%) | 0 (0.0%) |
| Bachelor's Degree or higher | 341 (89.5%) | 16 (4.1%) |
| Total | 1,840 (72.8%) | 40 (1.6%) |
Employment Occupations by Sex in Tillamook
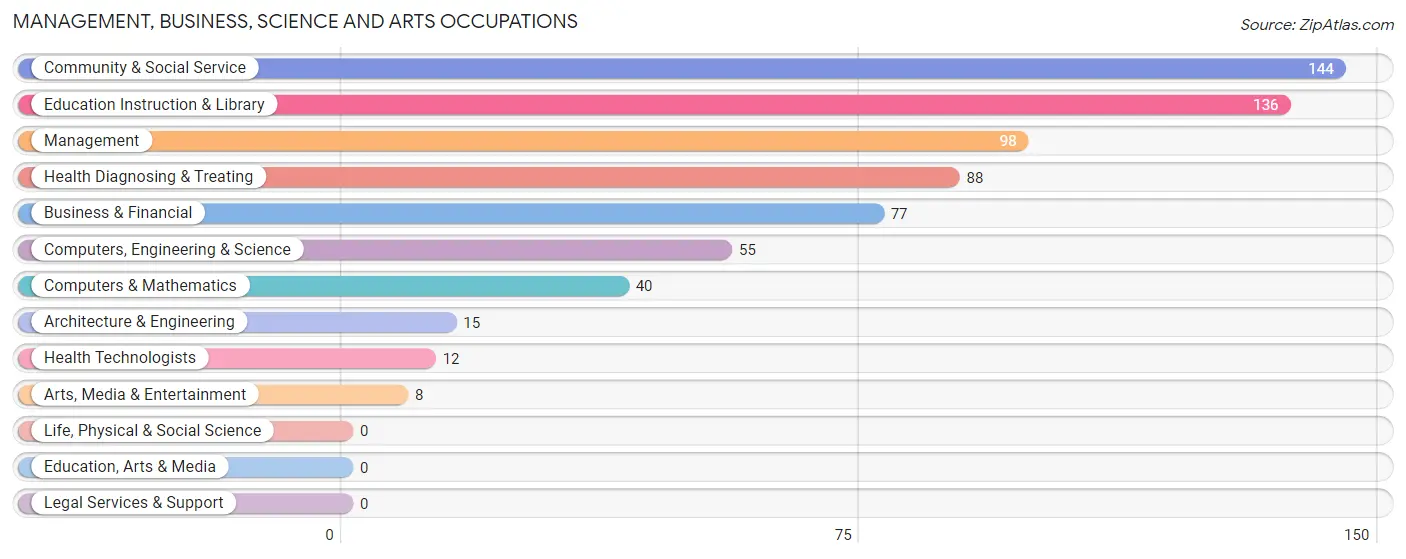
Management, Business, Science and Arts Occupations
The most common Management, Business, Science and Arts occupations in Tillamook are Community & Social Service (144 | 6.6%), Education Instruction & Library (136 | 6.2%), Management (98 | 4.5%), Health Diagnosing & Treating (88 | 4.0%), and Business & Financial (77 | 3.5%).
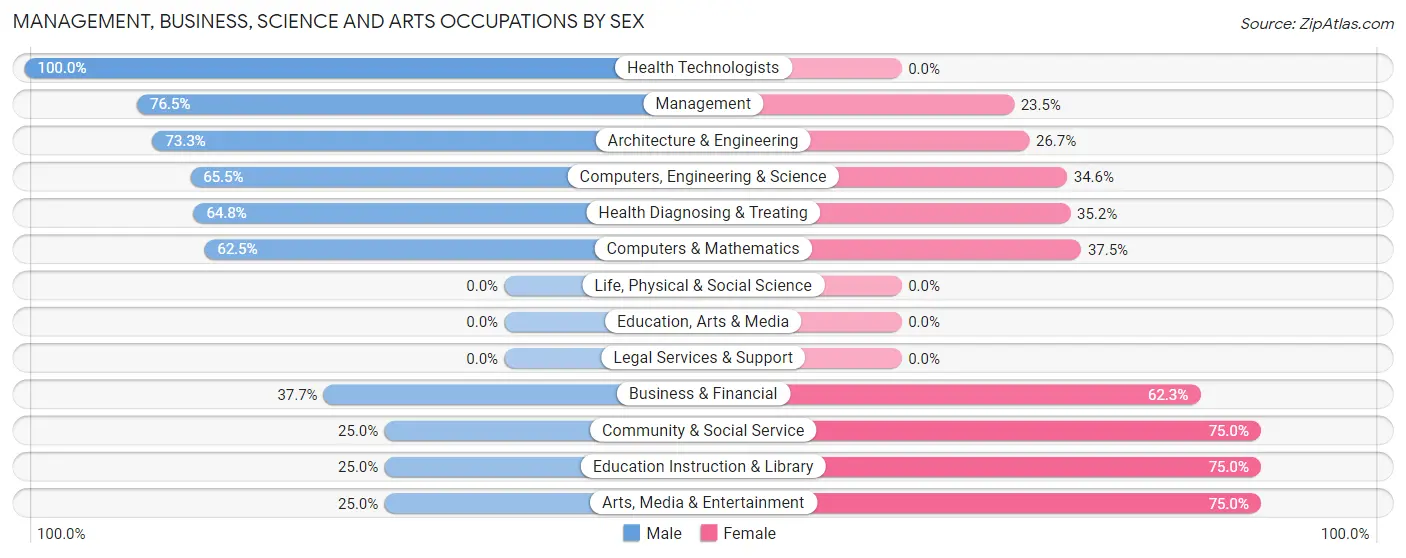
Management, Business, Science and Arts Occupations by Sex
Within the Management, Business, Science and Arts occupations in Tillamook, the most male-oriented occupations are Health Technologists (100.0%), Management (76.5%), and Architecture & Engineering (73.3%), while the most female-oriented occupations are Community & Social Service (75.0%), Education Instruction & Library (75.0%), and Arts, Media & Entertainment (75.0%).
| Occupation | Male | Female |
| Management | 75 (76.5%) | 23 (23.5%) |
| Business & Financial | 29 (37.7%) | 48 (62.3%) |
| Computers, Engineering & Science | 36 (65.4%) | 19 (34.5%) |
| Computers & Mathematics | 25 (62.5%) | 15 (37.5%) |
| Architecture & Engineering | 11 (73.3%) | 4 (26.7%) |
| Life, Physical & Social Science | 0 (0.0%) | 0 (0.0%) |
| Community & Social Service | 36 (25.0%) | 108 (75.0%) |
| Education, Arts & Media | 0 (0.0%) | 0 (0.0%) |
| Legal Services & Support | 0 (0.0%) | 0 (0.0%) |
| Education Instruction & Library | 34 (25.0%) | 102 (75.0%) |
| Arts, Media & Entertainment | 2 (25.0%) | 6 (75.0%) |
| Health Diagnosing & Treating | 57 (64.8%) | 31 (35.2%) |
| Health Technologists | 12 (100.0%) | 0 (0.0%) |
| Total (Category) | 233 (50.4%) | 229 (49.6%) |
| Total (Overall) | 1,179 (54.2%) | 998 (45.8%) |
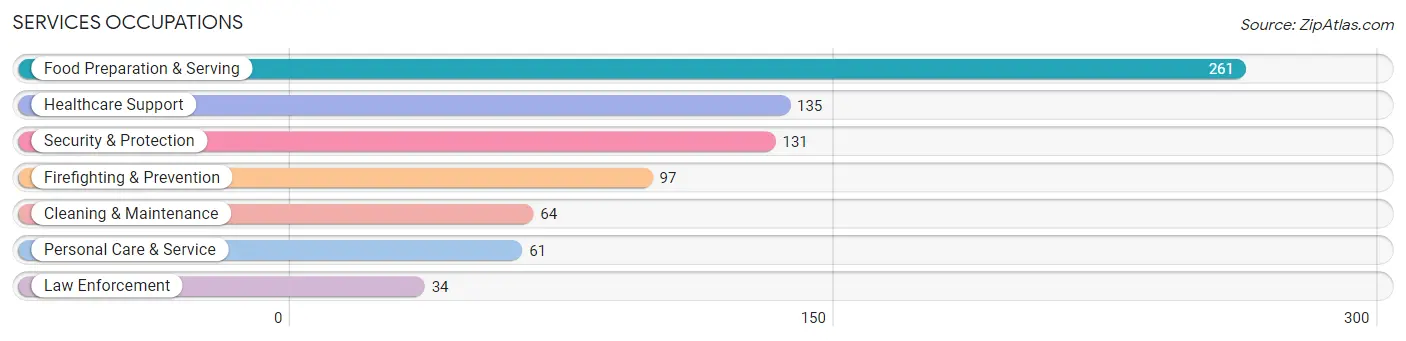
Services Occupations
The most common Services occupations in Tillamook are Food Preparation & Serving (261 | 12.0%), Healthcare Support (135 | 6.2%), Security & Protection (131 | 6.0%), Firefighting & Prevention (97 | 4.5%), and Cleaning & Maintenance (64 | 2.9%).
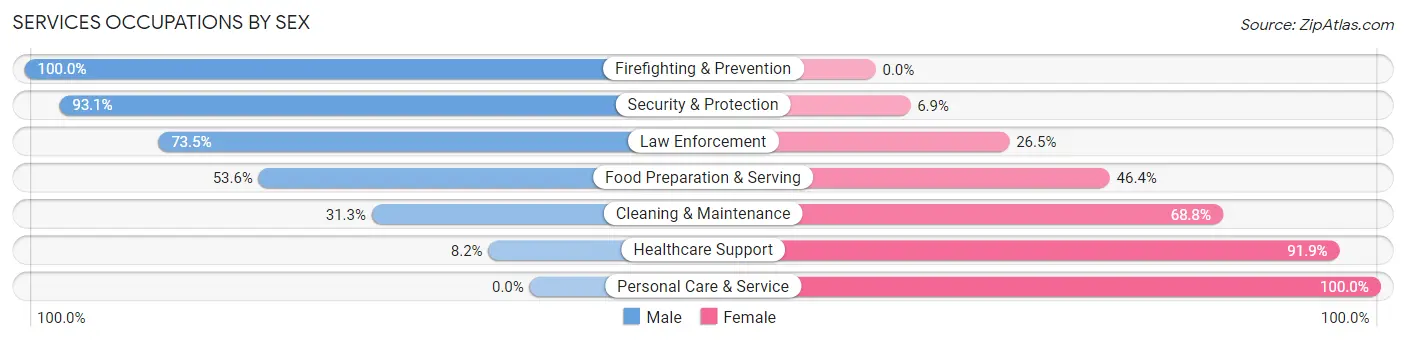
Services Occupations by Sex
Within the Services occupations in Tillamook, the most male-oriented occupations are Firefighting & Prevention (100.0%), Security & Protection (93.1%), and Law Enforcement (73.5%), while the most female-oriented occupations are Personal Care & Service (100.0%), Healthcare Support (91.8%), and Cleaning & Maintenance (68.8%).
| Occupation | Male | Female |
| Healthcare Support | 11 (8.2%) | 124 (91.8%) |
| Security & Protection | 122 (93.1%) | 9 (6.9%) |
| Firefighting & Prevention | 97 (100.0%) | 0 (0.0%) |
| Law Enforcement | 25 (73.5%) | 9 (26.5%) |
| Food Preparation & Serving | 140 (53.6%) | 121 (46.4%) |
| Cleaning & Maintenance | 20 (31.2%) | 44 (68.8%) |
| Personal Care & Service | 0 (0.0%) | 61 (100.0%) |
| Total (Category) | 293 (44.9%) | 359 (55.1%) |
| Total (Overall) | 1,179 (54.2%) | 998 (45.8%) |
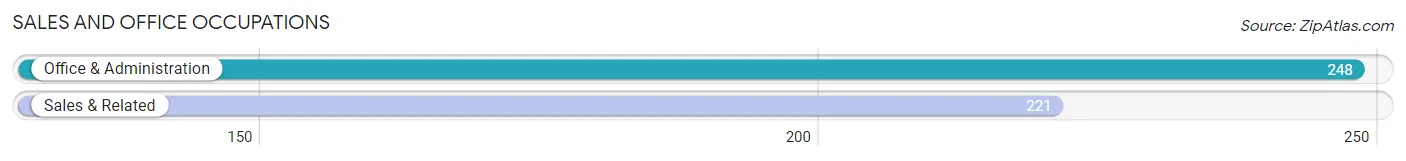
Sales and Office Occupations
The most common Sales and Office occupations in Tillamook are Office & Administration (248 | 11.4%), and Sales & Related (221 | 10.2%).
Sales and Office Occupations by Sex
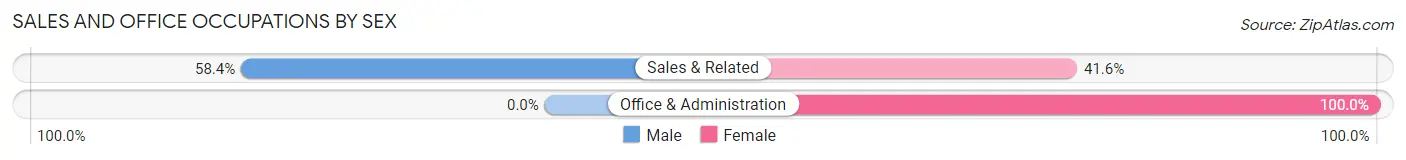
| Occupation | Male | Female |
| Sales & Related | 129 (58.4%) | 92 (41.6%) |
| Office & Administration | 0 (0.0%) | 248 (100.0%) |
| Total (Category) | 129 (27.5%) | 340 (72.5%) |
| Total (Overall) | 1,179 (54.2%) | 998 (45.8%) |
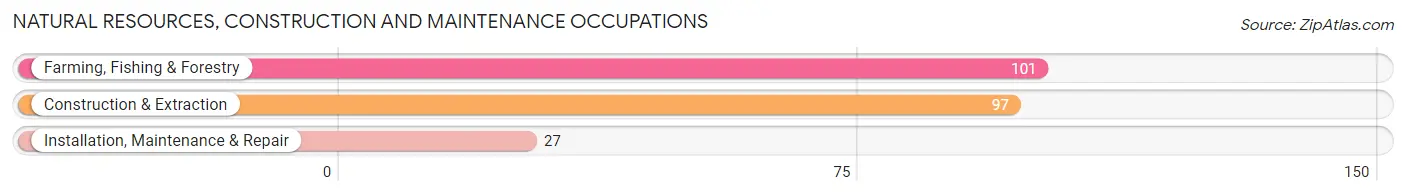
Natural Resources, Construction and Maintenance Occupations
The most common Natural Resources, Construction and Maintenance occupations in Tillamook are Farming, Fishing & Forestry (101 | 4.6%), Construction & Extraction (97 | 4.5%), and Installation, Maintenance & Repair (27 | 1.2%).
Natural Resources, Construction and Maintenance Occupations by Sex
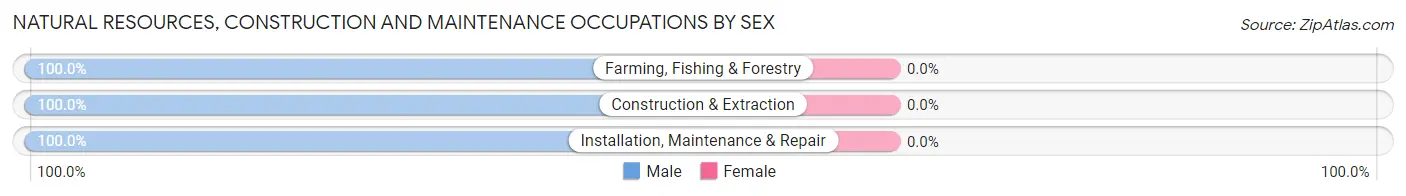
| Occupation | Male | Female |
| Farming, Fishing & Forestry | 101 (100.0%) | 0 (0.0%) |
| Construction & Extraction | 97 (100.0%) | 0 (0.0%) |
| Installation, Maintenance & Repair | 27 (100.0%) | 0 (0.0%) |
| Total (Category) | 225 (100.0%) | 0 (0.0%) |
| Total (Overall) | 1,179 (54.2%) | 998 (45.8%) |
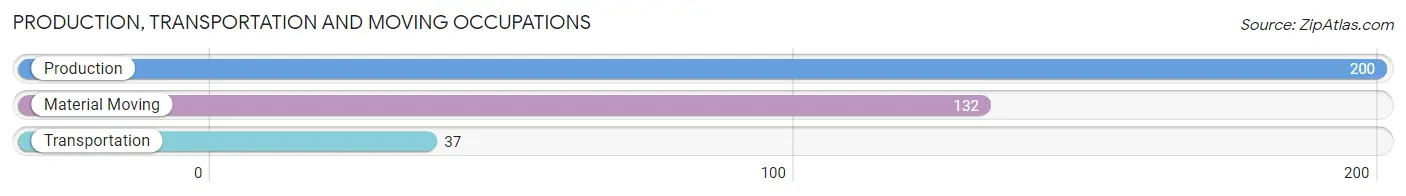
Production, Transportation and Moving Occupations
The most common Production, Transportation and Moving occupations in Tillamook are Production (200 | 9.2%), Material Moving (132 | 6.1%), and Transportation (37 | 1.7%).
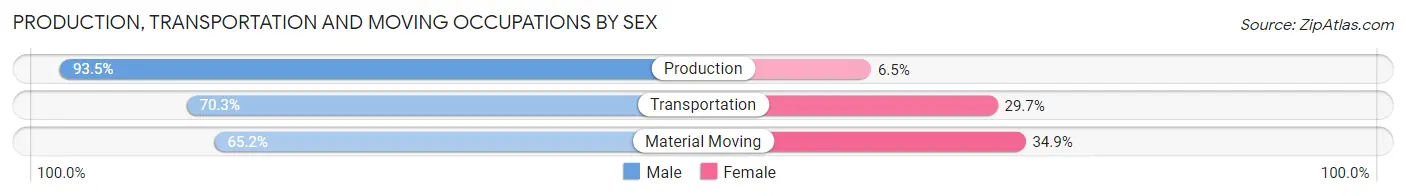
Production, Transportation and Moving Occupations by Sex
| Occupation | Male | Female |
| Production | 187 (93.5%) | 13 (6.5%) |
| Transportation | 26 (70.3%) | 11 (29.7%) |
| Material Moving | 86 (65.1%) | 46 (34.8%) |
| Total (Category) | 299 (81.0%) | 70 (19.0%) |
| Total (Overall) | 1,179 (54.2%) | 998 (45.8%) |
Employment Industries by Sex in Tillamook
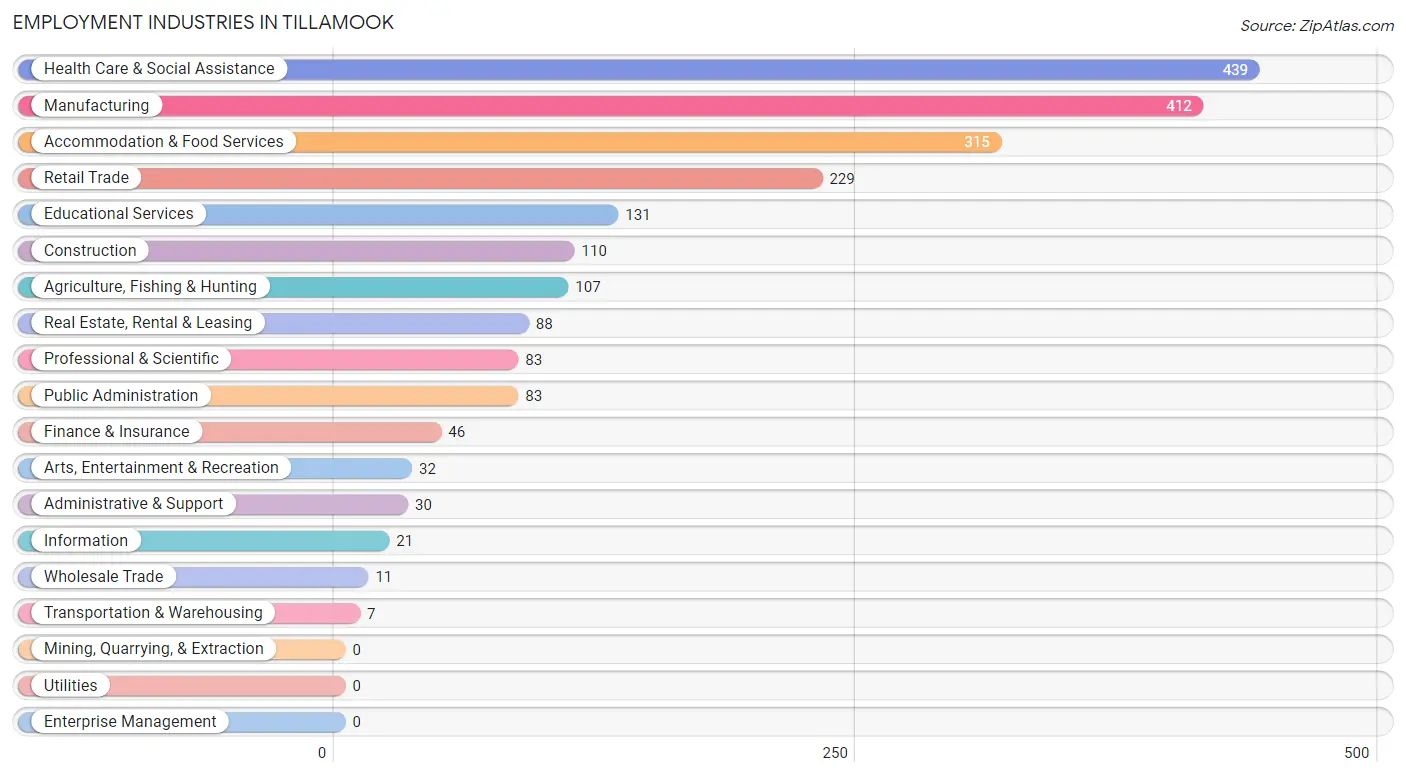
Employment Industries in Tillamook
The major employment industries in Tillamook include Health Care & Social Assistance (439 | 20.2%), Manufacturing (412 | 18.9%), Accommodation & Food Services (315 | 14.5%), Retail Trade (229 | 10.5%), and Educational Services (131 | 6.0%).
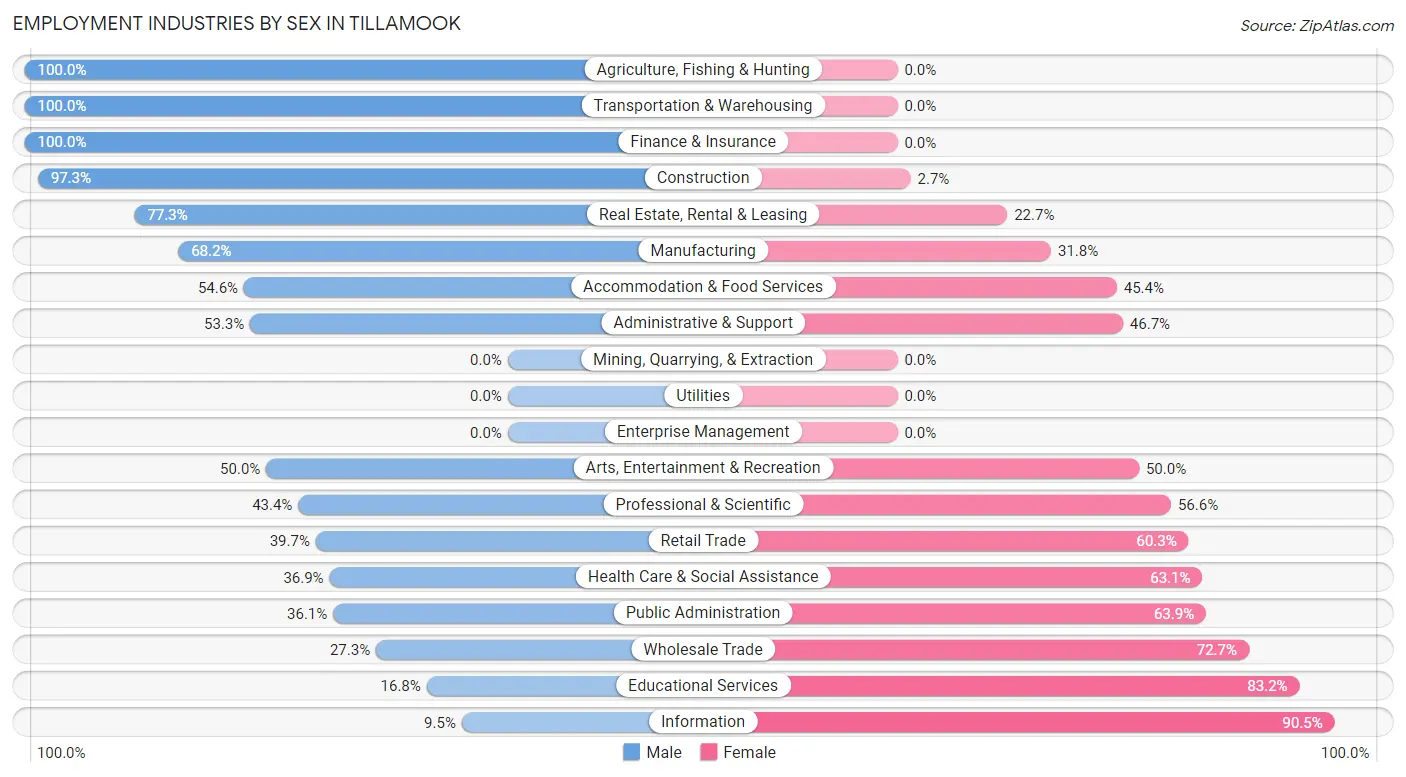
Employment Industries by Sex in Tillamook
The Tillamook industries that see more men than women are Agriculture, Fishing & Hunting (100.0%), Transportation & Warehousing (100.0%), and Finance & Insurance (100.0%), whereas the industries that tend to have a higher number of women are Information (90.5%), Educational Services (83.2%), and Wholesale Trade (72.7%).
| Industry | Male | Female |
| Agriculture, Fishing & Hunting | 107 (100.0%) | 0 (0.0%) |
| Mining, Quarrying, & Extraction | 0 (0.0%) | 0 (0.0%) |
| Construction | 107 (97.3%) | 3 (2.7%) |
| Manufacturing | 281 (68.2%) | 131 (31.8%) |
| Wholesale Trade | 3 (27.3%) | 8 (72.7%) |
| Retail Trade | 91 (39.7%) | 138 (60.3%) |
| Transportation & Warehousing | 7 (100.0%) | 0 (0.0%) |
| Utilities | 0 (0.0%) | 0 (0.0%) |
| Information | 2 (9.5%) | 19 (90.5%) |
| Finance & Insurance | 46 (100.0%) | 0 (0.0%) |
| Real Estate, Rental & Leasing | 68 (77.3%) | 20 (22.7%) |
| Professional & Scientific | 36 (43.4%) | 47 (56.6%) |
| Enterprise Management | 0 (0.0%) | 0 (0.0%) |
| Administrative & Support | 16 (53.3%) | 14 (46.7%) |
| Educational Services | 22 (16.8%) | 109 (83.2%) |
| Health Care & Social Assistance | 162 (36.9%) | 277 (63.1%) |
| Arts, Entertainment & Recreation | 16 (50.0%) | 16 (50.0%) |
| Accommodation & Food Services | 172 (54.6%) | 143 (45.4%) |
| Public Administration | 30 (36.1%) | 53 (63.9%) |
| Total | 1,179 (54.2%) | 998 (45.8%) |
Education in Tillamook
School Enrollment in Tillamook
The most common levels of schooling among the 1,184 students in Tillamook are elementary school (515 | 43.5%), middle school (251 | 21.2%), and high school (214 | 18.1%).
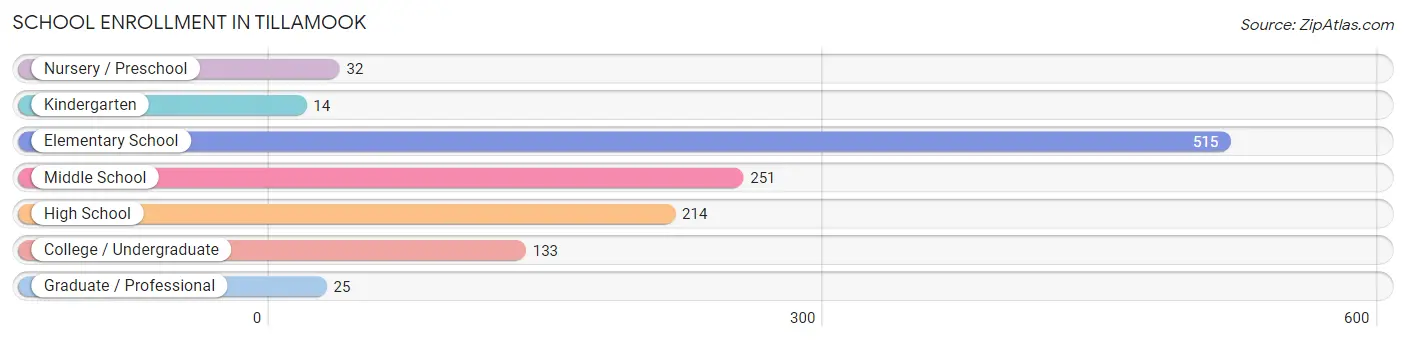
| School Level | # Students | % Students |
| Nursery / Preschool | 32 | 2.7% |
| Kindergarten | 14 | 1.2% |
| Elementary School | 515 | 43.5% |
| Middle School | 251 | 21.2% |
| High School | 214 | 18.1% |
| College / Undergraduate | 133 | 11.2% |
| Graduate / Professional | 25 | 2.1% |
| Total | 1,184 | 100.0% |
School Enrollment by Age by Funding Source in Tillamook
Out of a total of 1,184 students who are enrolled in schools in Tillamook, 43 (3.6%) attend a private institution, while the remaining 1,141 (96.4%) are enrolled in public schools. The age group of 35 years and over has the highest likelihood of being enrolled in private schools, with 20 (32.8% in the age bracket) enrolled. Conversely, the age group of 5 to 9 year old has the lowest likelihood of being enrolled in a private school, with 358 (100.0% in the age bracket) attending a public institution.
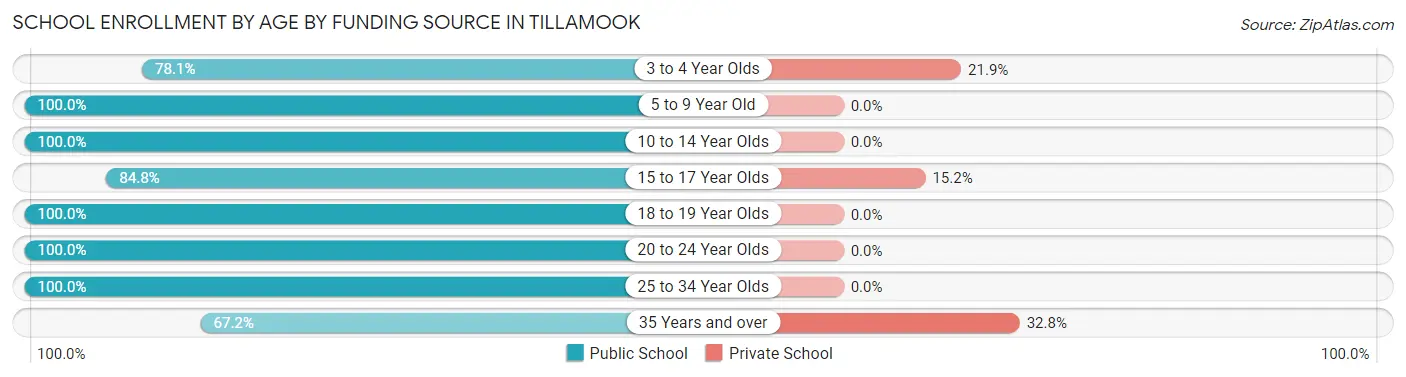
| Age Bracket | Public School | Private School |
| 3 to 4 Year Olds | 25 (78.1%) | 7 (21.9%) |
| 5 to 9 Year Old | 358 (100.0%) | 0 (0.0%) |
| 10 to 14 Year Olds | 471 (100.0%) | 0 (0.0%) |
| 15 to 17 Year Olds | 89 (84.8%) | 16 (15.2%) |
| 18 to 19 Year Olds | 58 (100.0%) | 0 (0.0%) |
| 20 to 24 Year Olds | 95 (100.0%) | 0 (0.0%) |
| 25 to 34 Year Olds | 4 (100.0%) | 0 (0.0%) |
| 35 Years and over | 41 (67.2%) | 20 (32.8%) |
| Total | 1,141 (96.4%) | 43 (3.6%) |
Educational Attainment by Field of Study in Tillamook
Bio, nature & agricultural (98 | 19.5%), education (82 | 16.3%), visual & performing arts (59 | 11.7%), social sciences (44 | 8.7%), and physical & health sciences (39 | 7.7%) are the most common fields of study among 503 individuals in Tillamook who have obtained a bachelor's degree or higher.
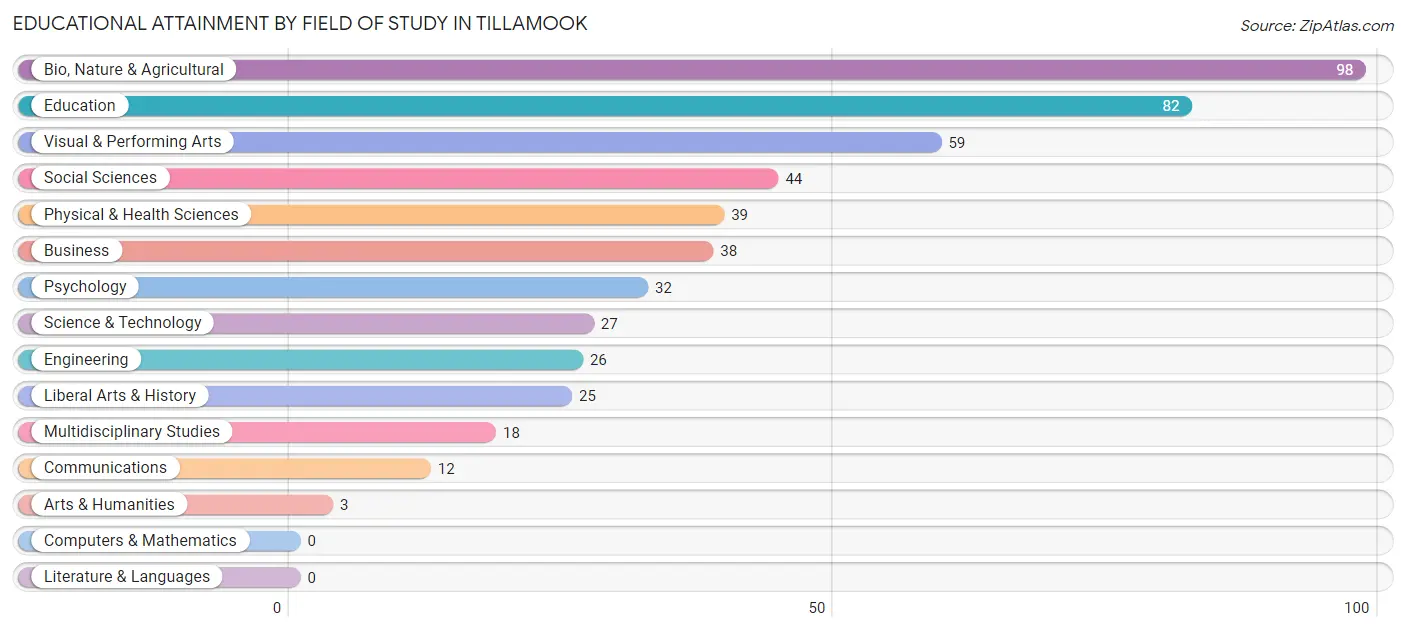
| Field of Study | # Graduates | % Graduates |
| Computers & Mathematics | 0 | 0.0% |
| Bio, Nature & Agricultural | 98 | 19.5% |
| Physical & Health Sciences | 39 | 7.7% |
| Psychology | 32 | 6.4% |
| Social Sciences | 44 | 8.7% |
| Engineering | 26 | 5.2% |
| Multidisciplinary Studies | 18 | 3.6% |
| Science & Technology | 27 | 5.4% |
| Business | 38 | 7.5% |
| Education | 82 | 16.3% |
| Literature & Languages | 0 | 0.0% |
| Liberal Arts & History | 25 | 5.0% |
| Visual & Performing Arts | 59 | 11.7% |
| Communications | 12 | 2.4% |
| Arts & Humanities | 3 | 0.6% |
| Total | 503 | 100.0% |
Transportation & Commute in Tillamook
Vehicle Availability by Sex in Tillamook
The most prevalent vehicle ownership categories in Tillamook are males with 2 vehicles (518, accounting for 43.9%) and females with 2 vehicles (428, making up 54.2%).
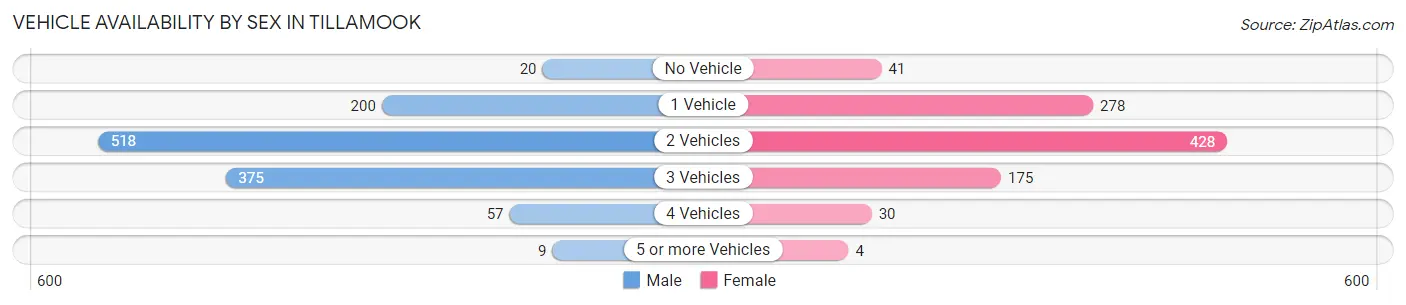
| Vehicles Available | Male | Female |
| No Vehicle | 20 (1.7%) | 41 (4.3%) |
| 1 Vehicle | 200 (17.0%) | 278 (29.1%) |
| 2 Vehicles | 518 (43.9%) | 428 (44.8%) |
| 3 Vehicles | 375 (31.8%) | 175 (18.3%) |
| 4 Vehicles | 57 (4.8%) | 30 (3.1%) |
| 5 or more Vehicles | 9 (0.8%) | 4 (0.4%) |
| Total | 1,179 (100.0%) | 956 (100.0%) |
Commute Time in Tillamook
The most frequently occuring commute durations in Tillamook are 5 to 9 minutes (744 commuters, 37.7%), 10 to 14 minutes (328 commuters, 16.6%), and 15 to 19 minutes (260 commuters, 13.2%).
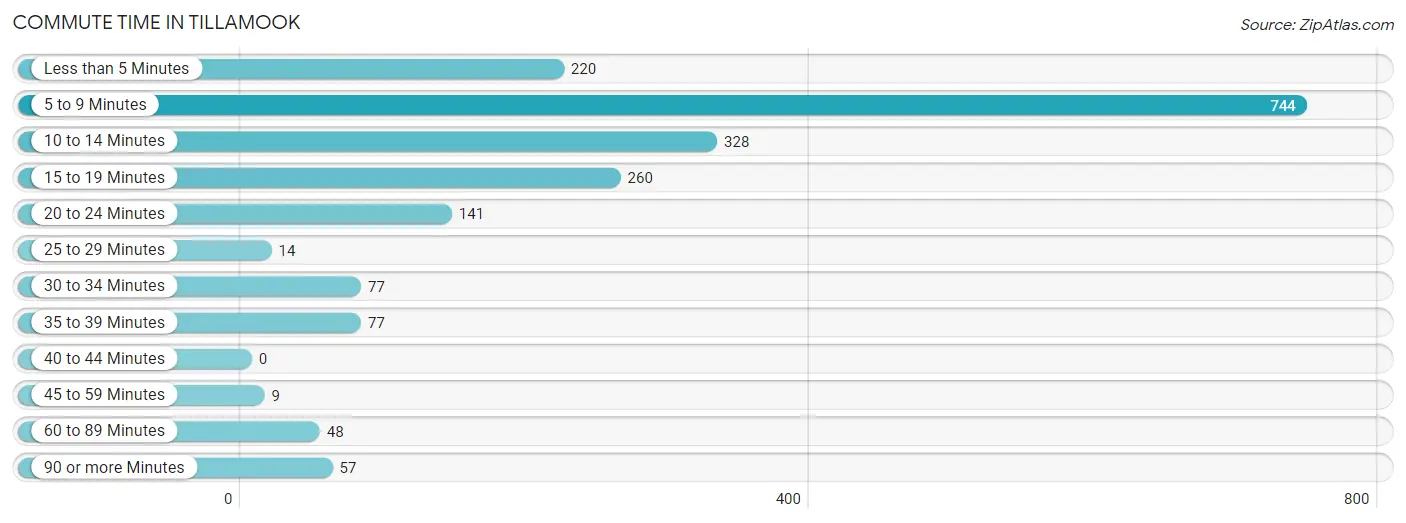
| Commute Time | # Commuters | % Commuters |
| Less than 5 Minutes | 220 | 11.1% |
| 5 to 9 Minutes | 744 | 37.7% |
| 10 to 14 Minutes | 328 | 16.6% |
| 15 to 19 Minutes | 260 | 13.2% |
| 20 to 24 Minutes | 141 | 7.1% |
| 25 to 29 Minutes | 14 | 0.7% |
| 30 to 34 Minutes | 77 | 3.9% |
| 35 to 39 Minutes | 77 | 3.9% |
| 40 to 44 Minutes | 0 | 0.0% |
| 45 to 59 Minutes | 9 | 0.5% |
| 60 to 89 Minutes | 48 | 2.4% |
| 90 or more Minutes | 57 | 2.9% |
Commute Time by Sex in Tillamook
The most common commute times in Tillamook are 5 to 9 minutes (392 commuters, 35.2%) for males and 5 to 9 minutes (352 commuters, 40.8%) for females.
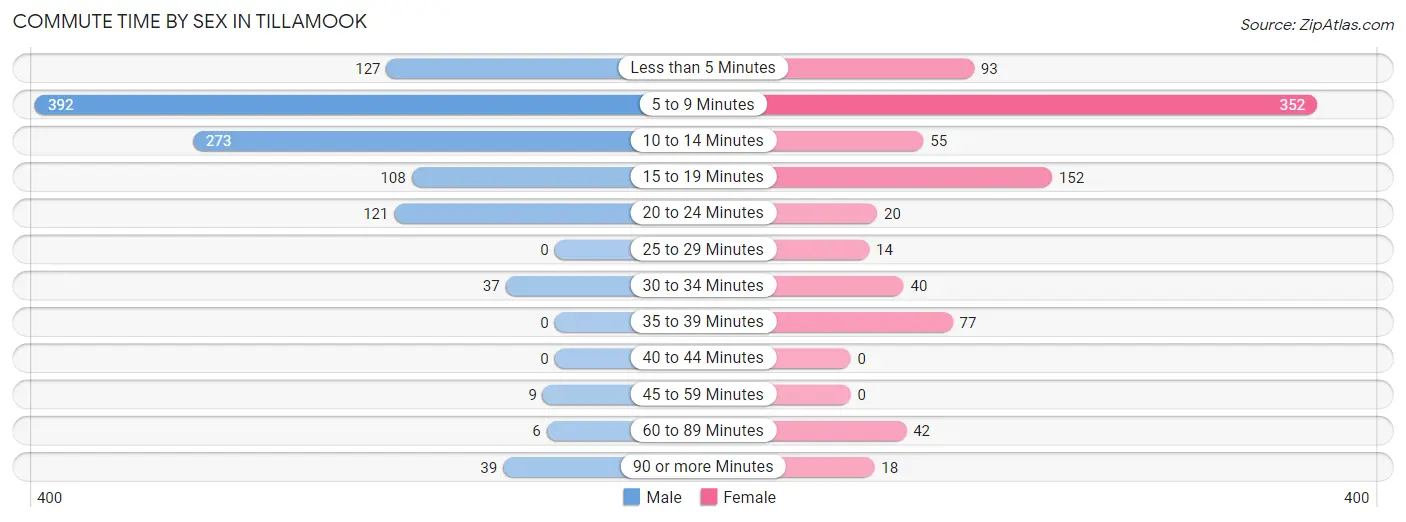
| Commute Time | Male | Female |
| Less than 5 Minutes | 127 (11.4%) | 93 (10.8%) |
| 5 to 9 Minutes | 392 (35.2%) | 352 (40.8%) |
| 10 to 14 Minutes | 273 (24.5%) | 55 (6.4%) |
| 15 to 19 Minutes | 108 (9.7%) | 152 (17.6%) |
| 20 to 24 Minutes | 121 (10.9%) | 20 (2.3%) |
| 25 to 29 Minutes | 0 (0.0%) | 14 (1.6%) |
| 30 to 34 Minutes | 37 (3.3%) | 40 (4.6%) |
| 35 to 39 Minutes | 0 (0.0%) | 77 (8.9%) |
| 40 to 44 Minutes | 0 (0.0%) | 0 (0.0%) |
| 45 to 59 Minutes | 9 (0.8%) | 0 (0.0%) |
| 60 to 89 Minutes | 6 (0.5%) | 42 (4.9%) |
| 90 or more Minutes | 39 (3.5%) | 18 (2.1%) |
Time of Departure to Work by Sex in Tillamook
The most frequent times of departure to work in Tillamook are 12:00 AM to 4:59 AM (246, 22.1%) for males and 7:30 AM to 7:59 AM (285, 33.0%) for females.
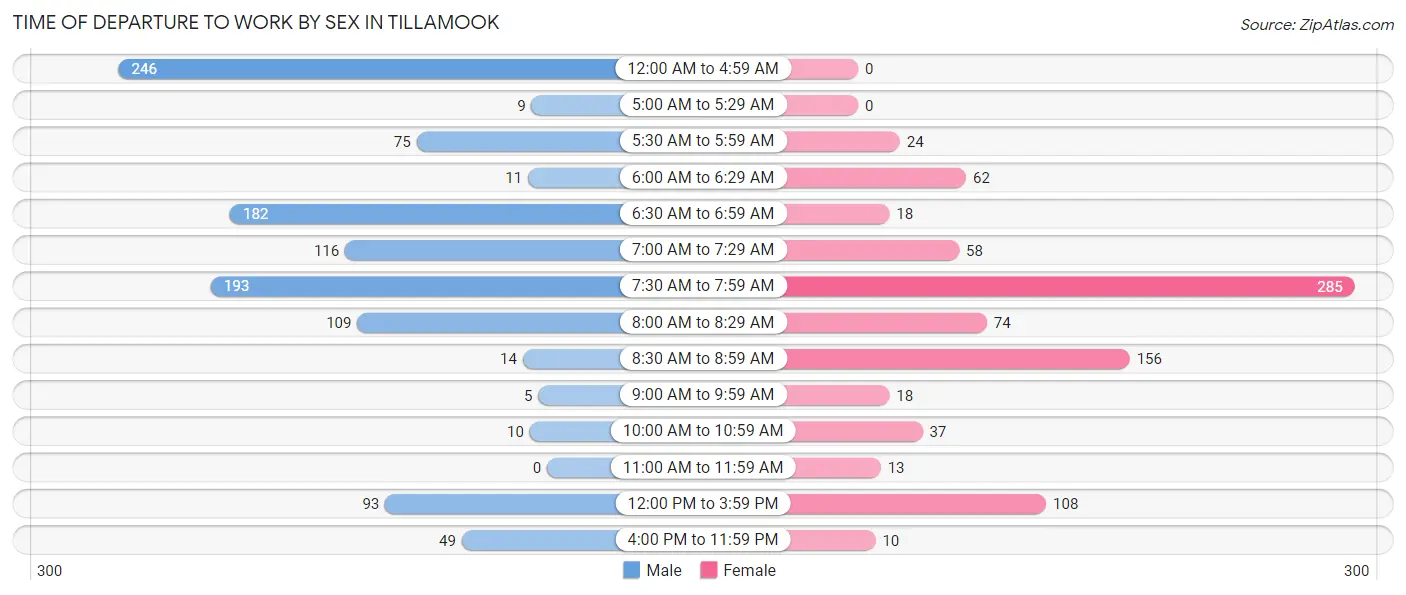
| Time of Departure | Male | Female |
| 12:00 AM to 4:59 AM | 246 (22.1%) | 0 (0.0%) |
| 5:00 AM to 5:29 AM | 9 (0.8%) | 0 (0.0%) |
| 5:30 AM to 5:59 AM | 75 (6.7%) | 24 (2.8%) |
| 6:00 AM to 6:29 AM | 11 (1.0%) | 62 (7.2%) |
| 6:30 AM to 6:59 AM | 182 (16.4%) | 18 (2.1%) |
| 7:00 AM to 7:29 AM | 116 (10.4%) | 58 (6.7%) |
| 7:30 AM to 7:59 AM | 193 (17.4%) | 285 (33.0%) |
| 8:00 AM to 8:29 AM | 109 (9.8%) | 74 (8.6%) |
| 8:30 AM to 8:59 AM | 14 (1.3%) | 156 (18.1%) |
| 9:00 AM to 9:59 AM | 5 (0.4%) | 18 (2.1%) |
| 10:00 AM to 10:59 AM | 10 (0.9%) | 37 (4.3%) |
| 11:00 AM to 11:59 AM | 0 (0.0%) | 13 (1.5%) |
| 12:00 PM to 3:59 PM | 93 (8.4%) | 108 (12.5%) |
| 4:00 PM to 11:59 PM | 49 (4.4%) | 10 (1.2%) |
| Total | 1,112 (100.0%) | 863 (100.0%) |
Housing Occupancy in Tillamook
Occupancy by Ownership in Tillamook
Of the total 2,074 dwellings in Tillamook, owner-occupied units account for 909 (43.8%), while renter-occupied units make up 1,165 (56.2%).
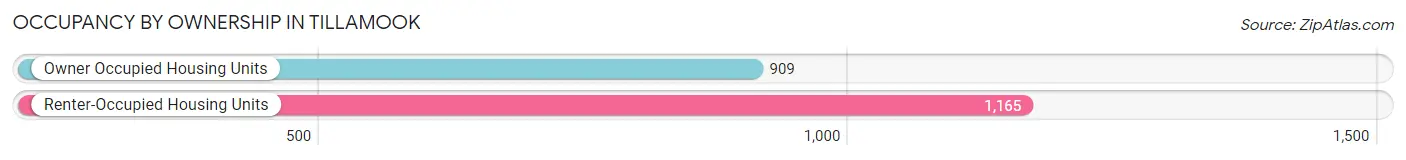
| Occupancy | # Housing Units | % Housing Units |
| Owner Occupied Housing Units | 909 | 43.8% |
| Renter-Occupied Housing Units | 1,165 | 56.2% |
| Total Occupied Housing Units | 2,074 | 100.0% |
Occupancy by Household Size in Tillamook
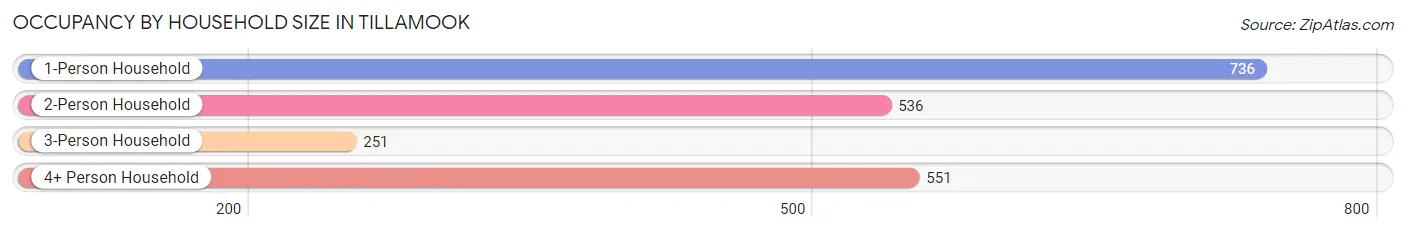
| Household Size | # Housing Units | % Housing Units |
| 1-Person Household | 736 | 35.5% |
| 2-Person Household | 536 | 25.8% |
| 3-Person Household | 251 | 12.1% |
| 4+ Person Household | 551 | 26.6% |
| Total Housing Units | 2,074 | 100.0% |
Occupancy by Ownership by Household Size in Tillamook
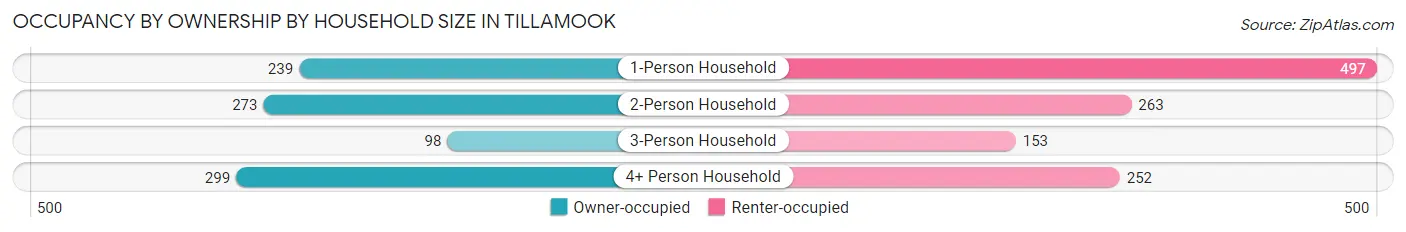
| Household Size | Owner-occupied | Renter-occupied |
| 1-Person Household | 239 (32.5%) | 497 (67.5%) |
| 2-Person Household | 273 (50.9%) | 263 (49.1%) |
| 3-Person Household | 98 (39.0%) | 153 (61.0%) |
| 4+ Person Household | 299 (54.3%) | 252 (45.7%) |
| Total Housing Units | 909 (43.8%) | 1,165 (56.2%) |
Occupancy by Educational Attainment in Tillamook
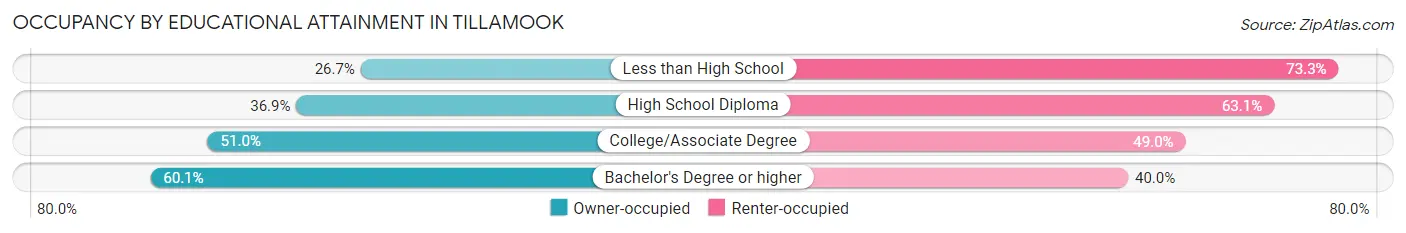
| Household Size | Owner-occupied | Renter-occupied |
| Less than High School | 67 (26.7%) | 184 (73.3%) |
| High School Diploma | 320 (36.9%) | 547 (63.1%) |
| College/Associate Degree | 292 (51.0%) | 281 (49.0%) |
| Bachelor's Degree or higher | 230 (60.1%) | 153 (40.0%) |
Occupancy by Age of Householder in Tillamook
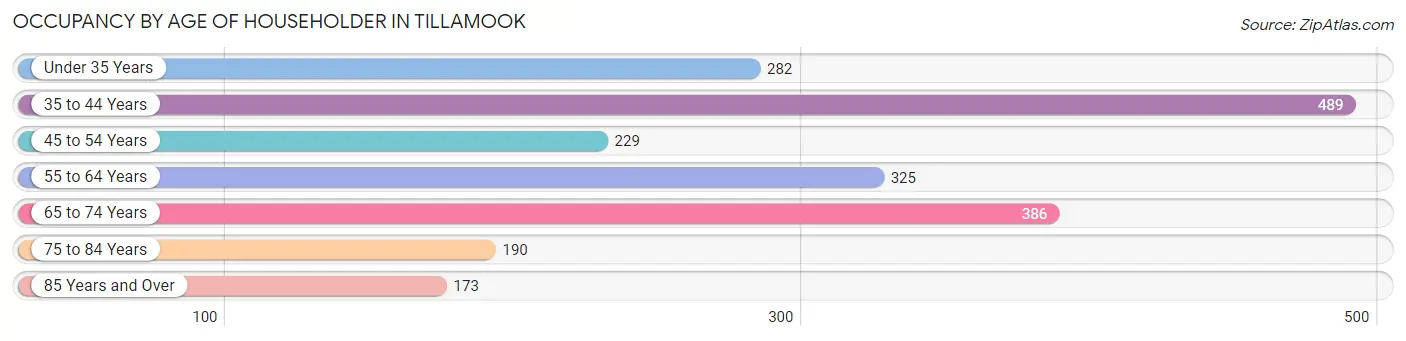
| Age Bracket | # Households | % Households |
| Under 35 Years | 282 | 13.6% |
| 35 to 44 Years | 489 | 23.6% |
| 45 to 54 Years | 229 | 11.0% |
| 55 to 64 Years | 325 | 15.7% |
| 65 to 74 Years | 386 | 18.6% |
| 75 to 84 Years | 190 | 9.2% |
| 85 Years and Over | 173 | 8.3% |
| Total | 2,074 | 100.0% |
Housing Finances in Tillamook
Median Income by Occupancy in Tillamook
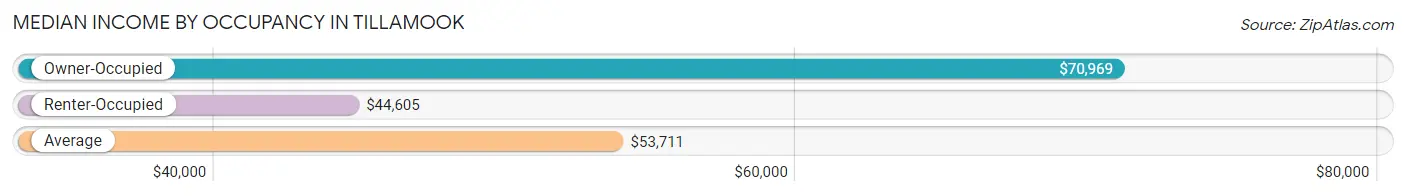
| Occupancy Type | # Households | Median Income |
| Owner-Occupied | 909 (43.8%) | $70,969 |
| Renter-Occupied | 1,165 (56.2%) | $44,605 |
| Average | 2,074 (100.0%) | $53,711 |
Occupancy by Householder Income Bracket in Tillamook
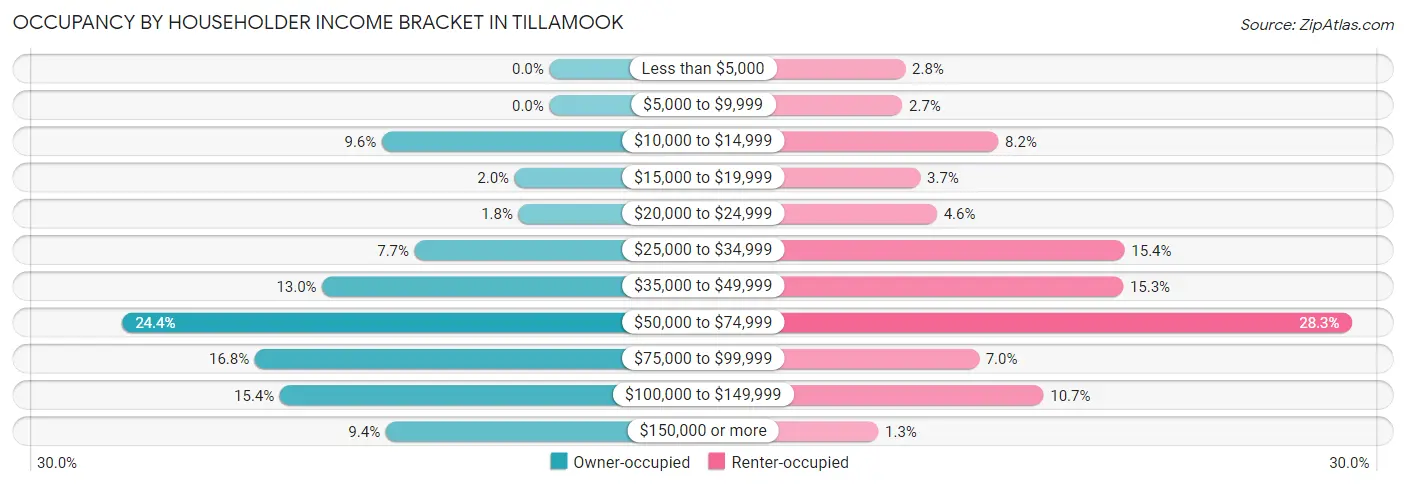
| Income Bracket | Owner-occupied | Renter-occupied |
| Less than $5,000 | 0 (0.0%) | 33 (2.8%) |
| $5,000 to $9,999 | 0 (0.0%) | 31 (2.7%) |
| $10,000 to $14,999 | 87 (9.6%) | 95 (8.2%) |
| $15,000 to $19,999 | 18 (2.0%) | 43 (3.7%) |
| $20,000 to $24,999 | 16 (1.8%) | 54 (4.6%) |
| $25,000 to $34,999 | 70 (7.7%) | 179 (15.4%) |
| $35,000 to $49,999 | 118 (13.0%) | 178 (15.3%) |
| $50,000 to $74,999 | 222 (24.4%) | 330 (28.3%) |
| $75,000 to $99,999 | 153 (16.8%) | 82 (7.0%) |
| $100,000 to $149,999 | 140 (15.4%) | 125 (10.7%) |
| $150,000 or more | 85 (9.3%) | 15 (1.3%) |
| Total | 909 (100.0%) | 1,165 (100.0%) |
Monthly Housing Cost Tiers in Tillamook
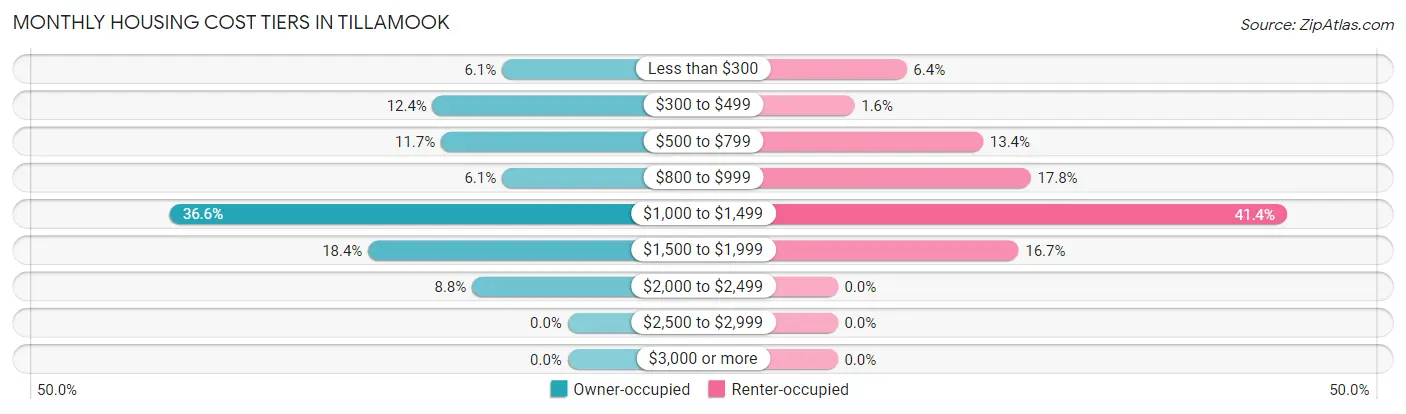
| Monthly Cost | Owner-occupied | Renter-occupied |
| Less than $300 | 55 (6.0%) | 74 (6.4%) |
| $300 to $499 | 113 (12.4%) | 18 (1.5%) |
| $500 to $799 | 106 (11.7%) | 156 (13.4%) |
| $800 to $999 | 55 (6.0%) | 207 (17.8%) |
| $1,000 to $1,499 | 333 (36.6%) | 482 (41.4%) |
| $1,500 to $1,999 | 167 (18.4%) | 194 (16.7%) |
| $2,000 to $2,499 | 80 (8.8%) | 0 (0.0%) |
| $2,500 to $2,999 | 0 (0.0%) | 0 (0.0%) |
| $3,000 or more | 0 (0.0%) | 0 (0.0%) |
| Total | 909 (100.0%) | 1,165 (100.0%) |
Physical Housing Characteristics in Tillamook
Housing Structures in Tillamook
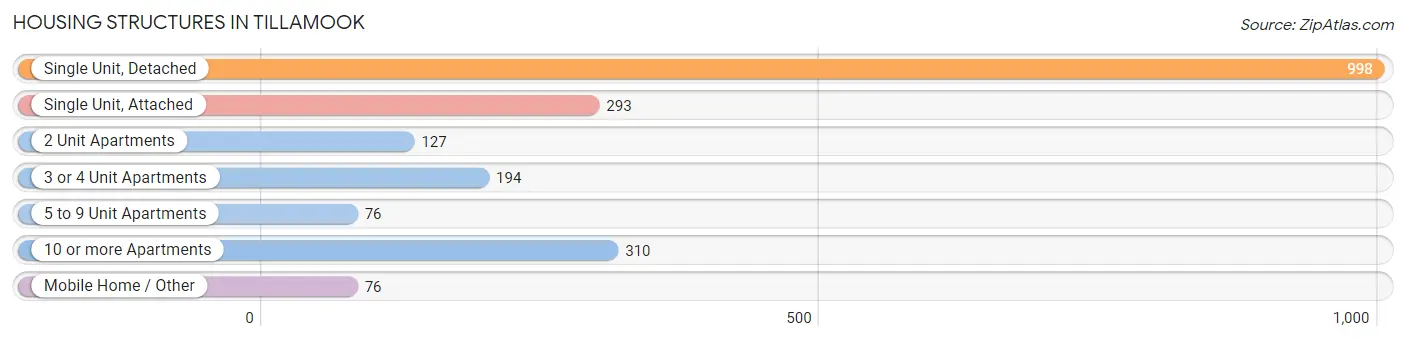
| Structure Type | # Housing Units | % Housing Units |
| Single Unit, Detached | 998 | 48.1% |
| Single Unit, Attached | 293 | 14.1% |
| 2 Unit Apartments | 127 | 6.1% |
| 3 or 4 Unit Apartments | 194 | 9.3% |
| 5 to 9 Unit Apartments | 76 | 3.7% |
| 10 or more Apartments | 310 | 14.9% |
| Mobile Home / Other | 76 | 3.7% |
| Total | 2,074 | 100.0% |
Housing Structures by Occupancy in Tillamook
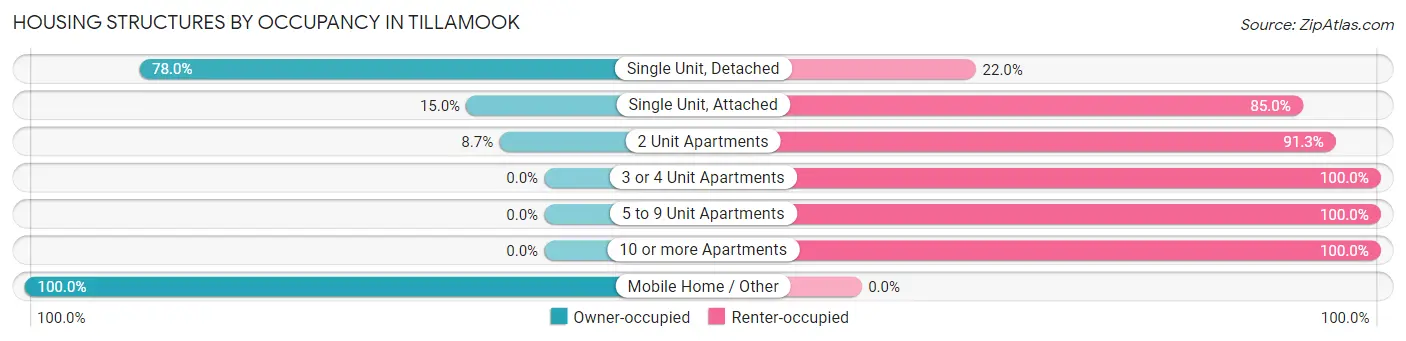
| Structure Type | Owner-occupied | Renter-occupied |
| Single Unit, Detached | 778 (78.0%) | 220 (22.0%) |
| Single Unit, Attached | 44 (15.0%) | 249 (85.0%) |
| 2 Unit Apartments | 11 (8.7%) | 116 (91.3%) |
| 3 or 4 Unit Apartments | 0 (0.0%) | 194 (100.0%) |
| 5 to 9 Unit Apartments | 0 (0.0%) | 76 (100.0%) |
| 10 or more Apartments | 0 (0.0%) | 310 (100.0%) |
| Mobile Home / Other | 76 (100.0%) | 0 (0.0%) |
| Total | 909 (43.8%) | 1,165 (56.2%) |
Housing Structures by Number of Rooms in Tillamook
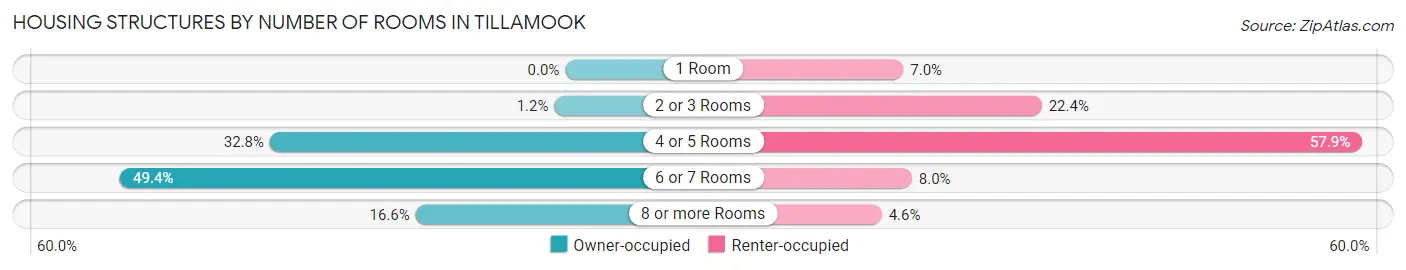
| Number of Rooms | Owner-occupied | Renter-occupied |
| 1 Room | 0 (0.0%) | 82 (7.0%) |
| 2 or 3 Rooms | 11 (1.2%) | 261 (22.4%) |
| 4 or 5 Rooms | 298 (32.8%) | 675 (57.9%) |
| 6 or 7 Rooms | 449 (49.4%) | 93 (8.0%) |
| 8 or more Rooms | 151 (16.6%) | 54 (4.6%) |
| Total | 909 (100.0%) | 1,165 (100.0%) |
Housing Structure by Heating Type in Tillamook
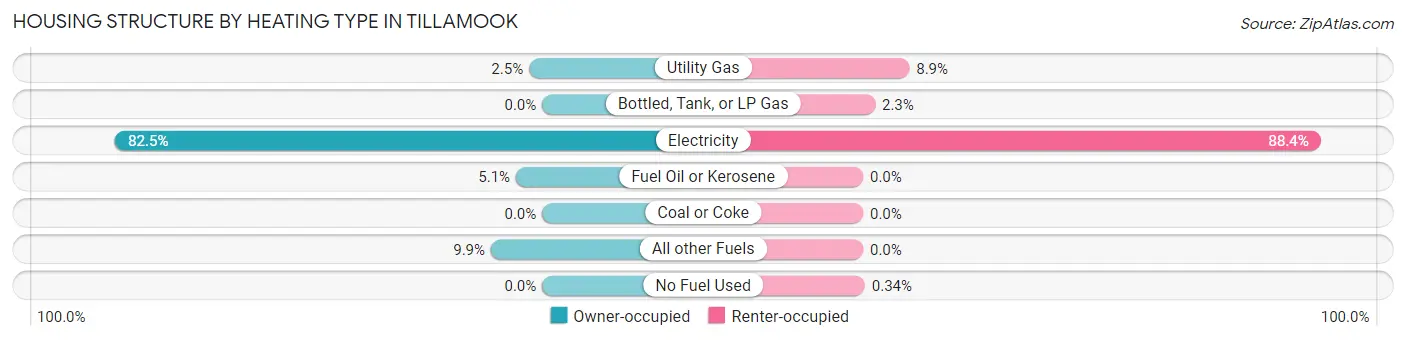
| Heating Type | Owner-occupied | Renter-occupied |
| Utility Gas | 23 (2.5%) | 104 (8.9%) |
| Bottled, Tank, or LP Gas | 0 (0.0%) | 27 (2.3%) |
| Electricity | 750 (82.5%) | 1,030 (88.4%) |
| Fuel Oil or Kerosene | 46 (5.1%) | 0 (0.0%) |
| Coal or Coke | 0 (0.0%) | 0 (0.0%) |
| All other Fuels | 90 (9.9%) | 0 (0.0%) |
| No Fuel Used | 0 (0.0%) | 4 (0.3%) |
| Total | 909 (100.0%) | 1,165 (100.0%) |
Household Vehicle Usage in Tillamook
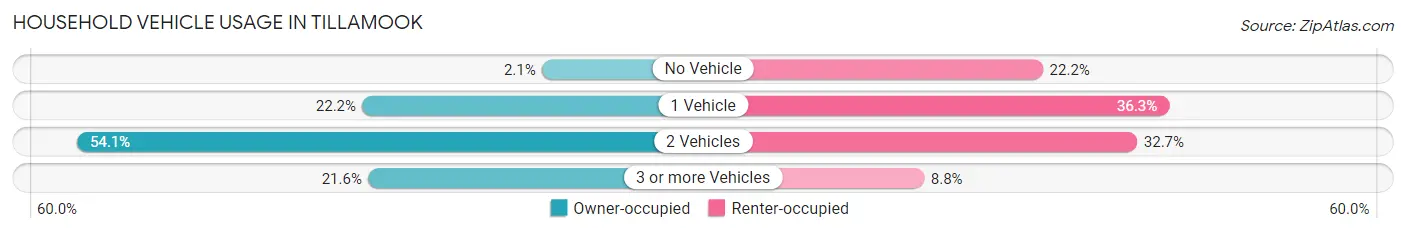
| Vehicles per Household | Owner-occupied | Renter-occupied |
| No Vehicle | 19 (2.1%) | 258 (22.2%) |
| 1 Vehicle | 202 (22.2%) | 423 (36.3%) |
| 2 Vehicles | 492 (54.1%) | 381 (32.7%) |
| 3 or more Vehicles | 196 (21.6%) | 103 (8.8%) |
| Total | 909 (100.0%) | 1,165 (100.0%) |
Real Estate & Mortgages in Tillamook
Real Estate and Mortgage Overview in Tillamook
| Characteristic | Without Mortgage | With Mortgage |
| Housing Units | 262 | 647 |
| Median Property Value | $250,800 | $261,500 |
| Median Household Income | $52,083 | $44 |
| Monthly Housing Costs | $455 | $0 |
| Real Estate Taxes | $1,945 | $0 |
Property Value by Mortgage Status in Tillamook
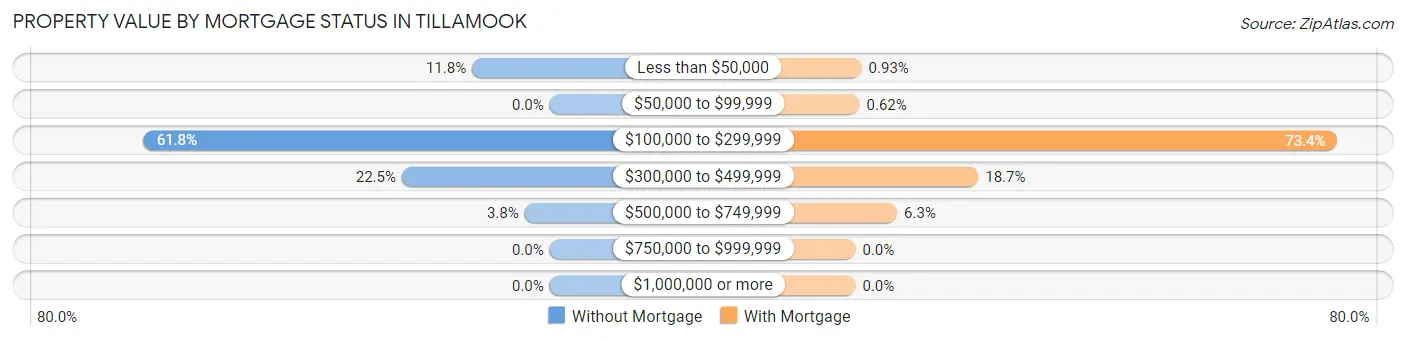
| Property Value | Without Mortgage | With Mortgage |
| Less than $50,000 | 31 (11.8%) | 6 (0.9%) |
| $50,000 to $99,999 | 0 (0.0%) | 4 (0.6%) |
| $100,000 to $299,999 | 162 (61.8%) | 475 (73.4%) |
| $300,000 to $499,999 | 59 (22.5%) | 121 (18.7%) |
| $500,000 to $749,999 | 10 (3.8%) | 41 (6.3%) |
| $750,000 to $999,999 | 0 (0.0%) | 0 (0.0%) |
| $1,000,000 or more | 0 (0.0%) | 0 (0.0%) |
| Total | 262 (100.0%) | 647 (100.0%) |
Household Income by Mortgage Status in Tillamook
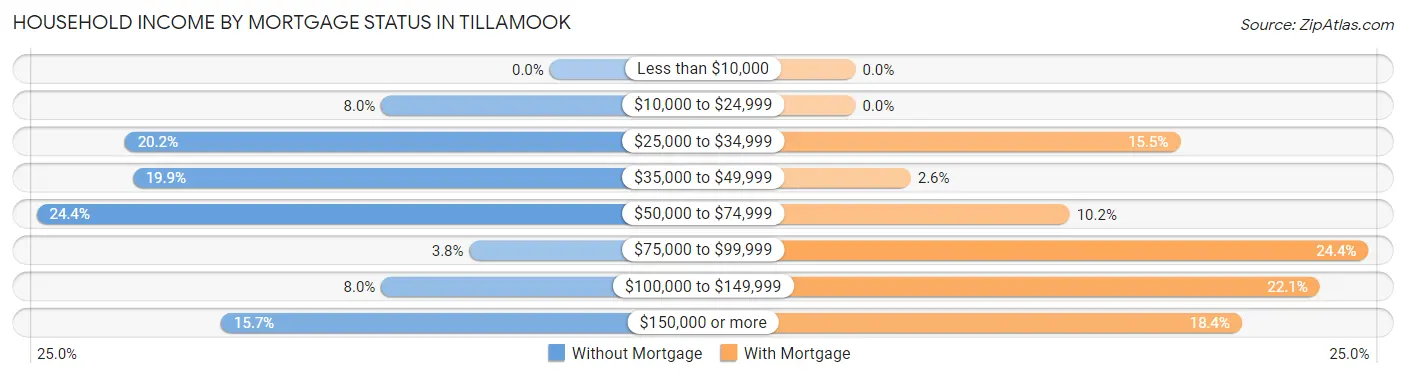
| Household Income | Without Mortgage | With Mortgage |
| Less than $10,000 | 0 (0.0%) | 0 (0.0%) |
| $10,000 to $24,999 | 21 (8.0%) | 0 (0.0%) |
| $25,000 to $34,999 | 53 (20.2%) | 100 (15.5%) |
| $35,000 to $49,999 | 52 (19.9%) | 17 (2.6%) |
| $50,000 to $74,999 | 64 (24.4%) | 66 (10.2%) |
| $75,000 to $99,999 | 10 (3.8%) | 158 (24.4%) |
| $100,000 to $149,999 | 21 (8.0%) | 143 (22.1%) |
| $150,000 or more | 41 (15.7%) | 119 (18.4%) |
| Total | 262 (100.0%) | 647 (100.0%) |
Property Value to Household Income Ratio in Tillamook
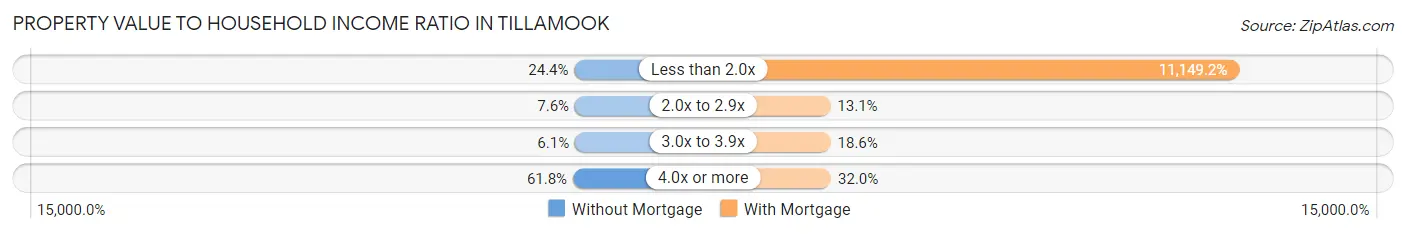
| Value-to-Income Ratio | Without Mortgage | With Mortgage |
| Less than 2.0x | 64 (24.4%) | 72,135 (11,149.2%) |
| 2.0x to 2.9x | 20 (7.6%) | 85 (13.1%) |
| 3.0x to 3.9x | 16 (6.1%) | 120 (18.5%) |
| 4.0x or more | 162 (61.8%) | 207 (32.0%) |
| Total | 262 (100.0%) | 647 (100.0%) |
Real Estate Taxes by Mortgage Status in Tillamook
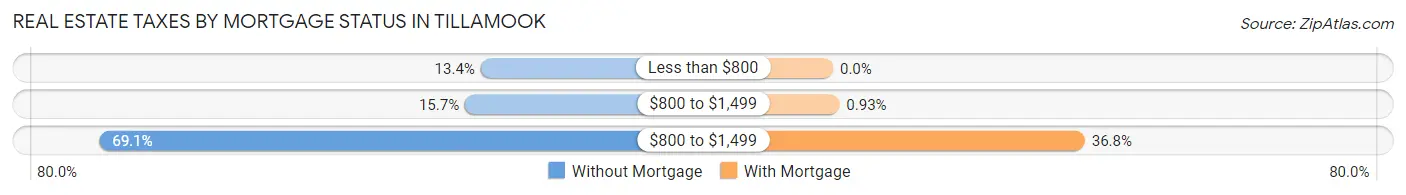
| Property Taxes | Without Mortgage | With Mortgage |
| Less than $800 | 35 (13.4%) | 0 (0.0%) |
| $800 to $1,499 | 41 (15.7%) | 6 (0.9%) |
| $800 to $1,499 | 181 (69.1%) | 238 (36.8%) |
| Total | 262 (100.0%) | 647 (100.0%) |
Health & Disability in Tillamook
Health Insurance Coverage by Age in Tillamook
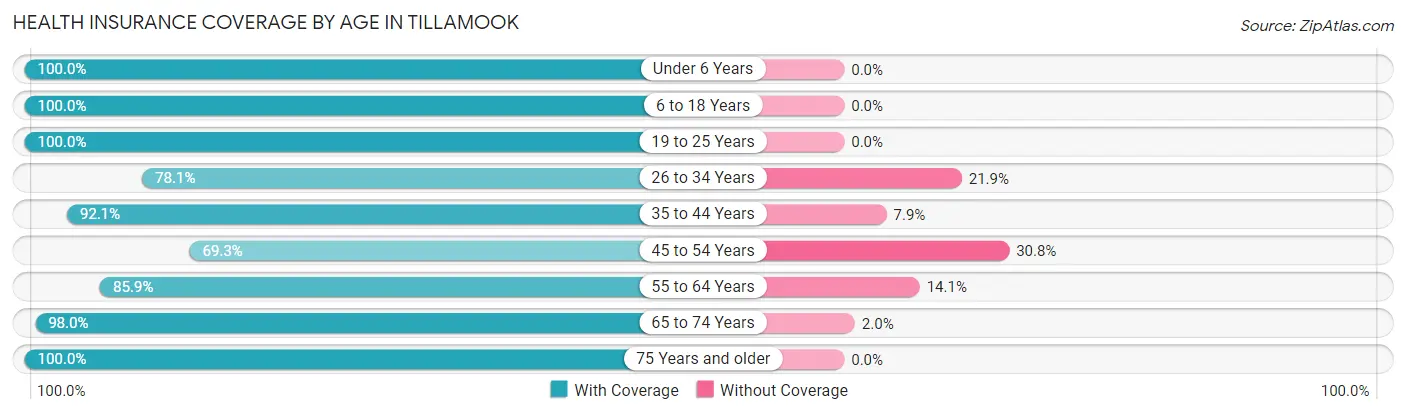
| Age Bracket | With Coverage | Without Coverage |
| Under 6 Years | 320 (100.0%) | 0 (0.0%) |
| 6 to 18 Years | 1,103 (100.0%) | 0 (0.0%) |
| 19 to 25 Years | 402 (100.0%) | 0 (0.0%) |
| 26 to 34 Years | 392 (78.1%) | 110 (21.9%) |
| 35 to 44 Years | 735 (92.1%) | 63 (7.9%) |
| 45 to 54 Years | 367 (69.3%) | 163 (30.7%) |
| 55 to 64 Years | 562 (85.9%) | 92 (14.1%) |
| 65 to 74 Years | 494 (98.0%) | 10 (2.0%) |
| 75 Years and older | 402 (100.0%) | 0 (0.0%) |
| Total | 4,777 (91.6%) | 438 (8.4%) |
Health Insurance Coverage by Citizenship Status in Tillamook
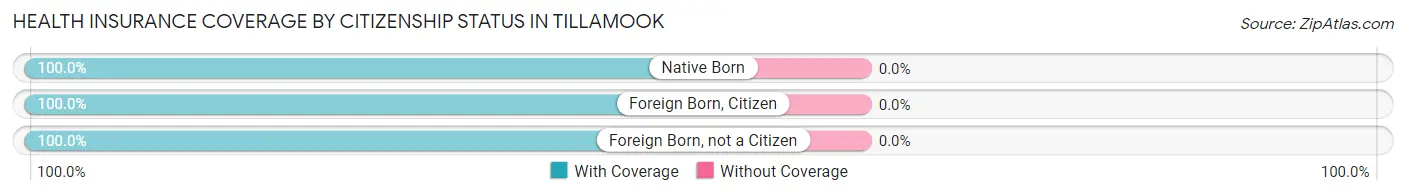
| Citizenship Status | With Coverage | Without Coverage |
| Native Born | 320 (100.0%) | 0 (0.0%) |
| Foreign Born, Citizen | 1,103 (100.0%) | 0 (0.0%) |
| Foreign Born, not a Citizen | 402 (100.0%) | 0 (0.0%) |
Health Insurance Coverage by Household Income in Tillamook
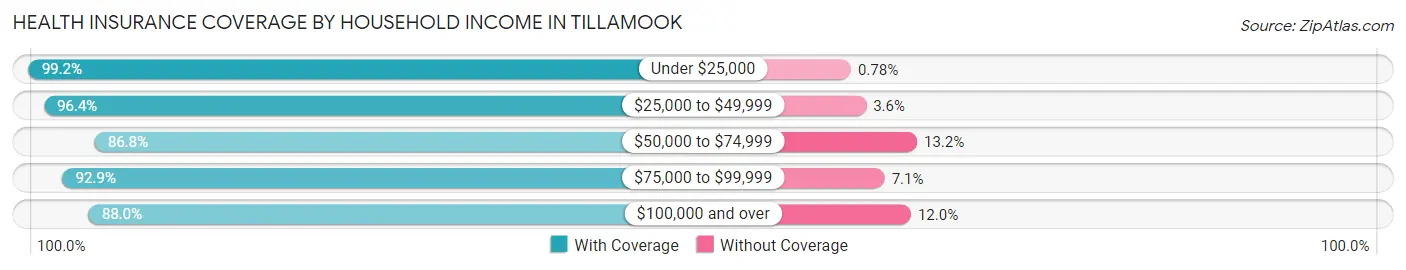
| Household Income | With Coverage | Without Coverage |
| Under $25,000 | 635 (99.2%) | 5 (0.8%) |
| $25,000 to $49,999 | 956 (96.4%) | 36 (3.6%) |
| $50,000 to $74,999 | 1,148 (86.8%) | 174 (13.2%) |
| $75,000 to $99,999 | 837 (92.9%) | 64 (7.1%) |
| $100,000 and over | 1,163 (88.0%) | 159 (12.0%) |
Public vs Private Health Insurance Coverage by Age in Tillamook
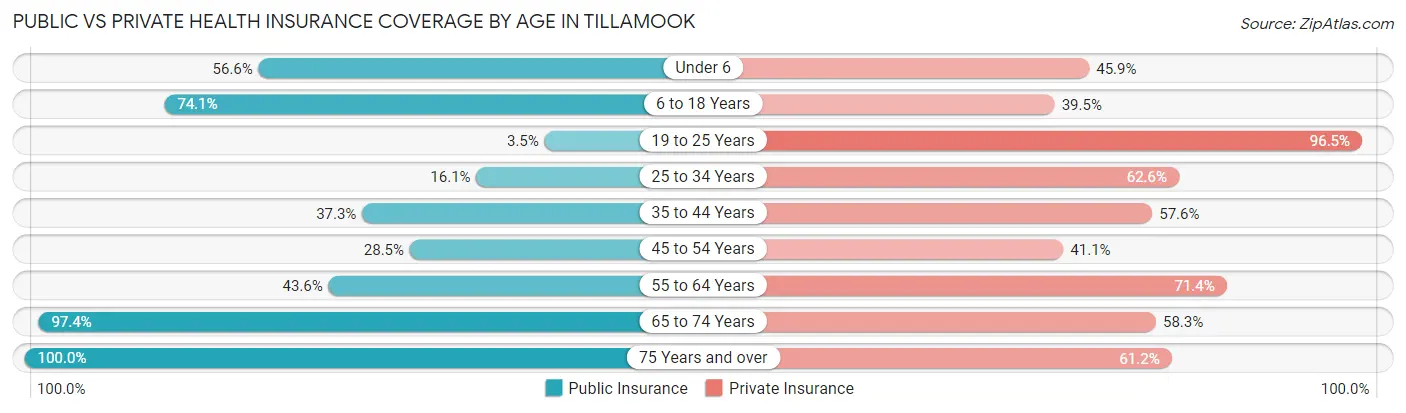
| Age Bracket | Public Insurance | Private Insurance |
| Under 6 | 181 (56.6%) | 147 (45.9%) |
| 6 to 18 Years | 817 (74.1%) | 436 (39.5%) |
| 19 to 25 Years | 14 (3.5%) | 388 (96.5%) |
| 25 to 34 Years | 81 (16.1%) | 314 (62.5%) |
| 35 to 44 Years | 298 (37.3%) | 460 (57.6%) |
| 45 to 54 Years | 151 (28.5%) | 218 (41.1%) |
| 55 to 64 Years | 285 (43.6%) | 467 (71.4%) |
| 65 to 74 Years | 491 (97.4%) | 294 (58.3%) |
| 75 Years and over | 402 (100.0%) | 246 (61.2%) |
| Total | 2,720 (52.2%) | 2,970 (57.0%) |
Disability Status by Sex by Age in Tillamook
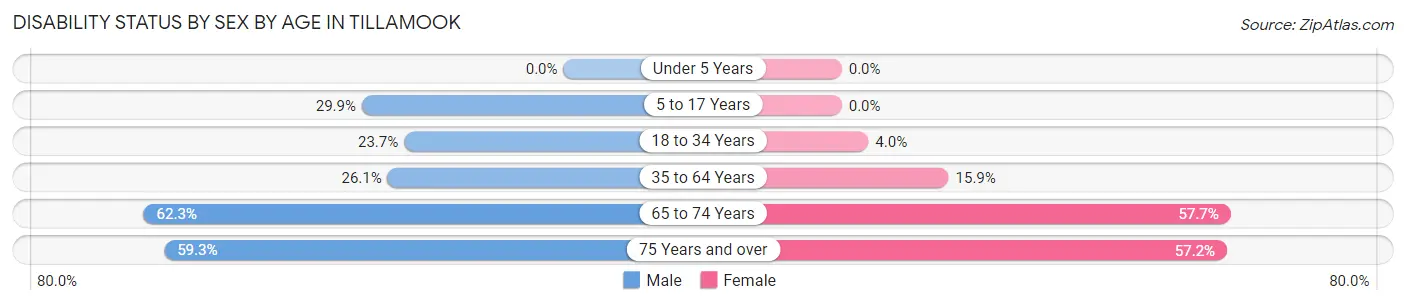
| Age Bracket | Male | Female |
| Under 5 Years | 0 (0.0%) | 0 (0.0%) |
| 5 to 17 Years | 182 (29.9%) | 0 (0.0%) |
| 18 to 34 Years | 146 (23.7%) | 13 (4.0%) |
| 35 to 64 Years | 241 (26.1%) | 168 (15.9%) |
| 65 to 74 Years | 177 (62.3%) | 127 (57.7%) |
| 75 Years and over | 32 (59.3%) | 199 (57.2%) |
Disability Class by Sex by Age in Tillamook
Disability Class: Hearing Difficulty
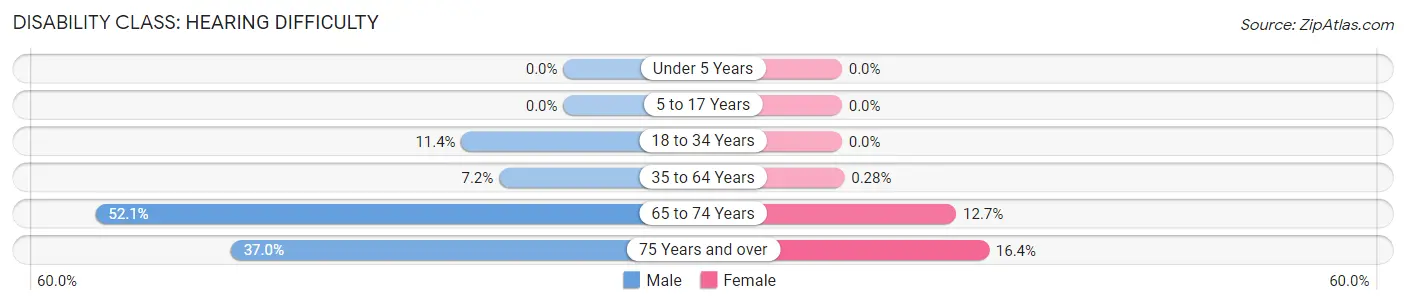
| Age Bracket | Male | Female |
| Under 5 Years | 0 (0.0%) | 0 (0.0%) |
| 5 to 17 Years | 0 (0.0%) | 0 (0.0%) |
| 18 to 34 Years | 70 (11.4%) | 0 (0.0%) |
| 35 to 64 Years | 66 (7.1%) | 3 (0.3%) |
| 65 to 74 Years | 148 (52.1%) | 28 (12.7%) |
| 75 Years and over | 20 (37.0%) | 57 (16.4%) |
Disability Class: Vision Difficulty
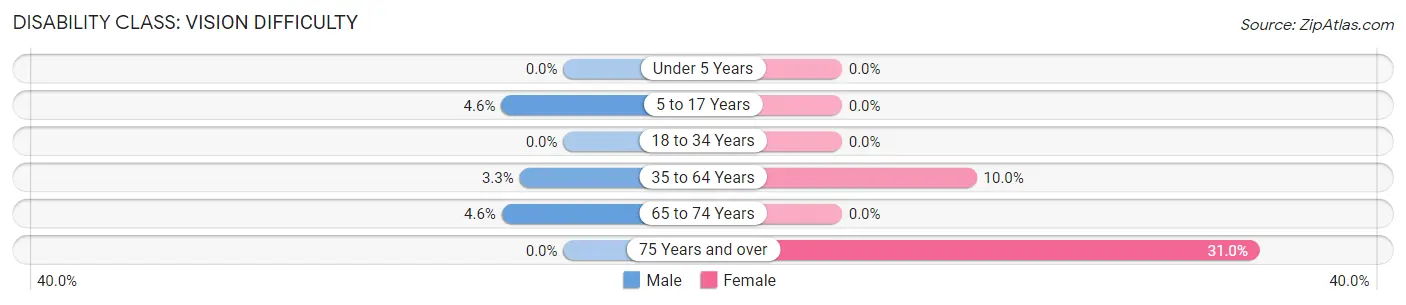
| Age Bracket | Male | Female |
| Under 5 Years | 0 (0.0%) | 0 (0.0%) |
| 5 to 17 Years | 28 (4.6%) | 0 (0.0%) |
| 18 to 34 Years | 0 (0.0%) | 0 (0.0%) |
| 35 to 64 Years | 30 (3.3%) | 106 (10.0%) |
| 65 to 74 Years | 13 (4.6%) | 0 (0.0%) |
| 75 Years and over | 0 (0.0%) | 108 (31.0%) |
Disability Class: Cognitive Difficulty
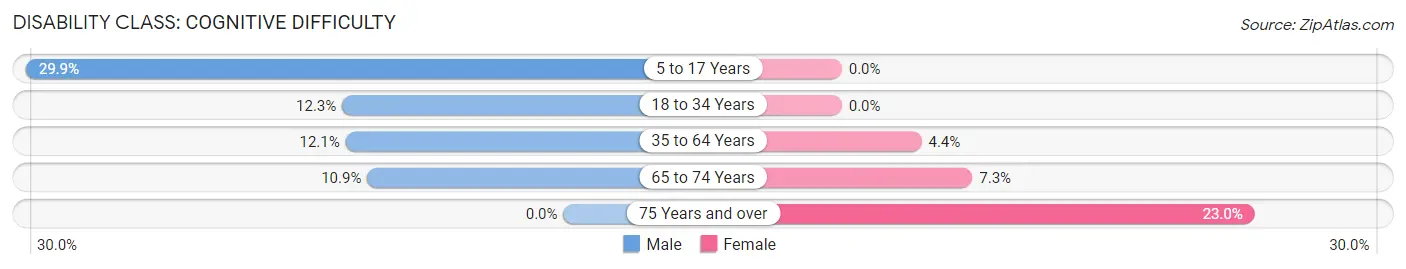
| Age Bracket | Male | Female |
| 5 to 17 Years | 182 (29.9%) | 0 (0.0%) |
| 18 to 34 Years | 76 (12.3%) | 0 (0.0%) |
| 35 to 64 Years | 112 (12.1%) | 47 (4.4%) |
| 65 to 74 Years | 31 (10.9%) | 16 (7.3%) |
| 75 Years and over | 0 (0.0%) | 80 (23.0%) |
Disability Class: Ambulatory Difficulty
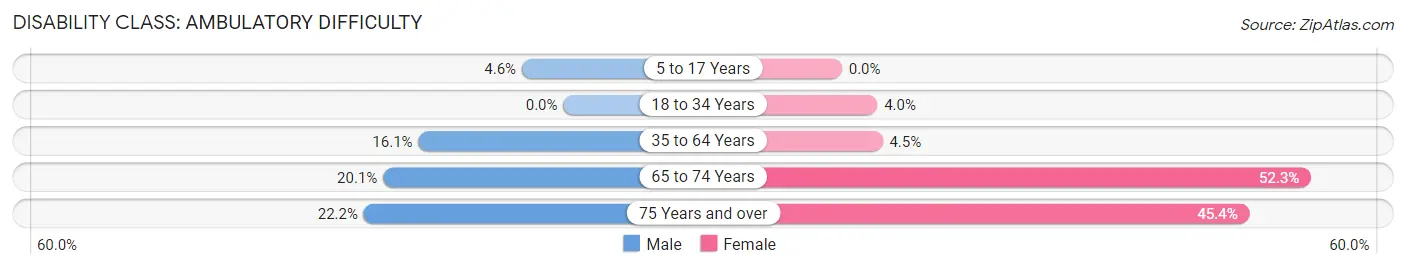
| Age Bracket | Male | Female |
| 5 to 17 Years | 28 (4.6%) | 0 (0.0%) |
| 18 to 34 Years | 0 (0.0%) | 13 (4.0%) |
| 35 to 64 Years | 149 (16.1%) | 48 (4.5%) |
| 65 to 74 Years | 57 (20.1%) | 115 (52.3%) |
| 75 Years and over | 12 (22.2%) | 158 (45.4%) |
Disability Class: Self-Care Difficulty
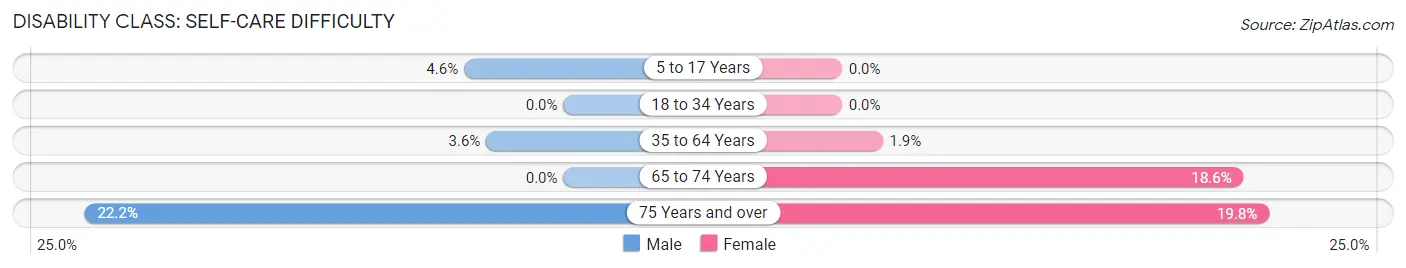
| Age Bracket | Male | Female |
| 5 to 17 Years | 28 (4.6%) | 0 (0.0%) |
| 18 to 34 Years | 0 (0.0%) | 0 (0.0%) |
| 35 to 64 Years | 33 (3.6%) | 20 (1.9%) |
| 65 to 74 Years | 0 (0.0%) | 41 (18.6%) |
| 75 Years and over | 12 (22.2%) | 69 (19.8%) |
Technology Access in Tillamook
Computing Device Access in Tillamook
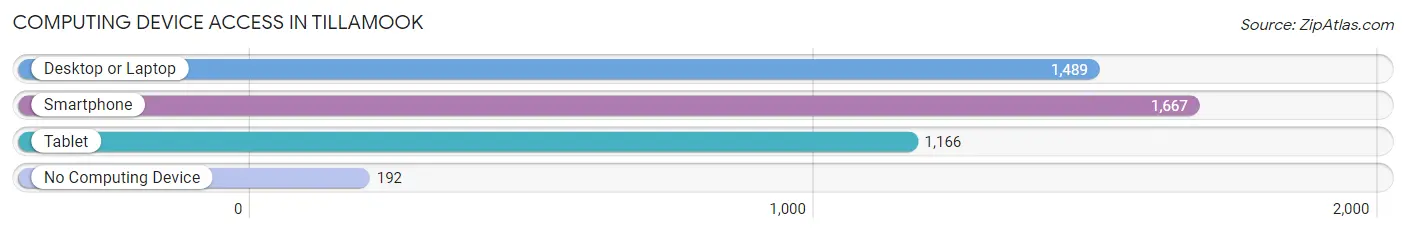
| Device Type | # Households | % Households |
| Desktop or Laptop | 1,489 | 71.8% |
| Smartphone | 1,667 | 80.4% |
| Tablet | 1,166 | 56.2% |
| No Computing Device | 192 | 9.3% |
| Total | 2,074 | 100.0% |
Internet Access in Tillamook
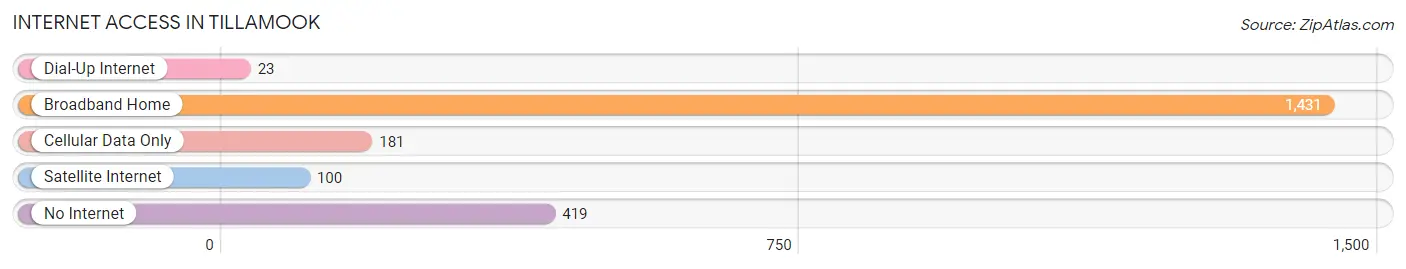
| Internet Type | # Households | % Households |
| Dial-Up Internet | 23 | 1.1% |
| Broadband Home | 1,431 | 69.0% |
| Cellular Data Only | 181 | 8.7% |
| Satellite Internet | 100 | 4.8% |
| No Internet | 419 | 20.2% |
| Total | 2,074 | 100.0% |
Tillamook Summary
Tillamook is a city located in the U.S. state of Oregon. It is the county seat of Tillamook County and is situated on the Tillamook Bay, an inlet of the Pacific Ocean. The city is located on the northern Oregon Coast, approximately 80 miles (130 km) west of Portland. As of the 2010 census, the city had a population of 4,935.
History
The area around Tillamook has been inhabited by Native Americans for thousands of years. The Tillamook people were a subgroup of the larger Tillamook tribe, which was part of the Salishan language family. The first European settlers arrived in the area in the early 19th century, and the city was officially incorporated in 1891.
The city was named after the Tillamook people, who were the original inhabitants of the area. The name is derived from the Tillamook language, which means “people of the Nehalem”.
The city was initially a logging and fishing community, and it was also a major port for the lumber industry. In the early 20th century, the city became a popular tourist destination, and it remains so today.
Geography
Tillamook is located at the mouth of the Tillamook River, which empties into Tillamook Bay. The city is situated on a peninsula, with the Pacific Ocean to the west and the bay to the east. The city is surrounded by forests and mountains, and it is located approximately 80 miles (130 km) west of Portland.
The climate in Tillamook is mild and temperate, with cool, wet winters and warm, dry summers. The average annual temperature is around 50°F (10°C).
Economy
Tillamook’s economy is largely based on tourism, fishing, and forestry. The city is home to several major employers, including Tillamook Cheese, Tillamook Creamery, and Tillamook County Creamery. The city is also home to several small businesses, including restaurants, shops, and galleries.
Demographics
As of the 2010 census, the population of Tillamook was 4,935. The racial makeup of the city was 91.3% White, 0.7% African American, 1.2% Native American, 0.7% Asian, 0.1% Pacific Islander, 2.3% from other races, and 3.9% from two or more races. Hispanic or Latino of any race were 6.2% of the population.
The median income for a household in the city was $37,917, and the median income for a family was $45,938. The per capita income for the city was $20,945. About 11.2% of families and 14.3% of the population were below the poverty line, including 19.2% of those under age 18 and 8.2% of those age 65 or over.
Tillamook is a vibrant and diverse city with a rich history and a bright future. The city is home to a variety of businesses, attractions, and activities, and it is a popular destination for tourists and locals alike. With its beautiful scenery, mild climate, and friendly people, Tillamook is a great place to live, work, and play.
Common Questions
What is Per Capita Income in Tillamook?
Per Capita income in Tillamook is $26,657.
What is the Median Family Income in Tillamook?
Median Family Income in Tillamook is $70,177.
What is the Median Household income in Tillamook?
Median Household Income in Tillamook is $53,711.
What is Income or Wage Gap in Tillamook?
Income or Wage Gap in Tillamook is 29.5%.
Women in Tillamook earn 70.5 cents for every dollar earned by a man.
What is Inequality or Gini Index in Tillamook?
Inequality or Gini Index in Tillamook is 0.38.
What is the Total Population of Tillamook?
Total Population of Tillamook is 5,215.
What is the Total Male Population of Tillamook?
Total Male Population of Tillamook is 2,648.
What is the Total Female Population of Tillamook?
Total Female Population of Tillamook is 2,567.
What is the Ratio of Males per 100 Females in Tillamook?
There are 103.16 Males per 100 Females in Tillamook.
What is the Ratio of Females per 100 Males in Tillamook?
There are 96.94 Females per 100 Males in Tillamook.
What is the Median Population Age in Tillamook?
Median Population Age in Tillamook is 37.3 Years.
What is the Average Family Size in Tillamook
Average Family Size in Tillamook is 3.3 People.
What is the Average Household Size in Tillamook
Average Household Size in Tillamook is 2.5 People.
How Large is the Labor Force in Tillamook?
There are 2,292 People in the Labor Forcein in Tillamook.
What is the Percentage of People in the Labor Force in Tillamook?
58.2% of People are in the Labor Force in Tillamook.
What is the Unemployment Rate in Tillamook?
Unemployment Rate in Tillamook is 5.0%.