Sisters, OR Map & Demographics
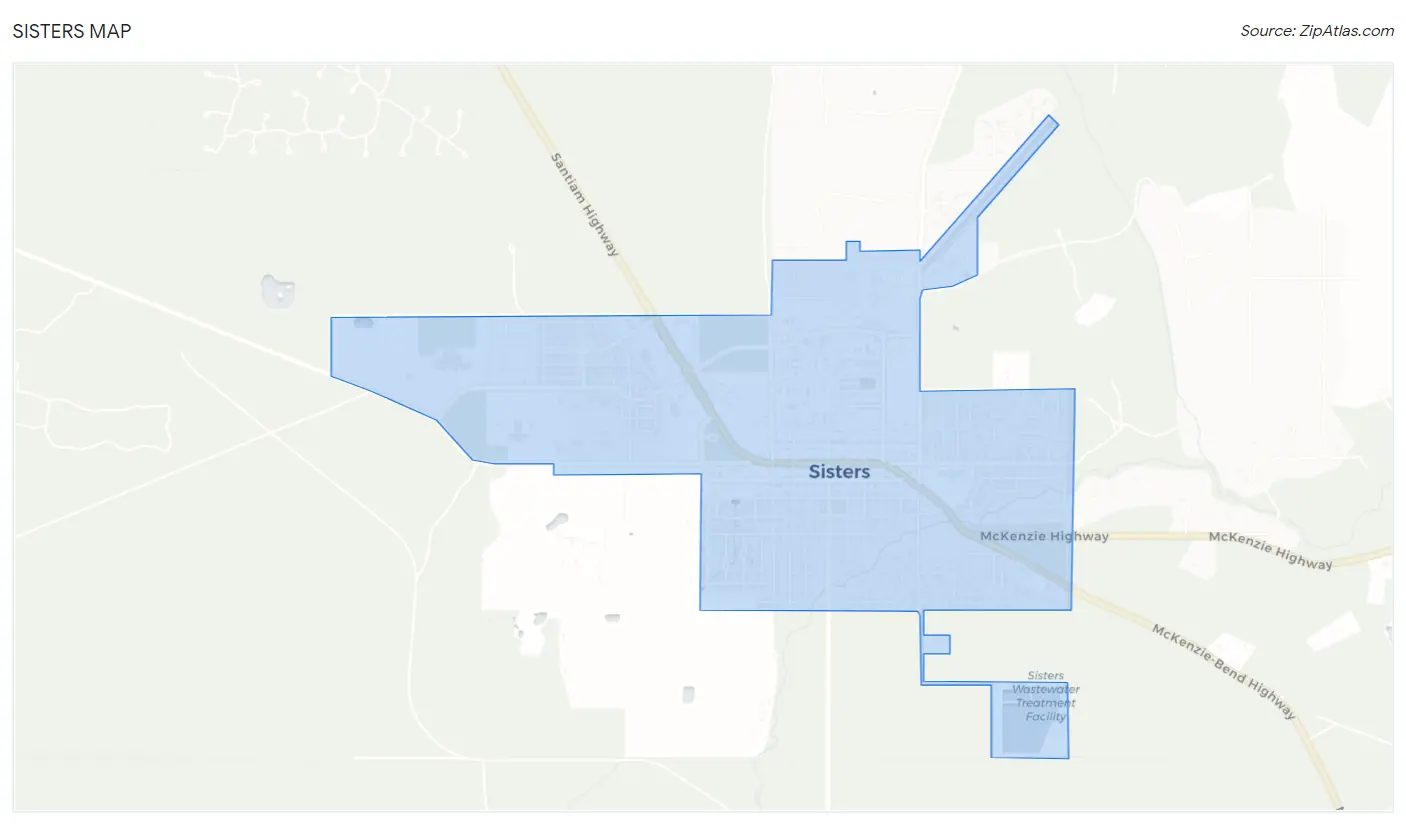
Sisters Map
Sisters Overview
$48,669
PER CAPITA INCOME
$98,726
AVG FAMILY INCOME
$84,088
AVG HOUSEHOLD INCOME
25.0%
WAGE / INCOME GAP [ % ]
75.0¢/ $1
WAGE / INCOME GAP [ $ ]
$5,735
FAMILY INCOME DEFICIT
0.46
INEQUALITY / GINI INDEX
2,992
TOTAL POPULATION
1,342
MALE POPULATION
1,650
FEMALE POPULATION
81.33
MALES / 100 FEMALES
122.95
FEMALES / 100 MALES
49.4
MEDIAN AGE
2.6
AVG FAMILY SIZE
2.2
AVG HOUSEHOLD SIZE
1,323
LABOR FORCE [ PEOPLE ]
51.5%
PERCENT IN LABOR FORCE
4.0%
UNEMPLOYMENT RATE
Sisters Zip Codes
Sisters Area Codes
Income in Sisters
Income Overview in Sisters
Per Capita Income in Sisters is $48,669, while median incomes of families and households are $98,726 and $84,088 respectively.
| Characteristic | Number | Measure |
| Per Capita Income | 2,992 | $48,669 |
| Median Family Income | 962 | $98,726 |
| Mean Family Income | 962 | $123,819 |
| Median Household Income | 1,343 | $84,088 |
| Mean Household Income | 1,343 | $109,585 |
| Income Deficit | 962 | $5,735 |
| Wage / Income Gap (%) | 2,992 | 24.96% |
| Wage / Income Gap ($) | 2,992 | 75.04¢ per $1 |
| Gini / Inequality Index | 2,992 | 0.46 |
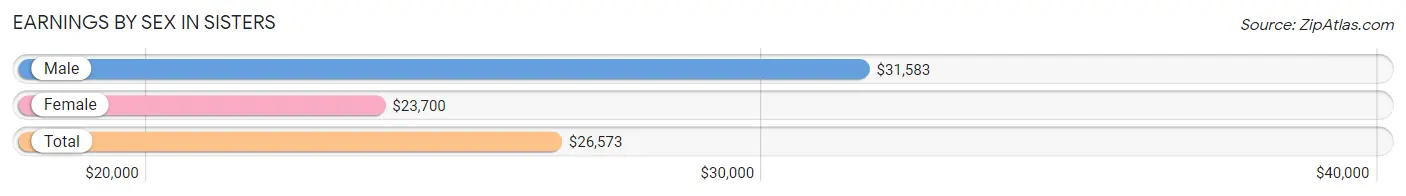
Earnings by Sex in Sisters
Average Earnings in Sisters are $26,573, $31,583 for men and $23,700 for women, a difference of 25.0%.
| Sex | Number | Average Earnings |
| Male | 851 (53.6%) | $31,583 |
| Female | 738 (46.4%) | $23,700 |
| Total | 1,589 (100.0%) | $26,573 |
Earnings by Sex by Income Bracket in Sisters
The most common earnings brackets in Sisters are $100,000+ for men (184 | 21.6%) and $100,000+ for women (117 | 15.9%).
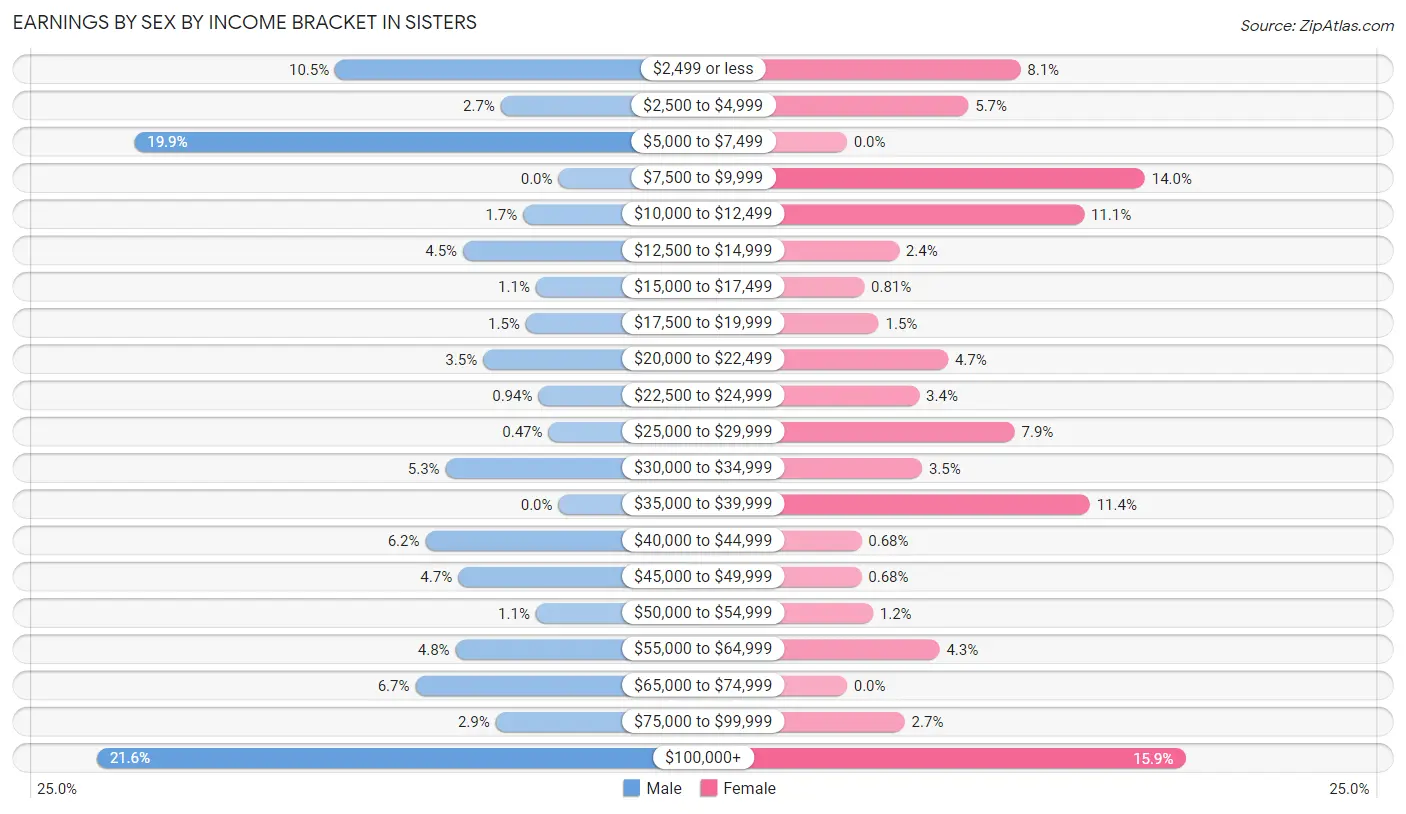
| Income | Male | Female |
| $2,499 or less | 89 (10.5%) | 60 (8.1%) |
| $2,500 to $4,999 | 23 (2.7%) | 42 (5.7%) |
| $5,000 to $7,499 | 169 (19.9%) | 0 (0.0%) |
| $7,500 to $9,999 | 0 (0.0%) | 103 (14.0%) |
| $10,000 to $12,499 | 14 (1.7%) | 82 (11.1%) |
| $12,500 to $14,999 | 38 (4.5%) | 18 (2.4%) |
| $15,000 to $17,499 | 9 (1.1%) | 6 (0.8%) |
| $17,500 to $19,999 | 13 (1.5%) | 11 (1.5%) |
| $20,000 to $22,499 | 30 (3.5%) | 35 (4.7%) |
| $22,500 to $24,999 | 8 (0.9%) | 25 (3.4%) |
| $25,000 to $29,999 | 4 (0.5%) | 58 (7.9%) |
| $30,000 to $34,999 | 45 (5.3%) | 26 (3.5%) |
| $35,000 to $39,999 | 0 (0.0%) | 84 (11.4%) |
| $40,000 to $44,999 | 53 (6.2%) | 5 (0.7%) |
| $45,000 to $49,999 | 40 (4.7%) | 5 (0.7%) |
| $50,000 to $54,999 | 9 (1.1%) | 9 (1.2%) |
| $55,000 to $64,999 | 41 (4.8%) | 32 (4.3%) |
| $65,000 to $74,999 | 57 (6.7%) | 0 (0.0%) |
| $75,000 to $99,999 | 25 (2.9%) | 20 (2.7%) |
| $100,000+ | 184 (21.6%) | 117 (15.9%) |
| Total | 851 (100.0%) | 738 (100.0%) |
Earnings by Sex by Educational Attainment in Sisters
Average earnings in Sisters are $41,940 for men and $28,831 for women, a difference of 31.3%. Men with an educational attainment of high school diploma enjoy the highest average annual earnings of $66,208, while those with bachelor's degree education earn the least with $62,845. Women with an educational attainment of bachelor's degree earn the most with the average annual earnings of $55,673, while those with high school diploma education have the smallest earnings of $9,356.
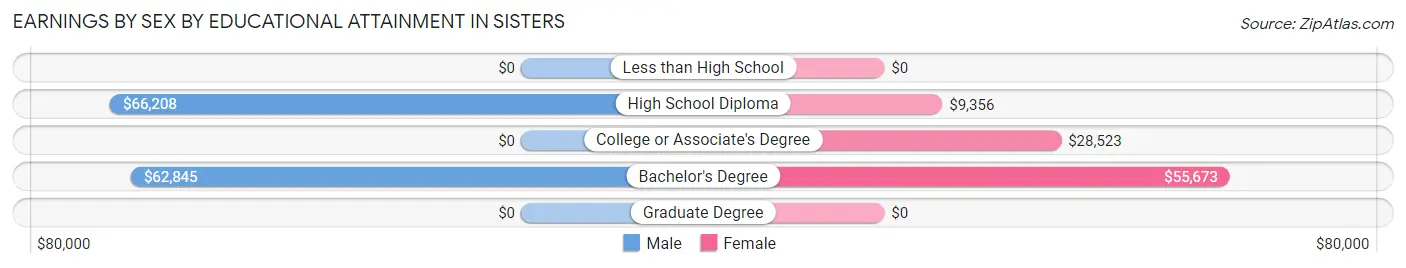
| Educational Attainment | Male Income | Female Income |
| Less than High School | - | - |
| High School Diploma | $66,208 | $9,356 |
| College or Associate's Degree | - | - |
| Bachelor's Degree | $62,845 | $55,673 |
| Graduate Degree | - | - |
| Total | $41,940 | $28,831 |
Family Income in Sisters
Family Income Brackets in Sisters
According to the Sisters family income data, there are 226 families falling into the $100,000 to $149,999 income range, which is the most common income bracket and makes up 23.5% of all families. Conversely, the $10,000 to $14,999 income bracket is the least frequent group with only 5 families (0.5%) belonging to this category.
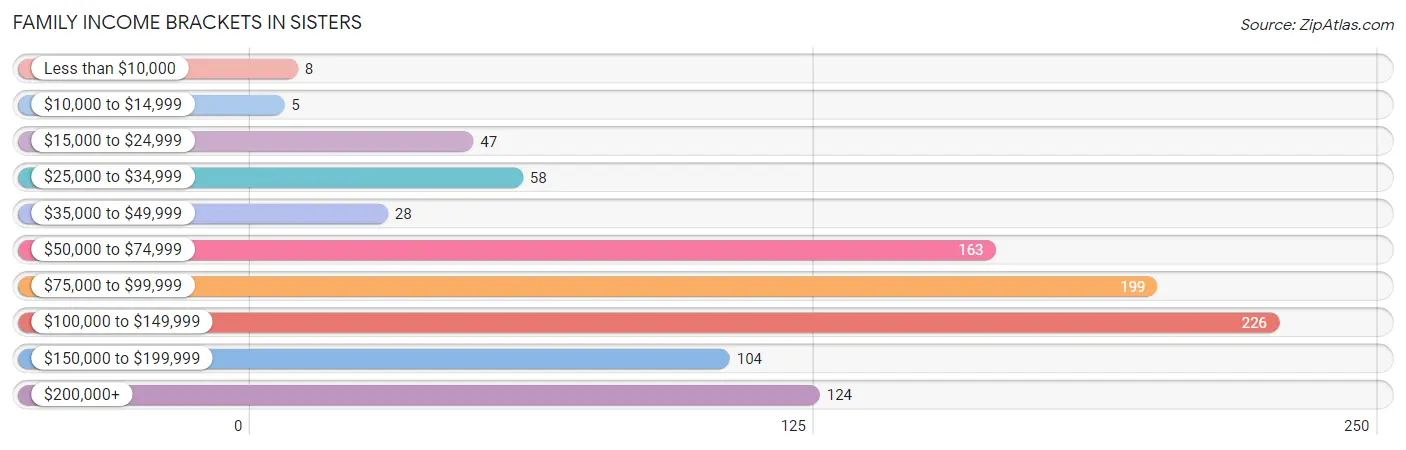
| Income Bracket | # Families | % Families |
| Less than $10,000 | 8 | 0.8% |
| $10,000 to $14,999 | 5 | 0.5% |
| $15,000 to $24,999 | 47 | 4.9% |
| $25,000 to $34,999 | 58 | 6.0% |
| $35,000 to $49,999 | 28 | 2.9% |
| $50,000 to $74,999 | 163 | 16.9% |
| $75,000 to $99,999 | 199 | 20.7% |
| $100,000 to $149,999 | 226 | 23.5% |
| $150,000 to $199,999 | 104 | 10.8% |
| $200,000+ | 124 | 12.9% |
Family Income by Famaliy Size in Sisters
5-person families (33 | 3.4%) account for the highest median family income in Sisters with $250,001 per family, while 5-person families (33 | 3.4%) have the highest median income of $50,000 per family member.
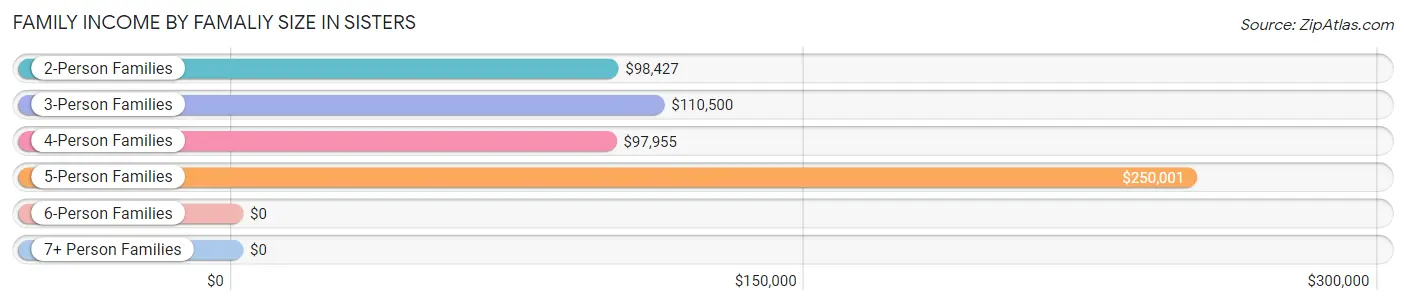
| Income Bracket | # Families | Median Income |
| 2-Person Families | 579 (60.2%) | $98,427 |
| 3-Person Families | 152 (15.8%) | $110,500 |
| 4-Person Families | 198 (20.6%) | $97,955 |
| 5-Person Families | 33 (3.4%) | $250,001 |
| 6-Person Families | 0 (0.0%) | $0 |
| 7+ Person Families | 0 (0.0%) | $0 |
| Total | 962 (100.0%) | $98,726 |
Family Income by Number of Earners in Sisters
The median family income in Sisters is $98,726, with families comprising 3+ earners (109) having the highest median family income of $112,125, while families with 1 earner (233) have the lowest median family income of $63,405, accounting for 11.3% and 24.2% of families, respectively.
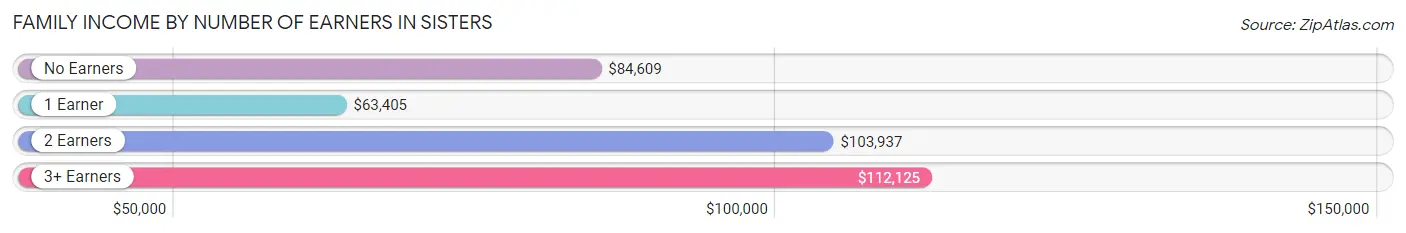
| Number of Earners | # Families | Median Income |
| No Earners | 197 (20.5%) | $84,609 |
| 1 Earner | 233 (24.2%) | $63,405 |
| 2 Earners | 423 (44.0%) | $103,937 |
| 3+ Earners | 109 (11.3%) | $112,125 |
| Total | 962 (100.0%) | $98,726 |
Household Income in Sisters
Household Income Brackets in Sisters
With 266 households falling in the category, the $75,000 to $99,999 income range is the most frequent in Sisters, accounting for 19.8% of all households. In contrast, only 13 households (1.0%) fall into the $10,000 to $14,999 income bracket, making it the least populous group.
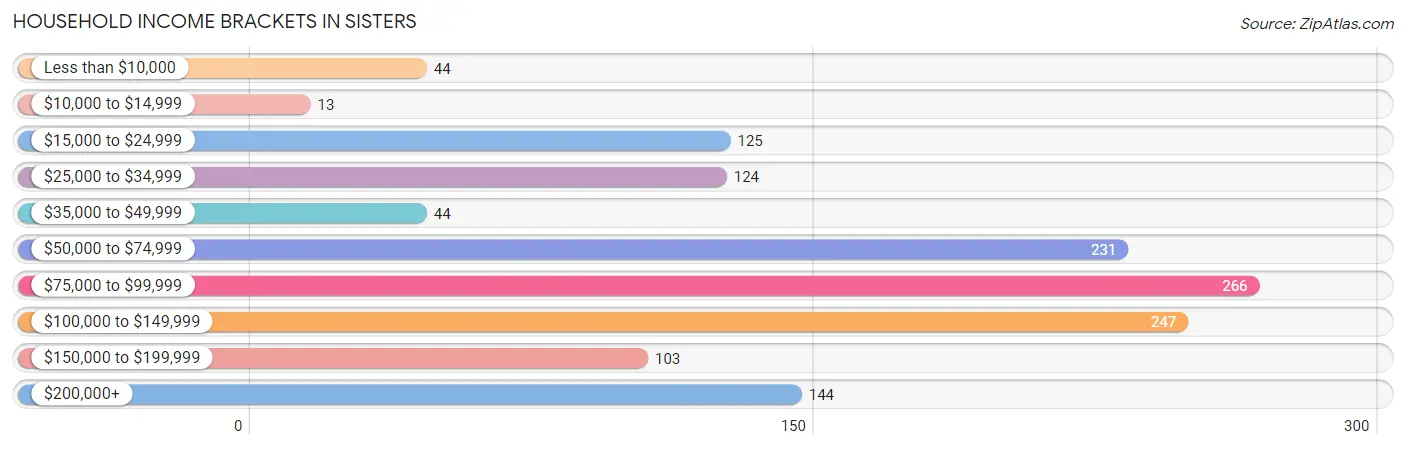
| Income Bracket | # Households | % Households |
| Less than $10,000 | 44 | 3.3% |
| $10,000 to $14,999 | 13 | 1.0% |
| $15,000 to $24,999 | 125 | 9.3% |
| $25,000 to $34,999 | 124 | 9.2% |
| $35,000 to $49,999 | 44 | 3.3% |
| $50,000 to $74,999 | 231 | 17.2% |
| $75,000 to $99,999 | 266 | 19.8% |
| $100,000 to $149,999 | 247 | 18.4% |
| $150,000 to $199,999 | 103 | 7.7% |
| $200,000+ | 144 | 10.7% |
Household Income by Householder Age in Sisters
The median household income in Sisters is $84,088, with the highest median household income of $118,750 found in the 25 to 44 years age bracket for the primary householder. A total of 300 households (22.3%) fall into this category. Meanwhile, the 15 to 24 years age bracket for the primary householder has the lowest median household income of $0, with 12 households (0.9%) in this group.
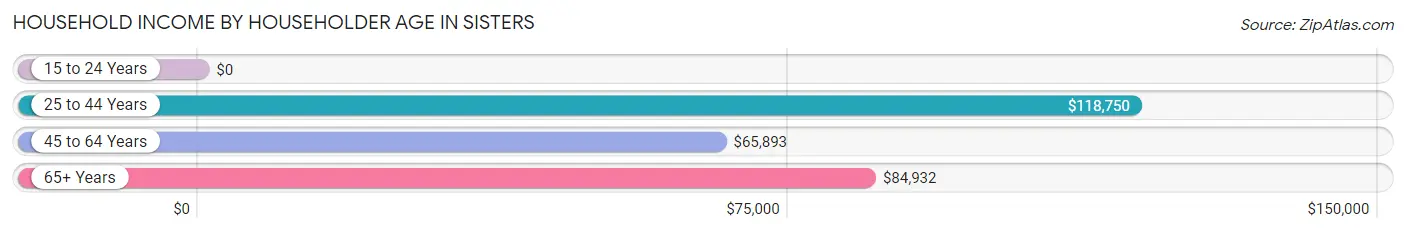
| Income Bracket | # Households | Median Income |
| 15 to 24 Years | 12 (0.9%) | $0 |
| 25 to 44 Years | 300 (22.3%) | $118,750 |
| 45 to 64 Years | 327 (24.3%) | $65,893 |
| 65+ Years | 704 (52.4%) | $84,932 |
| Total | 1,343 (100.0%) | $84,088 |
Poverty in Sisters
Income Below Poverty by Sex and Age in Sisters
With 7.1% poverty level for males and 8.5% for females among the residents of Sisters, 25 to 34 year old males and 25 to 34 year old females are the most vulnerable to poverty, with 32 males (28.1%) and 63 females (54.3%) in their respective age groups living below the poverty level.
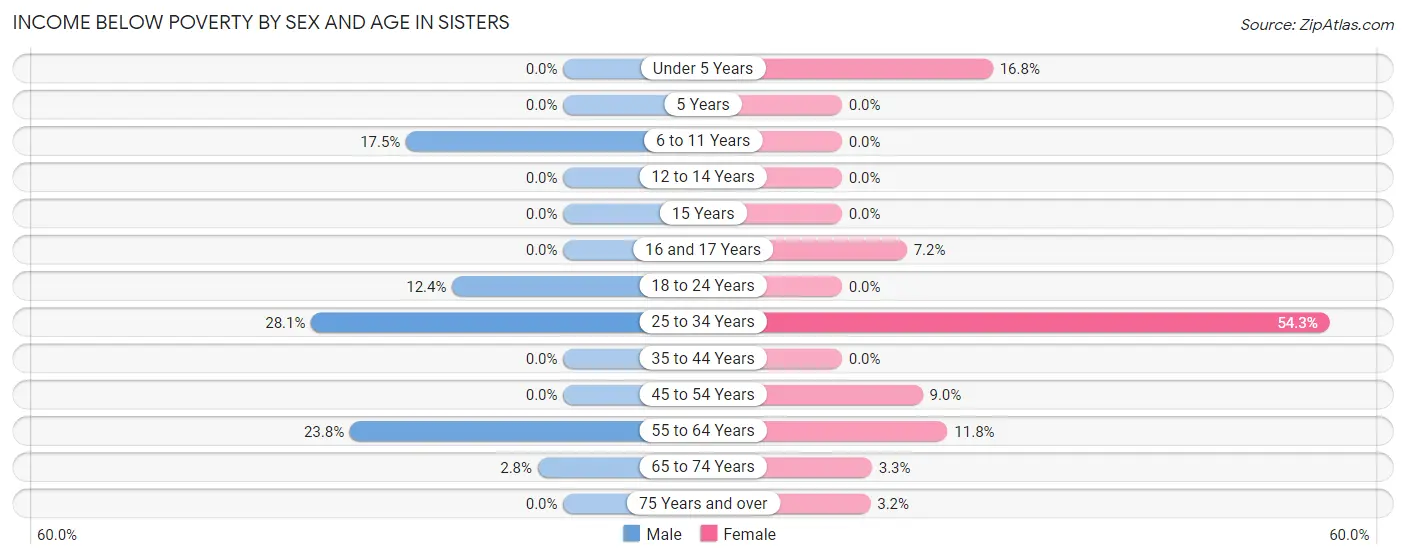
| Age Bracket | Male | Female |
| Under 5 Years | 0 (0.0%) | 20 (16.8%) |
| 5 Years | 0 (0.0%) | 0 (0.0%) |
| 6 to 11 Years | 14 (17.5%) | 0 (0.0%) |
| 12 to 14 Years | 0 (0.0%) | 0 (0.0%) |
| 15 Years | 0 (0.0%) | 0 (0.0%) |
| 16 and 17 Years | 0 (0.0%) | 6 (7.2%) |
| 18 to 24 Years | 12 (12.4%) | 0 (0.0%) |
| 25 to 34 Years | 32 (28.1%) | 63 (54.3%) |
| 35 to 44 Years | 0 (0.0%) | 0 (0.0%) |
| 45 to 54 Years | 0 (0.0%) | 17 (9.0%) |
| 55 to 64 Years | 24 (23.8%) | 14 (11.8%) |
| 65 to 74 Years | 13 (2.8%) | 16 (3.3%) |
| 75 Years and over | 0 (0.0%) | 4 (3.2%) |
| Total | 95 (7.1%) | 140 (8.5%) |
Income Above Poverty by Sex and Age in Sisters
According to the poverty statistics in Sisters, males aged under 5 years and females aged 5 years are the age groups that are most secure financially, with 100.0% of males and 100.0% of females in these age groups living above the poverty line.
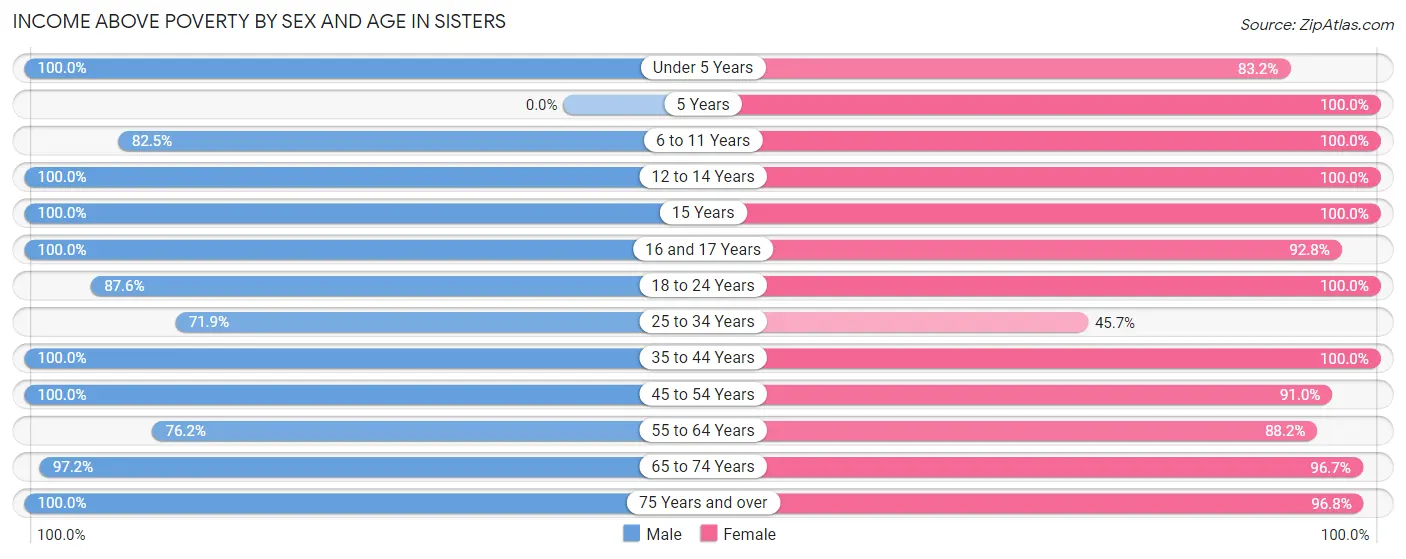
| Age Bracket | Male | Female |
| Under 5 Years | 31 (100.0%) | 99 (83.2%) |
| 5 Years | 0 (0.0%) | 22 (100.0%) |
| 6 to 11 Years | 66 (82.5%) | 92 (100.0%) |
| 12 to 14 Years | 6 (100.0%) | 31 (100.0%) |
| 15 Years | 37 (100.0%) | 5 (100.0%) |
| 16 and 17 Years | 25 (100.0%) | 77 (92.8%) |
| 18 to 24 Years | 85 (87.6%) | 30 (100.0%) |
| 25 to 34 Years | 82 (71.9%) | 53 (45.7%) |
| 35 to 44 Years | 162 (100.0%) | 239 (100.0%) |
| 45 to 54 Years | 172 (100.0%) | 172 (91.0%) |
| 55 to 64 Years | 77 (76.2%) | 105 (88.2%) |
| 65 to 74 Years | 445 (97.2%) | 463 (96.7%) |
| 75 Years and over | 58 (100.0%) | 122 (96.8%) |
| Total | 1,246 (92.9%) | 1,510 (91.5%) |
Income Below Poverty Among Married-Couple Families in Sisters
The poverty statistics for married-couple families in Sisters show that 3.7% or 34 of the total 927 families live below the poverty line. Families with 1 or 2 children have the highest poverty rate of 6.4%, comprising of 21 families. On the other hand, families with 3 or 4 children have the lowest poverty rate of 0.0%, which includes 0 families.
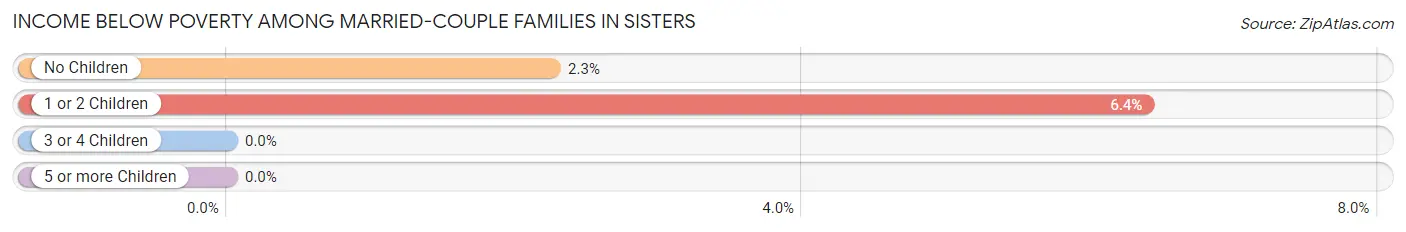
| Children | Above Poverty | Below Poverty |
| No Children | 566 (97.8%) | 13 (2.2%) |
| 1 or 2 Children | 308 (93.6%) | 21 (6.4%) |
| 3 or 4 Children | 19 (100.0%) | 0 (0.0%) |
| 5 or more Children | 0 (0.0%) | 0 (0.0%) |
| Total | 893 (96.3%) | 34 (3.7%) |
Income Below Poverty Among Single-Parent Households in Sisters
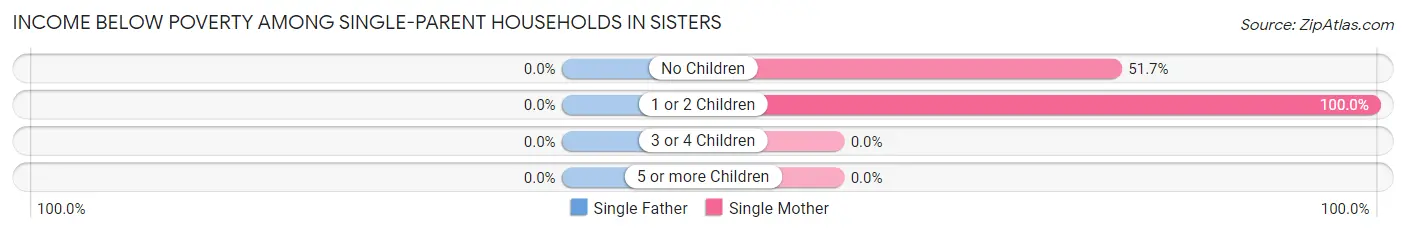
| Children | Single Father | Single Mother |
| No Children | 0 (0.0%) | 15 (51.7%) |
| 1 or 2 Children | 0 (0.0%) | 6 (100.0%) |
| 3 or 4 Children | 0 (0.0%) | 0 (0.0%) |
| 5 or more Children | 0 (0.0%) | 0 (0.0%) |
| Total | 0 (0.0%) | 21 (60.0%) |
Income Below Poverty Among Married-Couple vs Single-Parent Households in Sisters
The poverty data for Sisters shows that 34 of the married-couple family households (3.7%) and 21 of the single-parent households (60.0%) are living below the poverty level. Within the married-couple family households, those with 1 or 2 children have the highest poverty rate, with 21 households (6.4%) falling below the poverty line. Among the single-parent households, those with 1 or 2 children have the highest poverty rate, with 6 household (100.0%) living below poverty.
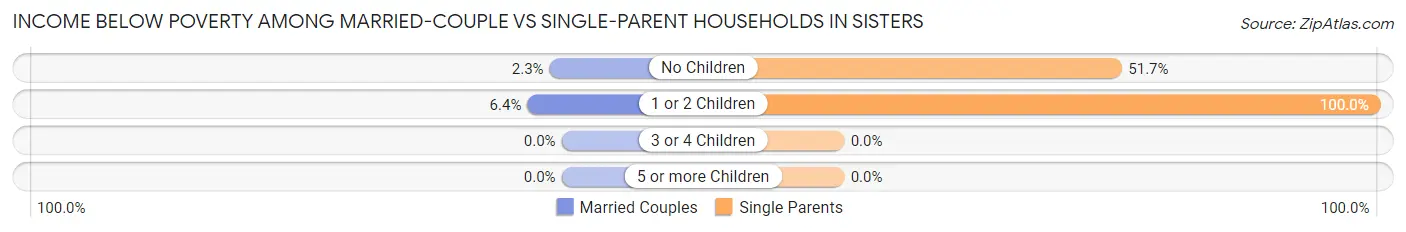
| Children | Married-Couple Families | Single-Parent Households |
| No Children | 13 (2.2%) | 15 (51.7%) |
| 1 or 2 Children | 21 (6.4%) | 6 (100.0%) |
| 3 or 4 Children | 0 (0.0%) | 0 (0.0%) |
| 5 or more Children | 0 (0.0%) | 0 (0.0%) |
| Total | 34 (3.7%) | 21 (60.0%) |
Race in Sisters
The most populous races in Sisters are White / Caucasian (2,775 | 92.7%), Two or more Races (164 | 5.5%), and Hispanic or Latino (122 | 4.1%).
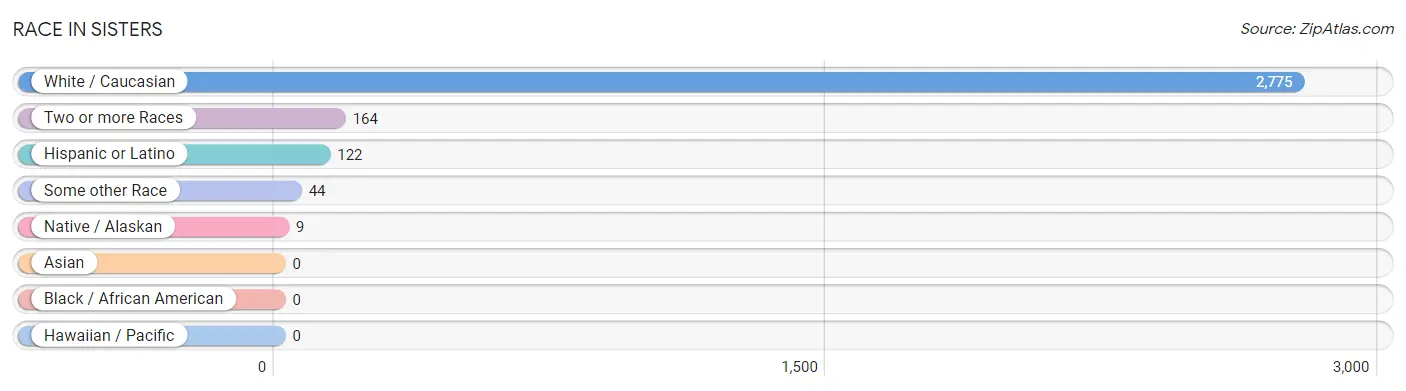
| Race | # Population | % Population |
| Asian | 0 | 0.0% |
| Black / African American | 0 | 0.0% |
| Hawaiian / Pacific | 0 | 0.0% |
| Hispanic or Latino | 122 | 4.1% |
| Native / Alaskan | 9 | 0.3% |
| White / Caucasian | 2,775 | 92.7% |
| Two or more Races | 164 | 5.5% |
| Some other Race | 44 | 1.5% |
| Total | 2,992 | 100.0% |
Ancestry in Sisters
The most populous ancestries reported in Sisters are German (771 | 25.8%), English (414 | 13.8%), Irish (343 | 11.5%), American (258 | 8.6%), and Italian (195 | 6.5%), together accounting for 66.2% of all Sisters residents.
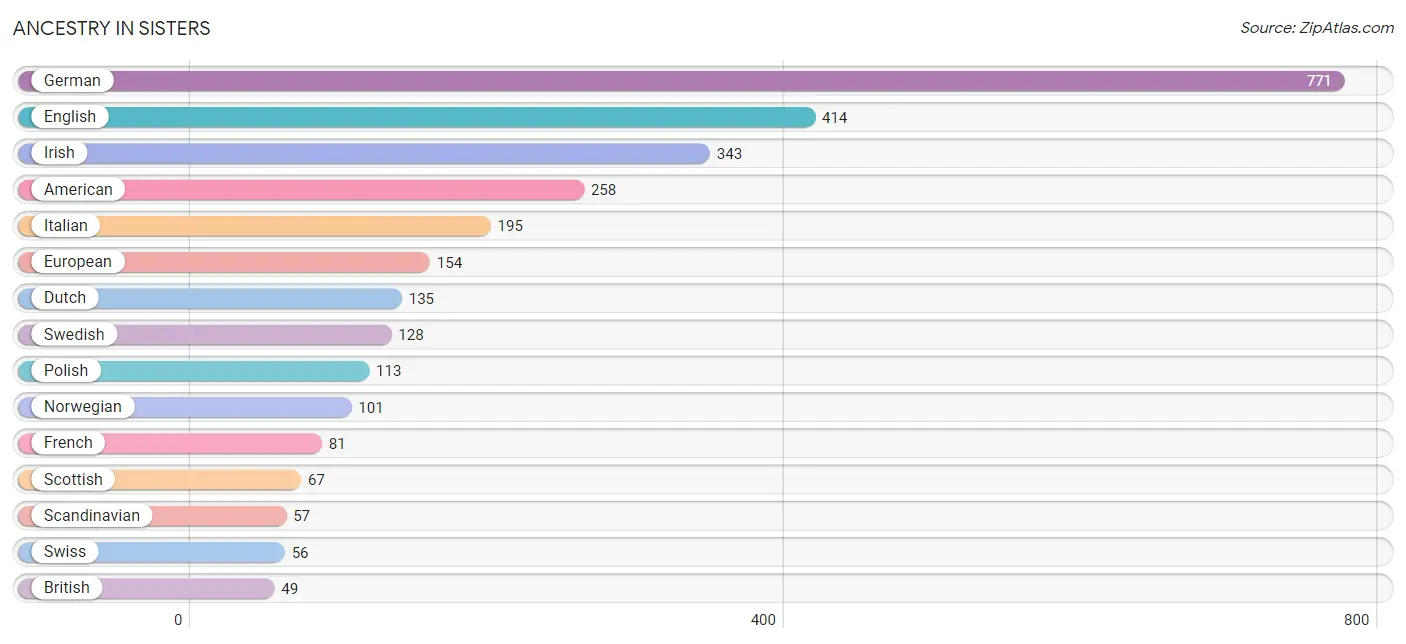
| Ancestry | # Population | % Population |
| American | 258 | 8.6% |
| Argentinean | 33 | 1.1% |
| Austrian | 26 | 0.9% |
| Brazilian | 16 | 0.5% |
| British | 49 | 1.6% |
| Canadian | 26 | 0.9% |
| Central American | 16 | 0.5% |
| Czech | 7 | 0.2% |
| Danish | 19 | 0.6% |
| Dutch | 135 | 4.5% |
| Eastern European | 8 | 0.3% |
| English | 414 | 13.8% |
| European | 154 | 5.1% |
| Finnish | 11 | 0.4% |
| French | 81 | 2.7% |
| French Canadian | 4 | 0.1% |
| German | 771 | 25.8% |
| German Russian | 15 | 0.5% |
| Guatemalan | 16 | 0.5% |
| Irish | 343 | 11.5% |
| Italian | 195 | 6.5% |
| Laotian | 6 | 0.2% |
| Latvian | 15 | 0.5% |
| Mexican | 27 | 0.9% |
| Northern European | 15 | 0.5% |
| Norwegian | 101 | 3.4% |
| Polish | 113 | 3.8% |
| Potawatomi | 9 | 0.3% |
| Puerto Rican | 11 | 0.4% |
| Romanian | 28 | 0.9% |
| Russian | 17 | 0.6% |
| Scandinavian | 57 | 1.9% |
| Scotch-Irish | 41 | 1.4% |
| Scottish | 67 | 2.2% |
| South American | 33 | 1.1% |
| Spaniard | 15 | 0.5% |
| Swedish | 128 | 4.3% |
| Swiss | 56 | 1.9% |
| Ukrainian | 1 | 0.0% | View All 39 Rows |
Immigrants in Sisters
The most numerous immigrant groups reported in Sisters came from Europe (79 | 2.6%), Latin America (57 | 1.9%), Western Europe (49 | 1.6%), Germany (43 | 1.4%), and Canada (30 | 1.0%), together accounting for 8.6% of all Sisters residents.
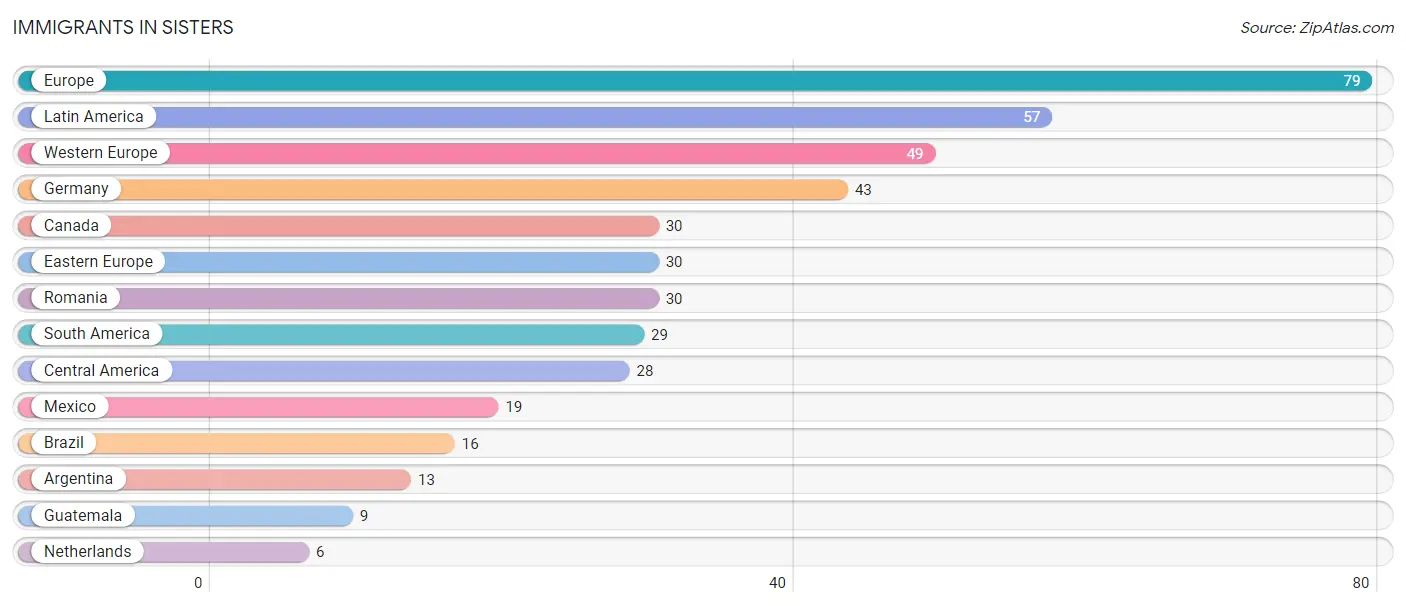
| Immigration Origin | # Population | % Population |
| Argentina | 13 | 0.4% |
| Brazil | 16 | 0.5% |
| Canada | 30 | 1.0% |
| Central America | 28 | 0.9% |
| Eastern Europe | 30 | 1.0% |
| Europe | 79 | 2.6% |
| Germany | 43 | 1.4% |
| Guatemala | 9 | 0.3% |
| Latin America | 57 | 1.9% |
| Mexico | 19 | 0.6% |
| Netherlands | 6 | 0.2% |
| Romania | 30 | 1.0% |
| South America | 29 | 1.0% |
| Western Europe | 49 | 1.6% | View All 14 Rows |
Sex and Age in Sisters
Sex and Age in Sisters
The most populous age groups in Sisters are 70 to 74 Years (263 | 19.6%) for men and 70 to 74 Years (248 | 15.0%) for women.
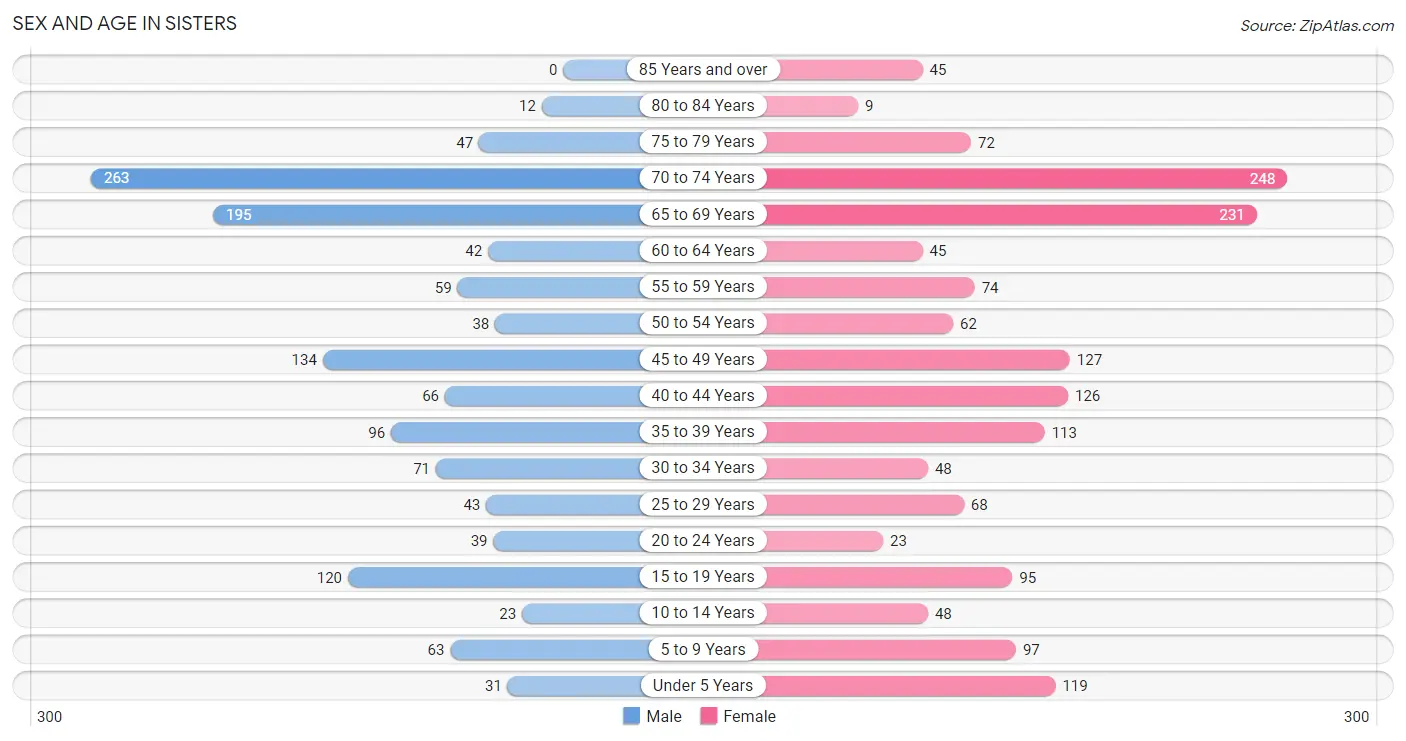
| Age Bracket | Male | Female |
| Under 5 Years | 31 (2.3%) | 119 (7.2%) |
| 5 to 9 Years | 63 (4.7%) | 97 (5.9%) |
| 10 to 14 Years | 23 (1.7%) | 48 (2.9%) |
| 15 to 19 Years | 120 (8.9%) | 95 (5.8%) |
| 20 to 24 Years | 39 (2.9%) | 23 (1.4%) |
| 25 to 29 Years | 43 (3.2%) | 68 (4.1%) |
| 30 to 34 Years | 71 (5.3%) | 48 (2.9%) |
| 35 to 39 Years | 96 (7.1%) | 113 (6.9%) |
| 40 to 44 Years | 66 (4.9%) | 126 (7.6%) |
| 45 to 49 Years | 134 (10.0%) | 127 (7.7%) |
| 50 to 54 Years | 38 (2.8%) | 62 (3.8%) |
| 55 to 59 Years | 59 (4.4%) | 74 (4.5%) |
| 60 to 64 Years | 42 (3.1%) | 45 (2.7%) |
| 65 to 69 Years | 195 (14.5%) | 231 (14.0%) |
| 70 to 74 Years | 263 (19.6%) | 248 (15.0%) |
| 75 to 79 Years | 47 (3.5%) | 72 (4.4%) |
| 80 to 84 Years | 12 (0.9%) | 9 (0.5%) |
| 85 Years and over | 0 (0.0%) | 45 (2.7%) |
| Total | 1,342 (100.0%) | 1,650 (100.0%) |
Families and Households in Sisters
Median Family Size in Sisters
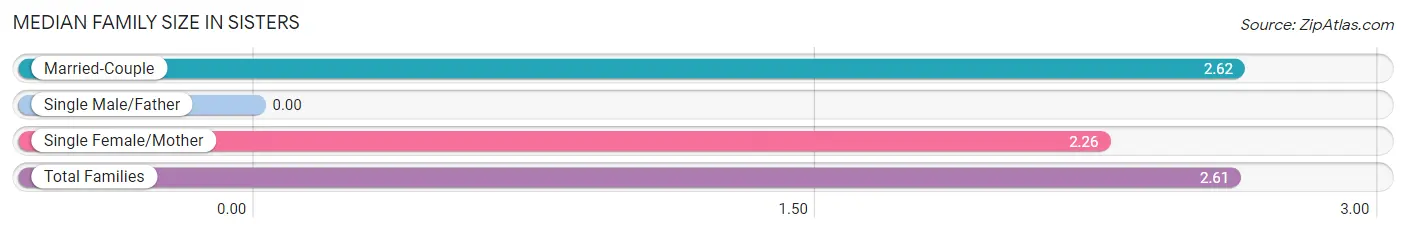
| Family Type | # Families | Family Size |
| Married-Couple | 927 (96.4%) | 2.62 |
| Single Male/Father | 0 (0.0%) | - |
| Single Female/Mother | 35 (3.6%) | 2.26 |
| Total Families | 962 (100.0%) | 2.61 |
Median Household Size in Sisters
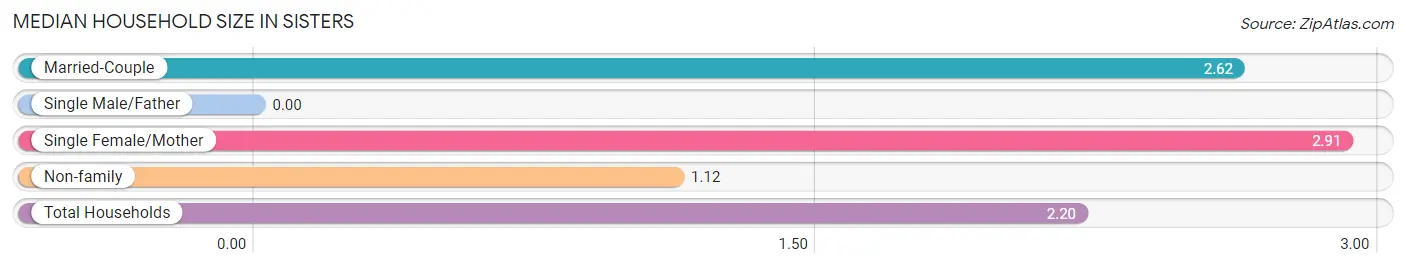
| Household Type | # Households | Household Size |
| Married-Couple | 927 (69.0%) | 2.62 |
| Single Male/Father | 0 (0.0%) | - |
| Single Female/Mother | 35 (2.6%) | 2.91 |
| Non-family | 381 (28.4%) | 1.12 |
| Total Households | 1,343 (100.0%) | 2.20 |
Household Size by Marriage Status in Sisters
Out of a total of 1,343 households in Sisters, 962 (71.6%) are family households, while 381 (28.4%) are nonfamily households. The most numerous type of family households are 2-person households, comprising 564, and the most common type of nonfamily households are 1-person households, comprising 339.
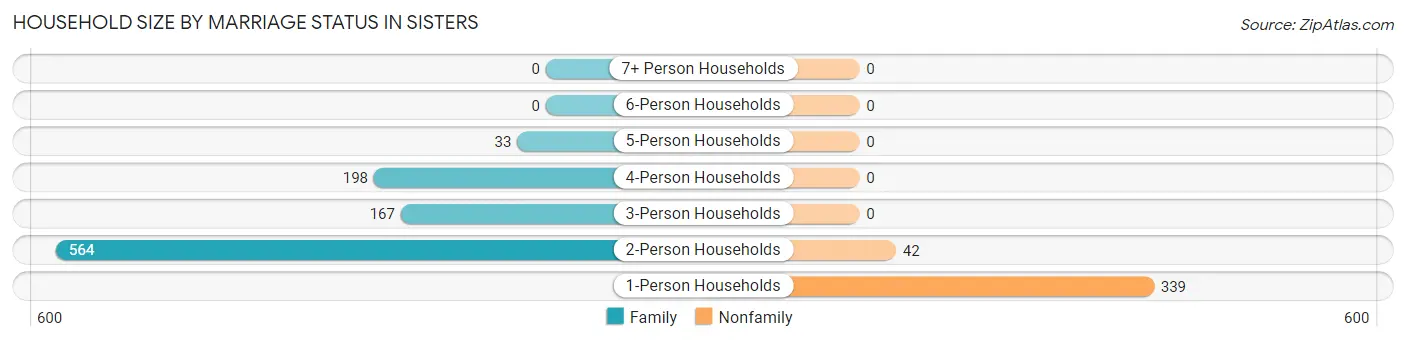
| Household Size | Family Households | Nonfamily Households |
| 1-Person Households | - | 339 (25.2%) |
| 2-Person Households | 564 (42.0%) | 42 (3.1%) |
| 3-Person Households | 167 (12.4%) | 0 (0.0%) |
| 4-Person Households | 198 (14.7%) | 0 (0.0%) |
| 5-Person Households | 33 (2.5%) | 0 (0.0%) |
| 6-Person Households | 0 (0.0%) | 0 (0.0%) |
| 7+ Person Households | 0 (0.0%) | 0 (0.0%) |
| Total | 962 (71.6%) | 381 (28.4%) |
Female Fertility in Sisters
Fertility by Age in Sisters
Average fertility rate in Sisters is 52.0 births per 1,000 women. Women in the age bracket of 20 to 34 years have the highest fertility rate with 237.0 births per 1,000 women. Women in the age bracket of 20 to 34 years acount for 100.0% of all women with births.
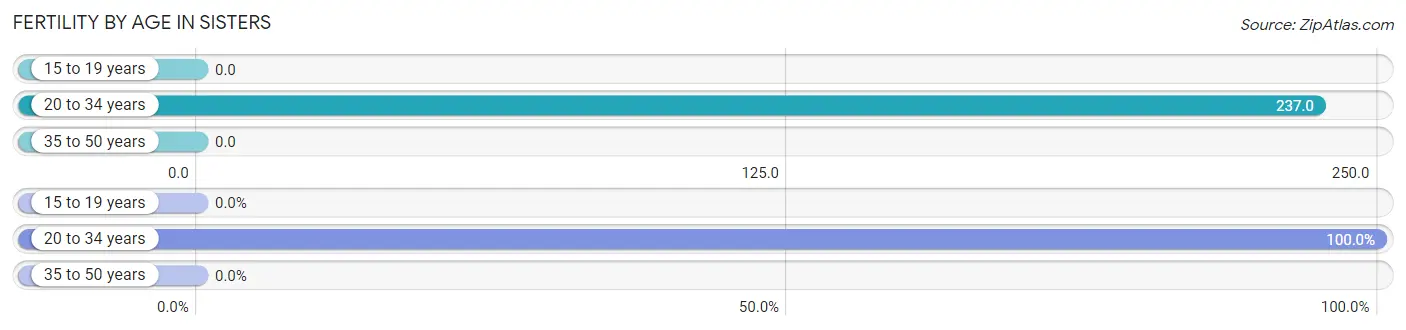
| Age Bracket | Women with Births | Births / 1,000 Women |
| 15 to 19 years | 0 (0.0%) | 0.0 |
| 20 to 34 years | 33 (100.0%) | 237.0 |
| 35 to 50 years | 0 (0.0%) | 0.0 |
| Total | 33 (100.0%) | 52.0 |
Fertility by Age by Marriage Status in Sisters
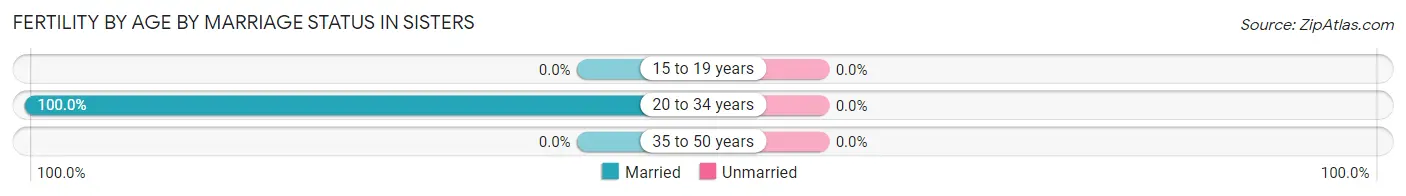
| Age Bracket | Married | Unmarried |
| 15 to 19 years | 0 (0.0%) | 0 (0.0%) |
| 20 to 34 years | 33 (100.0%) | 0 (0.0%) |
| 35 to 50 years | 0 (0.0%) | 0 (0.0%) |
| Total | 33 (100.0%) | 0 (0.0%) |
Fertility by Education in Sisters
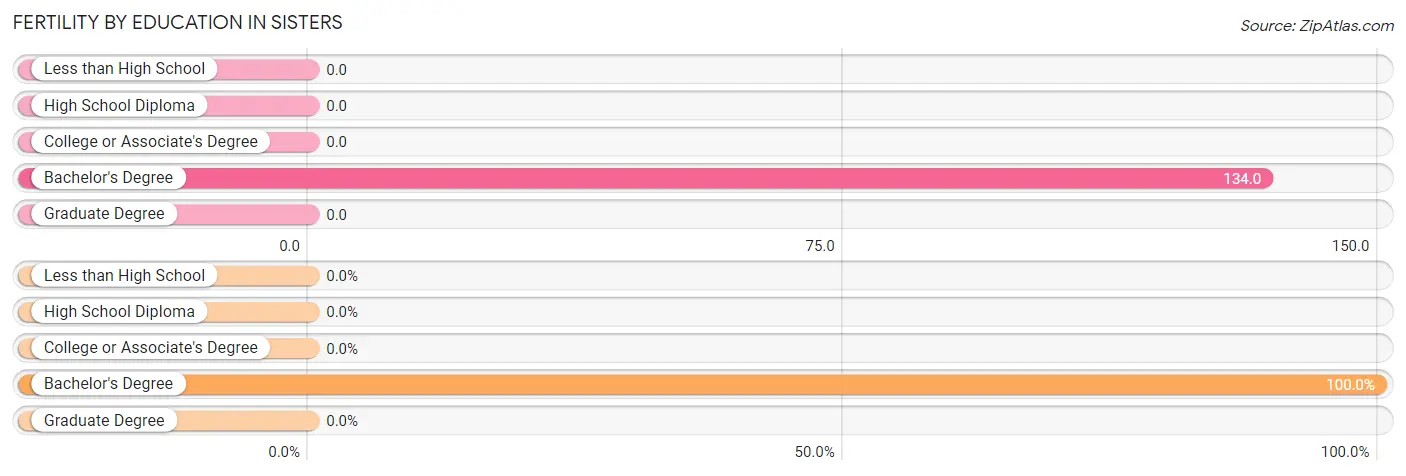
| Educational Attainment | Women with Births | Births / 1,000 Women |
| Less than High School | 0 (0.0%) | 0.0 |
| High School Diploma | 0 (0.0%) | 0.0 |
| College or Associate's Degree | 0 (0.0%) | 0.0 |
| Bachelor's Degree | 33 (100.0%) | 134.0 |
| Graduate Degree | 0 (0.0%) | 0.0 |
| Total | 33 (100.0%) | 52.0 |
Fertility by Education by Marriage Status in Sisters
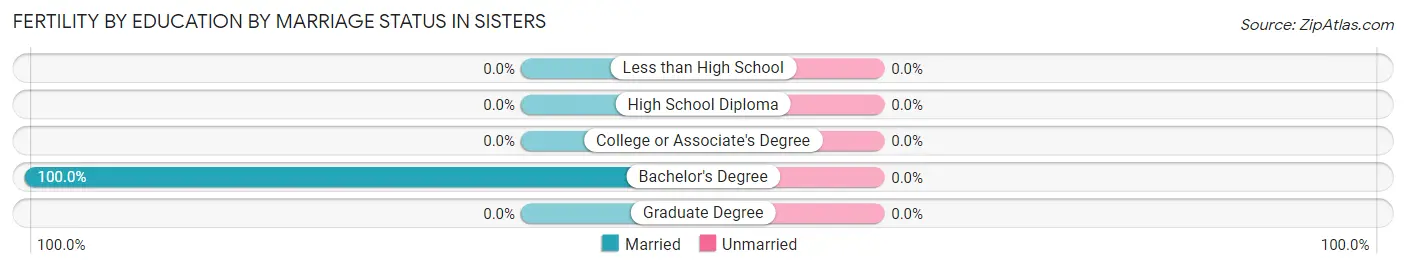
| Educational Attainment | Married | Unmarried |
| Less than High School | 0 (0.0%) | 0 (0.0%) |
| High School Diploma | 0 (0.0%) | 0 (0.0%) |
| College or Associate's Degree | 0 (0.0%) | 0 (0.0%) |
| Bachelor's Degree | 33 (100.0%) | 0 (0.0%) |
| Graduate Degree | 0 (0.0%) | 0 (0.0%) |
| Total | 33 (100.0%) | 0 (0.0%) |
Employment Characteristics in Sisters
Employment by Class of Employer in Sisters
Among the 1,269 employed individuals in Sisters, private company employees (663 | 52.2%), self-employed (not incorporated) (254 | 20.0%), and self-employed (incorporated) (154 | 12.1%) make up the most common classes of employment.
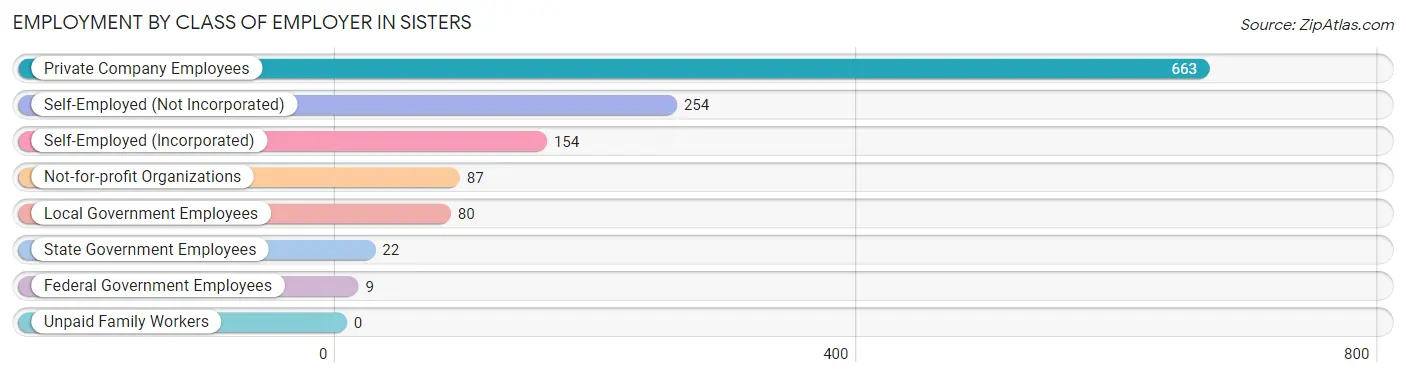
| Employer Class | # Employees | % Employees |
| Private Company Employees | 663 | 52.2% |
| Self-Employed (Incorporated) | 154 | 12.1% |
| Self-Employed (Not Incorporated) | 254 | 20.0% |
| Not-for-profit Organizations | 87 | 6.9% |
| Local Government Employees | 80 | 6.3% |
| State Government Employees | 22 | 1.7% |
| Federal Government Employees | 9 | 0.7% |
| Unpaid Family Workers | 0 | 0.0% |
| Total | 1,269 | 100.0% |
Employment Status by Age in Sisters
According to the labor force statistics for Sisters, out of the total population over 16 years of age (2,569), 51.5% or 1,323 individuals are in the labor force, with 4.0% or 53 of them unemployed. The age group with the highest labor force participation rate is 30 to 34 years, with 90.8% or 108 individuals in the labor force. Within the labor force, the 16 to 19 years age range has the highest percentage of unemployed individuals, with 28.8% or 32 of them being unemployed.
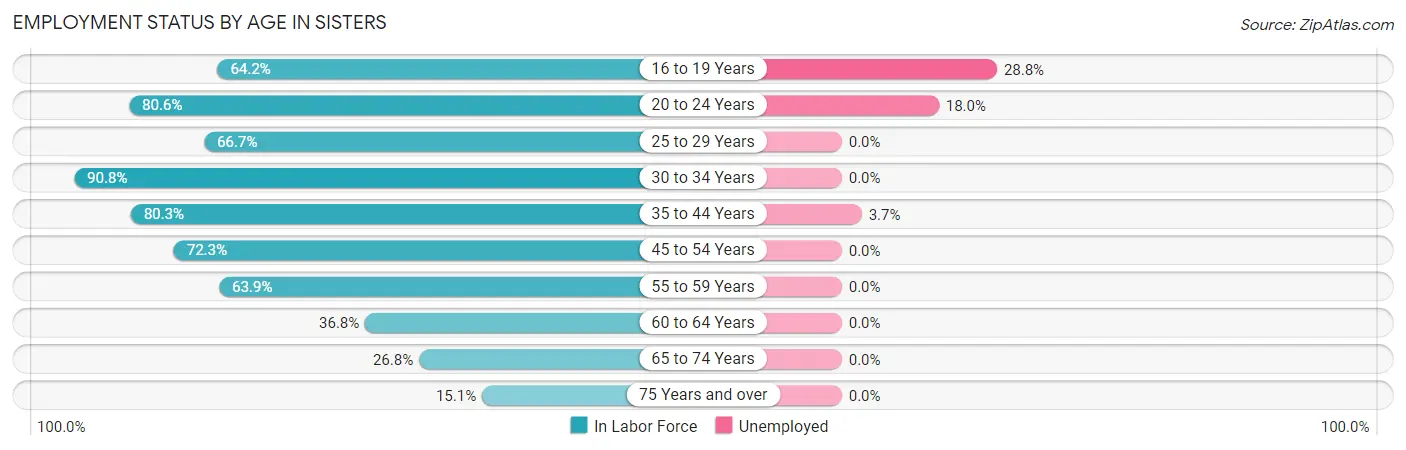
| Age Bracket | In Labor Force | Unemployed |
| 16 to 19 Years | 111 (64.2%) | 32 (28.8%) |
| 20 to 24 Years | 50 (80.6%) | 9 (18.0%) |
| 25 to 29 Years | 74 (66.7%) | 0 (0.0%) |
| 30 to 34 Years | 108 (90.8%) | 0 (0.0%) |
| 35 to 44 Years | 322 (80.3%) | 12 (3.7%) |
| 45 to 54 Years | 261 (72.3%) | 0 (0.0%) |
| 55 to 59 Years | 85 (63.9%) | 0 (0.0%) |
| 60 to 64 Years | 32 (36.8%) | 0 (0.0%) |
| 65 to 74 Years | 251 (26.8%) | 0 (0.0%) |
| 75 Years and over | 28 (15.1%) | 0 (0.0%) |
| Total | 1,323 (51.5%) | 53 (4.0%) |
Employment Status by Educational Attainment in Sisters
According to labor force statistics for Sisters, 72.8% of individuals (882) out of the total population between 25 and 64 years of age (1,212) are in the labor force, with 1.4% or 12 of them being unemployed. The group with the highest labor force participation rate are those with the educational attainment of bachelor's degree or higher, with 79.4% or 439 individuals in the labor force. Within the labor force, individuals with bachelor's degree or higher education have the highest percentage of unemployment, with 2.7% or 12 of them being unemployed.
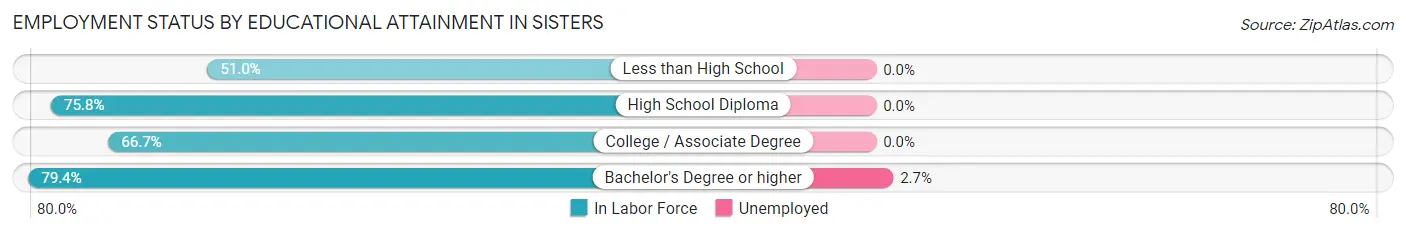
| Educational Attainment | In Labor Force | Unemployed |
| Less than High School | 51 (51.0%) | 0 (0.0%) |
| High School Diploma | 160 (75.8%) | 0 (0.0%) |
| College / Associate Degree | 232 (66.7%) | 0 (0.0%) |
| Bachelor's Degree or higher | 439 (79.4%) | 15 (2.7%) |
| Total | 882 (72.8%) | 17 (1.4%) |
Employment Occupations by Sex in Sisters
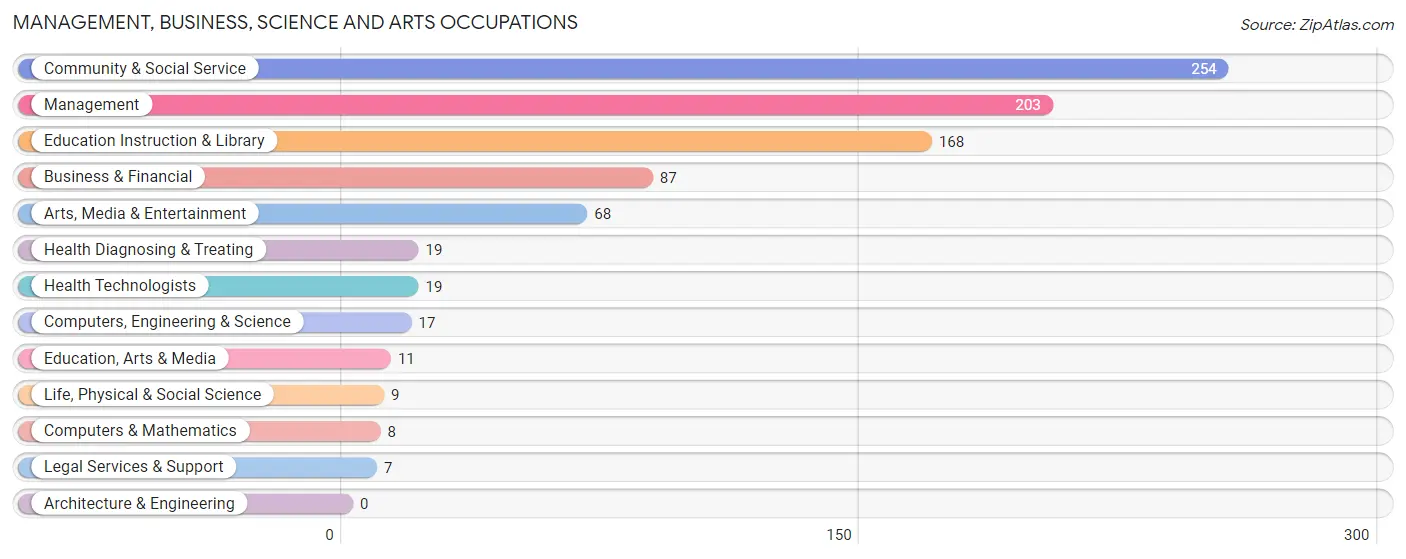
Management, Business, Science and Arts Occupations
The most common Management, Business, Science and Arts occupations in Sisters are Community & Social Service (254 | 20.0%), Management (203 | 16.0%), Education Instruction & Library (168 | 13.2%), Business & Financial (87 | 6.9%), and Arts, Media & Entertainment (68 | 5.4%).
Management, Business, Science and Arts Occupations by Sex
Within the Management, Business, Science and Arts occupations in Sisters, the most male-oriented occupations are Life, Physical & Social Science (100.0%), Education, Arts & Media (100.0%), and Legal Services & Support (100.0%), while the most female-oriented occupations are Computers & Mathematics (100.0%), Education Instruction & Library (82.7%), and Community & Social Service (54.7%).
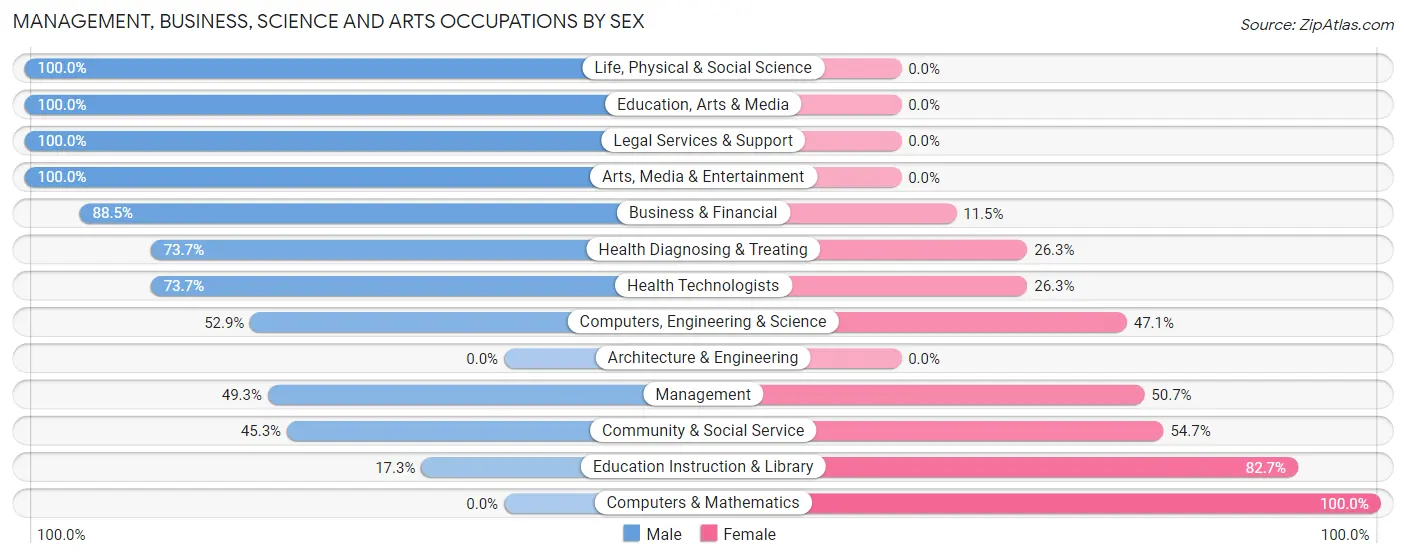
| Occupation | Male | Female |
| Management | 100 (49.3%) | 103 (50.7%) |
| Business & Financial | 77 (88.5%) | 10 (11.5%) |
| Computers, Engineering & Science | 9 (52.9%) | 8 (47.1%) |
| Computers & Mathematics | 0 (0.0%) | 8 (100.0%) |
| Architecture & Engineering | 0 (0.0%) | 0 (0.0%) |
| Life, Physical & Social Science | 9 (100.0%) | 0 (0.0%) |
| Community & Social Service | 115 (45.3%) | 139 (54.7%) |
| Education, Arts & Media | 11 (100.0%) | 0 (0.0%) |
| Legal Services & Support | 7 (100.0%) | 0 (0.0%) |
| Education Instruction & Library | 29 (17.3%) | 139 (82.7%) |
| Arts, Media & Entertainment | 68 (100.0%) | 0 (0.0%) |
| Health Diagnosing & Treating | 14 (73.7%) | 5 (26.3%) |
| Health Technologists | 14 (73.7%) | 5 (26.3%) |
| Total (Category) | 315 (54.3%) | 265 (45.7%) |
| Total (Overall) | 568 (44.8%) | 701 (55.2%) |
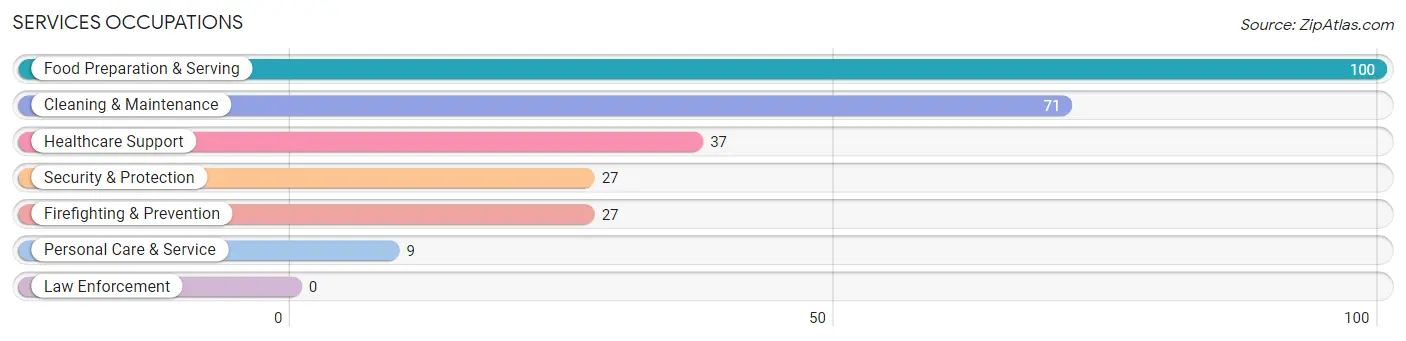
Services Occupations
The most common Services occupations in Sisters are Food Preparation & Serving (100 | 7.9%), Cleaning & Maintenance (71 | 5.6%), Healthcare Support (37 | 2.9%), Security & Protection (27 | 2.1%), and Firefighting & Prevention (27 | 2.1%).
Services Occupations by Sex
Within the Services occupations in Sisters, the most male-oriented occupations are Cleaning & Maintenance (42.2%), Food Preparation & Serving (32.0%), and Security & Protection (18.5%), while the most female-oriented occupations are Healthcare Support (100.0%), Personal Care & Service (100.0%), and Security & Protection (81.5%).
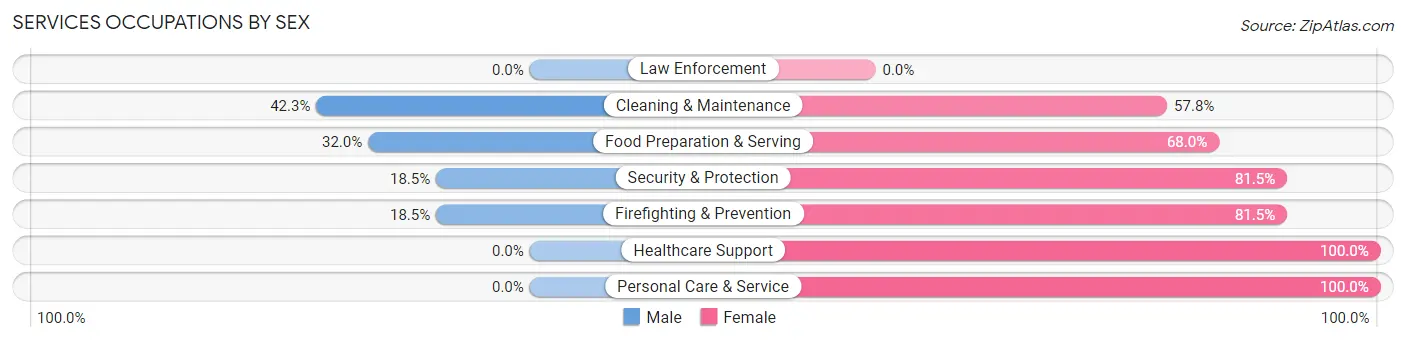
| Occupation | Male | Female |
| Healthcare Support | 0 (0.0%) | 37 (100.0%) |
| Security & Protection | 5 (18.5%) | 22 (81.5%) |
| Firefighting & Prevention | 5 (18.5%) | 22 (81.5%) |
| Law Enforcement | 0 (0.0%) | 0 (0.0%) |
| Food Preparation & Serving | 32 (32.0%) | 68 (68.0%) |
| Cleaning & Maintenance | 30 (42.2%) | 41 (57.8%) |
| Personal Care & Service | 0 (0.0%) | 9 (100.0%) |
| Total (Category) | 67 (27.5%) | 177 (72.5%) |
| Total (Overall) | 568 (44.8%) | 701 (55.2%) |
Sales and Office Occupations
The most common Sales and Office occupations in Sisters are Office & Administration (178 | 14.0%), and Sales & Related (158 | 12.4%).

Sales and Office Occupations by Sex

| Occupation | Male | Female |
| Sales & Related | 69 (43.7%) | 89 (56.3%) |
| Office & Administration | 31 (17.4%) | 147 (82.6%) |
| Total (Category) | 100 (29.8%) | 236 (70.2%) |
| Total (Overall) | 568 (44.8%) | 701 (55.2%) |
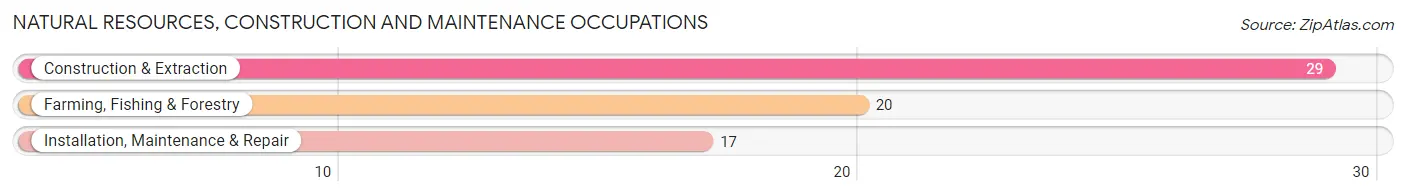
Natural Resources, Construction and Maintenance Occupations
The most common Natural Resources, Construction and Maintenance occupations in Sisters are Construction & Extraction (29 | 2.3%), Farming, Fishing & Forestry (20 | 1.6%), and Installation, Maintenance & Repair (17 | 1.3%).
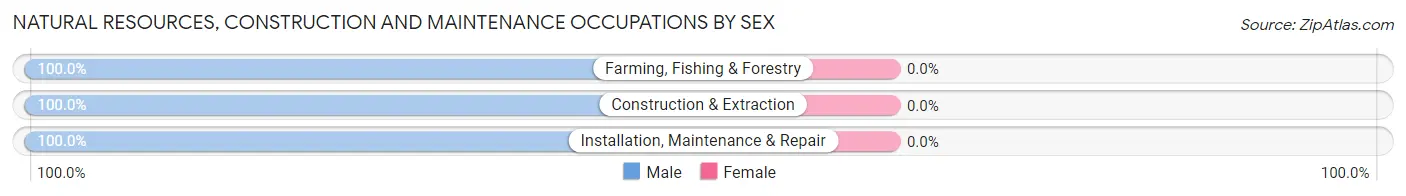
Natural Resources, Construction and Maintenance Occupations by Sex
| Occupation | Male | Female |
| Farming, Fishing & Forestry | 20 (100.0%) | 0 (0.0%) |
| Construction & Extraction | 29 (100.0%) | 0 (0.0%) |
| Installation, Maintenance & Repair | 17 (100.0%) | 0 (0.0%) |
| Total (Category) | 66 (100.0%) | 0 (0.0%) |
| Total (Overall) | 568 (44.8%) | 701 (55.2%) |
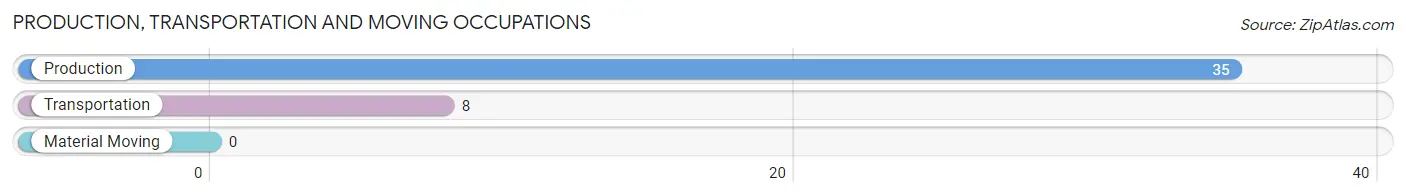
Production, Transportation and Moving Occupations
The most common Production, Transportation and Moving occupations in Sisters are Production (35 | 2.8%), and Transportation (8 | 0.6%).
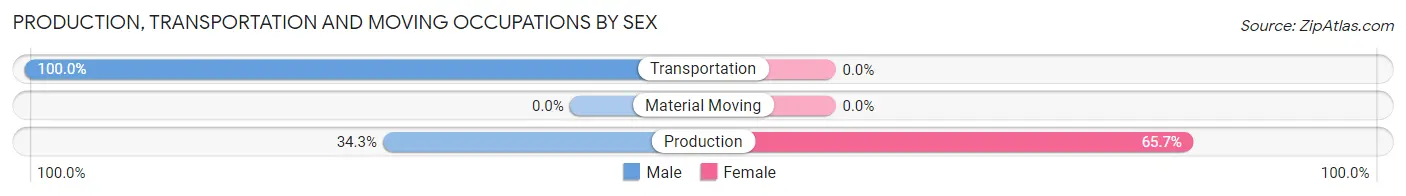
Production, Transportation and Moving Occupations by Sex
| Occupation | Male | Female |
| Production | 12 (34.3%) | 23 (65.7%) |
| Transportation | 8 (100.0%) | 0 (0.0%) |
| Material Moving | 0 (0.0%) | 0 (0.0%) |
| Total (Category) | 20 (46.5%) | 23 (53.5%) |
| Total (Overall) | 568 (44.8%) | 701 (55.2%) |
Employment Industries by Sex in Sisters
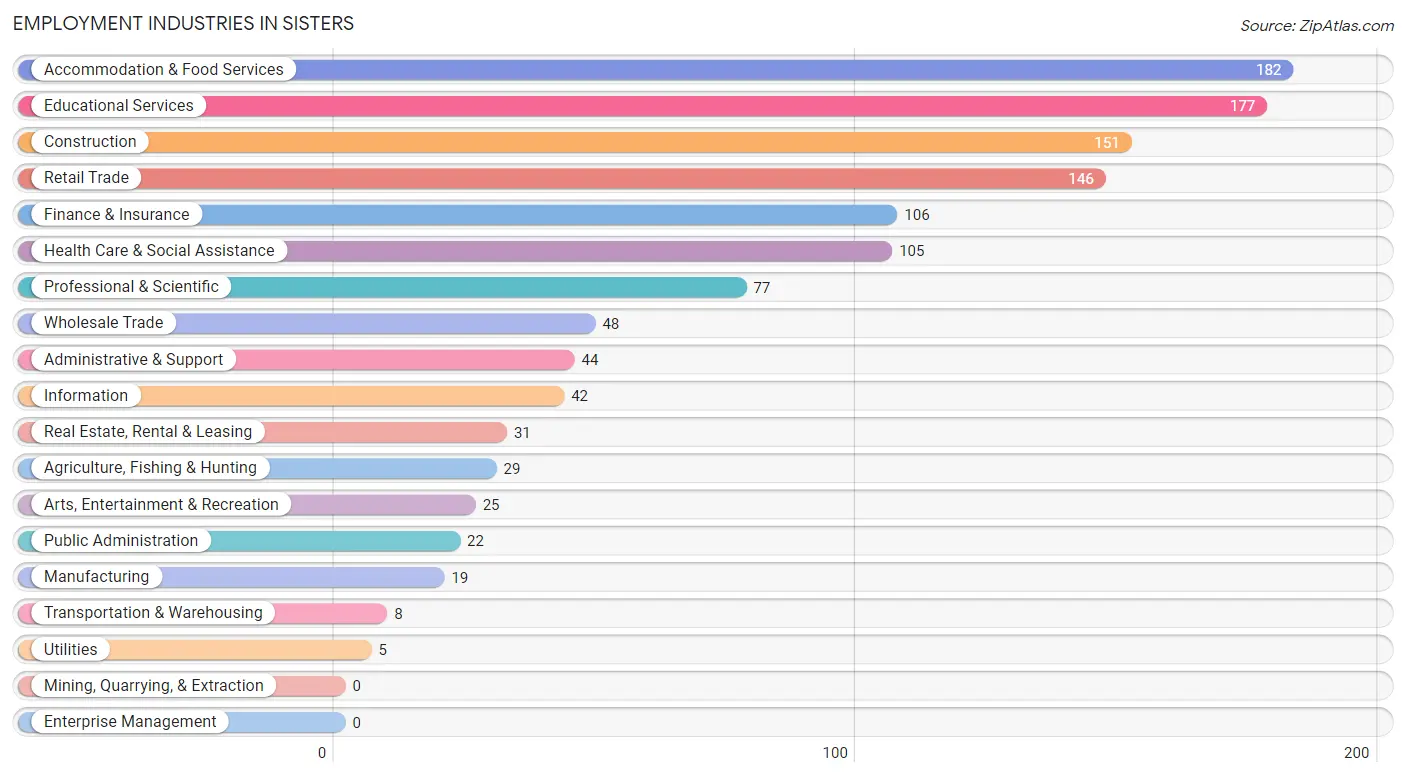
Employment Industries in Sisters
The major employment industries in Sisters include Accommodation & Food Services (182 | 14.3%), Educational Services (177 | 14.0%), Construction (151 | 11.9%), Retail Trade (146 | 11.5%), and Finance & Insurance (106 | 8.4%).
Employment Industries by Sex in Sisters
The Sisters industries that see more men than women are Agriculture, Fishing & Hunting (100.0%), Transportation & Warehousing (100.0%), and Utilities (100.0%), whereas the industries that tend to have a higher number of women are Arts, Entertainment & Recreation (100.0%), Educational Services (78.5%), and Retail Trade (67.1%).
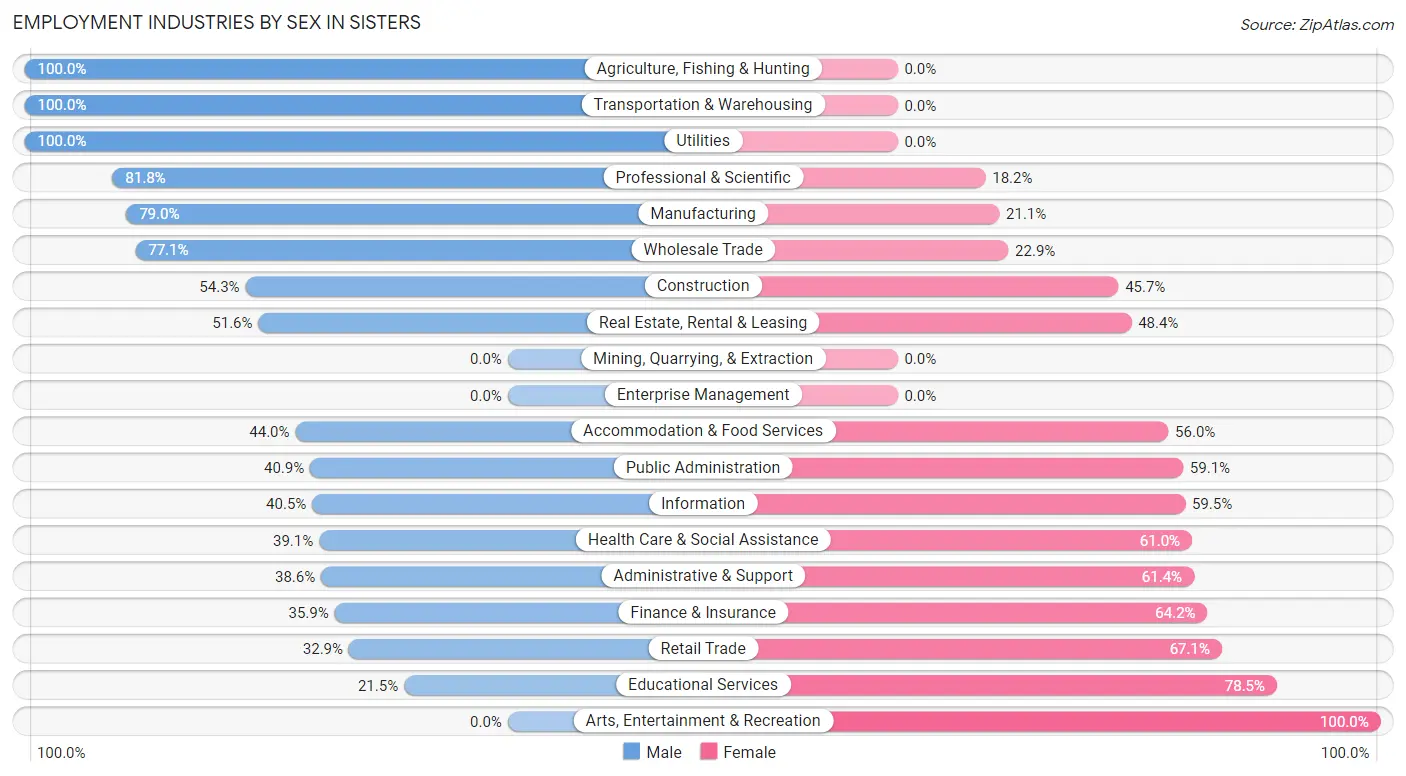
| Industry | Male | Female |
| Agriculture, Fishing & Hunting | 29 (100.0%) | 0 (0.0%) |
| Mining, Quarrying, & Extraction | 0 (0.0%) | 0 (0.0%) |
| Construction | 82 (54.3%) | 69 (45.7%) |
| Manufacturing | 15 (78.9%) | 4 (21.0%) |
| Wholesale Trade | 37 (77.1%) | 11 (22.9%) |
| Retail Trade | 48 (32.9%) | 98 (67.1%) |
| Transportation & Warehousing | 8 (100.0%) | 0 (0.0%) |
| Utilities | 5 (100.0%) | 0 (0.0%) |
| Information | 17 (40.5%) | 25 (59.5%) |
| Finance & Insurance | 38 (35.8%) | 68 (64.1%) |
| Real Estate, Rental & Leasing | 16 (51.6%) | 15 (48.4%) |
| Professional & Scientific | 63 (81.8%) | 14 (18.2%) |
| Enterprise Management | 0 (0.0%) | 0 (0.0%) |
| Administrative & Support | 17 (38.6%) | 27 (61.4%) |
| Educational Services | 38 (21.5%) | 139 (78.5%) |
| Health Care & Social Assistance | 41 (39.1%) | 64 (61.0%) |
| Arts, Entertainment & Recreation | 0 (0.0%) | 25 (100.0%) |
| Accommodation & Food Services | 80 (44.0%) | 102 (56.0%) |
| Public Administration | 9 (40.9%) | 13 (59.1%) |
| Total | 568 (44.8%) | 701 (55.2%) |
Education in Sisters
School Enrollment in Sisters
The most common levels of schooling among the 487 students in Sisters are high school (171 | 35.1%), elementary school (125 | 25.7%), and middle school (71 | 14.6%).
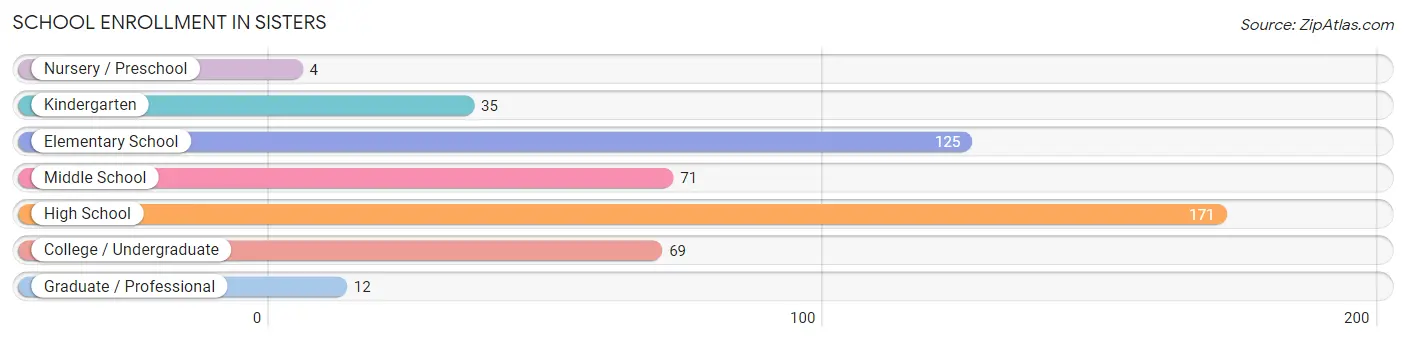
| School Level | # Students | % Students |
| Nursery / Preschool | 4 | 0.8% |
| Kindergarten | 35 | 7.2% |
| Elementary School | 125 | 25.7% |
| Middle School | 71 | 14.6% |
| High School | 171 | 35.1% |
| College / Undergraduate | 69 | 14.2% |
| Graduate / Professional | 12 | 2.5% |
| Total | 487 | 100.0% |
School Enrollment by Age by Funding Source in Sisters
Out of a total of 487 students who are enrolled in schools in Sisters, 98 (20.1%) attend a private institution, while the remaining 389 (79.9%) are enrolled in public schools. The age group of 5 to 9 year old has the highest likelihood of being enrolled in private schools, with 74 (46.3% in the age bracket) enrolled. Conversely, the age group of 3 to 4 year olds has the lowest likelihood of being enrolled in a private school, with 4 (100.0% in the age bracket) attending a public institution.
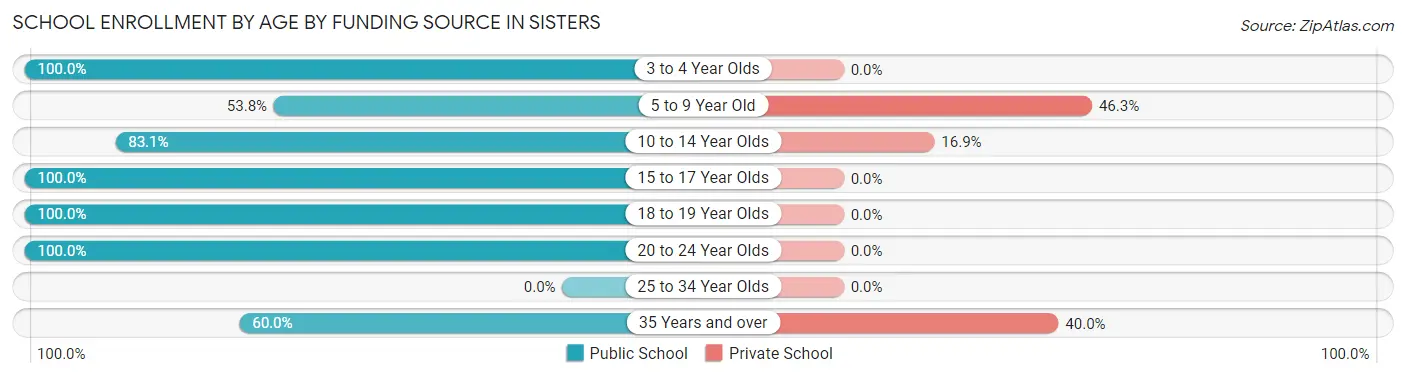
| Age Bracket | Public School | Private School |
| 3 to 4 Year Olds | 4 (100.0%) | 0 (0.0%) |
| 5 to 9 Year Old | 86 (53.7%) | 74 (46.3%) |
| 10 to 14 Year Olds | 59 (83.1%) | 12 (16.9%) |
| 15 to 17 Year Olds | 150 (100.0%) | 0 (0.0%) |
| 18 to 19 Year Olds | 49 (100.0%) | 0 (0.0%) |
| 20 to 24 Year Olds | 23 (100.0%) | 0 (0.0%) |
| 25 to 34 Year Olds | 0 (0.0%) | 0 (0.0%) |
| 35 Years and over | 18 (60.0%) | 12 (40.0%) |
| Total | 389 (79.9%) | 98 (20.1%) |
Educational Attainment by Field of Study in Sisters
Business (196 | 17.3%), social sciences (140 | 12.4%), science & technology (119 | 10.5%), arts & humanities (113 | 10.0%), and liberal arts & history (109 | 9.6%) are the most common fields of study among 1,133 individuals in Sisters who have obtained a bachelor's degree or higher.
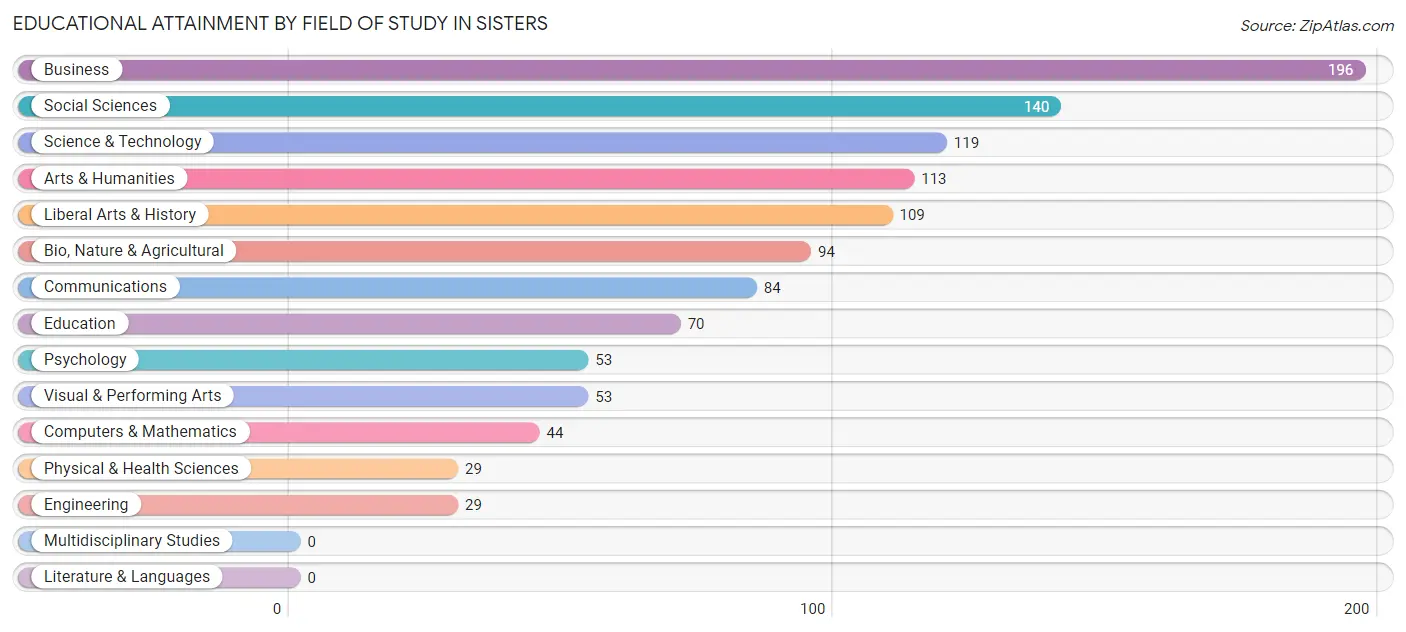
| Field of Study | # Graduates | % Graduates |
| Computers & Mathematics | 44 | 3.9% |
| Bio, Nature & Agricultural | 94 | 8.3% |
| Physical & Health Sciences | 29 | 2.6% |
| Psychology | 53 | 4.7% |
| Social Sciences | 140 | 12.4% |
| Engineering | 29 | 2.6% |
| Multidisciplinary Studies | 0 | 0.0% |
| Science & Technology | 119 | 10.5% |
| Business | 196 | 17.3% |
| Education | 70 | 6.2% |
| Literature & Languages | 0 | 0.0% |
| Liberal Arts & History | 109 | 9.6% |
| Visual & Performing Arts | 53 | 4.7% |
| Communications | 84 | 7.4% |
| Arts & Humanities | 113 | 10.0% |
| Total | 1,133 | 100.0% |
Transportation & Commute in Sisters
Vehicle Availability by Sex in Sisters
The most prevalent vehicle ownership categories in Sisters are males with 2 vehicles (283, accounting for 51.5%) and females with 2 vehicles (276, making up 40.4%).
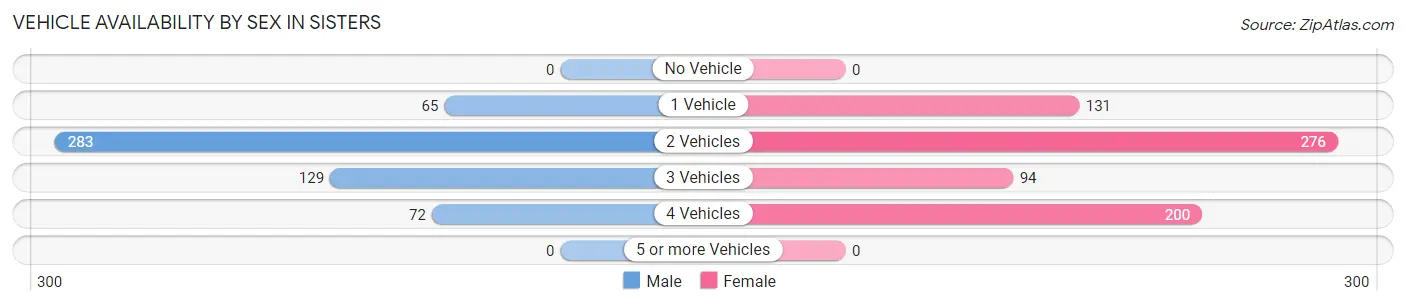
| Vehicles Available | Male | Female |
| No Vehicle | 0 (0.0%) | 0 (0.0%) |
| 1 Vehicle | 65 (11.8%) | 131 (18.7%) |
| 2 Vehicles | 283 (51.5%) | 276 (39.4%) |
| 3 Vehicles | 129 (23.5%) | 94 (13.4%) |
| 4 Vehicles | 72 (13.1%) | 200 (28.5%) |
| 5 or more Vehicles | 0 (0.0%) | 0 (0.0%) |
| Total | 549 (100.0%) | 701 (100.0%) |
Commute Time in Sisters
The most frequently occuring commute durations in Sisters are 5 to 9 minutes (277 commuters, 28.5%), less than 5 minutes (175 commuters, 18.0%), and 30 to 34 minutes (153 commuters, 15.8%).
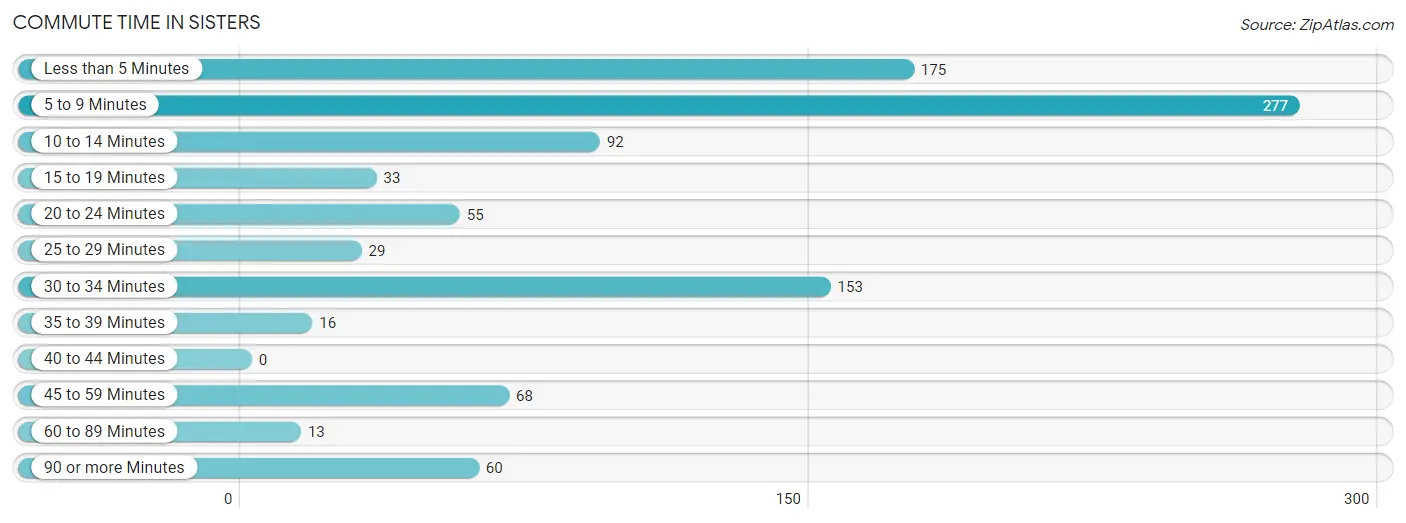
| Commute Time | # Commuters | % Commuters |
| Less than 5 Minutes | 175 | 18.0% |
| 5 to 9 Minutes | 277 | 28.5% |
| 10 to 14 Minutes | 92 | 9.5% |
| 15 to 19 Minutes | 33 | 3.4% |
| 20 to 24 Minutes | 55 | 5.7% |
| 25 to 29 Minutes | 29 | 3.0% |
| 30 to 34 Minutes | 153 | 15.8% |
| 35 to 39 Minutes | 16 | 1.7% |
| 40 to 44 Minutes | 0 | 0.0% |
| 45 to 59 Minutes | 68 | 7.0% |
| 60 to 89 Minutes | 13 | 1.3% |
| 90 or more Minutes | 60 | 6.2% |
Commute Time by Sex in Sisters
The most common commute times in Sisters are 5 to 9 minutes (129 commuters, 25.9%) for males and 5 to 9 minutes (148 commuters, 31.3%) for females.
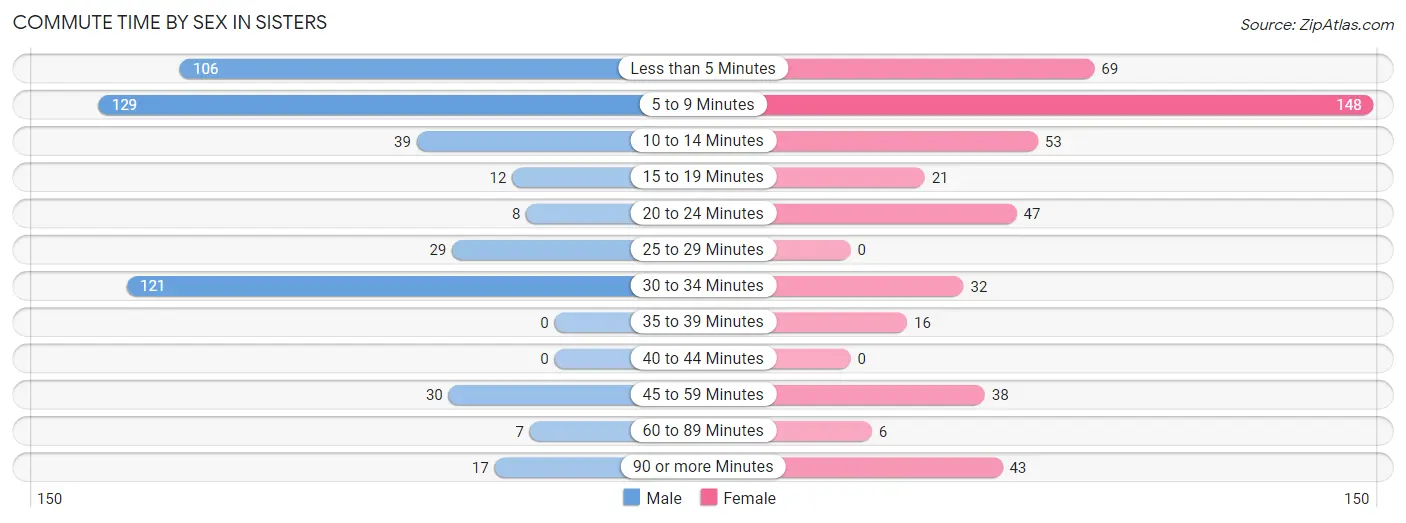
| Commute Time | Male | Female |
| Less than 5 Minutes | 106 (21.3%) | 69 (14.6%) |
| 5 to 9 Minutes | 129 (25.9%) | 148 (31.3%) |
| 10 to 14 Minutes | 39 (7.8%) | 53 (11.2%) |
| 15 to 19 Minutes | 12 (2.4%) | 21 (4.4%) |
| 20 to 24 Minutes | 8 (1.6%) | 47 (9.9%) |
| 25 to 29 Minutes | 29 (5.8%) | 0 (0.0%) |
| 30 to 34 Minutes | 121 (24.3%) | 32 (6.8%) |
| 35 to 39 Minutes | 0 (0.0%) | 16 (3.4%) |
| 40 to 44 Minutes | 0 (0.0%) | 0 (0.0%) |
| 45 to 59 Minutes | 30 (6.0%) | 38 (8.0%) |
| 60 to 89 Minutes | 7 (1.4%) | 6 (1.3%) |
| 90 or more Minutes | 17 (3.4%) | 43 (9.1%) |
Time of Departure to Work by Sex in Sisters
The most frequent times of departure to work in Sisters are 8:00 AM to 8:29 AM (120, 24.1%) for males and 8:00 AM to 8:29 AM (102, 21.6%) for females.
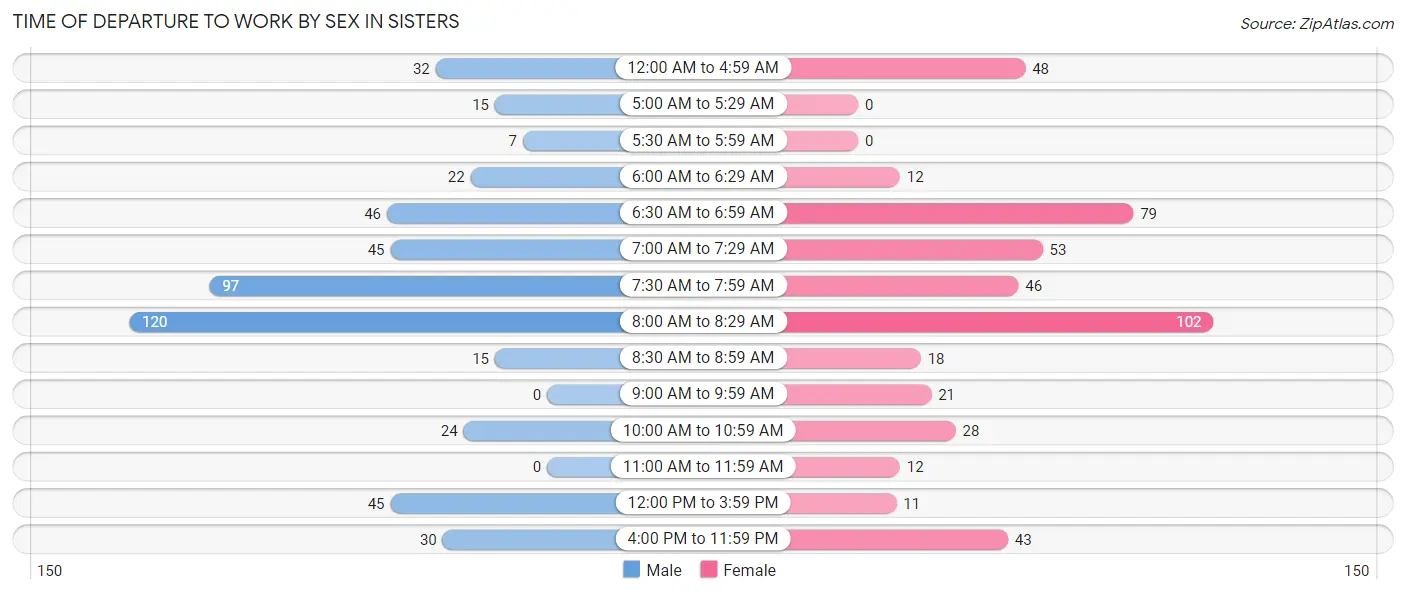
| Time of Departure | Male | Female |
| 12:00 AM to 4:59 AM | 32 (6.4%) | 48 (10.2%) |
| 5:00 AM to 5:29 AM | 15 (3.0%) | 0 (0.0%) |
| 5:30 AM to 5:59 AM | 7 (1.4%) | 0 (0.0%) |
| 6:00 AM to 6:29 AM | 22 (4.4%) | 12 (2.5%) |
| 6:30 AM to 6:59 AM | 46 (9.2%) | 79 (16.7%) |
| 7:00 AM to 7:29 AM | 45 (9.0%) | 53 (11.2%) |
| 7:30 AM to 7:59 AM | 97 (19.5%) | 46 (9.7%) |
| 8:00 AM to 8:29 AM | 120 (24.1%) | 102 (21.6%) |
| 8:30 AM to 8:59 AM | 15 (3.0%) | 18 (3.8%) |
| 9:00 AM to 9:59 AM | 0 (0.0%) | 21 (4.4%) |
| 10:00 AM to 10:59 AM | 24 (4.8%) | 28 (5.9%) |
| 11:00 AM to 11:59 AM | 0 (0.0%) | 12 (2.5%) |
| 12:00 PM to 3:59 PM | 45 (9.0%) | 11 (2.3%) |
| 4:00 PM to 11:59 PM | 30 (6.0%) | 43 (9.1%) |
| Total | 498 (100.0%) | 473 (100.0%) |
Housing Occupancy in Sisters
Occupancy by Ownership in Sisters
Of the total 1,343 dwellings in Sisters, owner-occupied units account for 1,044 (77.7%), while renter-occupied units make up 299 (22.3%).
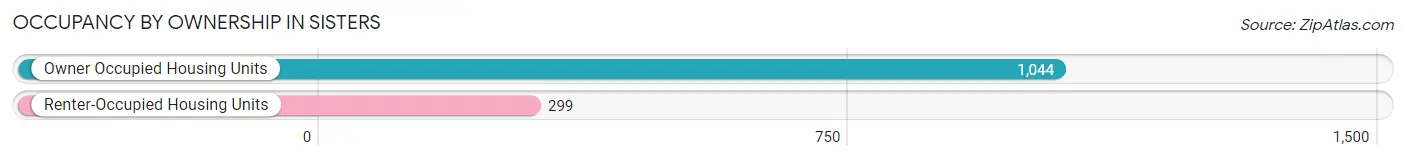
| Occupancy | # Housing Units | % Housing Units |
| Owner Occupied Housing Units | 1,044 | 77.7% |
| Renter-Occupied Housing Units | 299 | 22.3% |
| Total Occupied Housing Units | 1,343 | 100.0% |
Occupancy by Household Size in Sisters
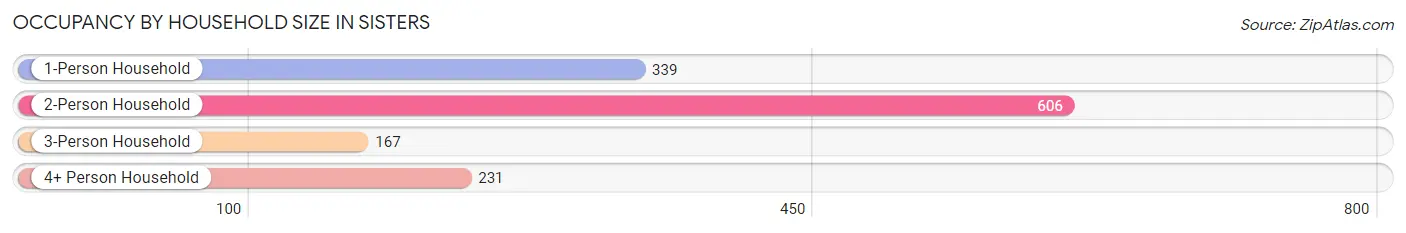
| Household Size | # Housing Units | % Housing Units |
| 1-Person Household | 339 | 25.2% |
| 2-Person Household | 606 | 45.1% |
| 3-Person Household | 167 | 12.4% |
| 4+ Person Household | 231 | 17.2% |
| Total Housing Units | 1,343 | 100.0% |
Occupancy by Ownership by Household Size in Sisters
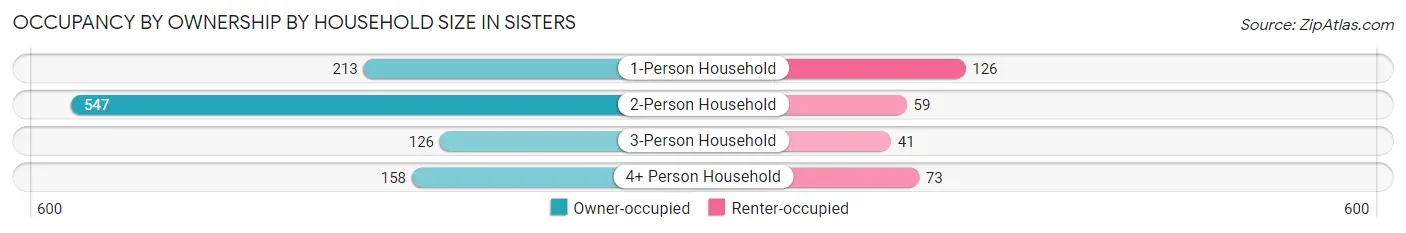
| Household Size | Owner-occupied | Renter-occupied |
| 1-Person Household | 213 (62.8%) | 126 (37.2%) |
| 2-Person Household | 547 (90.3%) | 59 (9.7%) |
| 3-Person Household | 126 (75.4%) | 41 (24.5%) |
| 4+ Person Household | 158 (68.4%) | 73 (31.6%) |
| Total Housing Units | 1,044 (77.7%) | 299 (22.3%) |
Occupancy by Educational Attainment in Sisters
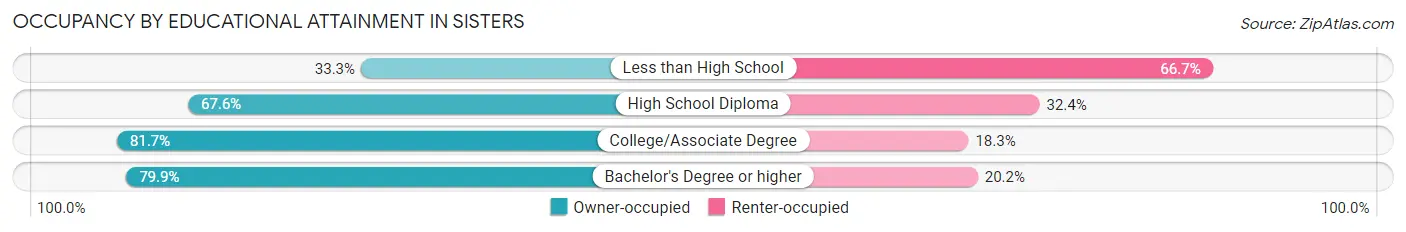
| Household Size | Owner-occupied | Renter-occupied |
| Less than High School | 9 (33.3%) | 18 (66.7%) |
| High School Diploma | 144 (67.6%) | 69 (32.4%) |
| College/Associate Degree | 451 (81.7%) | 101 (18.3%) |
| Bachelor's Degree or higher | 440 (79.8%) | 111 (20.2%) |
Occupancy by Age of Householder in Sisters
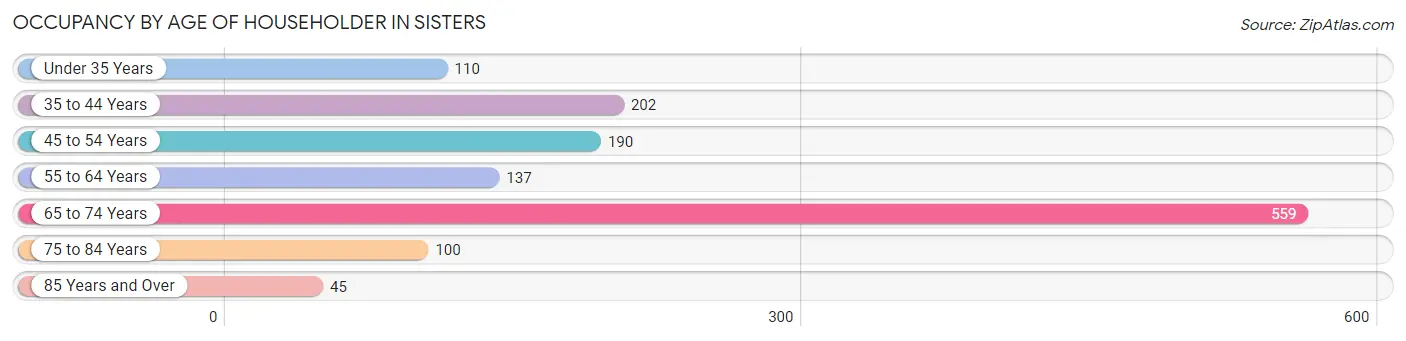
| Age Bracket | # Households | % Households |
| Under 35 Years | 110 | 8.2% |
| 35 to 44 Years | 202 | 15.0% |
| 45 to 54 Years | 190 | 14.1% |
| 55 to 64 Years | 137 | 10.2% |
| 65 to 74 Years | 559 | 41.6% |
| 75 to 84 Years | 100 | 7.4% |
| 85 Years and Over | 45 | 3.4% |
| Total | 1,343 | 100.0% |
Housing Finances in Sisters
Median Income by Occupancy in Sisters
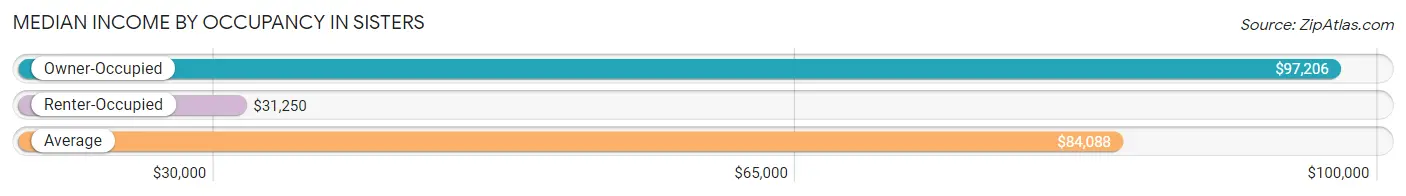
| Occupancy Type | # Households | Median Income |
| Owner-Occupied | 1,044 (77.7%) | $97,206 |
| Renter-Occupied | 299 (22.3%) | $31,250 |
| Average | 1,343 (100.0%) | $84,088 |
Occupancy by Householder Income Bracket in Sisters
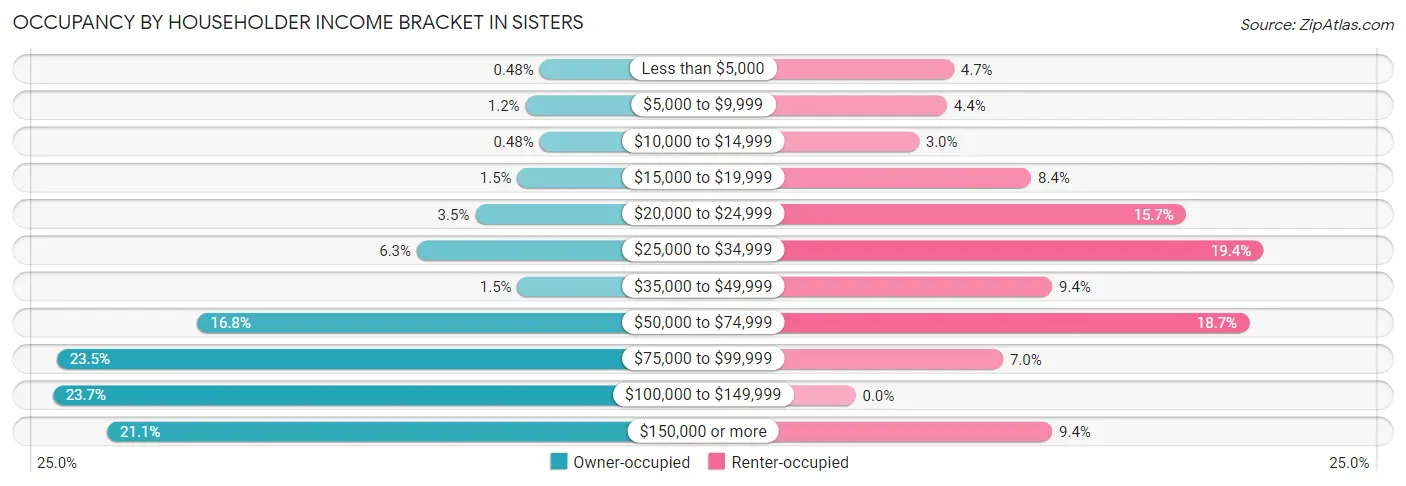
| Income Bracket | Owner-occupied | Renter-occupied |
| Less than $5,000 | 5 (0.5%) | 14 (4.7%) |
| $5,000 to $9,999 | 12 (1.1%) | 13 (4.3%) |
| $10,000 to $14,999 | 5 (0.5%) | 9 (3.0%) |
| $15,000 to $19,999 | 16 (1.5%) | 25 (8.4%) |
| $20,000 to $24,999 | 37 (3.5%) | 47 (15.7%) |
| $25,000 to $34,999 | 66 (6.3%) | 58 (19.4%) |
| $35,000 to $49,999 | 16 (1.5%) | 28 (9.4%) |
| $50,000 to $74,999 | 175 (16.8%) | 56 (18.7%) |
| $75,000 to $99,999 | 245 (23.5%) | 21 (7.0%) |
| $100,000 to $149,999 | 247 (23.7%) | 0 (0.0%) |
| $150,000 or more | 220 (21.1%) | 28 (9.4%) |
| Total | 1,044 (100.0%) | 299 (100.0%) |
Monthly Housing Cost Tiers in Sisters
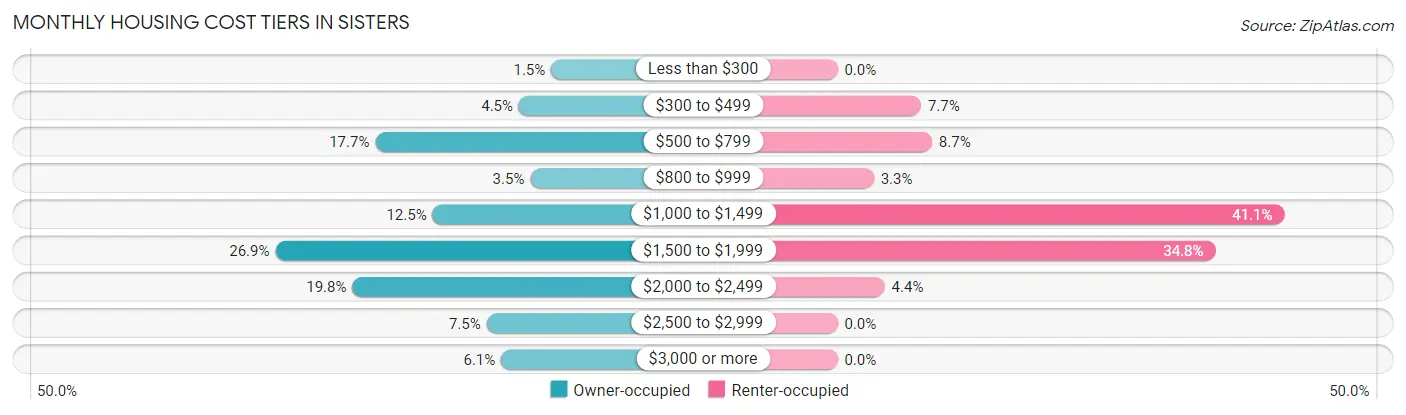
| Monthly Cost | Owner-occupied | Renter-occupied |
| Less than $300 | 16 (1.5%) | 0 (0.0%) |
| $300 to $499 | 47 (4.5%) | 23 (7.7%) |
| $500 to $799 | 185 (17.7%) | 26 (8.7%) |
| $800 to $999 | 36 (3.5%) | 10 (3.3%) |
| $1,000 to $1,499 | 130 (12.4%) | 123 (41.1%) |
| $1,500 to $1,999 | 281 (26.9%) | 104 (34.8%) |
| $2,000 to $2,499 | 207 (19.8%) | 13 (4.3%) |
| $2,500 to $2,999 | 78 (7.5%) | 0 (0.0%) |
| $3,000 or more | 64 (6.1%) | 0 (0.0%) |
| Total | 1,044 (100.0%) | 299 (100.0%) |
Physical Housing Characteristics in Sisters
Housing Structures in Sisters
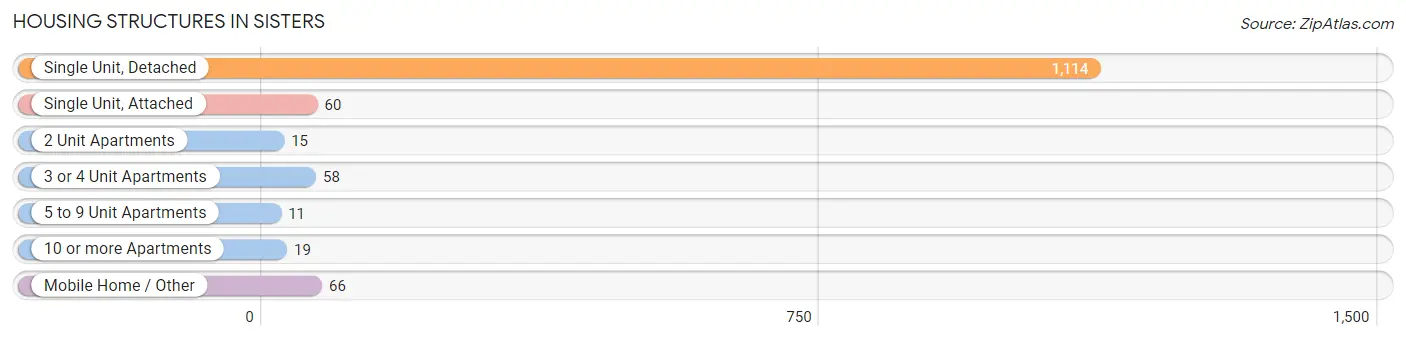
| Structure Type | # Housing Units | % Housing Units |
| Single Unit, Detached | 1,114 | 83.0% |
| Single Unit, Attached | 60 | 4.5% |
| 2 Unit Apartments | 15 | 1.1% |
| 3 or 4 Unit Apartments | 58 | 4.3% |
| 5 to 9 Unit Apartments | 11 | 0.8% |
| 10 or more Apartments | 19 | 1.4% |
| Mobile Home / Other | 66 | 4.9% |
| Total | 1,343 | 100.0% |
Housing Structures by Occupancy in Sisters
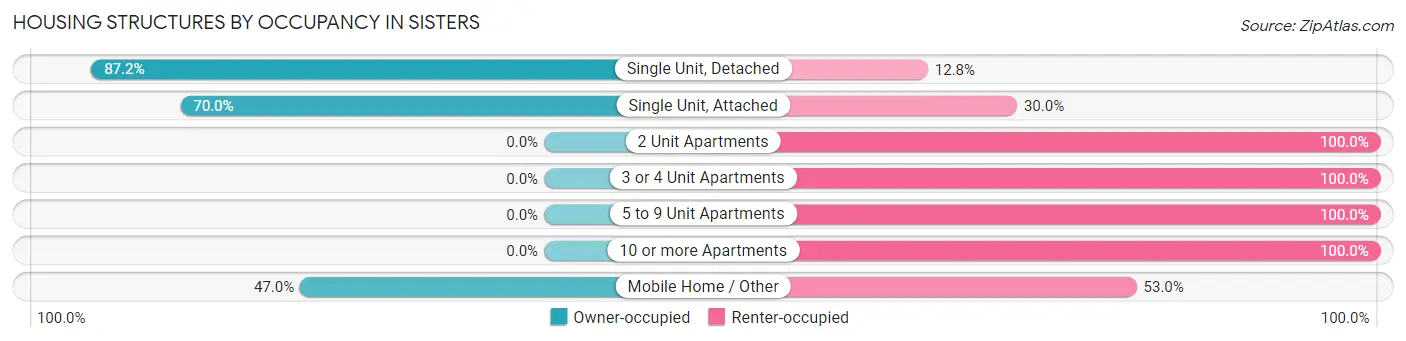
| Structure Type | Owner-occupied | Renter-occupied |
| Single Unit, Detached | 971 (87.2%) | 143 (12.8%) |
| Single Unit, Attached | 42 (70.0%) | 18 (30.0%) |
| 2 Unit Apartments | 0 (0.0%) | 15 (100.0%) |
| 3 or 4 Unit Apartments | 0 (0.0%) | 58 (100.0%) |
| 5 to 9 Unit Apartments | 0 (0.0%) | 11 (100.0%) |
| 10 or more Apartments | 0 (0.0%) | 19 (100.0%) |
| Mobile Home / Other | 31 (47.0%) | 35 (53.0%) |
| Total | 1,044 (77.7%) | 299 (22.3%) |
Housing Structures by Number of Rooms in Sisters
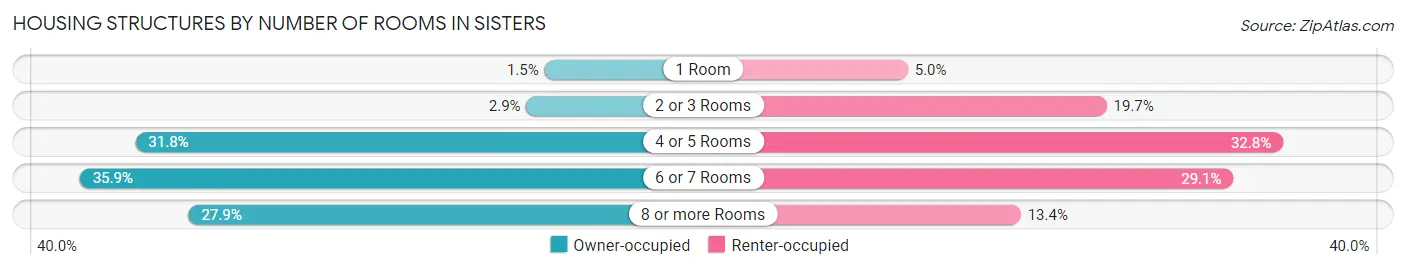
| Number of Rooms | Owner-occupied | Renter-occupied |
| 1 Room | 16 (1.5%) | 15 (5.0%) |
| 2 or 3 Rooms | 30 (2.9%) | 59 (19.7%) |
| 4 or 5 Rooms | 332 (31.8%) | 98 (32.8%) |
| 6 or 7 Rooms | 375 (35.9%) | 87 (29.1%) |
| 8 or more Rooms | 291 (27.9%) | 40 (13.4%) |
| Total | 1,044 (100.0%) | 299 (100.0%) |
Housing Structure by Heating Type in Sisters
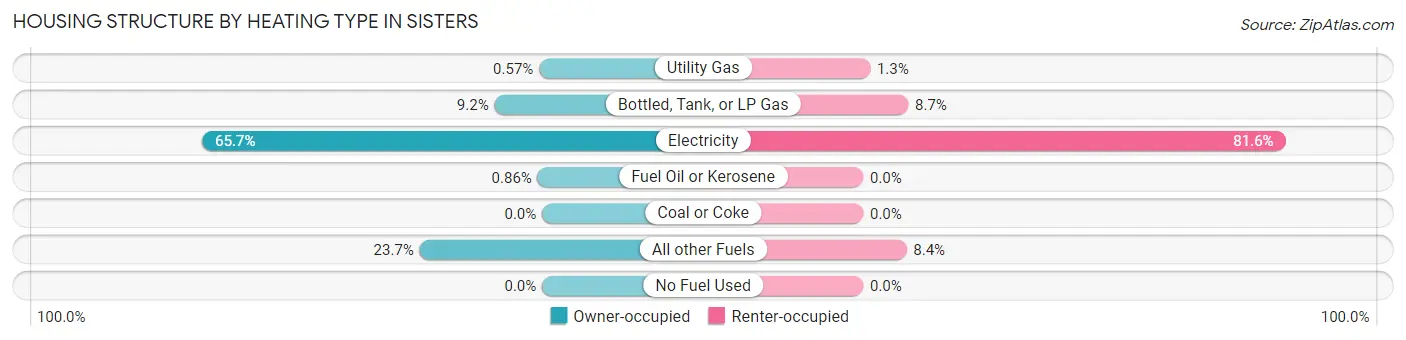
| Heating Type | Owner-occupied | Renter-occupied |
| Utility Gas | 6 (0.6%) | 4 (1.3%) |
| Bottled, Tank, or LP Gas | 96 (9.2%) | 26 (8.7%) |
| Electricity | 686 (65.7%) | 244 (81.6%) |
| Fuel Oil or Kerosene | 9 (0.9%) | 0 (0.0%) |
| Coal or Coke | 0 (0.0%) | 0 (0.0%) |
| All other Fuels | 247 (23.7%) | 25 (8.4%) |
| No Fuel Used | 0 (0.0%) | 0 (0.0%) |
| Total | 1,044 (100.0%) | 299 (100.0%) |
Household Vehicle Usage in Sisters
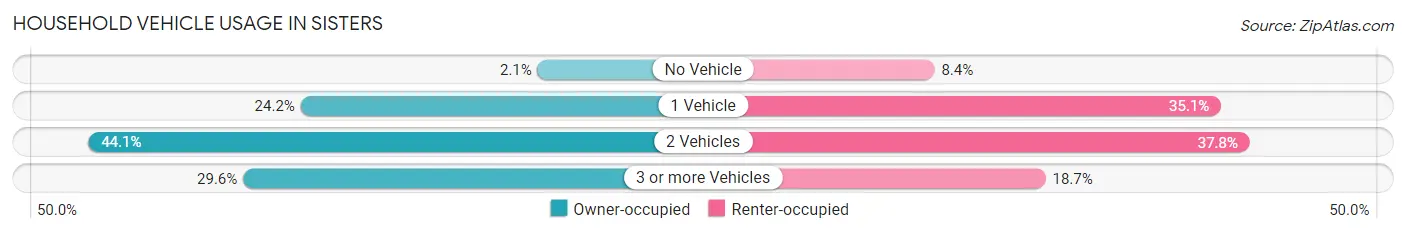
| Vehicles per Household | Owner-occupied | Renter-occupied |
| No Vehicle | 22 (2.1%) | 25 (8.4%) |
| 1 Vehicle | 253 (24.2%) | 105 (35.1%) |
| 2 Vehicles | 460 (44.1%) | 113 (37.8%) |
| 3 or more Vehicles | 309 (29.6%) | 56 (18.7%) |
| Total | 1,044 (100.0%) | 299 (100.0%) |
Real Estate & Mortgages in Sisters
Real Estate and Mortgage Overview in Sisters
| Characteristic | Without Mortgage | With Mortgage |
| Housing Units | 295 | 749 |
| Median Property Value | $455,100 | $569,300 |
| Median Household Income | $102,188 | $156 |
| Monthly Housing Costs | $663 | $64 |
| Real Estate Taxes | $3,672 | $16 |
Property Value by Mortgage Status in Sisters
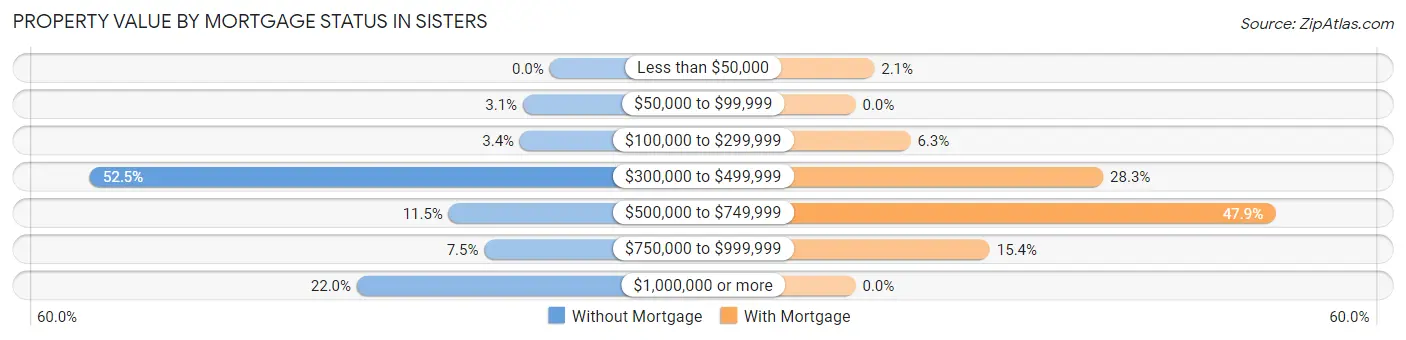
| Property Value | Without Mortgage | With Mortgage |
| Less than $50,000 | 0 (0.0%) | 16 (2.1%) |
| $50,000 to $99,999 | 9 (3.0%) | 0 (0.0%) |
| $100,000 to $299,999 | 10 (3.4%) | 47 (6.3%) |
| $300,000 to $499,999 | 155 (52.5%) | 212 (28.3%) |
| $500,000 to $749,999 | 34 (11.5%) | 359 (47.9%) |
| $750,000 to $999,999 | 22 (7.5%) | 115 (15.3%) |
| $1,000,000 or more | 65 (22.0%) | 0 (0.0%) |
| Total | 295 (100.0%) | 749 (100.0%) |
Household Income by Mortgage Status in Sisters
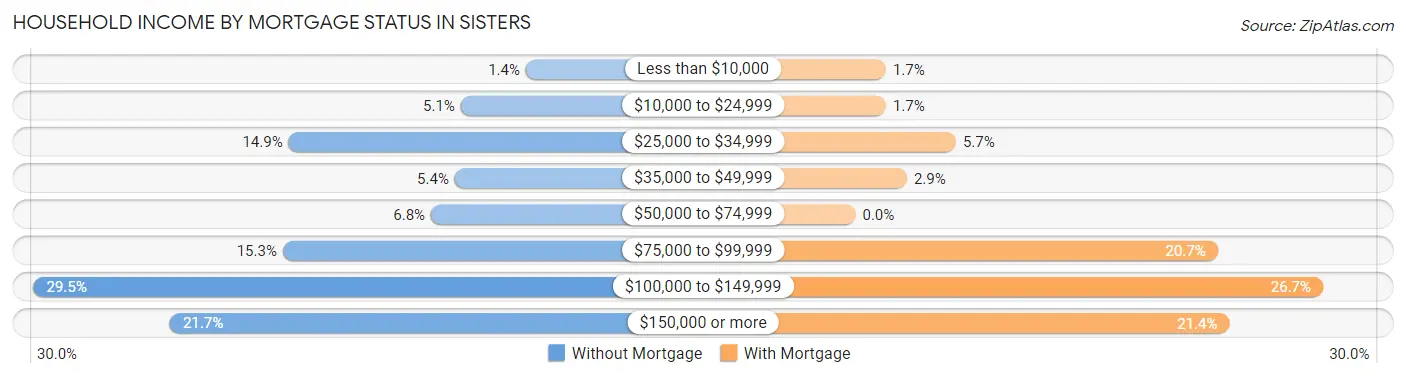
| Household Income | Without Mortgage | With Mortgage |
| Less than $10,000 | 4 (1.4%) | 13 (1.7%) |
| $10,000 to $24,999 | 15 (5.1%) | 13 (1.7%) |
| $25,000 to $34,999 | 44 (14.9%) | 43 (5.7%) |
| $35,000 to $49,999 | 16 (5.4%) | 22 (2.9%) |
| $50,000 to $74,999 | 20 (6.8%) | 0 (0.0%) |
| $75,000 to $99,999 | 45 (15.2%) | 155 (20.7%) |
| $100,000 to $149,999 | 87 (29.5%) | 200 (26.7%) |
| $150,000 or more | 64 (21.7%) | 160 (21.4%) |
| Total | 295 (100.0%) | 749 (100.0%) |
Property Value to Household Income Ratio in Sisters
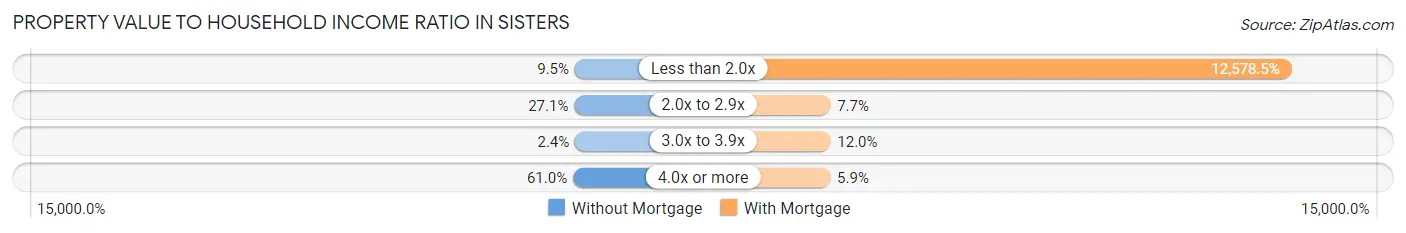
| Value-to-Income Ratio | Without Mortgage | With Mortgage |
| Less than 2.0x | 28 (9.5%) | 94,213 (12,578.5%) |
| 2.0x to 2.9x | 80 (27.1%) | 58 (7.7%) |
| 3.0x to 3.9x | 7 (2.4%) | 90 (12.0%) |
| 4.0x or more | 180 (61.0%) | 44 (5.9%) |
| Total | 295 (100.0%) | 749 (100.0%) |
Real Estate Taxes by Mortgage Status in Sisters

| Property Taxes | Without Mortgage | With Mortgage |
| Less than $800 | 16 (5.4%) | 0 (0.0%) |
| $800 to $1,499 | 6 (2.0%) | 9 (1.2%) |
| $800 to $1,499 | 273 (92.5%) | 7 (0.9%) |
| Total | 295 (100.0%) | 749 (100.0%) |
Health & Disability in Sisters
Health Insurance Coverage by Age in Sisters
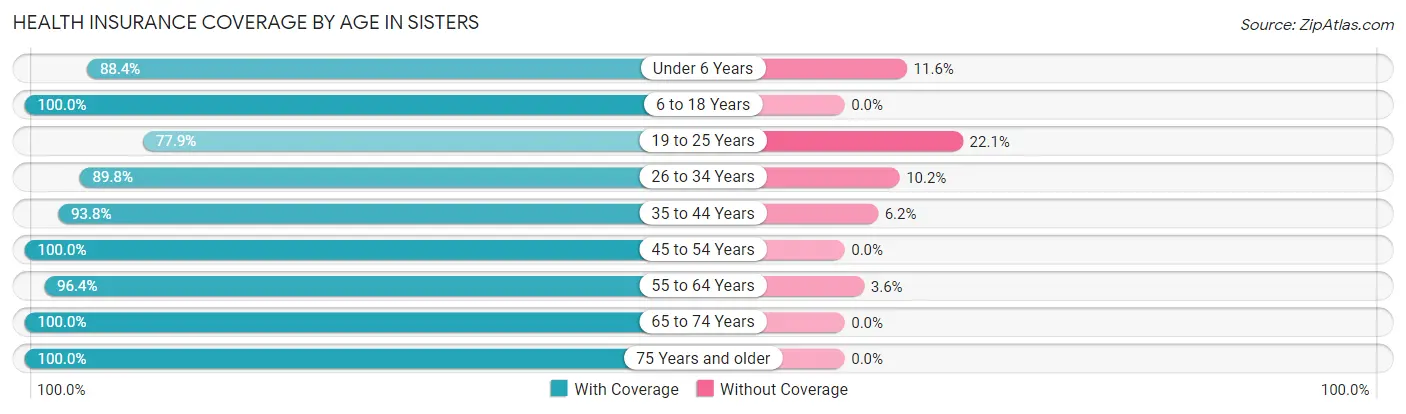
| Age Bracket | With Coverage | Without Coverage |
| Under 6 Years | 152 (88.4%) | 20 (11.6%) |
| 6 to 18 Years | 366 (100.0%) | 0 (0.0%) |
| 19 to 25 Years | 113 (77.9%) | 32 (22.1%) |
| 26 to 34 Years | 184 (89.8%) | 21 (10.2%) |
| 35 to 44 Years | 376 (93.8%) | 25 (6.2%) |
| 45 to 54 Years | 361 (100.0%) | 0 (0.0%) |
| 55 to 64 Years | 212 (96.4%) | 8 (3.6%) |
| 65 to 74 Years | 937 (100.0%) | 0 (0.0%) |
| 75 Years and older | 184 (100.0%) | 0 (0.0%) |
| Total | 2,885 (96.5%) | 106 (3.5%) |
Health Insurance Coverage by Citizenship Status in Sisters
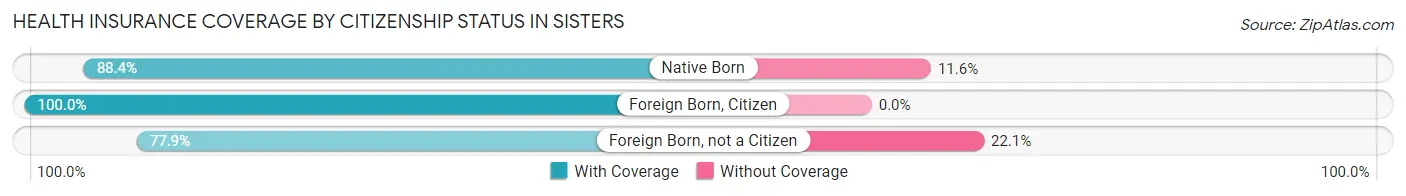
| Citizenship Status | With Coverage | Without Coverage |
| Native Born | 152 (88.4%) | 20 (11.6%) |
| Foreign Born, Citizen | 366 (100.0%) | 0 (0.0%) |
| Foreign Born, not a Citizen | 113 (77.9%) | 32 (22.1%) |
Health Insurance Coverage by Household Income in Sisters
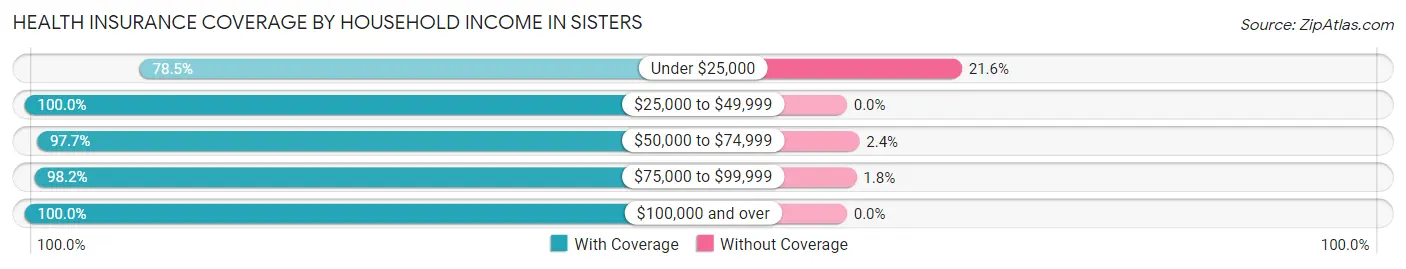
| Household Income | With Coverage | Without Coverage |
| Under $25,000 | 222 (78.4%) | 61 (21.5%) |
| $25,000 to $49,999 | 306 (100.0%) | 0 (0.0%) |
| $50,000 to $74,999 | 583 (97.7%) | 14 (2.4%) |
| $75,000 to $99,999 | 599 (98.2%) | 11 (1.8%) |
| $100,000 and over | 1,164 (100.0%) | 0 (0.0%) |
Public vs Private Health Insurance Coverage by Age in Sisters
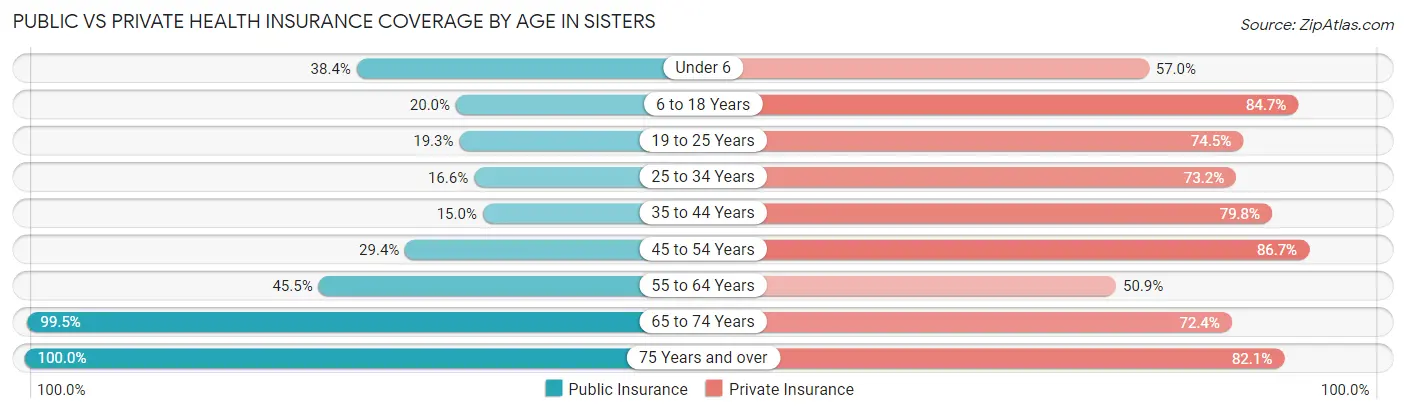
| Age Bracket | Public Insurance | Private Insurance |
| Under 6 | 66 (38.4%) | 98 (57.0%) |
| 6 to 18 Years | 73 (20.0%) | 310 (84.7%) |
| 19 to 25 Years | 28 (19.3%) | 108 (74.5%) |
| 25 to 34 Years | 34 (16.6%) | 150 (73.2%) |
| 35 to 44 Years | 60 (15.0%) | 320 (79.8%) |
| 45 to 54 Years | 106 (29.4%) | 313 (86.7%) |
| 55 to 64 Years | 100 (45.5%) | 112 (50.9%) |
| 65 to 74 Years | 932 (99.5%) | 678 (72.4%) |
| 75 Years and over | 184 (100.0%) | 151 (82.1%) |
| Total | 1,583 (52.9%) | 2,240 (74.9%) |
Disability Status by Sex by Age in Sisters
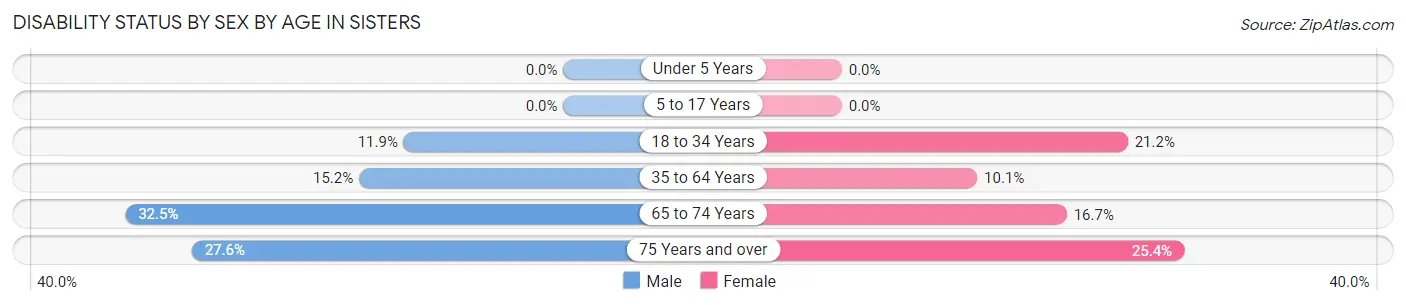
| Age Bracket | Male | Female |
| Under 5 Years | 0 (0.0%) | 0 (0.0%) |
| 5 to 17 Years | 0 (0.0%) | 0 (0.0%) |
| 18 to 34 Years | 25 (11.8%) | 31 (21.2%) |
| 35 to 64 Years | 66 (15.2%) | 55 (10.1%) |
| 65 to 74 Years | 149 (32.5%) | 80 (16.7%) |
| 75 Years and over | 16 (27.6%) | 32 (25.4%) |
Disability Class by Sex by Age in Sisters
Disability Class: Hearing Difficulty
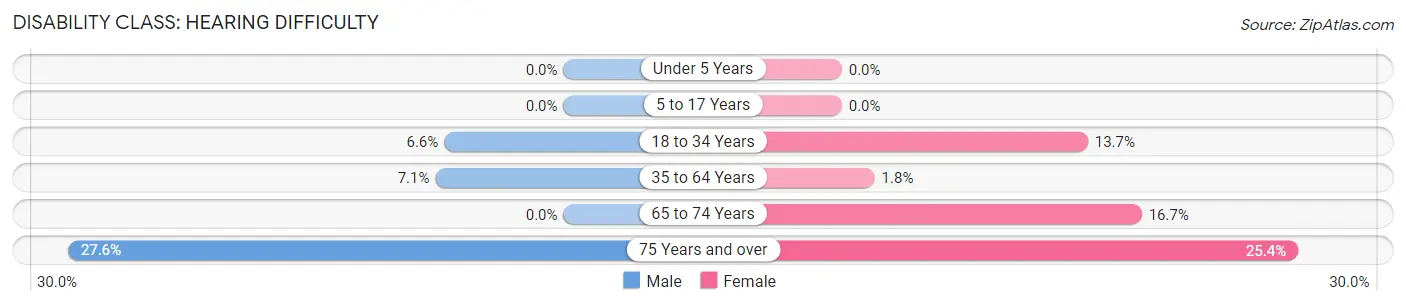
| Age Bracket | Male | Female |
| Under 5 Years | 0 (0.0%) | 0 (0.0%) |
| 5 to 17 Years | 0 (0.0%) | 0 (0.0%) |
| 18 to 34 Years | 14 (6.6%) | 20 (13.7%) |
| 35 to 64 Years | 31 (7.1%) | 10 (1.8%) |
| 65 to 74 Years | 0 (0.0%) | 80 (16.7%) |
| 75 Years and over | 16 (27.6%) | 32 (25.4%) |
Disability Class: Vision Difficulty
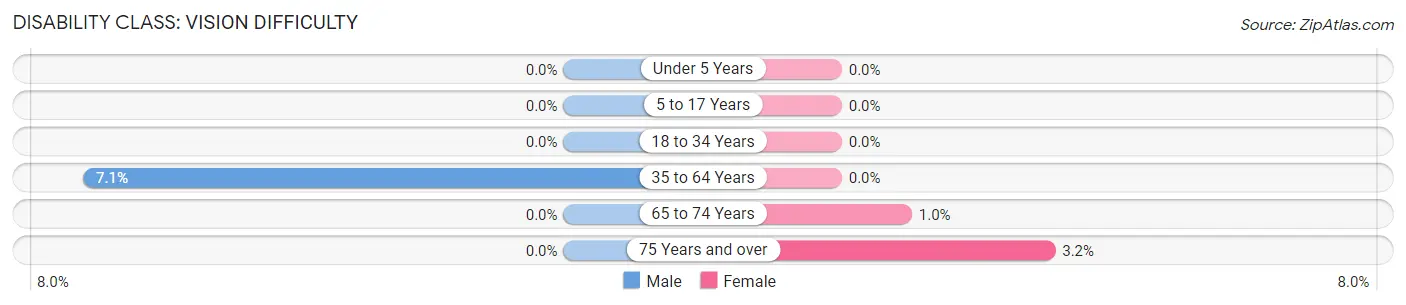
| Age Bracket | Male | Female |
| Under 5 Years | 0 (0.0%) | 0 (0.0%) |
| 5 to 17 Years | 0 (0.0%) | 0 (0.0%) |
| 18 to 34 Years | 0 (0.0%) | 0 (0.0%) |
| 35 to 64 Years | 31 (7.1%) | 0 (0.0%) |
| 65 to 74 Years | 0 (0.0%) | 5 (1.0%) |
| 75 Years and over | 0 (0.0%) | 4 (3.2%) |
Disability Class: Cognitive Difficulty
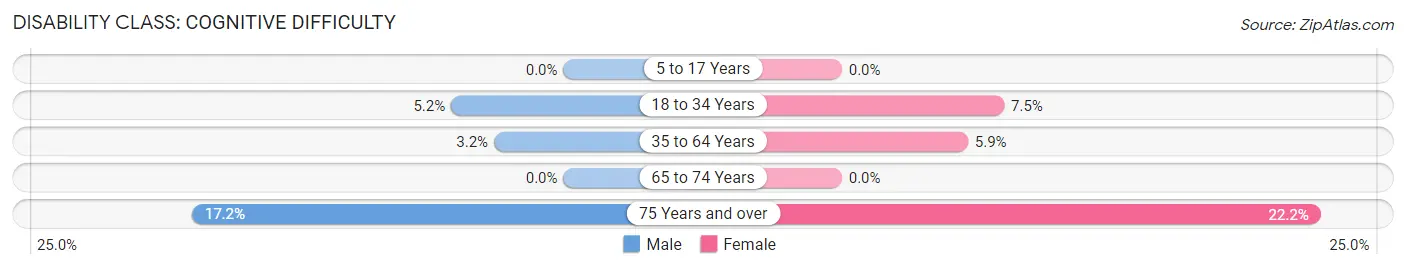
| Age Bracket | Male | Female |
| 5 to 17 Years | 0 (0.0%) | 0 (0.0%) |
| 18 to 34 Years | 11 (5.2%) | 11 (7.5%) |
| 35 to 64 Years | 14 (3.2%) | 32 (5.9%) |
| 65 to 74 Years | 0 (0.0%) | 0 (0.0%) |
| 75 Years and over | 10 (17.2%) | 28 (22.2%) |
Disability Class: Ambulatory Difficulty
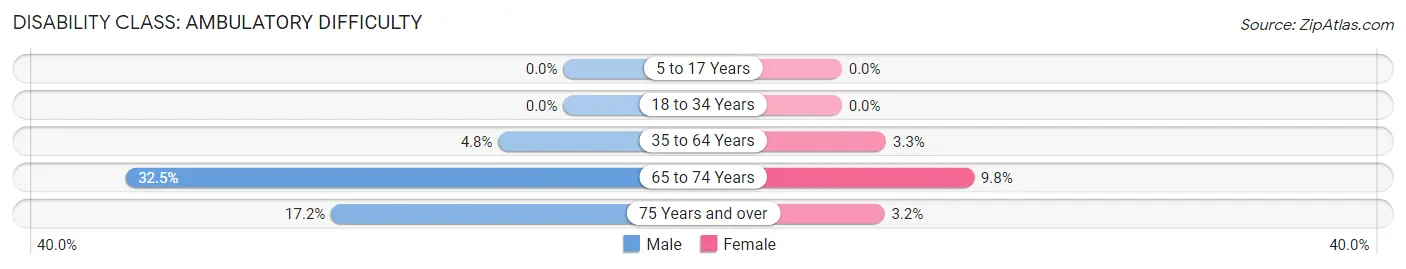
| Age Bracket | Male | Female |
| 5 to 17 Years | 0 (0.0%) | 0 (0.0%) |
| 18 to 34 Years | 0 (0.0%) | 0 (0.0%) |
| 35 to 64 Years | 21 (4.8%) | 18 (3.3%) |
| 65 to 74 Years | 149 (32.5%) | 47 (9.8%) |
| 75 Years and over | 10 (17.2%) | 4 (3.2%) |
Disability Class: Self-Care Difficulty

| Age Bracket | Male | Female |
| 5 to 17 Years | 0 (0.0%) | 0 (0.0%) |
| 18 to 34 Years | 0 (0.0%) | 11 (7.5%) |
| 35 to 64 Years | 14 (3.2%) | 5 (0.9%) |
| 65 to 74 Years | 0 (0.0%) | 47 (9.8%) |
| 75 Years and over | 0 (0.0%) | 0 (0.0%) |
Technology Access in Sisters
Computing Device Access in Sisters
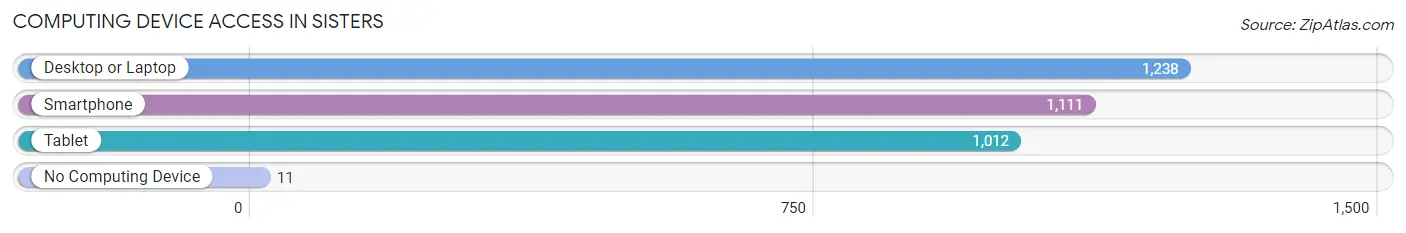
| Device Type | # Households | % Households |
| Desktop or Laptop | 1,238 | 92.2% |
| Smartphone | 1,111 | 82.7% |
| Tablet | 1,012 | 75.3% |
| No Computing Device | 11 | 0.8% |
| Total | 1,343 | 100.0% |
Internet Access in Sisters
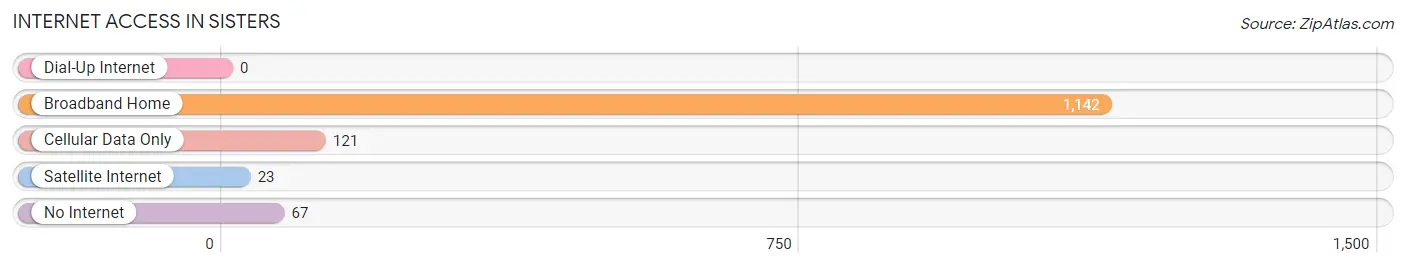
| Internet Type | # Households | % Households |
| Dial-Up Internet | 0 | 0.0% |
| Broadband Home | 1,142 | 85.0% |
| Cellular Data Only | 121 | 9.0% |
| Satellite Internet | 23 | 1.7% |
| No Internet | 67 | 5.0% |
| Total | 1,343 | 100.0% |
Sisters Summary
Sisters is a small city located in the high desert of Central Oregon, in the foothills of the Cascade Mountains. It is situated in Deschutes County, about 20 miles west of Bend and about 100 miles southeast of Portland. The city is known for its stunning views of the Three Sisters Mountains, which are visible from most parts of the city.
History
Sisters was founded in 1874 by two brothers, Peter and William Sisters, who were looking for a place to settle and start a ranch. The brothers purchased a large tract of land from the U.S. government and began to build their ranch. The ranch was successful and the brothers soon began to attract other settlers to the area. By the early 1900s, the town had grown to include a post office, a school, a hotel, and several stores.
In the 1920s, the town began to attract tourists, who were drawn to the area by its stunning views of the Three Sisters Mountains. The town was incorporated in 1927 and the population continued to grow throughout the 20th century.
Geography
Sisters is located in the high desert of Central Oregon, in the foothills of the Cascade Mountains. The city is situated at an elevation of 3,200 feet and is surrounded by the Deschutes National Forest. The city is located about 20 miles west of Bend and about 100 miles southeast of Portland.
The city is known for its stunning views of the Three Sisters Mountains, which are visible from most parts of the city. The city is also home to several lakes, including Suttle Lake, Davis Lake, and Hosmer Lake.
Economy
Sisters is a small city with a population of about 2,000 people. The city’s economy is largely based on tourism, as the city is a popular destination for outdoor recreation. The city is also home to several businesses, including restaurants, retail stores, and art galleries.
The city is also home to several large employers, including the Sisters School District, the Sisters-Camp Sherman Fire District, and the Sisters Ranger District of the Deschutes National Forest.
Demographics
As of the 2010 census, the population of Sisters was 2,038. The racial makeup of the city was 94.3% White, 0.7% African American, 0.7% Native American, 0.7% Asian, 0.2% Pacific Islander, 1.2% from other races, and 2.1% from two or more races. Hispanic or Latino of any race were 4.2% of the population.
The median household income in Sisters was $45,938, and the median family income was $50,938. The per capita income for the city was $25,938. About 11.2% of families and 14.2% of the population were below the poverty line, including 18.2% of those under age 18 and 8.2% of those age 65 or over.
Common Questions
What is Per Capita Income in Sisters?
Per Capita income in Sisters is $48,669.
What is the Median Family Income in Sisters?
Median Family Income in Sisters is $98,726.
What is the Median Household income in Sisters?
Median Household Income in Sisters is $84,088.
What is Income or Wage Gap in Sisters?
Income or Wage Gap in Sisters is 25.0%.
Women in Sisters earn 75.0 cents for every dollar earned by a man.
What is Family Income Deficit in Sisters?
Family Income Deficit in Sisters is $5,735.
Families that are below poverty line in Sisters earn $5,735 less on average than the poverty threshold level.
What is Inequality or Gini Index in Sisters?
Inequality or Gini Index in Sisters is 0.46.
What is the Total Population of Sisters?
Total Population of Sisters is 2,992.
What is the Total Male Population of Sisters?
Total Male Population of Sisters is 1,342.
What is the Total Female Population of Sisters?
Total Female Population of Sisters is 1,650.
What is the Ratio of Males per 100 Females in Sisters?
There are 81.33 Males per 100 Females in Sisters.
What is the Ratio of Females per 100 Males in Sisters?
There are 122.95 Females per 100 Males in Sisters.
What is the Median Population Age in Sisters?
Median Population Age in Sisters is 49.4 Years.
What is the Average Family Size in Sisters
Average Family Size in Sisters is 2.6 People.
What is the Average Household Size in Sisters
Average Household Size in Sisters is 2.2 People.
How Large is the Labor Force in Sisters?
There are 1,323 People in the Labor Forcein in Sisters.
What is the Percentage of People in the Labor Force in Sisters?
51.5% of People are in the Labor Force in Sisters.
What is the Unemployment Rate in Sisters?
Unemployment Rate in Sisters is 4.0%.