Lowell, OR Map & Demographics
Lowell Map
Lowell Overview
$39,498
PER CAPITA INCOME
$78,750
AVG FAMILY INCOME
$64,135
AVG HOUSEHOLD INCOME
26.3%
WAGE / INCOME GAP [ % ]
73.7¢/ $1
WAGE / INCOME GAP [ $ ]
0.51
INEQUALITY / GINI INDEX
1,211
TOTAL POPULATION
661
MALE POPULATION
550
FEMALE POPULATION
120.18
MALES / 100 FEMALES
83.21
FEMALES / 100 MALES
48.8
MEDIAN AGE
2.8
AVG FAMILY SIZE
2.5
AVG HOUSEHOLD SIZE
527
LABOR FORCE [ PEOPLE ]
53.6%
PERCENT IN LABOR FORCE
2.1%
UNEMPLOYMENT RATE
Lowell Zip Codes
Lowell Area Codes
Income in Lowell
Income Overview in Lowell
Per Capita Income in Lowell is $39,498, while median incomes of families and households are $78,750 and $64,135 respectively.
| Characteristic | Number | Measure |
| Per Capita Income | 1,211 | $39,498 |
| Median Family Income | 343 | $78,750 |
| Mean Family Income | 343 | $96,760 |
| Median Household Income | 495 | $64,135 |
| Mean Household Income | 495 | $96,314 |
| Income Deficit | 343 | $0 |
| Wage / Income Gap (%) | 1,211 | 26.32% |
| Wage / Income Gap ($) | 1,211 | 73.68¢ per $1 |
| Gini / Inequality Index | 1,211 | 0.51 |
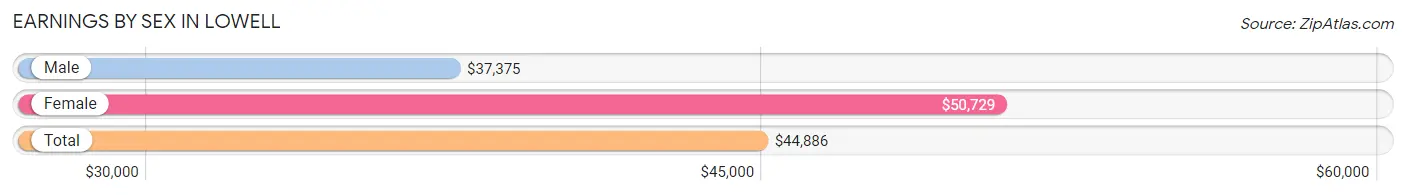
Earnings by Sex in Lowell
Average Earnings in Lowell are $44,886, $37,375 for men and $50,729 for women, a difference of 26.3%.
| Sex | Number | Average Earnings |
| Male | 331 (59.5%) | $37,375 |
| Female | 225 (40.5%) | $50,729 |
| Total | 556 (100.0%) | $44,886 |
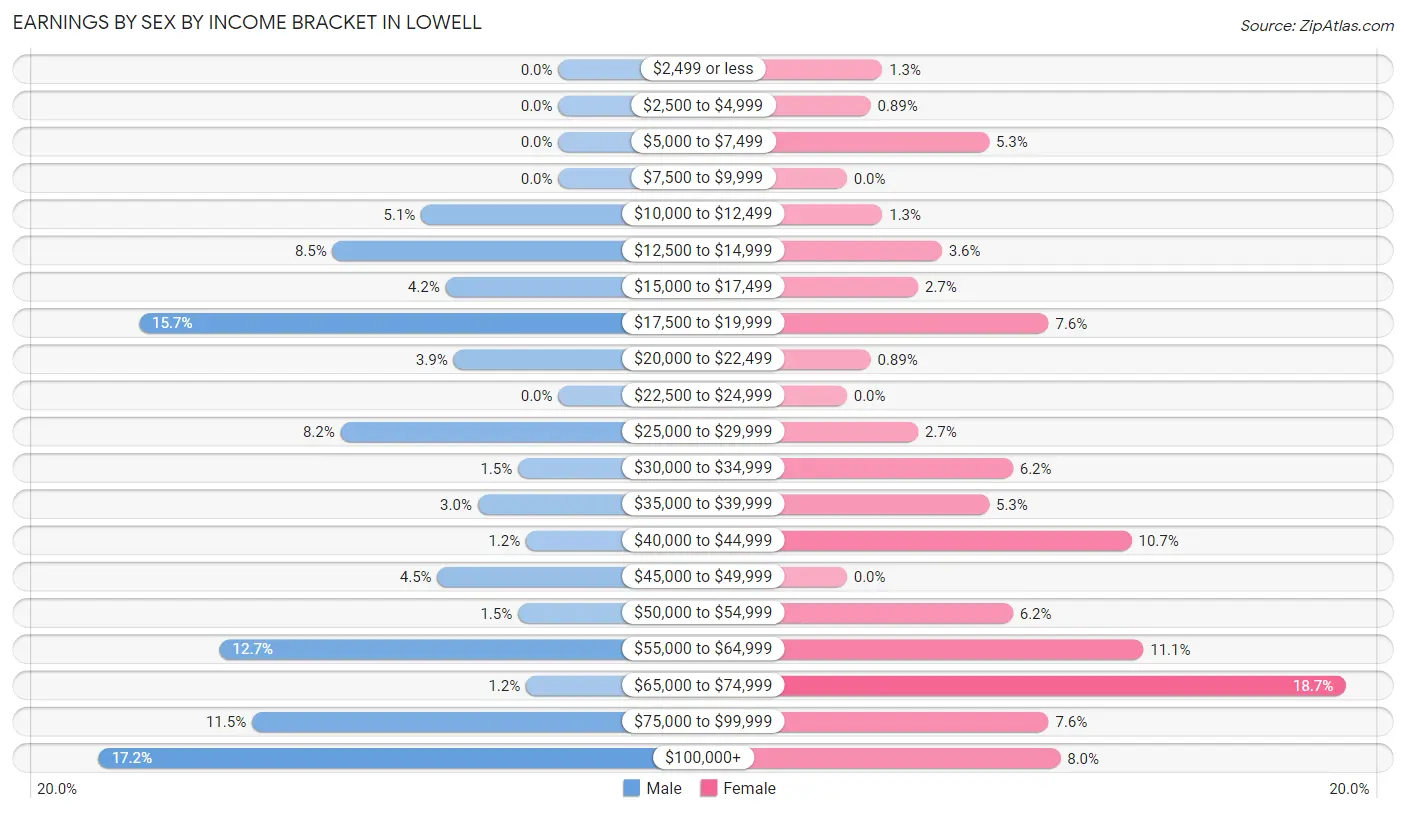
Earnings by Sex by Income Bracket in Lowell
The most common earnings brackets in Lowell are $100,000+ for men (57 | 17.2%) and $65,000 to $74,999 for women (42 | 18.7%).
| Income | Male | Female |
| $2,499 or less | 0 (0.0%) | 3 (1.3%) |
| $2,500 to $4,999 | 0 (0.0%) | 2 (0.9%) |
| $5,000 to $7,499 | 0 (0.0%) | 12 (5.3%) |
| $7,500 to $9,999 | 0 (0.0%) | 0 (0.0%) |
| $10,000 to $12,499 | 17 (5.1%) | 3 (1.3%) |
| $12,500 to $14,999 | 28 (8.5%) | 8 (3.6%) |
| $15,000 to $17,499 | 14 (4.2%) | 6 (2.7%) |
| $17,500 to $19,999 | 52 (15.7%) | 17 (7.6%) |
| $20,000 to $22,499 | 13 (3.9%) | 2 (0.9%) |
| $22,500 to $24,999 | 0 (0.0%) | 0 (0.0%) |
| $25,000 to $29,999 | 27 (8.2%) | 6 (2.7%) |
| $30,000 to $34,999 | 5 (1.5%) | 14 (6.2%) |
| $35,000 to $39,999 | 10 (3.0%) | 12 (5.3%) |
| $40,000 to $44,999 | 4 (1.2%) | 24 (10.7%) |
| $45,000 to $49,999 | 15 (4.5%) | 0 (0.0%) |
| $50,000 to $54,999 | 5 (1.5%) | 14 (6.2%) |
| $55,000 to $64,999 | 42 (12.7%) | 25 (11.1%) |
| $65,000 to $74,999 | 4 (1.2%) | 42 (18.7%) |
| $75,000 to $99,999 | 38 (11.5%) | 17 (7.6%) |
| $100,000+ | 57 (17.2%) | 18 (8.0%) |
| Total | 331 (100.0%) | 225 (100.0%) |
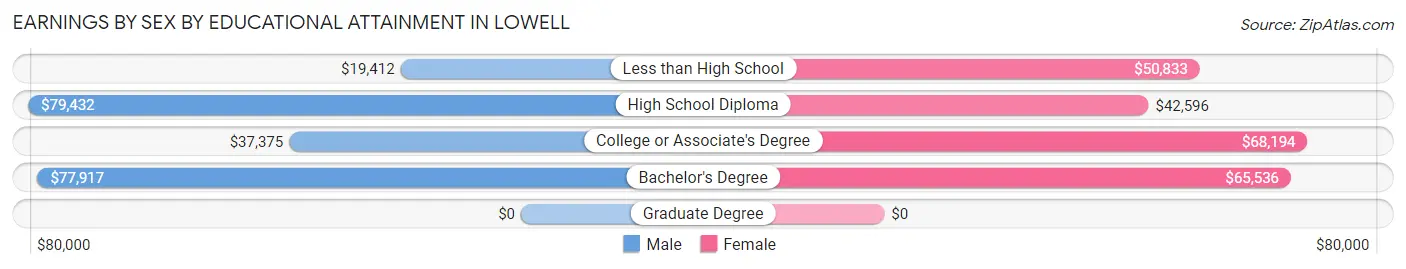
Earnings by Sex by Educational Attainment in Lowell
Average earnings in Lowell are $61,250 for men and $51,979 for women, a difference of 15.1%. Men with an educational attainment of high school diploma enjoy the highest average annual earnings of $79,432, while those with less than high school education earn the least with $19,412. Women with an educational attainment of college or associate's degree earn the most with the average annual earnings of $68,194, while those with high school diploma education have the smallest earnings of $42,596.
| Educational Attainment | Male Income | Female Income |
| Less than High School | $19,412 | $50,833 |
| High School Diploma | $79,432 | $42,596 |
| College or Associate's Degree | $37,375 | $68,194 |
| Bachelor's Degree | $77,917 | $65,536 |
| Graduate Degree | - | - |
| Total | $61,250 | $51,979 |
Family Income in Lowell
Family Income Brackets in Lowell
According to the Lowell family income data, there are 90 families falling into the $75,000 to $99,999 income range, which is the most common income bracket and makes up 26.2% of all families.
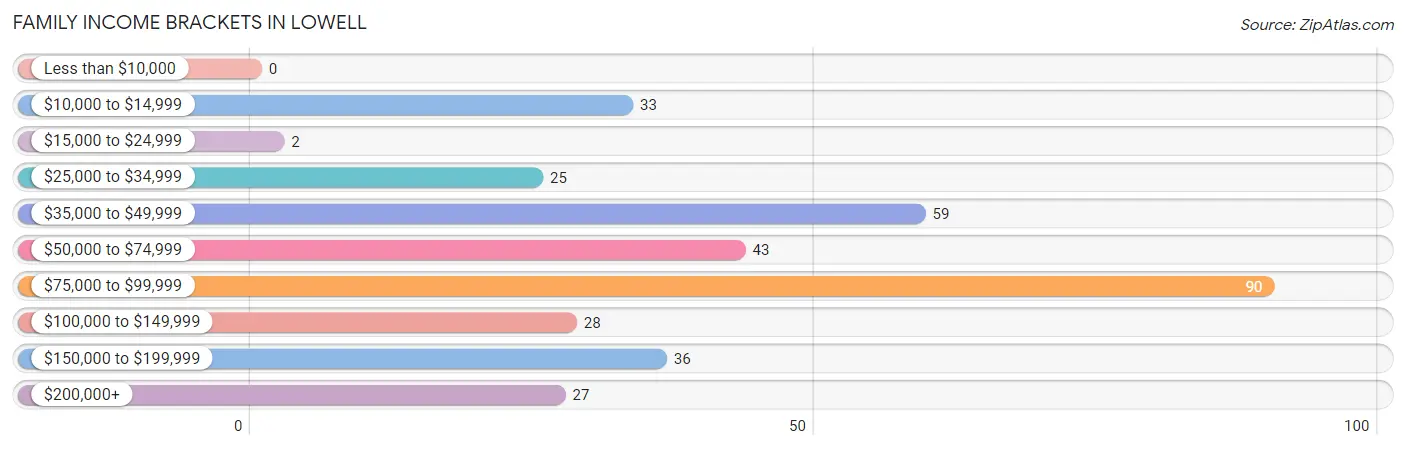
| Income Bracket | # Families | % Families |
| Less than $10,000 | 0 | 0.0% |
| $10,000 to $14,999 | 33 | 9.6% |
| $15,000 to $24,999 | 2 | 0.6% |
| $25,000 to $34,999 | 25 | 7.3% |
| $35,000 to $49,999 | 59 | 17.2% |
| $50,000 to $74,999 | 43 | 12.5% |
| $75,000 to $99,999 | 90 | 26.2% |
| $100,000 to $149,999 | 28 | 8.2% |
| $150,000 to $199,999 | 36 | 10.5% |
| $200,000+ | 27 | 7.9% |
Family Income by Famaliy Size in Lowell
4-person families (71 | 20.7%) account for the highest median family income in Lowell with $91,635 per family, while 2-person families (212 | 61.8%) have the highest median income of $35,625 per family member.
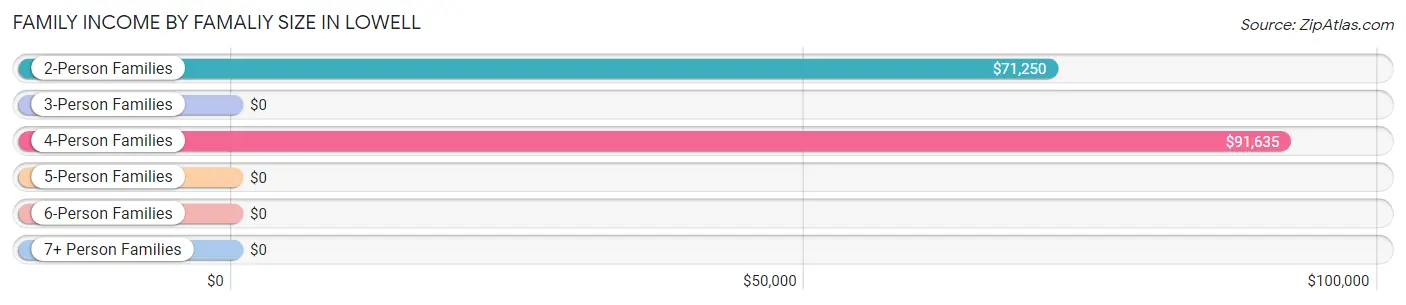
| Income Bracket | # Families | Median Income |
| 2-Person Families | 212 (61.8%) | $71,250 |
| 3-Person Families | 38 (11.1%) | $0 |
| 4-Person Families | 71 (20.7%) | $91,635 |
| 5-Person Families | 14 (4.1%) | $0 |
| 6-Person Families | 4 (1.2%) | $0 |
| 7+ Person Families | 4 (1.2%) | $0 |
| Total | 343 (100.0%) | $78,750 |
Family Income by Number of Earners in Lowell
The median family income in Lowell is $78,750, with families comprising 3+ earners (39) having the highest median family income of $169,205, while families with no earners (134) have the lowest median family income of $41,250, accounting for 11.4% and 39.1% of families, respectively.
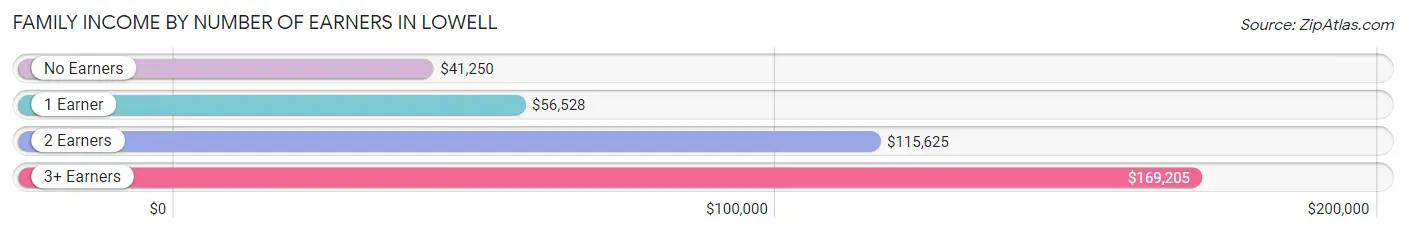
| Number of Earners | # Families | Median Income |
| No Earners | 134 (39.1%) | $41,250 |
| 1 Earner | 83 (24.2%) | $56,528 |
| 2 Earners | 87 (25.4%) | $115,625 |
| 3+ Earners | 39 (11.4%) | $169,205 |
| Total | 343 (100.0%) | $78,750 |
Household Income in Lowell
Household Income Brackets in Lowell
With 75 households falling in the category, the $100,000 to $149,999 income range is the most frequent in Lowell, accounting for 15.1% of all households. In contrast, only 4 households (0.8%) fall into the less than $10,000 income bracket, making it the least populous group.
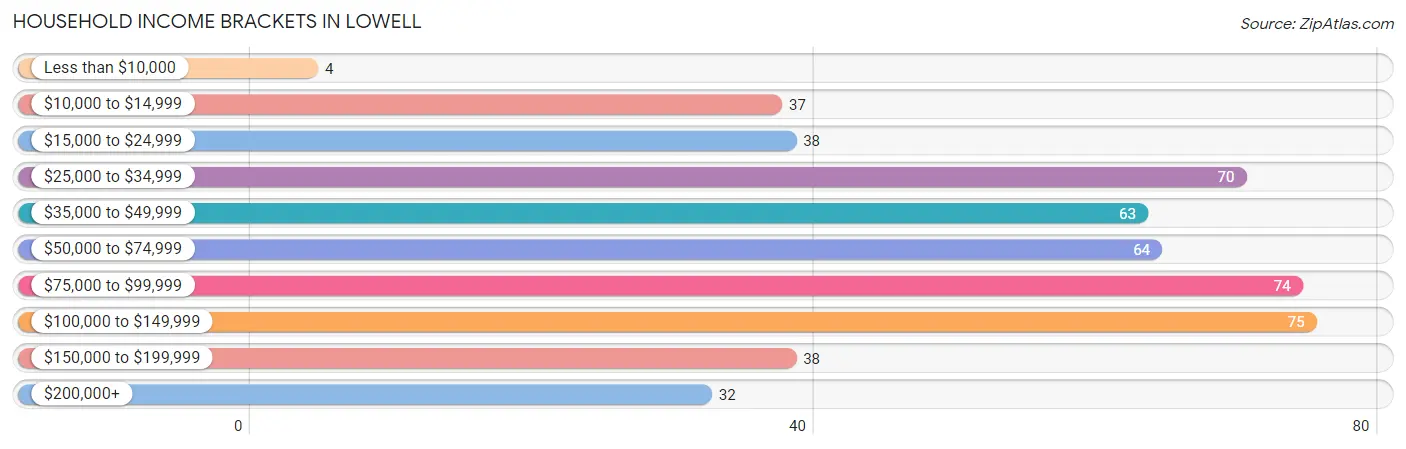
| Income Bracket | # Households | % Households |
| Less than $10,000 | 4 | 0.8% |
| $10,000 to $14,999 | 37 | 7.5% |
| $15,000 to $24,999 | 38 | 7.7% |
| $25,000 to $34,999 | 70 | 14.1% |
| $35,000 to $49,999 | 63 | 12.7% |
| $50,000 to $74,999 | 64 | 12.9% |
| $75,000 to $99,999 | 74 | 14.9% |
| $100,000 to $149,999 | 75 | 15.2% |
| $150,000 to $199,999 | 38 | 7.7% |
| $200,000+ | 32 | 6.5% |
Household Income by Householder Age in Lowell
The median household income in Lowell is $64,135, with the highest median household income of $81,250 found in the 45 to 64 years age bracket for the primary householder. A total of 214 households (43.2%) fall into this category. Meanwhile, the 15 to 24 years age bracket for the primary householder has the lowest median household income of $0, with 12 households (2.4%) in this group.
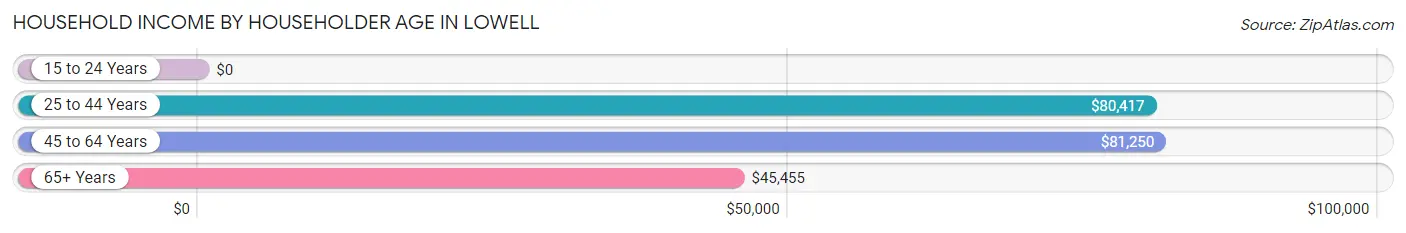
| Income Bracket | # Households | Median Income |
| 15 to 24 Years | 12 (2.4%) | $0 |
| 25 to 44 Years | 105 (21.2%) | $80,417 |
| 45 to 64 Years | 214 (43.2%) | $81,250 |
| 65+ Years | 164 (33.1%) | $45,455 |
| Total | 495 (100.0%) | $64,135 |
Poverty in Lowell
Income Below Poverty by Sex and Age in Lowell
With 11.2% poverty level for males and 11.3% for females among the residents of Lowell, 6 to 11 year old males and 18 to 24 year old females are the most vulnerable to poverty, with 11 males (45.8%) and 12 females (80.0%) in their respective age groups living below the poverty level.
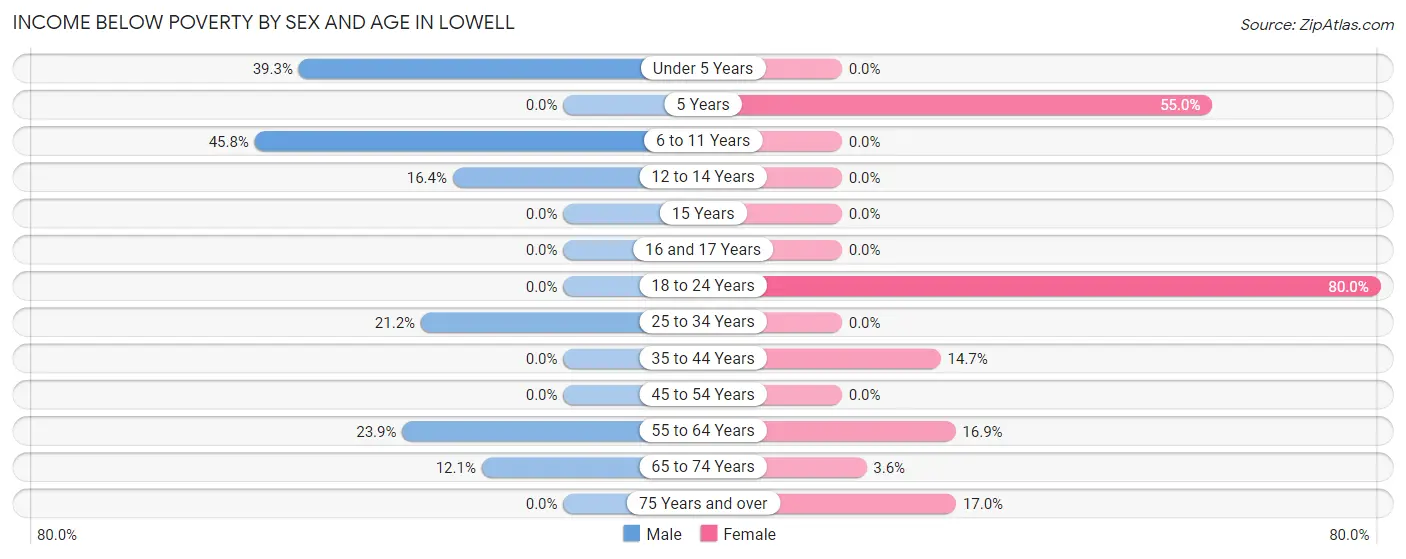
| Age Bracket | Male | Female |
| Under 5 Years | 11 (39.3%) | 0 (0.0%) |
| 5 Years | 0 (0.0%) | 11 (55.0%) |
| 6 to 11 Years | 11 (45.8%) | 0 (0.0%) |
| 12 to 14 Years | 11 (16.4%) | 0 (0.0%) |
| 15 Years | 0 (0.0%) | 0 (0.0%) |
| 16 and 17 Years | 0 (0.0%) | 0 (0.0%) |
| 18 to 24 Years | 0 (0.0%) | 12 (80.0%) |
| 25 to 34 Years | 11 (21.1%) | 0 (0.0%) |
| 35 to 44 Years | 0 (0.0%) | 11 (14.7%) |
| 45 to 54 Years | 0 (0.0%) | 0 (0.0%) |
| 55 to 64 Years | 22 (23.9%) | 14 (16.9%) |
| 65 to 74 Years | 8 (12.1%) | 4 (3.6%) |
| 75 Years and over | 0 (0.0%) | 10 (17.0%) |
| Total | 74 (11.2%) | 62 (11.3%) |
Income Above Poverty by Sex and Age in Lowell
According to the poverty statistics in Lowell, males aged 5 years and females aged under 5 years are the age groups that are most secure financially, with 100.0% of males and 100.0% of females in these age groups living above the poverty line.
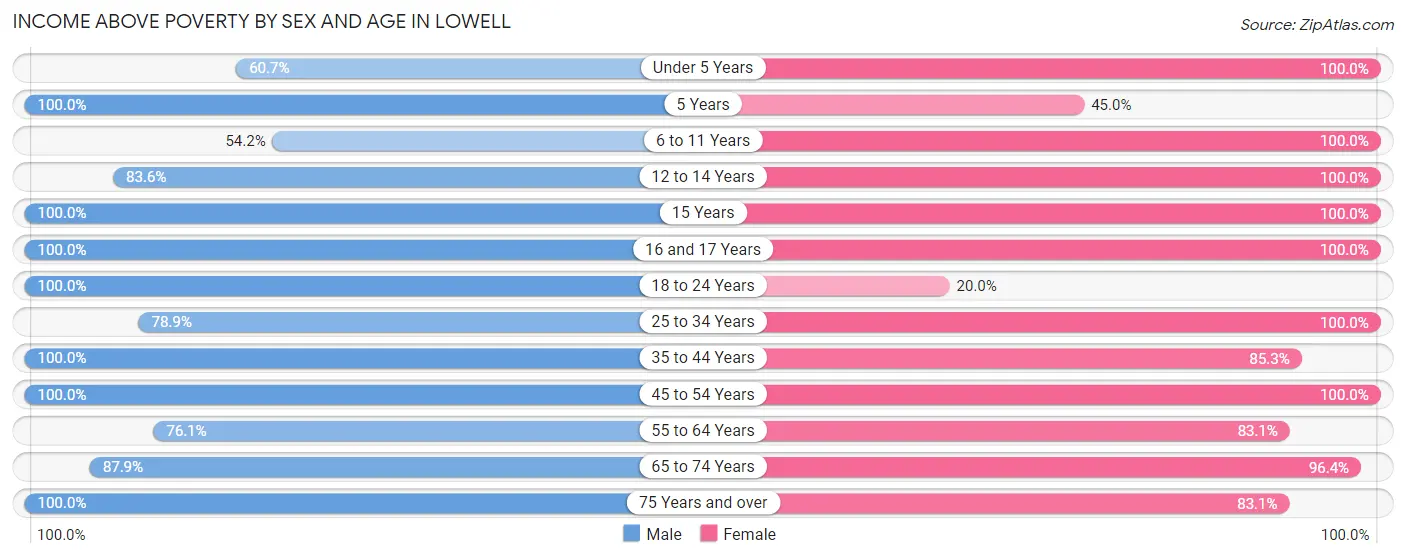
| Age Bracket | Male | Female |
| Under 5 Years | 17 (60.7%) | 10 (100.0%) |
| 5 Years | 7 (100.0%) | 9 (45.0%) |
| 6 to 11 Years | 13 (54.2%) | 49 (100.0%) |
| 12 to 14 Years | 56 (83.6%) | 5 (100.0%) |
| 15 Years | 15 (100.0%) | 2 (100.0%) |
| 16 and 17 Years | 2 (100.0%) | 14 (100.0%) |
| 18 to 24 Years | 57 (100.0%) | 3 (20.0%) |
| 25 to 34 Years | 41 (78.8%) | 47 (100.0%) |
| 35 to 44 Years | 64 (100.0%) | 64 (85.3%) |
| 45 to 54 Years | 137 (100.0%) | 61 (100.0%) |
| 55 to 64 Years | 70 (76.1%) | 69 (83.1%) |
| 65 to 74 Years | 58 (87.9%) | 106 (96.4%) |
| 75 Years and over | 50 (100.0%) | 49 (83.1%) |
| Total | 587 (88.8%) | 488 (88.7%) |
Income Below Poverty Among Married-Couple Families in Lowell
The poverty statistics for married-couple families in Lowell show that 4.0% or 11 of the total 275 families live below the poverty line. Families with no children have the highest poverty rate of 5.2%, comprising of 11 families. On the other hand, families with 1 or 2 children have the lowest poverty rate of 0.0%, which includes 0 families.
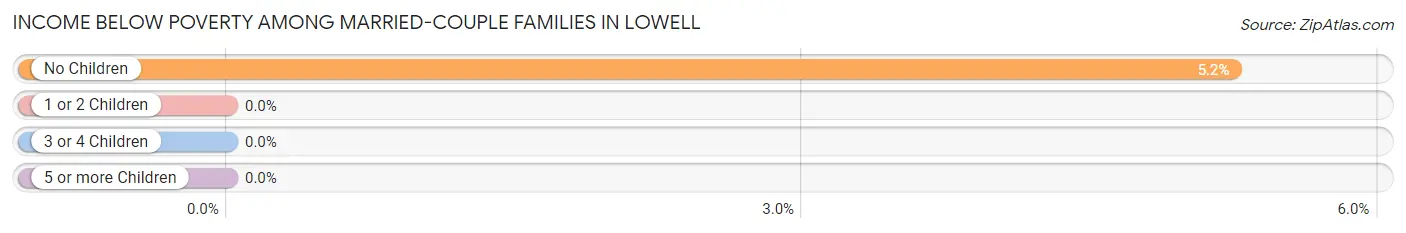
| Children | Above Poverty | Below Poverty |
| No Children | 199 (94.8%) | 11 (5.2%) |
| 1 or 2 Children | 59 (100.0%) | 0 (0.0%) |
| 3 or 4 Children | 4 (100.0%) | 0 (0.0%) |
| 5 or more Children | 2 (100.0%) | 0 (0.0%) |
| Total | 264 (96.0%) | 11 (4.0%) |
Income Below Poverty Among Single-Parent Households in Lowell
According to the poverty data in Lowell, 34.4% or 11 single-father households and 30.6% or 11 single-mother households are living below the poverty line. Among single-father households, those with 1 or 2 children have the highest poverty rate, with 11 households (50.0%) experiencing poverty. Likewise, among single-mother households, those with 1 or 2 children have the highest poverty rate, with 11 households (61.1%) falling below the poverty line.
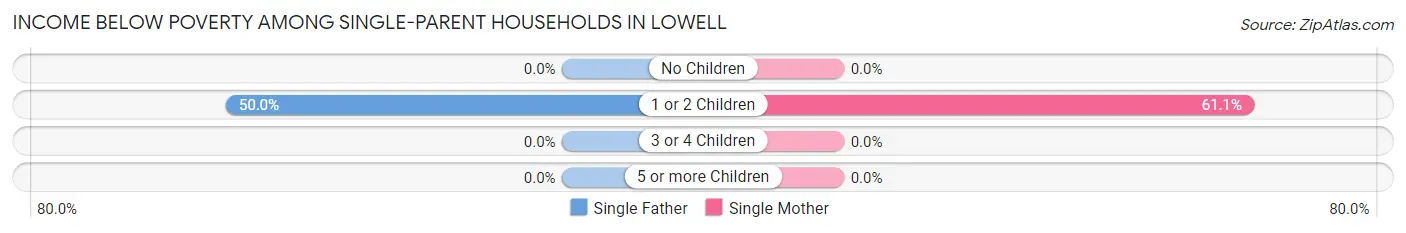
| Children | Single Father | Single Mother |
| No Children | 0 (0.0%) | 0 (0.0%) |
| 1 or 2 Children | 11 (50.0%) | 11 (61.1%) |
| 3 or 4 Children | 0 (0.0%) | 0 (0.0%) |
| 5 or more Children | 0 (0.0%) | 0 (0.0%) |
| Total | 11 (34.4%) | 11 (30.6%) |
Income Below Poverty Among Married-Couple vs Single-Parent Households in Lowell
The poverty data for Lowell shows that 11 of the married-couple family households (4.0%) and 22 of the single-parent households (32.4%) are living below the poverty level. Within the married-couple family households, those with no children have the highest poverty rate, with 11 households (5.2%) falling below the poverty line. Among the single-parent households, those with 1 or 2 children have the highest poverty rate, with 22 household (55.0%) living below poverty.
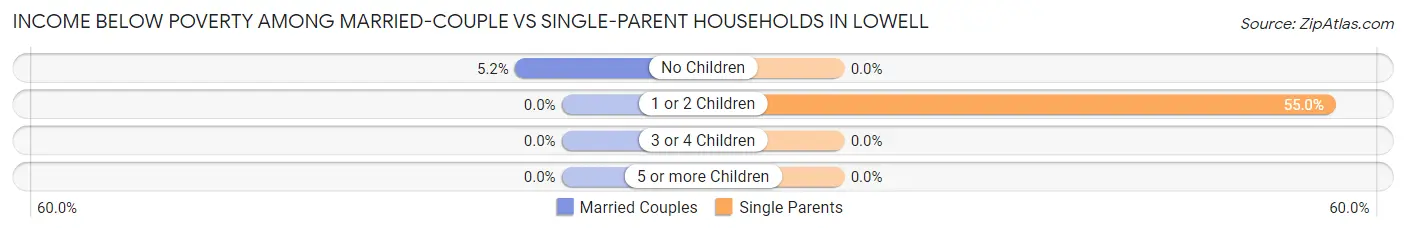
| Children | Married-Couple Families | Single-Parent Households |
| No Children | 11 (5.2%) | 0 (0.0%) |
| 1 or 2 Children | 0 (0.0%) | 22 (55.0%) |
| 3 or 4 Children | 0 (0.0%) | 0 (0.0%) |
| 5 or more Children | 0 (0.0%) | 0 (0.0%) |
| Total | 11 (4.0%) | 22 (32.4%) |
Race in Lowell
The most populous races in Lowell are White / Caucasian (1,134 | 93.6%), Two or more Races (41 | 3.4%), and Hispanic or Latino (24 | 2.0%).
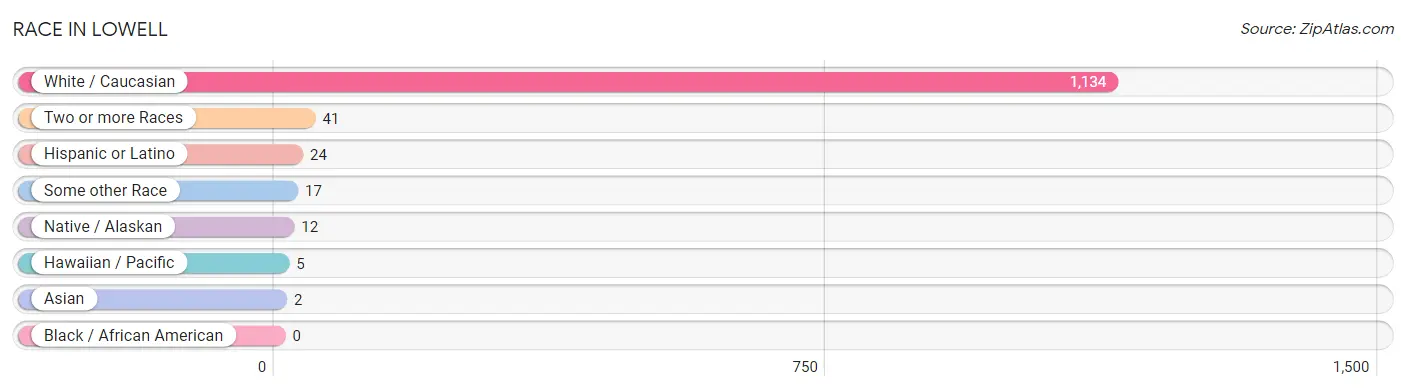
| Race | # Population | % Population |
| Asian | 2 | 0.2% |
| Black / African American | 0 | 0.0% |
| Hawaiian / Pacific | 5 | 0.4% |
| Hispanic or Latino | 24 | 2.0% |
| Native / Alaskan | 12 | 1.0% |
| White / Caucasian | 1,134 | 93.6% |
| Two or more Races | 41 | 3.4% |
| Some other Race | 17 | 1.4% |
| Total | 1,211 | 100.0% |
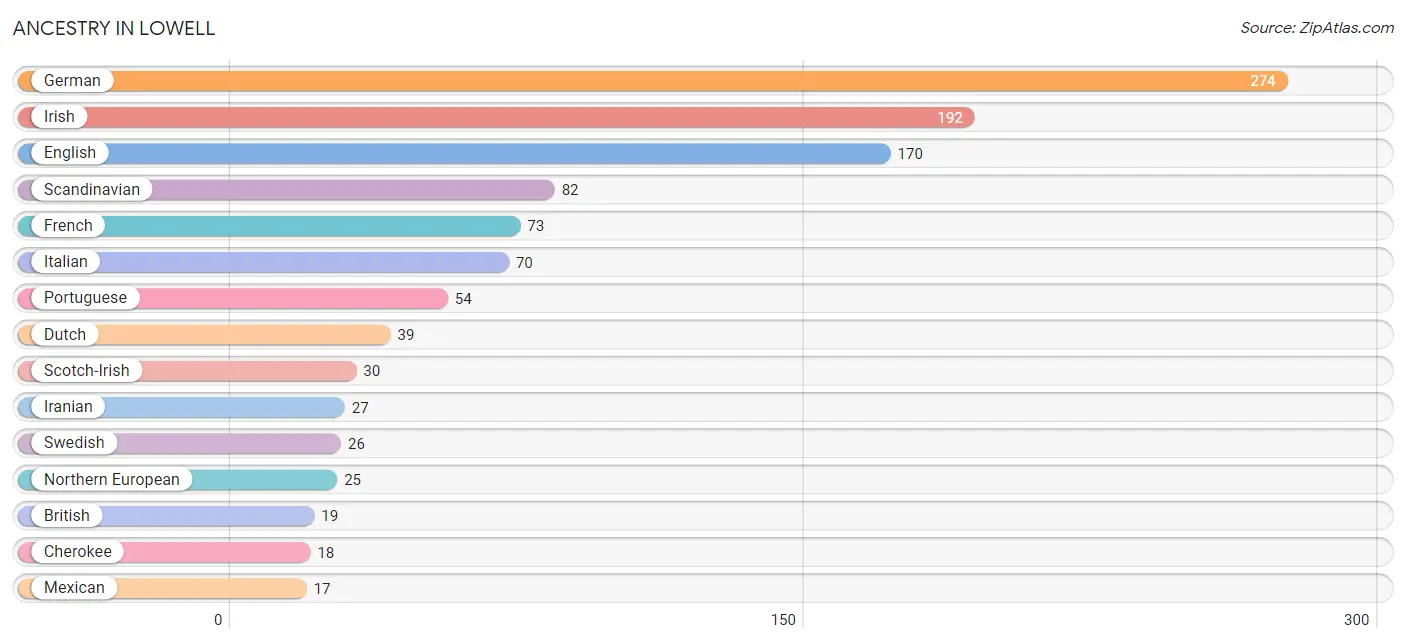
Ancestry in Lowell
The most populous ancestries reported in Lowell are German (274 | 22.6%), Irish (192 | 15.9%), English (170 | 14.0%), Scandinavian (82 | 6.8%), and French (73 | 6.0%), together accounting for 65.3% of all Lowell residents.
| Ancestry | # Population | % Population |
| American | 10 | 0.8% |
| British | 19 | 1.6% |
| Canadian | 11 | 0.9% |
| Central American | 7 | 0.6% |
| Cherokee | 18 | 1.5% |
| Dutch | 39 | 3.2% |
| English | 170 | 14.0% |
| European | 13 | 1.1% |
| French | 73 | 6.0% |
| German | 274 | 22.6% |
| Iranian | 27 | 2.2% |
| Irish | 192 | 15.9% |
| Italian | 70 | 5.8% |
| Korean | 6 | 0.5% |
| Mexican | 17 | 1.4% |
| Native Hawaiian | 5 | 0.4% |
| Nicaraguan | 7 | 0.6% |
| Northern European | 25 | 2.1% |
| Norwegian | 16 | 1.3% |
| Portuguese | 54 | 4.5% |
| Scandinavian | 82 | 6.8% |
| Scotch-Irish | 30 | 2.5% |
| Scottish | 11 | 0.9% |
| Swedish | 26 | 2.1% |
| Welsh | 10 | 0.8% | View All 25 Rows |
Immigrants in Lowell
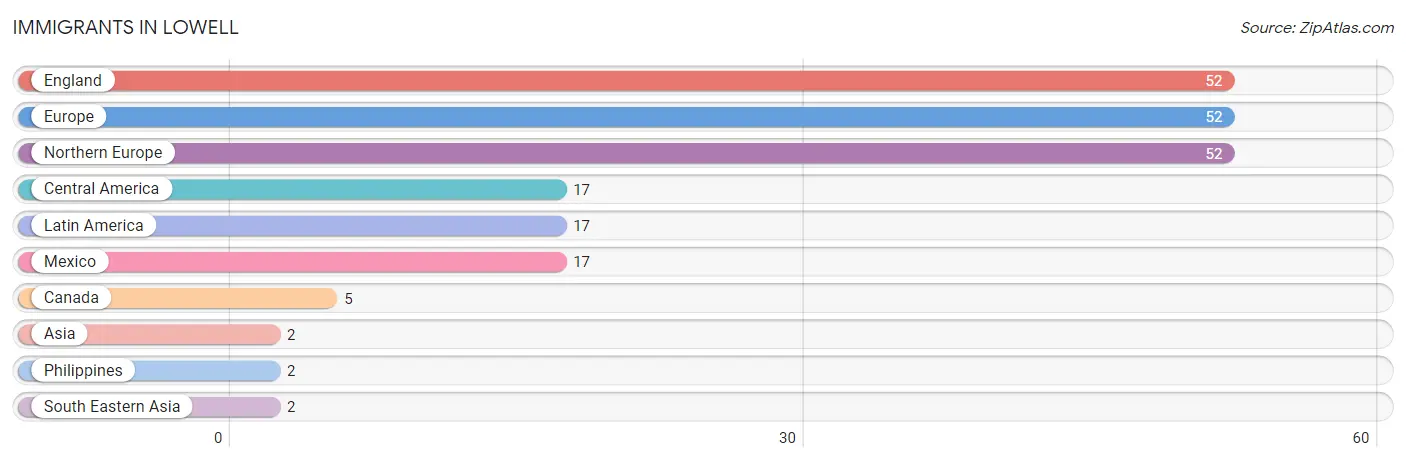
The most numerous immigrant groups reported in Lowell came from England (52 | 4.3%), Europe (52 | 4.3%), Northern Europe (52 | 4.3%), Central America (17 | 1.4%), and Latin America (17 | 1.4%), together accounting for 15.7% of all Lowell residents.
| Immigration Origin | # Population | % Population |
| Asia | 2 | 0.2% |
| Canada | 5 | 0.4% |
| Central America | 17 | 1.4% |
| England | 52 | 4.3% |
| Europe | 52 | 4.3% |
| Latin America | 17 | 1.4% |
| Mexico | 17 | 1.4% |
| Northern Europe | 52 | 4.3% |
| Philippines | 2 | 0.2% |
| South Eastern Asia | 2 | 0.2% | View All 10 Rows |
Sex and Age in Lowell
Sex and Age in Lowell
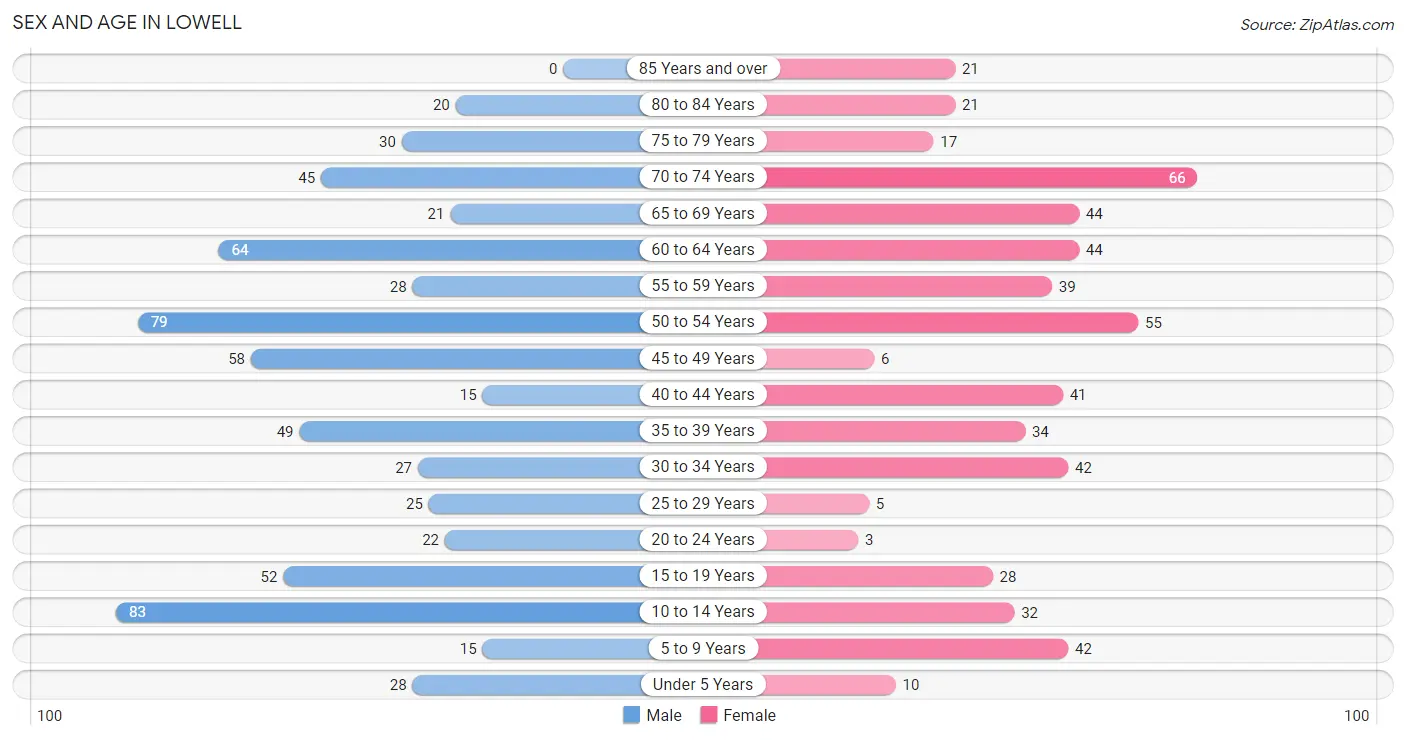
The most populous age groups in Lowell are 10 to 14 Years (83 | 12.6%) for men and 70 to 74 Years (66 | 12.0%) for women.
| Age Bracket | Male | Female |
| Under 5 Years | 28 (4.2%) | 10 (1.8%) |
| 5 to 9 Years | 15 (2.3%) | 42 (7.6%) |
| 10 to 14 Years | 83 (12.6%) | 32 (5.8%) |
| 15 to 19 Years | 52 (7.9%) | 28 (5.1%) |
| 20 to 24 Years | 22 (3.3%) | 3 (0.5%) |
| 25 to 29 Years | 25 (3.8%) | 5 (0.9%) |
| 30 to 34 Years | 27 (4.1%) | 42 (7.6%) |
| 35 to 39 Years | 49 (7.4%) | 34 (6.2%) |
| 40 to 44 Years | 15 (2.3%) | 41 (7.4%) |
| 45 to 49 Years | 58 (8.8%) | 6 (1.1%) |
| 50 to 54 Years | 79 (11.9%) | 55 (10.0%) |
| 55 to 59 Years | 28 (4.2%) | 39 (7.1%) |
| 60 to 64 Years | 64 (9.7%) | 44 (8.0%) |
| 65 to 69 Years | 21 (3.2%) | 44 (8.0%) |
| 70 to 74 Years | 45 (6.8%) | 66 (12.0%) |
| 75 to 79 Years | 30 (4.5%) | 17 (3.1%) |
| 80 to 84 Years | 20 (3.0%) | 21 (3.8%) |
| 85 Years and over | 0 (0.0%) | 21 (3.8%) |
| Total | 661 (100.0%) | 550 (100.0%) |
Families and Households in Lowell
Median Family Size in Lowell
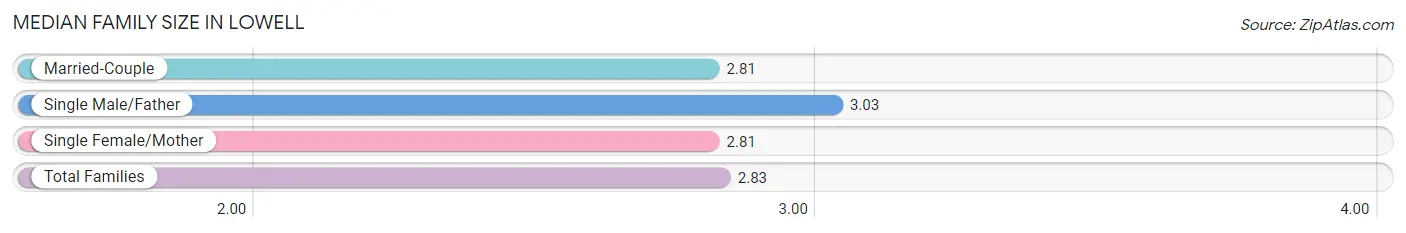
The median family size in Lowell is 2.83 persons per family, with single male/father families (32 | 9.3%) accounting for the largest median family size of 3.03 persons per family. On the other hand, married-couple families (275 | 80.2%) represent the smallest median family size with 2.81 persons per family.
| Family Type | # Families | Family Size |
| Married-Couple | 275 (80.2%) | 2.81 |
| Single Male/Father | 32 (9.3%) | 3.03 |
| Single Female/Mother | 36 (10.5%) | 2.81 |
| Total Families | 343 (100.0%) | 2.83 |
Median Household Size in Lowell
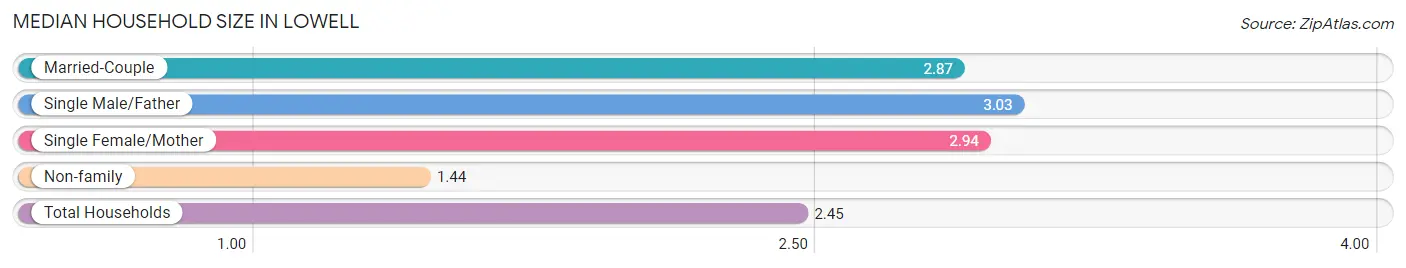
The median household size in Lowell is 2.45 persons per household, with single male/father households (32 | 6.5%) accounting for the largest median household size of 3.03 persons per household. non-family households (152 | 30.7%) represent the smallest median household size with 1.44 persons per household.
| Household Type | # Households | Household Size |
| Married-Couple | 275 (55.6%) | 2.87 |
| Single Male/Father | 32 (6.5%) | 3.03 |
| Single Female/Mother | 36 (7.3%) | 2.94 |
| Non-family | 152 (30.7%) | 1.44 |
| Total Households | 495 (100.0%) | 2.45 |
Household Size by Marriage Status in Lowell
Out of a total of 495 households in Lowell, 343 (69.3%) are family households, while 152 (30.7%) are nonfamily households. The most numerous type of family households are 2-person households, comprising 196, and the most common type of nonfamily households are 1-person households, comprising 89.
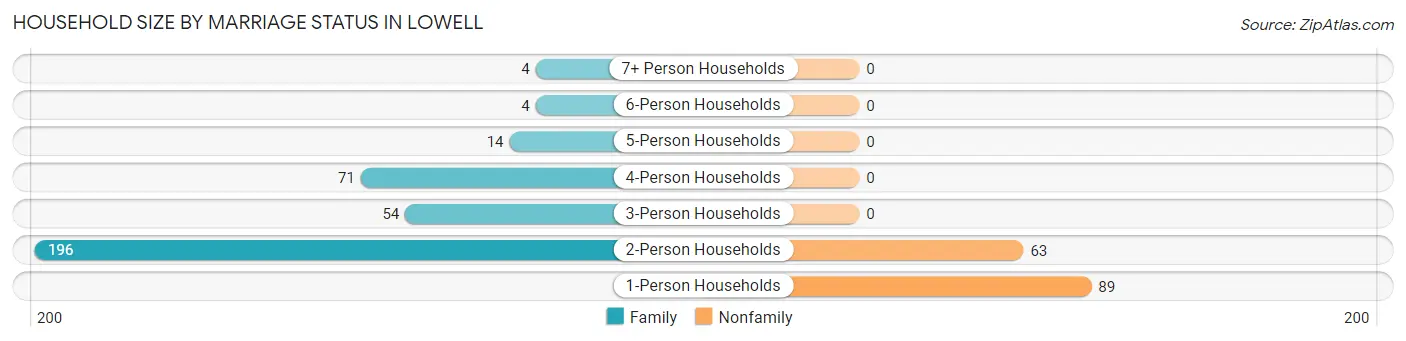
| Household Size | Family Households | Nonfamily Households |
| 1-Person Households | - | 89 (18.0%) |
| 2-Person Households | 196 (39.6%) | 63 (12.7%) |
| 3-Person Households | 54 (10.9%) | 0 (0.0%) |
| 4-Person Households | 71 (14.3%) | 0 (0.0%) |
| 5-Person Households | 14 (2.8%) | 0 (0.0%) |
| 6-Person Households | 4 (0.8%) | 0 (0.0%) |
| 7+ Person Households | 4 (0.8%) | 0 (0.0%) |
| Total | 343 (69.3%) | 152 (30.7%) |
Female Fertility in Lowell
Fertility by Age in Lowell
Average fertility rate in Lowell is 101.0 births per 1,000 women. Women in the age bracket of 35 to 50 years have the highest fertility rate with 136.0 births per 1,000 women. Women in the age bracket of 35 to 50 years acount for 68.8% of all women with births.
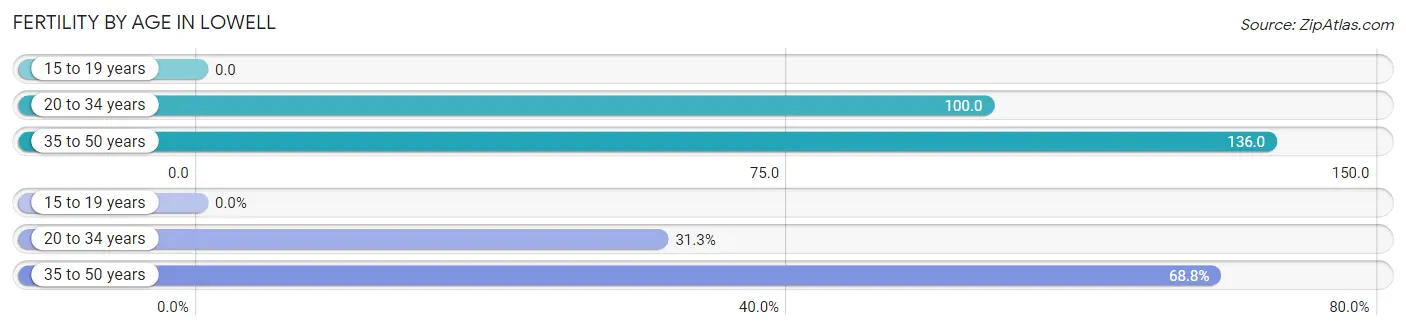
| Age Bracket | Women with Births | Births / 1,000 Women |
| 15 to 19 years | 0 (0.0%) | 0.0 |
| 20 to 34 years | 5 (31.2%) | 100.0 |
| 35 to 50 years | 11 (68.8%) | 136.0 |
| Total | 16 (100.0%) | 101.0 |
Fertility by Age by Marriage Status in Lowell
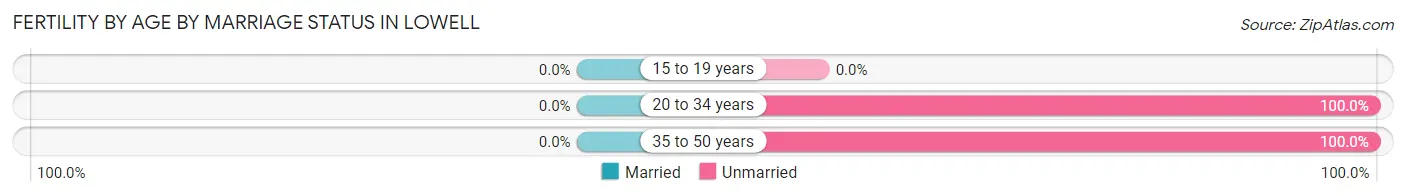
| Age Bracket | Married | Unmarried |
| 15 to 19 years | 0 (0.0%) | 0 (0.0%) |
| 20 to 34 years | 0 (0.0%) | 5 (100.0%) |
| 35 to 50 years | 0 (0.0%) | 11 (100.0%) |
| Total | 0 (0.0%) | 16 (100.0%) |
Fertility by Education in Lowell
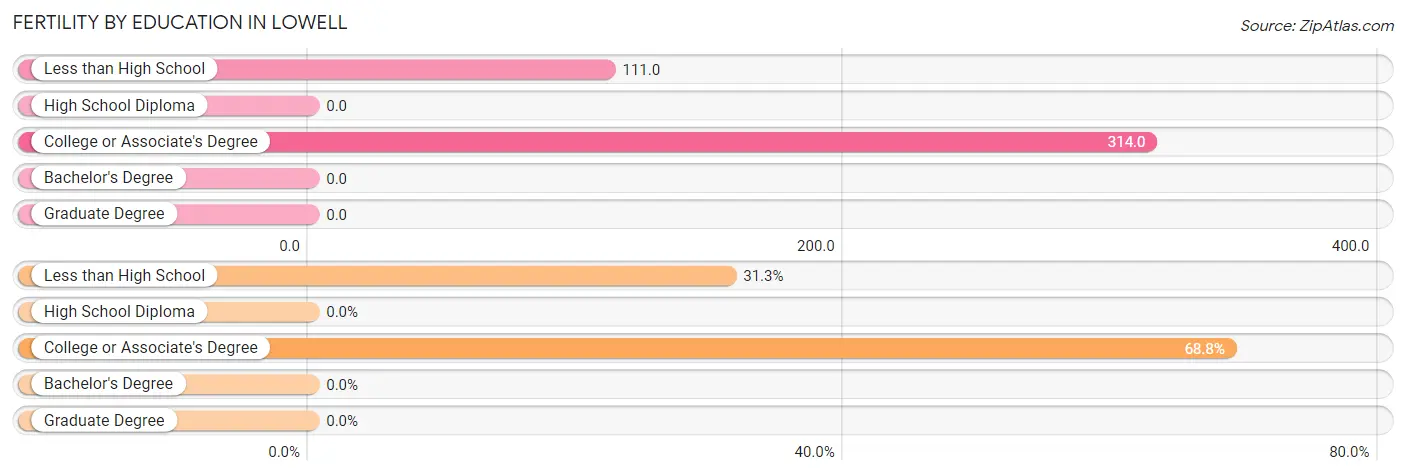
| Educational Attainment | Women with Births | Births / 1,000 Women |
| Less than High School | 5 (31.2%) | 111.0 |
| High School Diploma | 0 (0.0%) | 0.0 |
| College or Associate's Degree | 11 (68.8%) | 314.0 |
| Bachelor's Degree | 0 (0.0%) | 0.0 |
| Graduate Degree | 0 (0.0%) | 0.0 |
| Total | 16 (100.0%) | 101.0 |
Fertility by Education by Marriage Status in Lowell
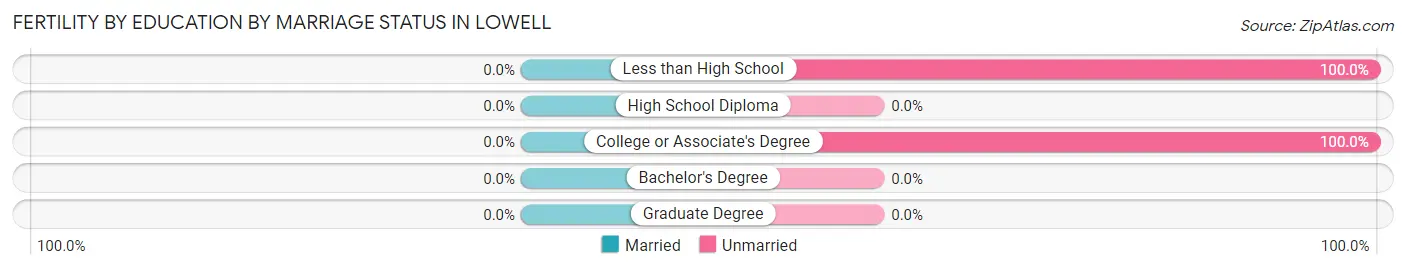
| Educational Attainment | Married | Unmarried |
| Less than High School | 0 (0.0%) | 5 (100.0%) |
| High School Diploma | 0 (0.0%) | 0 (0.0%) |
| College or Associate's Degree | 0 (0.0%) | 11 (100.0%) |
| Bachelor's Degree | 0 (0.0%) | 0 (0.0%) |
| Graduate Degree | 0 (0.0%) | 0 (0.0%) |
| Total | 0 (0.0%) | 16 (100.0%) |
Employment Characteristics in Lowell
Employment by Class of Employer in Lowell
Among the 509 employed individuals in Lowell, private company employees (387 | 76.0%), self-employed (not incorporated) (41 | 8.1%), and not-for-profit organizations (32 | 6.3%) make up the most common classes of employment.
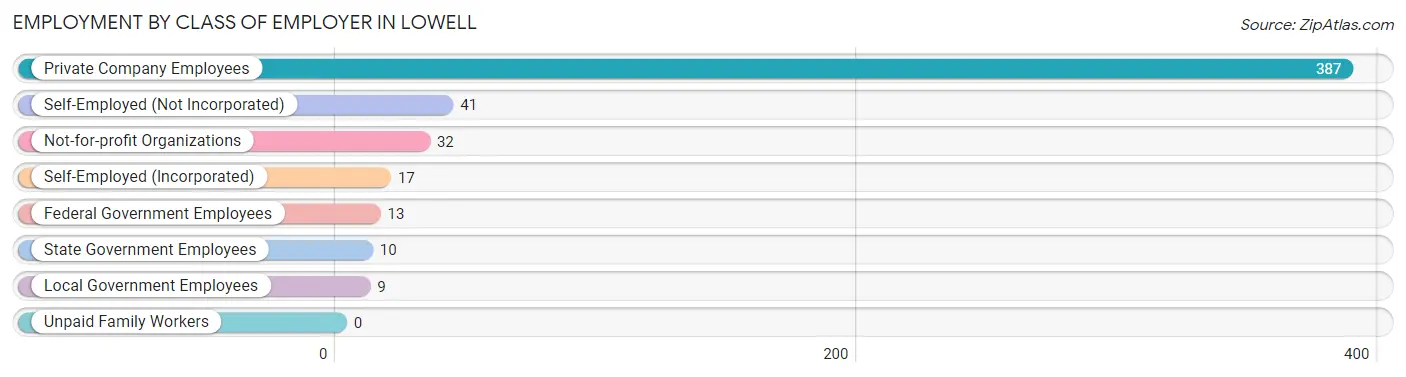
| Employer Class | # Employees | % Employees |
| Private Company Employees | 387 | 76.0% |
| Self-Employed (Incorporated) | 17 | 3.3% |
| Self-Employed (Not Incorporated) | 41 | 8.1% |
| Not-for-profit Organizations | 32 | 6.3% |
| Local Government Employees | 9 | 1.8% |
| State Government Employees | 10 | 2.0% |
| Federal Government Employees | 13 | 2.5% |
| Unpaid Family Workers | 0 | 0.0% |
| Total | 509 | 100.0% |
Employment Status by Age in Lowell
According to the labor force statistics for Lowell, out of the total population over 16 years of age (984), 53.6% or 527 individuals are in the labor force, with 2.1% or 11 of them unemployed. The age group with the highest labor force participation rate is 20 to 24 years, with 88.0% or 22 individuals in the labor force. Within the labor force, the 30 to 34 years age range has the highest percentage of unemployed individuals, with 19.3% or 11 of them being unemployed.
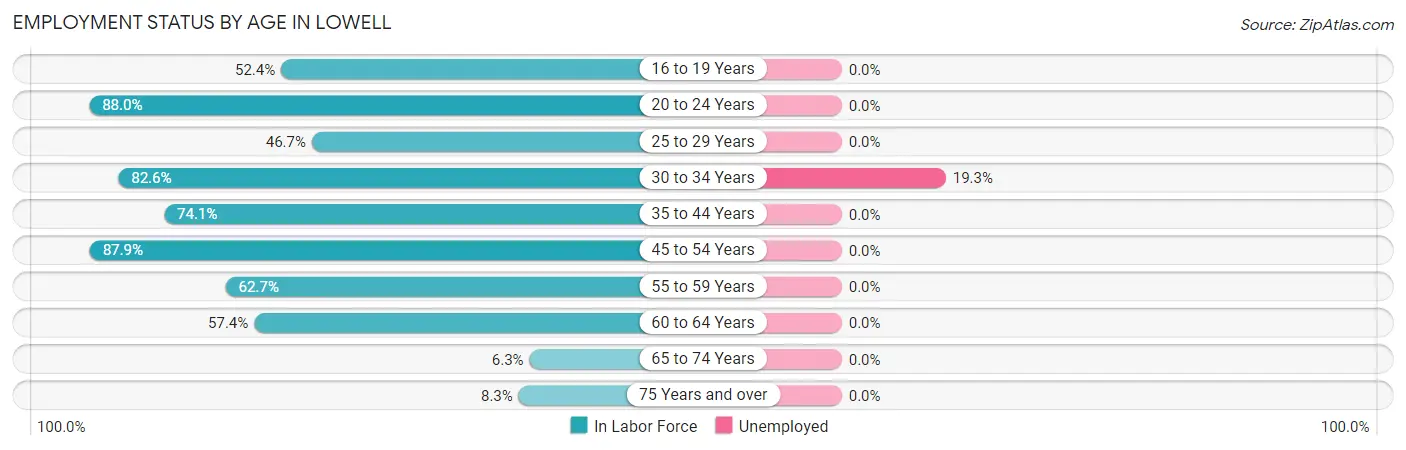
| Age Bracket | In Labor Force | Unemployed |
| 16 to 19 Years | 33 (52.4%) | 0 (0.0%) |
| 20 to 24 Years | 22 (88.0%) | 0 (0.0%) |
| 25 to 29 Years | 14 (46.7%) | 0 (0.0%) |
| 30 to 34 Years | 57 (82.6%) | 11 (19.3%) |
| 35 to 44 Years | 103 (74.1%) | 0 (0.0%) |
| 45 to 54 Years | 174 (87.9%) | 0 (0.0%) |
| 55 to 59 Years | 42 (62.7%) | 0 (0.0%) |
| 60 to 64 Years | 62 (57.4%) | 0 (0.0%) |
| 65 to 74 Years | 11 (6.3%) | 0 (0.0%) |
| 75 Years and over | 9 (8.3%) | 0 (0.0%) |
| Total | 527 (53.6%) | 11 (2.1%) |
Employment Status by Educational Attainment in Lowell
According to labor force statistics for Lowell, 74.0% of individuals (452) out of the total population between 25 and 64 years of age (611) are in the labor force, with 2.4% or 11 of them being unemployed. The group with the highest labor force participation rate are those with the educational attainment of bachelor's degree or higher, with 77.2% or 78 individuals in the labor force. Within the labor force, individuals with college / associate degree education have the highest percentage of unemployment, with 5.5% or 11 of them being unemployed.
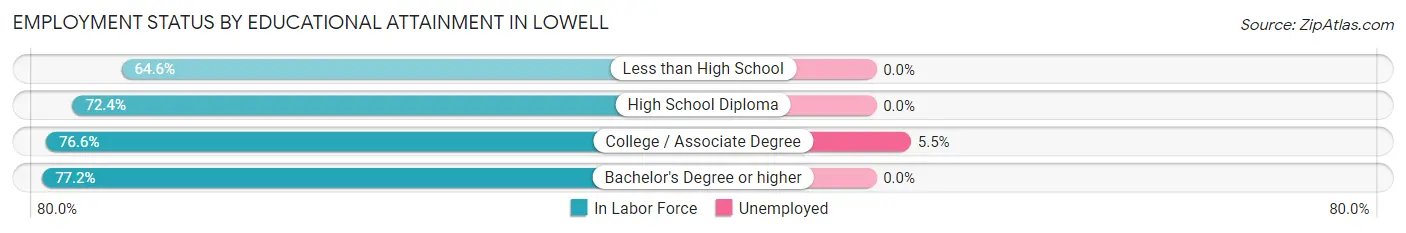
| Educational Attainment | In Labor Force | Unemployed |
| Less than High School | 51 (64.6%) | 0 (0.0%) |
| High School Diploma | 123 (72.4%) | 0 (0.0%) |
| College / Associate Degree | 200 (76.6%) | 14 (5.5%) |
| Bachelor's Degree or higher | 78 (77.2%) | 0 (0.0%) |
| Total | 452 (74.0%) | 15 (2.4%) |
Employment Occupations by Sex in Lowell
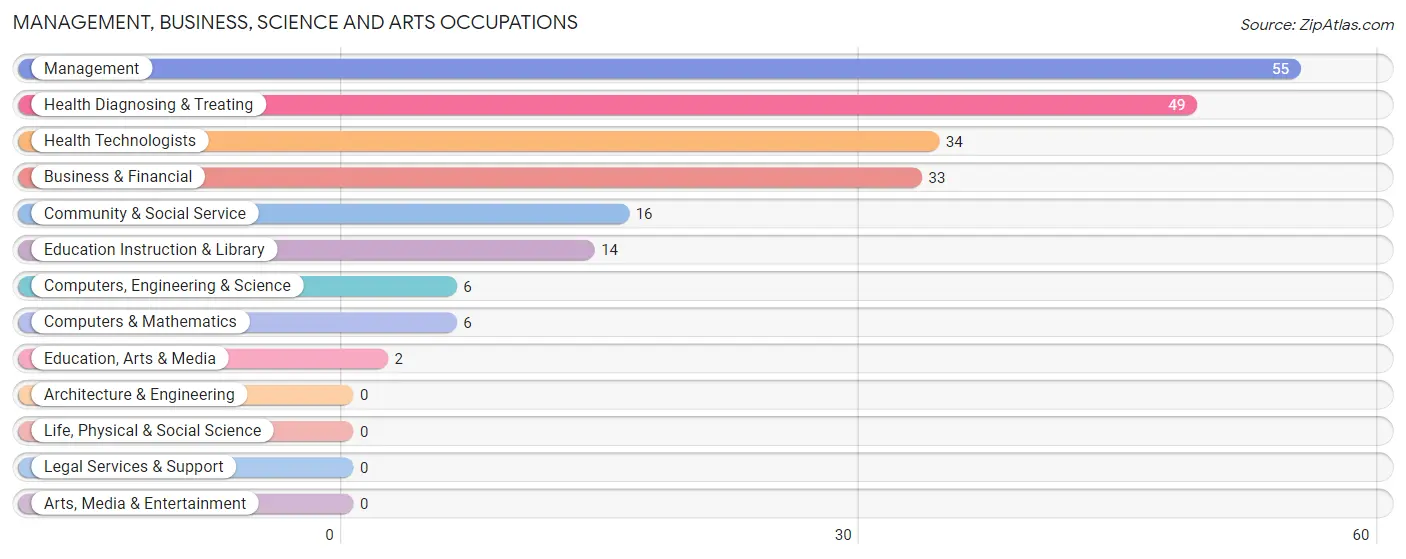
Management, Business, Science and Arts Occupations
The most common Management, Business, Science and Arts occupations in Lowell are Management (55 | 10.7%), Health Diagnosing & Treating (49 | 9.5%), Health Technologists (34 | 6.6%), Business & Financial (33 | 6.4%), and Community & Social Service (16 | 3.1%).
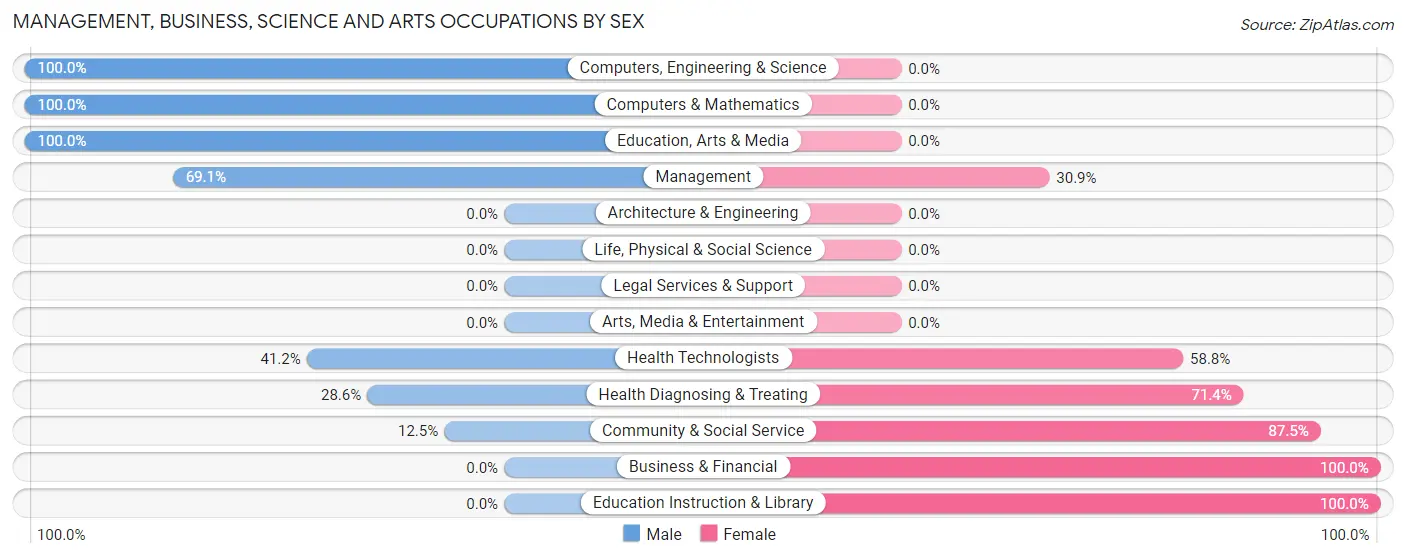
Management, Business, Science and Arts Occupations by Sex
Within the Management, Business, Science and Arts occupations in Lowell, the most male-oriented occupations are Computers, Engineering & Science (100.0%), Computers & Mathematics (100.0%), and Education, Arts & Media (100.0%), while the most female-oriented occupations are Business & Financial (100.0%), Education Instruction & Library (100.0%), and Community & Social Service (87.5%).
| Occupation | Male | Female |
| Management | 38 (69.1%) | 17 (30.9%) |
| Business & Financial | 0 (0.0%) | 33 (100.0%) |
| Computers, Engineering & Science | 6 (100.0%) | 0 (0.0%) |
| Computers & Mathematics | 6 (100.0%) | 0 (0.0%) |
| Architecture & Engineering | 0 (0.0%) | 0 (0.0%) |
| Life, Physical & Social Science | 0 (0.0%) | 0 (0.0%) |
| Community & Social Service | 2 (12.5%) | 14 (87.5%) |
| Education, Arts & Media | 2 (100.0%) | 0 (0.0%) |
| Legal Services & Support | 0 (0.0%) | 0 (0.0%) |
| Education Instruction & Library | 0 (0.0%) | 14 (100.0%) |
| Arts, Media & Entertainment | 0 (0.0%) | 0 (0.0%) |
| Health Diagnosing & Treating | 14 (28.6%) | 35 (71.4%) |
| Health Technologists | 14 (41.2%) | 20 (58.8%) |
| Total (Category) | 60 (37.7%) | 99 (62.3%) |
| Total (Overall) | 320 (62.0%) | 196 (38.0%) |
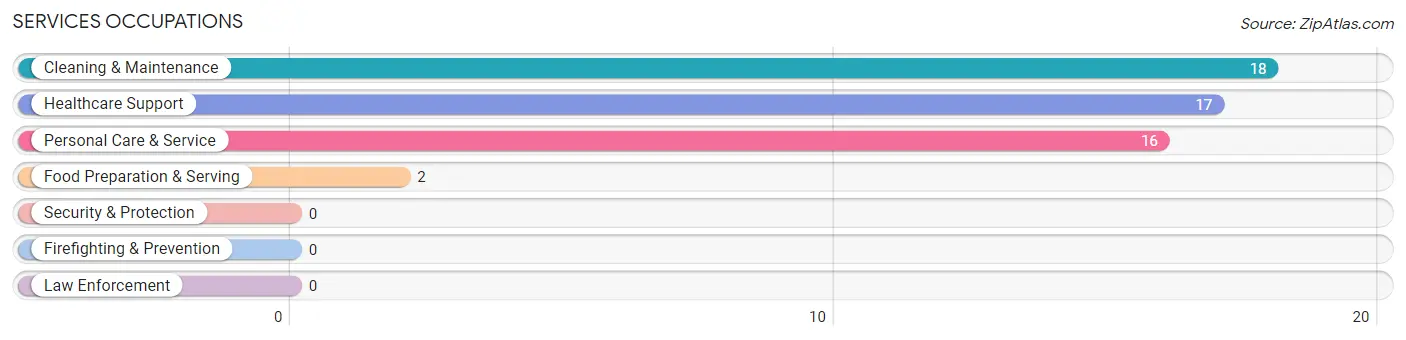
Services Occupations
The most common Services occupations in Lowell are Cleaning & Maintenance (18 | 3.5%), Healthcare Support (17 | 3.3%), Personal Care & Service (16 | 3.1%), and Food Preparation & Serving (2 | 0.4%).
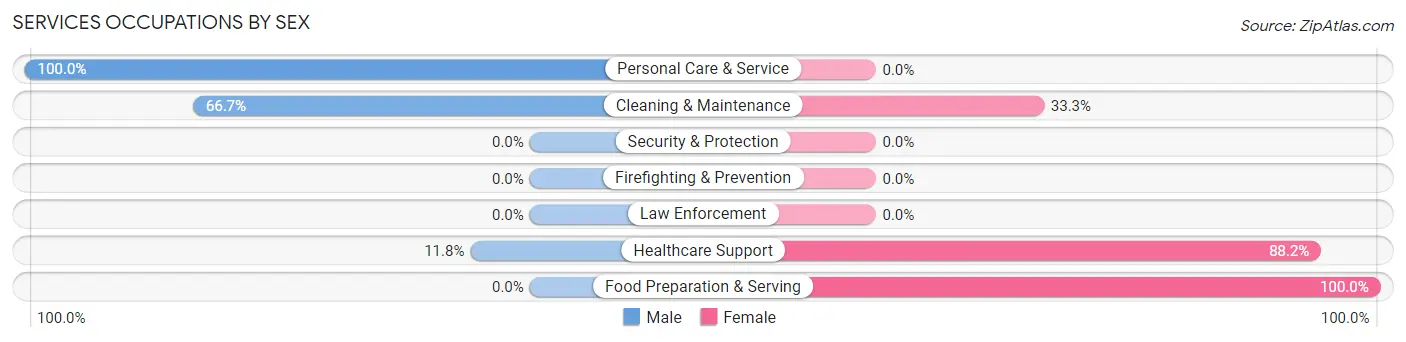
Services Occupations by Sex
Within the Services occupations in Lowell, the most male-oriented occupations are Personal Care & Service (100.0%), Cleaning & Maintenance (66.7%), and Healthcare Support (11.8%), while the most female-oriented occupations are Food Preparation & Serving (100.0%), Healthcare Support (88.2%), and Cleaning & Maintenance (33.3%).
| Occupation | Male | Female |
| Healthcare Support | 2 (11.8%) | 15 (88.2%) |
| Security & Protection | 0 (0.0%) | 0 (0.0%) |
| Firefighting & Prevention | 0 (0.0%) | 0 (0.0%) |
| Law Enforcement | 0 (0.0%) | 0 (0.0%) |
| Food Preparation & Serving | 0 (0.0%) | 2 (100.0%) |
| Cleaning & Maintenance | 12 (66.7%) | 6 (33.3%) |
| Personal Care & Service | 16 (100.0%) | 0 (0.0%) |
| Total (Category) | 30 (56.6%) | 23 (43.4%) |
| Total (Overall) | 320 (62.0%) | 196 (38.0%) |
Sales and Office Occupations
The most common Sales and Office occupations in Lowell are Office & Administration (54 | 10.5%), and Sales & Related (44 | 8.5%).

Sales and Office Occupations by Sex

| Occupation | Male | Female |
| Sales & Related | 36 (81.8%) | 8 (18.2%) |
| Office & Administration | 22 (40.7%) | 32 (59.3%) |
| Total (Category) | 58 (59.2%) | 40 (40.8%) |
| Total (Overall) | 320 (62.0%) | 196 (38.0%) |
Natural Resources, Construction and Maintenance Occupations
The most common Natural Resources, Construction and Maintenance occupations in Lowell are Installation, Maintenance & Repair (73 | 14.1%), and Construction & Extraction (42 | 8.1%).
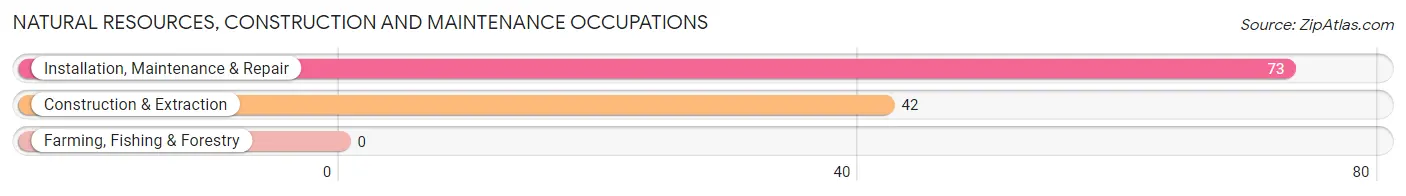
Natural Resources, Construction and Maintenance Occupations by Sex
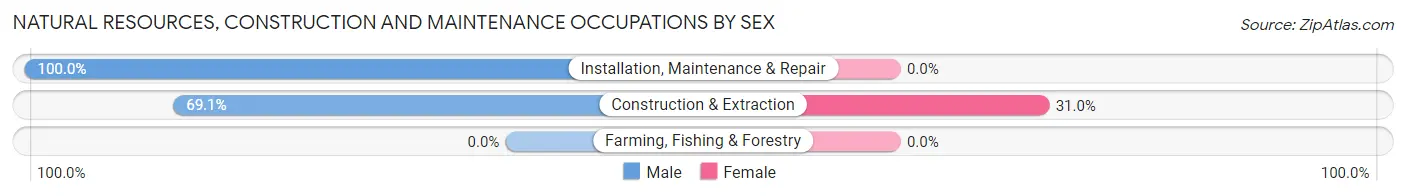
| Occupation | Male | Female |
| Farming, Fishing & Forestry | 0 (0.0%) | 0 (0.0%) |
| Construction & Extraction | 29 (69.1%) | 13 (30.9%) |
| Installation, Maintenance & Repair | 73 (100.0%) | 0 (0.0%) |
| Total (Category) | 102 (88.7%) | 13 (11.3%) |
| Total (Overall) | 320 (62.0%) | 196 (38.0%) |
Production, Transportation and Moving Occupations
The most common Production, Transportation and Moving occupations in Lowell are Material Moving (39 | 7.6%), Transportation (35 | 6.8%), and Production (17 | 3.3%).
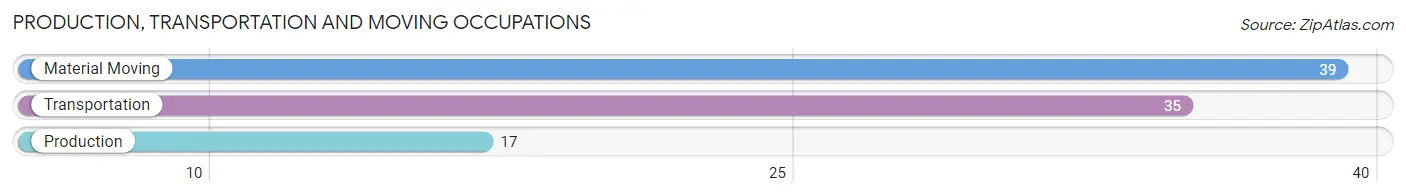
Production, Transportation and Moving Occupations by Sex
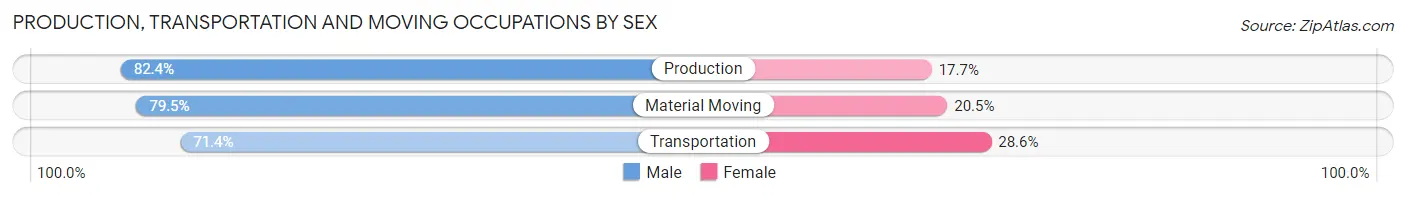
| Occupation | Male | Female |
| Production | 14 (82.4%) | 3 (17.6%) |
| Transportation | 25 (71.4%) | 10 (28.6%) |
| Material Moving | 31 (79.5%) | 8 (20.5%) |
| Total (Category) | 70 (76.9%) | 21 (23.1%) |
| Total (Overall) | 320 (62.0%) | 196 (38.0%) |
Employment Industries by Sex in Lowell
Employment Industries in Lowell
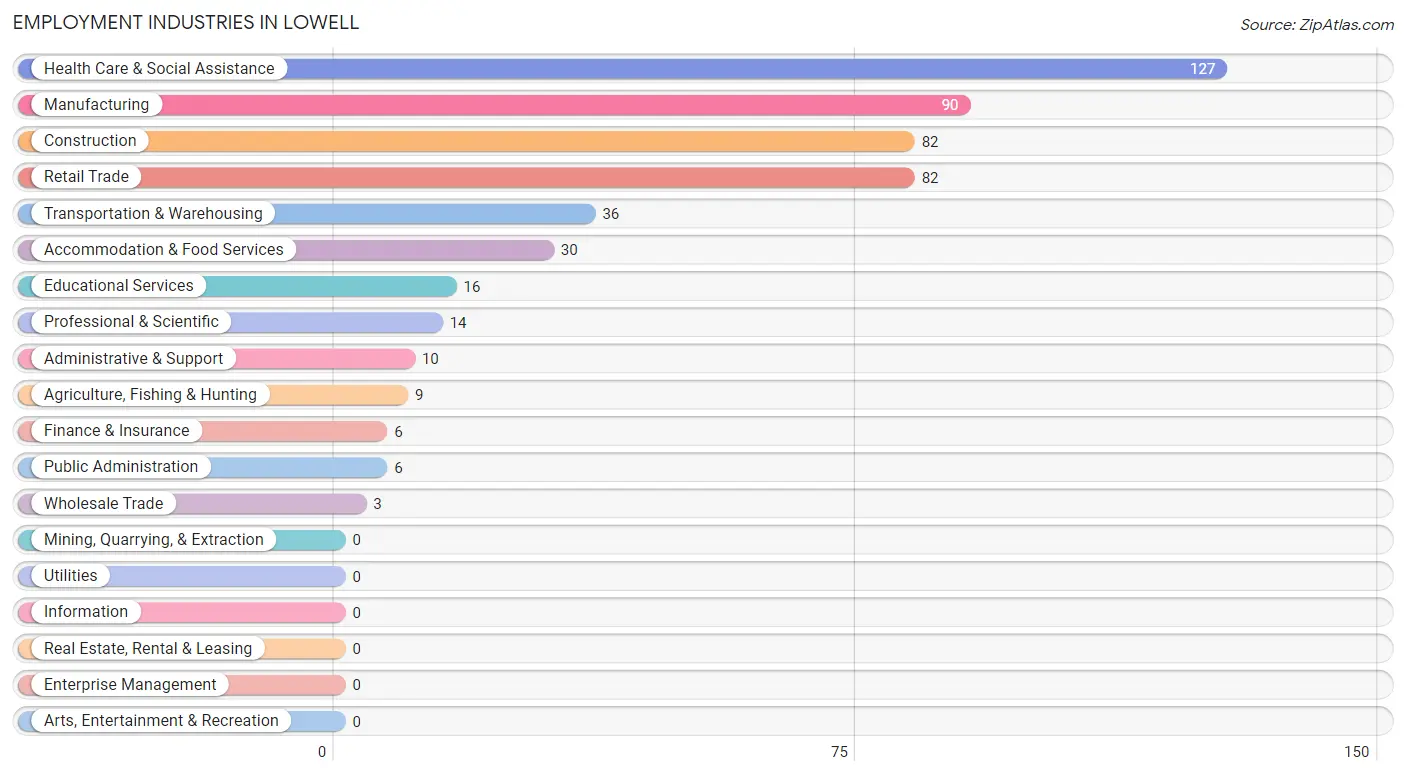
The major employment industries in Lowell include Health Care & Social Assistance (127 | 24.6%), Manufacturing (90 | 17.4%), Construction (82 | 15.9%), Retail Trade (82 | 15.9%), and Transportation & Warehousing (36 | 7.0%).
Employment Industries by Sex in Lowell
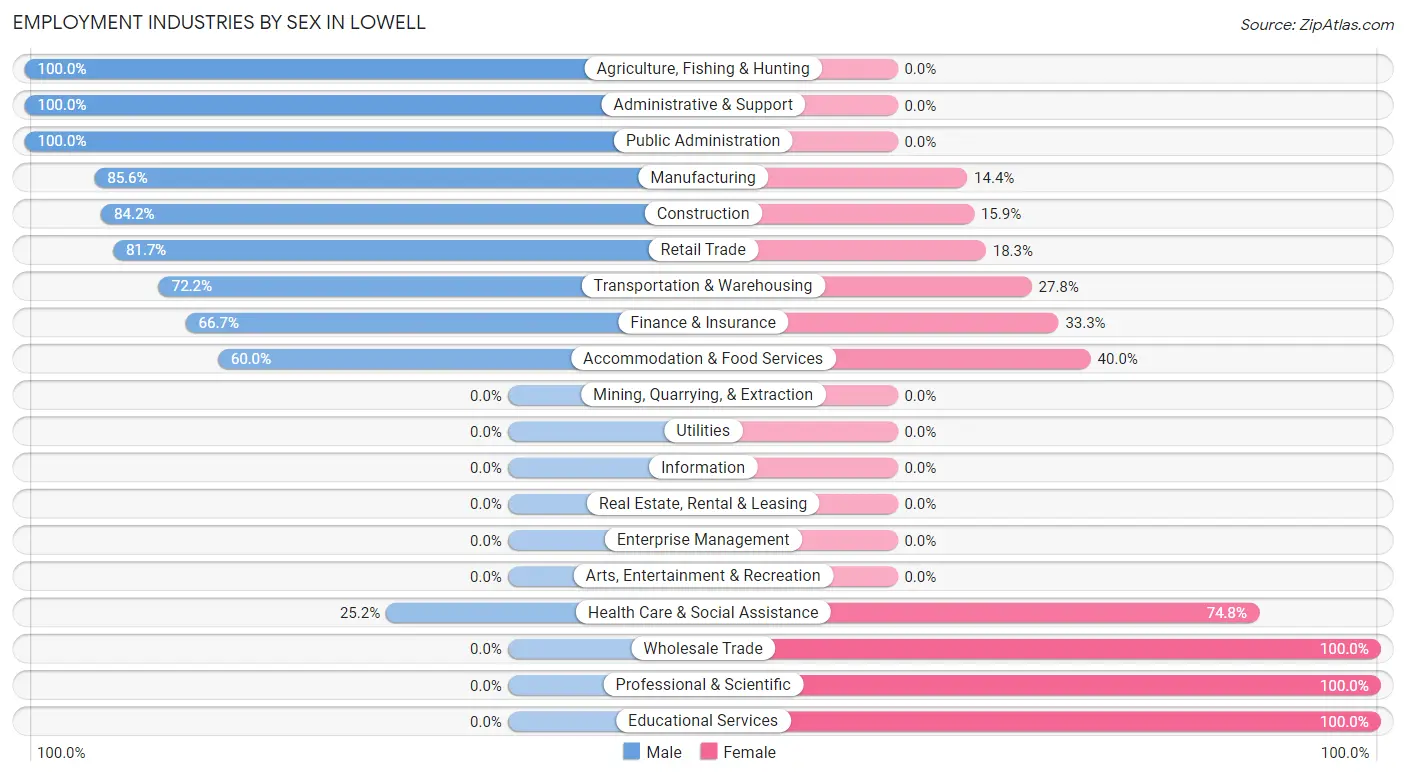
The Lowell industries that see more men than women are Agriculture, Fishing & Hunting (100.0%), Administrative & Support (100.0%), and Public Administration (100.0%), whereas the industries that tend to have a higher number of women are Wholesale Trade (100.0%), Professional & Scientific (100.0%), and Educational Services (100.0%).
| Industry | Male | Female |
| Agriculture, Fishing & Hunting | 9 (100.0%) | 0 (0.0%) |
| Mining, Quarrying, & Extraction | 0 (0.0%) | 0 (0.0%) |
| Construction | 69 (84.2%) | 13 (15.9%) |
| Manufacturing | 77 (85.6%) | 13 (14.4%) |
| Wholesale Trade | 0 (0.0%) | 3 (100.0%) |
| Retail Trade | 67 (81.7%) | 15 (18.3%) |
| Transportation & Warehousing | 26 (72.2%) | 10 (27.8%) |
| Utilities | 0 (0.0%) | 0 (0.0%) |
| Information | 0 (0.0%) | 0 (0.0%) |
| Finance & Insurance | 4 (66.7%) | 2 (33.3%) |
| Real Estate, Rental & Leasing | 0 (0.0%) | 0 (0.0%) |
| Professional & Scientific | 0 (0.0%) | 14 (100.0%) |
| Enterprise Management | 0 (0.0%) | 0 (0.0%) |
| Administrative & Support | 10 (100.0%) | 0 (0.0%) |
| Educational Services | 0 (0.0%) | 16 (100.0%) |
| Health Care & Social Assistance | 32 (25.2%) | 95 (74.8%) |
| Arts, Entertainment & Recreation | 0 (0.0%) | 0 (0.0%) |
| Accommodation & Food Services | 18 (60.0%) | 12 (40.0%) |
| Public Administration | 6 (100.0%) | 0 (0.0%) |
| Total | 320 (62.0%) | 196 (38.0%) |
Education in Lowell
School Enrollment in Lowell
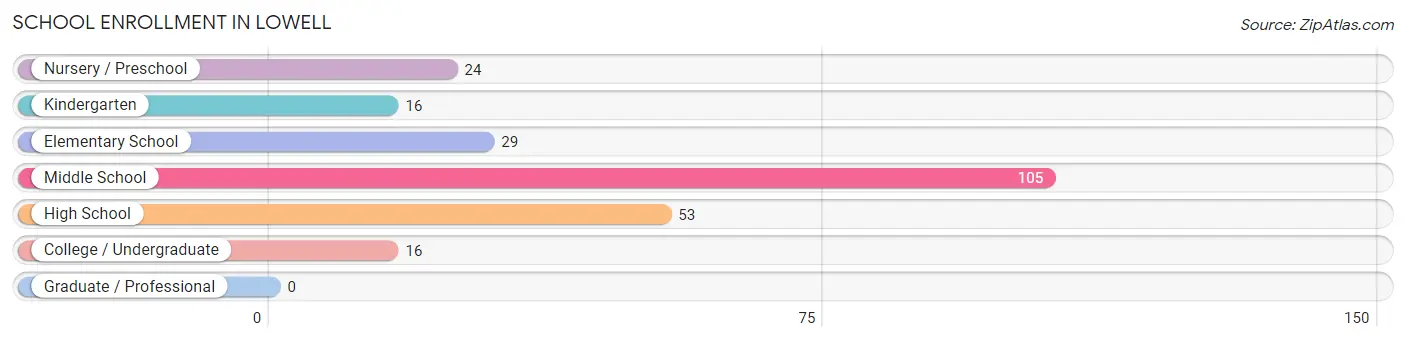
The most common levels of schooling among the 243 students in Lowell are middle school (105 | 43.2%), high school (53 | 21.8%), and elementary school (29 | 11.9%).
| School Level | # Students | % Students |
| Nursery / Preschool | 24 | 9.9% |
| Kindergarten | 16 | 6.6% |
| Elementary School | 29 | 11.9% |
| Middle School | 105 | 43.2% |
| High School | 53 | 21.8% |
| College / Undergraduate | 16 | 6.6% |
| Graduate / Professional | 0 | 0.0% |
| Total | 243 | 100.0% |
School Enrollment by Age by Funding Source in Lowell
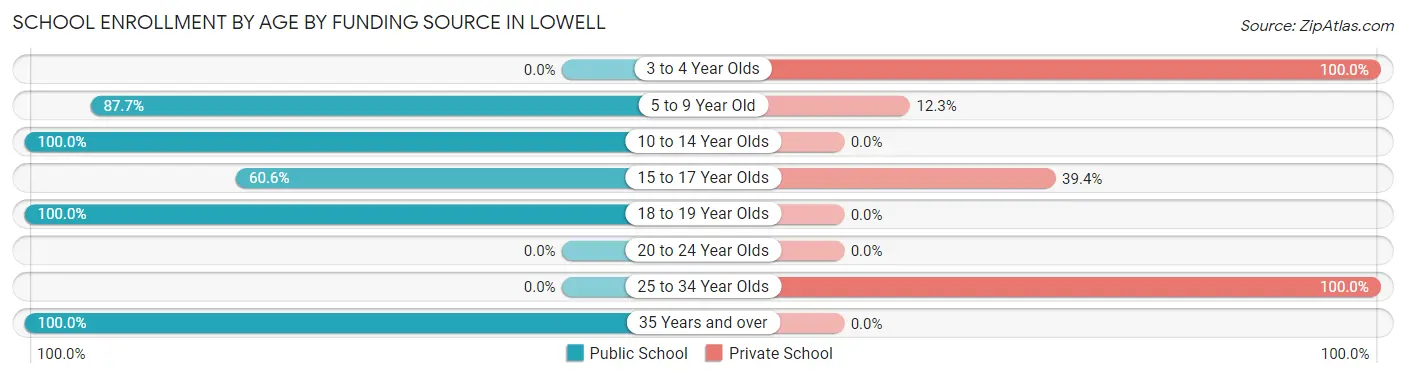
Out of a total of 243 students who are enrolled in schools in Lowell, 31 (12.8%) attend a private institution, while the remaining 212 (87.2%) are enrolled in public schools. The age group of 3 to 4 year olds has the highest likelihood of being enrolled in private schools, with 8 (100.0% in the age bracket) enrolled. Conversely, the age group of 10 to 14 year olds has the lowest likelihood of being enrolled in a private school, with 115 (100.0% in the age bracket) attending a public institution.
| Age Bracket | Public School | Private School |
| 3 to 4 Year Olds | 0 (0.0%) | 8 (100.0%) |
| 5 to 9 Year Old | 50 (87.7%) | 7 (12.3%) |
| 10 to 14 Year Olds | 115 (100.0%) | 0 (0.0%) |
| 15 to 17 Year Olds | 20 (60.6%) | 13 (39.4%) |
| 18 to 19 Year Olds | 14 (100.0%) | 0 (0.0%) |
| 20 to 24 Year Olds | 0 (0.0%) | 0 (0.0%) |
| 25 to 34 Year Olds | 0 (0.0%) | 3 (100.0%) |
| 35 Years and over | 13 (100.0%) | 0 (0.0%) |
| Total | 212 (87.2%) | 31 (12.8%) |
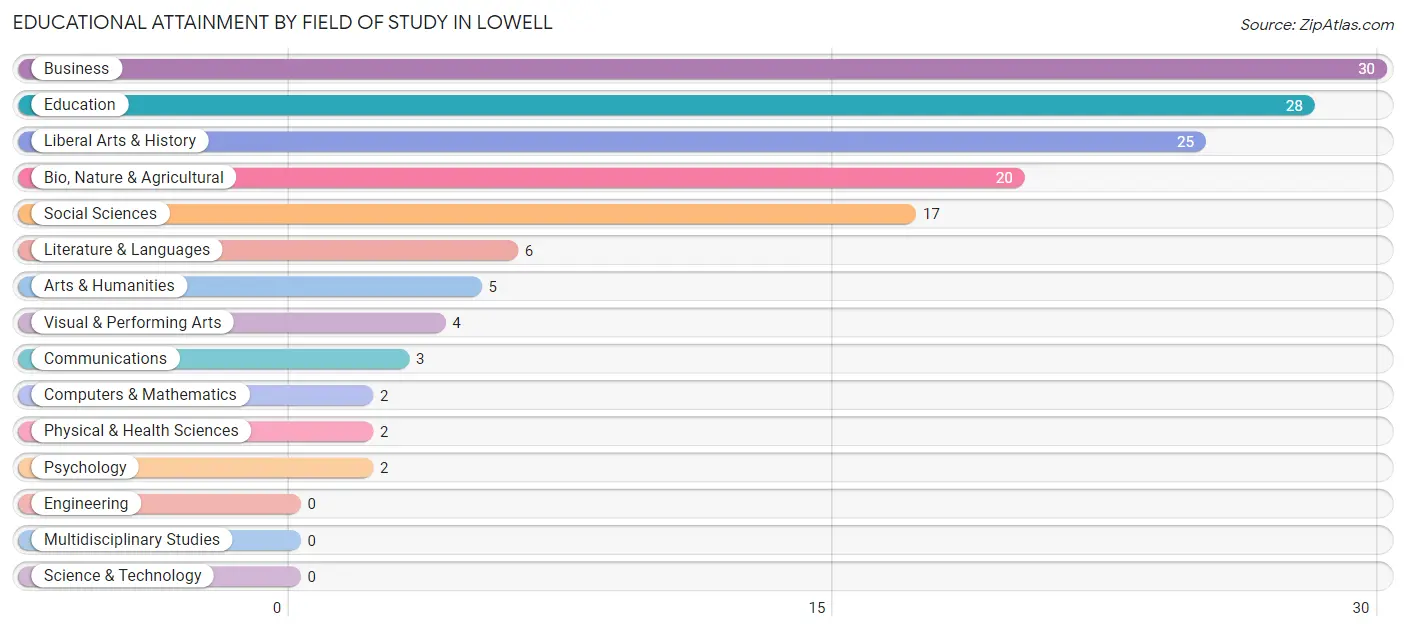
Educational Attainment by Field of Study in Lowell
Business (30 | 20.8%), education (28 | 19.4%), liberal arts & history (25 | 17.4%), bio, nature & agricultural (20 | 13.9%), and social sciences (17 | 11.8%) are the most common fields of study among 144 individuals in Lowell who have obtained a bachelor's degree or higher.
| Field of Study | # Graduates | % Graduates |
| Computers & Mathematics | 2 | 1.4% |
| Bio, Nature & Agricultural | 20 | 13.9% |
| Physical & Health Sciences | 2 | 1.4% |
| Psychology | 2 | 1.4% |
| Social Sciences | 17 | 11.8% |
| Engineering | 0 | 0.0% |
| Multidisciplinary Studies | 0 | 0.0% |
| Science & Technology | 0 | 0.0% |
| Business | 30 | 20.8% |
| Education | 28 | 19.4% |
| Literature & Languages | 6 | 4.2% |
| Liberal Arts & History | 25 | 17.4% |
| Visual & Performing Arts | 4 | 2.8% |
| Communications | 3 | 2.1% |
| Arts & Humanities | 5 | 3.5% |
| Total | 144 | 100.0% |
Transportation & Commute in Lowell
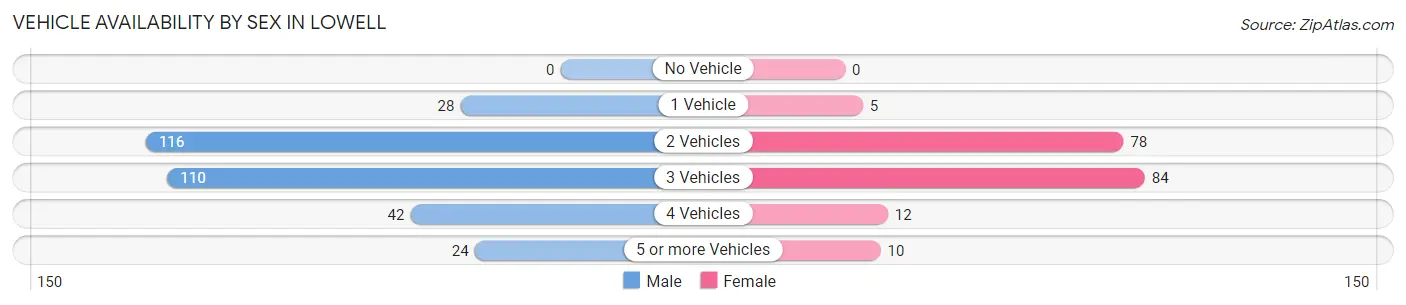
Vehicle Availability by Sex in Lowell
The most prevalent vehicle ownership categories in Lowell are males with 2 vehicles (116, accounting for 36.2%) and females with 2 vehicles (78, making up 61.4%).
| Vehicles Available | Male | Female |
| No Vehicle | 0 (0.0%) | 0 (0.0%) |
| 1 Vehicle | 28 (8.7%) | 5 (2.6%) |
| 2 Vehicles | 116 (36.2%) | 78 (41.3%) |
| 3 Vehicles | 110 (34.4%) | 84 (44.4%) |
| 4 Vehicles | 42 (13.1%) | 12 (6.4%) |
| 5 or more Vehicles | 24 (7.5%) | 10 (5.3%) |
| Total | 320 (100.0%) | 189 (100.0%) |
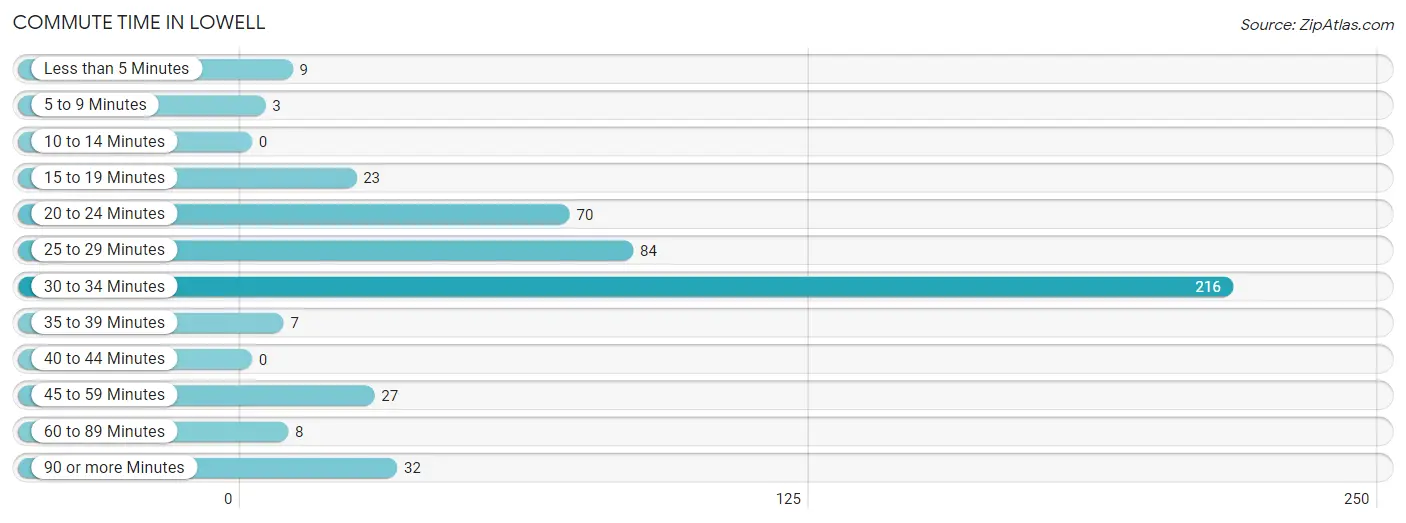
Commute Time in Lowell
The most frequently occuring commute durations in Lowell are 30 to 34 minutes (216 commuters, 45.1%), 25 to 29 minutes (84 commuters, 17.5%), and 20 to 24 minutes (70 commuters, 14.6%).
| Commute Time | # Commuters | % Commuters |
| Less than 5 Minutes | 9 | 1.9% |
| 5 to 9 Minutes | 3 | 0.6% |
| 10 to 14 Minutes | 0 | 0.0% |
| 15 to 19 Minutes | 23 | 4.8% |
| 20 to 24 Minutes | 70 | 14.6% |
| 25 to 29 Minutes | 84 | 17.5% |
| 30 to 34 Minutes | 216 | 45.1% |
| 35 to 39 Minutes | 7 | 1.5% |
| 40 to 44 Minutes | 0 | 0.0% |
| 45 to 59 Minutes | 27 | 5.6% |
| 60 to 89 Minutes | 8 | 1.7% |
| 90 or more Minutes | 32 | 6.7% |
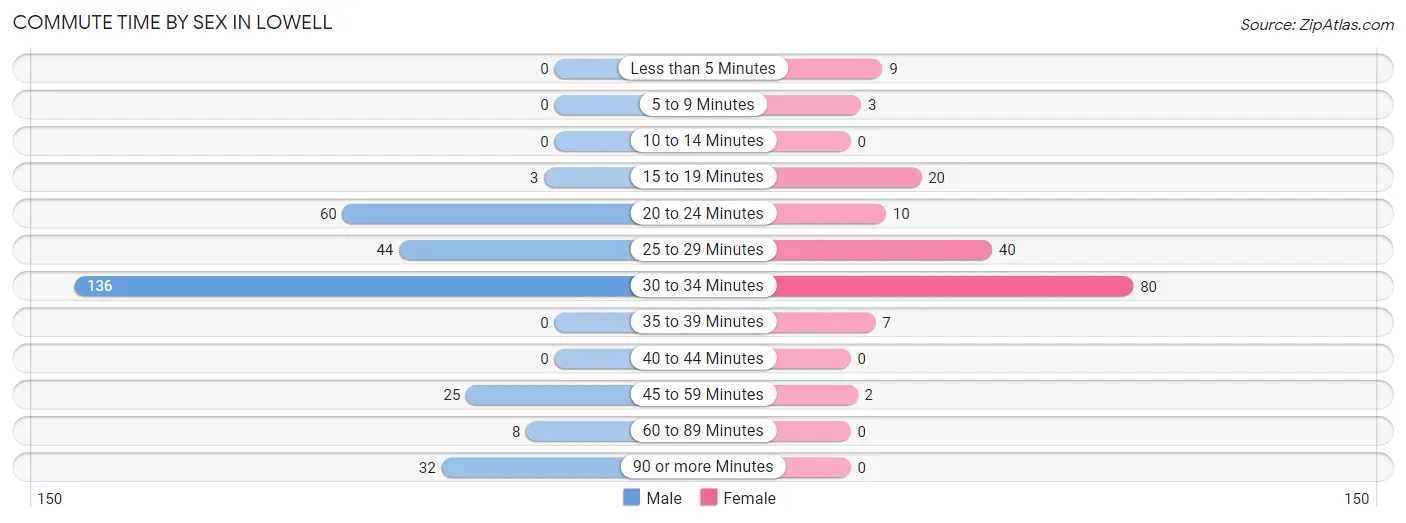
Commute Time by Sex in Lowell
The most common commute times in Lowell are 30 to 34 minutes (136 commuters, 44.2%) for males and 30 to 34 minutes (80 commuters, 46.8%) for females.
| Commute Time | Male | Female |
| Less than 5 Minutes | 0 (0.0%) | 9 (5.3%) |
| 5 to 9 Minutes | 0 (0.0%) | 3 (1.8%) |
| 10 to 14 Minutes | 0 (0.0%) | 0 (0.0%) |
| 15 to 19 Minutes | 3 (1.0%) | 20 (11.7%) |
| 20 to 24 Minutes | 60 (19.5%) | 10 (5.9%) |
| 25 to 29 Minutes | 44 (14.3%) | 40 (23.4%) |
| 30 to 34 Minutes | 136 (44.2%) | 80 (46.8%) |
| 35 to 39 Minutes | 0 (0.0%) | 7 (4.1%) |
| 40 to 44 Minutes | 0 (0.0%) | 0 (0.0%) |
| 45 to 59 Minutes | 25 (8.1%) | 2 (1.2%) |
| 60 to 89 Minutes | 8 (2.6%) | 0 (0.0%) |
| 90 or more Minutes | 32 (10.4%) | 0 (0.0%) |
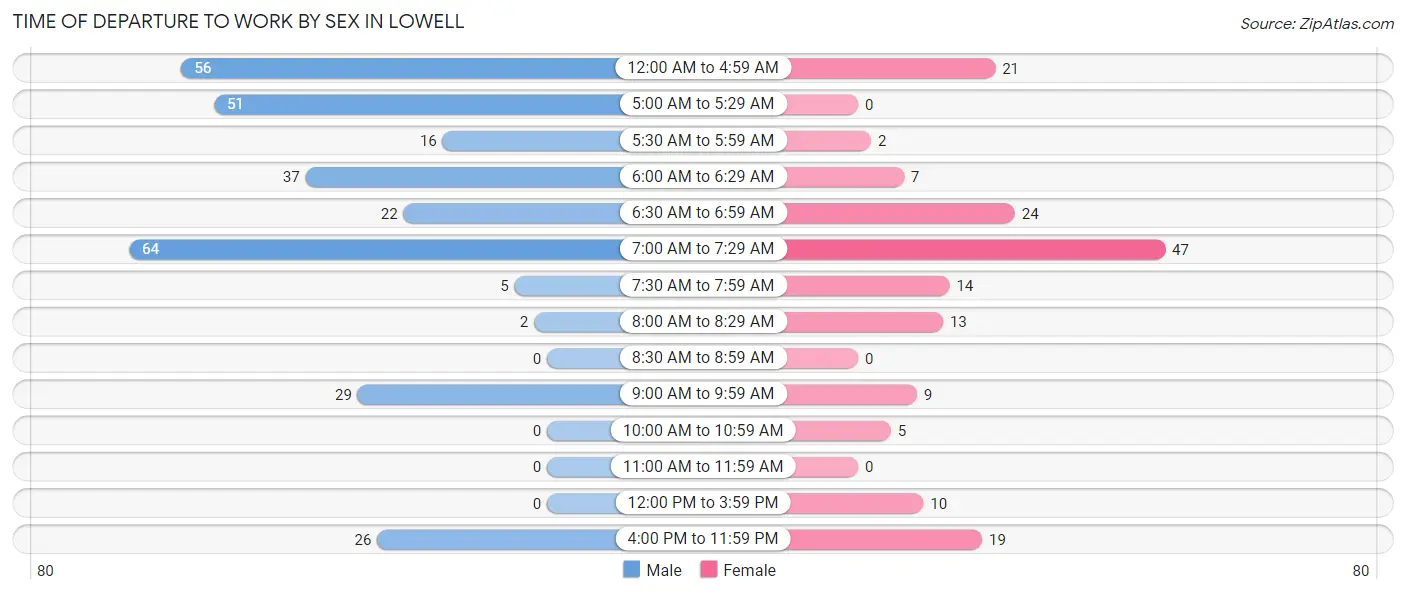
Time of Departure to Work by Sex in Lowell
The most frequent times of departure to work in Lowell are 7:00 AM to 7:29 AM (64, 20.8%) for males and 7:00 AM to 7:29 AM (47, 27.5%) for females.
| Time of Departure | Male | Female |
| 12:00 AM to 4:59 AM | 56 (18.2%) | 21 (12.3%) |
| 5:00 AM to 5:29 AM | 51 (16.6%) | 0 (0.0%) |
| 5:30 AM to 5:59 AM | 16 (5.2%) | 2 (1.2%) |
| 6:00 AM to 6:29 AM | 37 (12.0%) | 7 (4.1%) |
| 6:30 AM to 6:59 AM | 22 (7.1%) | 24 (14.0%) |
| 7:00 AM to 7:29 AM | 64 (20.8%) | 47 (27.5%) |
| 7:30 AM to 7:59 AM | 5 (1.6%) | 14 (8.2%) |
| 8:00 AM to 8:29 AM | 2 (0.6%) | 13 (7.6%) |
| 8:30 AM to 8:59 AM | 0 (0.0%) | 0 (0.0%) |
| 9:00 AM to 9:59 AM | 29 (9.4%) | 9 (5.3%) |
| 10:00 AM to 10:59 AM | 0 (0.0%) | 5 (2.9%) |
| 11:00 AM to 11:59 AM | 0 (0.0%) | 0 (0.0%) |
| 12:00 PM to 3:59 PM | 0 (0.0%) | 10 (5.9%) |
| 4:00 PM to 11:59 PM | 26 (8.4%) | 19 (11.1%) |
| Total | 308 (100.0%) | 171 (100.0%) |
Housing Occupancy in Lowell
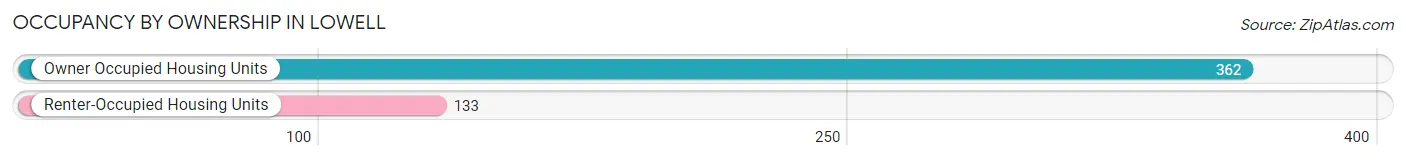
Occupancy by Ownership in Lowell
Of the total 495 dwellings in Lowell, owner-occupied units account for 362 (73.1%), while renter-occupied units make up 133 (26.9%).
| Occupancy | # Housing Units | % Housing Units |
| Owner Occupied Housing Units | 362 | 73.1% |
| Renter-Occupied Housing Units | 133 | 26.9% |
| Total Occupied Housing Units | 495 | 100.0% |
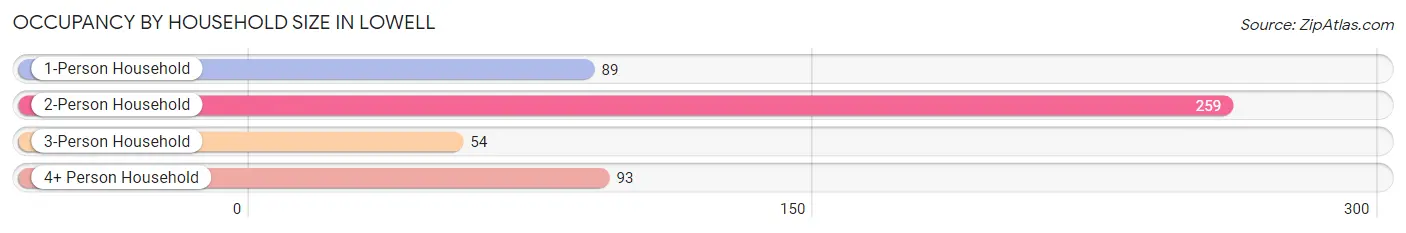
Occupancy by Household Size in Lowell
| Household Size | # Housing Units | % Housing Units |
| 1-Person Household | 89 | 18.0% |
| 2-Person Household | 259 | 52.3% |
| 3-Person Household | 54 | 10.9% |
| 4+ Person Household | 93 | 18.8% |
| Total Housing Units | 495 | 100.0% |
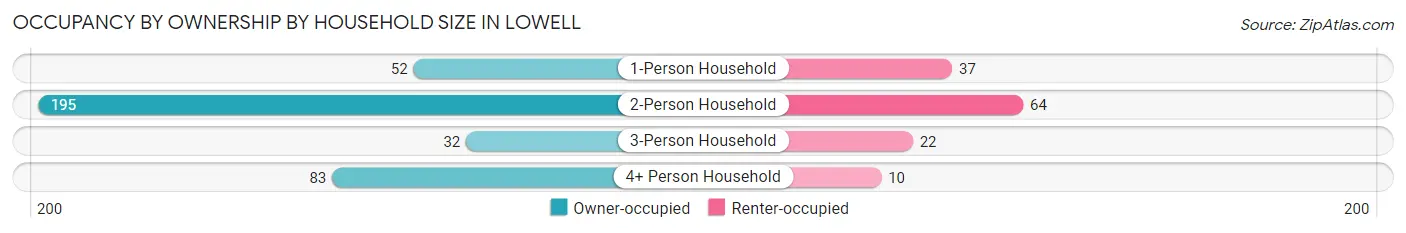
Occupancy by Ownership by Household Size in Lowell
| Household Size | Owner-occupied | Renter-occupied |
| 1-Person Household | 52 (58.4%) | 37 (41.6%) |
| 2-Person Household | 195 (75.3%) | 64 (24.7%) |
| 3-Person Household | 32 (59.3%) | 22 (40.7%) |
| 4+ Person Household | 83 (89.2%) | 10 (10.7%) |
| Total Housing Units | 362 (73.1%) | 133 (26.9%) |
Occupancy by Educational Attainment in Lowell
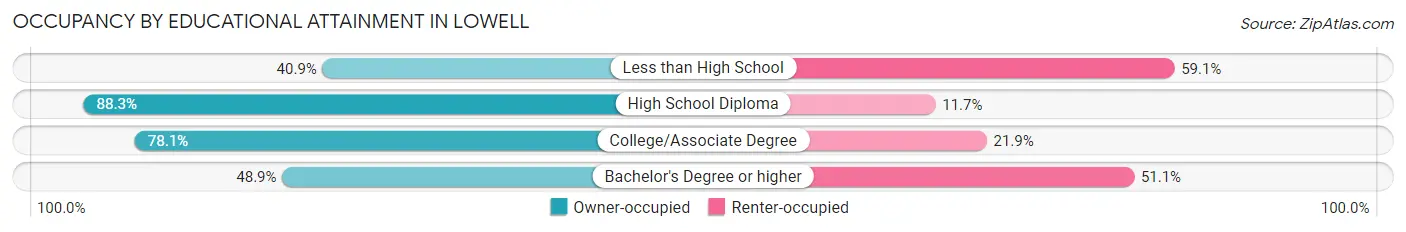
| Household Size | Owner-occupied | Renter-occupied |
| Less than High School | 27 (40.9%) | 39 (59.1%) |
| High School Diploma | 113 (88.3%) | 15 (11.7%) |
| College/Associate Degree | 200 (78.1%) | 56 (21.9%) |
| Bachelor's Degree or higher | 22 (48.9%) | 23 (51.1%) |
Occupancy by Age of Householder in Lowell
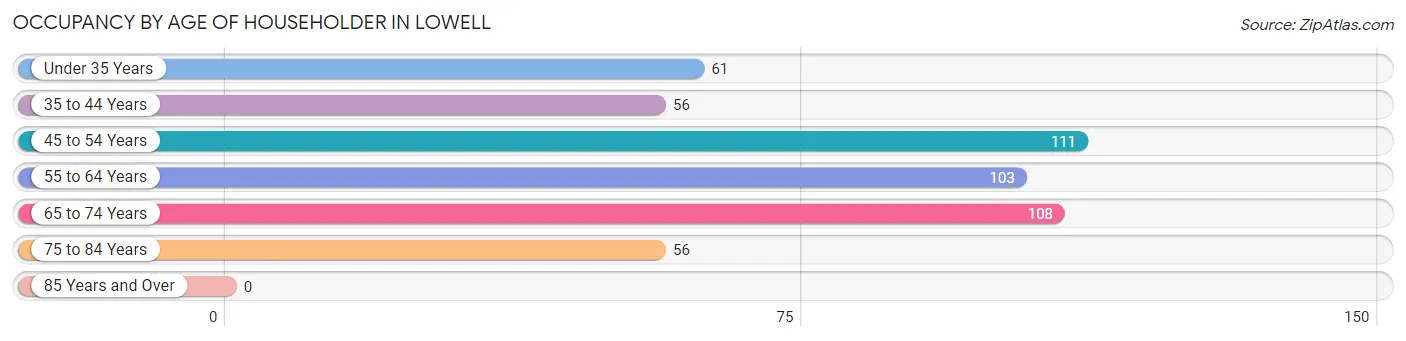
| Age Bracket | # Households | % Households |
| Under 35 Years | 61 | 12.3% |
| 35 to 44 Years | 56 | 11.3% |
| 45 to 54 Years | 111 | 22.4% |
| 55 to 64 Years | 103 | 20.8% |
| 65 to 74 Years | 108 | 21.8% |
| 75 to 84 Years | 56 | 11.3% |
| 85 Years and Over | 0 | 0.0% |
| Total | 495 | 100.0% |
Housing Finances in Lowell
Median Income by Occupancy in Lowell
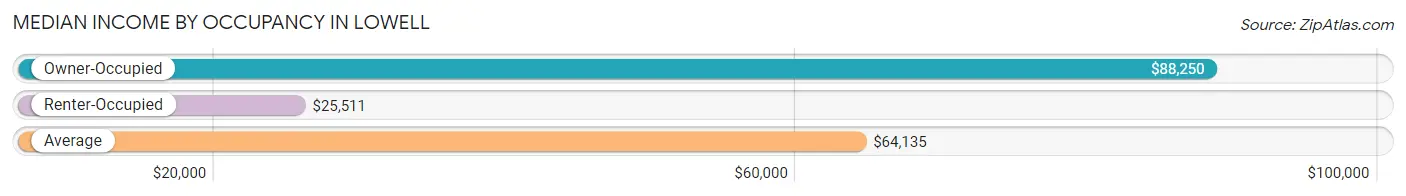
| Occupancy Type | # Households | Median Income |
| Owner-Occupied | 362 (73.1%) | $88,250 |
| Renter-Occupied | 133 (26.9%) | $25,511 |
| Average | 495 (100.0%) | $64,135 |
Occupancy by Householder Income Bracket in Lowell
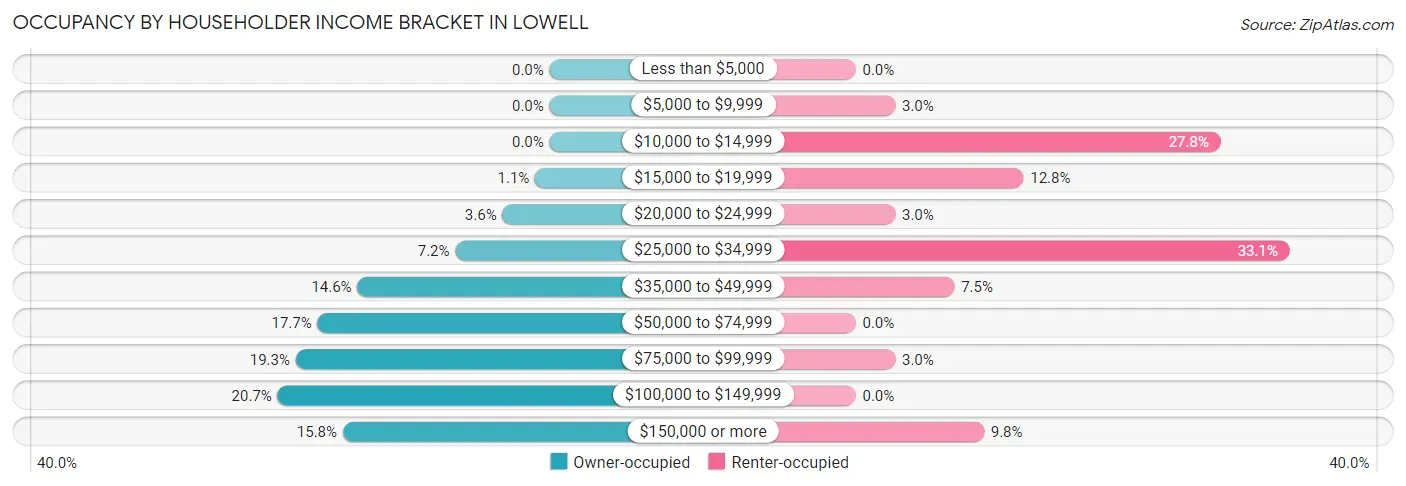
| Income Bracket | Owner-occupied | Renter-occupied |
| Less than $5,000 | 0 (0.0%) | 0 (0.0%) |
| $5,000 to $9,999 | 0 (0.0%) | 4 (3.0%) |
| $10,000 to $14,999 | 0 (0.0%) | 37 (27.8%) |
| $15,000 to $19,999 | 4 (1.1%) | 17 (12.8%) |
| $20,000 to $24,999 | 13 (3.6%) | 4 (3.0%) |
| $25,000 to $34,999 | 26 (7.2%) | 44 (33.1%) |
| $35,000 to $49,999 | 53 (14.6%) | 10 (7.5%) |
| $50,000 to $74,999 | 64 (17.7%) | 0 (0.0%) |
| $75,000 to $99,999 | 70 (19.3%) | 4 (3.0%) |
| $100,000 to $149,999 | 75 (20.7%) | 0 (0.0%) |
| $150,000 or more | 57 (15.8%) | 13 (9.8%) |
| Total | 362 (100.0%) | 133 (100.0%) |
Monthly Housing Cost Tiers in Lowell
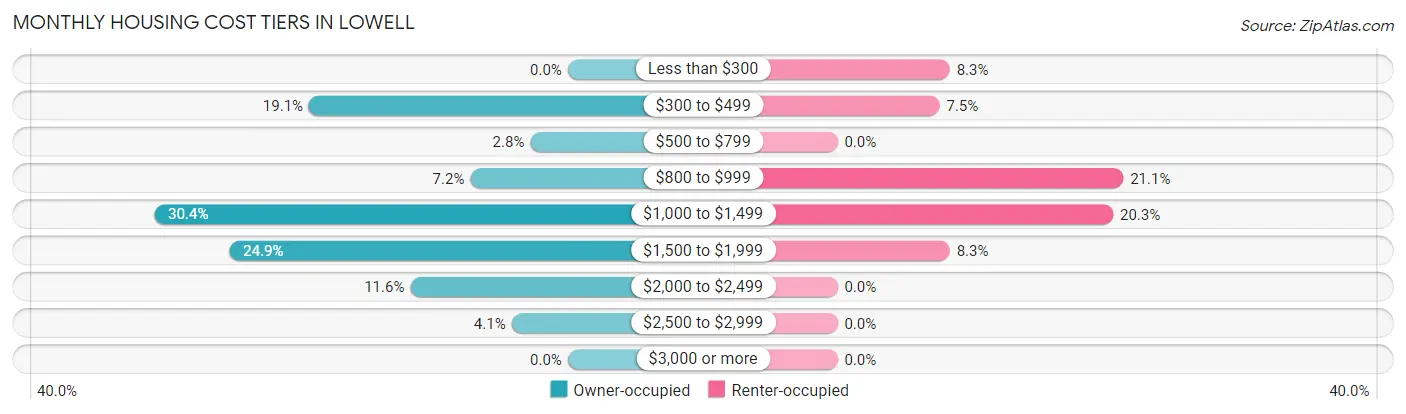
| Monthly Cost | Owner-occupied | Renter-occupied |
| Less than $300 | 0 (0.0%) | 11 (8.3%) |
| $300 to $499 | 69 (19.1%) | 10 (7.5%) |
| $500 to $799 | 10 (2.8%) | 0 (0.0%) |
| $800 to $999 | 26 (7.2%) | 28 (21.0%) |
| $1,000 to $1,499 | 110 (30.4%) | 27 (20.3%) |
| $1,500 to $1,999 | 90 (24.9%) | 11 (8.3%) |
| $2,000 to $2,499 | 42 (11.6%) | 0 (0.0%) |
| $2,500 to $2,999 | 15 (4.1%) | 0 (0.0%) |
| $3,000 or more | 0 (0.0%) | 0 (0.0%) |
| Total | 362 (100.0%) | 133 (100.0%) |
Physical Housing Characteristics in Lowell
Housing Structures in Lowell
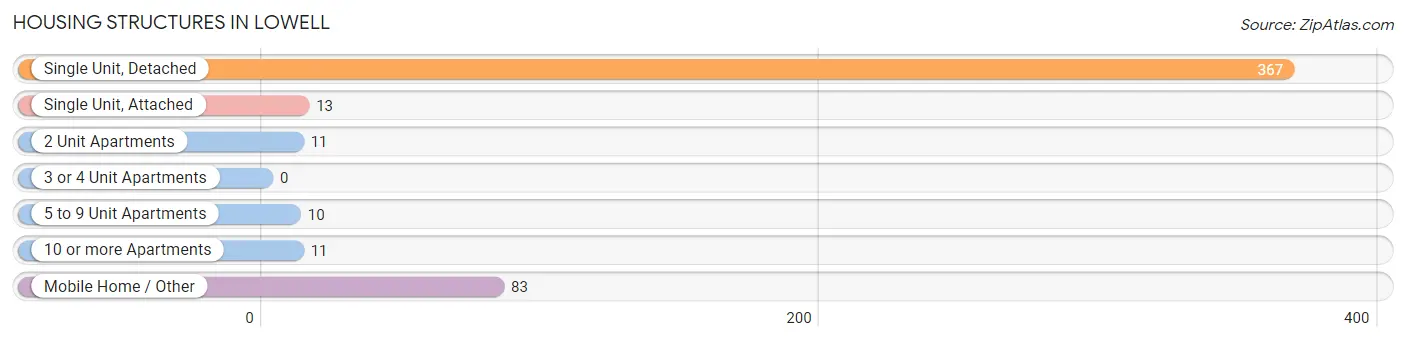
| Structure Type | # Housing Units | % Housing Units |
| Single Unit, Detached | 367 | 74.1% |
| Single Unit, Attached | 13 | 2.6% |
| 2 Unit Apartments | 11 | 2.2% |
| 3 or 4 Unit Apartments | 0 | 0.0% |
| 5 to 9 Unit Apartments | 10 | 2.0% |
| 10 or more Apartments | 11 | 2.2% |
| Mobile Home / Other | 83 | 16.8% |
| Total | 495 | 100.0% |
Housing Structures by Occupancy in Lowell
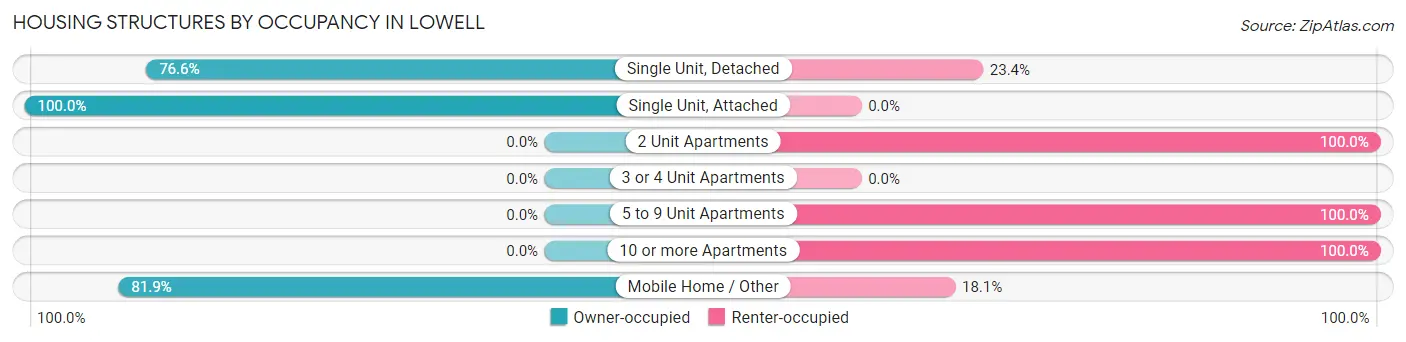
| Structure Type | Owner-occupied | Renter-occupied |
| Single Unit, Detached | 281 (76.6%) | 86 (23.4%) |
| Single Unit, Attached | 13 (100.0%) | 0 (0.0%) |
| 2 Unit Apartments | 0 (0.0%) | 11 (100.0%) |
| 3 or 4 Unit Apartments | 0 (0.0%) | 0 (0.0%) |
| 5 to 9 Unit Apartments | 0 (0.0%) | 10 (100.0%) |
| 10 or more Apartments | 0 (0.0%) | 11 (100.0%) |
| Mobile Home / Other | 68 (81.9%) | 15 (18.1%) |
| Total | 362 (73.1%) | 133 (26.9%) |
Housing Structures by Number of Rooms in Lowell
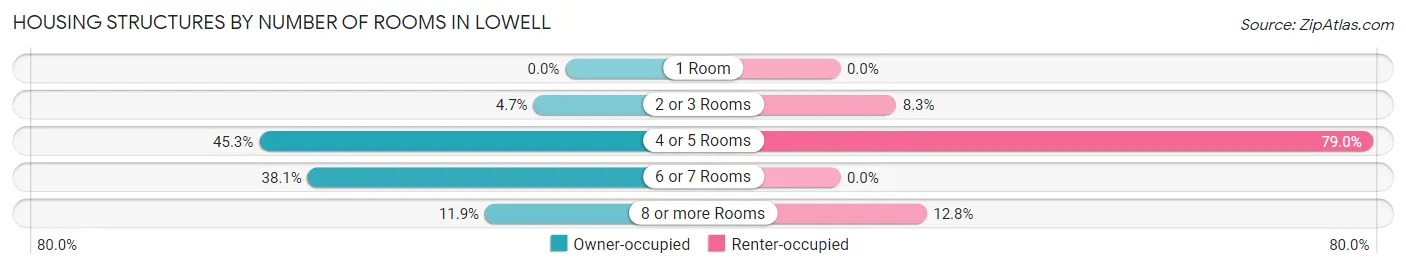
| Number of Rooms | Owner-occupied | Renter-occupied |
| 1 Room | 0 (0.0%) | 0 (0.0%) |
| 2 or 3 Rooms | 17 (4.7%) | 11 (8.3%) |
| 4 or 5 Rooms | 164 (45.3%) | 105 (78.9%) |
| 6 or 7 Rooms | 138 (38.1%) | 0 (0.0%) |
| 8 or more Rooms | 43 (11.9%) | 17 (12.8%) |
| Total | 362 (100.0%) | 133 (100.0%) |
Housing Structure by Heating Type in Lowell
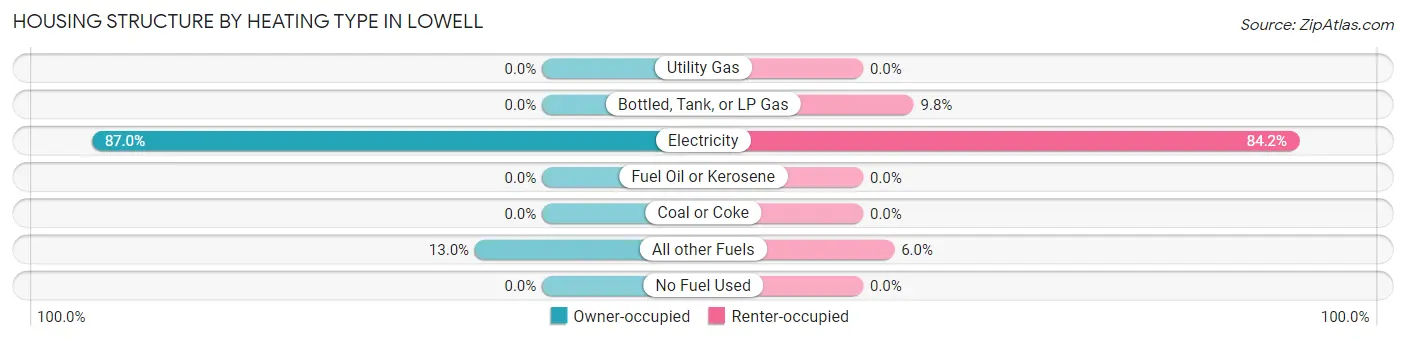
| Heating Type | Owner-occupied | Renter-occupied |
| Utility Gas | 0 (0.0%) | 0 (0.0%) |
| Bottled, Tank, or LP Gas | 0 (0.0%) | 13 (9.8%) |
| Electricity | 315 (87.0%) | 112 (84.2%) |
| Fuel Oil or Kerosene | 0 (0.0%) | 0 (0.0%) |
| Coal or Coke | 0 (0.0%) | 0 (0.0%) |
| All other Fuels | 47 (13.0%) | 8 (6.0%) |
| No Fuel Used | 0 (0.0%) | 0 (0.0%) |
| Total | 362 (100.0%) | 133 (100.0%) |
Household Vehicle Usage in Lowell
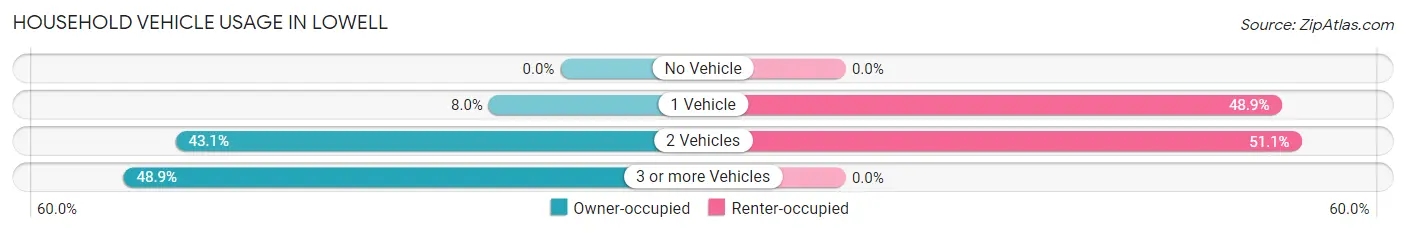
| Vehicles per Household | Owner-occupied | Renter-occupied |
| No Vehicle | 0 (0.0%) | 0 (0.0%) |
| 1 Vehicle | 29 (8.0%) | 65 (48.9%) |
| 2 Vehicles | 156 (43.1%) | 68 (51.1%) |
| 3 or more Vehicles | 177 (48.9%) | 0 (0.0%) |
| Total | 362 (100.0%) | 133 (100.0%) |
Real Estate & Mortgages in Lowell
Real Estate and Mortgage Overview in Lowell
| Characteristic | Without Mortgage | With Mortgage |
| Housing Units | 100 | 262 |
| Median Property Value | $280,800 | $269,600 |
| Median Household Income | $38,056 | $57 |
| Monthly Housing Costs | $457 | $0 |
| Real Estate Taxes | - | - |
Property Value by Mortgage Status in Lowell
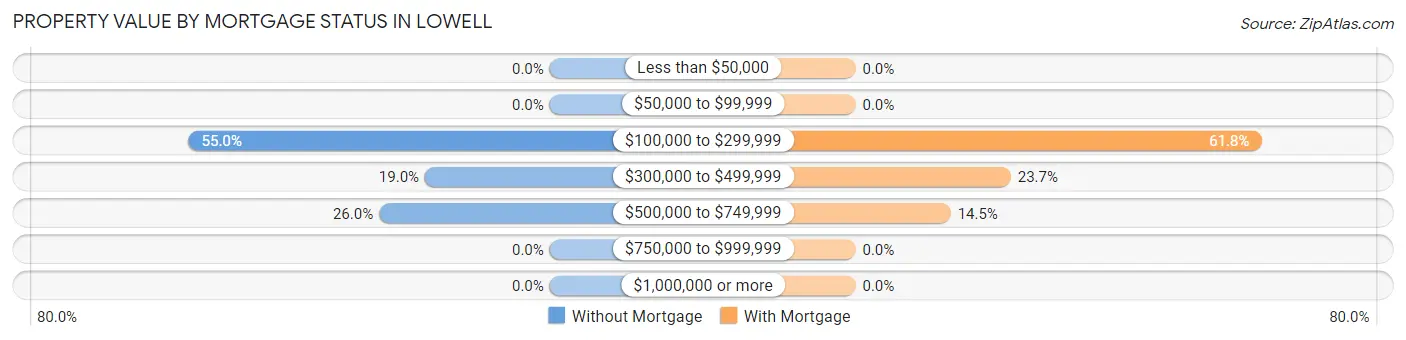
| Property Value | Without Mortgage | With Mortgage |
| Less than $50,000 | 0 (0.0%) | 0 (0.0%) |
| $50,000 to $99,999 | 0 (0.0%) | 0 (0.0%) |
| $100,000 to $299,999 | 55 (55.0%) | 162 (61.8%) |
| $300,000 to $499,999 | 19 (19.0%) | 62 (23.7%) |
| $500,000 to $749,999 | 26 (26.0%) | 38 (14.5%) |
| $750,000 to $999,999 | 0 (0.0%) | 0 (0.0%) |
| $1,000,000 or more | 0 (0.0%) | 0 (0.0%) |
| Total | 100 (100.0%) | 262 (100.0%) |
Household Income by Mortgage Status in Lowell
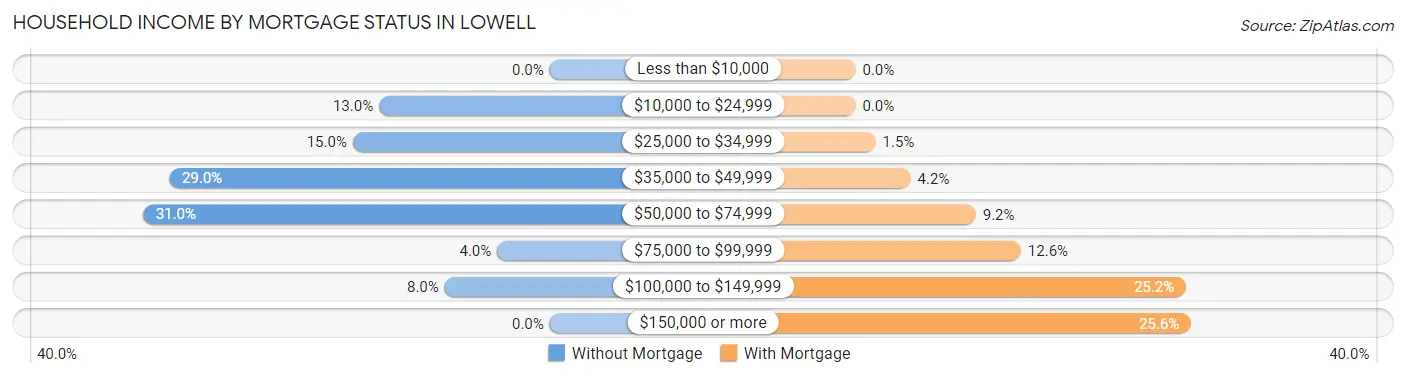
| Household Income | Without Mortgage | With Mortgage |
| Less than $10,000 | 0 (0.0%) | 0 (0.0%) |
| $10,000 to $24,999 | 13 (13.0%) | 0 (0.0%) |
| $25,000 to $34,999 | 15 (15.0%) | 4 (1.5%) |
| $35,000 to $49,999 | 29 (29.0%) | 11 (4.2%) |
| $50,000 to $74,999 | 31 (31.0%) | 24 (9.2%) |
| $75,000 to $99,999 | 4 (4.0%) | 33 (12.6%) |
| $100,000 to $149,999 | 8 (8.0%) | 66 (25.2%) |
| $150,000 or more | 0 (0.0%) | 67 (25.6%) |
| Total | 100 (100.0%) | 262 (100.0%) |
Property Value to Household Income Ratio in Lowell
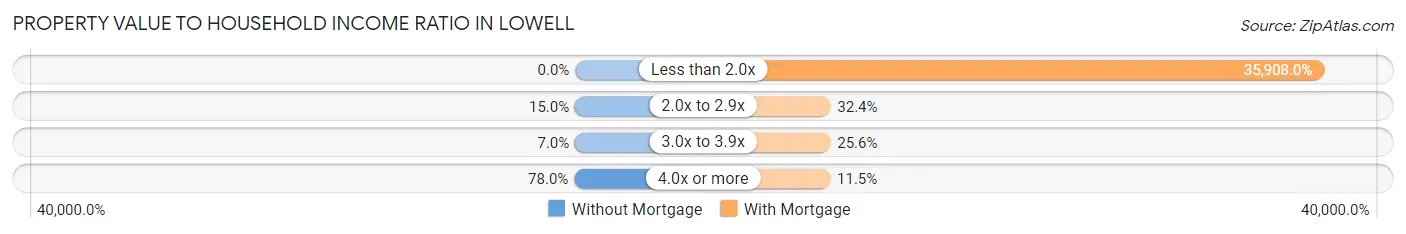
| Value-to-Income Ratio | Without Mortgage | With Mortgage |
| Less than 2.0x | 0 (0.0%) | 94,079 (35,908.0%) |
| 2.0x to 2.9x | 15 (15.0%) | 85 (32.4%) |
| 3.0x to 3.9x | 7 (7.0%) | 67 (25.6%) |
| 4.0x or more | 78 (78.0%) | 30 (11.5%) |
| Total | 100 (100.0%) | 262 (100.0%) |
Real Estate Taxes by Mortgage Status in Lowell
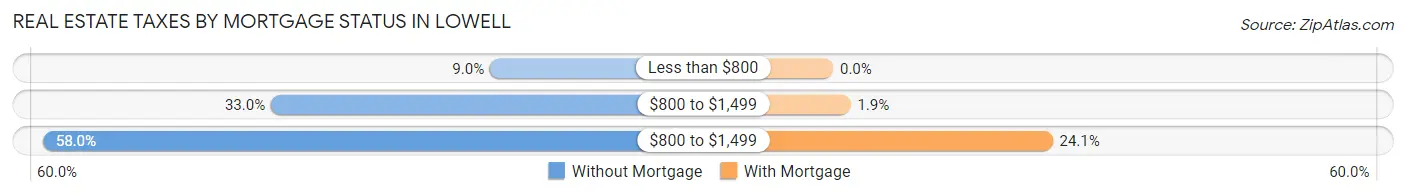
| Property Taxes | Without Mortgage | With Mortgage |
| Less than $800 | 9 (9.0%) | 0 (0.0%) |
| $800 to $1,499 | 33 (33.0%) | 5 (1.9%) |
| $800 to $1,499 | 58 (58.0%) | 63 (24.0%) |
| Total | 100 (100.0%) | 262 (100.0%) |
Health & Disability in Lowell
Health Insurance Coverage by Age in Lowell
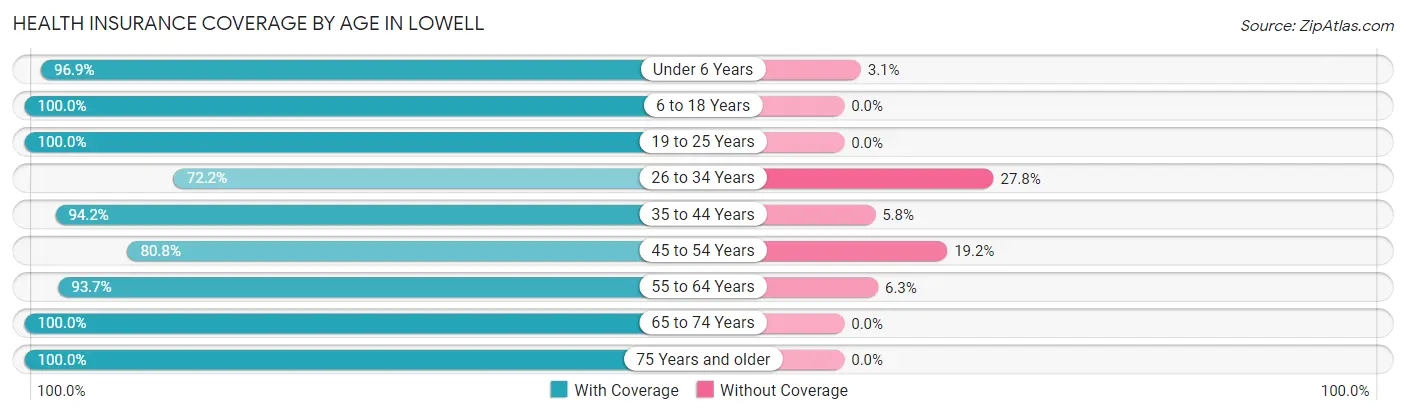
| Age Bracket | With Coverage | Without Coverage |
| Under 6 Years | 63 (96.9%) | 2 (3.1%) |
| 6 to 18 Years | 209 (100.0%) | 0 (0.0%) |
| 19 to 25 Years | 43 (100.0%) | 0 (0.0%) |
| 26 to 34 Years | 70 (72.2%) | 27 (27.8%) |
| 35 to 44 Years | 131 (94.2%) | 8 (5.8%) |
| 45 to 54 Years | 160 (80.8%) | 38 (19.2%) |
| 55 to 64 Years | 164 (93.7%) | 11 (6.3%) |
| 65 to 74 Years | 176 (100.0%) | 0 (0.0%) |
| 75 Years and older | 109 (100.0%) | 0 (0.0%) |
| Total | 1,125 (92.9%) | 86 (7.1%) |
Health Insurance Coverage by Citizenship Status in Lowell
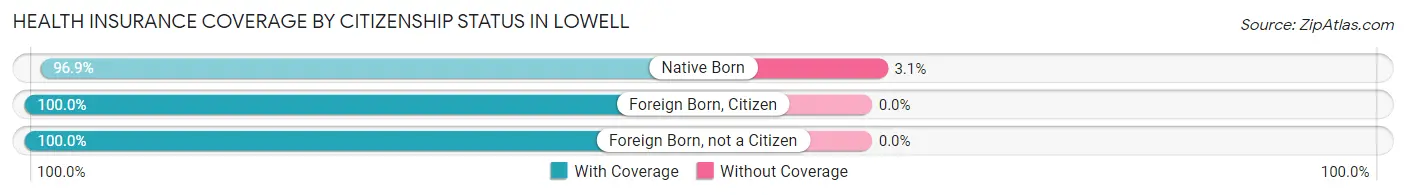
| Citizenship Status | With Coverage | Without Coverage |
| Native Born | 63 (96.9%) | 2 (3.1%) |
| Foreign Born, Citizen | 209 (100.0%) | 0 (0.0%) |
| Foreign Born, not a Citizen | 43 (100.0%) | 0 (0.0%) |
Health Insurance Coverage by Household Income in Lowell
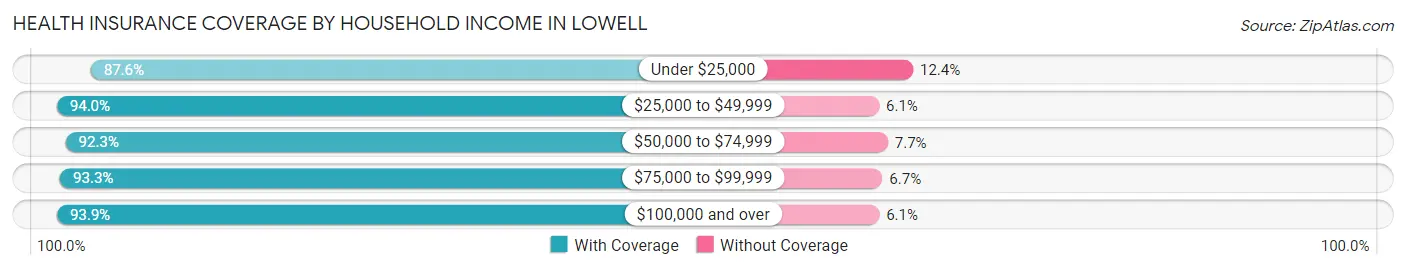
| Household Income | With Coverage | Without Coverage |
| Under $25,000 | 120 (87.6%) | 17 (12.4%) |
| $25,000 to $49,999 | 264 (94.0%) | 17 (6.0%) |
| $50,000 to $74,999 | 144 (92.3%) | 12 (7.7%) |
| $75,000 to $99,999 | 210 (93.3%) | 15 (6.7%) |
| $100,000 and over | 387 (93.9%) | 25 (6.1%) |
Public vs Private Health Insurance Coverage by Age in Lowell
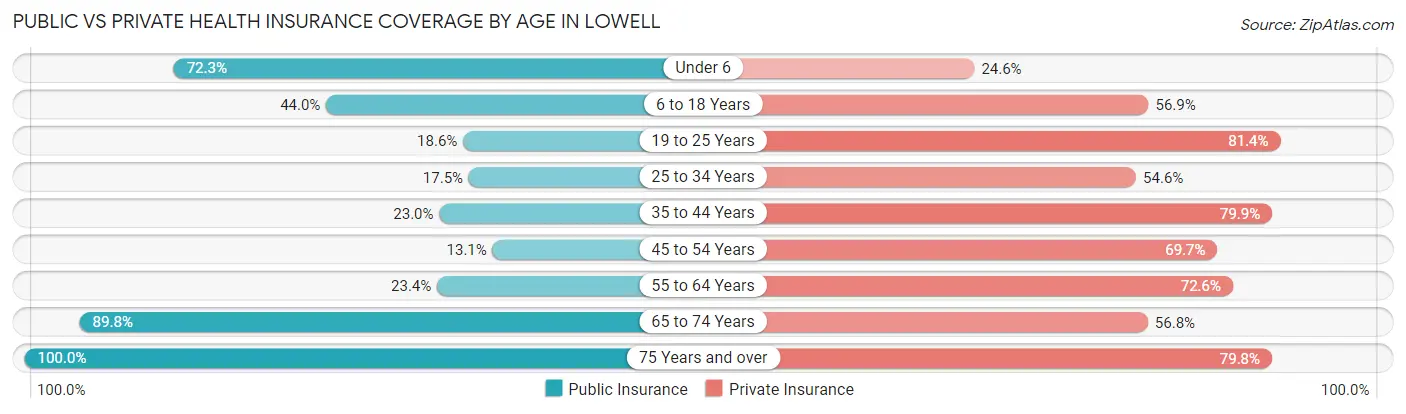
| Age Bracket | Public Insurance | Private Insurance |
| Under 6 | 47 (72.3%) | 16 (24.6%) |
| 6 to 18 Years | 92 (44.0%) | 119 (56.9%) |
| 19 to 25 Years | 8 (18.6%) | 35 (81.4%) |
| 25 to 34 Years | 17 (17.5%) | 53 (54.6%) |
| 35 to 44 Years | 32 (23.0%) | 111 (79.9%) |
| 45 to 54 Years | 26 (13.1%) | 138 (69.7%) |
| 55 to 64 Years | 41 (23.4%) | 127 (72.6%) |
| 65 to 74 Years | 158 (89.8%) | 100 (56.8%) |
| 75 Years and over | 109 (100.0%) | 87 (79.8%) |
| Total | 530 (43.8%) | 786 (64.9%) |
Disability Status by Sex by Age in Lowell
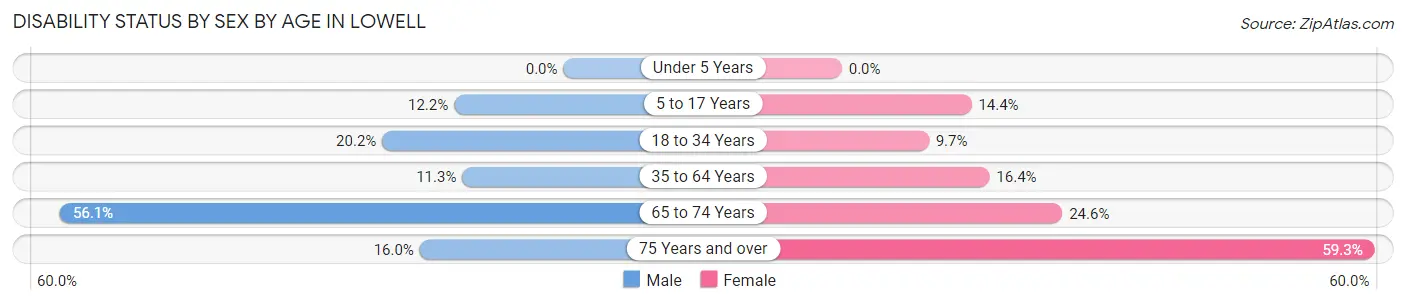
| Age Bracket | Male | Female |
| Under 5 Years | 0 (0.0%) | 0 (0.0%) |
| 5 to 17 Years | 14 (12.2%) | 13 (14.4%) |
| 18 to 34 Years | 22 (20.2%) | 6 (9.7%) |
| 35 to 64 Years | 33 (11.3%) | 36 (16.4%) |
| 65 to 74 Years | 37 (56.1%) | 27 (24.5%) |
| 75 Years and over | 8 (16.0%) | 35 (59.3%) |
Disability Class by Sex by Age in Lowell
Disability Class: Hearing Difficulty
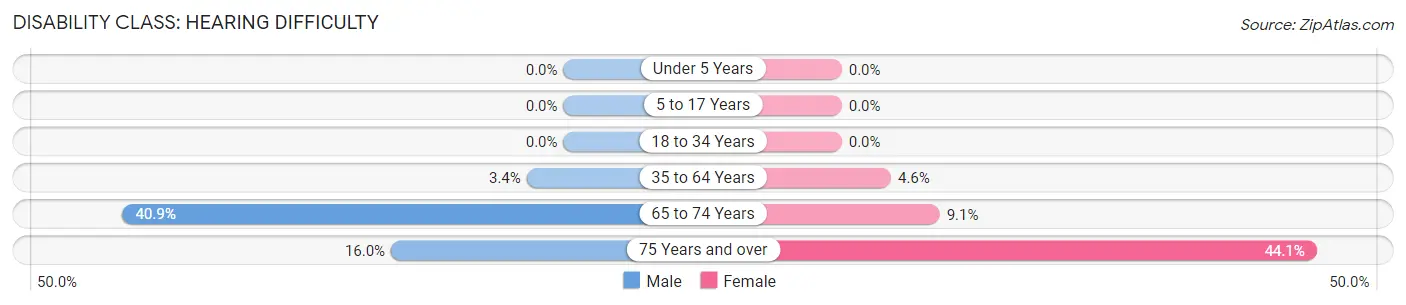
| Age Bracket | Male | Female |
| Under 5 Years | 0 (0.0%) | 0 (0.0%) |
| 5 to 17 Years | 0 (0.0%) | 0 (0.0%) |
| 18 to 34 Years | 0 (0.0%) | 0 (0.0%) |
| 35 to 64 Years | 10 (3.4%) | 10 (4.6%) |
| 65 to 74 Years | 27 (40.9%) | 10 (9.1%) |
| 75 Years and over | 8 (16.0%) | 26 (44.1%) |
Disability Class: Vision Difficulty
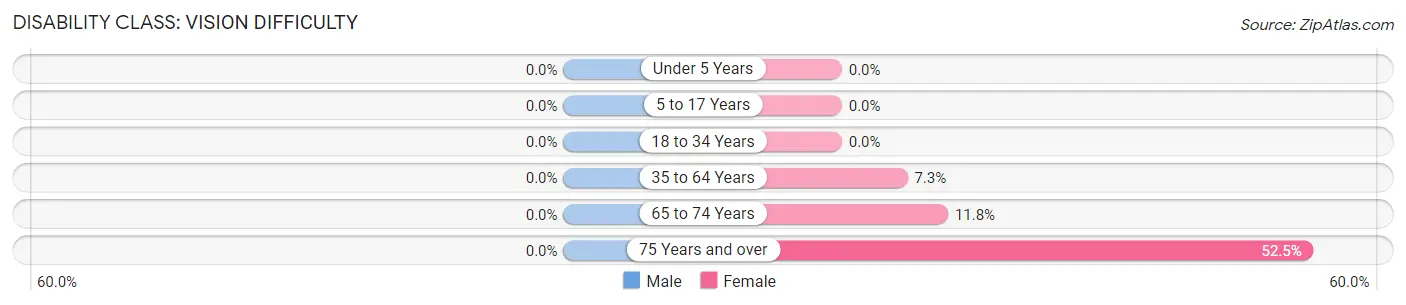
| Age Bracket | Male | Female |
| Under 5 Years | 0 (0.0%) | 0 (0.0%) |
| 5 to 17 Years | 0 (0.0%) | 0 (0.0%) |
| 18 to 34 Years | 0 (0.0%) | 0 (0.0%) |
| 35 to 64 Years | 0 (0.0%) | 16 (7.3%) |
| 65 to 74 Years | 0 (0.0%) | 13 (11.8%) |
| 75 Years and over | 0 (0.0%) | 31 (52.5%) |
Disability Class: Cognitive Difficulty
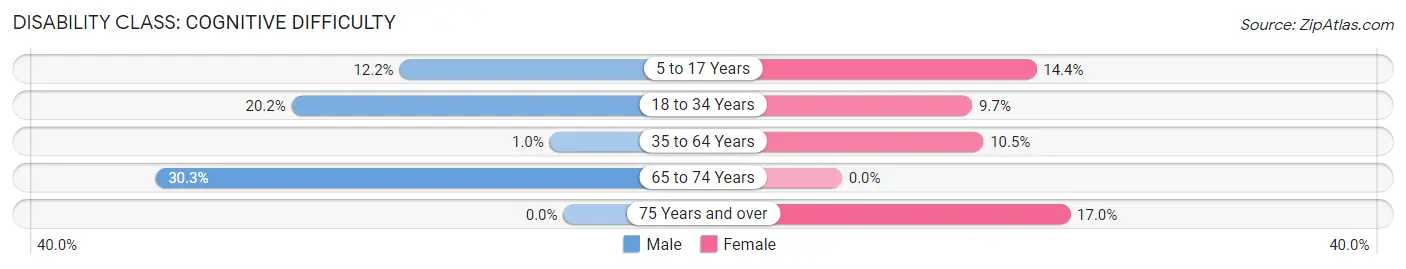
| Age Bracket | Male | Female |
| 5 to 17 Years | 14 (12.2%) | 13 (14.4%) |
| 18 to 34 Years | 22 (20.2%) | 6 (9.7%) |
| 35 to 64 Years | 3 (1.0%) | 23 (10.5%) |
| 65 to 74 Years | 20 (30.3%) | 0 (0.0%) |
| 75 Years and over | 0 (0.0%) | 10 (17.0%) |
Disability Class: Ambulatory Difficulty
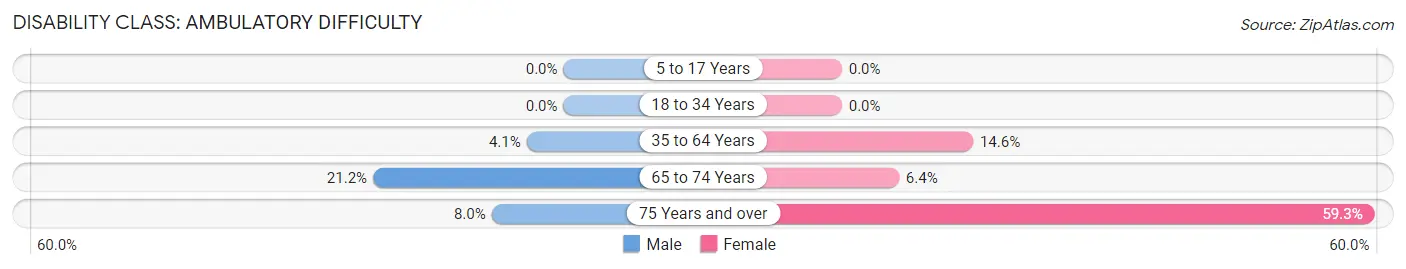
| Age Bracket | Male | Female |
| 5 to 17 Years | 0 (0.0%) | 0 (0.0%) |
| 18 to 34 Years | 0 (0.0%) | 0 (0.0%) |
| 35 to 64 Years | 12 (4.1%) | 32 (14.6%) |
| 65 to 74 Years | 14 (21.2%) | 7 (6.4%) |
| 75 Years and over | 4 (8.0%) | 35 (59.3%) |
Disability Class: Self-Care Difficulty
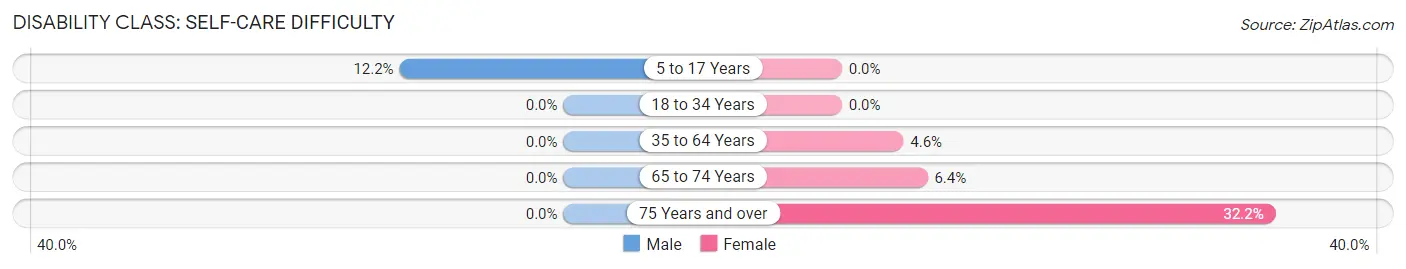
| Age Bracket | Male | Female |
| 5 to 17 Years | 14 (12.2%) | 0 (0.0%) |
| 18 to 34 Years | 0 (0.0%) | 0 (0.0%) |
| 35 to 64 Years | 0 (0.0%) | 10 (4.6%) |
| 65 to 74 Years | 0 (0.0%) | 7 (6.4%) |
| 75 Years and over | 0 (0.0%) | 19 (32.2%) |
Technology Access in Lowell
Computing Device Access in Lowell
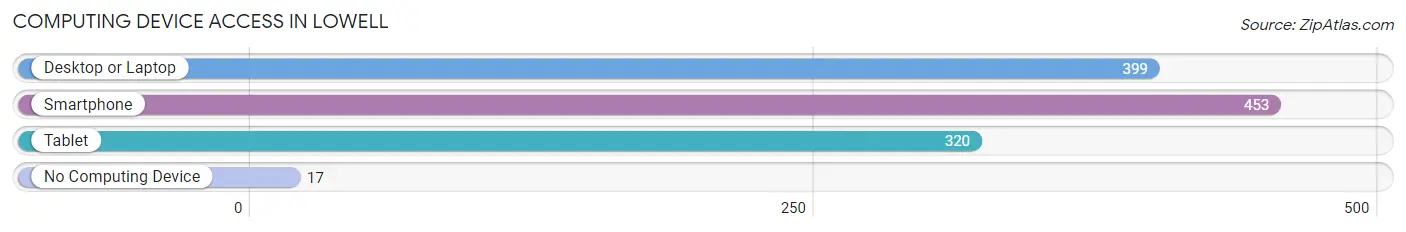
| Device Type | # Households | % Households |
| Desktop or Laptop | 399 | 80.6% |
| Smartphone | 453 | 91.5% |
| Tablet | 320 | 64.6% |
| No Computing Device | 17 | 3.4% |
| Total | 495 | 100.0% |
Internet Access in Lowell
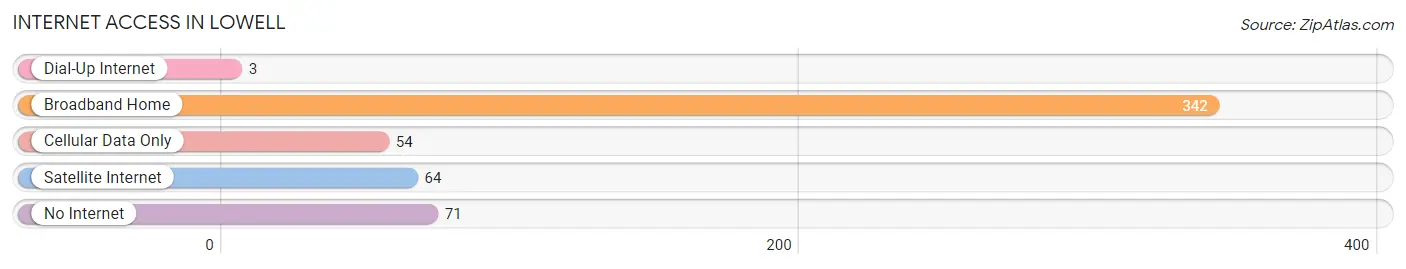
| Internet Type | # Households | % Households |
| Dial-Up Internet | 3 | 0.6% |
| Broadband Home | 342 | 69.1% |
| Cellular Data Only | 54 | 10.9% |
| Satellite Internet | 64 | 12.9% |
| No Internet | 71 | 14.3% |
| Total | 495 | 100.0% |
Lowell Summary
Lowell, Oregon is a small city located in Lane County, Oregon, United States. It is situated on the banks of the McKenzie River, about 20 miles east of Eugene. The population of Lowell was 1,845 at the 2010 census.
History
Lowell was founded in 1871 by a group of settlers from the Willamette Valley. The town was named after the nearby Lowell Creek, which was named after the poet James Russell Lowell. The first post office in Lowell was established in 1872.
In the late 19th century, Lowell was a thriving logging and mill town. The town was home to several sawmills, a grist mill, and a shingle mill. The town also had a hotel, a general store, and a blacksmith shop.
In the early 20th century, Lowell began to decline as the logging industry moved away from the area. The town was nearly abandoned by the 1950s.
In the late 20th century, Lowell began to experience a resurgence. The town was revitalized by the construction of the Lowell Covered Bridge in the 1970s. The bridge was built to provide access to the McKenzie River.
Geography
Lowell is located in the foothills of the Cascade Mountains, about 20 miles east of Eugene. The town is situated on the banks of the McKenzie River. The town is surrounded by forests and is home to several parks, including Lowell State Park and Lowell National Historic Site.
The climate in Lowell is mild and temperate. Summers are warm and dry, while winters are cool and wet.
Economy
Lowell’s economy is largely based on tourism. The town is home to several tourist attractions, including the Lowell Covered Bridge, Lowell State Park, and Lowell National Historic Site. The town also has several restaurants, shops, and lodging options.
The town is also home to several small businesses, including a sawmill, a grist mill, and a shingle mill.
Demographics
As of the 2010 census, the population of Lowell was 1,845. The racial makeup of the town was 94.3% White, 0.7% African American, 0.7% Native American, 0.7% Asian, 0.2% Pacific Islander, 0.7% from other races, and 2.5% from two or more races. Hispanic or Latino of any race were 2.2% of the population.
The median household income in Lowell was $41,250, and the median family income was $50,000. The per capita income in Lowell was $20,945. About 11.2% of families and 14.2% of the population were below the poverty line, including 18.2% of those under age 18 and 8.3% of those age 65 or over.
Common Questions
What is Per Capita Income in Lowell?
Per Capita income in Lowell is $39,498.
What is the Median Family Income in Lowell?
Median Family Income in Lowell is $78,750.
What is the Median Household income in Lowell?
Median Household Income in Lowell is $64,135.
What is Income or Wage Gap in Lowell?
Income or Wage Gap in Lowell is 26.3%.
Women in Lowell earn 73.7 cents for every dollar earned by a man.
What is Inequality or Gini Index in Lowell?
Inequality or Gini Index in Lowell is 0.51.
What is the Total Population of Lowell?
Total Population of Lowell is 1,211.
What is the Total Male Population of Lowell?
Total Male Population of Lowell is 661.
What is the Total Female Population of Lowell?
Total Female Population of Lowell is 550.
What is the Ratio of Males per 100 Females in Lowell?
There are 120.18 Males per 100 Females in Lowell.
What is the Ratio of Females per 100 Males in Lowell?
There are 83.21 Females per 100 Males in Lowell.
What is the Median Population Age in Lowell?
Median Population Age in Lowell is 48.8 Years.
What is the Average Family Size in Lowell
Average Family Size in Lowell is 2.8 People.
What is the Average Household Size in Lowell
Average Household Size in Lowell is 2.5 People.
How Large is the Labor Force in Lowell?
There are 527 People in the Labor Forcein in Lowell.
What is the Percentage of People in the Labor Force in Lowell?
53.6% of People are in the Labor Force in Lowell.
What is the Unemployment Rate in Lowell?
Unemployment Rate in Lowell is 2.1%.