Sublimity, OR Map & Demographics
Sublimity Map
Sublimity Overview
$39,078
PER CAPITA INCOME
$110,990
AVG FAMILY INCOME
$74,875
AVG HOUSEHOLD INCOME
2.8%
WAGE / INCOME GAP [ % ]
97.2¢/ $1
WAGE / INCOME GAP [ $ ]
0.43
INEQUALITY / GINI INDEX
2,945
TOTAL POPULATION
1,471
MALE POPULATION
1,474
FEMALE POPULATION
99.80
MALES / 100 FEMALES
100.20
FEMALES / 100 MALES
51.8
MEDIAN AGE
2.8
AVG FAMILY SIZE
2.2
AVG HOUSEHOLD SIZE
1,044
LABOR FORCE [ PEOPLE ]
43.9%
PERCENT IN LABOR FORCE
2.5%
UNEMPLOYMENT RATE
Sublimity Zip Codes
Income in Sublimity
Income Overview in Sublimity
Per Capita Income in Sublimity is $39,078, while median incomes of families and households are $110,990 and $74,875 respectively.
| Characteristic | Number | Measure |
| Per Capita Income | 2,945 | $39,078 |
| Median Family Income | 753 | $110,990 |
| Mean Family Income | 753 | $119,696 |
| Median Household Income | 1,282 | $74,875 |
| Mean Household Income | 1,282 | $88,824 |
| Income Deficit | 753 | $0 |
| Wage / Income Gap (%) | 2,945 | 2.84% |
| Wage / Income Gap ($) | 2,945 | 97.16¢ per $1 |
| Gini / Inequality Index | 2,945 | 0.43 |
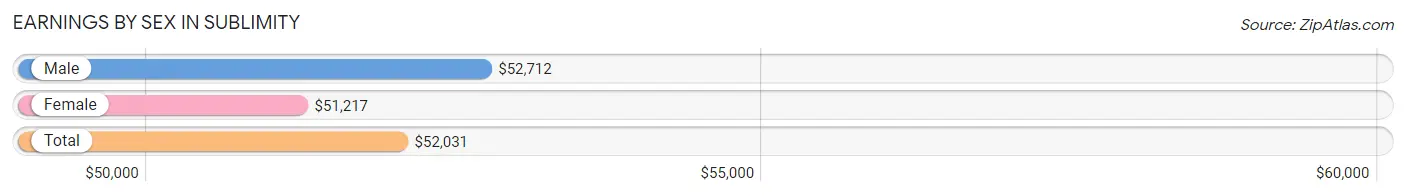
Earnings by Sex in Sublimity
Average Earnings in Sublimity are $52,031, $52,712 for men and $51,217 for women, a difference of 2.8%.
| Sex | Number | Average Earnings |
| Male | 683 (59.4%) | $52,712 |
| Female | 467 (40.6%) | $51,217 |
| Total | 1,150 (100.0%) | $52,031 |
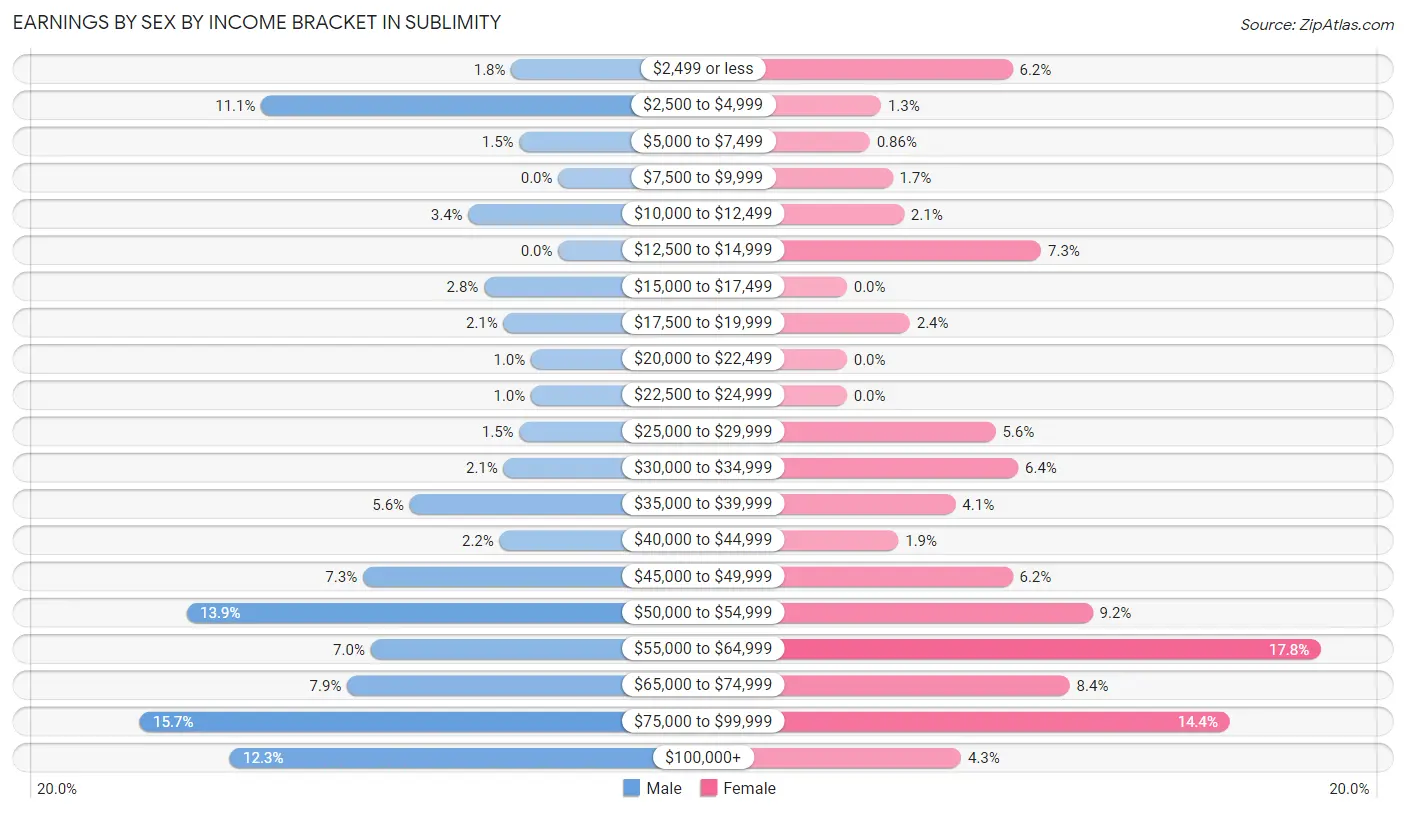
Earnings by Sex by Income Bracket in Sublimity
The most common earnings brackets in Sublimity are $75,000 to $99,999 for men (107 | 15.7%) and $55,000 to $64,999 for women (83 | 17.8%).
| Income | Male | Female |
| $2,499 or less | 12 (1.8%) | 29 (6.2%) |
| $2,500 to $4,999 | 76 (11.1%) | 6 (1.3%) |
| $5,000 to $7,499 | 10 (1.5%) | 4 (0.9%) |
| $7,500 to $9,999 | 0 (0.0%) | 8 (1.7%) |
| $10,000 to $12,499 | 23 (3.4%) | 10 (2.1%) |
| $12,500 to $14,999 | 0 (0.0%) | 34 (7.3%) |
| $15,000 to $17,499 | 19 (2.8%) | 0 (0.0%) |
| $17,500 to $19,999 | 14 (2.1%) | 11 (2.4%) |
| $20,000 to $22,499 | 7 (1.0%) | 0 (0.0%) |
| $22,500 to $24,999 | 7 (1.0%) | 0 (0.0%) |
| $25,000 to $29,999 | 10 (1.5%) | 26 (5.6%) |
| $30,000 to $34,999 | 14 (2.1%) | 30 (6.4%) |
| $35,000 to $39,999 | 38 (5.6%) | 19 (4.1%) |
| $40,000 to $44,999 | 15 (2.2%) | 9 (1.9%) |
| $45,000 to $49,999 | 50 (7.3%) | 29 (6.2%) |
| $50,000 to $54,999 | 95 (13.9%) | 43 (9.2%) |
| $55,000 to $64,999 | 48 (7.0%) | 83 (17.8%) |
| $65,000 to $74,999 | 54 (7.9%) | 39 (8.4%) |
| $75,000 to $99,999 | 107 (15.7%) | 67 (14.3%) |
| $100,000+ | 84 (12.3%) | 20 (4.3%) |
| Total | 683 (100.0%) | 467 (100.0%) |
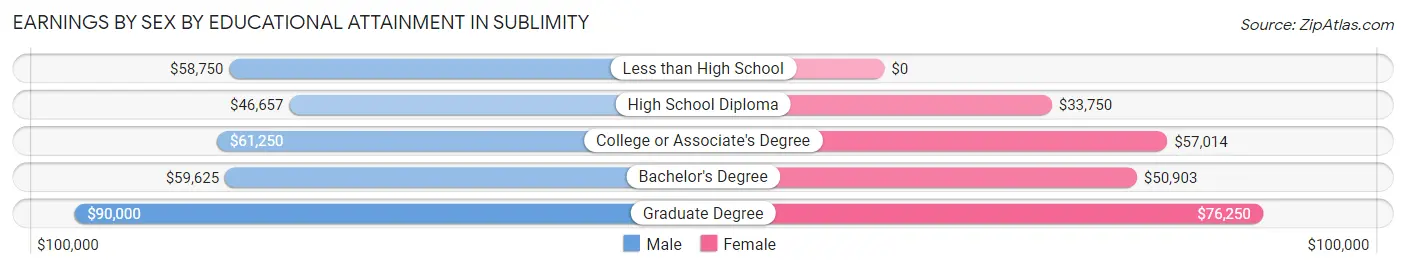
Earnings by Sex by Educational Attainment in Sublimity
Average earnings in Sublimity are $55,000 for men and $52,467 for women, a difference of 4.6%. Men with an educational attainment of graduate degree enjoy the highest average annual earnings of $90,000, while those with high school diploma education earn the least with $46,657. Women with an educational attainment of graduate degree earn the most with the average annual earnings of $76,250, while those with high school diploma education have the smallest earnings of $33,750.
| Educational Attainment | Male Income | Female Income |
| Less than High School | $58,750 | $0 |
| High School Diploma | $46,657 | $33,750 |
| College or Associate's Degree | $61,250 | $57,014 |
| Bachelor's Degree | $59,625 | $50,903 |
| Graduate Degree | $90,000 | $76,250 |
| Total | $55,000 | $52,467 |
Family Income in Sublimity
Family Income Brackets in Sublimity
According to the Sublimity family income data, there are 220 families falling into the $100,000 to $149,999 income range, which is the most common income bracket and makes up 29.2% of all families.
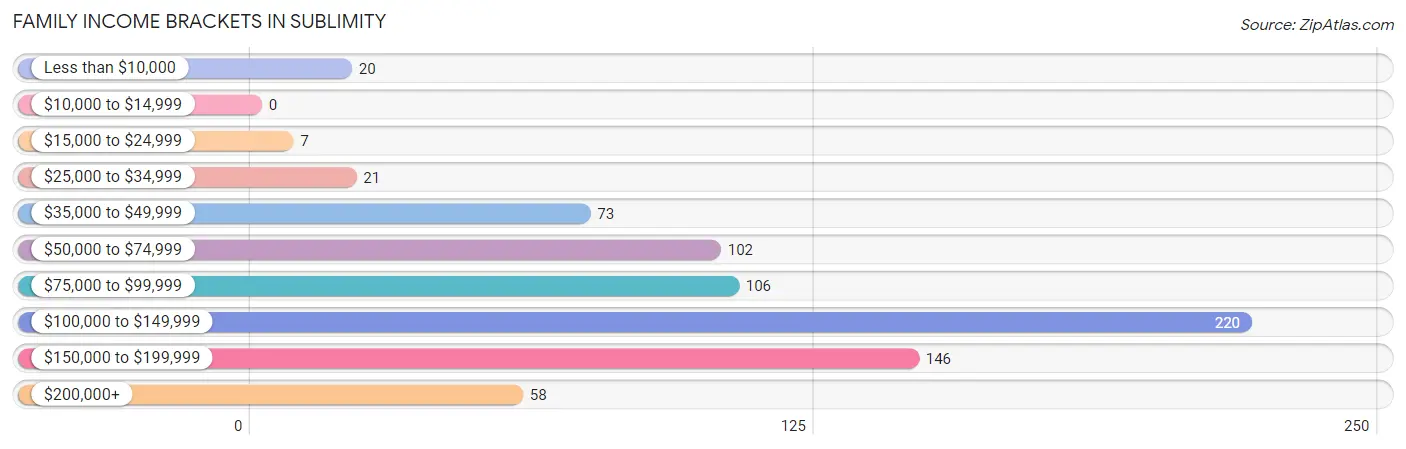
| Income Bracket | # Families | % Families |
| Less than $10,000 | 20 | 2.7% |
| $10,000 to $14,999 | 0 | 0.0% |
| $15,000 to $24,999 | 7 | 0.9% |
| $25,000 to $34,999 | 21 | 2.8% |
| $35,000 to $49,999 | 73 | 9.7% |
| $50,000 to $74,999 | 102 | 13.5% |
| $75,000 to $99,999 | 106 | 14.1% |
| $100,000 to $149,999 | 220 | 29.2% |
| $150,000 to $199,999 | 146 | 19.4% |
| $200,000+ | 58 | 7.7% |
Family Income by Famaliy Size in Sublimity
4-person families (114 | 15.1%) account for the highest median family income in Sublimity with $114,167 per family, while 2-person families (445 | 59.1%) have the highest median income of $47,153 per family member.
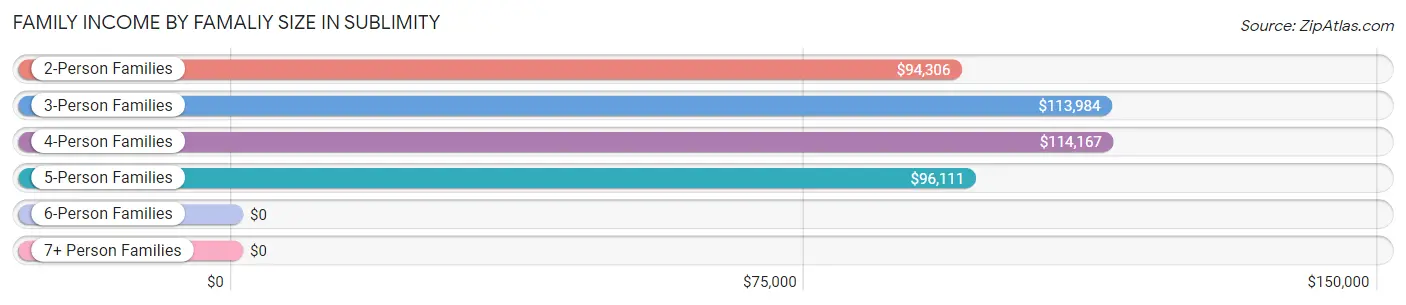
| Income Bracket | # Families | Median Income |
| 2-Person Families | 445 (59.1%) | $94,306 |
| 3-Person Families | 99 (13.2%) | $113,984 |
| 4-Person Families | 114 (15.1%) | $114,167 |
| 5-Person Families | 82 (10.9%) | $96,111 |
| 6-Person Families | 9 (1.2%) | $0 |
| 7+ Person Families | 4 (0.5%) | $0 |
| Total | 753 (100.0%) | $110,990 |
Family Income by Number of Earners in Sublimity
The median family income in Sublimity is $110,990, with families comprising 3+ earners (27) having the highest median family income of $203,438, while families with no earners (213) have the lowest median family income of $67,250, accounting for 3.6% and 28.3% of families, respectively.
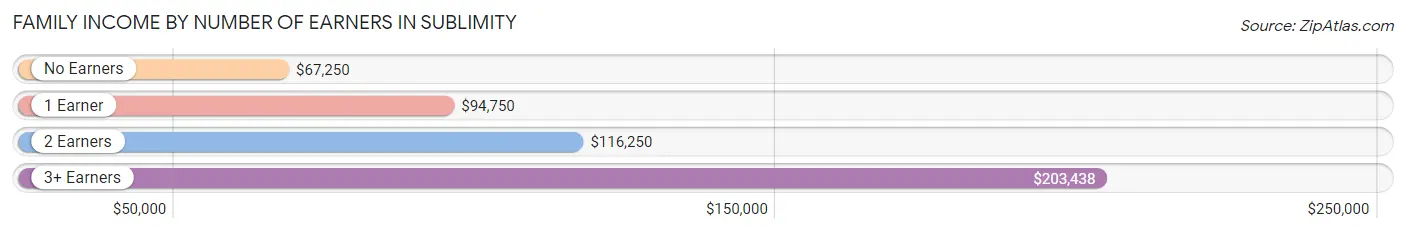
| Number of Earners | # Families | Median Income |
| No Earners | 213 (28.3%) | $67,250 |
| 1 Earner | 197 (26.2%) | $94,750 |
| 2 Earners | 316 (42.0%) | $116,250 |
| 3+ Earners | 27 (3.6%) | $203,438 |
| Total | 753 (100.0%) | $110,990 |
Household Income in Sublimity
Household Income Brackets in Sublimity
With 286 households falling in the category, the $100,000 to $149,999 income range is the most frequent in Sublimity, accounting for 22.3% of all households. In contrast, only 56 households (4.4%) fall into the less than $10,000 income bracket, making it the least populous group.
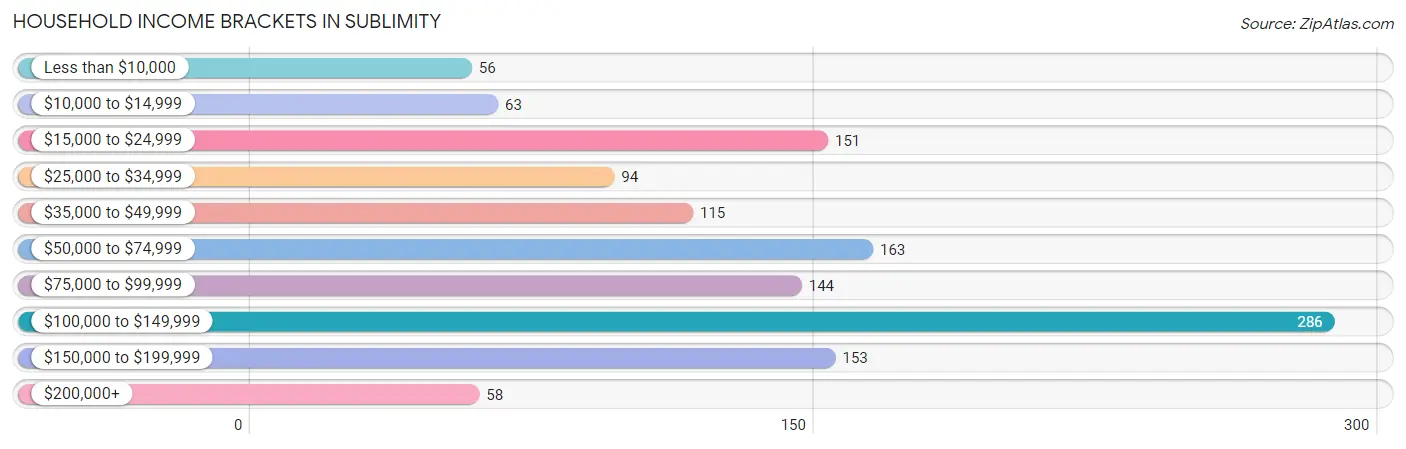
| Income Bracket | # Households | % Households |
| Less than $10,000 | 56 | 4.4% |
| $10,000 to $14,999 | 63 | 4.9% |
| $15,000 to $24,999 | 151 | 11.8% |
| $25,000 to $34,999 | 94 | 7.3% |
| $35,000 to $49,999 | 115 | 9.0% |
| $50,000 to $74,999 | 163 | 12.7% |
| $75,000 to $99,999 | 144 | 11.2% |
| $100,000 to $149,999 | 286 | 22.3% |
| $150,000 to $199,999 | 153 | 11.9% |
| $200,000+ | 58 | 4.5% |
Household Income by Householder Age in Sublimity
The median household income in Sublimity is $74,875, with the highest median household income of $113,750 found in the 45 to 64 years age bracket for the primary householder. A total of 384 households (29.9%) fall into this category.
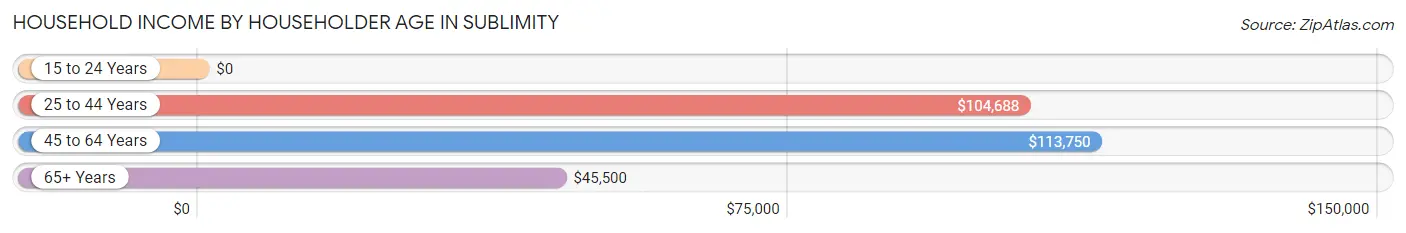
| Income Bracket | # Households | Median Income |
| 15 to 24 Years | 0 (0.0%) | $0 |
| 25 to 44 Years | 238 (18.6%) | $104,688 |
| 45 to 64 Years | 384 (29.9%) | $113,750 |
| 65+ Years | 660 (51.5%) | $45,500 |
| Total | 1,282 (100.0%) | $74,875 |
Poverty in Sublimity
Income Below Poverty by Sex and Age in Sublimity
With 5.9% poverty level for males and 9.3% for females among the residents of Sublimity, 6 to 11 year old males and 18 to 24 year old females are the most vulnerable to poverty, with 11 males (12.5%) and 27 females (62.8%) in their respective age groups living below the poverty level.
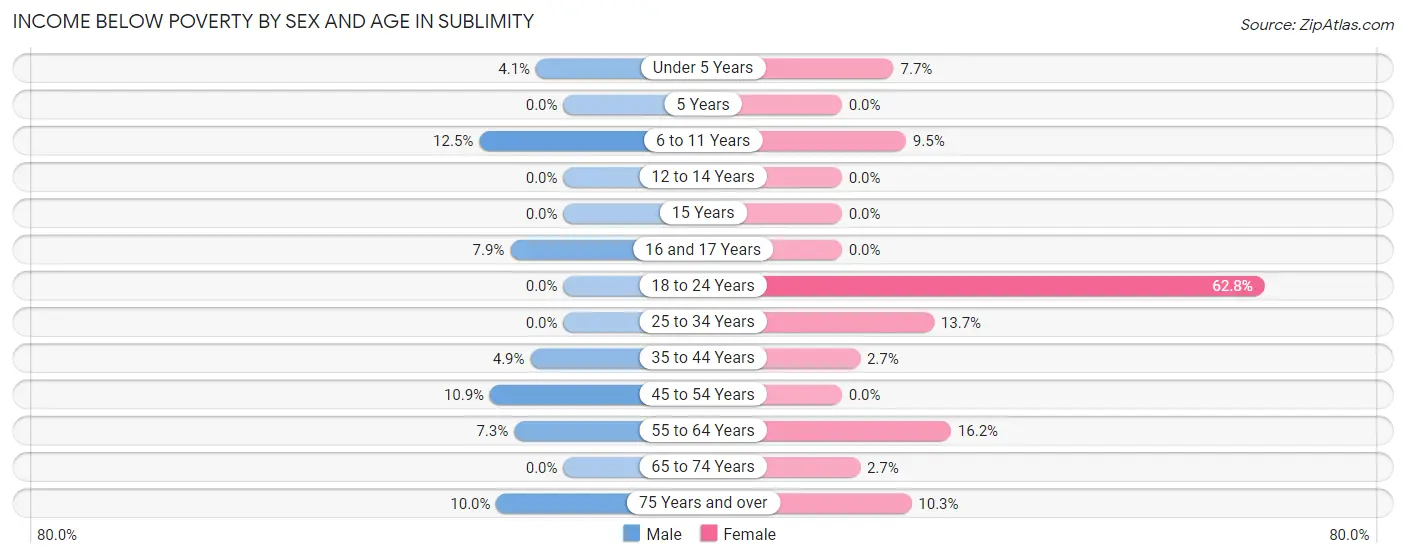
| Age Bracket | Male | Female |
| Under 5 Years | 5 (4.1%) | 7 (7.7%) |
| 5 Years | 0 (0.0%) | 0 (0.0%) |
| 6 to 11 Years | 11 (12.5%) | 6 (9.5%) |
| 12 to 14 Years | 0 (0.0%) | 0 (0.0%) |
| 15 Years | 0 (0.0%) | 0 (0.0%) |
| 16 and 17 Years | 6 (7.9%) | 0 (0.0%) |
| 18 to 24 Years | 0 (0.0%) | 27 (62.8%) |
| 25 to 34 Years | 0 (0.0%) | 16 (13.7%) |
| 35 to 44 Years | 7 (4.9%) | 4 (2.7%) |
| 45 to 54 Years | 23 (10.9%) | 0 (0.0%) |
| 55 to 64 Years | 12 (7.3%) | 29 (16.2%) |
| 65 to 74 Years | 0 (0.0%) | 6 (2.7%) |
| 75 Years and over | 19 (10.0%) | 34 (10.3%) |
| Total | 83 (5.9%) | 129 (9.3%) |
Income Above Poverty by Sex and Age in Sublimity
According to the poverty statistics in Sublimity, males aged 5 years and females aged 5 years are the age groups that are most secure financially, with 100.0% of males and 100.0% of females in these age groups living above the poverty line.
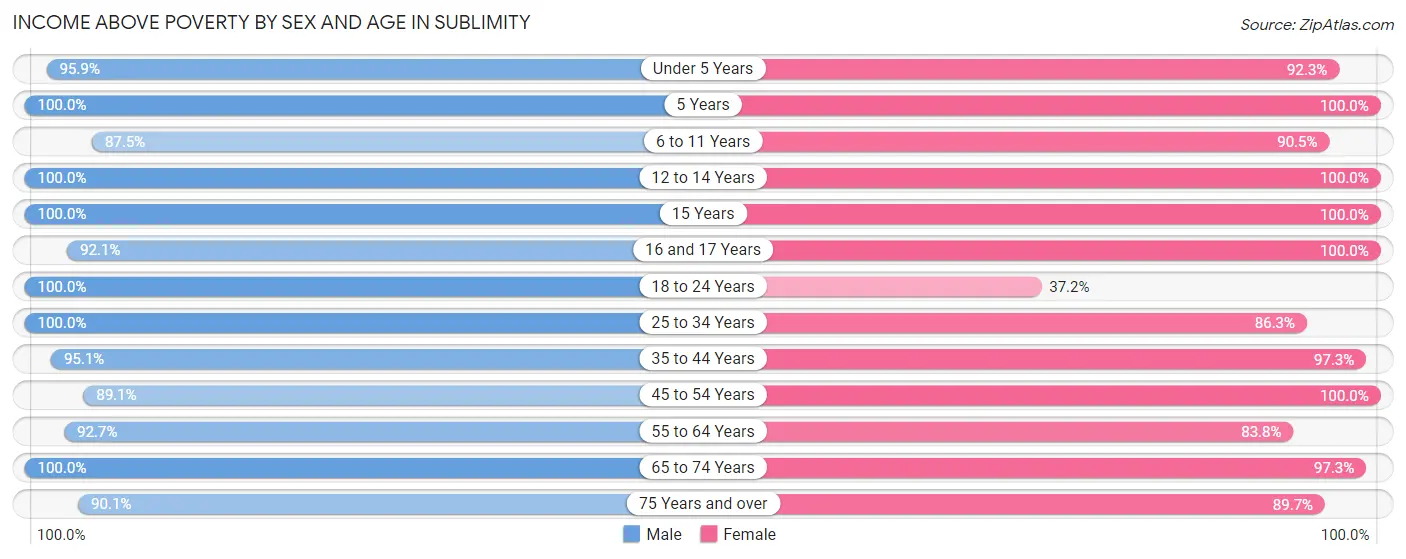
| Age Bracket | Male | Female |
| Under 5 Years | 118 (95.9%) | 84 (92.3%) |
| 5 Years | 6 (100.0%) | 2 (100.0%) |
| 6 to 11 Years | 77 (87.5%) | 57 (90.5%) |
| 12 to 14 Years | 61 (100.0%) | 59 (100.0%) |
| 15 Years | 40 (100.0%) | 8 (100.0%) |
| 16 and 17 Years | 70 (92.1%) | 21 (100.0%) |
| 18 to 24 Years | 33 (100.0%) | 16 (37.2%) |
| 25 to 34 Years | 110 (100.0%) | 101 (86.3%) |
| 35 to 44 Years | 136 (95.1%) | 144 (97.3%) |
| 45 to 54 Years | 188 (89.1%) | 101 (100.0%) |
| 55 to 64 Years | 152 (92.7%) | 150 (83.8%) |
| 65 to 74 Years | 166 (100.0%) | 216 (97.3%) |
| 75 Years and over | 172 (90.0%) | 295 (89.7%) |
| Total | 1,329 (94.1%) | 1,254 (90.7%) |
Income Below Poverty Among Married-Couple Families in Sublimity
The poverty statistics for married-couple families in Sublimity show that 0.6% or 4 of the total 654 families live below the poverty line. Families with 1 or 2 children have the highest poverty rate of 2.0%, comprising of 4 families. On the other hand, families with no children have the lowest poverty rate of 0.0%, which includes 0 families.
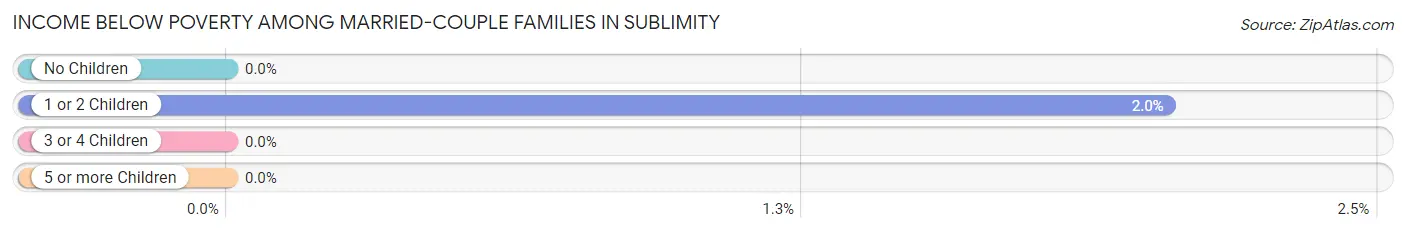
| Children | Above Poverty | Below Poverty |
| No Children | 396 (100.0%) | 0 (0.0%) |
| 1 or 2 Children | 192 (98.0%) | 4 (2.0%) |
| 3 or 4 Children | 58 (100.0%) | 0 (0.0%) |
| 5 or more Children | 4 (100.0%) | 0 (0.0%) |
| Total | 650 (99.4%) | 4 (0.6%) |
Income Below Poverty Among Single-Parent Households in Sublimity
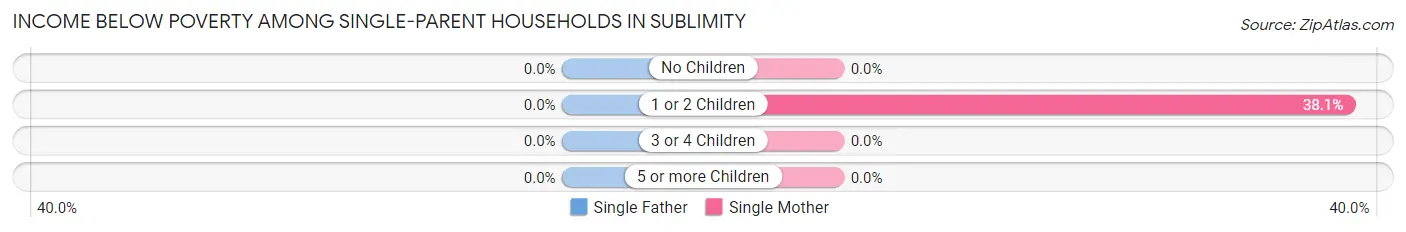
| Children | Single Father | Single Mother |
| No Children | 0 (0.0%) | 0 (0.0%) |
| 1 or 2 Children | 0 (0.0%) | 16 (38.1%) |
| 3 or 4 Children | 0 (0.0%) | 0 (0.0%) |
| 5 or more Children | 0 (0.0%) | 0 (0.0%) |
| Total | 0 (0.0%) | 16 (21.9%) |
Income Below Poverty Among Married-Couple vs Single-Parent Households in Sublimity
The poverty data for Sublimity shows that 4 of the married-couple family households (0.6%) and 16 of the single-parent households (16.2%) are living below the poverty level. Within the married-couple family households, those with 1 or 2 children have the highest poverty rate, with 4 households (2.0%) falling below the poverty line. Among the single-parent households, those with 1 or 2 children have the highest poverty rate, with 16 household (32.7%) living below poverty.
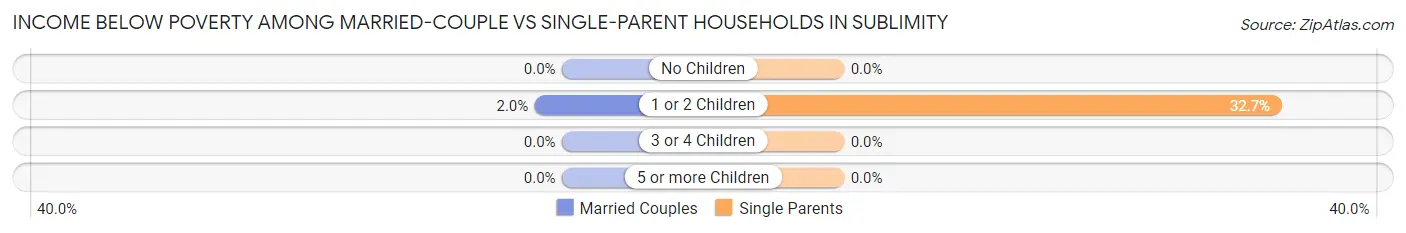
| Children | Married-Couple Families | Single-Parent Households |
| No Children | 0 (0.0%) | 0 (0.0%) |
| 1 or 2 Children | 4 (2.0%) | 16 (32.7%) |
| 3 or 4 Children | 0 (0.0%) | 0 (0.0%) |
| 5 or more Children | 0 (0.0%) | 0 (0.0%) |
| Total | 4 (0.6%) | 16 (16.2%) |
Race in Sublimity
The most populous races in Sublimity are White / Caucasian (2,588 | 87.9%), Hispanic or Latino (294 | 10.0%), and Some other Race (193 | 6.6%).
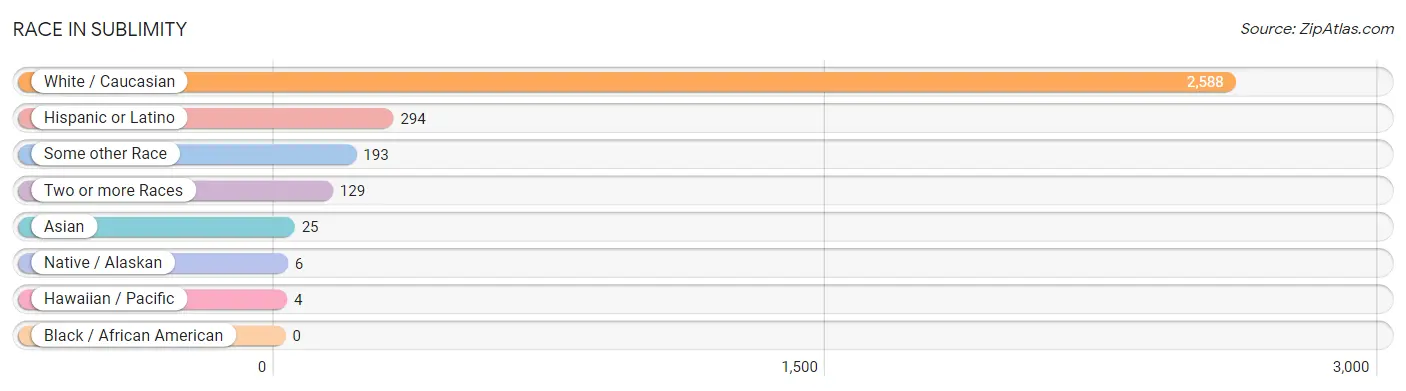
| Race | # Population | % Population |
| Asian | 25 | 0.9% |
| Black / African American | 0 | 0.0% |
| Hawaiian / Pacific | 4 | 0.1% |
| Hispanic or Latino | 294 | 10.0% |
| Native / Alaskan | 6 | 0.2% |
| White / Caucasian | 2,588 | 87.9% |
| Two or more Races | 129 | 4.4% |
| Some other Race | 193 | 6.6% |
| Total | 2,945 | 100.0% |
Ancestry in Sublimity
The most populous ancestries reported in Sublimity are German (819 | 27.8%), English (421 | 14.3%), Irish (336 | 11.4%), Mexican (265 | 9.0%), and Italian (139 | 4.7%), together accounting for 67.2% of all Sublimity residents.
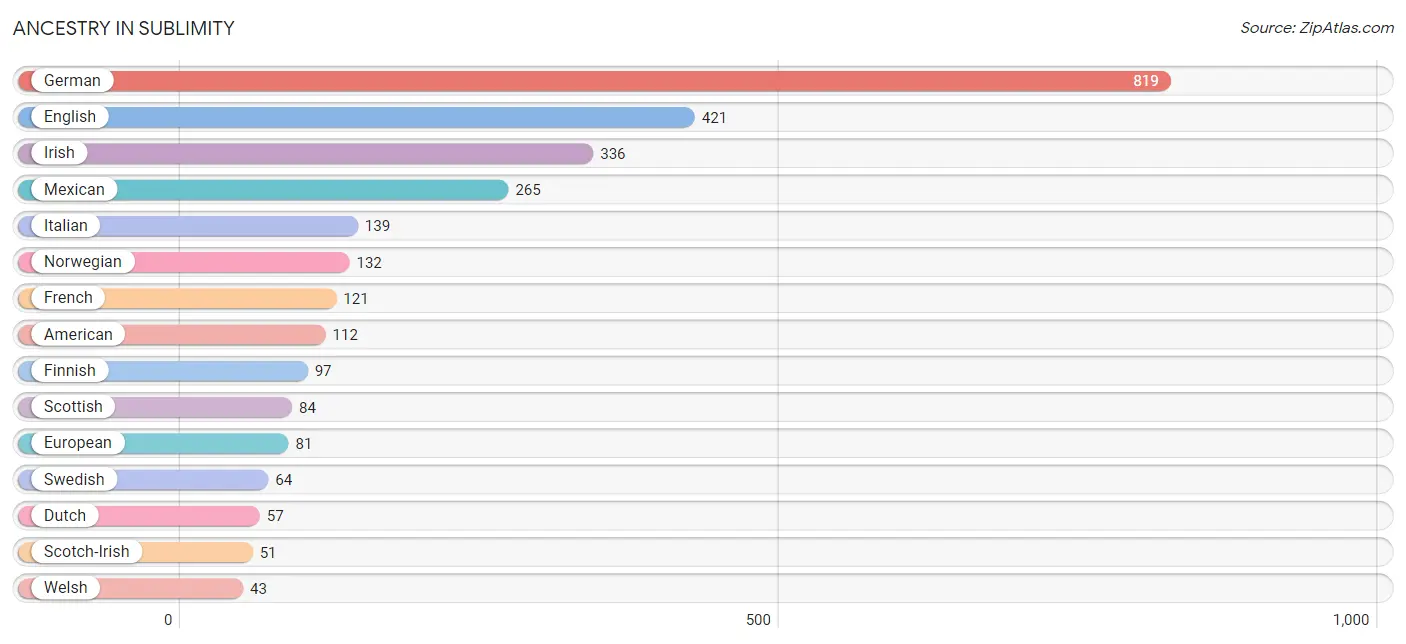
| Ancestry | # Population | % Population |
| American | 112 | 3.8% |
| Belgian | 14 | 0.5% |
| Bhutanese | 11 | 0.4% |
| British | 5 | 0.2% |
| Burmese | 18 | 0.6% |
| Canadian | 3 | 0.1% |
| Cherokee | 34 | 1.1% |
| Czech | 5 | 0.2% |
| Czechoslovakian | 6 | 0.2% |
| Danish | 14 | 0.5% |
| Dutch | 57 | 1.9% |
| Eastern European | 36 | 1.2% |
| English | 421 | 14.3% |
| European | 81 | 2.8% |
| Finnish | 97 | 3.3% |
| French | 121 | 4.1% |
| French Canadian | 32 | 1.1% |
| German | 819 | 27.8% |
| Hungarian | 10 | 0.3% |
| Irish | 336 | 11.4% |
| Italian | 139 | 4.7% |
| Korean | 7 | 0.2% |
| Mexican | 265 | 9.0% |
| Native Hawaiian | 4 | 0.1% |
| Northern European | 15 | 0.5% |
| Norwegian | 132 | 4.5% |
| Polish | 5 | 0.2% |
| Portuguese | 16 | 0.5% |
| Russian | 27 | 0.9% |
| Scandinavian | 16 | 0.5% |
| Scotch-Irish | 51 | 1.7% |
| Scottish | 84 | 2.9% |
| Sioux | 2 | 0.1% |
| Spanish | 7 | 0.2% |
| Swedish | 64 | 2.2% |
| Swiss | 6 | 0.2% |
| Welsh | 43 | 1.5% | View All 37 Rows |
Immigrants in Sublimity
The most numerous immigrant groups reported in Sublimity came from Central America (71 | 2.4%), Latin America (71 | 2.4%), Mexico (71 | 2.4%), Canada (30 | 1.0%), and Europe (12 | 0.4%), together accounting for 8.7% of all Sublimity residents.
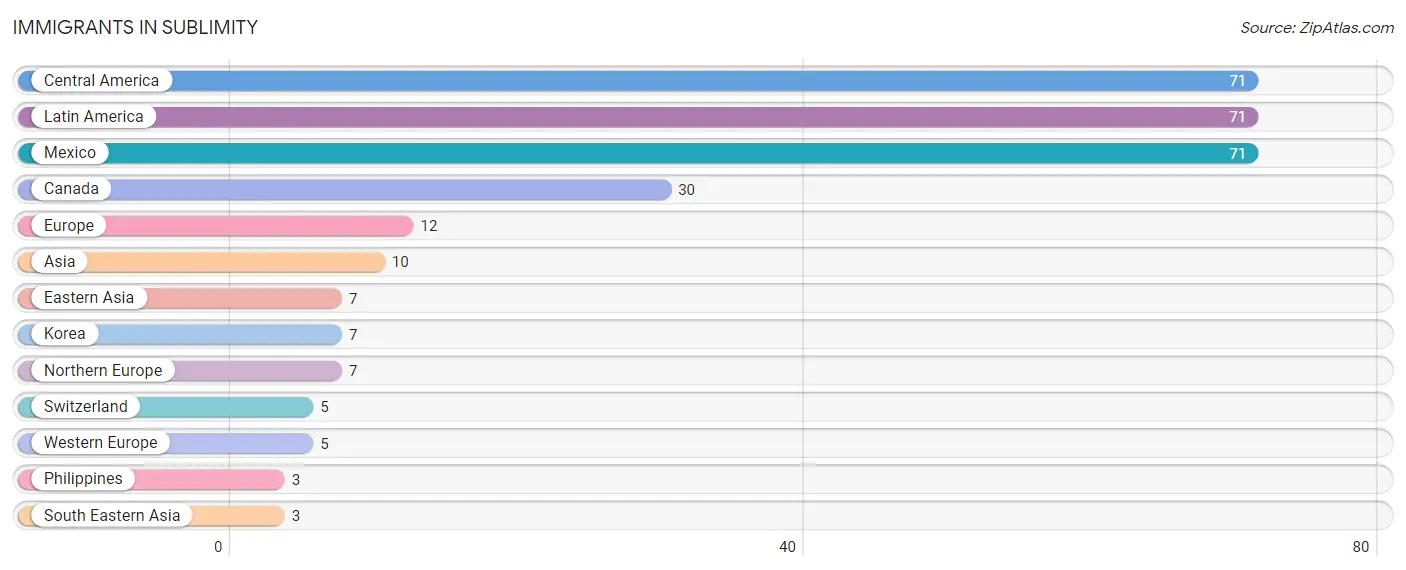
| Immigration Origin | # Population | % Population |
| Asia | 10 | 0.3% |
| Canada | 30 | 1.0% |
| Central America | 71 | 2.4% |
| Eastern Asia | 7 | 0.2% |
| Europe | 12 | 0.4% |
| Korea | 7 | 0.2% |
| Latin America | 71 | 2.4% |
| Mexico | 71 | 2.4% |
| Northern Europe | 7 | 0.2% |
| Philippines | 3 | 0.1% |
| South Eastern Asia | 3 | 0.1% |
| Switzerland | 5 | 0.2% |
| Western Europe | 5 | 0.2% | View All 13 Rows |
Sex and Age in Sublimity
Sex and Age in Sublimity
The most populous age groups in Sublimity are 50 to 54 Years (129 | 8.8%) for men and 85 Years and over (216 | 14.6%) for women.
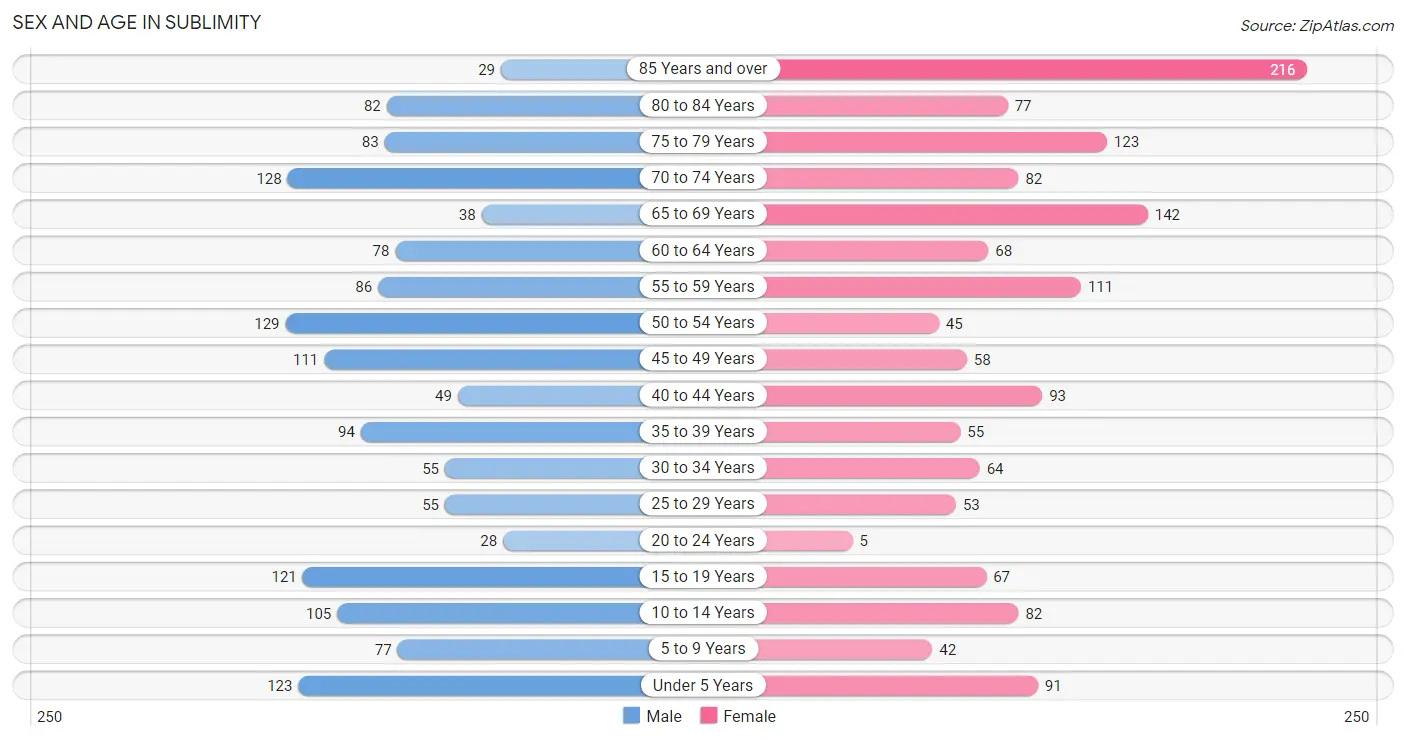
| Age Bracket | Male | Female |
| Under 5 Years | 123 (8.4%) | 91 (6.2%) |
| 5 to 9 Years | 77 (5.2%) | 42 (2.9%) |
| 10 to 14 Years | 105 (7.1%) | 82 (5.6%) |
| 15 to 19 Years | 121 (8.2%) | 67 (4.5%) |
| 20 to 24 Years | 28 (1.9%) | 5 (0.3%) |
| 25 to 29 Years | 55 (3.7%) | 53 (3.6%) |
| 30 to 34 Years | 55 (3.7%) | 64 (4.3%) |
| 35 to 39 Years | 94 (6.4%) | 55 (3.7%) |
| 40 to 44 Years | 49 (3.3%) | 93 (6.3%) |
| 45 to 49 Years | 111 (7.5%) | 58 (3.9%) |
| 50 to 54 Years | 129 (8.8%) | 45 (3.0%) |
| 55 to 59 Years | 86 (5.9%) | 111 (7.5%) |
| 60 to 64 Years | 78 (5.3%) | 68 (4.6%) |
| 65 to 69 Years | 38 (2.6%) | 142 (9.6%) |
| 70 to 74 Years | 128 (8.7%) | 82 (5.6%) |
| 75 to 79 Years | 83 (5.6%) | 123 (8.3%) |
| 80 to 84 Years | 82 (5.6%) | 77 (5.2%) |
| 85 Years and over | 29 (2.0%) | 216 (14.6%) |
| Total | 1,471 (100.0%) | 1,474 (100.0%) |
Families and Households in Sublimity
Median Family Size in Sublimity
The median family size in Sublimity is 2.80 persons per family, with single male/father families (26 | 3.5%) accounting for the largest median family size of 4.35 persons per family. On the other hand, single female/mother families (73 | 9.7%) represent the smallest median family size with 2.00 persons per family.
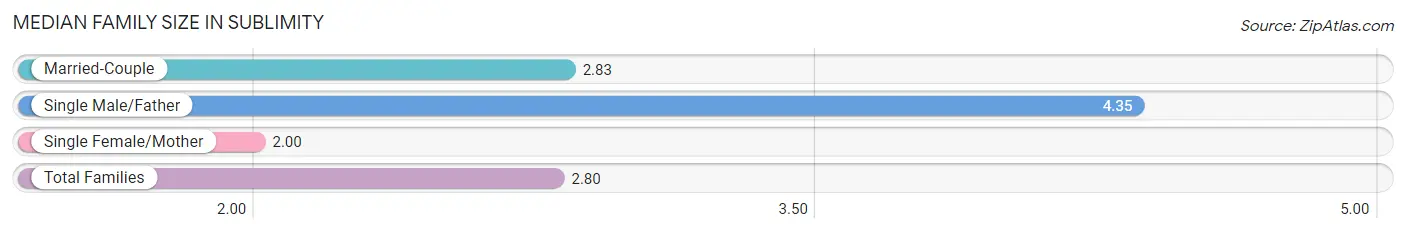
| Family Type | # Families | Family Size |
| Married-Couple | 654 (86.9%) | 2.83 |
| Single Male/Father | 26 (3.5%) | 4.35 |
| Single Female/Mother | 73 (9.7%) | 2.00 |
| Total Families | 753 (100.0%) | 2.80 |
Median Household Size in Sublimity
The median household size in Sublimity is 2.18 persons per household, with single male/father households (26 | 2.0%) accounting for the largest median household size of 4.35 persons per household. non-family households (529 | 41.3%) represent the smallest median household size with 1.13 persons per household.
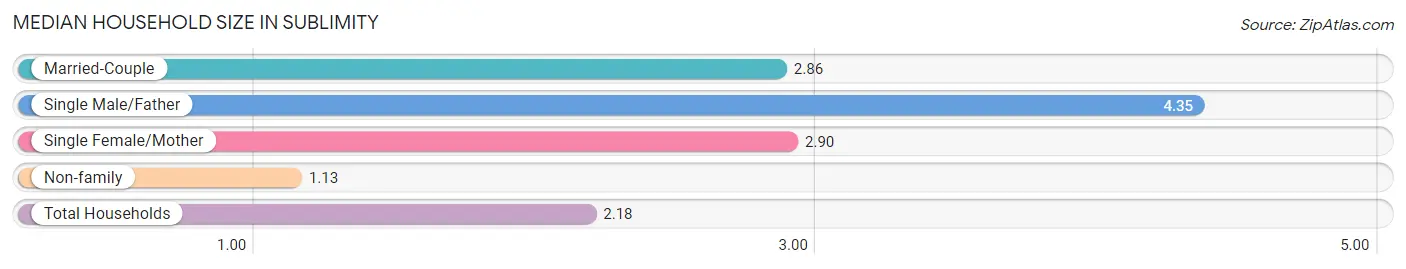
| Household Type | # Households | Household Size |
| Married-Couple | 654 (51.0%) | 2.86 |
| Single Male/Father | 26 (2.0%) | 4.35 |
| Single Female/Mother | 73 (5.7%) | 2.90 |
| Non-family | 529 (41.3%) | 1.13 |
| Total Households | 1,282 (100.0%) | 2.18 |
Household Size by Marriage Status in Sublimity
Out of a total of 1,282 households in Sublimity, 753 (58.7%) are family households, while 529 (41.3%) are nonfamily households. The most numerous type of family households are 2-person households, comprising 399, and the most common type of nonfamily households are 1-person households, comprising 468.
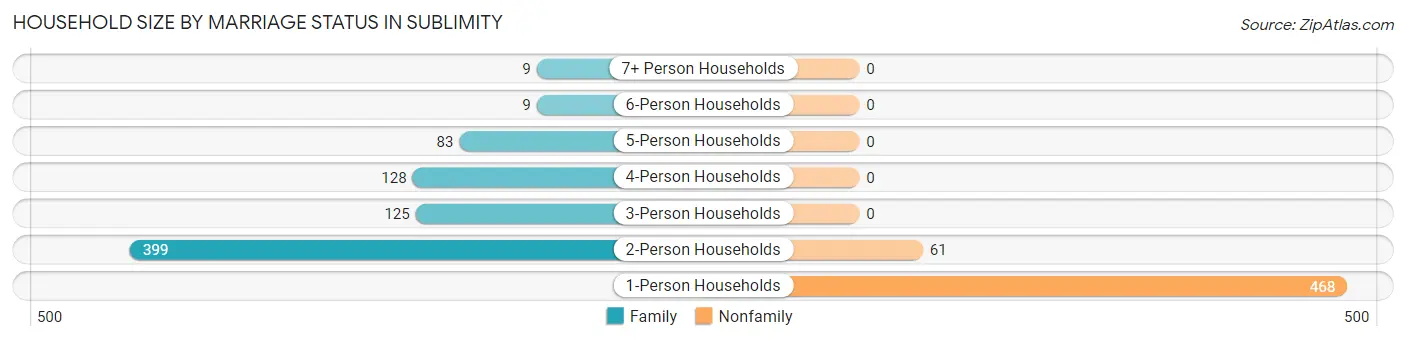
| Household Size | Family Households | Nonfamily Households |
| 1-Person Households | - | 468 (36.5%) |
| 2-Person Households | 399 (31.1%) | 61 (4.8%) |
| 3-Person Households | 125 (9.8%) | 0 (0.0%) |
| 4-Person Households | 128 (10.0%) | 0 (0.0%) |
| 5-Person Households | 83 (6.5%) | 0 (0.0%) |
| 6-Person Households | 9 (0.7%) | 0 (0.0%) |
| 7+ Person Households | 9 (0.7%) | 0 (0.0%) |
| Total | 753 (58.7%) | 529 (41.3%) |
Female Fertility in Sublimity
Fertility by Age in Sublimity
Average fertility rate in Sublimity is 180.0 births per 1,000 women. Women in the age bracket of 20 to 34 years have the highest fertility rate with 328.0 births per 1,000 women. Women in the age bracket of 20 to 34 years acount for 55.6% of all women with births.
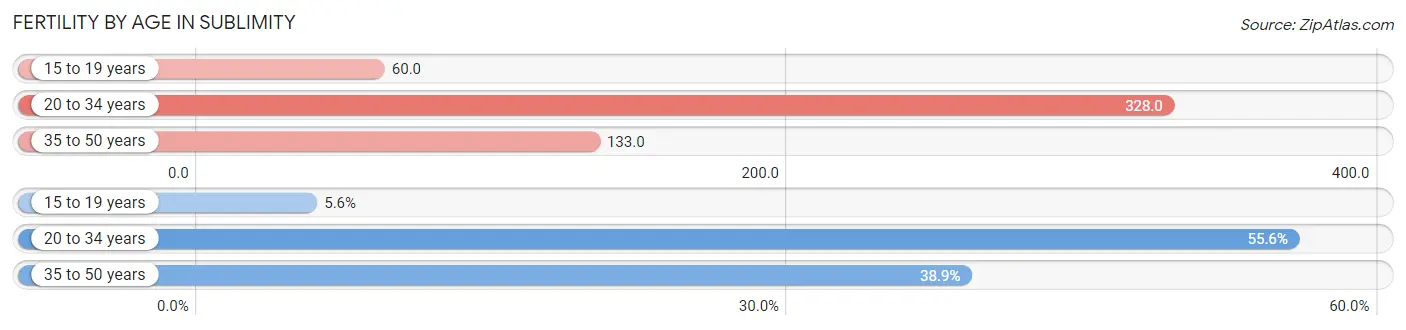
| Age Bracket | Women with Births | Births / 1,000 Women |
| 15 to 19 years | 4 (5.6%) | 60.0 |
| 20 to 34 years | 40 (55.6%) | 328.0 |
| 35 to 50 years | 28 (38.9%) | 133.0 |
| Total | 72 (100.0%) | 180.0 |
Fertility by Age by Marriage Status in Sublimity
86.1% of women with births (72) in Sublimity are married. The highest percentage of unmarried women with births falls into 15 to 19 years age bracket with 100.0% of them unmarried at the time of birth, while the lowest percentage of unmarried women with births belong to 35 to 50 years age bracket with 0.0% of them unmarried.
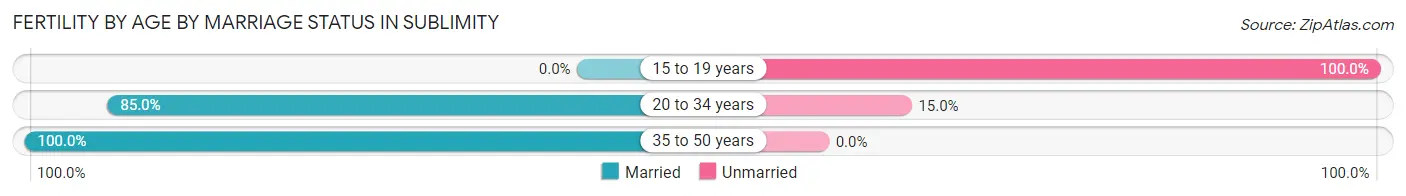
| Age Bracket | Married | Unmarried |
| 15 to 19 years | 0 (0.0%) | 4 (100.0%) |
| 20 to 34 years | 34 (85.0%) | 6 (15.0%) |
| 35 to 50 years | 28 (100.0%) | 0 (0.0%) |
| Total | 62 (86.1%) | 10 (13.9%) |
Fertility by Education in Sublimity
Average fertility rate in Sublimity is 180.0 births per 1,000 women. Women with the education attainment of college or associate's degree have the highest fertility rate of 233.0 births per 1,000 women, while women with the education attainment of bachelor's degree have the lowest fertility at 87.0 births per 1,000 women. Women with the education attainment of college or associate's degree represent 65.3% of all women with births.
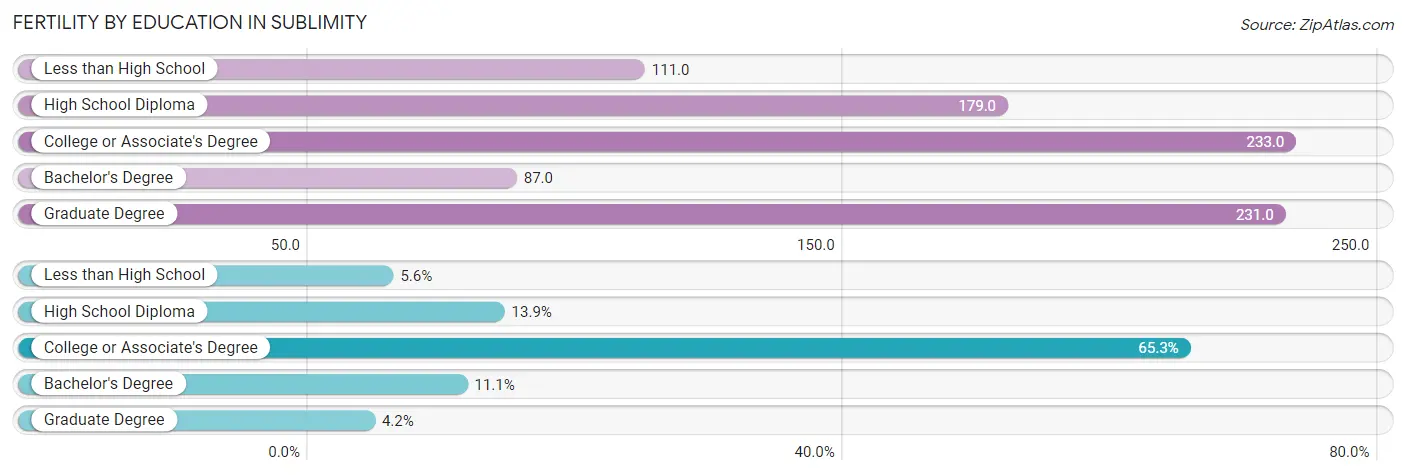
| Educational Attainment | Women with Births | Births / 1,000 Women |
| Less than High School | 4 (5.6%) | 111.0 |
| High School Diploma | 10 (13.9%) | 179.0 |
| College or Associate's Degree | 47 (65.3%) | 233.0 |
| Bachelor's Degree | 8 (11.1%) | 87.0 |
| Graduate Degree | 3 (4.2%) | 231.0 |
| Total | 72 (100.0%) | 180.0 |
Fertility by Education by Marriage Status in Sublimity
13.9% of women with births in Sublimity are unmarried. Women with the educational attainment of high school diploma are most likely to be married with 100.0% of them married at childbirth, while women with the educational attainment of less than high school are least likely to be married with 100.0% of them unmarried at childbirth.
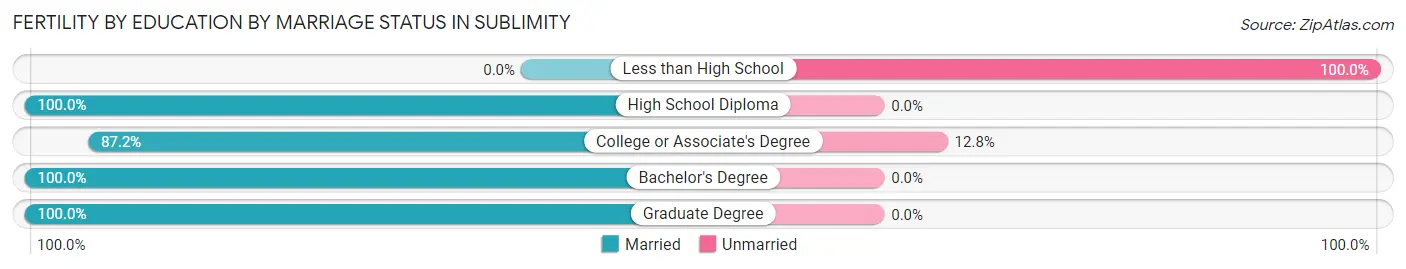
| Educational Attainment | Married | Unmarried |
| Less than High School | 0 (0.0%) | 4 (100.0%) |
| High School Diploma | 10 (100.0%) | 0 (0.0%) |
| College or Associate's Degree | 41 (87.2%) | 6 (12.8%) |
| Bachelor's Degree | 8 (100.0%) | 0 (0.0%) |
| Graduate Degree | 3 (100.0%) | 0 (0.0%) |
| Total | 62 (86.1%) | 10 (13.9%) |
Employment Characteristics in Sublimity
Employment by Class of Employer in Sublimity
Among the 983 employed individuals in Sublimity, private company employees (479 | 48.7%), state government employees (219 | 22.3%), and self-employed (not incorporated) (96 | 9.8%) make up the most common classes of employment.
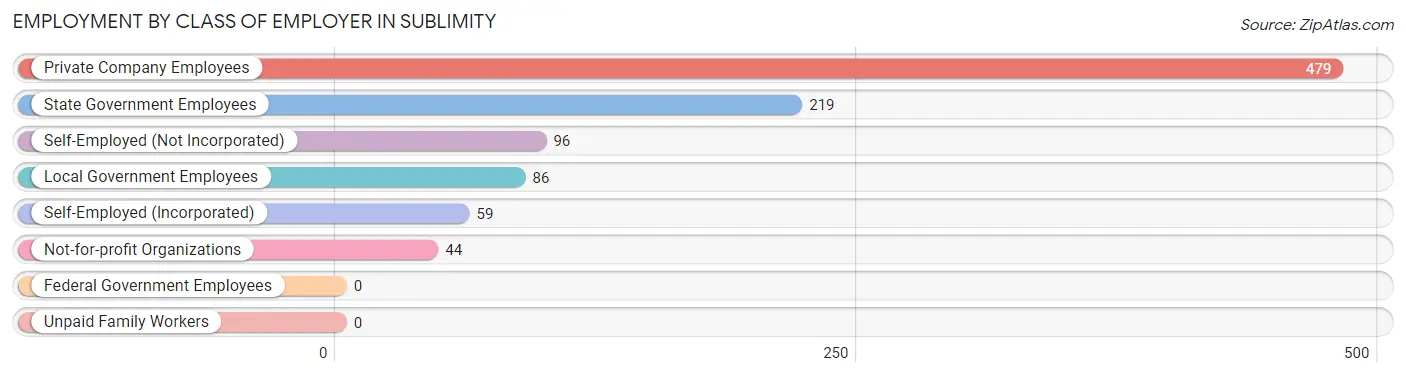
| Employer Class | # Employees | % Employees |
| Private Company Employees | 479 | 48.7% |
| Self-Employed (Incorporated) | 59 | 6.0% |
| Self-Employed (Not Incorporated) | 96 | 9.8% |
| Not-for-profit Organizations | 44 | 4.5% |
| Local Government Employees | 86 | 8.7% |
| State Government Employees | 219 | 22.3% |
| Federal Government Employees | 0 | 0.0% |
| Unpaid Family Workers | 0 | 0.0% |
| Total | 983 | 100.0% |
Employment Status by Age in Sublimity
According to the labor force statistics for Sublimity, out of the total population over 16 years of age (2,377), 43.9% or 1,044 individuals are in the labor force, with 2.5% or 26 of them unemployed. The age group with the highest labor force participation rate is 25 to 29 years, with 90.7% or 98 individuals in the labor force. Within the labor force, the 20 to 24 years age range has the highest percentage of unemployed individuals, with 29.2% or 7 of them being unemployed.
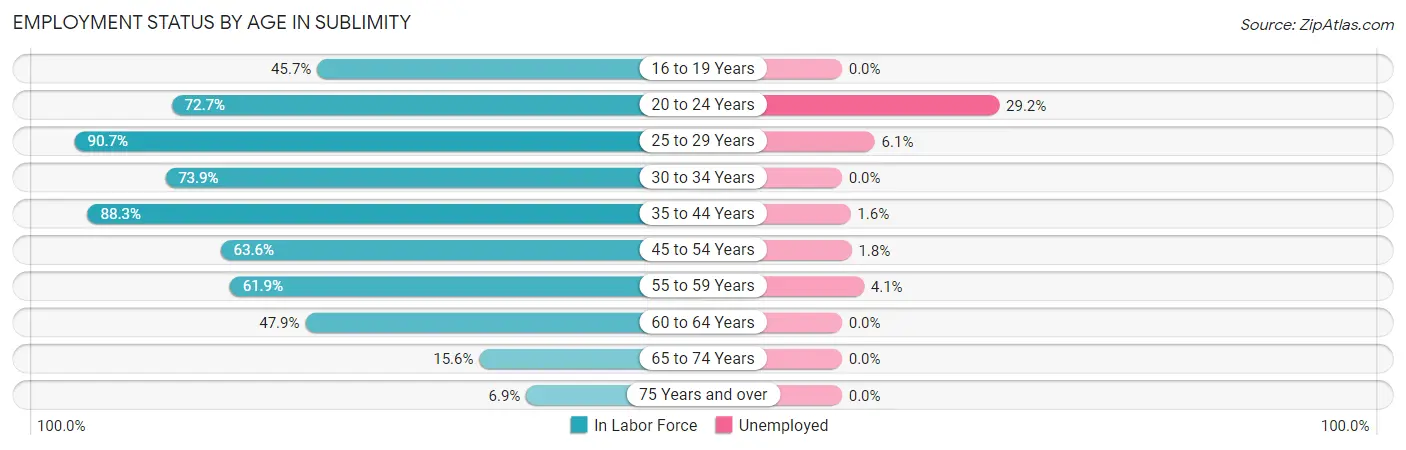
| Age Bracket | In Labor Force | Unemployed |
| 16 to 19 Years | 64 (45.7%) | 0 (0.0%) |
| 20 to 24 Years | 24 (72.7%) | 7 (29.2%) |
| 25 to 29 Years | 98 (90.7%) | 6 (6.1%) |
| 30 to 34 Years | 88 (73.9%) | 0 (0.0%) |
| 35 to 44 Years | 257 (88.3%) | 4 (1.6%) |
| 45 to 54 Years | 218 (63.6%) | 4 (1.8%) |
| 55 to 59 Years | 122 (61.9%) | 5 (4.1%) |
| 60 to 64 Years | 70 (47.9%) | 0 (0.0%) |
| 65 to 74 Years | 61 (15.6%) | 0 (0.0%) |
| 75 Years and over | 42 (6.9%) | 0 (0.0%) |
| Total | 1,044 (43.9%) | 26 (2.5%) |
Employment Status by Educational Attainment in Sublimity
According to labor force statistics for Sublimity, 70.8% of individuals (852) out of the total population between 25 and 64 years of age (1,204) are in the labor force, with 2.2% or 19 of them being unemployed. The group with the highest labor force participation rate are those with the educational attainment of bachelor's degree or higher, with 79.8% or 260 individuals in the labor force. Within the labor force, individuals with less than high school education have the highest percentage of unemployment, with 31.3% or 15 of them being unemployed.
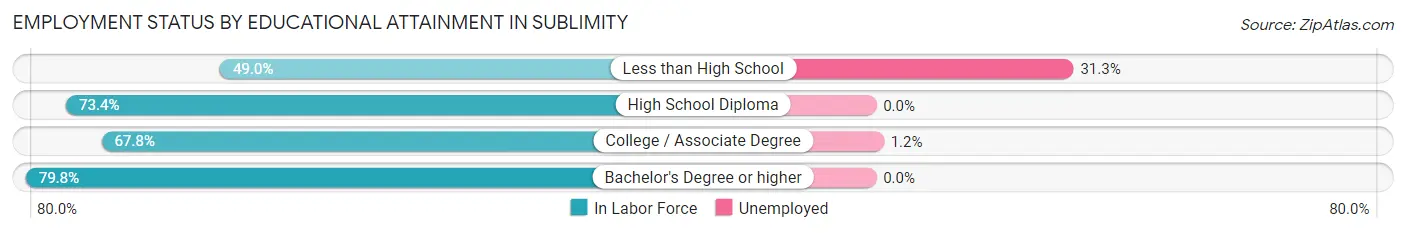
| Educational Attainment | In Labor Force | Unemployed |
| Less than High School | 48 (49.0%) | 31 (31.3%) |
| High School Diploma | 215 (73.4%) | 0 (0.0%) |
| College / Associate Degree | 330 (67.8%) | 6 (1.2%) |
| Bachelor's Degree or higher | 260 (79.8%) | 0 (0.0%) |
| Total | 852 (70.8%) | 26 (2.2%) |
Employment Occupations by Sex in Sublimity
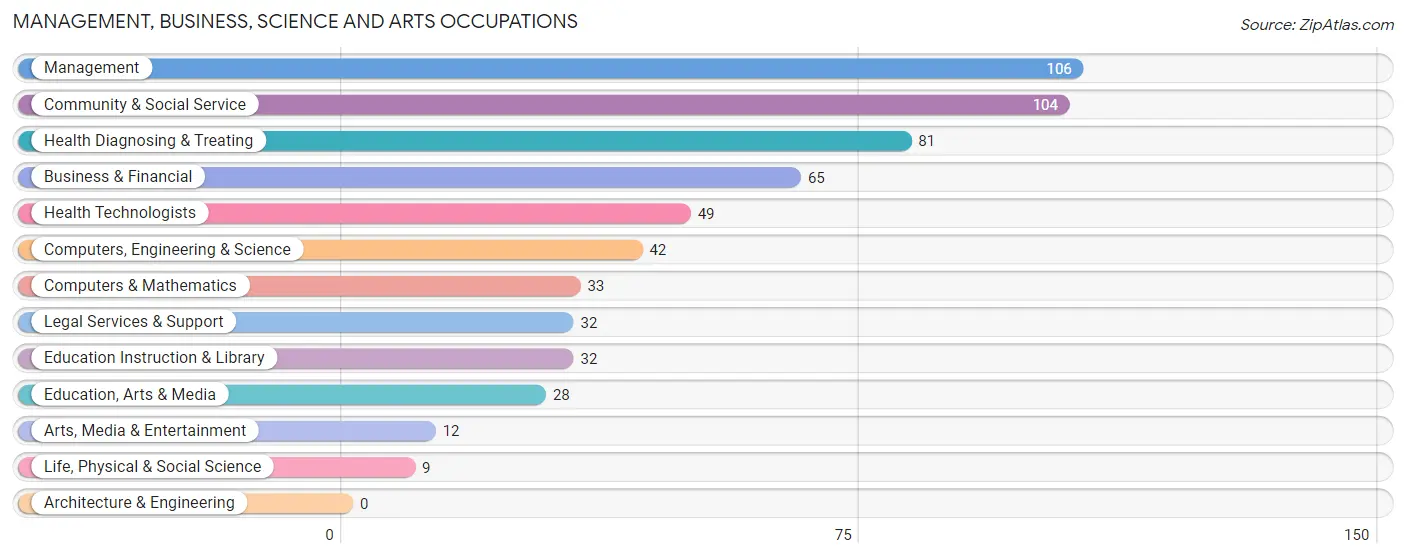
Management, Business, Science and Arts Occupations
The most common Management, Business, Science and Arts occupations in Sublimity are Management (106 | 10.4%), Community & Social Service (104 | 10.2%), Health Diagnosing & Treating (81 | 8.0%), Business & Financial (65 | 6.4%), and Health Technologists (49 | 4.8%).
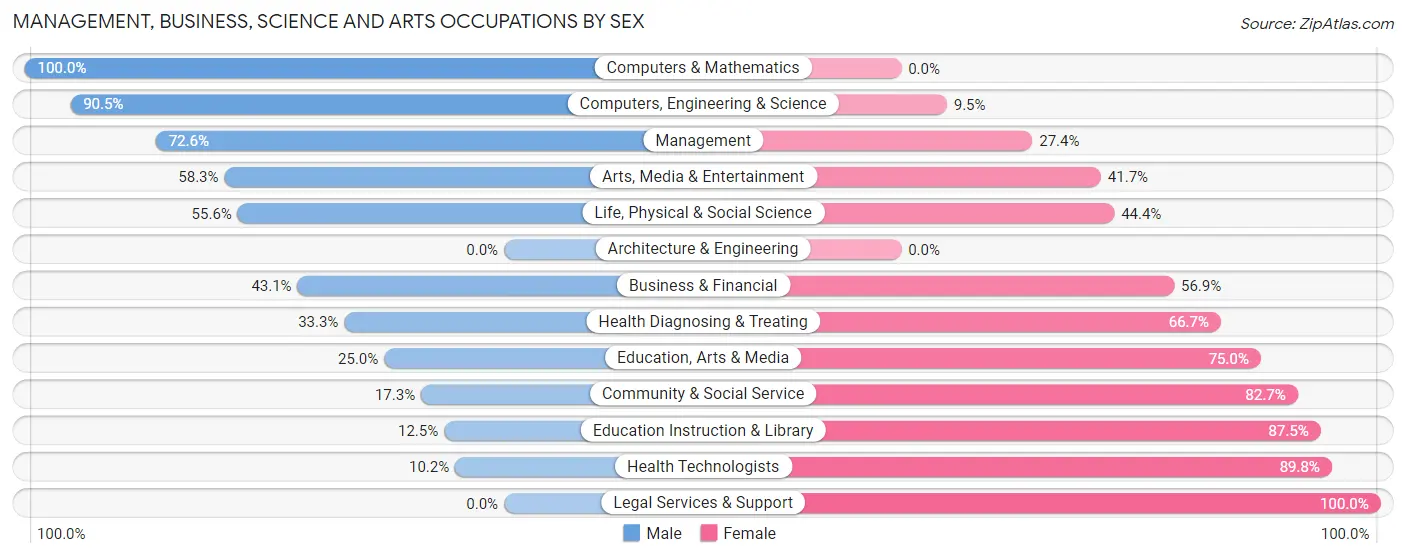
Management, Business, Science and Arts Occupations by Sex
Within the Management, Business, Science and Arts occupations in Sublimity, the most male-oriented occupations are Computers & Mathematics (100.0%), Computers, Engineering & Science (90.5%), and Management (72.6%), while the most female-oriented occupations are Legal Services & Support (100.0%), Health Technologists (89.8%), and Education Instruction & Library (87.5%).
| Occupation | Male | Female |
| Management | 77 (72.6%) | 29 (27.4%) |
| Business & Financial | 28 (43.1%) | 37 (56.9%) |
| Computers, Engineering & Science | 38 (90.5%) | 4 (9.5%) |
| Computers & Mathematics | 33 (100.0%) | 0 (0.0%) |
| Architecture & Engineering | 0 (0.0%) | 0 (0.0%) |
| Life, Physical & Social Science | 5 (55.6%) | 4 (44.4%) |
| Community & Social Service | 18 (17.3%) | 86 (82.7%) |
| Education, Arts & Media | 7 (25.0%) | 21 (75.0%) |
| Legal Services & Support | 0 (0.0%) | 32 (100.0%) |
| Education Instruction & Library | 4 (12.5%) | 28 (87.5%) |
| Arts, Media & Entertainment | 7 (58.3%) | 5 (41.7%) |
| Health Diagnosing & Treating | 27 (33.3%) | 54 (66.7%) |
| Health Technologists | 5 (10.2%) | 44 (89.8%) |
| Total (Category) | 188 (47.2%) | 210 (52.8%) |
| Total (Overall) | 607 (59.6%) | 411 (40.4%) |
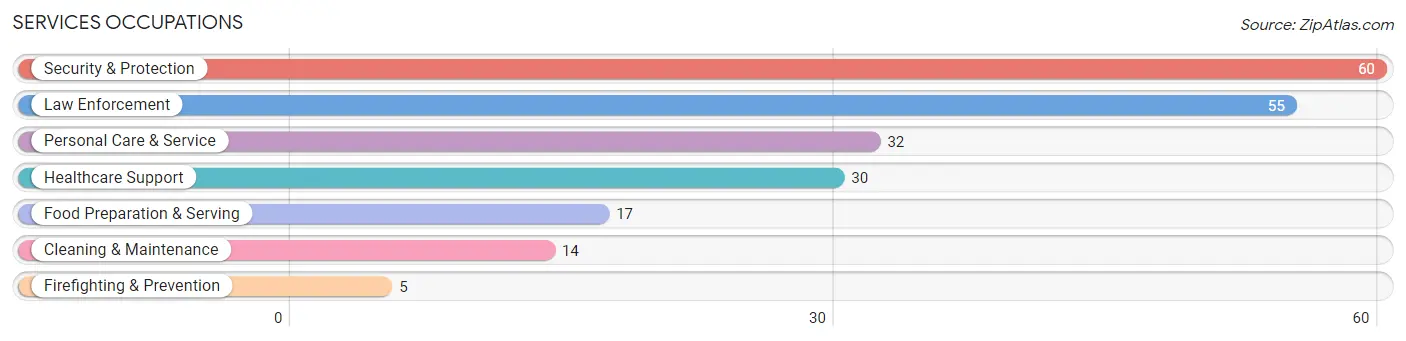
Services Occupations
The most common Services occupations in Sublimity are Security & Protection (60 | 5.9%), Law Enforcement (55 | 5.4%), Personal Care & Service (32 | 3.1%), Healthcare Support (30 | 2.9%), and Food Preparation & Serving (17 | 1.7%).
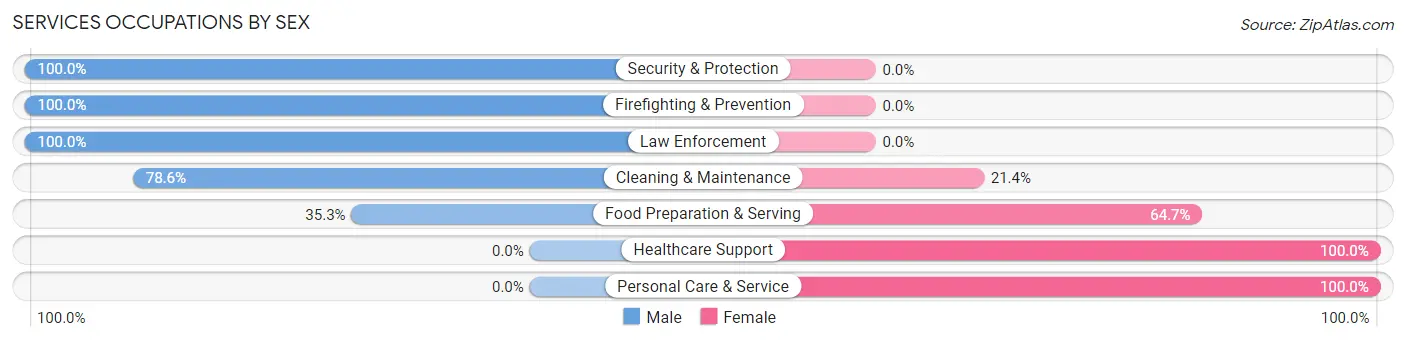
Services Occupations by Sex
Within the Services occupations in Sublimity, the most male-oriented occupations are Security & Protection (100.0%), Firefighting & Prevention (100.0%), and Law Enforcement (100.0%), while the most female-oriented occupations are Healthcare Support (100.0%), Personal Care & Service (100.0%), and Food Preparation & Serving (64.7%).
| Occupation | Male | Female |
| Healthcare Support | 0 (0.0%) | 30 (100.0%) |
| Security & Protection | 60 (100.0%) | 0 (0.0%) |
| Firefighting & Prevention | 5 (100.0%) | 0 (0.0%) |
| Law Enforcement | 55 (100.0%) | 0 (0.0%) |
| Food Preparation & Serving | 6 (35.3%) | 11 (64.7%) |
| Cleaning & Maintenance | 11 (78.6%) | 3 (21.4%) |
| Personal Care & Service | 0 (0.0%) | 32 (100.0%) |
| Total (Category) | 77 (50.3%) | 76 (49.7%) |
| Total (Overall) | 607 (59.6%) | 411 (40.4%) |
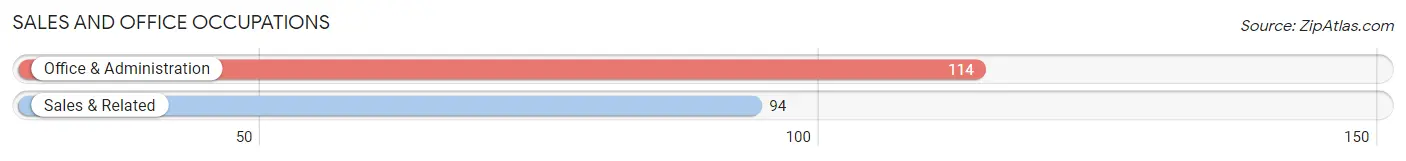
Sales and Office Occupations
The most common Sales and Office occupations in Sublimity are Office & Administration (114 | 11.2%), and Sales & Related (94 | 9.2%).
Sales and Office Occupations by Sex
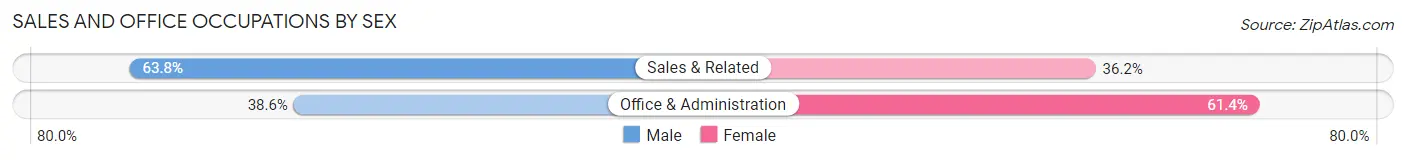
| Occupation | Male | Female |
| Sales & Related | 60 (63.8%) | 34 (36.2%) |
| Office & Administration | 44 (38.6%) | 70 (61.4%) |
| Total (Category) | 104 (50.0%) | 104 (50.0%) |
| Total (Overall) | 607 (59.6%) | 411 (40.4%) |
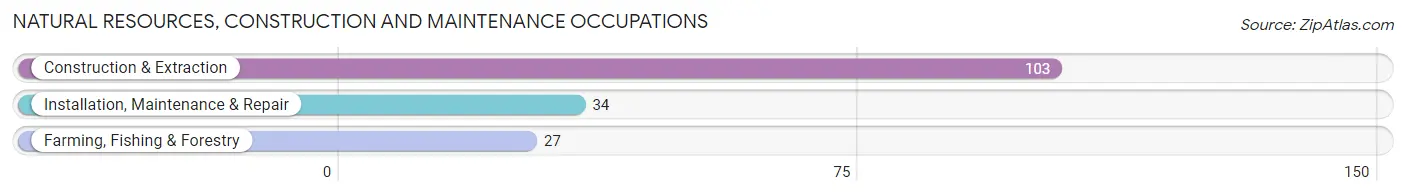
Natural Resources, Construction and Maintenance Occupations
The most common Natural Resources, Construction and Maintenance occupations in Sublimity are Construction & Extraction (103 | 10.1%), Installation, Maintenance & Repair (34 | 3.3%), and Farming, Fishing & Forestry (27 | 2.6%).
Natural Resources, Construction and Maintenance Occupations by Sex
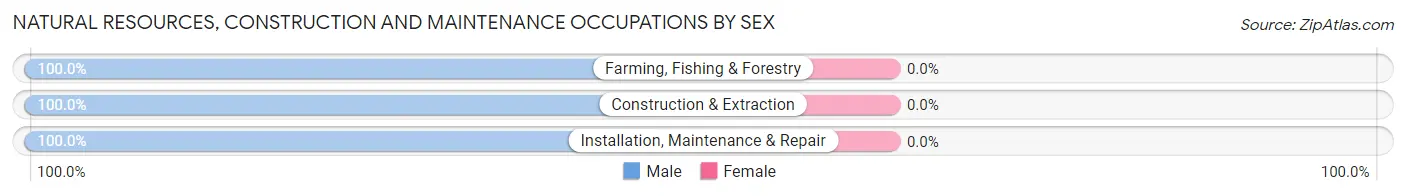
| Occupation | Male | Female |
| Farming, Fishing & Forestry | 27 (100.0%) | 0 (0.0%) |
| Construction & Extraction | 103 (100.0%) | 0 (0.0%) |
| Installation, Maintenance & Repair | 34 (100.0%) | 0 (0.0%) |
| Total (Category) | 164 (100.0%) | 0 (0.0%) |
| Total (Overall) | 607 (59.6%) | 411 (40.4%) |
Production, Transportation and Moving Occupations
The most common Production, Transportation and Moving occupations in Sublimity are Production (40 | 3.9%), Transportation (32 | 3.1%), and Material Moving (23 | 2.3%).
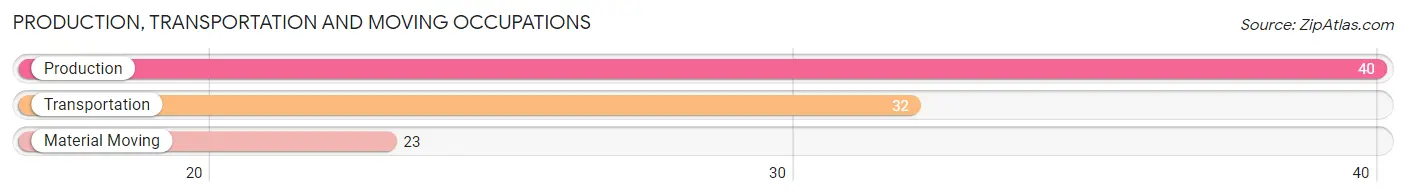
Production, Transportation and Moving Occupations by Sex
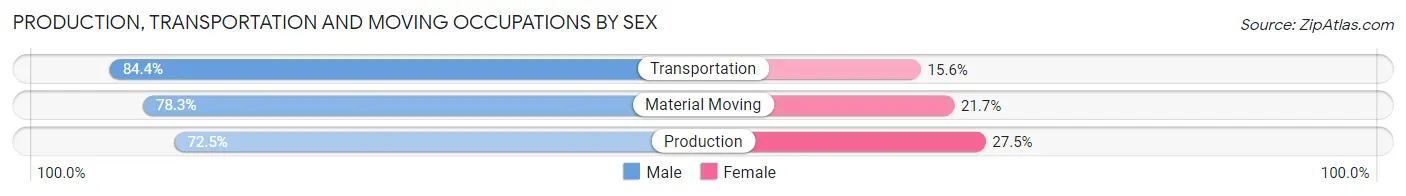
| Occupation | Male | Female |
| Production | 29 (72.5%) | 11 (27.5%) |
| Transportation | 27 (84.4%) | 5 (15.6%) |
| Material Moving | 18 (78.3%) | 5 (21.7%) |
| Total (Category) | 74 (77.9%) | 21 (22.1%) |
| Total (Overall) | 607 (59.6%) | 411 (40.4%) |
Employment Industries by Sex in Sublimity
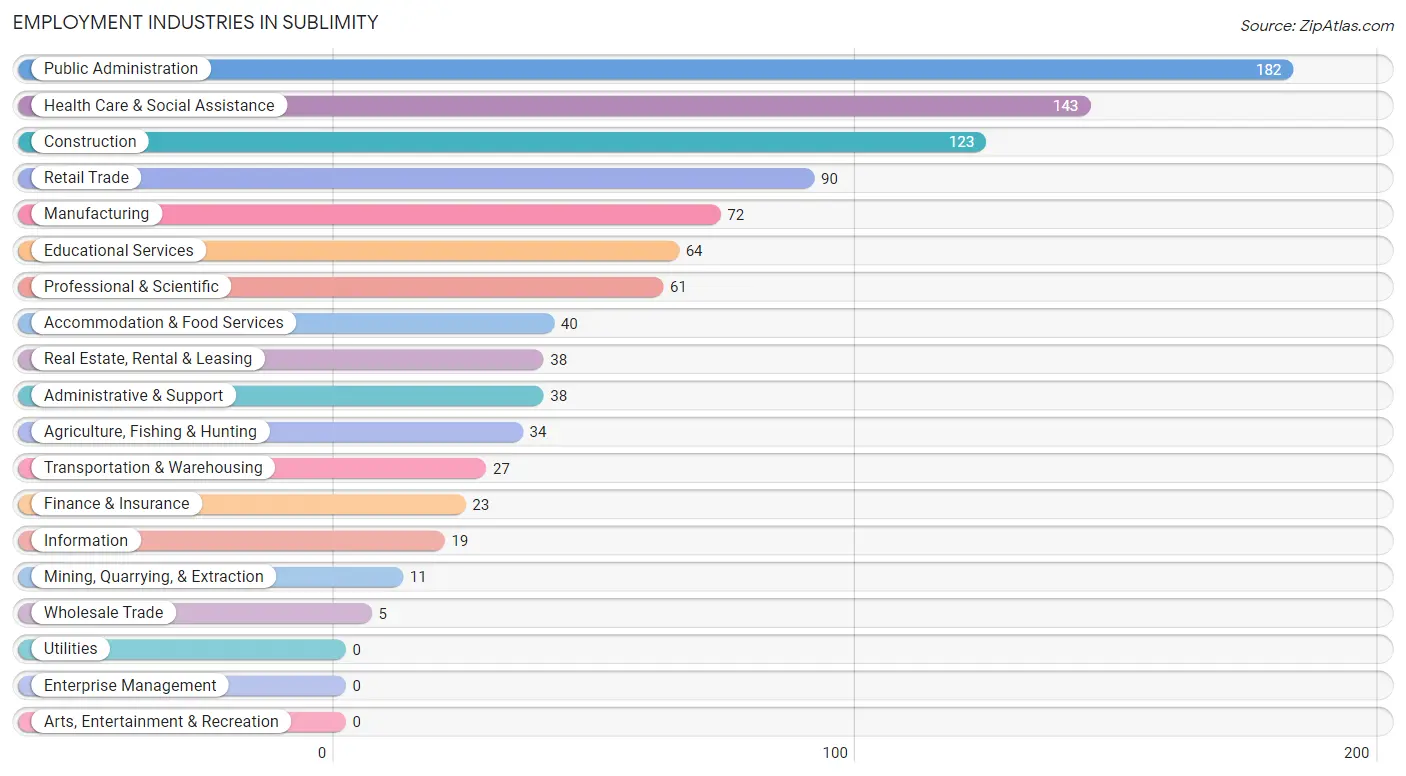
Employment Industries in Sublimity
The major employment industries in Sublimity include Public Administration (182 | 17.9%), Health Care & Social Assistance (143 | 14.1%), Construction (123 | 12.1%), Retail Trade (90 | 8.8%), and Manufacturing (72 | 7.1%).
Employment Industries by Sex in Sublimity
The Sublimity industries that see more men than women are Construction (100.0%), Information (100.0%), and Manufacturing (93.1%), whereas the industries that tend to have a higher number of women are Wholesale Trade (100.0%), Accommodation & Food Services (85.0%), and Educational Services (82.8%).
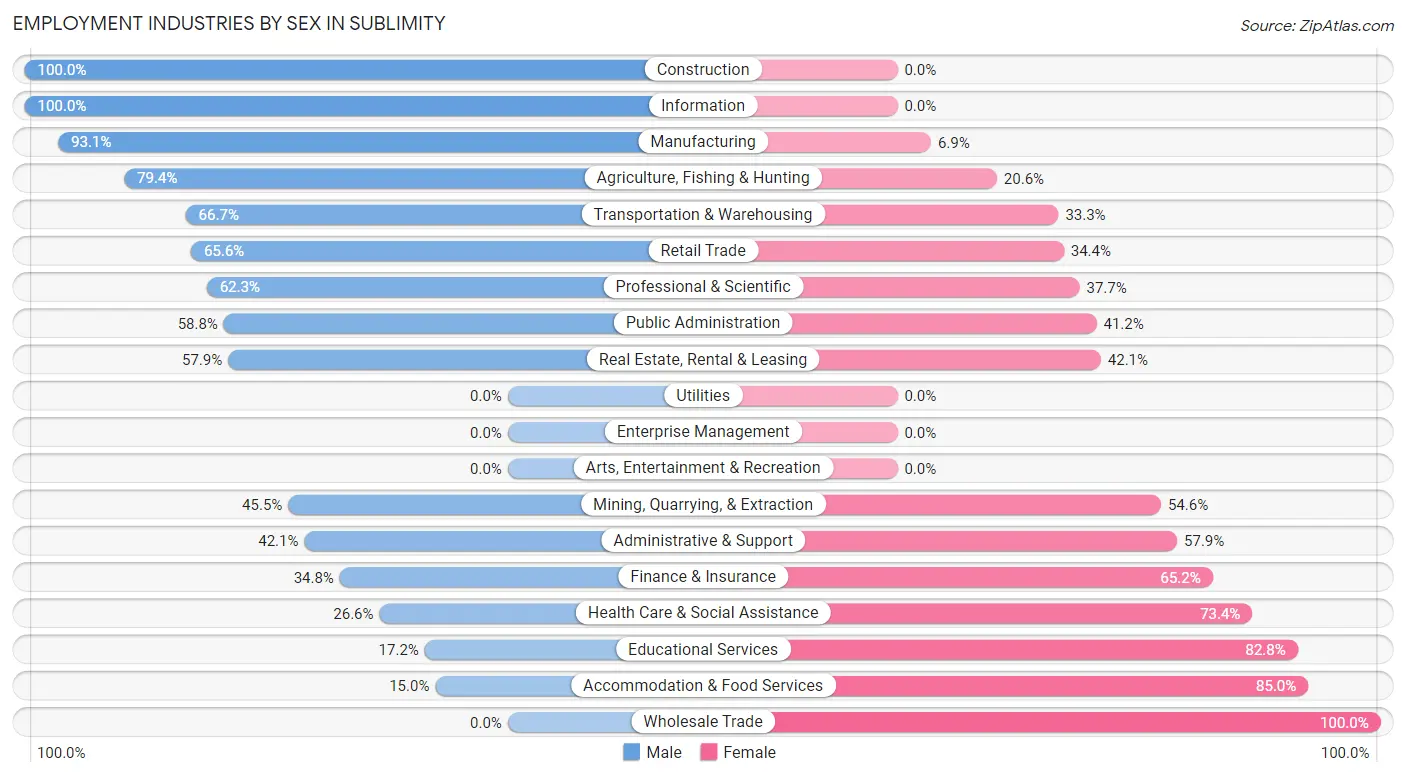
| Industry | Male | Female |
| Agriculture, Fishing & Hunting | 27 (79.4%) | 7 (20.6%) |
| Mining, Quarrying, & Extraction | 5 (45.5%) | 6 (54.5%) |
| Construction | 123 (100.0%) | 0 (0.0%) |
| Manufacturing | 67 (93.1%) | 5 (6.9%) |
| Wholesale Trade | 0 (0.0%) | 5 (100.0%) |
| Retail Trade | 59 (65.6%) | 31 (34.4%) |
| Transportation & Warehousing | 18 (66.7%) | 9 (33.3%) |
| Utilities | 0 (0.0%) | 0 (0.0%) |
| Information | 19 (100.0%) | 0 (0.0%) |
| Finance & Insurance | 8 (34.8%) | 15 (65.2%) |
| Real Estate, Rental & Leasing | 22 (57.9%) | 16 (42.1%) |
| Professional & Scientific | 38 (62.3%) | 23 (37.7%) |
| Enterprise Management | 0 (0.0%) | 0 (0.0%) |
| Administrative & Support | 16 (42.1%) | 22 (57.9%) |
| Educational Services | 11 (17.2%) | 53 (82.8%) |
| Health Care & Social Assistance | 38 (26.6%) | 105 (73.4%) |
| Arts, Entertainment & Recreation | 0 (0.0%) | 0 (0.0%) |
| Accommodation & Food Services | 6 (15.0%) | 34 (85.0%) |
| Public Administration | 107 (58.8%) | 75 (41.2%) |
| Total | 607 (59.6%) | 411 (40.4%) |
Education in Sublimity
School Enrollment in Sublimity
The most common levels of schooling among the 523 students in Sublimity are high school (165 | 31.6%), middle school (150 | 28.7%), and elementary school (94 | 18.0%).
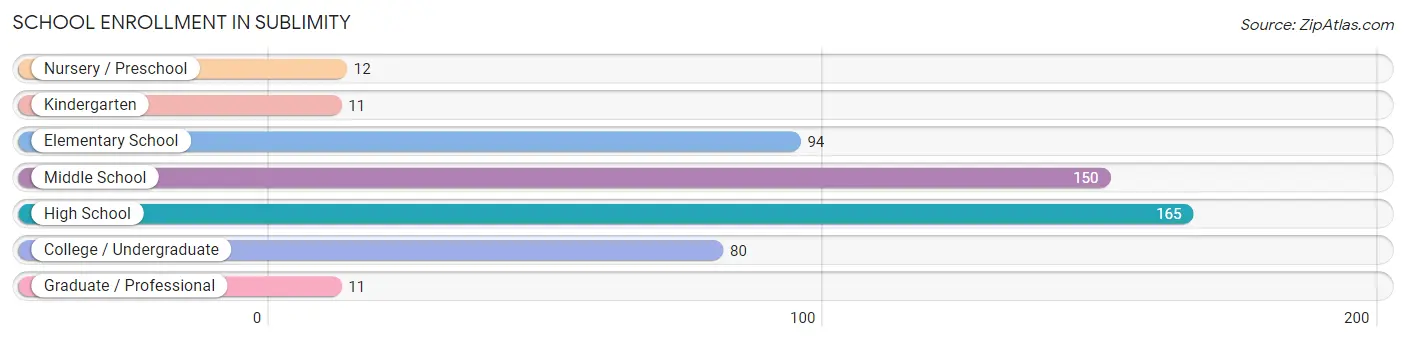
| School Level | # Students | % Students |
| Nursery / Preschool | 12 | 2.3% |
| Kindergarten | 11 | 2.1% |
| Elementary School | 94 | 18.0% |
| Middle School | 150 | 28.7% |
| High School | 165 | 31.6% |
| College / Undergraduate | 80 | 15.3% |
| Graduate / Professional | 11 | 2.1% |
| Total | 523 | 100.0% |
School Enrollment by Age by Funding Source in Sublimity
Out of a total of 523 students who are enrolled in schools in Sublimity, 103 (19.7%) attend a private institution, while the remaining 420 (80.3%) are enrolled in public schools. The age group of 3 to 4 year olds has the highest likelihood of being enrolled in private schools, with 12 (100.0% in the age bracket) enrolled. Conversely, the age group of 15 to 17 year olds has the lowest likelihood of being enrolled in a private school, with 140 (96.6% in the age bracket) attending a public institution.
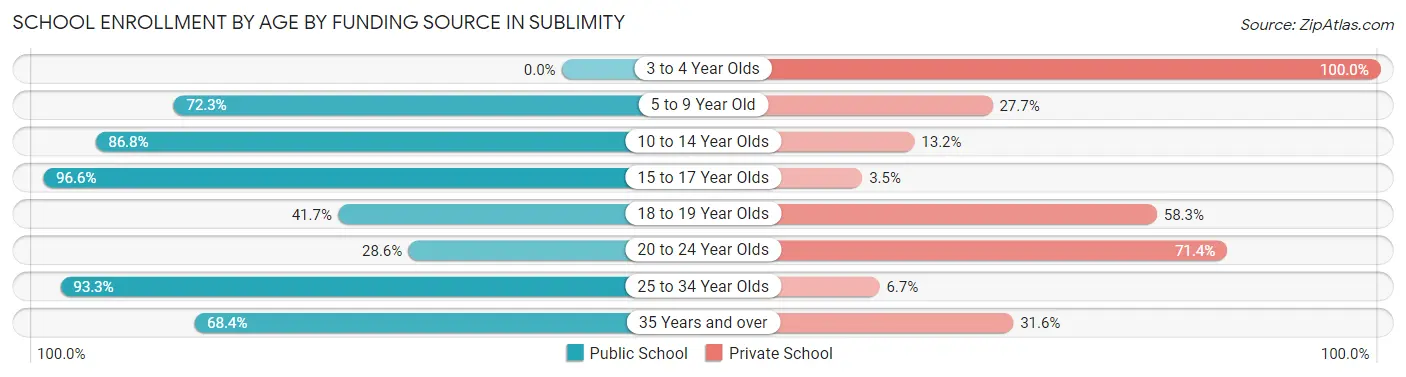
| Age Bracket | Public School | Private School |
| 3 to 4 Year Olds | 0 (0.0%) | 12 (100.0%) |
| 5 to 9 Year Old | 73 (72.3%) | 28 (27.7%) |
| 10 to 14 Year Olds | 145 (86.8%) | 22 (13.2%) |
| 15 to 17 Year Olds | 140 (96.6%) | 5 (3.5%) |
| 18 to 19 Year Olds | 5 (41.7%) | 7 (58.3%) |
| 20 to 24 Year Olds | 4 (28.6%) | 10 (71.4%) |
| 25 to 34 Year Olds | 14 (93.3%) | 1 (6.7%) |
| 35 Years and over | 39 (68.4%) | 18 (31.6%) |
| Total | 420 (80.3%) | 103 (19.7%) |
Educational Attainment by Field of Study in Sublimity
Business (186 | 25.6%), education (105 | 14.4%), social sciences (92 | 12.6%), bio, nature & agricultural (90 | 12.4%), and arts & humanities (57 | 7.8%) are the most common fields of study among 728 individuals in Sublimity who have obtained a bachelor's degree or higher.
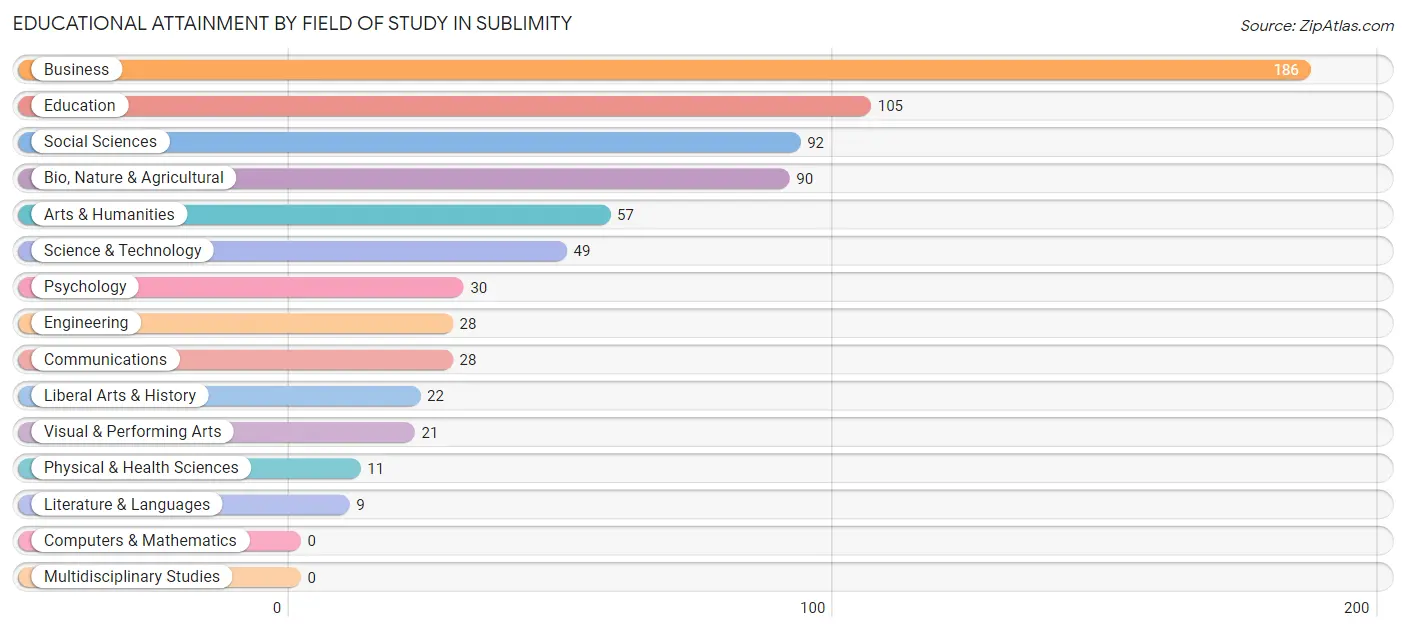
| Field of Study | # Graduates | % Graduates |
| Computers & Mathematics | 0 | 0.0% |
| Bio, Nature & Agricultural | 90 | 12.4% |
| Physical & Health Sciences | 11 | 1.5% |
| Psychology | 30 | 4.1% |
| Social Sciences | 92 | 12.6% |
| Engineering | 28 | 3.8% |
| Multidisciplinary Studies | 0 | 0.0% |
| Science & Technology | 49 | 6.7% |
| Business | 186 | 25.6% |
| Education | 105 | 14.4% |
| Literature & Languages | 9 | 1.2% |
| Liberal Arts & History | 22 | 3.0% |
| Visual & Performing Arts | 21 | 2.9% |
| Communications | 28 | 3.8% |
| Arts & Humanities | 57 | 7.8% |
| Total | 728 | 100.0% |
Transportation & Commute in Sublimity
Vehicle Availability by Sex in Sublimity
The most prevalent vehicle ownership categories in Sublimity are males with 2 vehicles (278, accounting for 46.5%) and females with 2 vehicles (157, making up 77.6%).
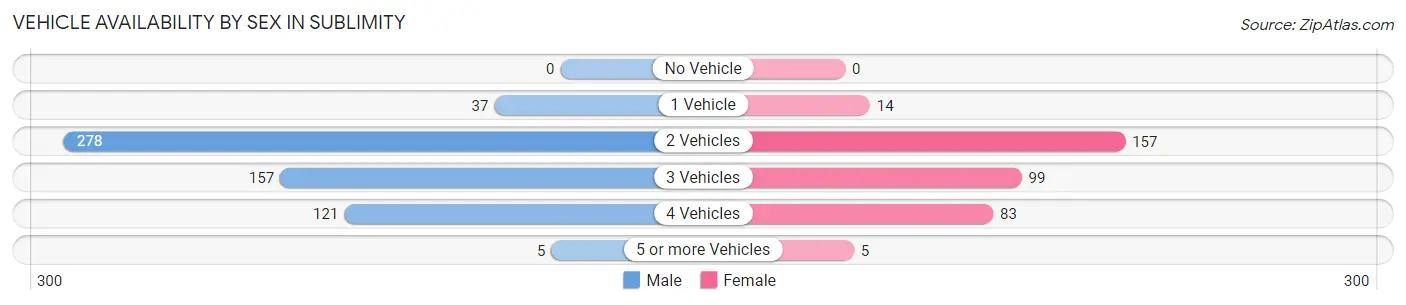
| Vehicles Available | Male | Female |
| No Vehicle | 0 (0.0%) | 0 (0.0%) |
| 1 Vehicle | 37 (6.2%) | 14 (3.9%) |
| 2 Vehicles | 278 (46.5%) | 157 (43.9%) |
| 3 Vehicles | 157 (26.3%) | 99 (27.7%) |
| 4 Vehicles | 121 (20.2%) | 83 (23.2%) |
| 5 or more Vehicles | 5 (0.8%) | 5 (1.4%) |
| Total | 598 (100.0%) | 358 (100.0%) |
Commute Time in Sublimity
The most frequently occuring commute durations in Sublimity are 20 to 24 minutes (198 commuters, 23.4%), 25 to 29 minutes (186 commuters, 22.0%), and 15 to 19 minutes (117 commuters, 13.9%).
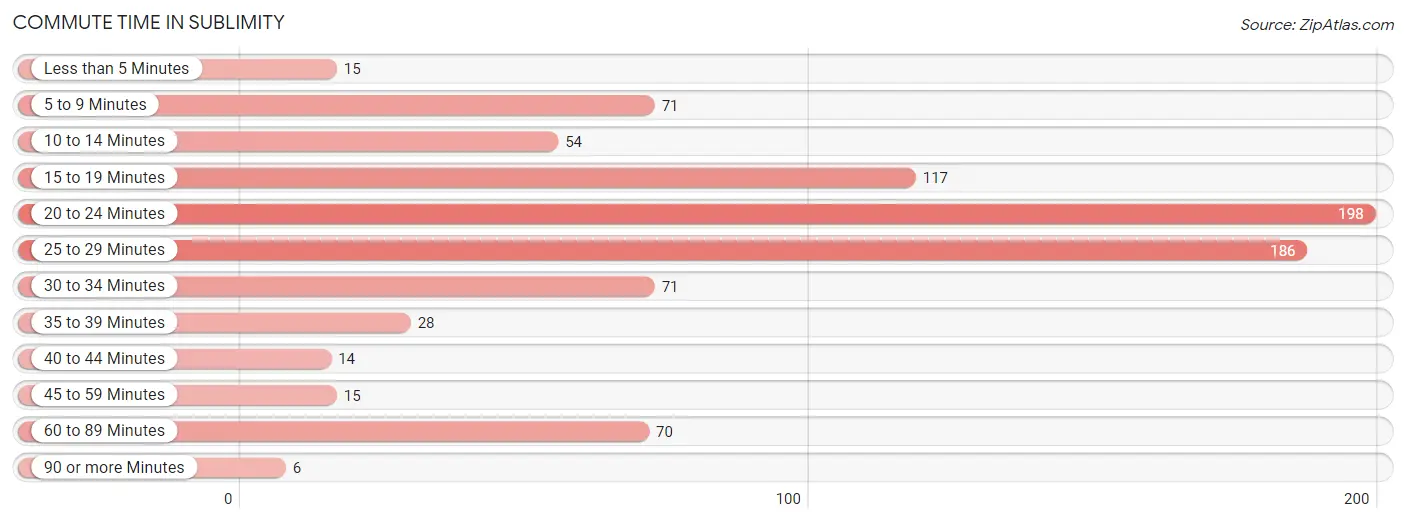
| Commute Time | # Commuters | % Commuters |
| Less than 5 Minutes | 15 | 1.8% |
| 5 to 9 Minutes | 71 | 8.4% |
| 10 to 14 Minutes | 54 | 6.4% |
| 15 to 19 Minutes | 117 | 13.9% |
| 20 to 24 Minutes | 198 | 23.4% |
| 25 to 29 Minutes | 186 | 22.0% |
| 30 to 34 Minutes | 71 | 8.4% |
| 35 to 39 Minutes | 28 | 3.3% |
| 40 to 44 Minutes | 14 | 1.7% |
| 45 to 59 Minutes | 15 | 1.8% |
| 60 to 89 Minutes | 70 | 8.3% |
| 90 or more Minutes | 6 | 0.7% |
Commute Time by Sex in Sublimity
The most common commute times in Sublimity are 20 to 24 minutes (120 commuters, 23.7%) for males and 25 to 29 minutes (85 commuters, 25.2%) for females.
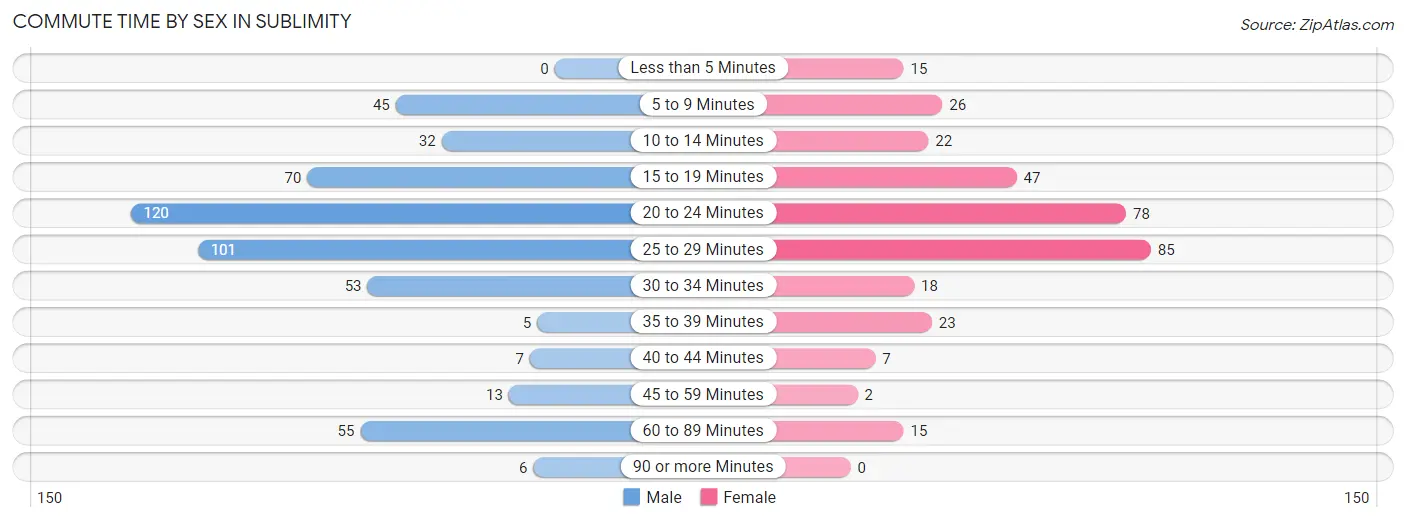
| Commute Time | Male | Female |
| Less than 5 Minutes | 0 (0.0%) | 15 (4.4%) |
| 5 to 9 Minutes | 45 (8.9%) | 26 (7.7%) |
| 10 to 14 Minutes | 32 (6.3%) | 22 (6.5%) |
| 15 to 19 Minutes | 70 (13.8%) | 47 (13.9%) |
| 20 to 24 Minutes | 120 (23.7%) | 78 (23.1%) |
| 25 to 29 Minutes | 101 (19.9%) | 85 (25.2%) |
| 30 to 34 Minutes | 53 (10.4%) | 18 (5.3%) |
| 35 to 39 Minutes | 5 (1.0%) | 23 (6.8%) |
| 40 to 44 Minutes | 7 (1.4%) | 7 (2.1%) |
| 45 to 59 Minutes | 13 (2.6%) | 2 (0.6%) |
| 60 to 89 Minutes | 55 (10.8%) | 15 (4.4%) |
| 90 or more Minutes | 6 (1.2%) | 0 (0.0%) |
Time of Departure to Work by Sex in Sublimity
The most frequent times of departure to work in Sublimity are 6:30 AM to 6:59 AM (75, 14.8%) for males and 6:30 AM to 6:59 AM (63, 18.6%) for females.
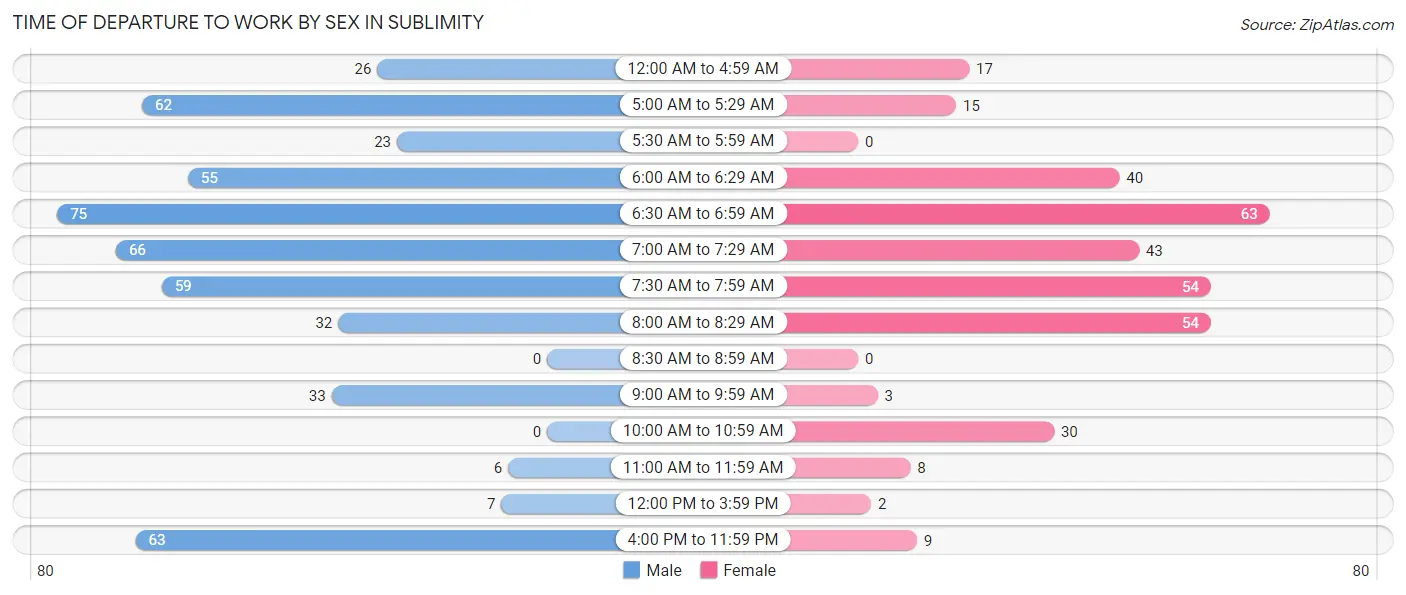
| Time of Departure | Male | Female |
| 12:00 AM to 4:59 AM | 26 (5.1%) | 17 (5.0%) |
| 5:00 AM to 5:29 AM | 62 (12.2%) | 15 (4.4%) |
| 5:30 AM to 5:59 AM | 23 (4.5%) | 0 (0.0%) |
| 6:00 AM to 6:29 AM | 55 (10.8%) | 40 (11.8%) |
| 6:30 AM to 6:59 AM | 75 (14.8%) | 63 (18.6%) |
| 7:00 AM to 7:29 AM | 66 (13.0%) | 43 (12.7%) |
| 7:30 AM to 7:59 AM | 59 (11.6%) | 54 (16.0%) |
| 8:00 AM to 8:29 AM | 32 (6.3%) | 54 (16.0%) |
| 8:30 AM to 8:59 AM | 0 (0.0%) | 0 (0.0%) |
| 9:00 AM to 9:59 AM | 33 (6.5%) | 3 (0.9%) |
| 10:00 AM to 10:59 AM | 0 (0.0%) | 30 (8.9%) |
| 11:00 AM to 11:59 AM | 6 (1.2%) | 8 (2.4%) |
| 12:00 PM to 3:59 PM | 7 (1.4%) | 2 (0.6%) |
| 4:00 PM to 11:59 PM | 63 (12.4%) | 9 (2.7%) |
| Total | 507 (100.0%) | 338 (100.0%) |
Housing Occupancy in Sublimity
Occupancy by Ownership in Sublimity
Of the total 1,282 dwellings in Sublimity, owner-occupied units account for 913 (71.2%), while renter-occupied units make up 369 (28.8%).
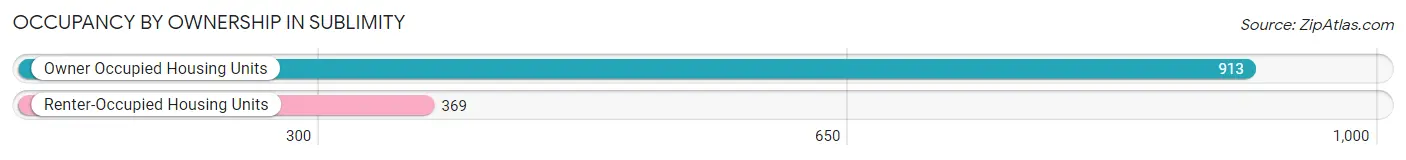
| Occupancy | # Housing Units | % Housing Units |
| Owner Occupied Housing Units | 913 | 71.2% |
| Renter-Occupied Housing Units | 369 | 28.8% |
| Total Occupied Housing Units | 1,282 | 100.0% |
Occupancy by Household Size in Sublimity
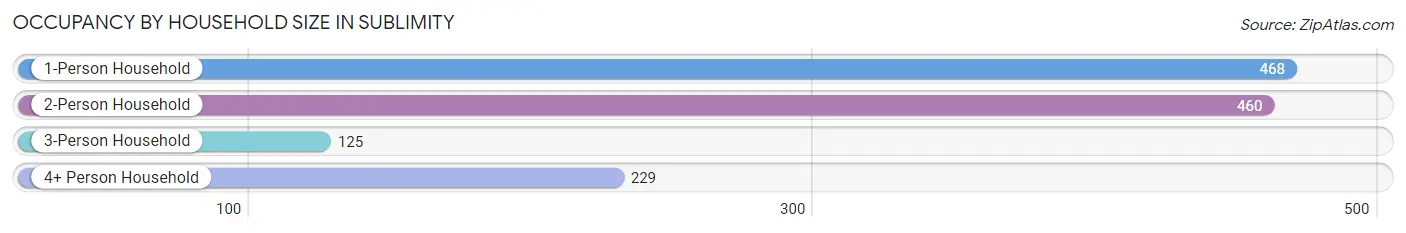
| Household Size | # Housing Units | % Housing Units |
| 1-Person Household | 468 | 36.5% |
| 2-Person Household | 460 | 35.9% |
| 3-Person Household | 125 | 9.8% |
| 4+ Person Household | 229 | 17.9% |
| Total Housing Units | 1,282 | 100.0% |
Occupancy by Ownership by Household Size in Sublimity
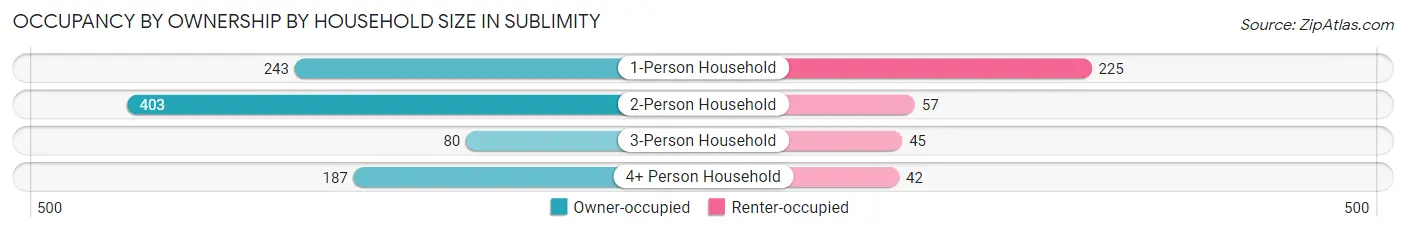
| Household Size | Owner-occupied | Renter-occupied |
| 1-Person Household | 243 (51.9%) | 225 (48.1%) |
| 2-Person Household | 403 (87.6%) | 57 (12.4%) |
| 3-Person Household | 80 (64.0%) | 45 (36.0%) |
| 4+ Person Household | 187 (81.7%) | 42 (18.3%) |
| Total Housing Units | 913 (71.2%) | 369 (28.8%) |
Occupancy by Educational Attainment in Sublimity
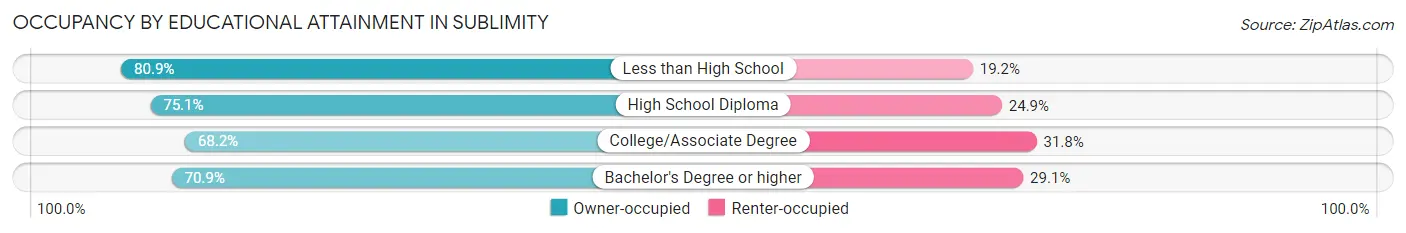
| Household Size | Owner-occupied | Renter-occupied |
| Less than High School | 38 (80.8%) | 9 (19.2%) |
| High School Diploma | 232 (75.1%) | 77 (24.9%) |
| College/Associate Degree | 339 (68.2%) | 158 (31.8%) |
| Bachelor's Degree or higher | 304 (70.9%) | 125 (29.1%) |
Occupancy by Age of Householder in Sublimity
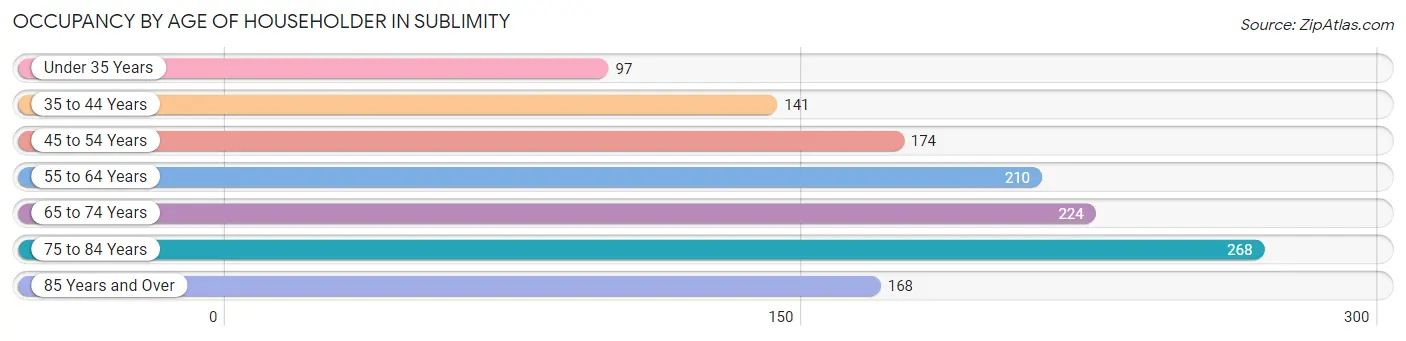
| Age Bracket | # Households | % Households |
| Under 35 Years | 97 | 7.6% |
| 35 to 44 Years | 141 | 11.0% |
| 45 to 54 Years | 174 | 13.6% |
| 55 to 64 Years | 210 | 16.4% |
| 65 to 74 Years | 224 | 17.5% |
| 75 to 84 Years | 268 | 20.9% |
| 85 Years and Over | 168 | 13.1% |
| Total | 1,282 | 100.0% |
Housing Finances in Sublimity
Median Income by Occupancy in Sublimity
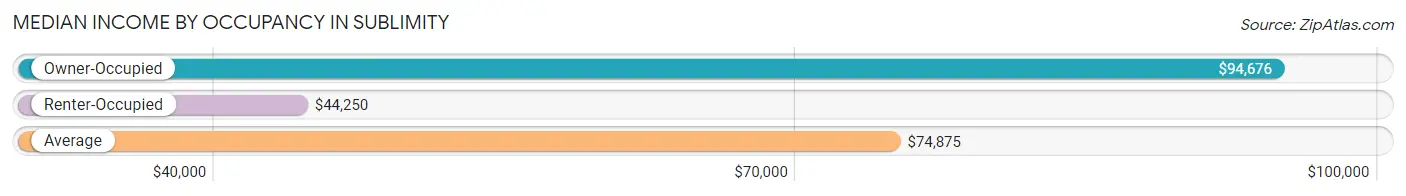
| Occupancy Type | # Households | Median Income |
| Owner-Occupied | 913 (71.2%) | $94,676 |
| Renter-Occupied | 369 (28.8%) | $44,250 |
| Average | 1,282 (100.0%) | $74,875 |
Occupancy by Householder Income Bracket in Sublimity
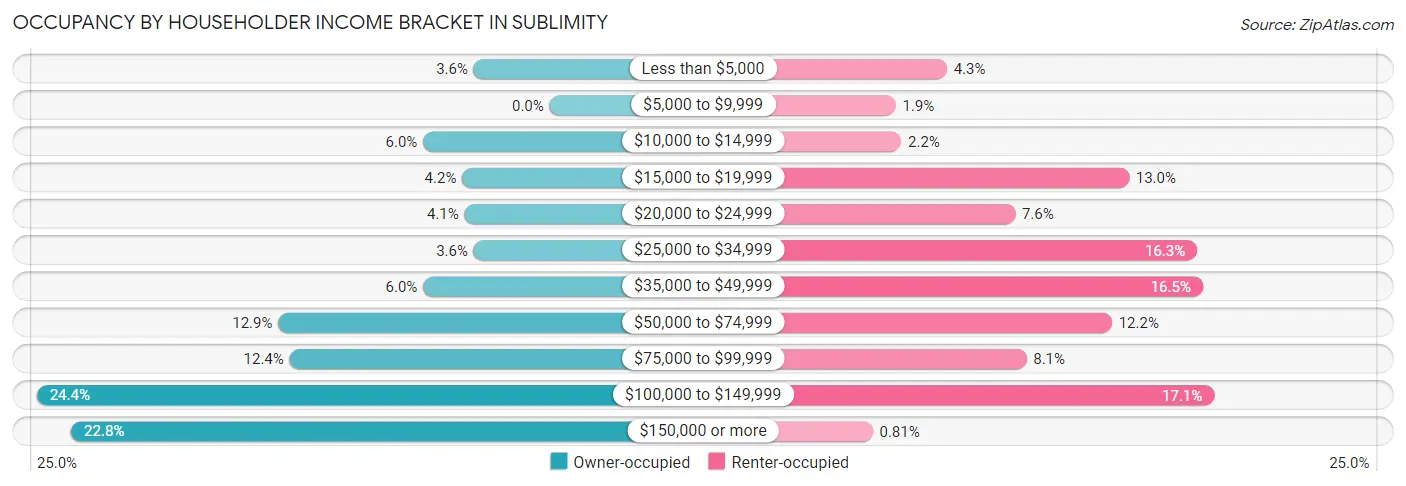
| Income Bracket | Owner-occupied | Renter-occupied |
| Less than $5,000 | 33 (3.6%) | 16 (4.3%) |
| $5,000 to $9,999 | 0 (0.0%) | 7 (1.9%) |
| $10,000 to $14,999 | 55 (6.0%) | 8 (2.2%) |
| $15,000 to $19,999 | 38 (4.2%) | 48 (13.0%) |
| $20,000 to $24,999 | 37 (4.1%) | 28 (7.6%) |
| $25,000 to $34,999 | 33 (3.6%) | 60 (16.3%) |
| $35,000 to $49,999 | 55 (6.0%) | 61 (16.5%) |
| $50,000 to $74,999 | 118 (12.9%) | 45 (12.2%) |
| $75,000 to $99,999 | 113 (12.4%) | 30 (8.1%) |
| $100,000 to $149,999 | 223 (24.4%) | 63 (17.1%) |
| $150,000 or more | 208 (22.8%) | 3 (0.8%) |
| Total | 913 (100.0%) | 369 (100.0%) |
Monthly Housing Cost Tiers in Sublimity
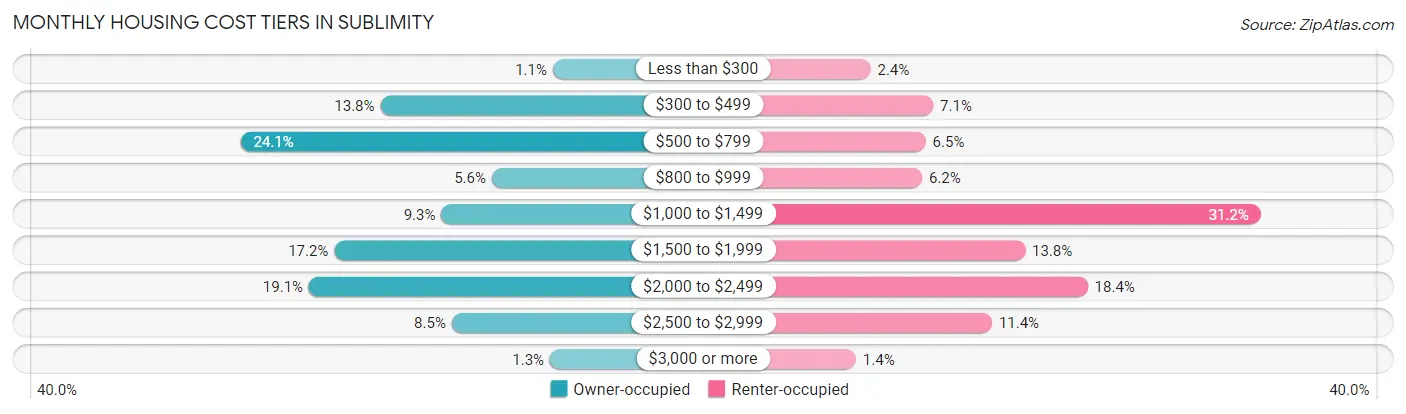
| Monthly Cost | Owner-occupied | Renter-occupied |
| Less than $300 | 10 (1.1%) | 9 (2.4%) |
| $300 to $499 | 126 (13.8%) | 26 (7.0%) |
| $500 to $799 | 220 (24.1%) | 24 (6.5%) |
| $800 to $999 | 51 (5.6%) | 23 (6.2%) |
| $1,000 to $1,499 | 85 (9.3%) | 115 (31.2%) |
| $1,500 to $1,999 | 157 (17.2%) | 51 (13.8%) |
| $2,000 to $2,499 | 174 (19.1%) | 68 (18.4%) |
| $2,500 to $2,999 | 78 (8.5%) | 42 (11.4%) |
| $3,000 or more | 12 (1.3%) | 5 (1.4%) |
| Total | 913 (100.0%) | 369 (100.0%) |
Physical Housing Characteristics in Sublimity
Housing Structures in Sublimity
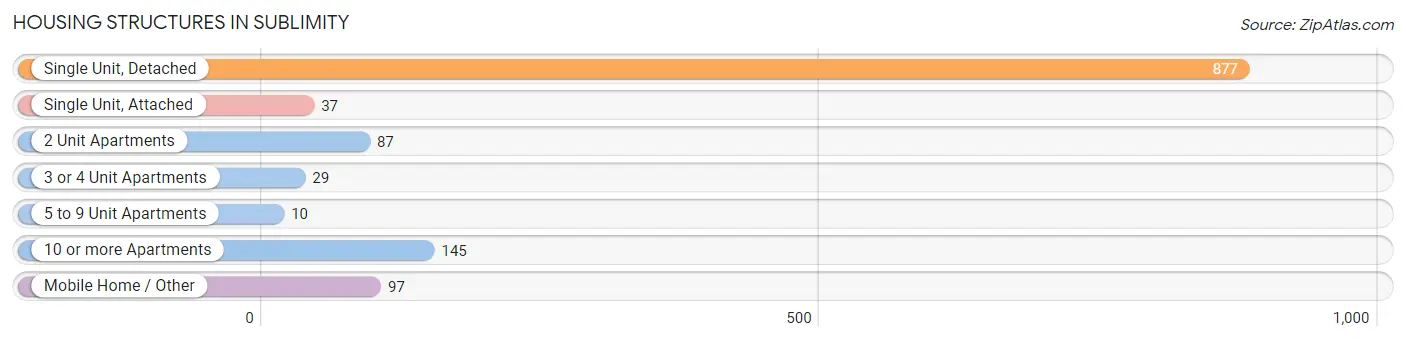
| Structure Type | # Housing Units | % Housing Units |
| Single Unit, Detached | 877 | 68.4% |
| Single Unit, Attached | 37 | 2.9% |
| 2 Unit Apartments | 87 | 6.8% |
| 3 or 4 Unit Apartments | 29 | 2.3% |
| 5 to 9 Unit Apartments | 10 | 0.8% |
| 10 or more Apartments | 145 | 11.3% |
| Mobile Home / Other | 97 | 7.6% |
| Total | 1,282 | 100.0% |
Housing Structures by Occupancy in Sublimity
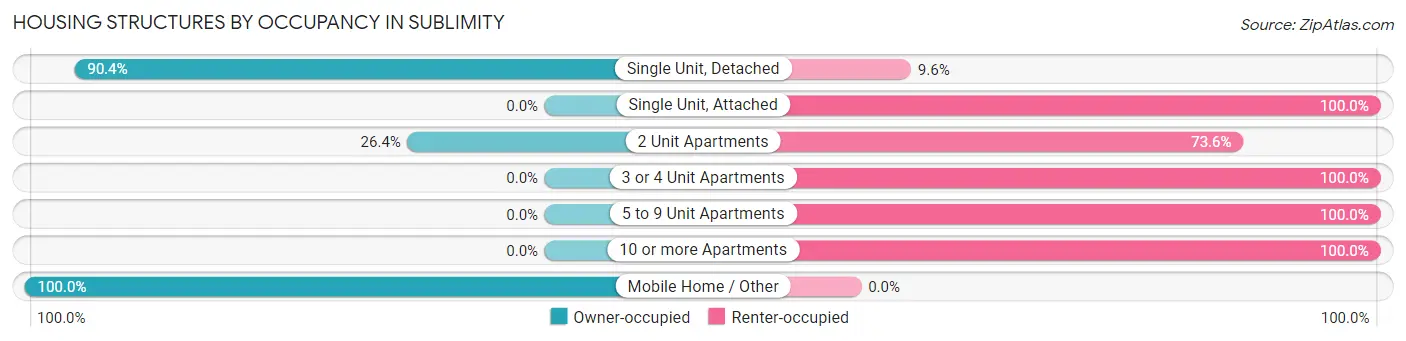
| Structure Type | Owner-occupied | Renter-occupied |
| Single Unit, Detached | 793 (90.4%) | 84 (9.6%) |
| Single Unit, Attached | 0 (0.0%) | 37 (100.0%) |
| 2 Unit Apartments | 23 (26.4%) | 64 (73.6%) |
| 3 or 4 Unit Apartments | 0 (0.0%) | 29 (100.0%) |
| 5 to 9 Unit Apartments | 0 (0.0%) | 10 (100.0%) |
| 10 or more Apartments | 0 (0.0%) | 145 (100.0%) |
| Mobile Home / Other | 97 (100.0%) | 0 (0.0%) |
| Total | 913 (71.2%) | 369 (28.8%) |
Housing Structures by Number of Rooms in Sublimity
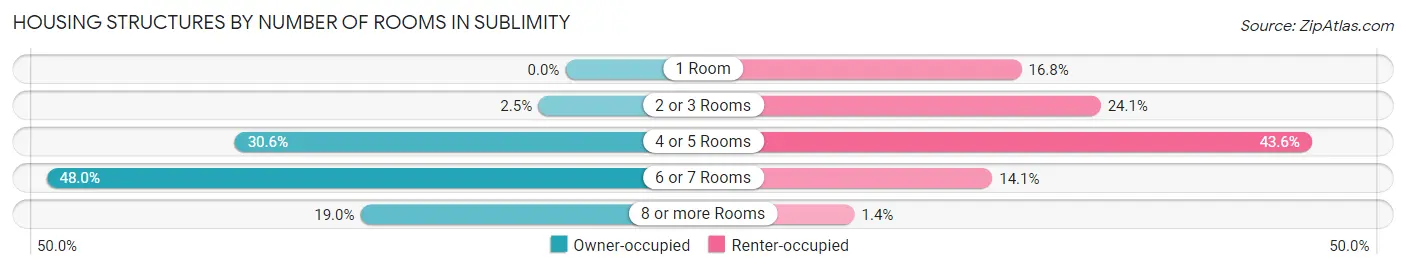
| Number of Rooms | Owner-occupied | Renter-occupied |
| 1 Room | 0 (0.0%) | 62 (16.8%) |
| 2 or 3 Rooms | 23 (2.5%) | 89 (24.1%) |
| 4 or 5 Rooms | 279 (30.6%) | 161 (43.6%) |
| 6 or 7 Rooms | 438 (48.0%) | 52 (14.1%) |
| 8 or more Rooms | 173 (19.0%) | 5 (1.4%) |
| Total | 913 (100.0%) | 369 (100.0%) |
Housing Structure by Heating Type in Sublimity
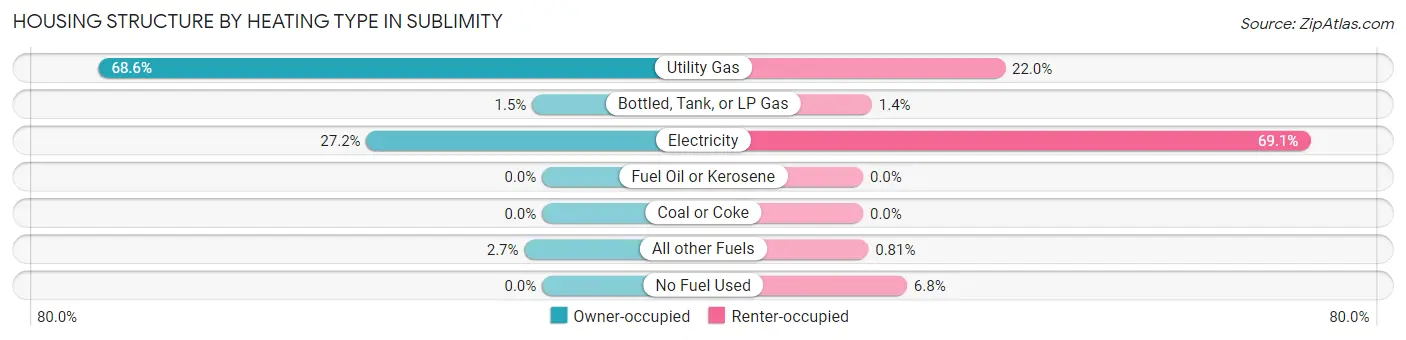
| Heating Type | Owner-occupied | Renter-occupied |
| Utility Gas | 626 (68.6%) | 81 (22.0%) |
| Bottled, Tank, or LP Gas | 14 (1.5%) | 5 (1.4%) |
| Electricity | 248 (27.2%) | 255 (69.1%) |
| Fuel Oil or Kerosene | 0 (0.0%) | 0 (0.0%) |
| Coal or Coke | 0 (0.0%) | 0 (0.0%) |
| All other Fuels | 25 (2.7%) | 3 (0.8%) |
| No Fuel Used | 0 (0.0%) | 25 (6.8%) |
| Total | 913 (100.0%) | 369 (100.0%) |
Household Vehicle Usage in Sublimity
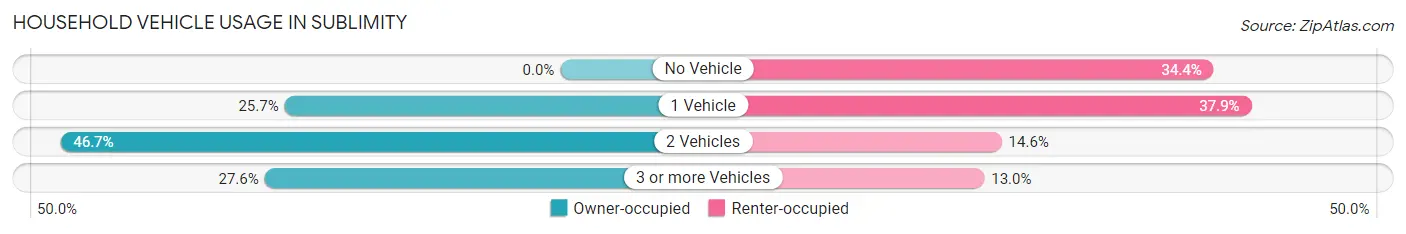
| Vehicles per Household | Owner-occupied | Renter-occupied |
| No Vehicle | 0 (0.0%) | 127 (34.4%) |
| 1 Vehicle | 235 (25.7%) | 140 (37.9%) |
| 2 Vehicles | 426 (46.7%) | 54 (14.6%) |
| 3 or more Vehicles | 252 (27.6%) | 48 (13.0%) |
| Total | 913 (100.0%) | 369 (100.0%) |
Real Estate & Mortgages in Sublimity
Real Estate and Mortgage Overview in Sublimity
| Characteristic | Without Mortgage | With Mortgage |
| Housing Units | 411 | 502 |
| Median Property Value | $373,900 | $471,000 |
| Median Household Income | $61,438 | $117 |
| Monthly Housing Costs | $603 | $12 |
| Real Estate Taxes | $2,750 | $0 |
Property Value by Mortgage Status in Sublimity
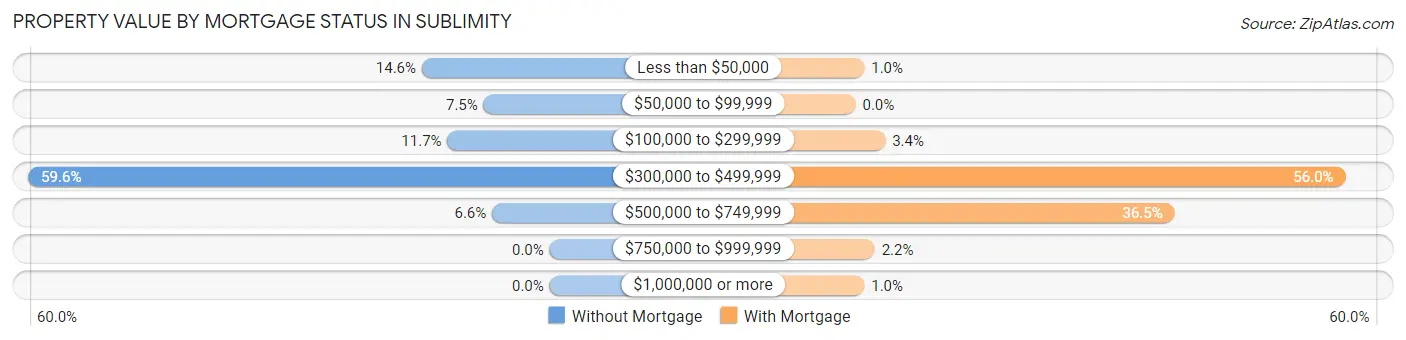
| Property Value | Without Mortgage | With Mortgage |
| Less than $50,000 | 60 (14.6%) | 5 (1.0%) |
| $50,000 to $99,999 | 31 (7.5%) | 0 (0.0%) |
| $100,000 to $299,999 | 48 (11.7%) | 17 (3.4%) |
| $300,000 to $499,999 | 245 (59.6%) | 281 (56.0%) |
| $500,000 to $749,999 | 27 (6.6%) | 183 (36.4%) |
| $750,000 to $999,999 | 0 (0.0%) | 11 (2.2%) |
| $1,000,000 or more | 0 (0.0%) | 5 (1.0%) |
| Total | 411 (100.0%) | 502 (100.0%) |
Household Income by Mortgage Status in Sublimity
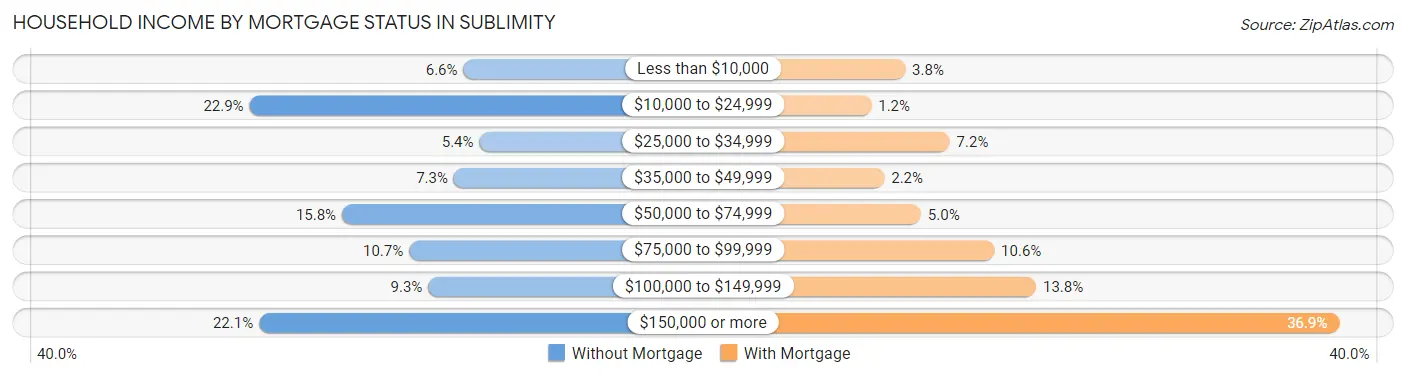
| Household Income | Without Mortgage | With Mortgage |
| Less than $10,000 | 27 (6.6%) | 19 (3.8%) |
| $10,000 to $24,999 | 94 (22.9%) | 6 (1.2%) |
| $25,000 to $34,999 | 22 (5.3%) | 36 (7.2%) |
| $35,000 to $49,999 | 30 (7.3%) | 11 (2.2%) |
| $50,000 to $74,999 | 65 (15.8%) | 25 (5.0%) |
| $75,000 to $99,999 | 44 (10.7%) | 53 (10.6%) |
| $100,000 to $149,999 | 38 (9.2%) | 69 (13.8%) |
| $150,000 or more | 91 (22.1%) | 185 (36.8%) |
| Total | 411 (100.0%) | 502 (100.0%) |
Property Value to Household Income Ratio in Sublimity
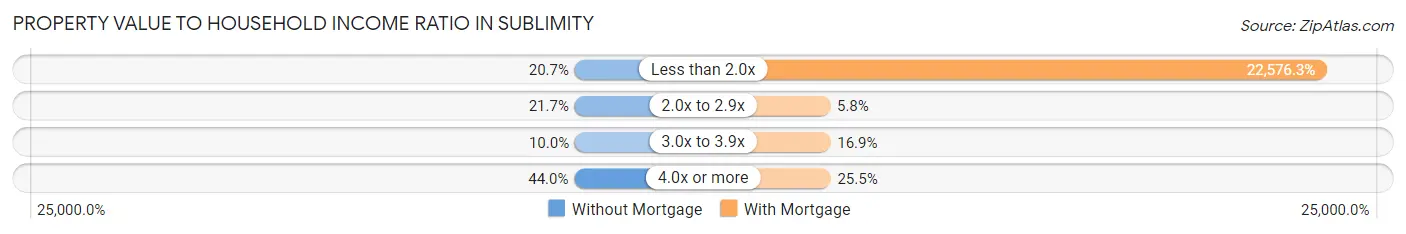
| Value-to-Income Ratio | Without Mortgage | With Mortgage |
| Less than 2.0x | 85 (20.7%) | 113,333 (22,576.3%) |
| 2.0x to 2.9x | 89 (21.6%) | 29 (5.8%) |
| 3.0x to 3.9x | 41 (10.0%) | 85 (16.9%) |
| 4.0x or more | 181 (44.0%) | 128 (25.5%) |
| Total | 411 (100.0%) | 502 (100.0%) |
Real Estate Taxes by Mortgage Status in Sublimity
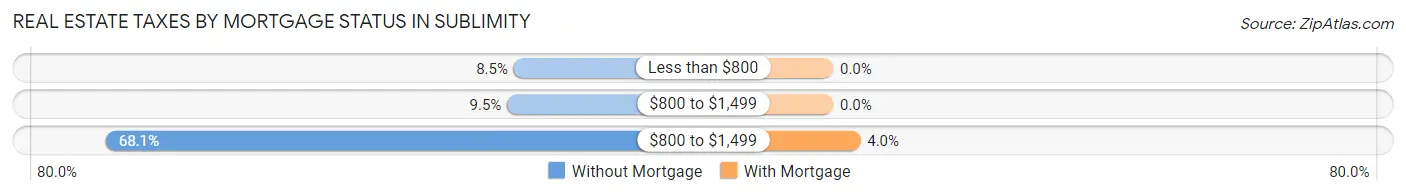
| Property Taxes | Without Mortgage | With Mortgage |
| Less than $800 | 35 (8.5%) | 0 (0.0%) |
| $800 to $1,499 | 39 (9.5%) | 0 (0.0%) |
| $800 to $1,499 | 280 (68.1%) | 20 (4.0%) |
| Total | 411 (100.0%) | 502 (100.0%) |
Health & Disability in Sublimity
Health Insurance Coverage by Age in Sublimity
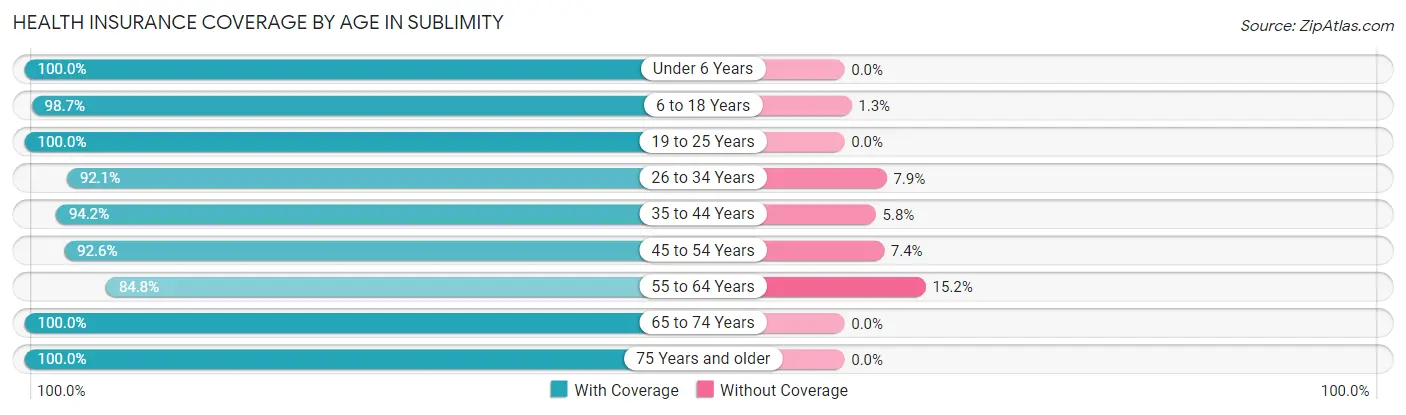
| Age Bracket | With Coverage | Without Coverage |
| Under 6 Years | 222 (100.0%) | 0 (0.0%) |
| 6 to 18 Years | 449 (98.7%) | 6 (1.3%) |
| 19 to 25 Years | 75 (100.0%) | 0 (0.0%) |
| 26 to 34 Years | 199 (92.1%) | 17 (7.9%) |
| 35 to 44 Years | 274 (94.2%) | 17 (5.8%) |
| 45 to 54 Years | 289 (92.6%) | 23 (7.4%) |
| 55 to 64 Years | 291 (84.8%) | 52 (15.2%) |
| 65 to 74 Years | 388 (100.0%) | 0 (0.0%) |
| 75 Years and older | 520 (100.0%) | 0 (0.0%) |
| Total | 2,707 (95.9%) | 115 (4.1%) |
Health Insurance Coverage by Citizenship Status in Sublimity
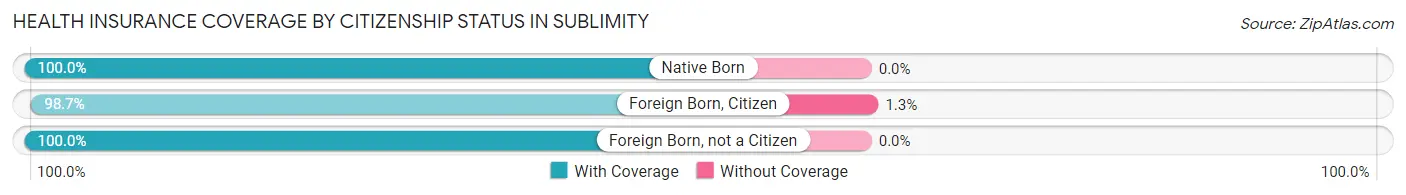
| Citizenship Status | With Coverage | Without Coverage |
| Native Born | 222 (100.0%) | 0 (0.0%) |
| Foreign Born, Citizen | 449 (98.7%) | 6 (1.3%) |
| Foreign Born, not a Citizen | 75 (100.0%) | 0 (0.0%) |
Health Insurance Coverage by Household Income in Sublimity
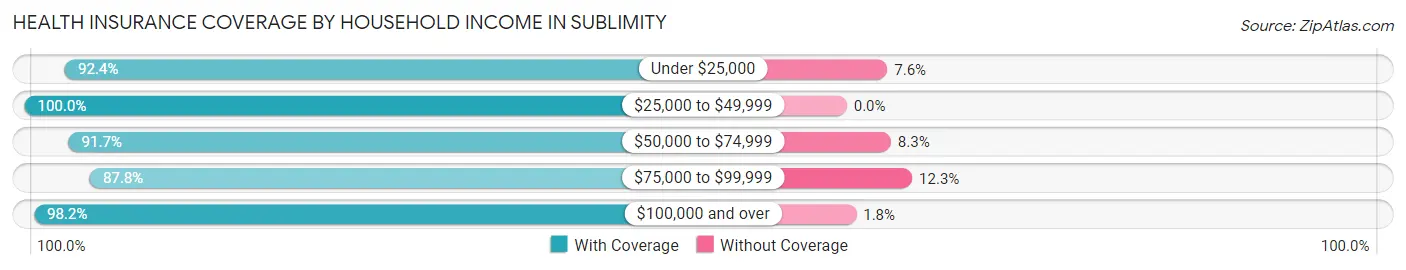
| Household Income | With Coverage | Without Coverage |
| Under $25,000 | 280 (92.4%) | 23 (7.6%) |
| $25,000 to $49,999 | 373 (100.0%) | 0 (0.0%) |
| $50,000 to $74,999 | 322 (91.7%) | 29 (8.3%) |
| $75,000 to $99,999 | 265 (87.7%) | 37 (12.2%) |
| $100,000 and over | 1,435 (98.2%) | 26 (1.8%) |
Public vs Private Health Insurance Coverage by Age in Sublimity
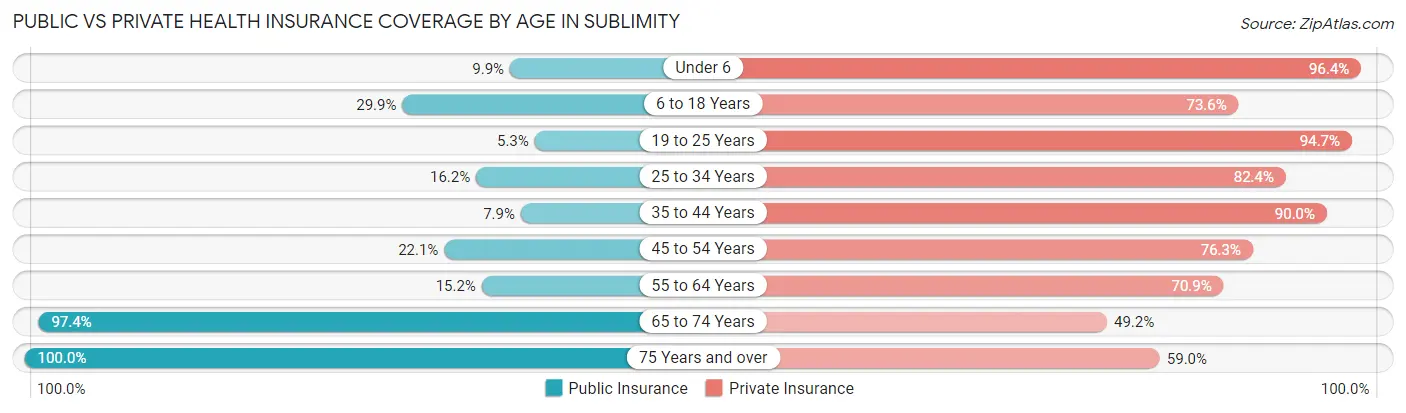
| Age Bracket | Public Insurance | Private Insurance |
| Under 6 | 22 (9.9%) | 214 (96.4%) |
| 6 to 18 Years | 136 (29.9%) | 335 (73.6%) |
| 19 to 25 Years | 4 (5.3%) | 71 (94.7%) |
| 25 to 34 Years | 35 (16.2%) | 178 (82.4%) |
| 35 to 44 Years | 23 (7.9%) | 262 (90.0%) |
| 45 to 54 Years | 69 (22.1%) | 238 (76.3%) |
| 55 to 64 Years | 52 (15.2%) | 243 (70.9%) |
| 65 to 74 Years | 378 (97.4%) | 191 (49.2%) |
| 75 Years and over | 520 (100.0%) | 307 (59.0%) |
| Total | 1,239 (43.9%) | 2,039 (72.3%) |
Disability Status by Sex by Age in Sublimity
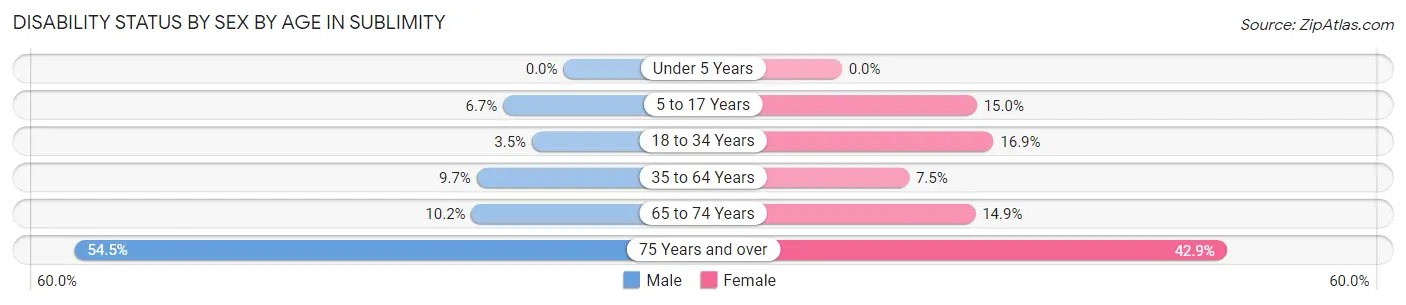
| Age Bracket | Male | Female |
| Under 5 Years | 0 (0.0%) | 0 (0.0%) |
| 5 to 17 Years | 20 (6.7%) | 23 (15.0%) |
| 18 to 34 Years | 5 (3.5%) | 27 (16.9%) |
| 35 to 64 Years | 50 (9.7%) | 32 (7.5%) |
| 65 to 74 Years | 17 (10.2%) | 33 (14.9%) |
| 75 Years and over | 104 (54.4%) | 141 (42.9%) |
Disability Class by Sex by Age in Sublimity
Disability Class: Hearing Difficulty
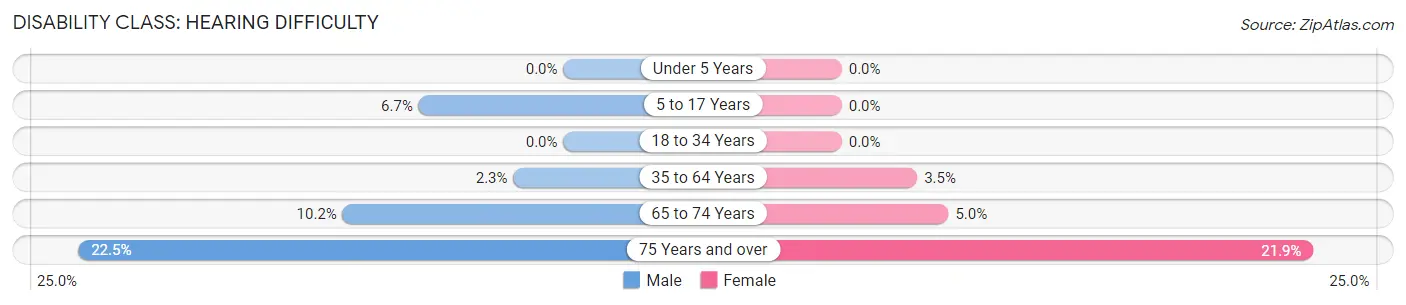
| Age Bracket | Male | Female |
| Under 5 Years | 0 (0.0%) | 0 (0.0%) |
| 5 to 17 Years | 20 (6.7%) | 0 (0.0%) |
| 18 to 34 Years | 0 (0.0%) | 0 (0.0%) |
| 35 to 64 Years | 12 (2.3%) | 15 (3.5%) |
| 65 to 74 Years | 17 (10.2%) | 11 (5.0%) |
| 75 Years and over | 43 (22.5%) | 72 (21.9%) |
Disability Class: Vision Difficulty
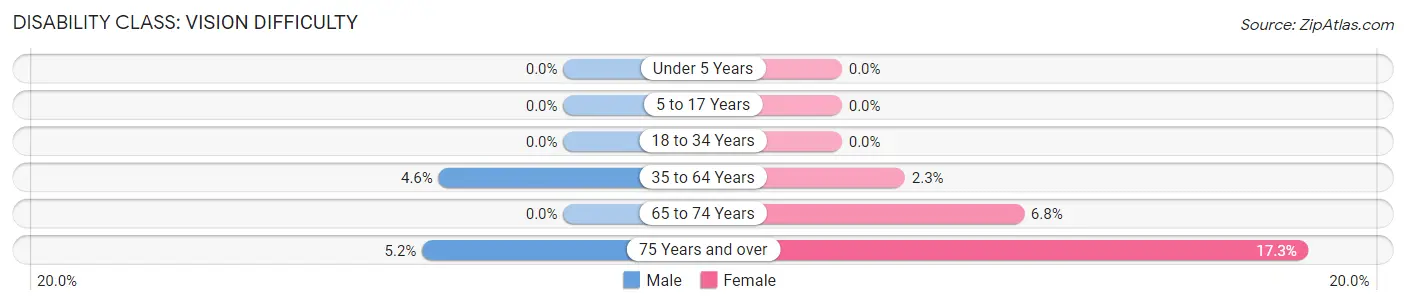
| Age Bracket | Male | Female |
| Under 5 Years | 0 (0.0%) | 0 (0.0%) |
| 5 to 17 Years | 0 (0.0%) | 0 (0.0%) |
| 18 to 34 Years | 0 (0.0%) | 0 (0.0%) |
| 35 to 64 Years | 24 (4.6%) | 10 (2.3%) |
| 65 to 74 Years | 0 (0.0%) | 15 (6.8%) |
| 75 Years and over | 10 (5.2%) | 57 (17.3%) |
Disability Class: Cognitive Difficulty
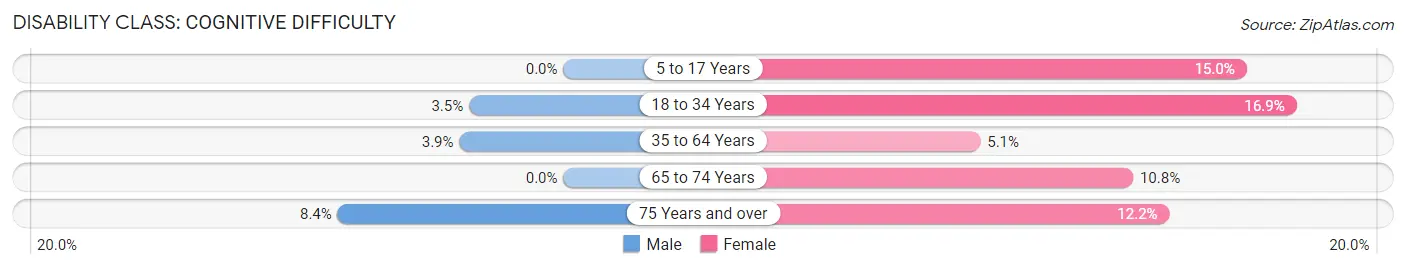
| Age Bracket | Male | Female |
| 5 to 17 Years | 0 (0.0%) | 23 (15.0%) |
| 18 to 34 Years | 5 (3.5%) | 27 (16.9%) |
| 35 to 64 Years | 20 (3.9%) | 22 (5.1%) |
| 65 to 74 Years | 0 (0.0%) | 24 (10.8%) |
| 75 Years and over | 16 (8.4%) | 40 (12.2%) |
Disability Class: Ambulatory Difficulty
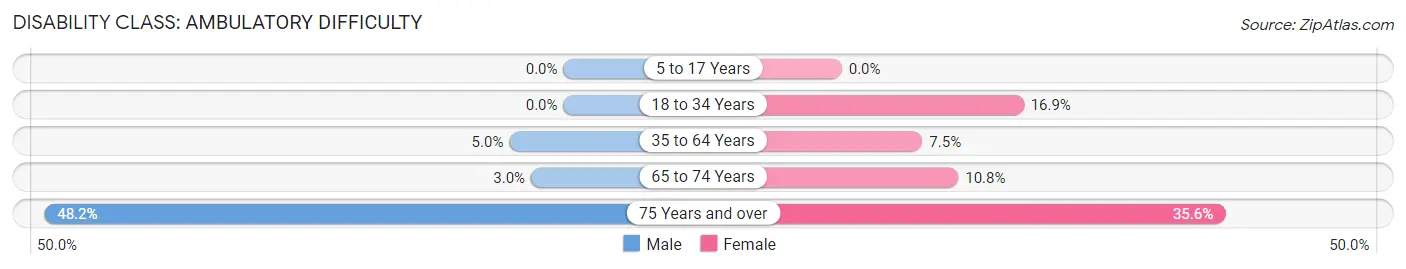
| Age Bracket | Male | Female |
| 5 to 17 Years | 0 (0.0%) | 0 (0.0%) |
| 18 to 34 Years | 0 (0.0%) | 27 (16.9%) |
| 35 to 64 Years | 26 (5.0%) | 32 (7.5%) |
| 65 to 74 Years | 5 (3.0%) | 24 (10.8%) |
| 75 Years and over | 92 (48.2%) | 117 (35.6%) |
Disability Class: Self-Care Difficulty
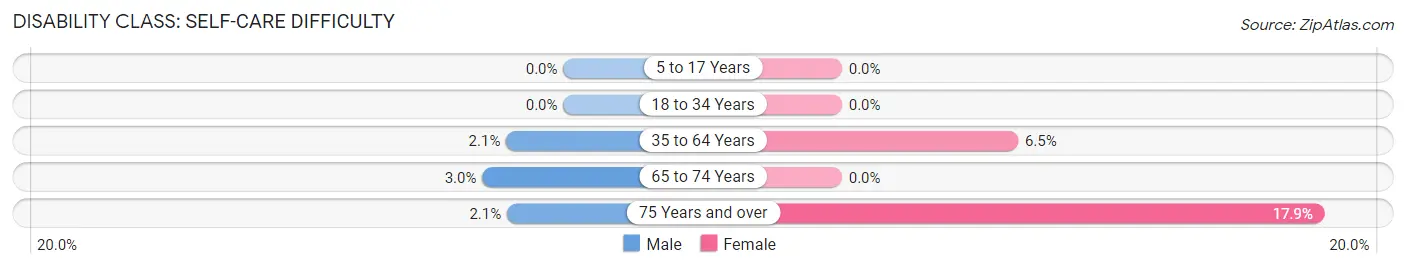
| Age Bracket | Male | Female |
| 5 to 17 Years | 0 (0.0%) | 0 (0.0%) |
| 18 to 34 Years | 0 (0.0%) | 0 (0.0%) |
| 35 to 64 Years | 11 (2.1%) | 28 (6.5%) |
| 65 to 74 Years | 5 (3.0%) | 0 (0.0%) |
| 75 Years and over | 4 (2.1%) | 59 (17.9%) |
Technology Access in Sublimity
Computing Device Access in Sublimity
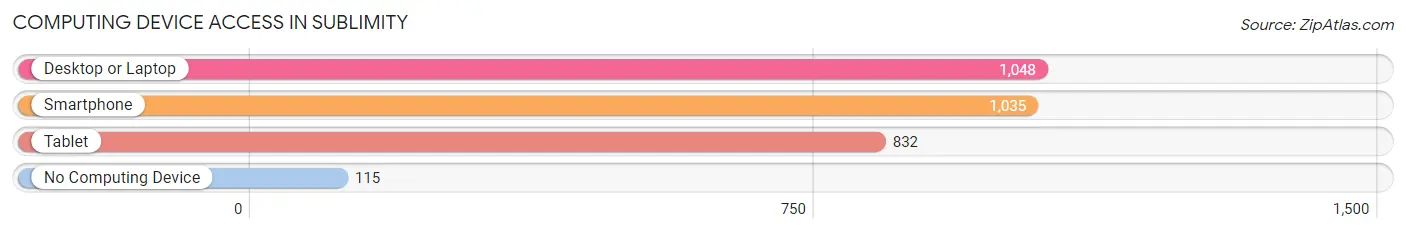
| Device Type | # Households | % Households |
| Desktop or Laptop | 1,048 | 81.8% |
| Smartphone | 1,035 | 80.7% |
| Tablet | 832 | 64.9% |
| No Computing Device | 115 | 9.0% |
| Total | 1,282 | 100.0% |
Internet Access in Sublimity
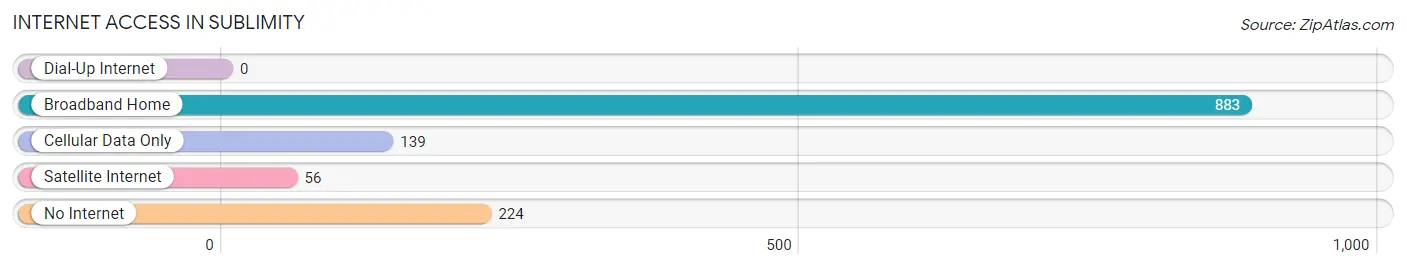
| Internet Type | # Households | % Households |
| Dial-Up Internet | 0 | 0.0% |
| Broadband Home | 883 | 68.9% |
| Cellular Data Only | 139 | 10.8% |
| Satellite Internet | 56 | 4.4% |
| No Internet | 224 | 17.5% |
| Total | 1,282 | 100.0% |
Sublimity Summary
Sublimity is a small city located in Marion County, Oregon, United States. It is situated in the foothills of the Cascade Mountains, approximately 20 miles southeast of Salem, the state capital. The population of Sublimity was 1,845 at the 2010 census.
History
The area that is now Sublimity was first settled in the early 1850s by a group of German immigrants. The town was originally known as “Sublimity Station”, and was a stop on the Oregon and California Railroad. The name was changed to Sublimity in 1891, and the town was officially incorporated in 1903.
The town was originally a farming community, and the main crops were wheat, oats, and hay. In the early 1900s, the town began to grow and develop, and the first bank was established in 1906. The town also had a post office, a hotel, a blacksmith shop, and a general store.
In the 1920s, the town began to experience a period of growth and prosperity. The population increased from 500 in 1920 to 1,000 in 1930. The town also had a movie theater, a bowling alley, and a library.
In the 1950s, the town began to decline. The railroad stopped running in the 1950s, and the population decreased to 500 by 1960. The town also lost its post office and its bank.
Geography
Sublimity is located in the foothills of the Cascade Mountains, approximately 20 miles southeast of Salem, the state capital. The city is situated at an elevation of 830 feet above sea level. The city covers an area of 1.2 square miles, and is located in the Willamette Valley.
The city is bordered by the cities of Aumsville to the north, Stayton to the east, and Turner to the south. The city is also bordered by the Santiam River to the west.
Economy
The economy of Sublimity is largely based on agriculture. The main crops are wheat, oats, and hay. The city also has a number of small businesses, including restaurants, retail stores, and service providers.
The city is also home to a number of manufacturing companies, including a wood products company, a metal fabrication company, and a plastics company.
Demographics
As of the 2010 census, the population of Sublimity was 1,845. The racial makeup of the city was 94.3% White, 0.7% African American, 0.7% Native American, 0.7% Asian, 0.2% Pacific Islander, and 2.6% from other races.
The median household income in Sublimity was $45,938, and the median family income was $51,250. The per capita income was $20,945.
Conclusion
Sublimity is a small city located in Marion County, Oregon, United States. It is situated in the foothills of the Cascade Mountains, approximately 20 miles southeast of Salem, the state capital. The population of Sublimity was 1,845 at the 2010 census. The economy of Sublimity is largely based on agriculture, and the city also has a number of small businesses and manufacturing companies. The racial makeup of the city was 94.3% White, 0.7% African American, 0.7% Native American, 0.7% Asian, 0.2% Pacific Islander, and 2.6% from other races. The median household income in Sublimity was $45,938, and the median family income was $51,250.
Common Questions
What is Per Capita Income in Sublimity?
Per Capita income in Sublimity is $39,078.
What is the Median Family Income in Sublimity?
Median Family Income in Sublimity is $110,990.
What is the Median Household income in Sublimity?
Median Household Income in Sublimity is $74,875.
What is Income or Wage Gap in Sublimity?
Income or Wage Gap in Sublimity is 2.8%.
Women in Sublimity earn 97.2 cents for every dollar earned by a man.
What is Inequality or Gini Index in Sublimity?
Inequality or Gini Index in Sublimity is 0.43.
What is the Total Population of Sublimity?
Total Population of Sublimity is 2,945.
What is the Total Male Population of Sublimity?
Total Male Population of Sublimity is 1,471.
What is the Total Female Population of Sublimity?
Total Female Population of Sublimity is 1,474.
What is the Ratio of Males per 100 Females in Sublimity?
There are 99.80 Males per 100 Females in Sublimity.
What is the Ratio of Females per 100 Males in Sublimity?
There are 100.20 Females per 100 Males in Sublimity.
What is the Median Population Age in Sublimity?
Median Population Age in Sublimity is 51.8 Years.
What is the Average Family Size in Sublimity
Average Family Size in Sublimity is 2.8 People.
What is the Average Household Size in Sublimity
Average Household Size in Sublimity is 2.2 People.
How Large is the Labor Force in Sublimity?
There are 1,044 People in the Labor Forcein in Sublimity.
What is the Percentage of People in the Labor Force in Sublimity?
43.9% of People are in the Labor Force in Sublimity.
What is the Unemployment Rate in Sublimity?
Unemployment Rate in Sublimity is 2.5%.