Stayton, OR Map & Demographics
Stayton Map
Stayton Overview
$36,926
PER CAPITA INCOME
$82,895
AVG FAMILY INCOME
$72,639
AVG HOUSEHOLD INCOME
43.3%
WAGE / INCOME GAP [ % ]
56.7¢/ $1
WAGE / INCOME GAP [ $ ]
0.50
INEQUALITY / GINI INDEX
8,210
TOTAL POPULATION
4,027
MALE POPULATION
4,183
FEMALE POPULATION
96.27
MALES / 100 FEMALES
103.87
FEMALES / 100 MALES
38.4
MEDIAN AGE
3.1
AVG FAMILY SIZE
2.6
AVG HOUSEHOLD SIZE
3,904
LABOR FORCE [ PEOPLE ]
62.9%
PERCENT IN LABOR FORCE
4.8%
UNEMPLOYMENT RATE
Stayton Zip Codes
Stayton Area Codes
Income in Stayton
Income Overview in Stayton
Per Capita Income in Stayton is $36,926, while median incomes of families and households are $82,895 and $72,639 respectively.
| Characteristic | Number | Measure |
| Per Capita Income | 8,210 | $36,926 |
| Median Family Income | 2,272 | $82,895 |
| Mean Family Income | 2,272 | $114,985 |
| Median Household Income | 3,095 | $72,639 |
| Mean Household Income | 3,095 | $95,051 |
| Income Deficit | 2,272 | $0 |
| Wage / Income Gap (%) | 8,210 | 43.27% |
| Wage / Income Gap ($) | 8,210 | 56.73¢ per $1 |
| Gini / Inequality Index | 8,210 | 0.50 |
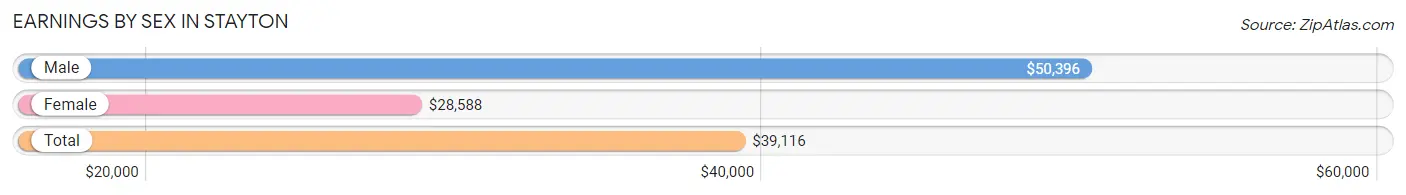
Earnings by Sex in Stayton
Average Earnings in Stayton are $39,116, $50,396 for men and $28,588 for women, a difference of 43.3%.
| Sex | Number | Average Earnings |
| Male | 2,036 (50.2%) | $50,396 |
| Female | 2,021 (49.8%) | $28,588 |
| Total | 4,057 (100.0%) | $39,116 |
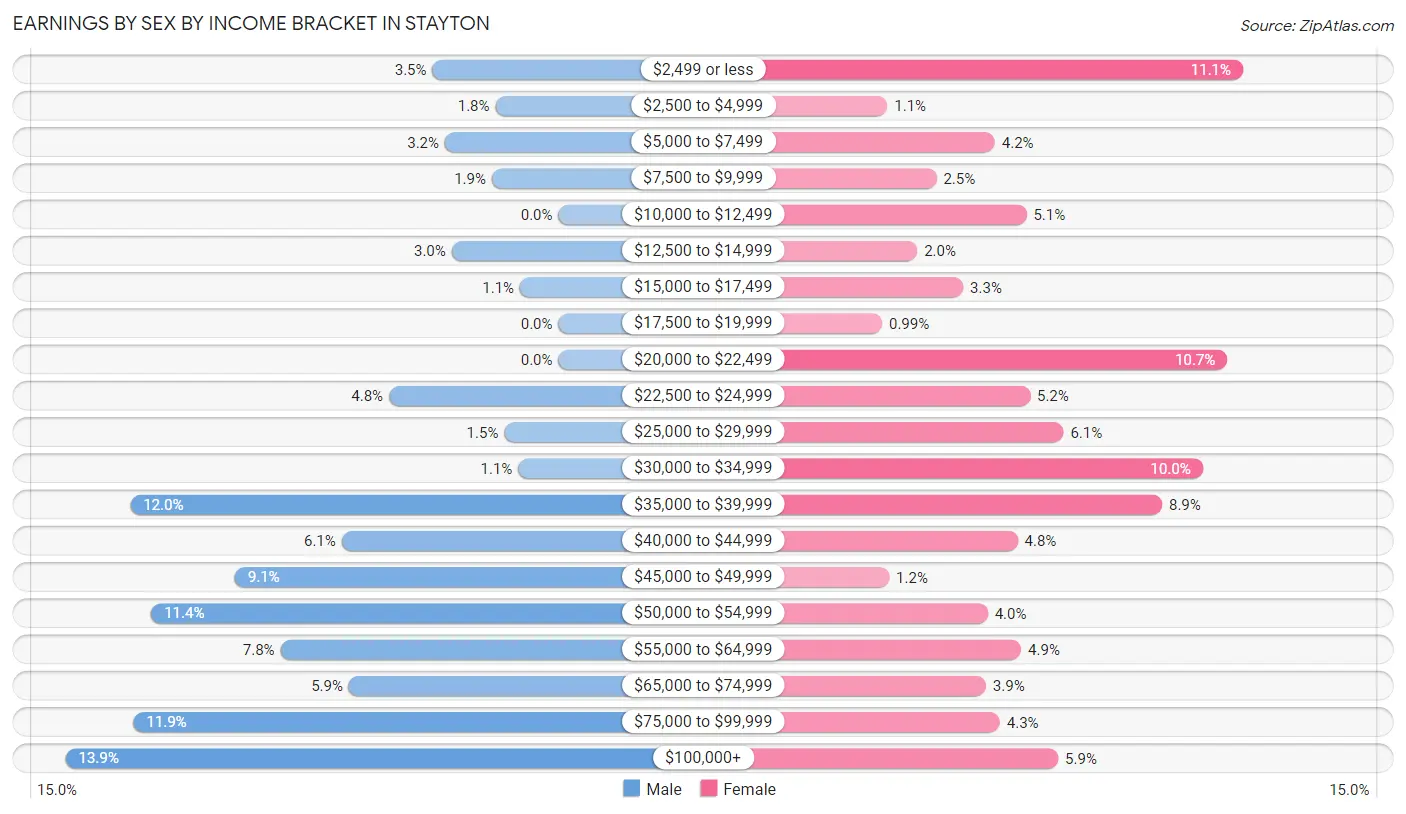
Earnings by Sex by Income Bracket in Stayton
The most common earnings brackets in Stayton are $100,000+ for men (282 | 13.9%) and $2,499 or less for women (225 | 11.1%).
| Income | Male | Female |
| $2,499 or less | 72 (3.5%) | 225 (11.1%) |
| $2,500 to $4,999 | 36 (1.8%) | 23 (1.1%) |
| $5,000 to $7,499 | 65 (3.2%) | 84 (4.2%) |
| $7,500 to $9,999 | 38 (1.9%) | 51 (2.5%) |
| $10,000 to $12,499 | 0 (0.0%) | 102 (5.1%) |
| $12,500 to $14,999 | 61 (3.0%) | 40 (2.0%) |
| $15,000 to $17,499 | 22 (1.1%) | 66 (3.3%) |
| $17,500 to $19,999 | 0 (0.0%) | 20 (1.0%) |
| $20,000 to $22,499 | 0 (0.0%) | 216 (10.7%) |
| $22,500 to $24,999 | 97 (4.8%) | 104 (5.1%) |
| $25,000 to $29,999 | 31 (1.5%) | 123 (6.1%) |
| $30,000 to $34,999 | 23 (1.1%) | 202 (10.0%) |
| $35,000 to $39,999 | 245 (12.0%) | 179 (8.9%) |
| $40,000 to $44,999 | 124 (6.1%) | 97 (4.8%) |
| $45,000 to $49,999 | 185 (9.1%) | 24 (1.2%) |
| $50,000 to $54,999 | 233 (11.4%) | 80 (4.0%) |
| $55,000 to $64,999 | 159 (7.8%) | 99 (4.9%) |
| $65,000 to $74,999 | 120 (5.9%) | 79 (3.9%) |
| $75,000 to $99,999 | 243 (11.9%) | 87 (4.3%) |
| $100,000+ | 282 (13.9%) | 120 (5.9%) |
| Total | 2,036 (100.0%) | 2,021 (100.0%) |
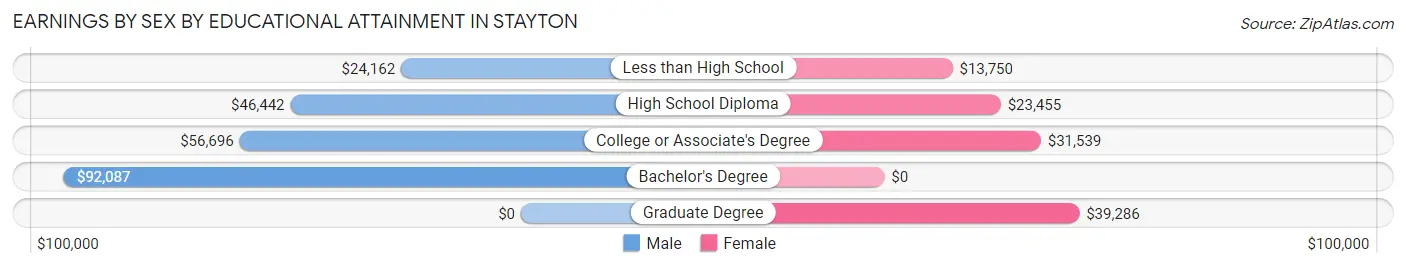
Earnings by Sex by Educational Attainment in Stayton
Average earnings in Stayton are $50,865 for men and $31,324 for women, a difference of 38.4%. Men with an educational attainment of bachelor's degree enjoy the highest average annual earnings of $92,087, while those with less than high school education earn the least with $24,162. Women with an educational attainment of graduate degree earn the most with the average annual earnings of $39,286, while those with less than high school education have the smallest earnings of $13,750.
| Educational Attainment | Male Income | Female Income |
| Less than High School | $24,162 | $13,750 |
| High School Diploma | $46,442 | $23,455 |
| College or Associate's Degree | $56,696 | $31,539 |
| Bachelor's Degree | $92,087 | $0 |
| Graduate Degree | - | - |
| Total | $50,865 | $31,324 |
Family Income in Stayton
Family Income Brackets in Stayton
According to the Stayton family income data, there are 611 families falling into the $100,000 to $149,999 income range, which is the most common income bracket and makes up 26.9% of all families. Conversely, the $10,000 to $14,999 income bracket is the least frequent group with only 52 families (2.3%) belonging to this category.
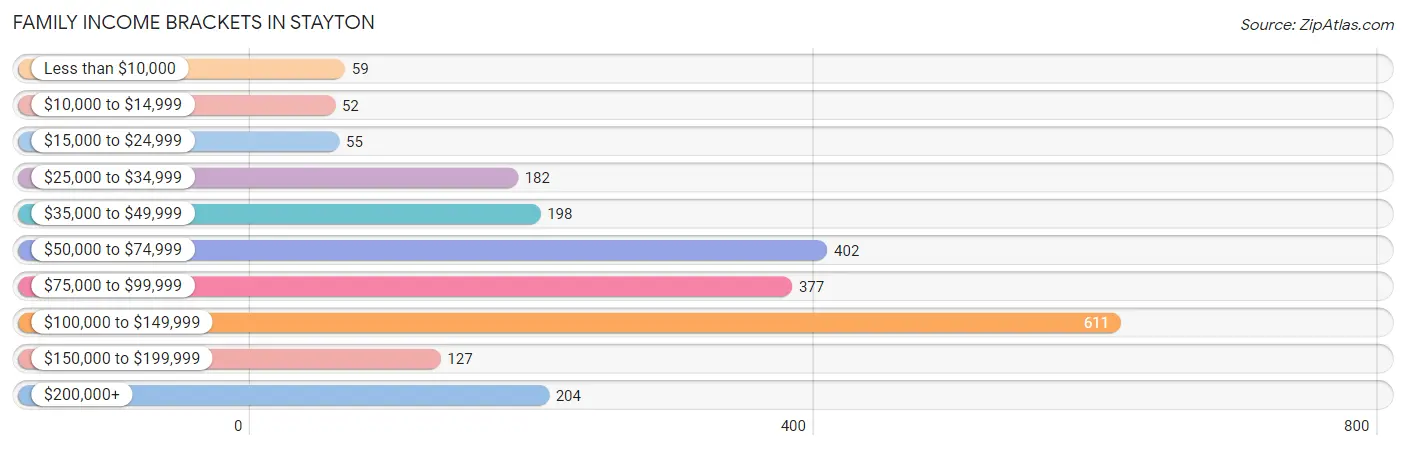
| Income Bracket | # Families | % Families |
| Less than $10,000 | 59 | 2.6% |
| $10,000 to $14,999 | 52 | 2.3% |
| $15,000 to $24,999 | 55 | 2.4% |
| $25,000 to $34,999 | 182 | 8.0% |
| $35,000 to $49,999 | 198 | 8.7% |
| $50,000 to $74,999 | 402 | 17.7% |
| $75,000 to $99,999 | 377 | 16.6% |
| $100,000 to $149,999 | 611 | 26.9% |
| $150,000 to $199,999 | 127 | 5.6% |
| $200,000+ | 204 | 9.0% |
Family Income by Famaliy Size in Stayton
5-person families (141 | 6.2%) account for the highest median family income in Stayton with $248,084 per family, while 5-person families (141 | 6.2%) have the highest median income of $49,617 per family member.
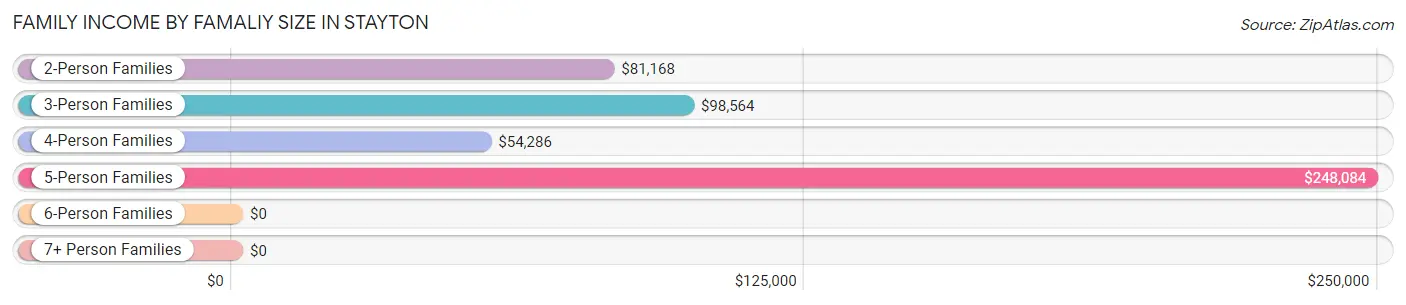
| Income Bracket | # Families | Median Income |
| 2-Person Families | 879 (38.7%) | $81,168 |
| 3-Person Families | 672 (29.6%) | $98,564 |
| 4-Person Families | 480 (21.1%) | $54,286 |
| 5-Person Families | 141 (6.2%) | $248,084 |
| 6-Person Families | 100 (4.4%) | $0 |
| 7+ Person Families | 0 (0.0%) | $0 |
| Total | 2,272 (100.0%) | $82,895 |
Family Income by Number of Earners in Stayton
The median family income in Stayton is $82,895, with families comprising 3+ earners (187) having the highest median family income of $132,176, while families with 1 earner (799) have the lowest median family income of $50,060, accounting for 8.2% and 35.2% of families, respectively.
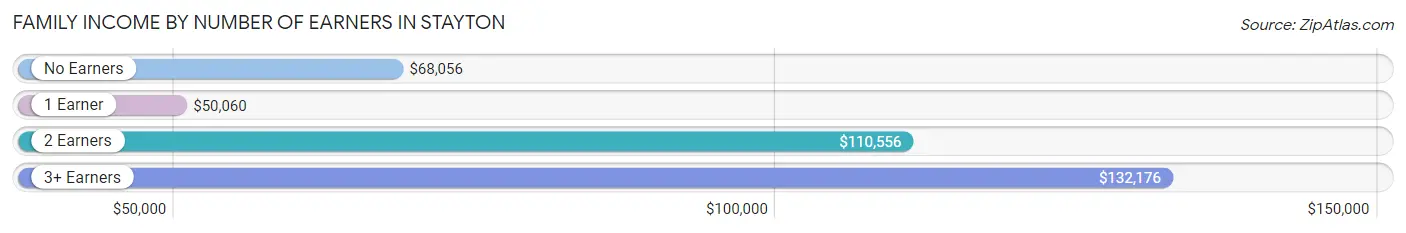
| Number of Earners | # Families | Median Income |
| No Earners | 246 (10.8%) | $68,056 |
| 1 Earner | 799 (35.2%) | $50,060 |
| 2 Earners | 1,040 (45.8%) | $110,556 |
| 3+ Earners | 187 (8.2%) | $132,176 |
| Total | 2,272 (100.0%) | $82,895 |
Household Income in Stayton
Household Income Brackets in Stayton
With 706 households falling in the category, the $100,000 to $149,999 income range is the most frequent in Stayton, accounting for 22.8% of all households. In contrast, only 90 households (2.9%) fall into the $10,000 to $14,999 income bracket, making it the least populous group.
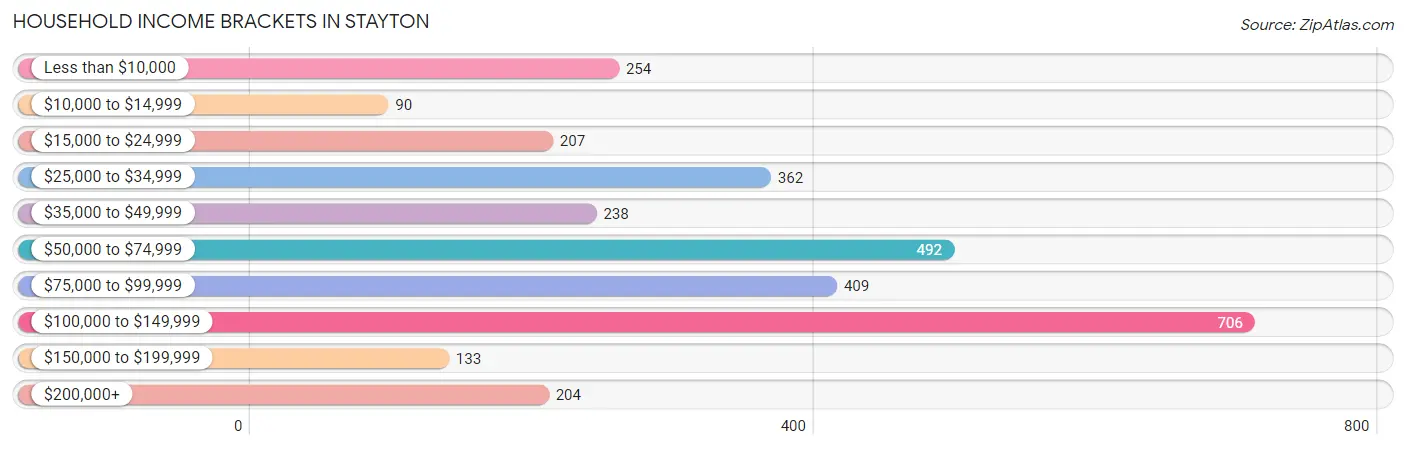
| Income Bracket | # Households | % Households |
| Less than $10,000 | 254 | 8.2% |
| $10,000 to $14,999 | 90 | 2.9% |
| $15,000 to $24,999 | 207 | 6.7% |
| $25,000 to $34,999 | 362 | 11.7% |
| $35,000 to $49,999 | 238 | 7.7% |
| $50,000 to $74,999 | 492 | 15.9% |
| $75,000 to $99,999 | 409 | 13.2% |
| $100,000 to $149,999 | 706 | 22.8% |
| $150,000 to $199,999 | 133 | 4.3% |
| $200,000+ | 204 | 6.6% |
Household Income by Householder Age in Stayton
The median household income in Stayton is $72,639, with the highest median household income of $82,375 found in the 45 to 64 years age bracket for the primary householder. A total of 896 households (28.9%) fall into this category. Meanwhile, the 65+ years age bracket for the primary householder has the lowest median household income of $49,087, with 851 households (27.5%) in this group.
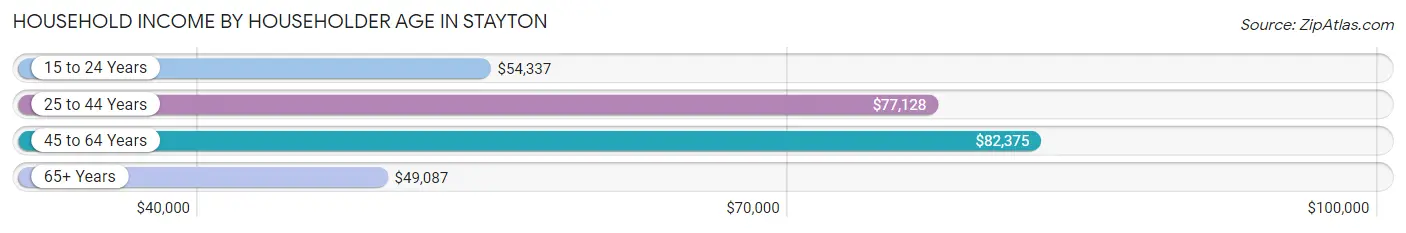
| Income Bracket | # Households | Median Income |
| 15 to 24 Years | 190 (6.1%) | $54,337 |
| 25 to 44 Years | 1,158 (37.4%) | $77,128 |
| 45 to 64 Years | 896 (28.9%) | $82,375 |
| 65+ Years | 851 (27.5%) | $49,087 |
| Total | 3,095 (100.0%) | $72,639 |
Poverty in Stayton
Income Below Poverty by Sex and Age in Stayton
With 8.2% poverty level for males and 10.1% for females among the residents of Stayton, 16 and 17 year old males and 16 and 17 year old females are the most vulnerable to poverty, with 48 males (28.6%) and 25 females (100.0%) in their respective age groups living below the poverty level.
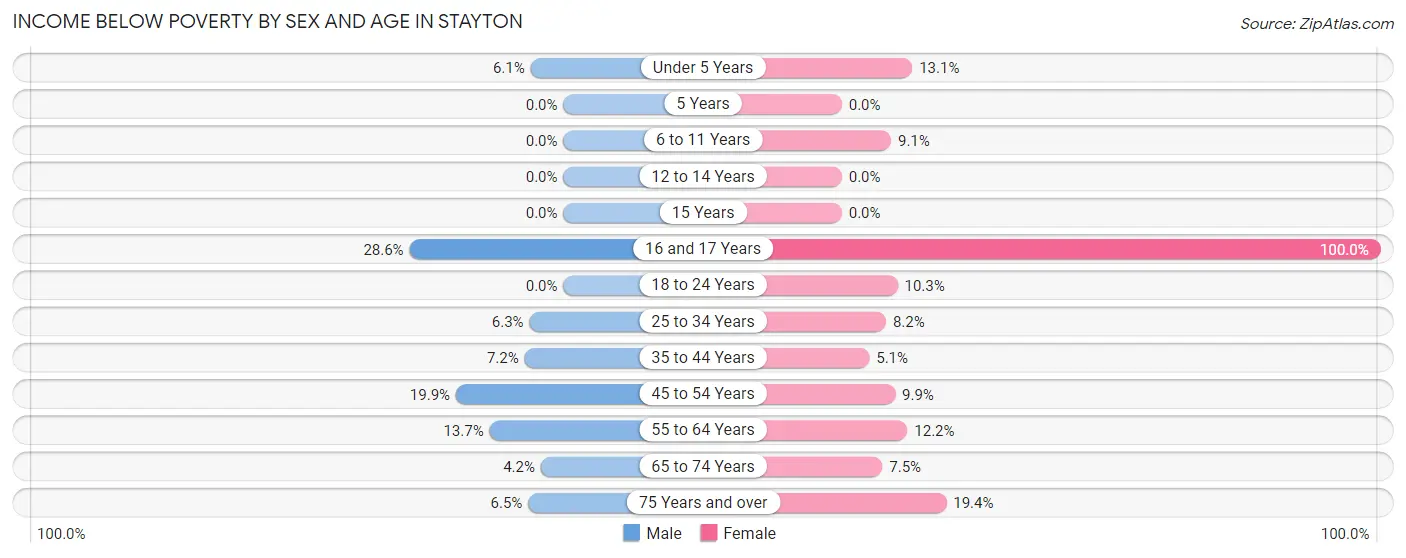
| Age Bracket | Male | Female |
| Under 5 Years | 27 (6.1%) | 54 (13.1%) |
| 5 Years | 0 (0.0%) | 0 (0.0%) |
| 6 to 11 Years | 0 (0.0%) | 31 (9.1%) |
| 12 to 14 Years | 0 (0.0%) | 0 (0.0%) |
| 15 Years | 0 (0.0%) | 0 (0.0%) |
| 16 and 17 Years | 48 (28.6%) | 25 (100.0%) |
| 18 to 24 Years | 0 (0.0%) | 30 (10.3%) |
| 25 to 34 Years | 21 (6.3%) | 51 (8.2%) |
| 35 to 44 Years | 57 (7.2%) | 27 (5.1%) |
| 45 to 54 Years | 65 (19.9%) | 36 (9.9%) |
| 55 to 64 Years | 75 (13.7%) | 69 (12.2%) |
| 65 to 74 Years | 16 (4.2%) | 31 (7.5%) |
| 75 Years and over | 22 (6.5%) | 65 (19.4%) |
| Total | 331 (8.2%) | 419 (10.1%) |
Income Above Poverty by Sex and Age in Stayton
According to the poverty statistics in Stayton, males aged 5 years and females aged 5 years are the age groups that are most secure financially, with 100.0% of males and 100.0% of females in these age groups living above the poverty line.
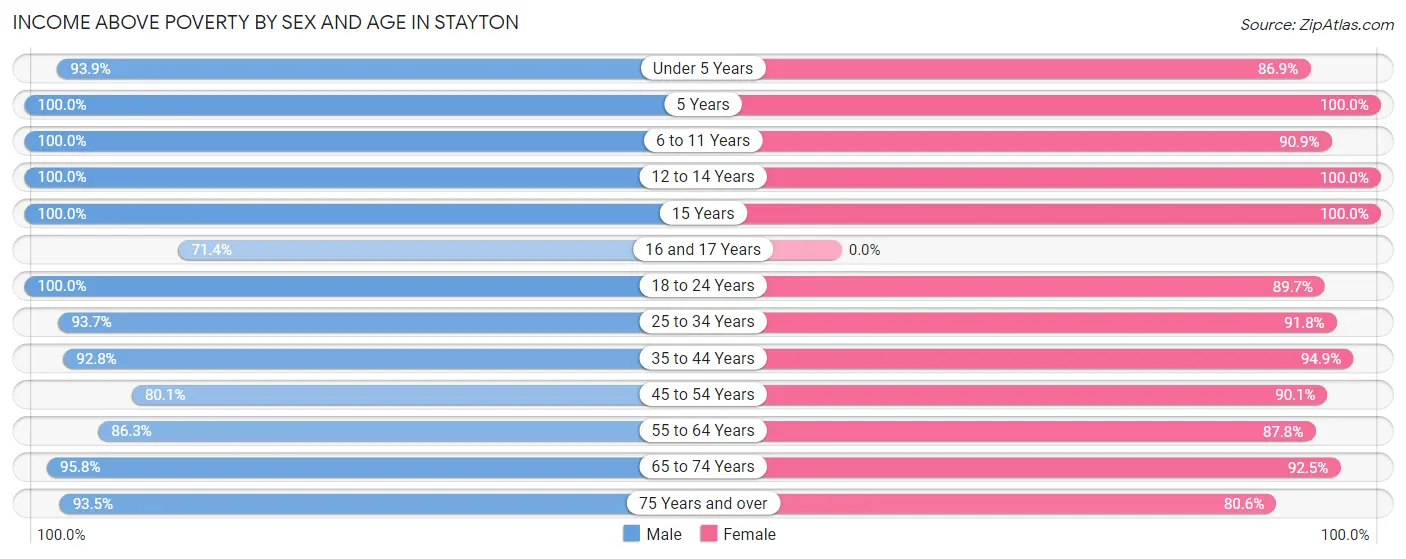
| Age Bracket | Male | Female |
| Under 5 Years | 416 (93.9%) | 359 (86.9%) |
| 5 Years | 59 (100.0%) | 67 (100.0%) |
| 6 to 11 Years | 179 (100.0%) | 308 (90.9%) |
| 12 to 14 Years | 185 (100.0%) | 151 (100.0%) |
| 15 Years | 98 (100.0%) | 34 (100.0%) |
| 16 and 17 Years | 120 (71.4%) | 0 (0.0%) |
| 18 to 24 Years | 177 (100.0%) | 260 (89.7%) |
| 25 to 34 Years | 313 (93.7%) | 571 (91.8%) |
| 35 to 44 Years | 734 (92.8%) | 502 (94.9%) |
| 45 to 54 Years | 261 (80.1%) | 328 (90.1%) |
| 55 to 64 Years | 472 (86.3%) | 498 (87.8%) |
| 65 to 74 Years | 367 (95.8%) | 381 (92.5%) |
| 75 Years and over | 315 (93.5%) | 270 (80.6%) |
| Total | 3,696 (91.8%) | 3,729 (89.9%) |
Income Below Poverty Among Married-Couple Families in Stayton
The poverty statistics for married-couple families in Stayton show that 2.9% or 51 of the total 1,733 families live below the poverty line. Families with 1 or 2 children have the highest poverty rate of 3.4%, comprising of 27 families. On the other hand, families with 3 or 4 children have the lowest poverty rate of 0.0%, which includes 0 families.
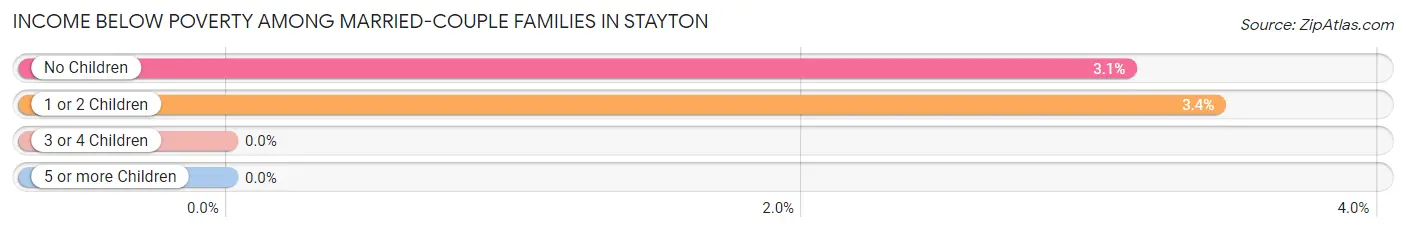
| Children | Above Poverty | Below Poverty |
| No Children | 742 (96.9%) | 24 (3.1%) |
| 1 or 2 Children | 757 (96.6%) | 27 (3.4%) |
| 3 or 4 Children | 183 (100.0%) | 0 (0.0%) |
| 5 or more Children | 0 (0.0%) | 0 (0.0%) |
| Total | 1,682 (97.1%) | 51 (2.9%) |
Income Below Poverty Among Single-Parent Households in Stayton
According to the poverty data in Stayton, 29.8% or 37 single-father households and 14.2% or 59 single-mother households are living below the poverty line. Among single-father households, those with 1 or 2 children have the highest poverty rate, with 21 households (45.7%) experiencing poverty. Likewise, among single-mother households, those with 1 or 2 children have the highest poverty rate, with 47 households (21.0%) falling below the poverty line.
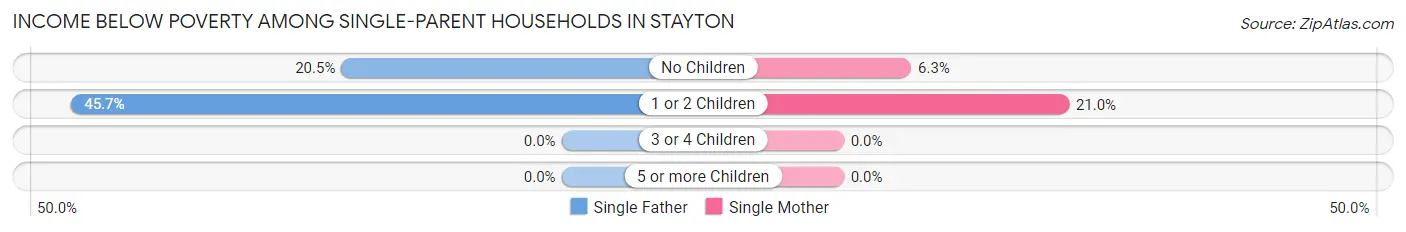
| Children | Single Father | Single Mother |
| No Children | 16 (20.5%) | 12 (6.3%) |
| 1 or 2 Children | 21 (45.7%) | 47 (21.0%) |
| 3 or 4 Children | 0 (0.0%) | 0 (0.0%) |
| 5 or more Children | 0 (0.0%) | 0 (0.0%) |
| Total | 37 (29.8%) | 59 (14.2%) |
Income Below Poverty Among Married-Couple vs Single-Parent Households in Stayton
The poverty data for Stayton shows that 51 of the married-couple family households (2.9%) and 96 of the single-parent households (17.8%) are living below the poverty level. Within the married-couple family households, those with 1 or 2 children have the highest poverty rate, with 27 households (3.4%) falling below the poverty line. Among the single-parent households, those with 1 or 2 children have the highest poverty rate, with 68 household (25.2%) living below poverty.
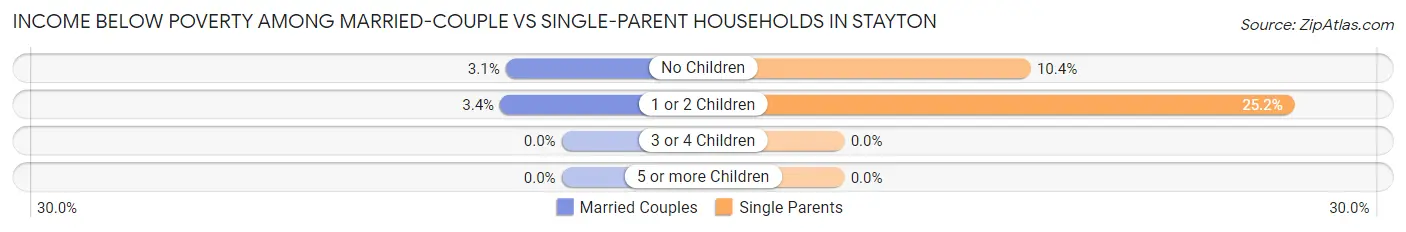
| Children | Married-Couple Families | Single-Parent Households |
| No Children | 24 (3.1%) | 28 (10.4%) |
| 1 or 2 Children | 27 (3.4%) | 68 (25.2%) |
| 3 or 4 Children | 0 (0.0%) | 0 (0.0%) |
| 5 or more Children | 0 (0.0%) | 0 (0.0%) |
| Total | 51 (2.9%) | 96 (17.8%) |
Race in Stayton
The most populous races in Stayton are White / Caucasian (6,401 | 78.0%), Two or more Races (1,549 | 18.9%), and Hispanic or Latino (1,385 | 16.9%).
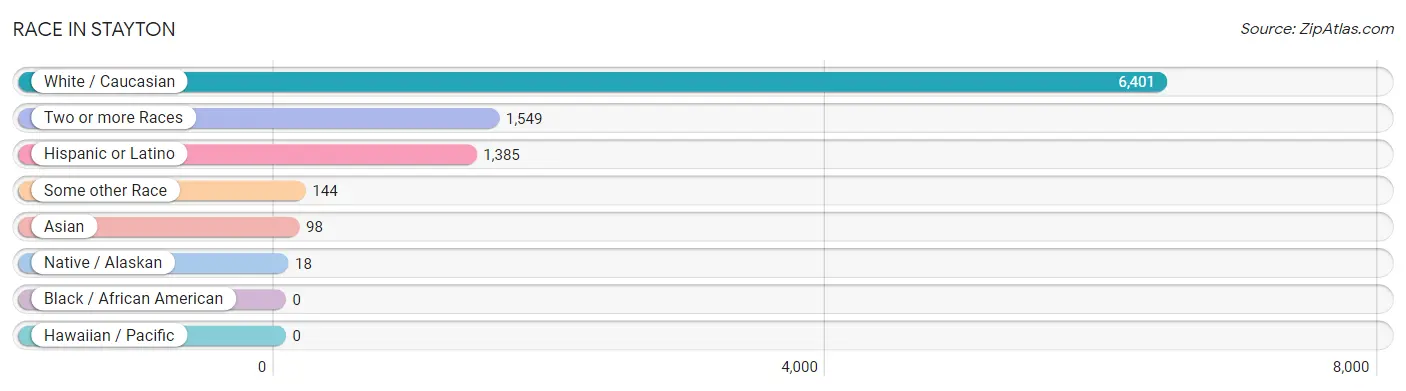
| Race | # Population | % Population |
| Asian | 98 | 1.2% |
| Black / African American | 0 | 0.0% |
| Hawaiian / Pacific | 0 | 0.0% |
| Hispanic or Latino | 1,385 | 16.9% |
| Native / Alaskan | 18 | 0.2% |
| White / Caucasian | 6,401 | 78.0% |
| Two or more Races | 1,549 | 18.9% |
| Some other Race | 144 | 1.8% |
| Total | 8,210 | 100.0% |
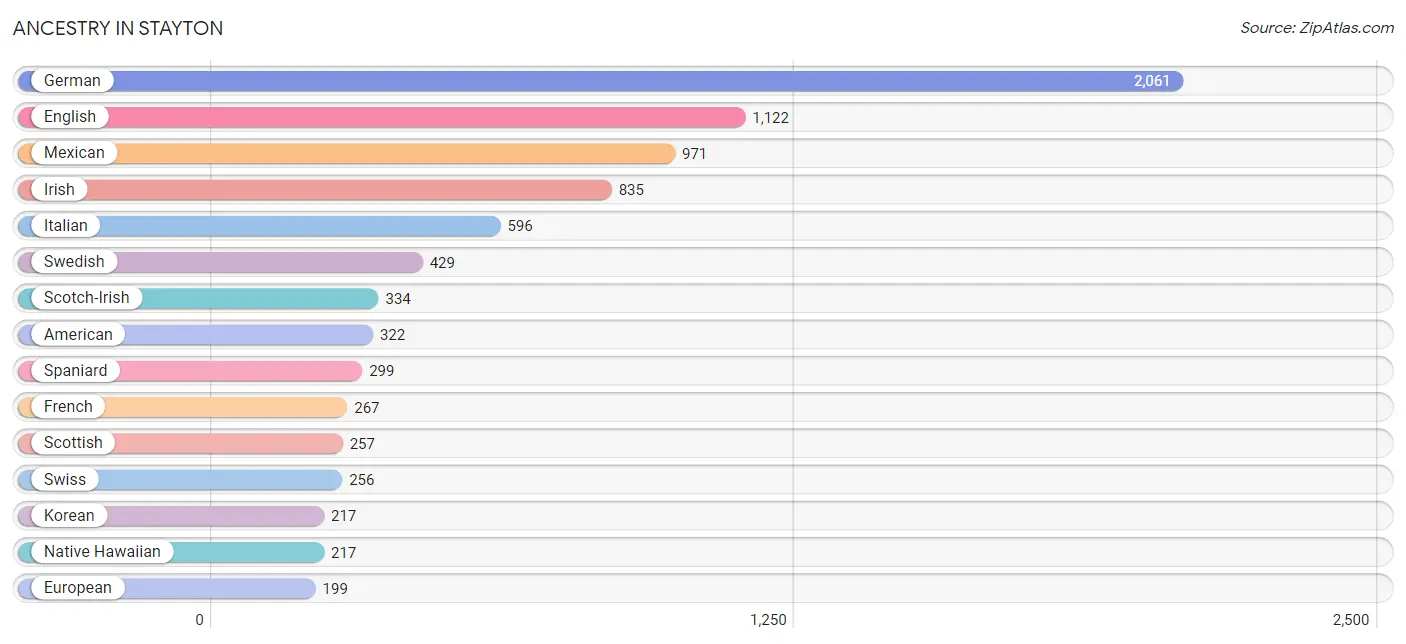
Ancestry in Stayton
The most populous ancestries reported in Stayton are German (2,061 | 25.1%), English (1,122 | 13.7%), Mexican (971 | 11.8%), Irish (835 | 10.2%), and Italian (596 | 7.3%), together accounting for 68.0% of all Stayton residents.
| Ancestry | # Population | % Population |
| American | 322 | 3.9% |
| Basque | 1 | 0.0% |
| Belgian | 9 | 0.1% |
| Bhutanese | 44 | 0.5% |
| British | 64 | 0.8% |
| Bulgarian | 23 | 0.3% |
| Burmese | 54 | 0.7% |
| Canadian | 18 | 0.2% |
| Central American | 58 | 0.7% |
| Cherokee | 55 | 0.7% |
| Chickasaw | 3 | 0.0% |
| Chippewa | 18 | 0.2% |
| Czech | 8 | 0.1% |
| Danish | 16 | 0.2% |
| Dutch | 125 | 1.5% |
| Dutch West Indian | 36 | 0.4% |
| English | 1,122 | 13.7% |
| European | 199 | 2.4% |
| Fijian | 24 | 0.3% |
| Finnish | 43 | 0.5% |
| French | 267 | 3.3% |
| French Canadian | 50 | 0.6% |
| German | 2,061 | 25.1% |
| Hungarian | 40 | 0.5% |
| Irish | 835 | 10.2% |
| Italian | 596 | 7.3% |
| Korean | 217 | 2.6% |
| Mexican | 971 | 11.8% |
| Mexican American Indian | 46 | 0.6% |
| Native Hawaiian | 217 | 2.6% |
| Northern European | 93 | 1.1% |
| Norwegian | 91 | 1.1% |
| Polish | 45 | 0.5% |
| Portuguese | 54 | 0.7% |
| Russian | 78 | 0.9% |
| Salvadoran | 58 | 0.7% |
| Scandinavian | 176 | 2.1% |
| Scotch-Irish | 334 | 4.1% |
| Scottish | 257 | 3.1% |
| Spaniard | 299 | 3.6% |
| Swedish | 429 | 5.2% |
| Swiss | 256 | 3.1% |
| Welsh | 19 | 0.2% |
| Yaqui | 75 | 0.9% | View All 44 Rows |
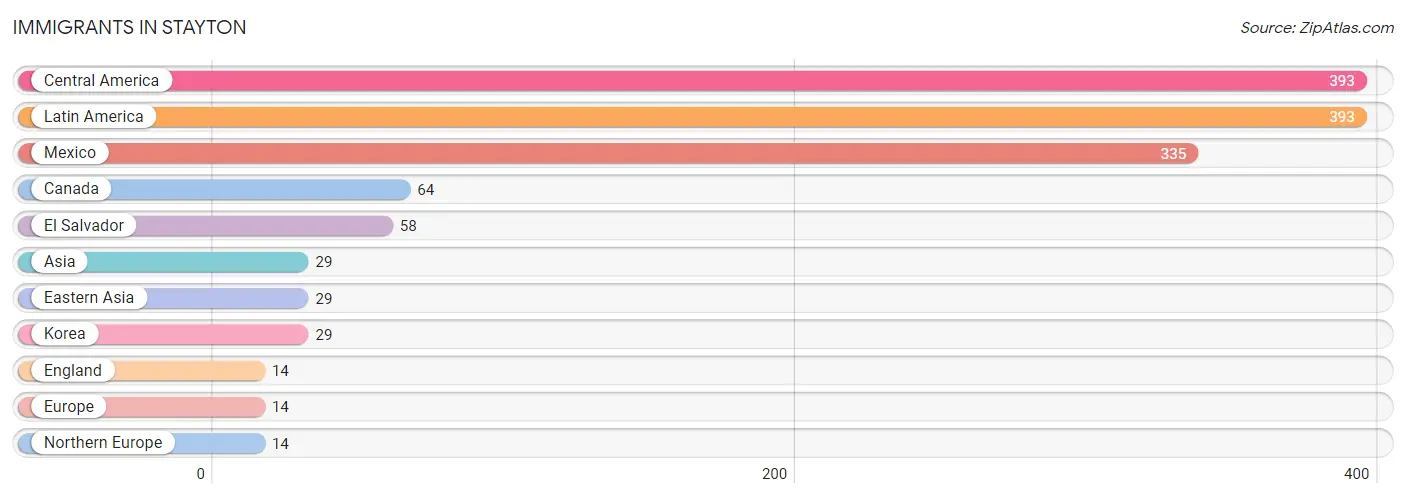
Immigrants in Stayton
The most numerous immigrant groups reported in Stayton came from Central America (393 | 4.8%), Latin America (393 | 4.8%), Mexico (335 | 4.1%), Canada (64 | 0.8%), and El Salvador (58 | 0.7%), together accounting for 15.1% of all Stayton residents.
| Immigration Origin | # Population | % Population |
| Asia | 29 | 0.4% |
| Canada | 64 | 0.8% |
| Central America | 393 | 4.8% |
| Eastern Asia | 29 | 0.4% |
| El Salvador | 58 | 0.7% |
| England | 14 | 0.2% |
| Europe | 14 | 0.2% |
| Korea | 29 | 0.4% |
| Latin America | 393 | 4.8% |
| Mexico | 335 | 4.1% |
| Northern Europe | 14 | 0.2% | View All 11 Rows |
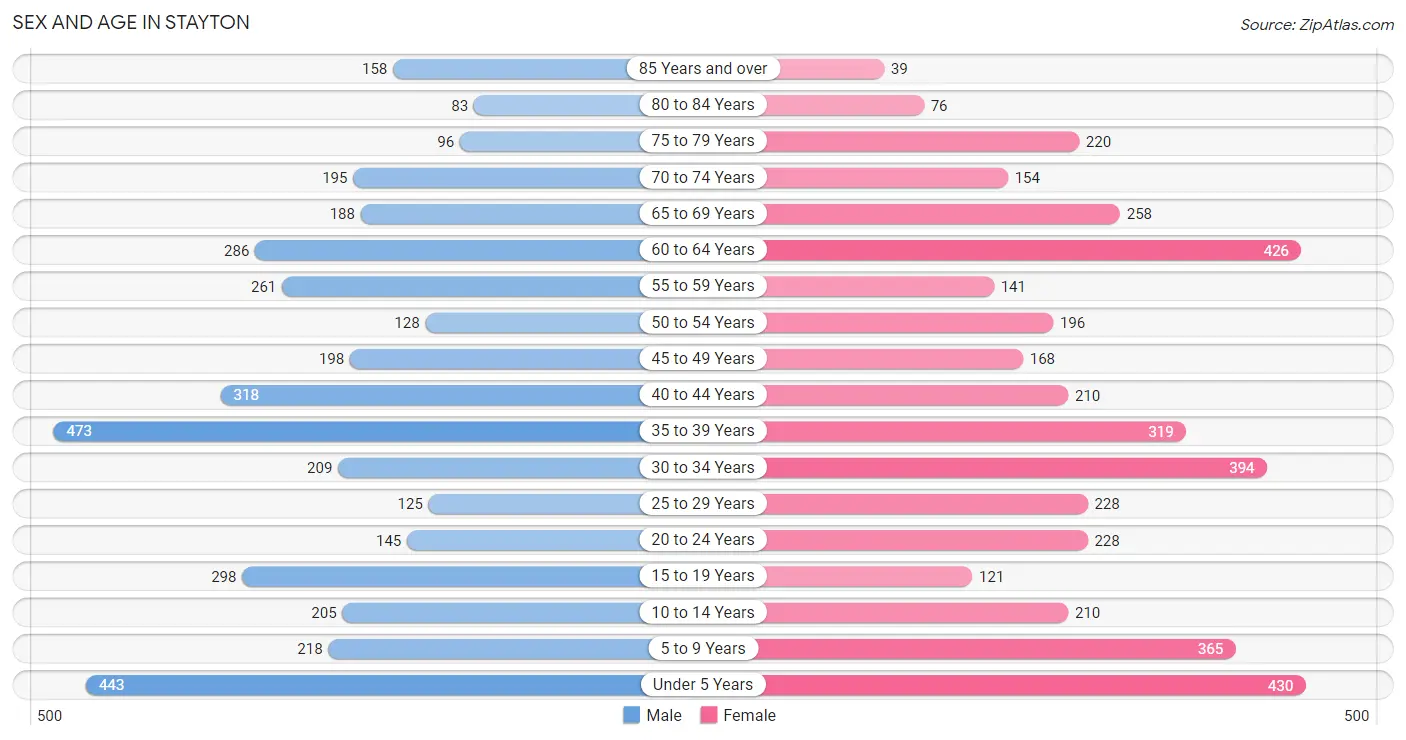
Sex and Age in Stayton
Sex and Age in Stayton
The most populous age groups in Stayton are 35 to 39 Years (473 | 11.7%) for men and Under 5 Years (430 | 10.3%) for women.
| Age Bracket | Male | Female |
| Under 5 Years | 443 (11.0%) | 430 (10.3%) |
| 5 to 9 Years | 218 (5.4%) | 365 (8.7%) |
| 10 to 14 Years | 205 (5.1%) | 210 (5.0%) |
| 15 to 19 Years | 298 (7.4%) | 121 (2.9%) |
| 20 to 24 Years | 145 (3.6%) | 228 (5.4%) |
| 25 to 29 Years | 125 (3.1%) | 228 (5.4%) |
| 30 to 34 Years | 209 (5.2%) | 394 (9.4%) |
| 35 to 39 Years | 473 (11.7%) | 319 (7.6%) |
| 40 to 44 Years | 318 (7.9%) | 210 (5.0%) |
| 45 to 49 Years | 198 (4.9%) | 168 (4.0%) |
| 50 to 54 Years | 128 (3.2%) | 196 (4.7%) |
| 55 to 59 Years | 261 (6.5%) | 141 (3.4%) |
| 60 to 64 Years | 286 (7.1%) | 426 (10.2%) |
| 65 to 69 Years | 188 (4.7%) | 258 (6.2%) |
| 70 to 74 Years | 195 (4.8%) | 154 (3.7%) |
| 75 to 79 Years | 96 (2.4%) | 220 (5.3%) |
| 80 to 84 Years | 83 (2.1%) | 76 (1.8%) |
| 85 Years and over | 158 (3.9%) | 39 (0.9%) |
| Total | 4,027 (100.0%) | 4,183 (100.0%) |
Families and Households in Stayton
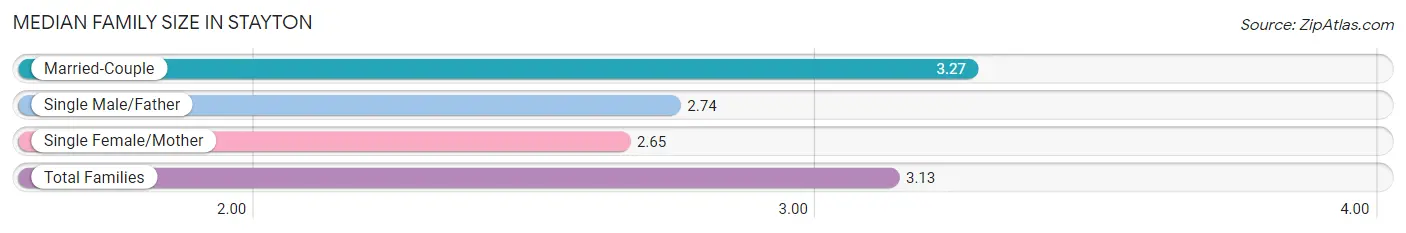
Median Family Size in Stayton
The median family size in Stayton is 3.13 persons per family, with married-couple families (1,733 | 76.3%) accounting for the largest median family size of 3.27 persons per family. On the other hand, single female/mother families (415 | 18.3%) represent the smallest median family size with 2.65 persons per family.
| Family Type | # Families | Family Size |
| Married-Couple | 1,733 (76.3%) | 3.27 |
| Single Male/Father | 124 (5.5%) | 2.74 |
| Single Female/Mother | 415 (18.3%) | 2.65 |
| Total Families | 2,272 (100.0%) | 3.13 |
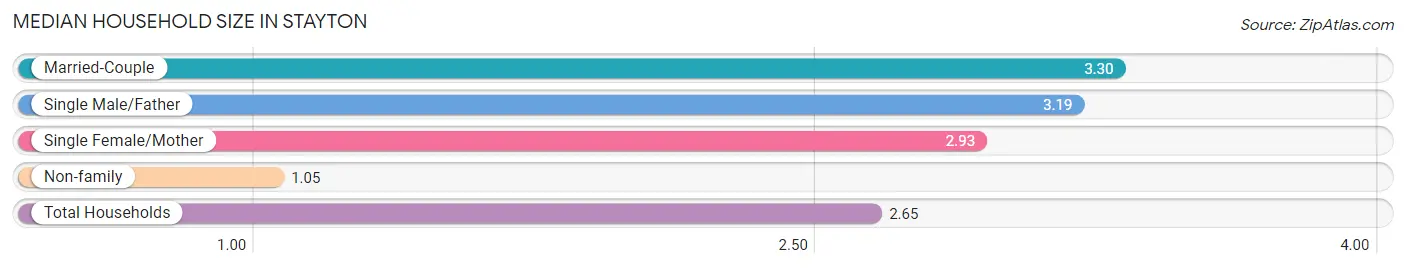
Median Household Size in Stayton
The median household size in Stayton is 2.65 persons per household, with married-couple households (1,733 | 56.0%) accounting for the largest median household size of 3.3 persons per household. non-family households (823 | 26.6%) represent the smallest median household size with 1.05 persons per household.
| Household Type | # Households | Household Size |
| Married-Couple | 1,733 (56.0%) | 3.30 |
| Single Male/Father | 124 (4.0%) | 3.19 |
| Single Female/Mother | 415 (13.4%) | 2.93 |
| Non-family | 823 (26.6%) | 1.05 |
| Total Households | 3,095 (100.0%) | 2.65 |
Household Size by Marriage Status in Stayton
Out of a total of 3,095 households in Stayton, 2,272 (73.4%) are family households, while 823 (26.6%) are nonfamily households. The most numerous type of family households are 2-person households, comprising 765, and the most common type of nonfamily households are 1-person households, comprising 773.
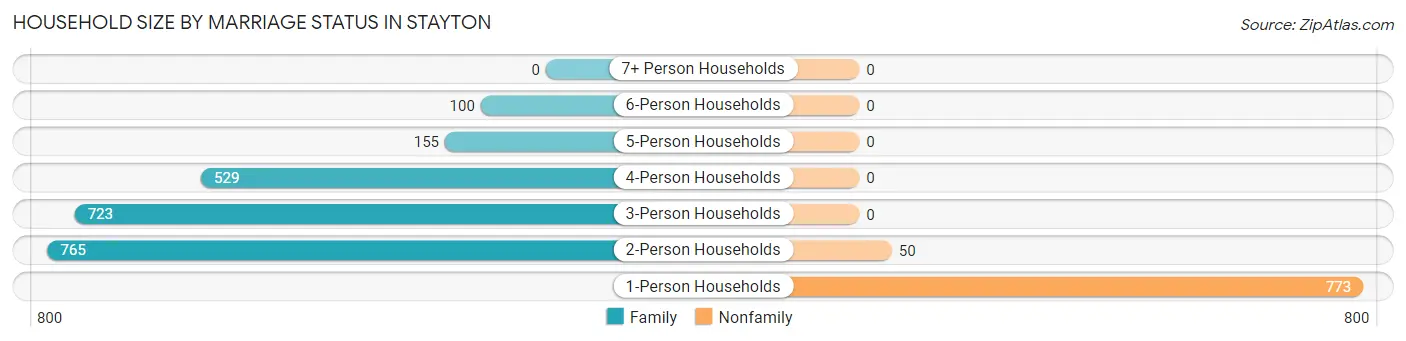
| Household Size | Family Households | Nonfamily Households |
| 1-Person Households | - | 773 (25.0%) |
| 2-Person Households | 765 (24.7%) | 50 (1.6%) |
| 3-Person Households | 723 (23.4%) | 0 (0.0%) |
| 4-Person Households | 529 (17.1%) | 0 (0.0%) |
| 5-Person Households | 155 (5.0%) | 0 (0.0%) |
| 6-Person Households | 100 (3.2%) | 0 (0.0%) |
| 7+ Person Households | 0 (0.0%) | 0 (0.0%) |
| Total | 2,272 (73.4%) | 823 (26.6%) |
Female Fertility in Stayton
Fertility by Age in Stayton
Average fertility rate in Stayton is 124.0 births per 1,000 women. Women in the age bracket of 20 to 34 years have the highest fertility rate with 194.0 births per 1,000 women. Women in the age bracket of 20 to 34 years acount for 79.7% of all women with births.
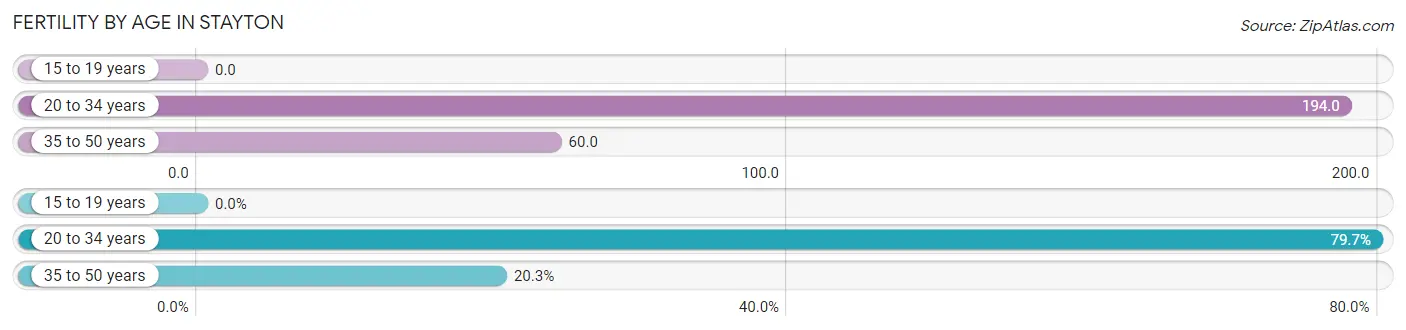
| Age Bracket | Women with Births | Births / 1,000 Women |
| 15 to 19 years | 0 (0.0%) | 0.0 |
| 20 to 34 years | 165 (79.7%) | 194.0 |
| 35 to 50 years | 42 (20.3%) | 60.0 |
| Total | 207 (100.0%) | 124.0 |
Fertility by Age by Marriage Status in Stayton
75.4% of women with births (207) in Stayton are married. The highest percentage of unmarried women with births falls into 20 to 34 years age bracket with 30.9% of them unmarried at the time of birth, while the lowest percentage of unmarried women with births belong to 35 to 50 years age bracket with 0.0% of them unmarried.
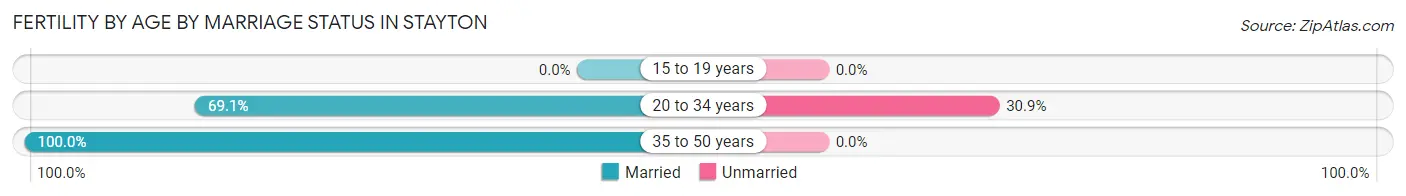
| Age Bracket | Married | Unmarried |
| 15 to 19 years | 0 (0.0%) | 0 (0.0%) |
| 20 to 34 years | 114 (69.1%) | 51 (30.9%) |
| 35 to 50 years | 42 (100.0%) | 0 (0.0%) |
| Total | 156 (75.4%) | 51 (24.6%) |
Fertility by Education in Stayton
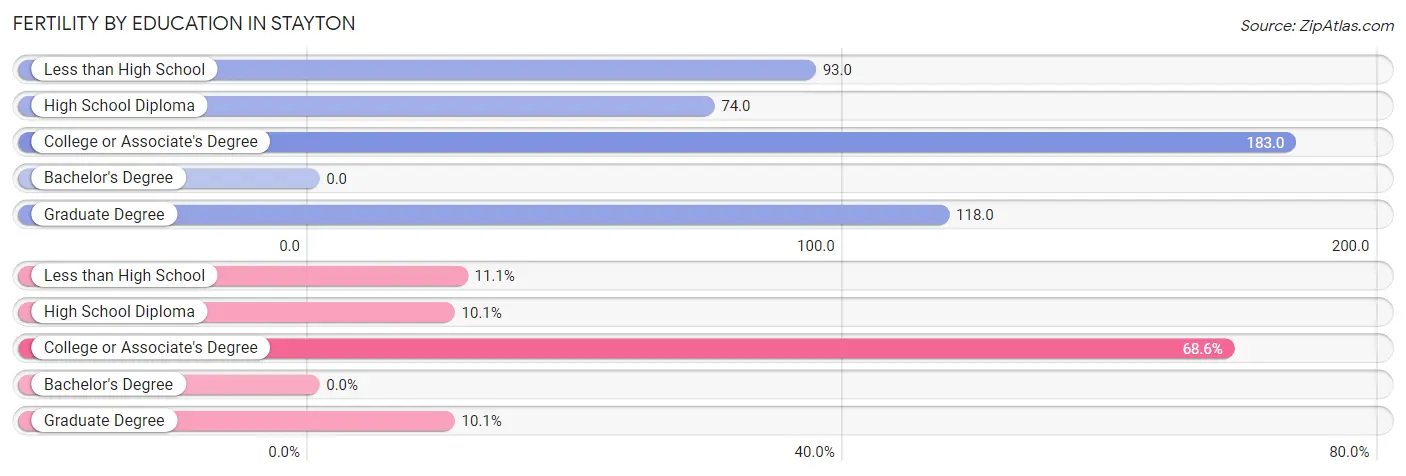
| Educational Attainment | Women with Births | Births / 1,000 Women |
| Less than High School | 23 (11.1%) | 93.0 |
| High School Diploma | 21 (10.1%) | 74.0 |
| College or Associate's Degree | 142 (68.6%) | 183.0 |
| Bachelor's Degree | 0 (0.0%) | 0.0 |
| Graduate Degree | 21 (10.1%) | 118.0 |
| Total | 207 (100.0%) | 124.0 |
Fertility by Education by Marriage Status in Stayton
24.6% of women with births in Stayton are unmarried. Women with the educational attainment of high school diploma are most likely to be married with 100.0% of them married at childbirth, while women with the educational attainment of less than high school are least likely to be married with 100.0% of them unmarried at childbirth.
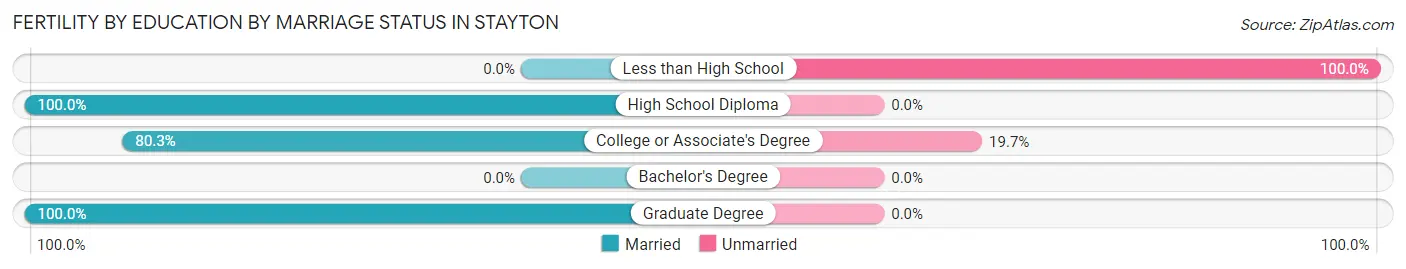
| Educational Attainment | Married | Unmarried |
| Less than High School | 0 (0.0%) | 23 (100.0%) |
| High School Diploma | 21 (100.0%) | 0 (0.0%) |
| College or Associate's Degree | 114 (80.3%) | 28 (19.7%) |
| Bachelor's Degree | 0 (0.0%) | 0 (0.0%) |
| Graduate Degree | 21 (100.0%) | 0 (0.0%) |
| Total | 156 (75.4%) | 51 (24.6%) |
Employment Characteristics in Stayton
Employment by Class of Employer in Stayton
Among the 3,637 employed individuals in Stayton, private company employees (2,383 | 65.5%), not-for-profit organizations (412 | 11.3%), and state government employees (217 | 6.0%) make up the most common classes of employment.
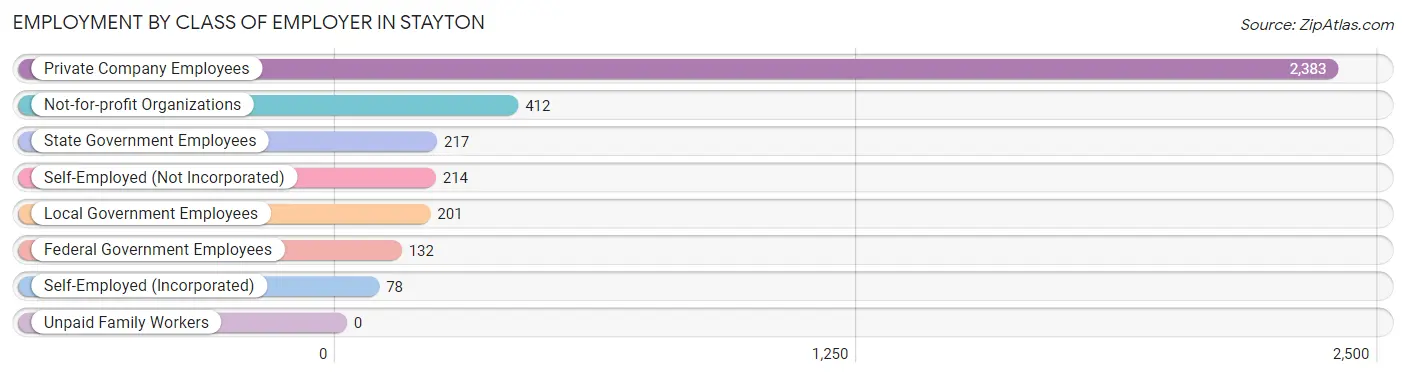
| Employer Class | # Employees | % Employees |
| Private Company Employees | 2,383 | 65.5% |
| Self-Employed (Incorporated) | 78 | 2.1% |
| Self-Employed (Not Incorporated) | 214 | 5.9% |
| Not-for-profit Organizations | 412 | 11.3% |
| Local Government Employees | 201 | 5.5% |
| State Government Employees | 217 | 6.0% |
| Federal Government Employees | 132 | 3.6% |
| Unpaid Family Workers | 0 | 0.0% |
| Total | 3,637 | 100.0% |
Employment Status by Age in Stayton
According to the labor force statistics for Stayton, out of the total population over 16 years of age (6,207), 62.9% or 3,904 individuals are in the labor force, with 4.8% or 187 of them unemployed. The age group with the highest labor force participation rate is 25 to 29 years, with 99.4% or 351 individuals in the labor force. Within the labor force, the 55 to 59 years age range has the highest percentage of unemployed individuals, with 22.3% or 48 of them being unemployed.
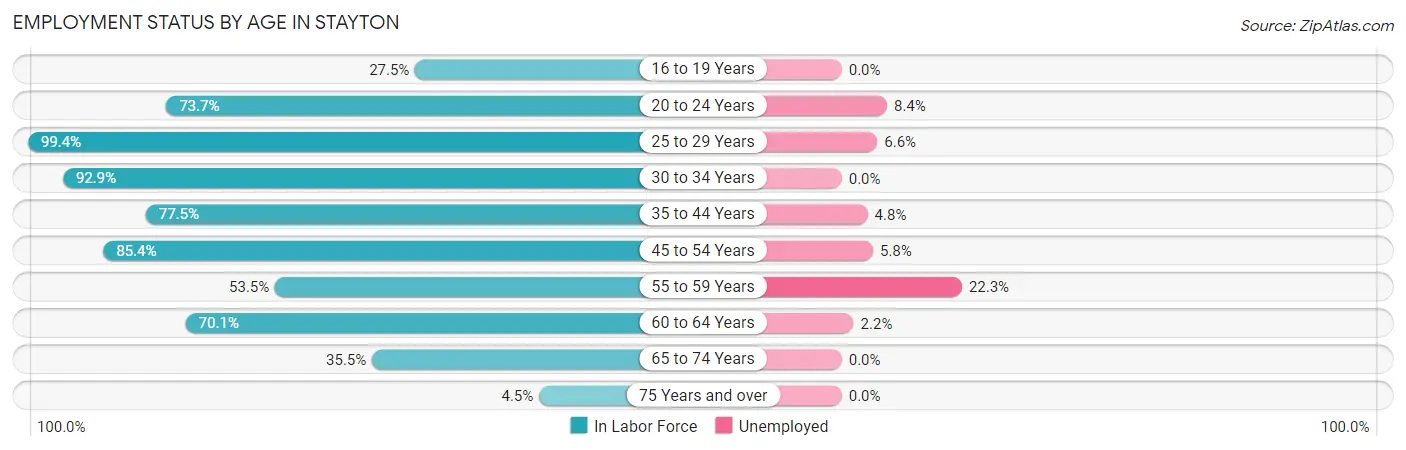
| Age Bracket | In Labor Force | Unemployed |
| 16 to 19 Years | 79 (27.5%) | 0 (0.0%) |
| 20 to 24 Years | 275 (73.7%) | 23 (8.4%) |
| 25 to 29 Years | 351 (99.4%) | 23 (6.6%) |
| 30 to 34 Years | 560 (92.9%) | 0 (0.0%) |
| 35 to 44 Years | 1,023 (77.5%) | 49 (4.8%) |
| 45 to 54 Years | 589 (85.4%) | 34 (5.8%) |
| 55 to 59 Years | 215 (53.5%) | 48 (22.3%) |
| 60 to 64 Years | 499 (70.1%) | 11 (2.2%) |
| 65 to 74 Years | 282 (35.5%) | 0 (0.0%) |
| 75 Years and over | 30 (4.5%) | 0 (0.0%) |
| Total | 3,904 (62.9%) | 187 (4.8%) |
Employment Status by Educational Attainment in Stayton
According to labor force statistics for Stayton, 79.3% of individuals (3,235) out of the total population between 25 and 64 years of age (4,080) are in the labor force, with 5.1% or 165 of them being unemployed. The group with the highest labor force participation rate are those with the educational attainment of bachelor's degree or higher, with 87.9% or 872 individuals in the labor force. Within the labor force, individuals with less than high school education have the highest percentage of unemployment, with 17.6% or 57 of them being unemployed.
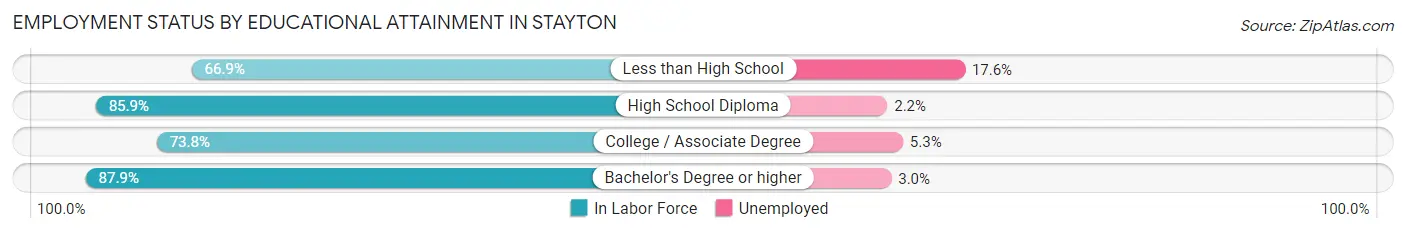
| Educational Attainment | In Labor Force | Unemployed |
| Less than High School | 323 (66.9%) | 85 (17.6%) |
| High School Diploma | 847 (85.9%) | 22 (2.2%) |
| College / Associate Degree | 1,195 (73.8%) | 86 (5.3%) |
| Bachelor's Degree or higher | 872 (87.9%) | 30 (3.0%) |
| Total | 3,235 (79.3%) | 208 (5.1%) |
Employment Occupations by Sex in Stayton
Management, Business, Science and Arts Occupations
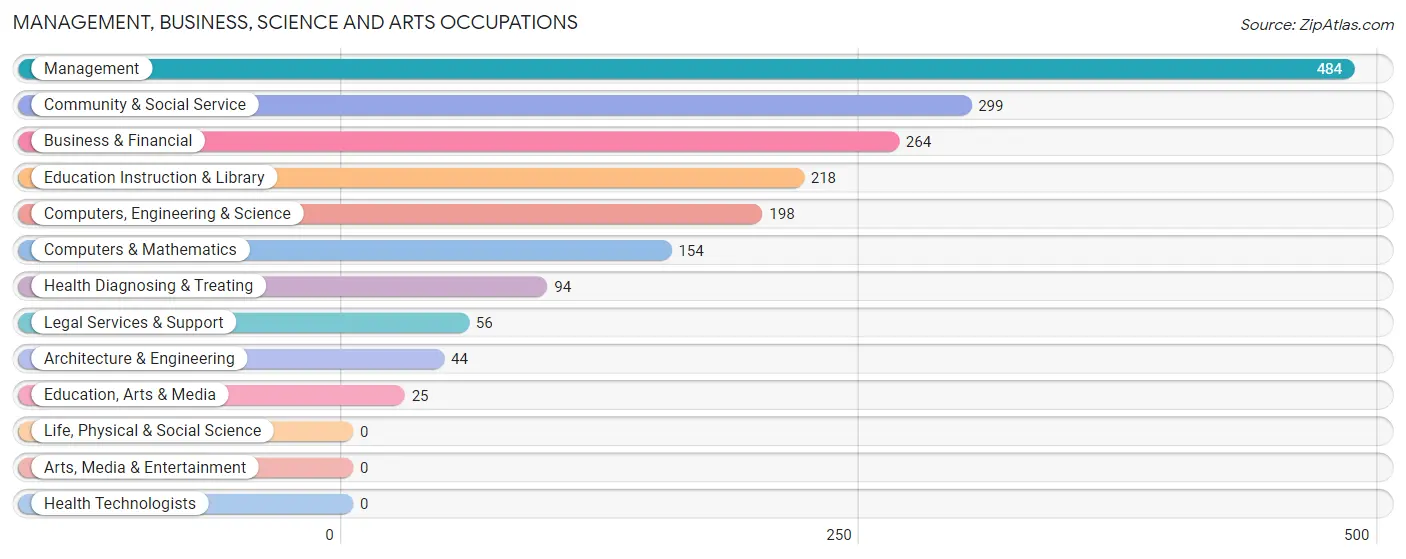
The most common Management, Business, Science and Arts occupations in Stayton are Management (484 | 13.0%), Community & Social Service (299 | 8.1%), Business & Financial (264 | 7.1%), Education Instruction & Library (218 | 5.9%), and Computers, Engineering & Science (198 | 5.3%).
Management, Business, Science and Arts Occupations by Sex
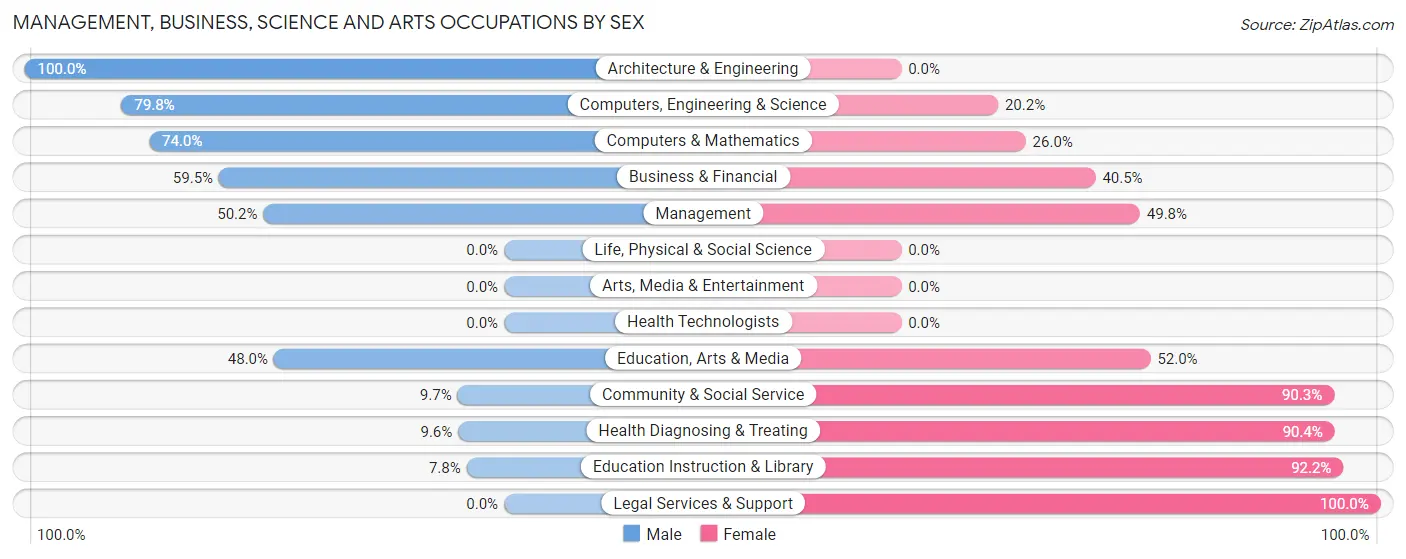
Within the Management, Business, Science and Arts occupations in Stayton, the most male-oriented occupations are Architecture & Engineering (100.0%), Computers, Engineering & Science (79.8%), and Computers & Mathematics (74.0%), while the most female-oriented occupations are Legal Services & Support (100.0%), Education Instruction & Library (92.2%), and Health Diagnosing & Treating (90.4%).
| Occupation | Male | Female |
| Management | 243 (50.2%) | 241 (49.8%) |
| Business & Financial | 157 (59.5%) | 107 (40.5%) |
| Computers, Engineering & Science | 158 (79.8%) | 40 (20.2%) |
| Computers & Mathematics | 114 (74.0%) | 40 (26.0%) |
| Architecture & Engineering | 44 (100.0%) | 0 (0.0%) |
| Life, Physical & Social Science | 0 (0.0%) | 0 (0.0%) |
| Community & Social Service | 29 (9.7%) | 270 (90.3%) |
| Education, Arts & Media | 12 (48.0%) | 13 (52.0%) |
| Legal Services & Support | 0 (0.0%) | 56 (100.0%) |
| Education Instruction & Library | 17 (7.8%) | 201 (92.2%) |
| Arts, Media & Entertainment | 0 (0.0%) | 0 (0.0%) |
| Health Diagnosing & Treating | 9 (9.6%) | 85 (90.4%) |
| Health Technologists | 0 (0.0%) | 0 (0.0%) |
| Total (Category) | 596 (44.5%) | 743 (55.5%) |
| Total (Overall) | 1,909 (51.4%) | 1,806 (48.6%) |
Services Occupations
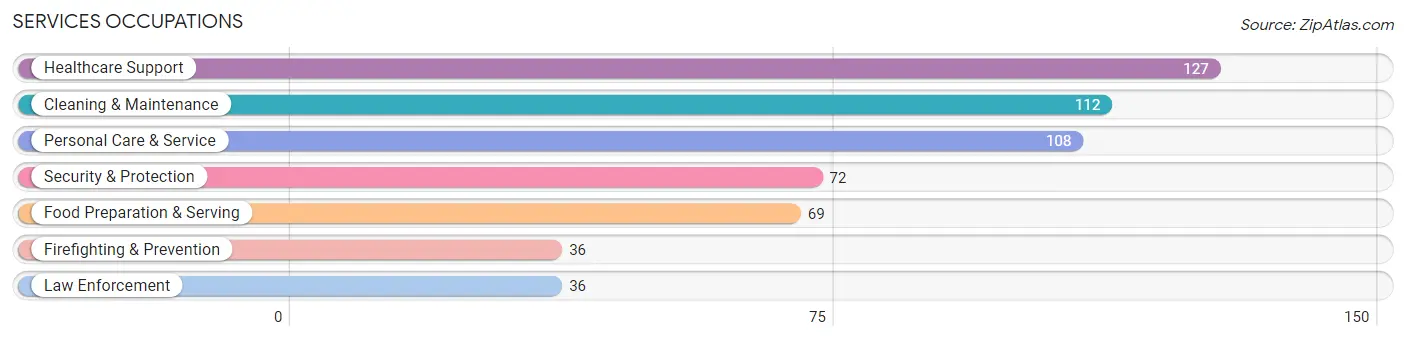
The most common Services occupations in Stayton are Healthcare Support (127 | 3.4%), Cleaning & Maintenance (112 | 3.0%), Personal Care & Service (108 | 2.9%), Security & Protection (72 | 1.9%), and Food Preparation & Serving (69 | 1.9%).
Services Occupations by Sex
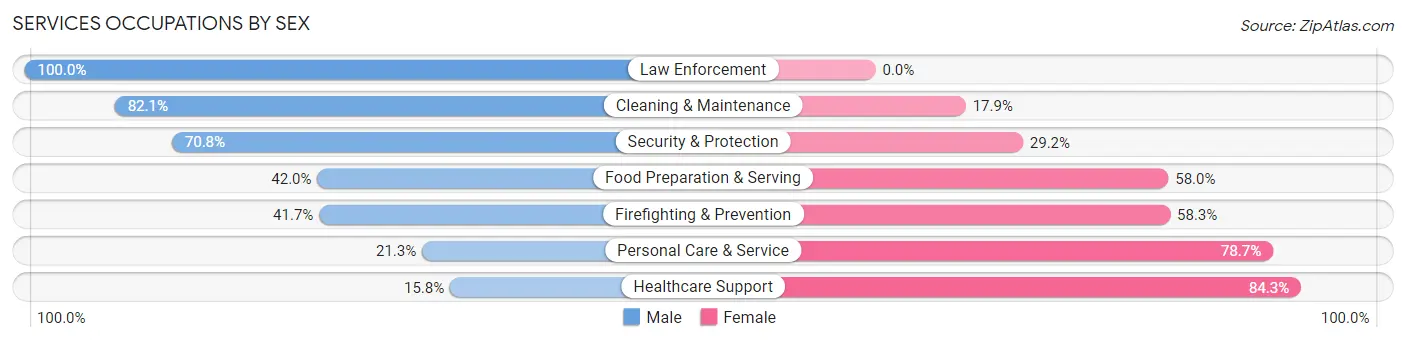
Within the Services occupations in Stayton, the most male-oriented occupations are Law Enforcement (100.0%), Cleaning & Maintenance (82.1%), and Security & Protection (70.8%), while the most female-oriented occupations are Healthcare Support (84.3%), Personal Care & Service (78.7%), and Firefighting & Prevention (58.3%).
| Occupation | Male | Female |
| Healthcare Support | 20 (15.8%) | 107 (84.3%) |
| Security & Protection | 51 (70.8%) | 21 (29.2%) |
| Firefighting & Prevention | 15 (41.7%) | 21 (58.3%) |
| Law Enforcement | 36 (100.0%) | 0 (0.0%) |
| Food Preparation & Serving | 29 (42.0%) | 40 (58.0%) |
| Cleaning & Maintenance | 92 (82.1%) | 20 (17.9%) |
| Personal Care & Service | 23 (21.3%) | 85 (78.7%) |
| Total (Category) | 215 (44.1%) | 273 (55.9%) |
| Total (Overall) | 1,909 (51.4%) | 1,806 (48.6%) |
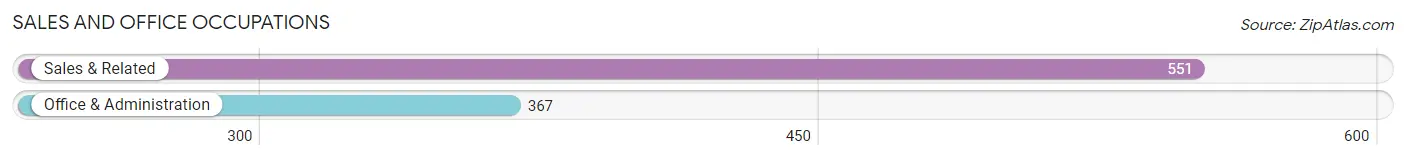
Sales and Office Occupations
The most common Sales and Office occupations in Stayton are Sales & Related (551 | 14.8%), and Office & Administration (367 | 9.9%).
Sales and Office Occupations by Sex
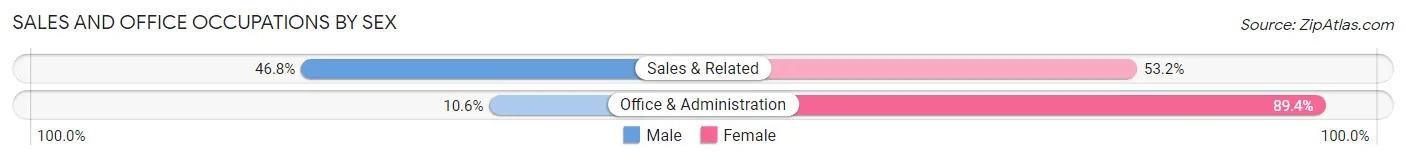
| Occupation | Male | Female |
| Sales & Related | 258 (46.8%) | 293 (53.2%) |
| Office & Administration | 39 (10.6%) | 328 (89.4%) |
| Total (Category) | 297 (32.4%) | 621 (67.6%) |
| Total (Overall) | 1,909 (51.4%) | 1,806 (48.6%) |
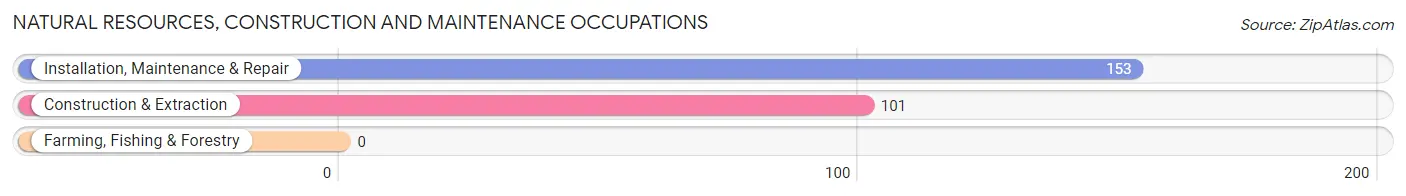
Natural Resources, Construction and Maintenance Occupations
The most common Natural Resources, Construction and Maintenance occupations in Stayton are Installation, Maintenance & Repair (153 | 4.1%), and Construction & Extraction (101 | 2.7%).
Natural Resources, Construction and Maintenance Occupations by Sex
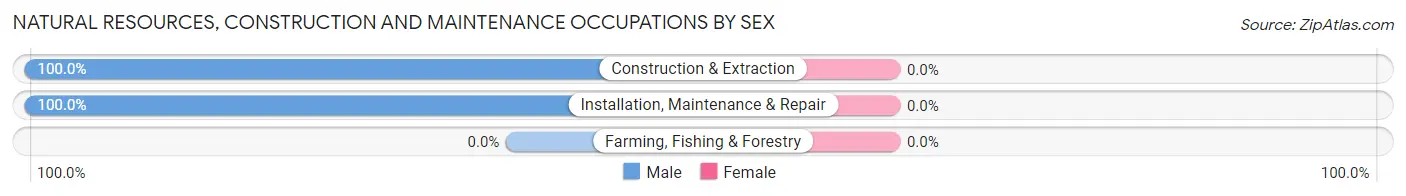
| Occupation | Male | Female |
| Farming, Fishing & Forestry | 0 (0.0%) | 0 (0.0%) |
| Construction & Extraction | 101 (100.0%) | 0 (0.0%) |
| Installation, Maintenance & Repair | 153 (100.0%) | 0 (0.0%) |
| Total (Category) | 254 (100.0%) | 0 (0.0%) |
| Total (Overall) | 1,909 (51.4%) | 1,806 (48.6%) |
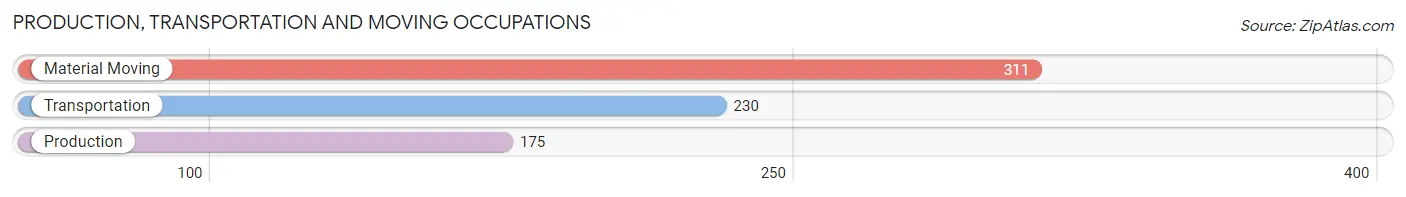
Production, Transportation and Moving Occupations
The most common Production, Transportation and Moving occupations in Stayton are Material Moving (311 | 8.4%), Transportation (230 | 6.2%), and Production (175 | 4.7%).
Production, Transportation and Moving Occupations by Sex
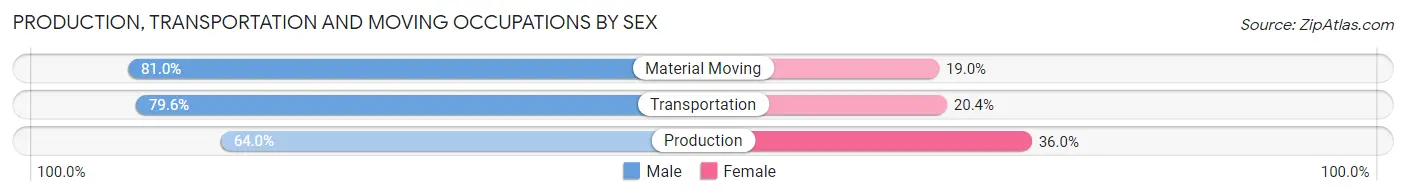
| Occupation | Male | Female |
| Production | 112 (64.0%) | 63 (36.0%) |
| Transportation | 183 (79.6%) | 47 (20.4%) |
| Material Moving | 252 (81.0%) | 59 (19.0%) |
| Total (Category) | 547 (76.4%) | 169 (23.6%) |
| Total (Overall) | 1,909 (51.4%) | 1,806 (48.6%) |
Employment Industries by Sex in Stayton
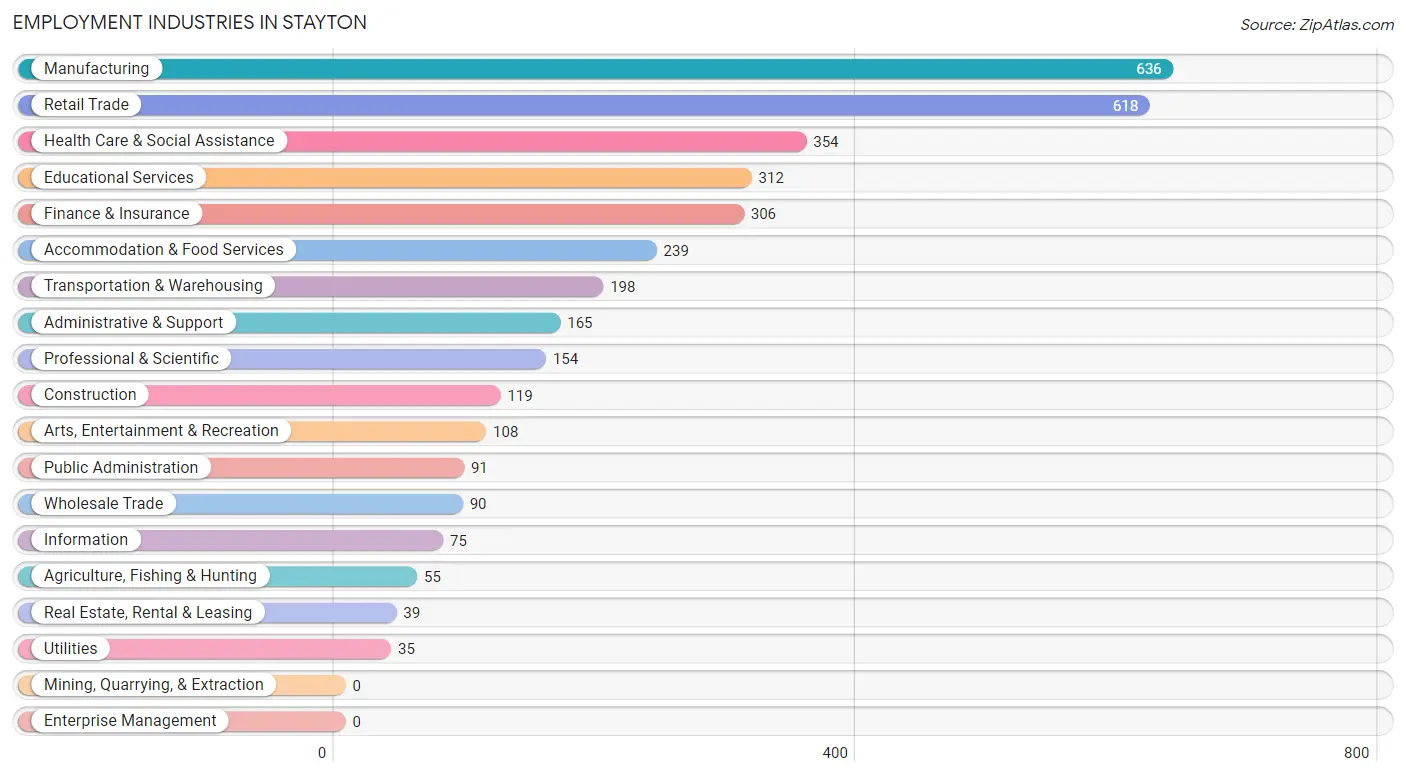
Employment Industries in Stayton
The major employment industries in Stayton include Manufacturing (636 | 17.1%), Retail Trade (618 | 16.6%), Health Care & Social Assistance (354 | 9.5%), Educational Services (312 | 8.4%), and Finance & Insurance (306 | 8.2%).
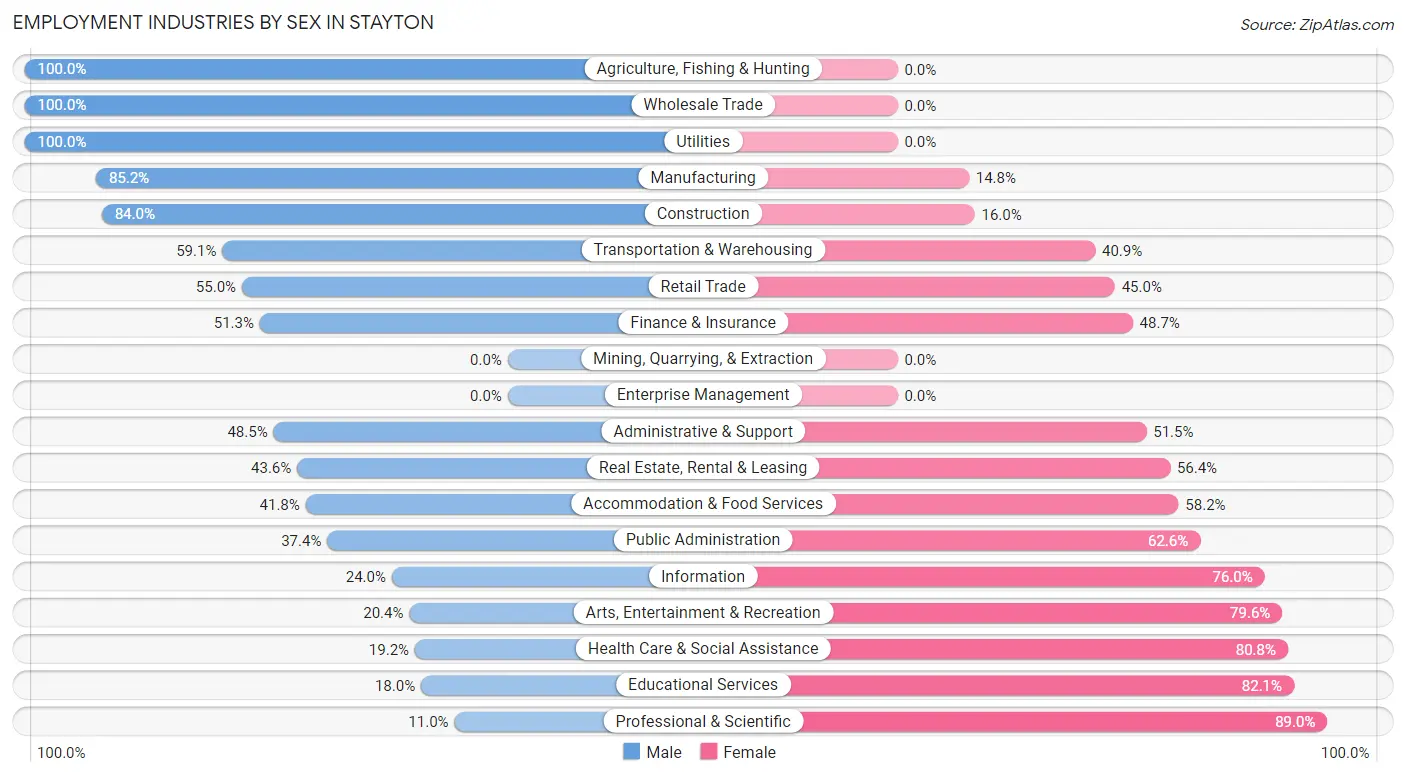
Employment Industries by Sex in Stayton
The Stayton industries that see more men than women are Agriculture, Fishing & Hunting (100.0%), Wholesale Trade (100.0%), and Utilities (100.0%), whereas the industries that tend to have a higher number of women are Professional & Scientific (89.0%), Educational Services (82.1%), and Health Care & Social Assistance (80.8%).
| Industry | Male | Female |
| Agriculture, Fishing & Hunting | 55 (100.0%) | 0 (0.0%) |
| Mining, Quarrying, & Extraction | 0 (0.0%) | 0 (0.0%) |
| Construction | 100 (84.0%) | 19 (16.0%) |
| Manufacturing | 542 (85.2%) | 94 (14.8%) |
| Wholesale Trade | 90 (100.0%) | 0 (0.0%) |
| Retail Trade | 340 (55.0%) | 278 (45.0%) |
| Transportation & Warehousing | 117 (59.1%) | 81 (40.9%) |
| Utilities | 35 (100.0%) | 0 (0.0%) |
| Information | 18 (24.0%) | 57 (76.0%) |
| Finance & Insurance | 157 (51.3%) | 149 (48.7%) |
| Real Estate, Rental & Leasing | 17 (43.6%) | 22 (56.4%) |
| Professional & Scientific | 17 (11.0%) | 137 (89.0%) |
| Enterprise Management | 0 (0.0%) | 0 (0.0%) |
| Administrative & Support | 80 (48.5%) | 85 (51.5%) |
| Educational Services | 56 (17.9%) | 256 (82.1%) |
| Health Care & Social Assistance | 68 (19.2%) | 286 (80.8%) |
| Arts, Entertainment & Recreation | 22 (20.4%) | 86 (79.6%) |
| Accommodation & Food Services | 100 (41.8%) | 139 (58.2%) |
| Public Administration | 34 (37.4%) | 57 (62.6%) |
| Total | 1,909 (51.4%) | 1,806 (48.6%) |
Education in Stayton
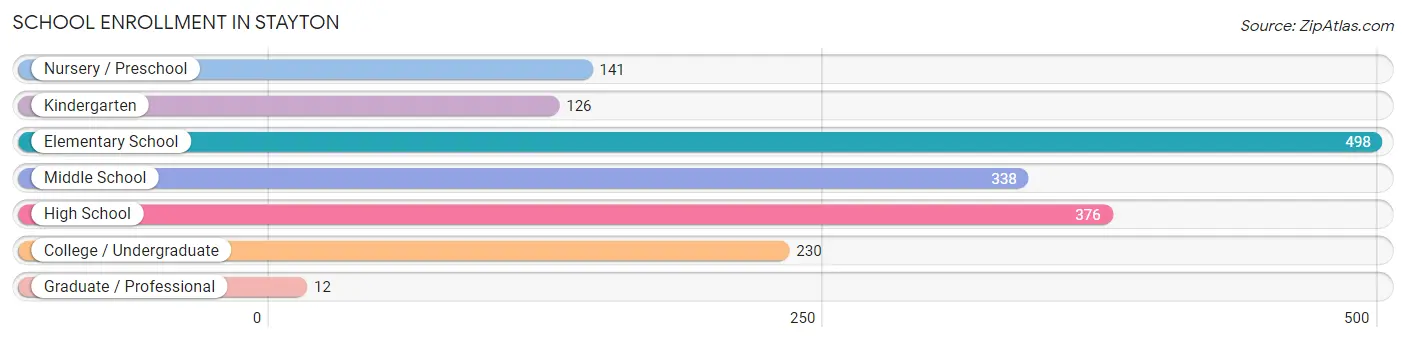
School Enrollment in Stayton
The most common levels of schooling among the 1,721 students in Stayton are elementary school (498 | 28.9%), high school (376 | 21.8%), and middle school (338 | 19.6%).
| School Level | # Students | % Students |
| Nursery / Preschool | 141 | 8.2% |
| Kindergarten | 126 | 7.3% |
| Elementary School | 498 | 28.9% |
| Middle School | 338 | 19.6% |
| High School | 376 | 21.8% |
| College / Undergraduate | 230 | 13.4% |
| Graduate / Professional | 12 | 0.7% |
| Total | 1,721 | 100.0% |
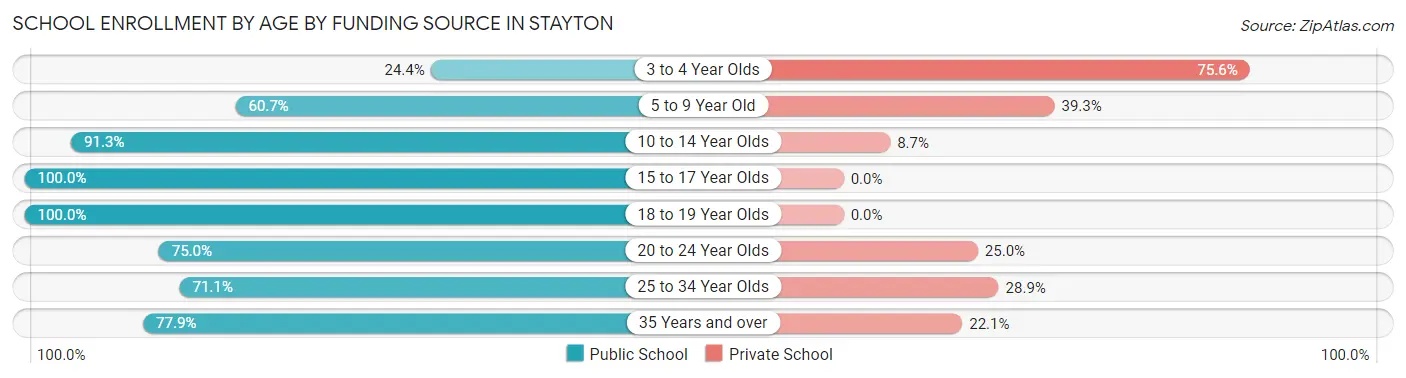
School Enrollment by Age by Funding Source in Stayton
Out of a total of 1,721 students who are enrolled in schools in Stayton, 420 (24.4%) attend a private institution, while the remaining 1,301 (75.6%) are enrolled in public schools. The age group of 3 to 4 year olds has the highest likelihood of being enrolled in private schools, with 93 (75.6% in the age bracket) enrolled. Conversely, the age group of 15 to 17 year olds has the lowest likelihood of being enrolled in a private school, with 325 (100.0% in the age bracket) attending a public institution.
| Age Bracket | Public School | Private School |
| 3 to 4 Year Olds | 30 (24.4%) | 93 (75.6%) |
| 5 to 9 Year Old | 354 (60.7%) | 229 (39.3%) |
| 10 to 14 Year Olds | 379 (91.3%) | 36 (8.7%) |
| 15 to 17 Year Olds | 325 (100.0%) | 0 (0.0%) |
| 18 to 19 Year Olds | 32 (100.0%) | 0 (0.0%) |
| 20 to 24 Year Olds | 45 (75.0%) | 15 (25.0%) |
| 25 to 34 Year Olds | 69 (71.1%) | 28 (28.9%) |
| 35 Years and over | 67 (77.9%) | 19 (22.1%) |
| Total | 1,301 (75.6%) | 420 (24.4%) |
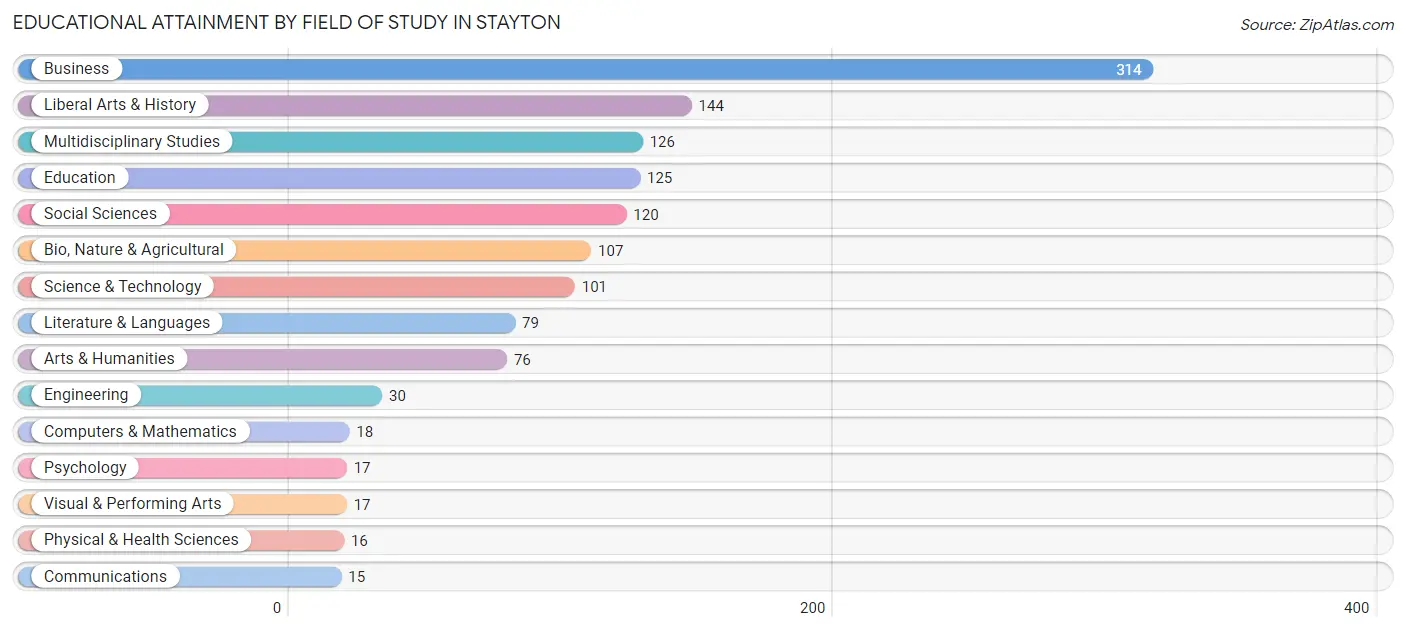
Educational Attainment by Field of Study in Stayton
Business (314 | 24.1%), liberal arts & history (144 | 11.0%), multidisciplinary studies (126 | 9.7%), education (125 | 9.6%), and social sciences (120 | 9.2%) are the most common fields of study among 1,305 individuals in Stayton who have obtained a bachelor's degree or higher.
| Field of Study | # Graduates | % Graduates |
| Computers & Mathematics | 18 | 1.4% |
| Bio, Nature & Agricultural | 107 | 8.2% |
| Physical & Health Sciences | 16 | 1.2% |
| Psychology | 17 | 1.3% |
| Social Sciences | 120 | 9.2% |
| Engineering | 30 | 2.3% |
| Multidisciplinary Studies | 126 | 9.7% |
| Science & Technology | 101 | 7.7% |
| Business | 314 | 24.1% |
| Education | 125 | 9.6% |
| Literature & Languages | 79 | 6.0% |
| Liberal Arts & History | 144 | 11.0% |
| Visual & Performing Arts | 17 | 1.3% |
| Communications | 15 | 1.1% |
| Arts & Humanities | 76 | 5.8% |
| Total | 1,305 | 100.0% |
Transportation & Commute in Stayton
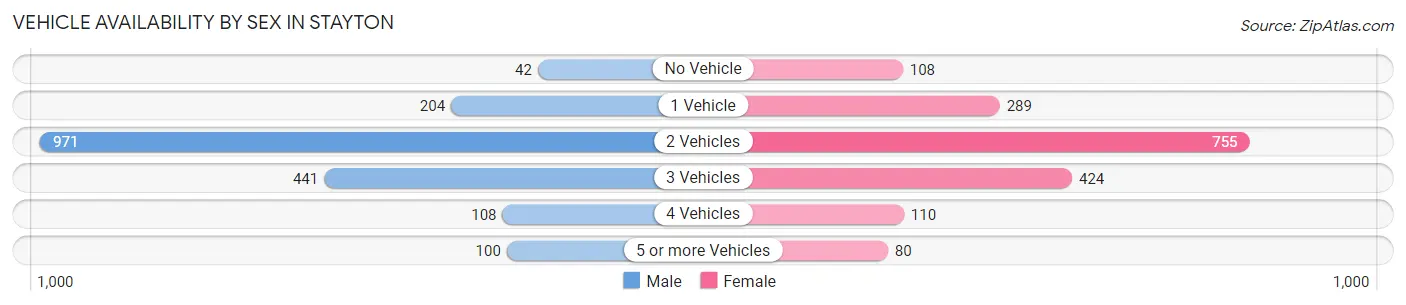
Vehicle Availability by Sex in Stayton
The most prevalent vehicle ownership categories in Stayton are males with 2 vehicles (971, accounting for 52.0%) and females with 2 vehicles (755, making up 55.0%).
| Vehicles Available | Male | Female |
| No Vehicle | 42 (2.2%) | 108 (6.1%) |
| 1 Vehicle | 204 (10.9%) | 289 (16.4%) |
| 2 Vehicles | 971 (52.0%) | 755 (42.7%) |
| 3 Vehicles | 441 (23.6%) | 424 (24.0%) |
| 4 Vehicles | 108 (5.8%) | 110 (6.2%) |
| 5 or more Vehicles | 100 (5.4%) | 80 (4.5%) |
| Total | 1,866 (100.0%) | 1,766 (100.0%) |
Commute Time in Stayton
The most frequently occuring commute durations in Stayton are 5 to 9 minutes (773 commuters, 25.1%), 25 to 29 minutes (426 commuters, 13.8%), and 15 to 19 minutes (378 commuters, 12.3%).
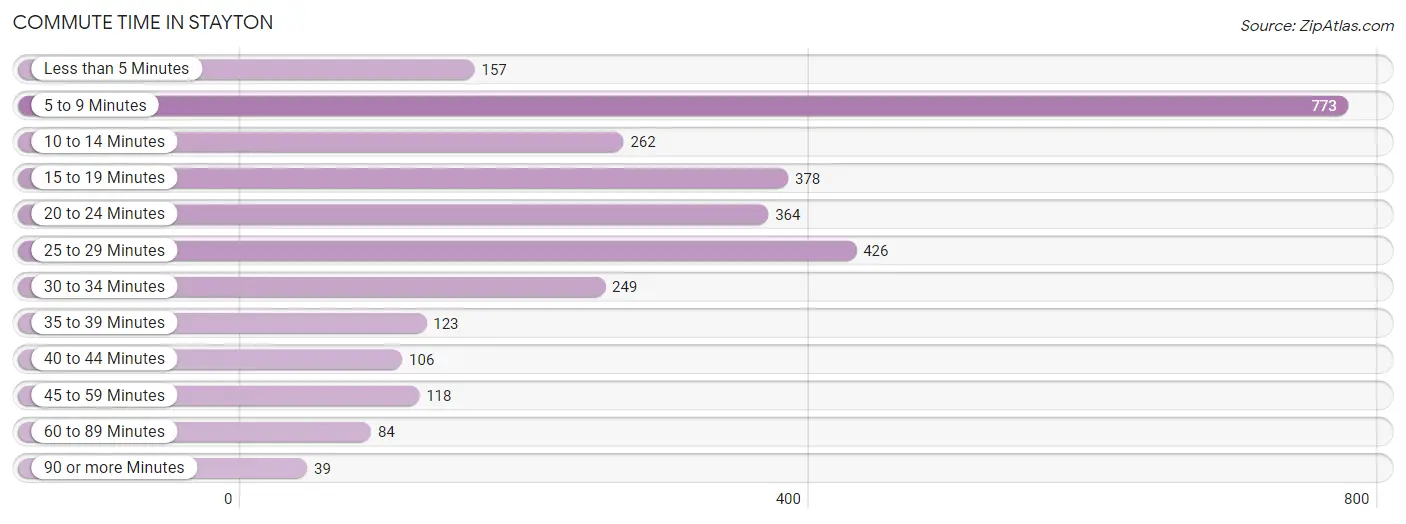
| Commute Time | # Commuters | % Commuters |
| Less than 5 Minutes | 157 | 5.1% |
| 5 to 9 Minutes | 773 | 25.1% |
| 10 to 14 Minutes | 262 | 8.5% |
| 15 to 19 Minutes | 378 | 12.3% |
| 20 to 24 Minutes | 364 | 11.8% |
| 25 to 29 Minutes | 426 | 13.8% |
| 30 to 34 Minutes | 249 | 8.1% |
| 35 to 39 Minutes | 123 | 4.0% |
| 40 to 44 Minutes | 106 | 3.4% |
| 45 to 59 Minutes | 118 | 3.8% |
| 60 to 89 Minutes | 84 | 2.7% |
| 90 or more Minutes | 39 | 1.3% |
Commute Time by Sex in Stayton
The most common commute times in Stayton are 5 to 9 minutes (328 commuters, 20.4%) for males and 5 to 9 minutes (445 commuters, 30.3%) for females.
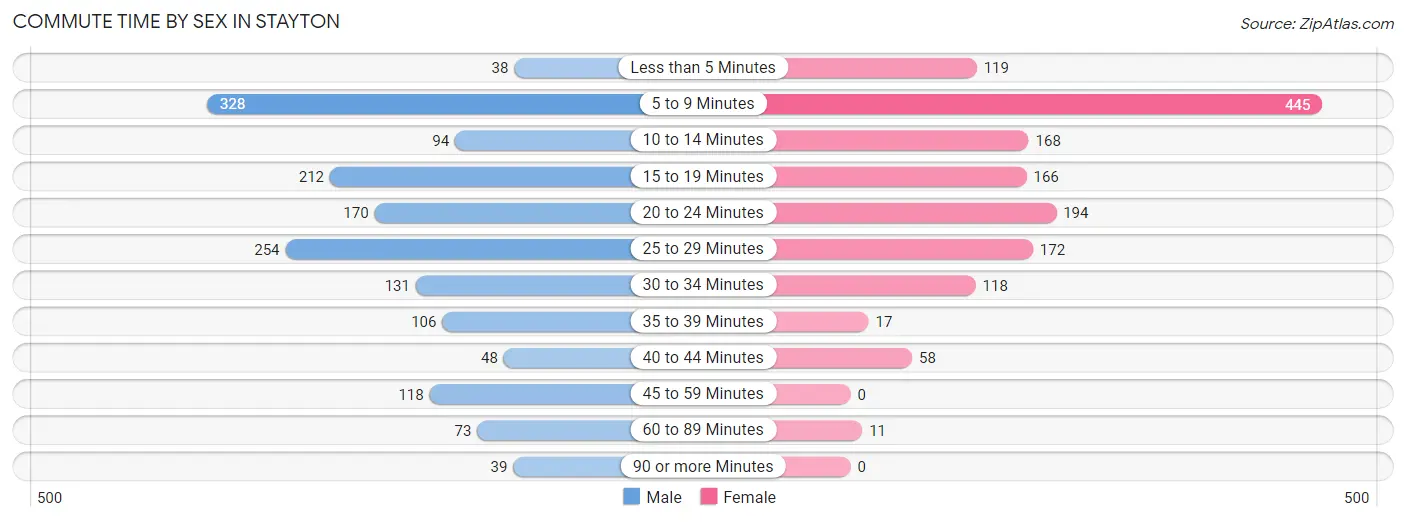
| Commute Time | Male | Female |
| Less than 5 Minutes | 38 (2.4%) | 119 (8.1%) |
| 5 to 9 Minutes | 328 (20.4%) | 445 (30.3%) |
| 10 to 14 Minutes | 94 (5.8%) | 168 (11.4%) |
| 15 to 19 Minutes | 212 (13.2%) | 166 (11.3%) |
| 20 to 24 Minutes | 170 (10.5%) | 194 (13.2%) |
| 25 to 29 Minutes | 254 (15.8%) | 172 (11.7%) |
| 30 to 34 Minutes | 131 (8.1%) | 118 (8.0%) |
| 35 to 39 Minutes | 106 (6.6%) | 17 (1.2%) |
| 40 to 44 Minutes | 48 (3.0%) | 58 (4.0%) |
| 45 to 59 Minutes | 118 (7.3%) | 0 (0.0%) |
| 60 to 89 Minutes | 73 (4.5%) | 11 (0.7%) |
| 90 or more Minutes | 39 (2.4%) | 0 (0.0%) |
Time of Departure to Work by Sex in Stayton
The most frequent times of departure to work in Stayton are 12:00 PM to 3:59 PM (308, 19.1%) for males and 7:30 AM to 7:59 AM (261, 17.8%) for females.
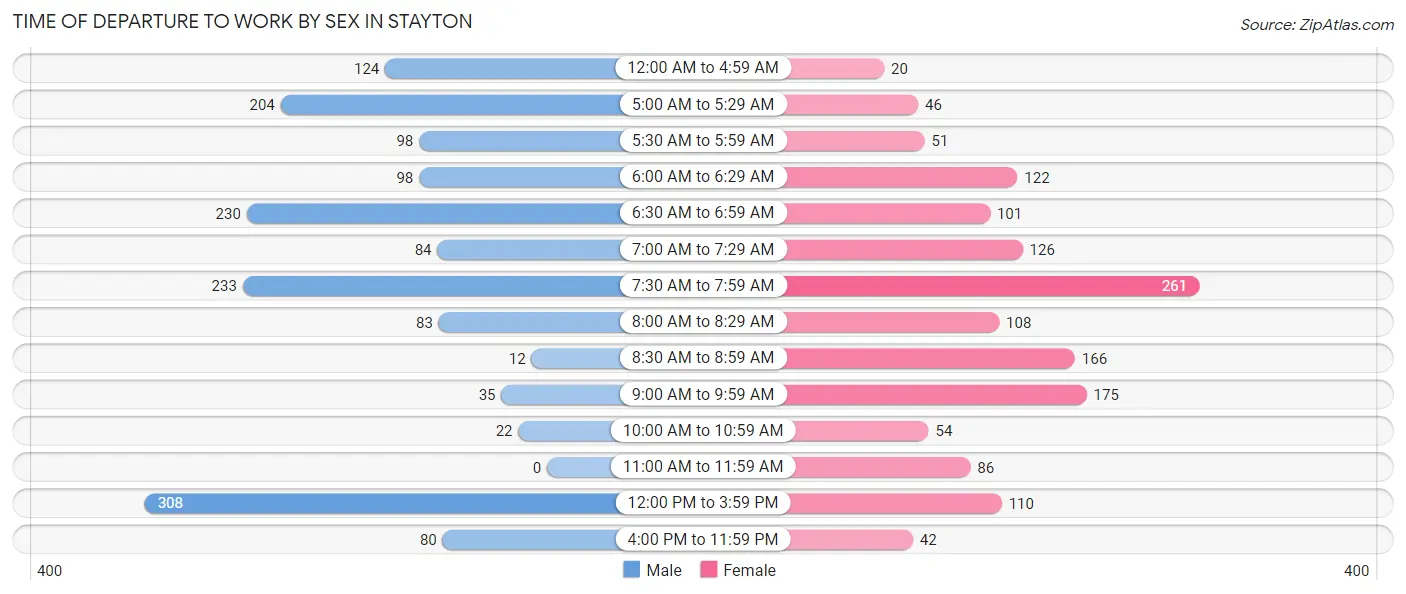
| Time of Departure | Male | Female |
| 12:00 AM to 4:59 AM | 124 (7.7%) | 20 (1.4%) |
| 5:00 AM to 5:29 AM | 204 (12.7%) | 46 (3.1%) |
| 5:30 AM to 5:59 AM | 98 (6.1%) | 51 (3.5%) |
| 6:00 AM to 6:29 AM | 98 (6.1%) | 122 (8.3%) |
| 6:30 AM to 6:59 AM | 230 (14.3%) | 101 (6.9%) |
| 7:00 AM to 7:29 AM | 84 (5.2%) | 126 (8.6%) |
| 7:30 AM to 7:59 AM | 233 (14.5%) | 261 (17.8%) |
| 8:00 AM to 8:29 AM | 83 (5.1%) | 108 (7.4%) |
| 8:30 AM to 8:59 AM | 12 (0.7%) | 166 (11.3%) |
| 9:00 AM to 9:59 AM | 35 (2.2%) | 175 (11.9%) |
| 10:00 AM to 10:59 AM | 22 (1.4%) | 54 (3.7%) |
| 11:00 AM to 11:59 AM | 0 (0.0%) | 86 (5.9%) |
| 12:00 PM to 3:59 PM | 308 (19.1%) | 110 (7.5%) |
| 4:00 PM to 11:59 PM | 80 (5.0%) | 42 (2.9%) |
| Total | 1,611 (100.0%) | 1,468 (100.0%) |
Housing Occupancy in Stayton
Occupancy by Ownership in Stayton
Of the total 3,095 dwellings in Stayton, owner-occupied units account for 1,922 (62.1%), while renter-occupied units make up 1,173 (37.9%).
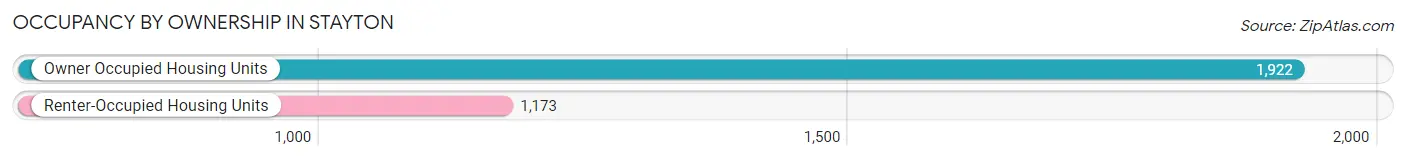
| Occupancy | # Housing Units | % Housing Units |
| Owner Occupied Housing Units | 1,922 | 62.1% |
| Renter-Occupied Housing Units | 1,173 | 37.9% |
| Total Occupied Housing Units | 3,095 | 100.0% |
Occupancy by Household Size in Stayton
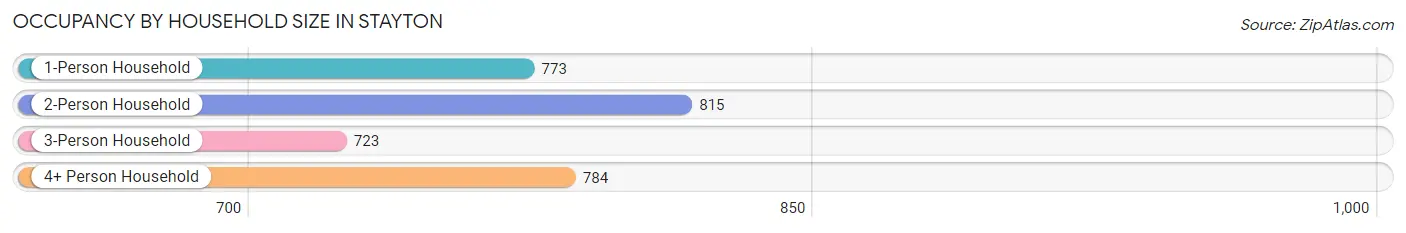
| Household Size | # Housing Units | % Housing Units |
| 1-Person Household | 773 | 25.0% |
| 2-Person Household | 815 | 26.3% |
| 3-Person Household | 723 | 23.4% |
| 4+ Person Household | 784 | 25.3% |
| Total Housing Units | 3,095 | 100.0% |
Occupancy by Ownership by Household Size in Stayton
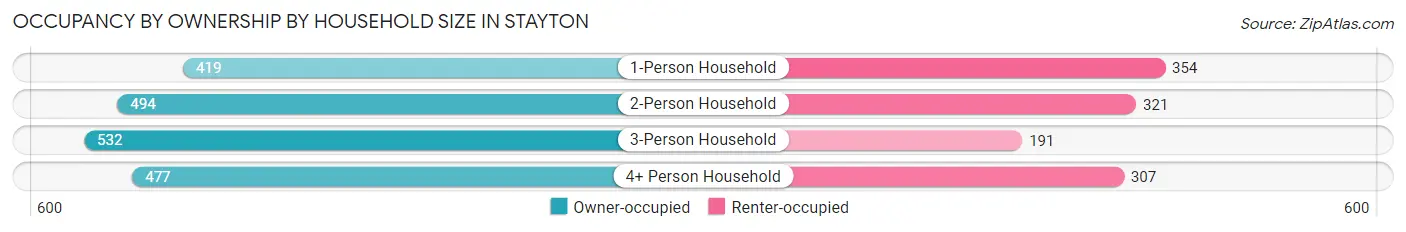
| Household Size | Owner-occupied | Renter-occupied |
| 1-Person Household | 419 (54.2%) | 354 (45.8%) |
| 2-Person Household | 494 (60.6%) | 321 (39.4%) |
| 3-Person Household | 532 (73.6%) | 191 (26.4%) |
| 4+ Person Household | 477 (60.8%) | 307 (39.2%) |
| Total Housing Units | 1,922 (62.1%) | 1,173 (37.9%) |
Occupancy by Educational Attainment in Stayton
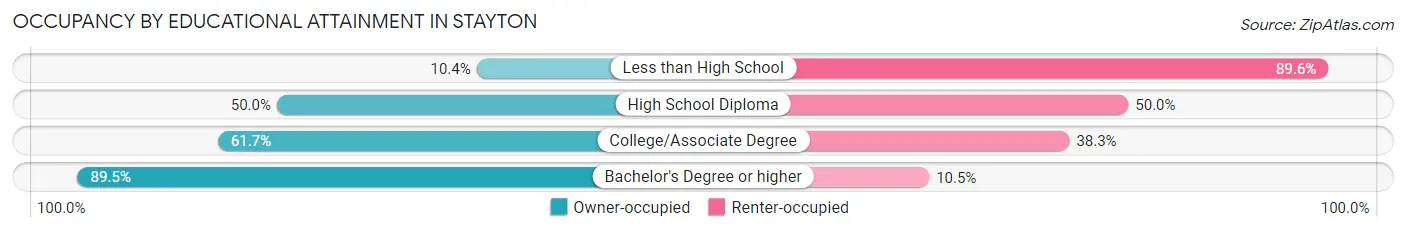
| Household Size | Owner-occupied | Renter-occupied |
| Less than High School | 29 (10.4%) | 250 (89.6%) |
| High School Diploma | 283 (50.0%) | 283 (50.0%) |
| College/Associate Degree | 895 (61.7%) | 556 (38.3%) |
| Bachelor's Degree or higher | 715 (89.5%) | 84 (10.5%) |
Occupancy by Age of Householder in Stayton
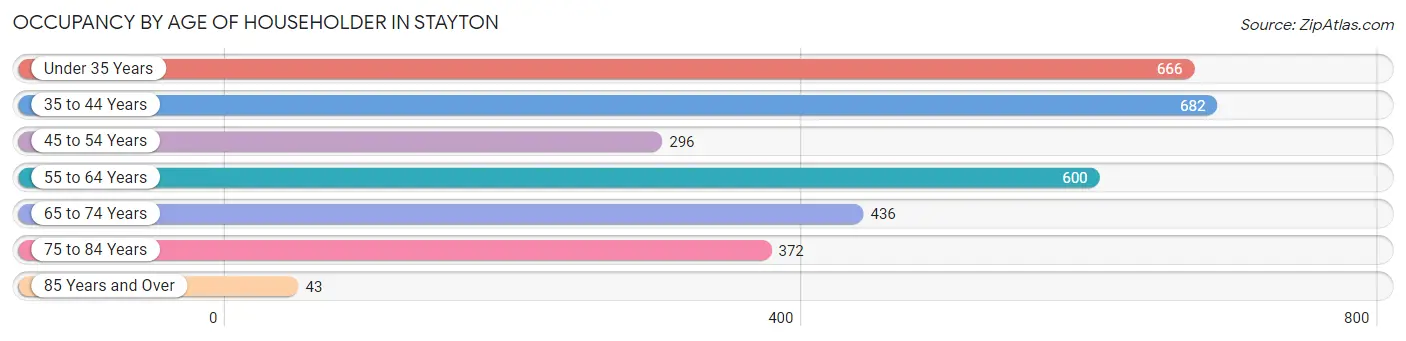
| Age Bracket | # Households | % Households |
| Under 35 Years | 666 | 21.5% |
| 35 to 44 Years | 682 | 22.0% |
| 45 to 54 Years | 296 | 9.6% |
| 55 to 64 Years | 600 | 19.4% |
| 65 to 74 Years | 436 | 14.1% |
| 75 to 84 Years | 372 | 12.0% |
| 85 Years and Over | 43 | 1.4% |
| Total | 3,095 | 100.0% |
Housing Finances in Stayton
Median Income by Occupancy in Stayton
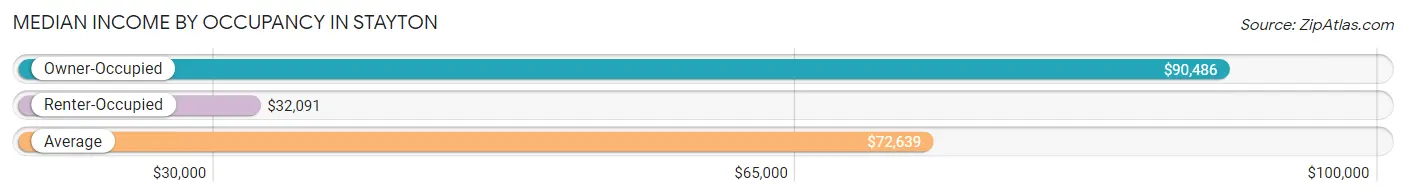
| Occupancy Type | # Households | Median Income |
| Owner-Occupied | 1,922 (62.1%) | $90,486 |
| Renter-Occupied | 1,173 (37.9%) | $32,091 |
| Average | 3,095 (100.0%) | $72,639 |
Occupancy by Householder Income Bracket in Stayton
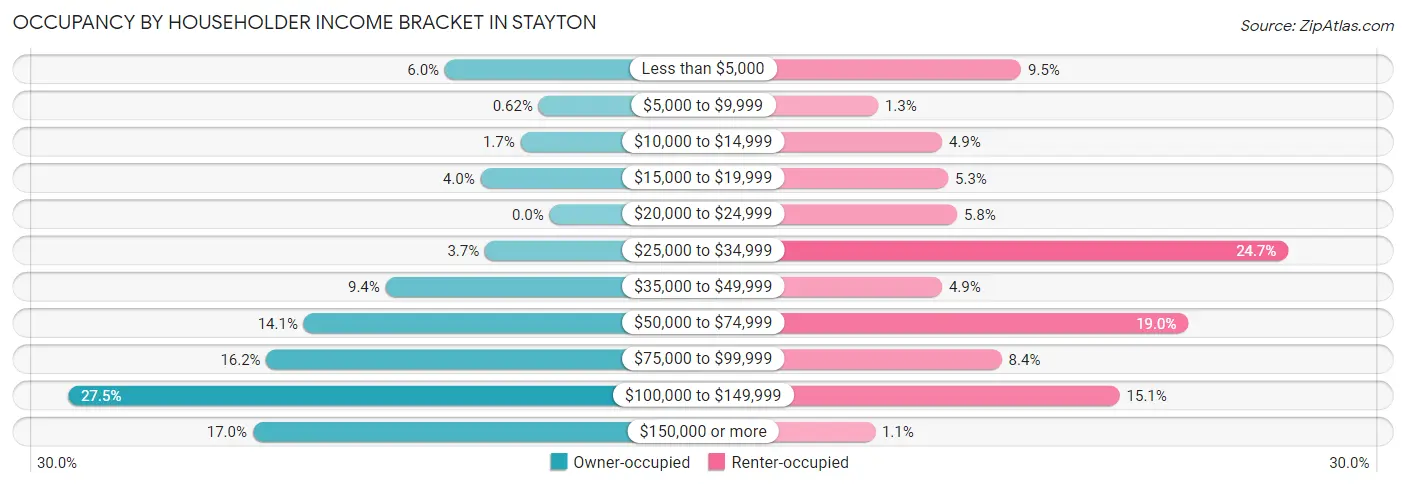
| Income Bracket | Owner-occupied | Renter-occupied |
| Less than $5,000 | 115 (6.0%) | 111 (9.5%) |
| $5,000 to $9,999 | 12 (0.6%) | 15 (1.3%) |
| $10,000 to $14,999 | 32 (1.7%) | 58 (4.9%) |
| $15,000 to $19,999 | 76 (4.0%) | 62 (5.3%) |
| $20,000 to $24,999 | 0 (0.0%) | 68 (5.8%) |
| $25,000 to $34,999 | 71 (3.7%) | 290 (24.7%) |
| $35,000 to $49,999 | 180 (9.4%) | 58 (4.9%) |
| $50,000 to $74,999 | 270 (14.1%) | 223 (19.0%) |
| $75,000 to $99,999 | 311 (16.2%) | 98 (8.4%) |
| $100,000 to $149,999 | 529 (27.5%) | 177 (15.1%) |
| $150,000 or more | 326 (17.0%) | 13 (1.1%) |
| Total | 1,922 (100.0%) | 1,173 (100.0%) |
Monthly Housing Cost Tiers in Stayton
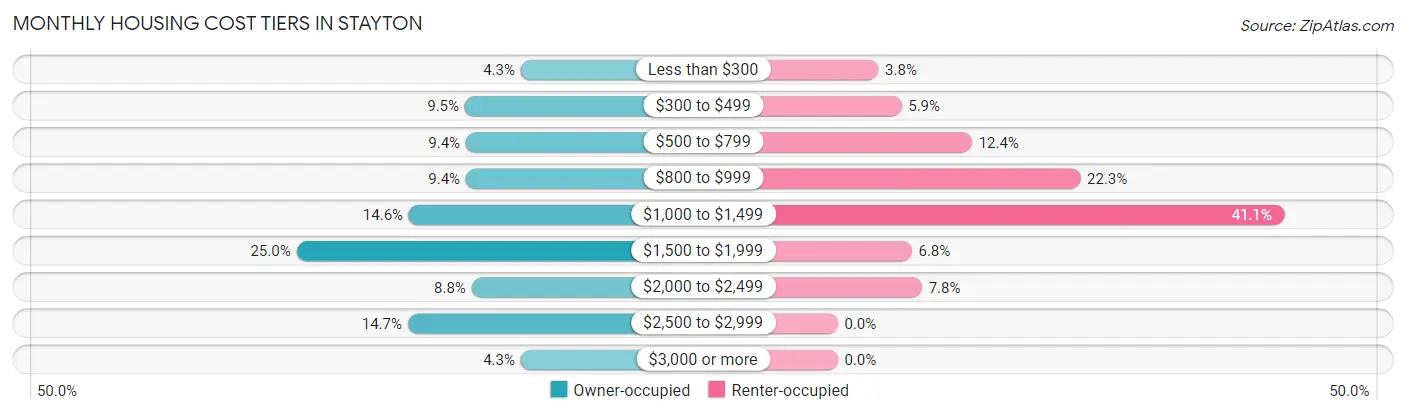
| Monthly Cost | Owner-occupied | Renter-occupied |
| Less than $300 | 83 (4.3%) | 44 (3.7%) |
| $300 to $499 | 182 (9.5%) | 69 (5.9%) |
| $500 to $799 | 180 (9.4%) | 145 (12.4%) |
| $800 to $999 | 180 (9.4%) | 262 (22.3%) |
| $1,000 to $1,499 | 281 (14.6%) | 482 (41.1%) |
| $1,500 to $1,999 | 480 (25.0%) | 80 (6.8%) |
| $2,000 to $2,499 | 170 (8.8%) | 91 (7.8%) |
| $2,500 to $2,999 | 283 (14.7%) | 0 (0.0%) |
| $3,000 or more | 83 (4.3%) | 0 (0.0%) |
| Total | 1,922 (100.0%) | 1,173 (100.0%) |
Physical Housing Characteristics in Stayton
Housing Structures in Stayton
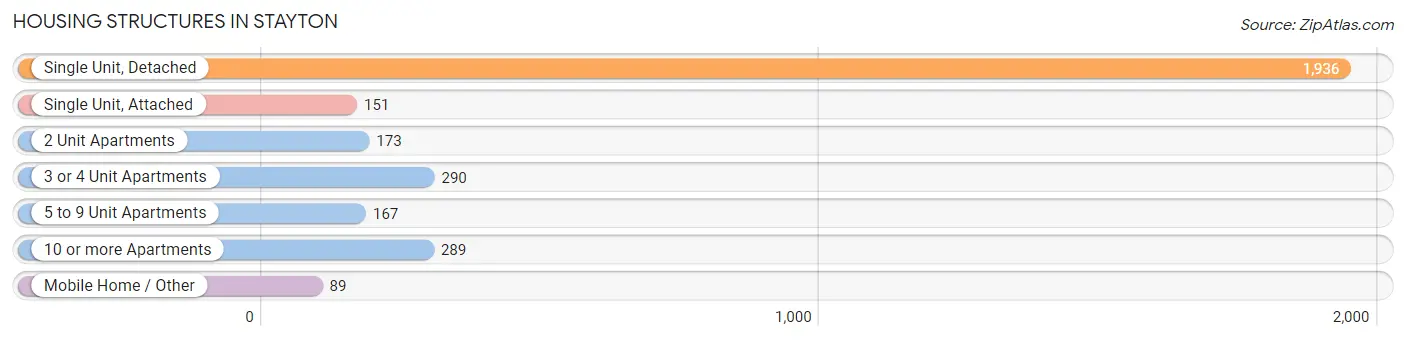
| Structure Type | # Housing Units | % Housing Units |
| Single Unit, Detached | 1,936 | 62.5% |
| Single Unit, Attached | 151 | 4.9% |
| 2 Unit Apartments | 173 | 5.6% |
| 3 or 4 Unit Apartments | 290 | 9.4% |
| 5 to 9 Unit Apartments | 167 | 5.4% |
| 10 or more Apartments | 289 | 9.3% |
| Mobile Home / Other | 89 | 2.9% |
| Total | 3,095 | 100.0% |
Housing Structures by Occupancy in Stayton
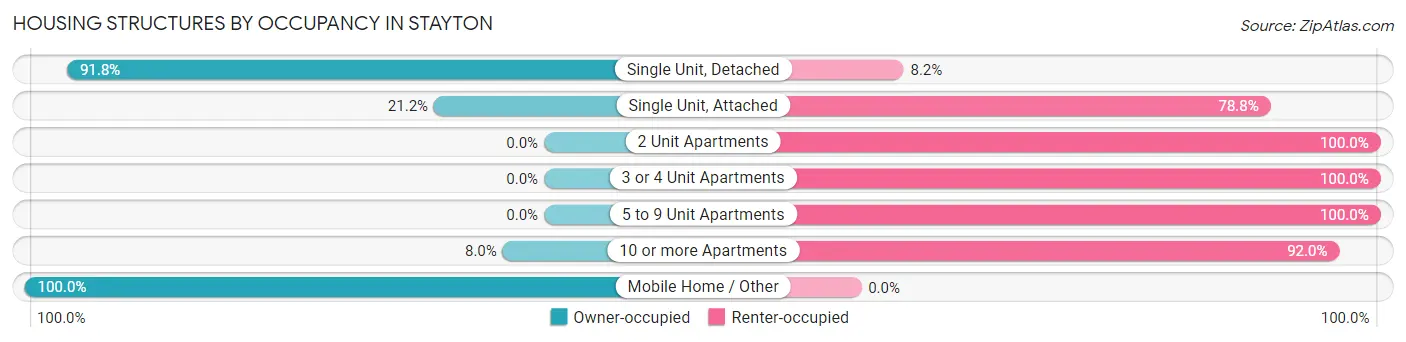
| Structure Type | Owner-occupied | Renter-occupied |
| Single Unit, Detached | 1,778 (91.8%) | 158 (8.2%) |
| Single Unit, Attached | 32 (21.2%) | 119 (78.8%) |
| 2 Unit Apartments | 0 (0.0%) | 173 (100.0%) |
| 3 or 4 Unit Apartments | 0 (0.0%) | 290 (100.0%) |
| 5 to 9 Unit Apartments | 0 (0.0%) | 167 (100.0%) |
| 10 or more Apartments | 23 (8.0%) | 266 (92.0%) |
| Mobile Home / Other | 89 (100.0%) | 0 (0.0%) |
| Total | 1,922 (62.1%) | 1,173 (37.9%) |
Housing Structures by Number of Rooms in Stayton
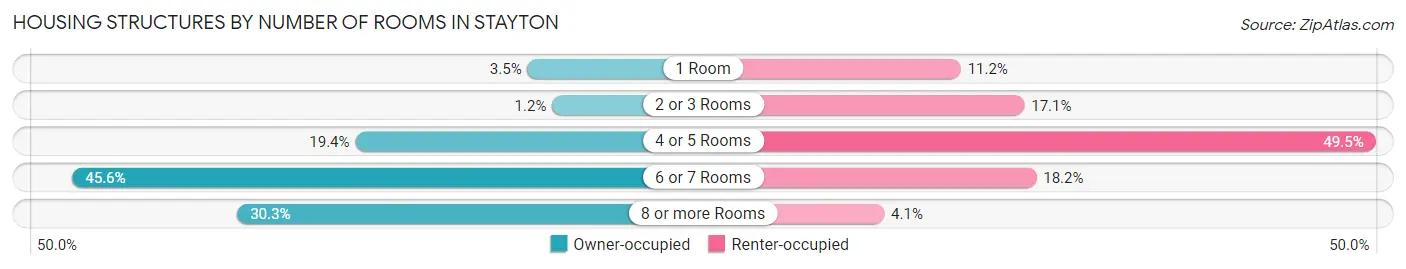
| Number of Rooms | Owner-occupied | Renter-occupied |
| 1 Room | 67 (3.5%) | 131 (11.2%) |
| 2 or 3 Rooms | 23 (1.2%) | 200 (17.1%) |
| 4 or 5 Rooms | 373 (19.4%) | 581 (49.5%) |
| 6 or 7 Rooms | 876 (45.6%) | 213 (18.2%) |
| 8 or more Rooms | 583 (30.3%) | 48 (4.1%) |
| Total | 1,922 (100.0%) | 1,173 (100.0%) |
Housing Structure by Heating Type in Stayton
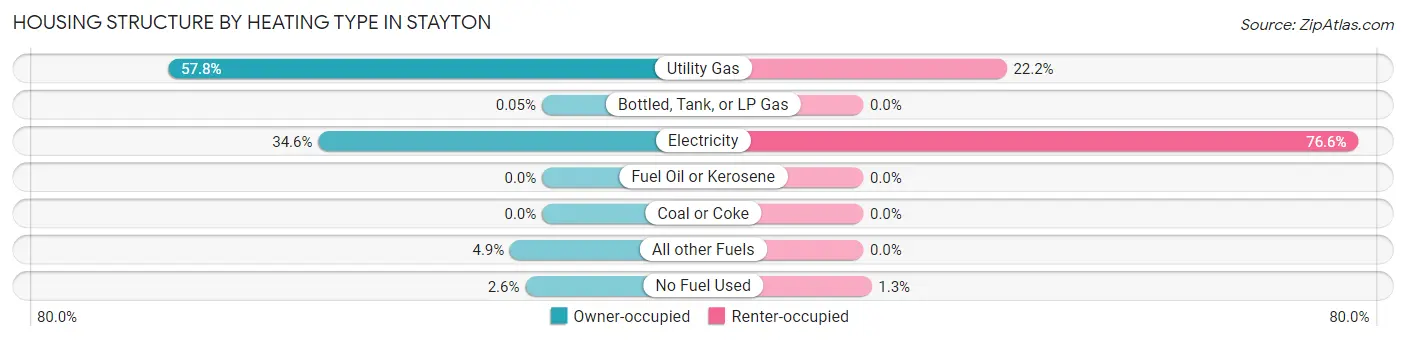
| Heating Type | Owner-occupied | Renter-occupied |
| Utility Gas | 1,111 (57.8%) | 260 (22.2%) |
| Bottled, Tank, or LP Gas | 1 (0.1%) | 0 (0.0%) |
| Electricity | 665 (34.6%) | 898 (76.6%) |
| Fuel Oil or Kerosene | 0 (0.0%) | 0 (0.0%) |
| Coal or Coke | 0 (0.0%) | 0 (0.0%) |
| All other Fuels | 95 (4.9%) | 0 (0.0%) |
| No Fuel Used | 50 (2.6%) | 15 (1.3%) |
| Total | 1,922 (100.0%) | 1,173 (100.0%) |
Household Vehicle Usage in Stayton
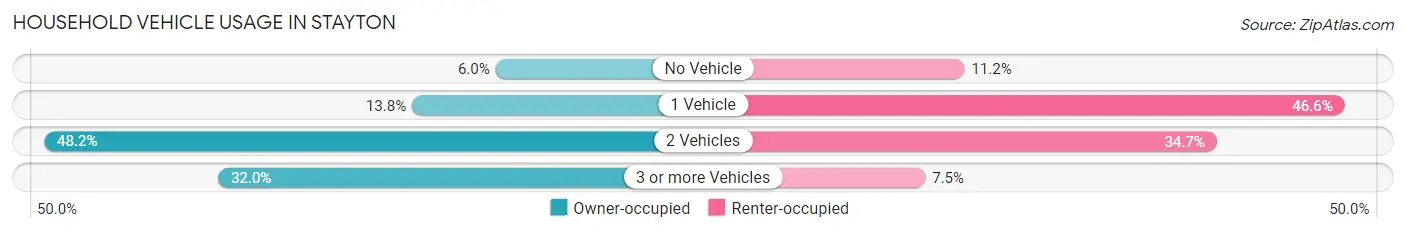
| Vehicles per Household | Owner-occupied | Renter-occupied |
| No Vehicle | 116 (6.0%) | 131 (11.2%) |
| 1 Vehicle | 266 (13.8%) | 547 (46.6%) |
| 2 Vehicles | 926 (48.2%) | 407 (34.7%) |
| 3 or more Vehicles | 614 (32.0%) | 88 (7.5%) |
| Total | 1,922 (100.0%) | 1,173 (100.0%) |
Real Estate & Mortgages in Stayton
Real Estate and Mortgage Overview in Stayton
| Characteristic | Without Mortgage | With Mortgage |
| Housing Units | 542 | 1,380 |
| Median Property Value | $338,200 | $386,000 |
| Median Household Income | $43,214 | $274 |
| Monthly Housing Costs | $560 | $83 |
| Real Estate Taxes | $2,848 | $0 |
Property Value by Mortgage Status in Stayton
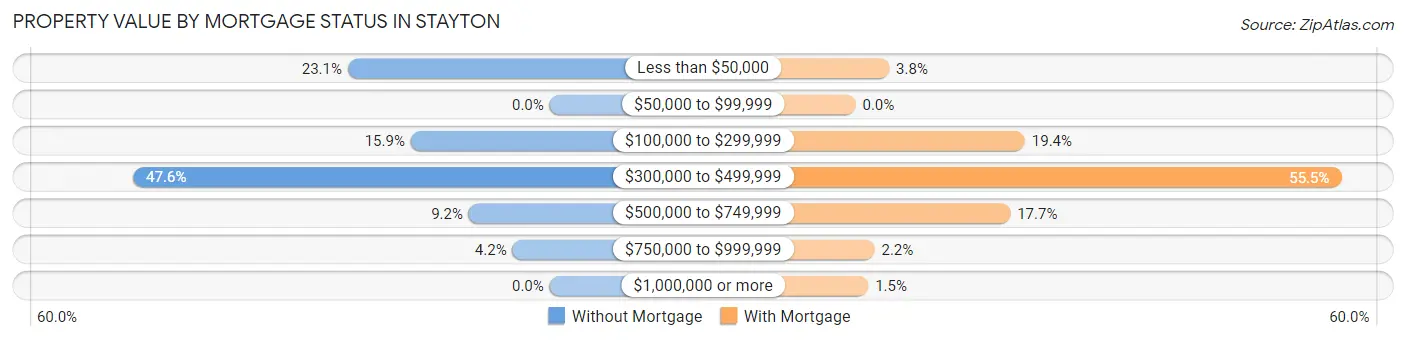
| Property Value | Without Mortgage | With Mortgage |
| Less than $50,000 | 125 (23.1%) | 53 (3.8%) |
| $50,000 to $99,999 | 0 (0.0%) | 0 (0.0%) |
| $100,000 to $299,999 | 86 (15.9%) | 267 (19.4%) |
| $300,000 to $499,999 | 258 (47.6%) | 766 (55.5%) |
| $500,000 to $749,999 | 50 (9.2%) | 244 (17.7%) |
| $750,000 to $999,999 | 23 (4.2%) | 30 (2.2%) |
| $1,000,000 or more | 0 (0.0%) | 20 (1.5%) |
| Total | 542 (100.0%) | 1,380 (100.0%) |
Household Income by Mortgage Status in Stayton
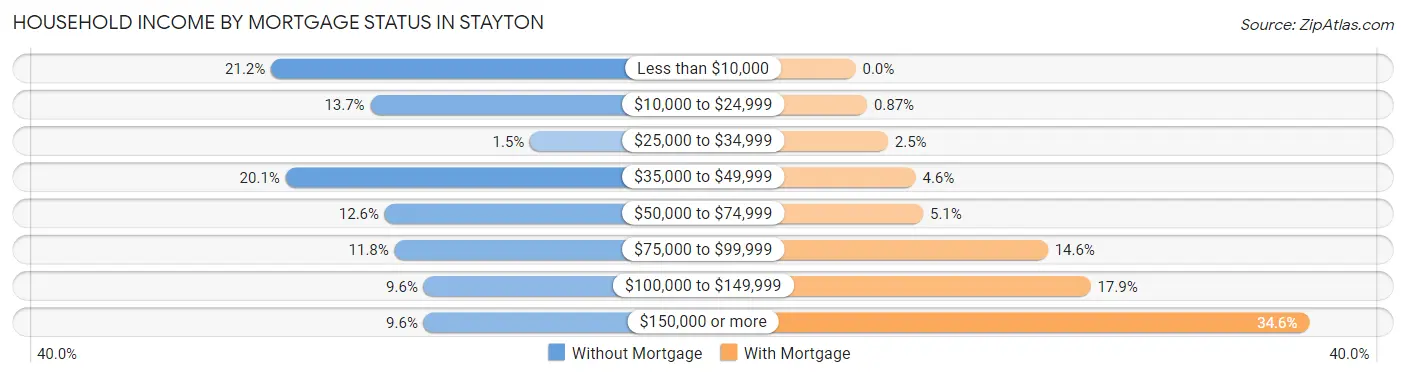
| Household Income | Without Mortgage | With Mortgage |
| Less than $10,000 | 115 (21.2%) | 0 (0.0%) |
| $10,000 to $24,999 | 74 (13.7%) | 12 (0.9%) |
| $25,000 to $34,999 | 8 (1.5%) | 34 (2.5%) |
| $35,000 to $49,999 | 109 (20.1%) | 63 (4.6%) |
| $50,000 to $74,999 | 68 (12.6%) | 71 (5.1%) |
| $75,000 to $99,999 | 64 (11.8%) | 202 (14.6%) |
| $100,000 to $149,999 | 52 (9.6%) | 247 (17.9%) |
| $150,000 or more | 52 (9.6%) | 477 (34.6%) |
| Total | 542 (100.0%) | 1,380 (100.0%) |
Property Value to Household Income Ratio in Stayton
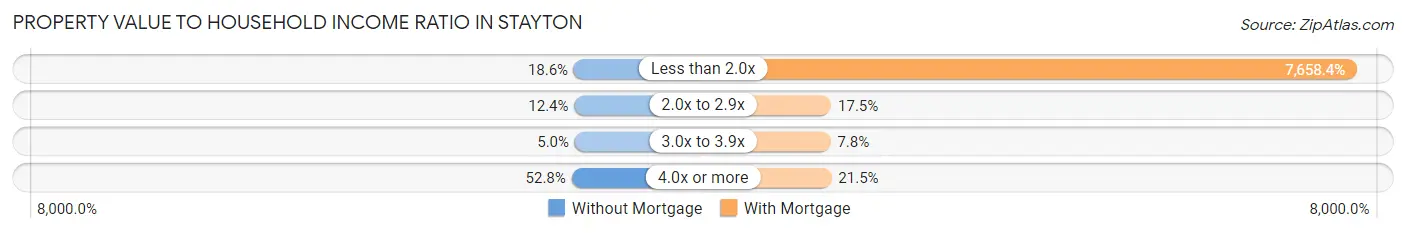
| Value-to-Income Ratio | Without Mortgage | With Mortgage |
| Less than 2.0x | 101 (18.6%) | 105,686 (7,658.4%) |
| 2.0x to 2.9x | 67 (12.4%) | 242 (17.5%) |
| 3.0x to 3.9x | 27 (5.0%) | 107 (7.7%) |
| 4.0x or more | 286 (52.8%) | 297 (21.5%) |
| Total | 542 (100.0%) | 1,380 (100.0%) |
Real Estate Taxes by Mortgage Status in Stayton
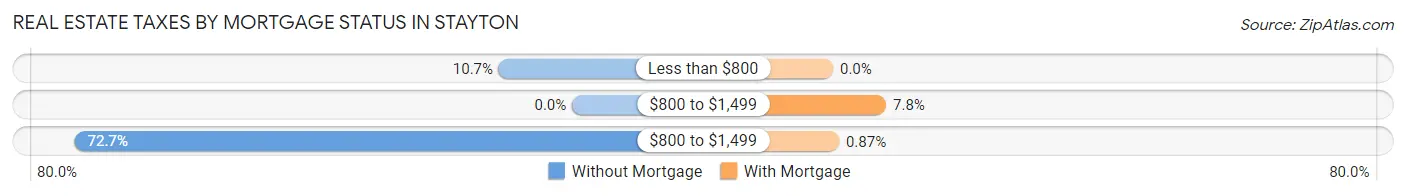
| Property Taxes | Without Mortgage | With Mortgage |
| Less than $800 | 58 (10.7%) | 0 (0.0%) |
| $800 to $1,499 | 0 (0.0%) | 107 (7.7%) |
| $800 to $1,499 | 394 (72.7%) | 12 (0.9%) |
| Total | 542 (100.0%) | 1,380 (100.0%) |
Health & Disability in Stayton
Health Insurance Coverage by Age in Stayton
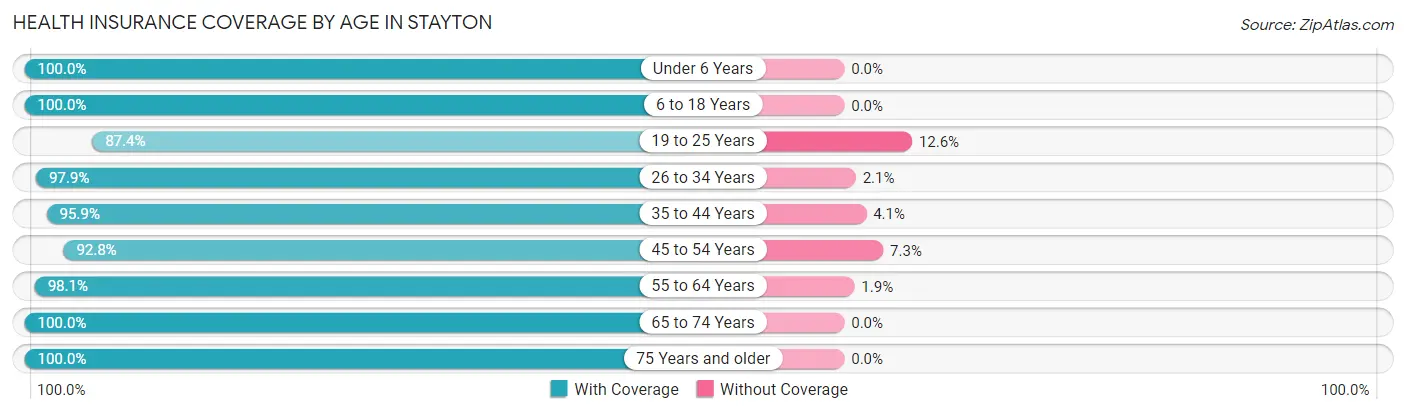
| Age Bracket | With Coverage | Without Coverage |
| Under 6 Years | 1,017 (100.0%) | 0 (0.0%) |
| 6 to 18 Years | 1,243 (100.0%) | 0 (0.0%) |
| 19 to 25 Years | 367 (87.4%) | 53 (12.6%) |
| 26 to 34 Years | 919 (97.9%) | 20 (2.1%) |
| 35 to 44 Years | 1,266 (95.9%) | 54 (4.1%) |
| 45 to 54 Years | 640 (92.7%) | 50 (7.2%) |
| 55 to 64 Years | 1,093 (98.1%) | 21 (1.9%) |
| 65 to 74 Years | 795 (100.0%) | 0 (0.0%) |
| 75 Years and older | 672 (100.0%) | 0 (0.0%) |
| Total | 8,012 (97.6%) | 198 (2.4%) |
Health Insurance Coverage by Citizenship Status in Stayton
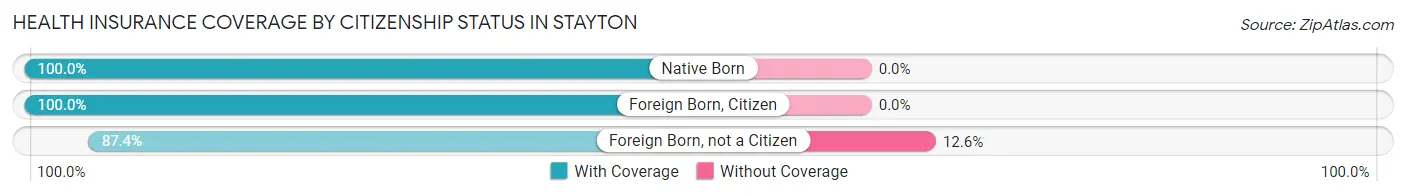
| Citizenship Status | With Coverage | Without Coverage |
| Native Born | 1,017 (100.0%) | 0 (0.0%) |
| Foreign Born, Citizen | 1,243 (100.0%) | 0 (0.0%) |
| Foreign Born, not a Citizen | 367 (87.4%) | 53 (12.6%) |
Health Insurance Coverage by Household Income in Stayton
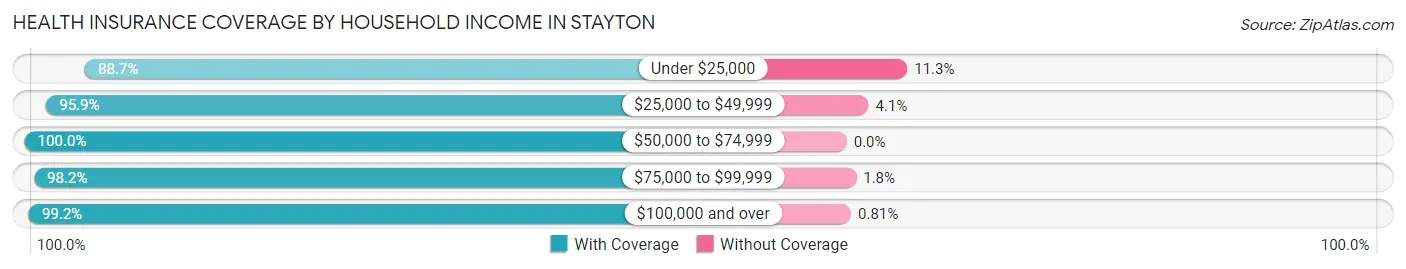
| Household Income | With Coverage | Without Coverage |
| Under $25,000 | 806 (88.7%) | 103 (11.3%) |
| $25,000 to $49,999 | 1,129 (95.9%) | 48 (4.1%) |
| $50,000 to $74,999 | 1,709 (100.0%) | 0 (0.0%) |
| $75,000 to $99,999 | 1,159 (98.2%) | 21 (1.8%) |
| $100,000 and over | 3,193 (99.2%) | 26 (0.8%) |
Public vs Private Health Insurance Coverage by Age in Stayton
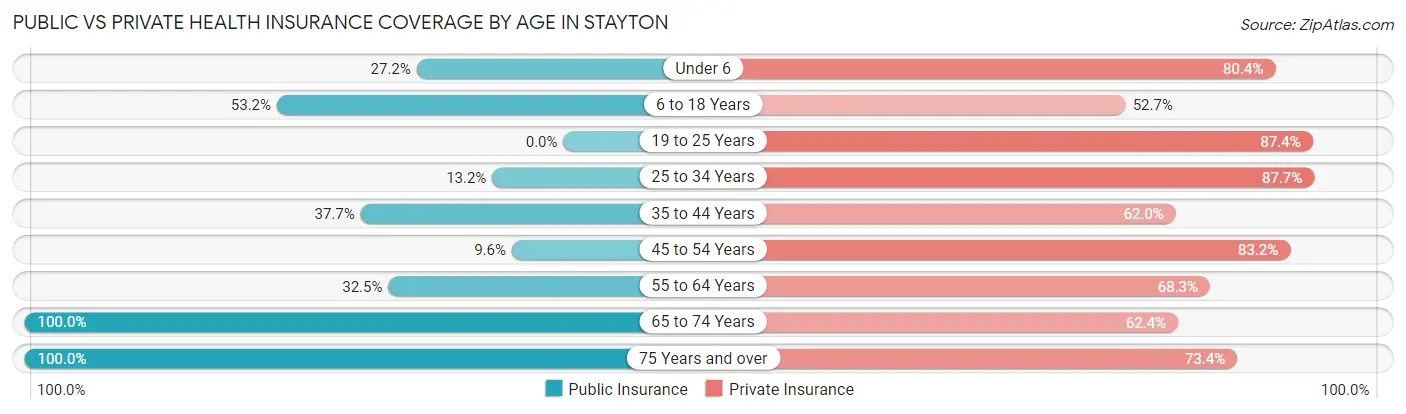
| Age Bracket | Public Insurance | Private Insurance |
| Under 6 | 277 (27.2%) | 818 (80.4%) |
| 6 to 18 Years | 661 (53.2%) | 655 (52.7%) |
| 19 to 25 Years | 0 (0.0%) | 367 (87.4%) |
| 25 to 34 Years | 124 (13.2%) | 823 (87.6%) |
| 35 to 44 Years | 497 (37.7%) | 818 (62.0%) |
| 45 to 54 Years | 66 (9.6%) | 574 (83.2%) |
| 55 to 64 Years | 362 (32.5%) | 761 (68.3%) |
| 65 to 74 Years | 795 (100.0%) | 496 (62.4%) |
| 75 Years and over | 672 (100.0%) | 493 (73.4%) |
| Total | 3,454 (42.1%) | 5,805 (70.7%) |
Disability Status by Sex by Age in Stayton
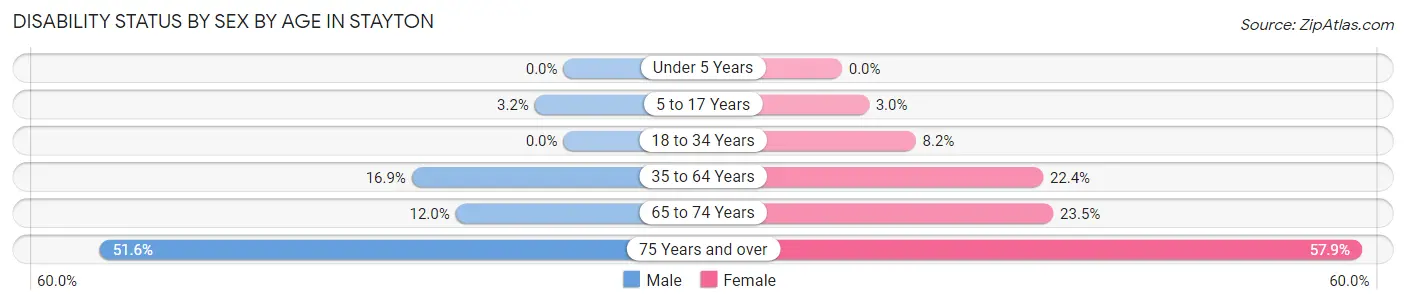
| Age Bracket | Male | Female |
| Under 5 Years | 0 (0.0%) | 0 (0.0%) |
| 5 to 17 Years | 22 (3.2%) | 19 (3.0%) |
| 18 to 34 Years | 0 (0.0%) | 75 (8.2%) |
| 35 to 64 Years | 281 (16.9%) | 327 (22.4%) |
| 65 to 74 Years | 46 (12.0%) | 97 (23.5%) |
| 75 Years and over | 174 (51.6%) | 194 (57.9%) |
Disability Class by Sex by Age in Stayton
Disability Class: Hearing Difficulty
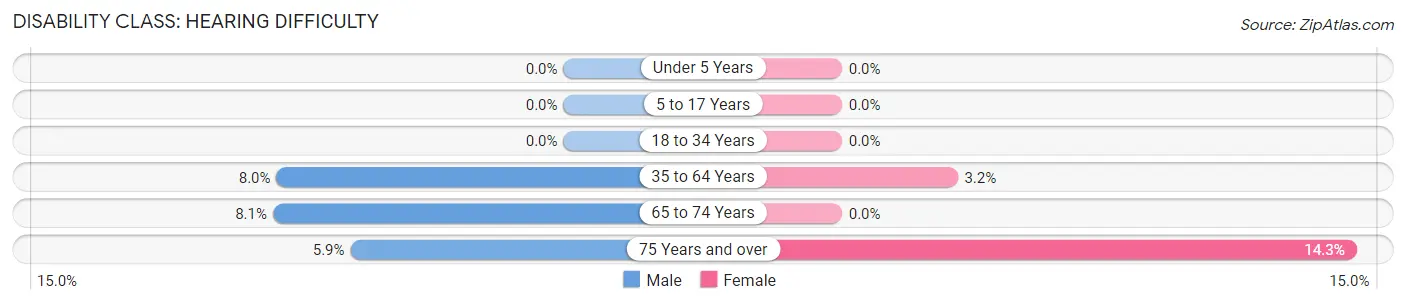
| Age Bracket | Male | Female |
| Under 5 Years | 0 (0.0%) | 0 (0.0%) |
| 5 to 17 Years | 0 (0.0%) | 0 (0.0%) |
| 18 to 34 Years | 0 (0.0%) | 0 (0.0%) |
| 35 to 64 Years | 133 (8.0%) | 47 (3.2%) |
| 65 to 74 Years | 31 (8.1%) | 0 (0.0%) |
| 75 Years and over | 20 (5.9%) | 48 (14.3%) |
Disability Class: Vision Difficulty
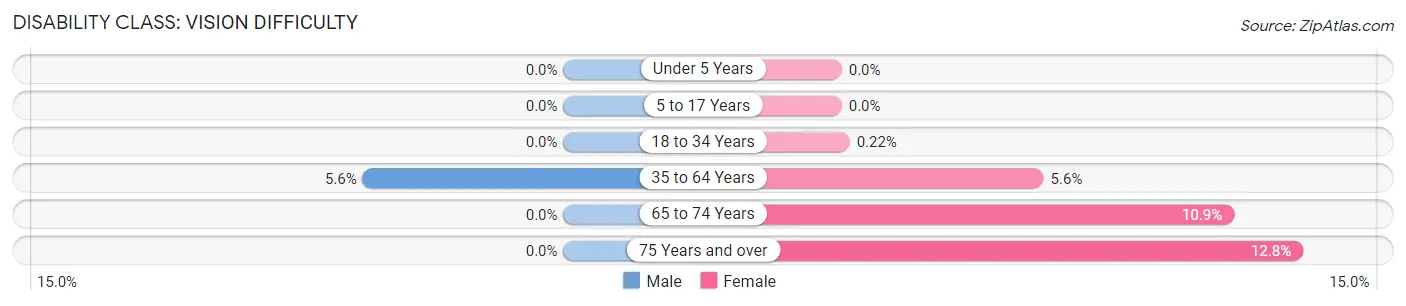
| Age Bracket | Male | Female |
| Under 5 Years | 0 (0.0%) | 0 (0.0%) |
| 5 to 17 Years | 0 (0.0%) | 0 (0.0%) |
| 18 to 34 Years | 0 (0.0%) | 2 (0.2%) |
| 35 to 64 Years | 93 (5.6%) | 82 (5.6%) |
| 65 to 74 Years | 0 (0.0%) | 45 (10.9%) |
| 75 Years and over | 0 (0.0%) | 43 (12.8%) |
Disability Class: Cognitive Difficulty
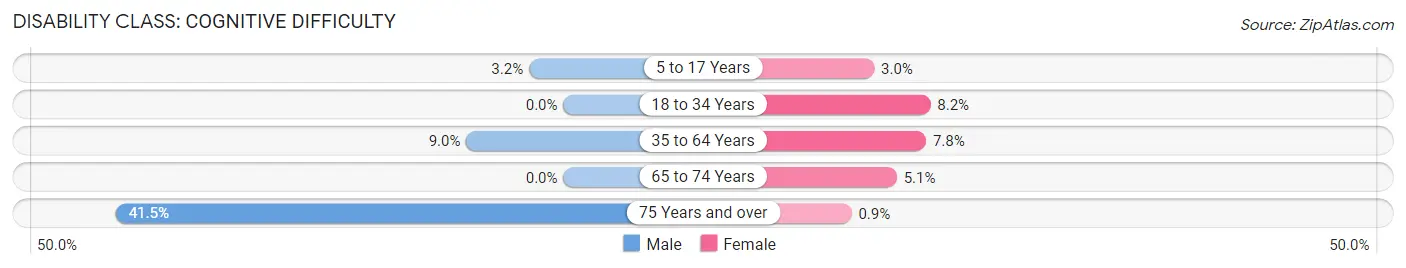
| Age Bracket | Male | Female |
| 5 to 17 Years | 22 (3.2%) | 19 (3.0%) |
| 18 to 34 Years | 0 (0.0%) | 75 (8.2%) |
| 35 to 64 Years | 150 (9.0%) | 114 (7.8%) |
| 65 to 74 Years | 0 (0.0%) | 21 (5.1%) |
| 75 Years and over | 140 (41.5%) | 3 (0.9%) |
Disability Class: Ambulatory Difficulty
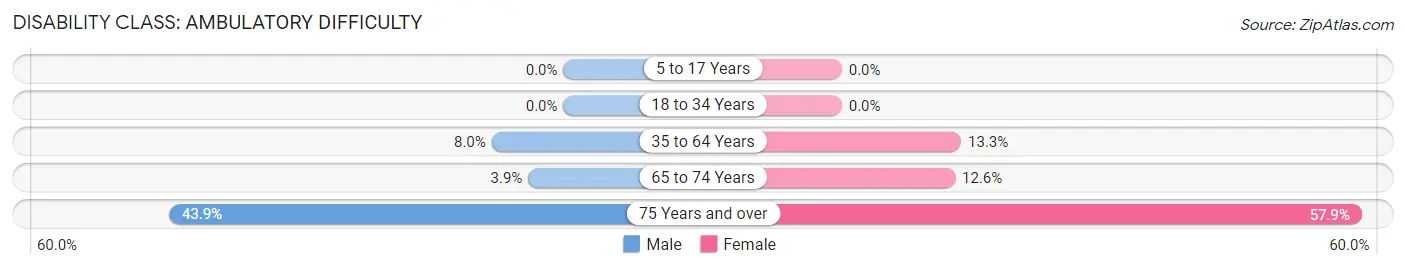
| Age Bracket | Male | Female |
| 5 to 17 Years | 0 (0.0%) | 0 (0.0%) |
| 18 to 34 Years | 0 (0.0%) | 0 (0.0%) |
| 35 to 64 Years | 133 (8.0%) | 194 (13.3%) |
| 65 to 74 Years | 15 (3.9%) | 52 (12.6%) |
| 75 Years and over | 148 (43.9%) | 194 (57.9%) |
Disability Class: Self-Care Difficulty
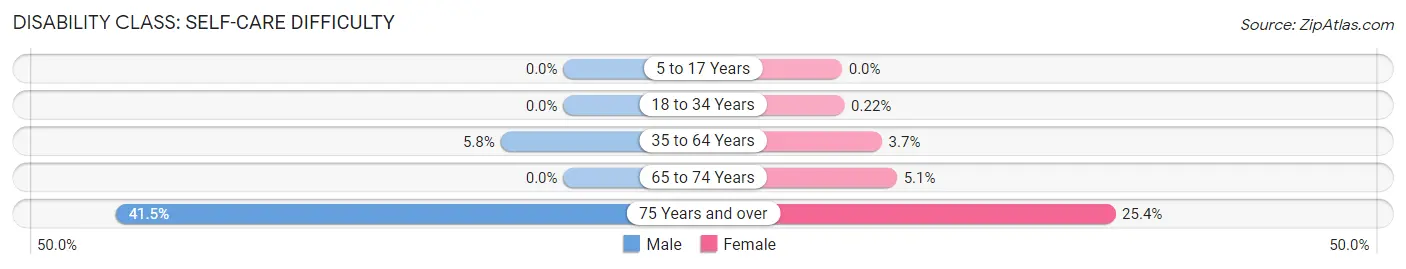
| Age Bracket | Male | Female |
| 5 to 17 Years | 0 (0.0%) | 0 (0.0%) |
| 18 to 34 Years | 0 (0.0%) | 2 (0.2%) |
| 35 to 64 Years | 97 (5.8%) | 54 (3.7%) |
| 65 to 74 Years | 0 (0.0%) | 21 (5.1%) |
| 75 Years and over | 140 (41.5%) | 85 (25.4%) |
Technology Access in Stayton
Computing Device Access in Stayton
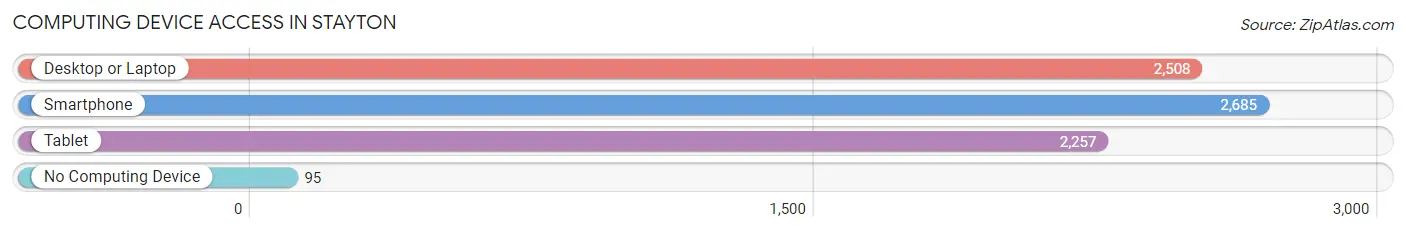
| Device Type | # Households | % Households |
| Desktop or Laptop | 2,508 | 81.0% |
| Smartphone | 2,685 | 86.8% |
| Tablet | 2,257 | 72.9% |
| No Computing Device | 95 | 3.1% |
| Total | 3,095 | 100.0% |
Internet Access in Stayton
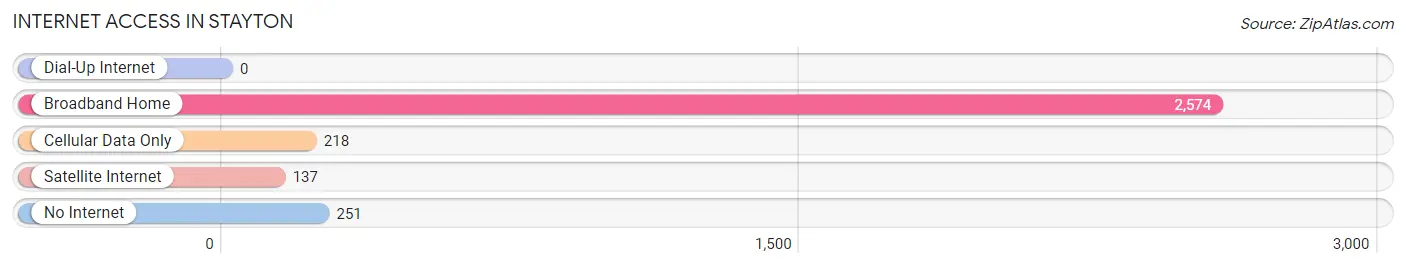
| Internet Type | # Households | % Households |
| Dial-Up Internet | 0 | 0.0% |
| Broadband Home | 2,574 | 83.2% |
| Cellular Data Only | 218 | 7.0% |
| Satellite Internet | 137 | 4.4% |
| No Internet | 251 | 8.1% |
| Total | 3,095 | 100.0% |
Stayton Summary
Situated in the foothills of the Cascade Mountains, the city of Stayton, Oregon is a small, rural community located in Marion County. With a population of 6,845 as of the 2010 census, Stayton is the second largest city in the county, behind the county seat of Salem. The city is located approximately 15 miles east of Salem and is part of the Salem Metropolitan Statistical Area.
History
The area that is now Stayton was originally inhabited by the Kalapuya Native American tribe. The first European settlers arrived in the area in the mid-1800s, and the city was officially incorporated in 1891. The city was named after the Stayton family, who were among the first settlers in the area.
The city was originally a farming and logging community, and the economy was largely based on these industries. In the early 1900s, the city began to grow and develop, and the population increased significantly. The city was also home to several mills, which provided employment for many of the residents.
Geography
Stayton is located in the foothills of the Cascade Mountains, approximately 15 miles east of Salem. The city is situated at an elevation of 545 feet above sea level. The city is located in the Willamette Valley, and the climate is generally mild and temperate.
The city covers an area of 4.2 square miles, and is bordered by the cities of Sublimity to the north, Aumsville to the east, and Turner to the south. The city is also located near several rivers, including the Santiam River, the North Santiam River, and the South Santiam River.
Economy
The economy of Stayton is largely based on agriculture and manufacturing. The city is home to several large agricultural operations, including dairy farms, fruit orchards, and vegetable farms. The city is also home to several manufacturing companies, including a paper mill, a wood products plant, and a metal fabrication plant.
The city is also home to several retail stores, restaurants, and other businesses. The city is served by the Stayton-Sublimity School District, which provides educational services to the city's students.
Demographics
As of the 2010 census, the population of Stayton was 6,845. The racial makeup of the city was 90.2% White, 0.7% African American, 0.7% Native American, 0.9% Asian, 0.1% Pacific Islander, 4.3% from other races, and 3.1% from two or more races. Hispanic or Latino of any race were 8.2% of the population.
The median household income in Stayton was $45,945, and the median family income was $51,945. The per capita income for the city was $20,945. About 11.2% of the population was below the poverty line.
Stayton is a small, rural community with a strong agricultural and manufacturing base. The city is home to several large agricultural operations, manufacturing companies, and other businesses. The city is served by the Stayton-Sublimity School District, which provides educational services to the city's students. The population of Stayton is diverse, and the city is a great place to live and work.
Common Questions
What is Per Capita Income in Stayton?
Per Capita income in Stayton is $36,926.
What is the Median Family Income in Stayton?
Median Family Income in Stayton is $82,895.
What is the Median Household income in Stayton?
Median Household Income in Stayton is $72,639.
What is Income or Wage Gap in Stayton?
Income or Wage Gap in Stayton is 43.3%.
Women in Stayton earn 56.7 cents for every dollar earned by a man.
What is Inequality or Gini Index in Stayton?
Inequality or Gini Index in Stayton is 0.50.
What is the Total Population of Stayton?
Total Population of Stayton is 8,210.
What is the Total Male Population of Stayton?
Total Male Population of Stayton is 4,027.
What is the Total Female Population of Stayton?
Total Female Population of Stayton is 4,183.
What is the Ratio of Males per 100 Females in Stayton?
There are 96.27 Males per 100 Females in Stayton.
What is the Ratio of Females per 100 Males in Stayton?
There are 103.87 Females per 100 Males in Stayton.
What is the Median Population Age in Stayton?
Median Population Age in Stayton is 38.4 Years.
What is the Average Family Size in Stayton
Average Family Size in Stayton is 3.1 People.
What is the Average Household Size in Stayton
Average Household Size in Stayton is 2.6 People.
How Large is the Labor Force in Stayton?
There are 3,904 People in the Labor Forcein in Stayton.
What is the Percentage of People in the Labor Force in Stayton?
62.9% of People are in the Labor Force in Stayton.
What is the Unemployment Rate in Stayton?
Unemployment Rate in Stayton is 4.8%.