Cannon Beach, OR Map & Demographics
Cannon Beach Map
Cannon Beach Overview
$50,204
PER CAPITA INCOME
$110,893
AVG FAMILY INCOME
$63,509
AVG HOUSEHOLD INCOME
0.50
INEQUALITY / GINI INDEX
1,271
TOTAL POPULATION
565
MALE POPULATION
706
FEMALE POPULATION
80.03
MALES / 100 FEMALES
124.96
FEMALES / 100 MALES
55.0
MEDIAN AGE
2.9
AVG FAMILY SIZE
1.7
AVG HOUSEHOLD SIZE
717
LABOR FORCE [ PEOPLE ]
64.4%
PERCENT IN LABOR FORCE
1.7%
UNEMPLOYMENT RATE
Cannon Beach Zip Codes
Cannon Beach Area Codes
Income in Cannon Beach
Income Overview in Cannon Beach
Per Capita Income in Cannon Beach is $50,204, while median incomes of families and households are $110,893 and $63,509 respectively.
| Characteristic | Number | Measure |
| Per Capita Income | 1,271 | $50,204 |
| Median Family Income | 251 | $110,893 |
| Mean Family Income | 251 | $163,344 |
| Median Household Income | 677 | $63,509 |
| Mean Household Income | 677 | $93,760 |
| Income Deficit | 251 | $0 |
| Wage / Income Gap (%) | 1,271 | 0.00% |
| Wage / Income Gap ($) | 1,271 | 100.00¢ per $1 |
| Gini / Inequality Index | 1,271 | 0.50 |
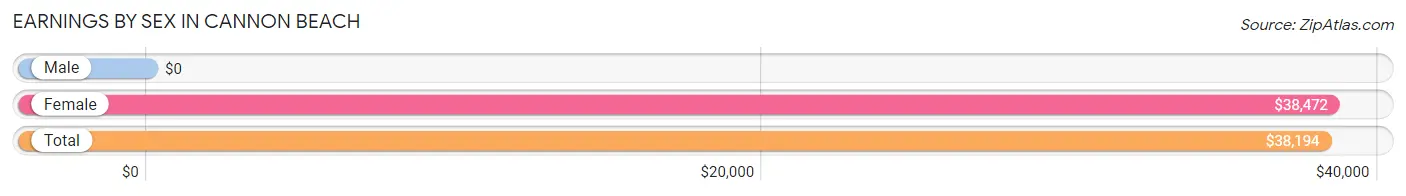
Earnings by Sex in Cannon Beach
| Sex | Number | Average Earnings |
| Male | 312 (39.3%) | $0 |
| Female | 482 (60.7%) | $38,472 |
| Total | 794 (100.0%) | $38,194 |
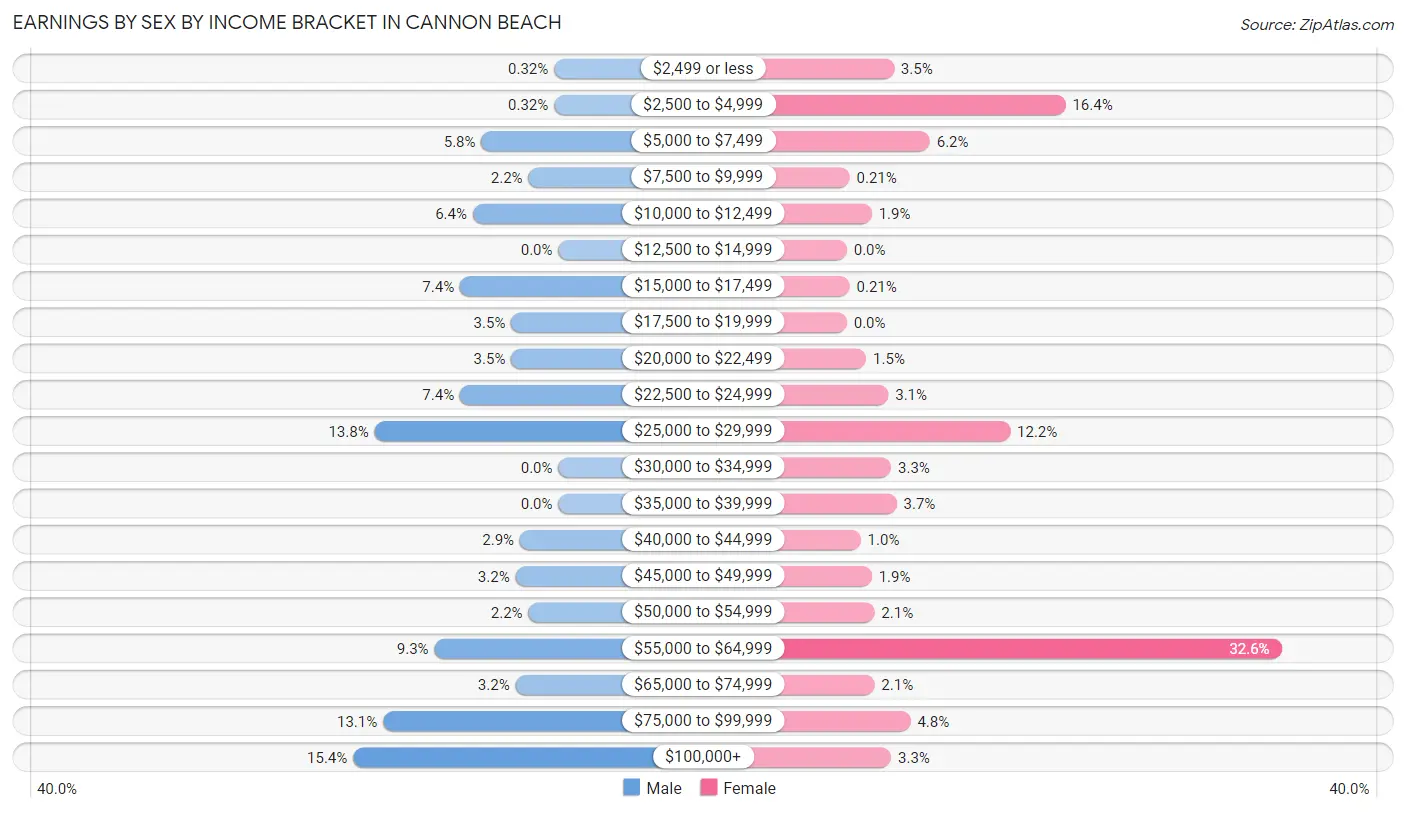
Earnings by Sex by Income Bracket in Cannon Beach
The most common earnings brackets in Cannon Beach are $100,000+ for men (48 | 15.4%) and $55,000 to $64,999 for women (157 | 32.6%).
| Income | Male | Female |
| $2,499 or less | 1 (0.3%) | 17 (3.5%) |
| $2,500 to $4,999 | 1 (0.3%) | 79 (16.4%) |
| $5,000 to $7,499 | 18 (5.8%) | 30 (6.2%) |
| $7,500 to $9,999 | 7 (2.2%) | 1 (0.2%) |
| $10,000 to $12,499 | 20 (6.4%) | 9 (1.9%) |
| $12,500 to $14,999 | 0 (0.0%) | 0 (0.0%) |
| $15,000 to $17,499 | 23 (7.4%) | 1 (0.2%) |
| $17,500 to $19,999 | 11 (3.5%) | 0 (0.0%) |
| $20,000 to $22,499 | 11 (3.5%) | 7 (1.5%) |
| $22,500 to $24,999 | 23 (7.4%) | 15 (3.1%) |
| $25,000 to $29,999 | 43 (13.8%) | 59 (12.2%) |
| $30,000 to $34,999 | 0 (0.0%) | 16 (3.3%) |
| $35,000 to $39,999 | 0 (0.0%) | 18 (3.7%) |
| $40,000 to $44,999 | 9 (2.9%) | 5 (1.0%) |
| $45,000 to $49,999 | 10 (3.2%) | 9 (1.9%) |
| $50,000 to $54,999 | 7 (2.2%) | 10 (2.1%) |
| $55,000 to $64,999 | 29 (9.3%) | 157 (32.6%) |
| $65,000 to $74,999 | 10 (3.2%) | 10 (2.1%) |
| $75,000 to $99,999 | 41 (13.1%) | 23 (4.8%) |
| $100,000+ | 48 (15.4%) | 16 (3.3%) |
| Total | 312 (100.0%) | 482 (100.0%) |
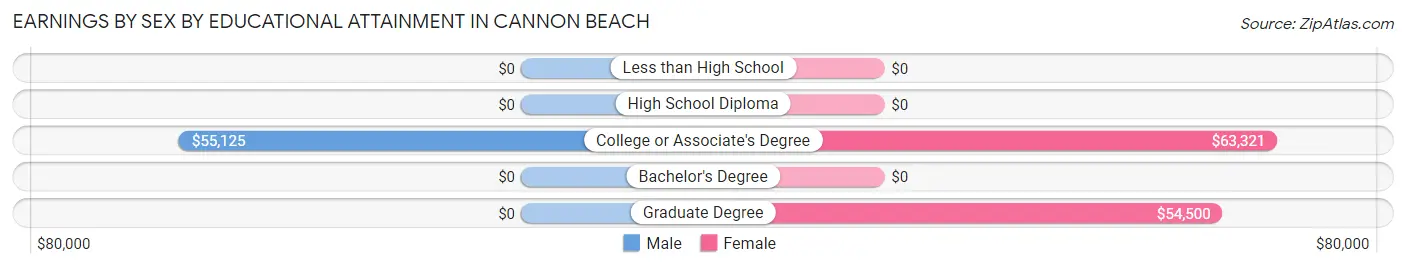
Earnings by Sex by Educational Attainment in Cannon Beach
Average earnings in Cannon Beach are $47,750 for men and $59,674 for women, a difference of 20.0%. Men with an educational attainment of college or associate's degree enjoy the highest average annual earnings of $55,125, while those with college or associate's degree education earn the least with $55,125. Women with an educational attainment of college or associate's degree earn the most with the average annual earnings of $63,321, while those with graduate degree education have the smallest earnings of $54,500.
| Educational Attainment | Male Income | Female Income |
| Less than High School | - | - |
| High School Diploma | - | - |
| College or Associate's Degree | $55,125 | $63,321 |
| Bachelor's Degree | - | - |
| Graduate Degree | - | - |
| Total | $47,750 | $59,674 |
Family Income in Cannon Beach
Family Income Brackets in Cannon Beach
According to the Cannon Beach family income data, there are 91 families falling into the $100,000 to $149,999 income range, which is the most common income bracket and makes up 36.2% of all families.
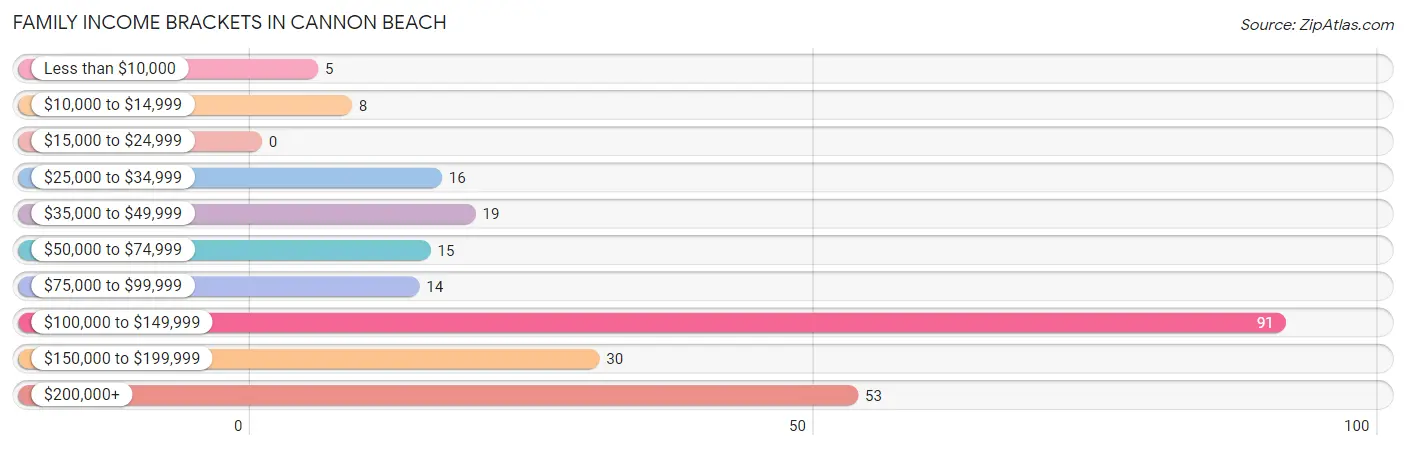
| Income Bracket | # Families | % Families |
| Less than $10,000 | 5 | 2.0% |
| $10,000 to $14,999 | 8 | 3.2% |
| $15,000 to $24,999 | 0 | 0.0% |
| $25,000 to $34,999 | 16 | 6.4% |
| $35,000 to $49,999 | 19 | 7.6% |
| $50,000 to $74,999 | 15 | 6.0% |
| $75,000 to $99,999 | 14 | 5.6% |
| $100,000 to $149,999 | 91 | 36.3% |
| $150,000 to $199,999 | 30 | 12.0% |
| $200,000+ | 53 | 21.1% |
Family Income by Famaliy Size in Cannon Beach
4-person families (28 | 11.2%) account for the highest median family income in Cannon Beach with $140,750 per family, while 2-person families (180 | 71.7%) have the highest median income of $54,844 per family member.
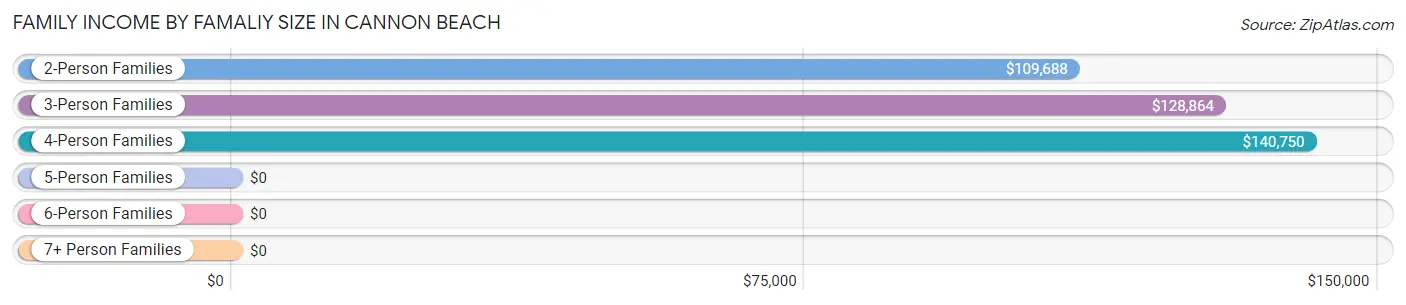
| Income Bracket | # Families | Median Income |
| 2-Person Families | 180 (71.7%) | $109,688 |
| 3-Person Families | 32 (12.8%) | $128,864 |
| 4-Person Families | 28 (11.2%) | $140,750 |
| 5-Person Families | 11 (4.4%) | $0 |
| 6-Person Families | 0 (0.0%) | $0 |
| 7+ Person Families | 0 (0.0%) | $0 |
| Total | 251 (100.0%) | $110,893 |
Family Income by Number of Earners in Cannon Beach
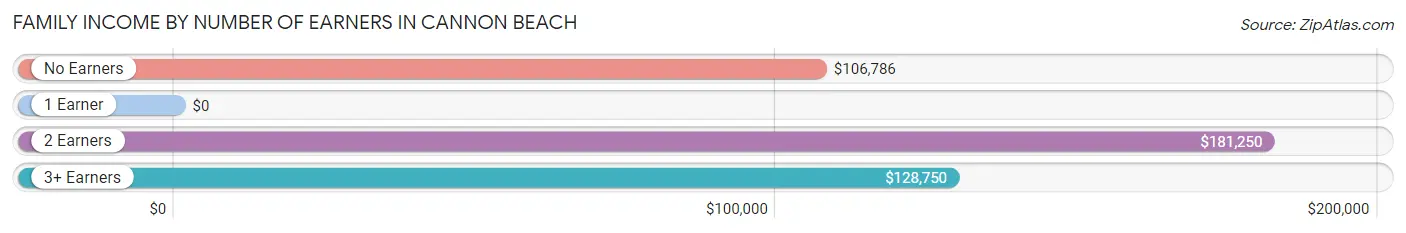
| Number of Earners | # Families | Median Income |
| No Earners | 58 (23.1%) | $106,786 |
| 1 Earner | 54 (21.5%) | $0 |
| 2 Earners | 106 (42.2%) | $181,250 |
| 3+ Earners | 33 (13.2%) | $128,750 |
| Total | 251 (100.0%) | $110,893 |
Household Income in Cannon Beach
Household Income Brackets in Cannon Beach
With 201 households falling in the category, the $50,000 to $74,999 income range is the most frequent in Cannon Beach, accounting for 29.7% of all households. In contrast, only 16 households (2.4%) fall into the $10,000 to $14,999 income bracket, making it the least populous group.
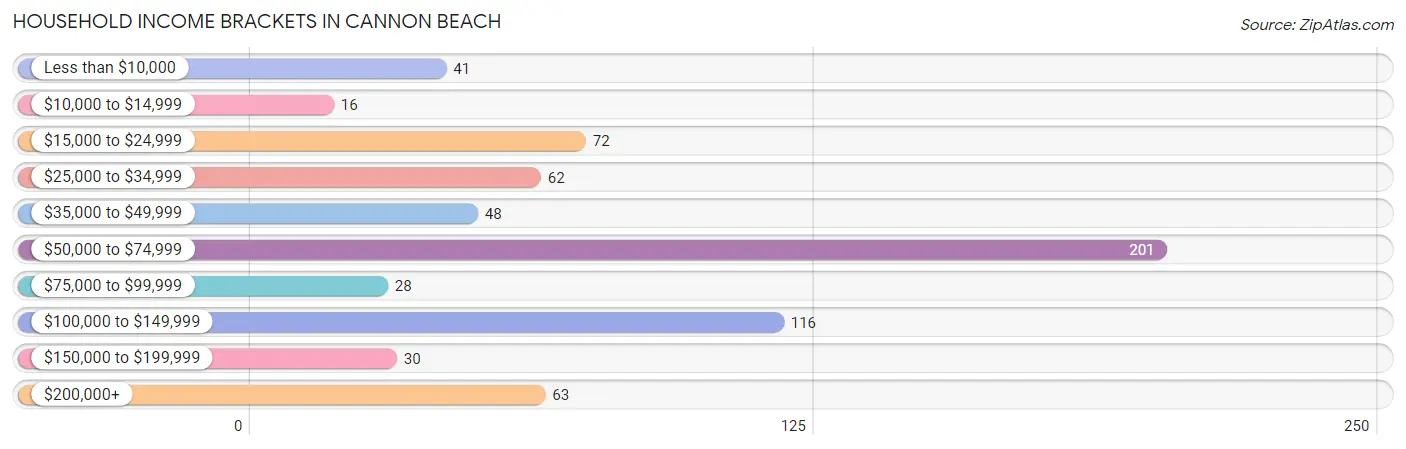
| Income Bracket | # Households | % Households |
| Less than $10,000 | 41 | 6.1% |
| $10,000 to $14,999 | 16 | 2.4% |
| $15,000 to $24,999 | 72 | 10.6% |
| $25,000 to $34,999 | 62 | 9.2% |
| $35,000 to $49,999 | 48 | 7.1% |
| $50,000 to $74,999 | 201 | 29.7% |
| $75,000 to $99,999 | 28 | 4.1% |
| $100,000 to $149,999 | 116 | 17.1% |
| $150,000 to $199,999 | 30 | 4.4% |
| $200,000+ | 63 | 9.3% |
Household Income by Householder Age in Cannon Beach
The median household income in Cannon Beach is $63,509, with the highest median household income of $82,083 found in the 65+ years age bracket for the primary householder. A total of 231 households (34.1%) fall into this category.
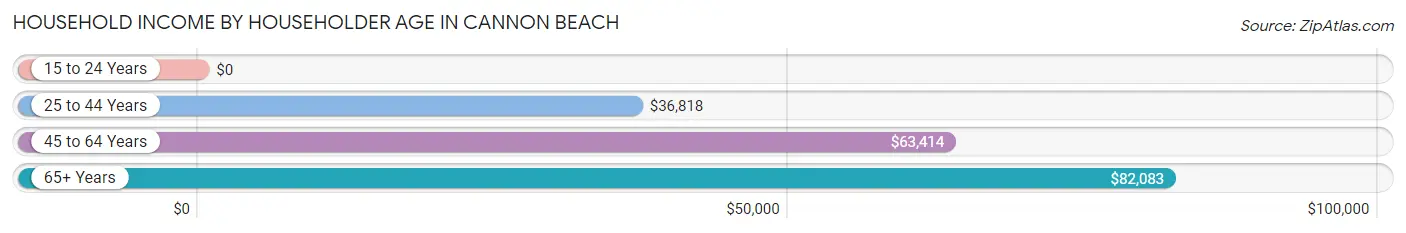
| Income Bracket | # Households | Median Income |
| 15 to 24 Years | 0 (0.0%) | $0 |
| 25 to 44 Years | 92 (13.6%) | $36,818 |
| 45 to 64 Years | 354 (52.3%) | $63,414 |
| 65+ Years | 231 (34.1%) | $82,083 |
| Total | 677 (100.0%) | $63,509 |
Poverty in Cannon Beach
Income Below Poverty by Sex and Age in Cannon Beach
With 5.9% poverty level for males and 10.1% for females among the residents of Cannon Beach, under 5 year old males and 18 to 24 year old females are the most vulnerable to poverty, with 7 males (12.7%) and 13 females (22.8%) in their respective age groups living below the poverty level.
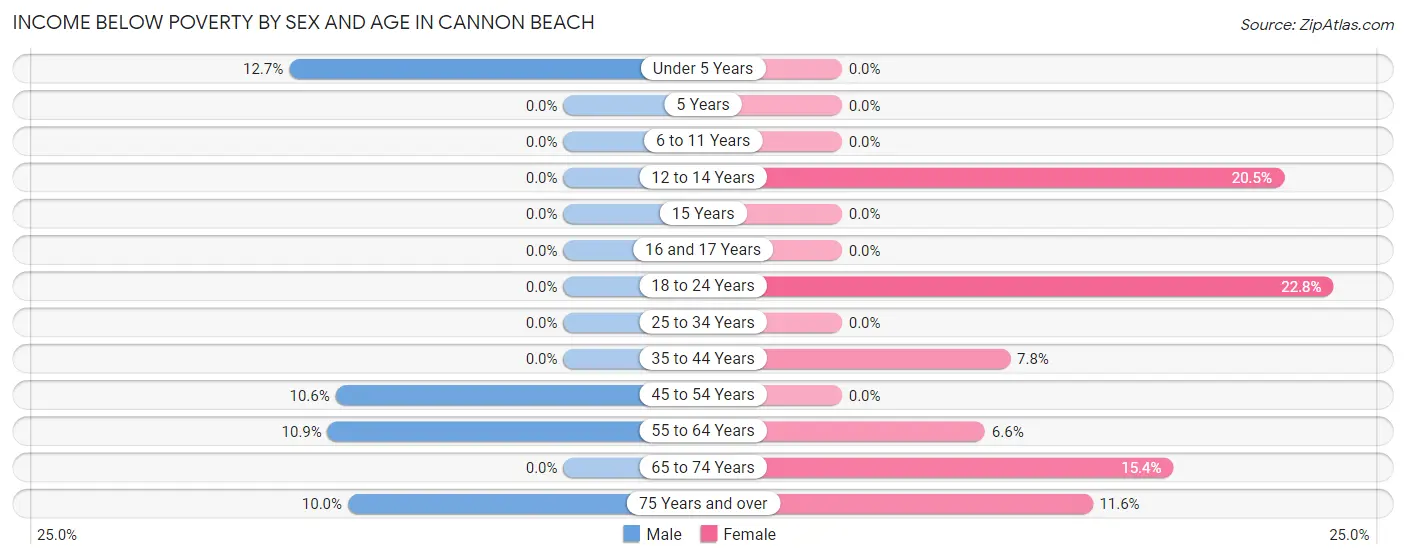
| Age Bracket | Male | Female |
| Under 5 Years | 7 (12.7%) | 0 (0.0%) |
| 5 Years | 0 (0.0%) | 0 (0.0%) |
| 6 to 11 Years | 0 (0.0%) | 0 (0.0%) |
| 12 to 14 Years | 0 (0.0%) | 8 (20.5%) |
| 15 Years | 0 (0.0%) | 0 (0.0%) |
| 16 and 17 Years | 0 (0.0%) | 0 (0.0%) |
| 18 to 24 Years | 0 (0.0%) | 13 (22.8%) |
| 25 to 34 Years | 0 (0.0%) | 0 (0.0%) |
| 35 to 44 Years | 0 (0.0%) | 5 (7.8%) |
| 45 to 54 Years | 13 (10.6%) | 0 (0.0%) |
| 55 to 64 Years | 7 (10.9%) | 15 (6.6%) |
| 65 to 74 Years | 0 (0.0%) | 14 (15.4%) |
| 75 Years and over | 6 (10.0%) | 10 (11.6%) |
| Total | 33 (5.9%) | 65 (10.1%) |
Income Above Poverty by Sex and Age in Cannon Beach
According to the poverty statistics in Cannon Beach, males aged 6 to 11 years and females aged under 5 years are the age groups that are most secure financially, with 100.0% of males and 100.0% of females in these age groups living above the poverty line.
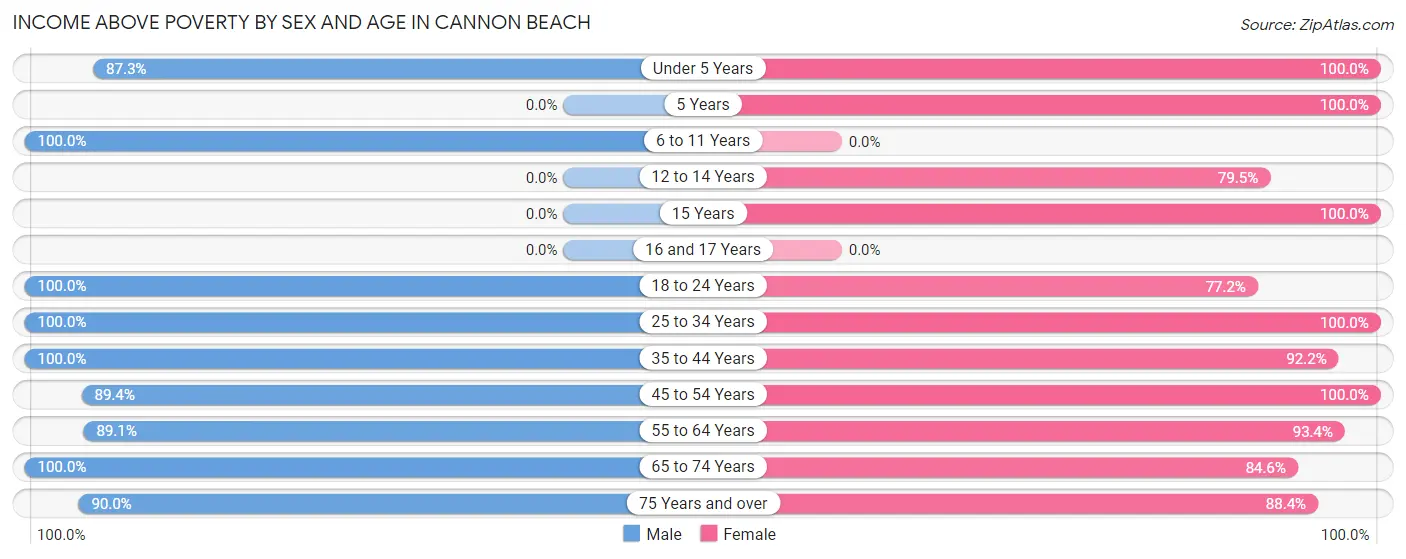
| Age Bracket | Male | Female |
| Under 5 Years | 48 (87.3%) | 7 (100.0%) |
| 5 Years | 0 (0.0%) | 6 (100.0%) |
| 6 to 11 Years | 43 (100.0%) | 0 (0.0%) |
| 12 to 14 Years | 0 (0.0%) | 31 (79.5%) |
| 15 Years | 0 (0.0%) | 7 (100.0%) |
| 16 and 17 Years | 0 (0.0%) | 0 (0.0%) |
| 18 to 24 Years | 22 (100.0%) | 44 (77.2%) |
| 25 to 34 Years | 57 (100.0%) | 29 (100.0%) |
| 35 to 44 Years | 32 (100.0%) | 59 (92.2%) |
| 45 to 54 Years | 110 (89.4%) | 32 (100.0%) |
| 55 to 64 Years | 57 (89.1%) | 211 (93.4%) |
| 65 to 74 Years | 107 (100.0%) | 77 (84.6%) |
| 75 Years and over | 54 (90.0%) | 76 (88.4%) |
| Total | 530 (94.1%) | 579 (89.9%) |
Income Below Poverty Among Married-Couple Families in Cannon Beach
The poverty statistics for married-couple families in Cannon Beach show that 2.3% or 5 of the total 215 families live below the poverty line. Families with 1 or 2 children have the highest poverty rate of 10.2%, comprising of 5 families. On the other hand, families with no children have the lowest poverty rate of 0.0%, which includes 0 families.
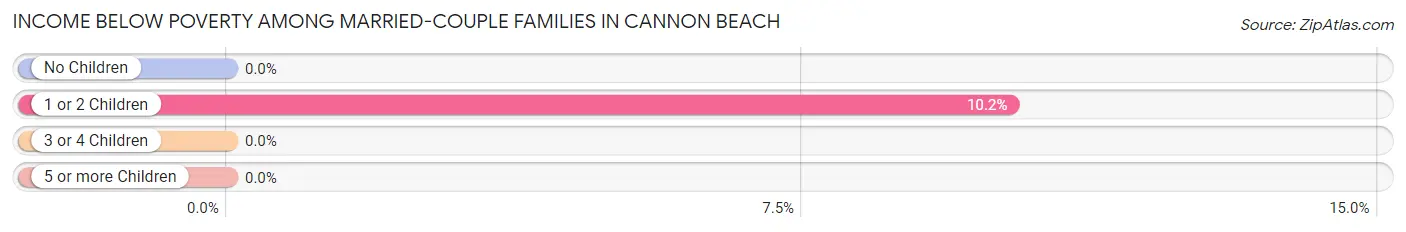
| Children | Above Poverty | Below Poverty |
| No Children | 166 (100.0%) | 0 (0.0%) |
| 1 or 2 Children | 44 (89.8%) | 5 (10.2%) |
| 3 or 4 Children | 0 (0.0%) | 0 (0.0%) |
| 5 or more Children | 0 (0.0%) | 0 (0.0%) |
| Total | 210 (97.7%) | 5 (2.3%) |
Income Below Poverty Among Single-Parent Households in Cannon Beach
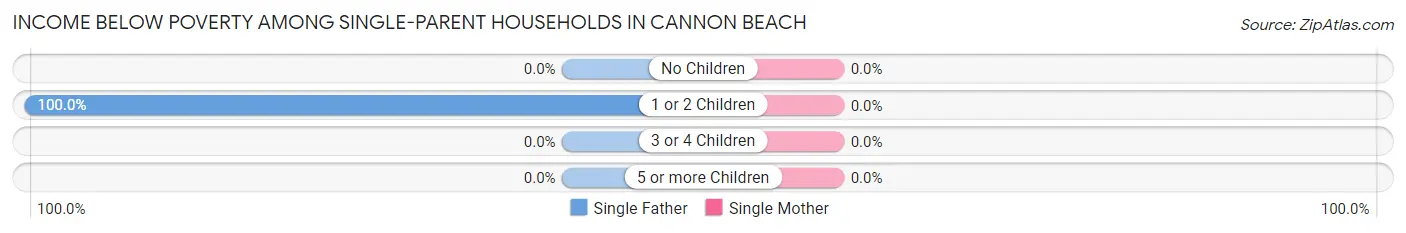
| Children | Single Father | Single Mother |
| No Children | 0 (0.0%) | 0 (0.0%) |
| 1 or 2 Children | 8 (100.0%) | 0 (0.0%) |
| 3 or 4 Children | 0 (0.0%) | 0 (0.0%) |
| 5 or more Children | 0 (0.0%) | 0 (0.0%) |
| Total | 8 (42.1%) | 0 (0.0%) |
Income Below Poverty Among Married-Couple vs Single-Parent Households in Cannon Beach
The poverty data for Cannon Beach shows that 5 of the married-couple family households (2.3%) and 8 of the single-parent households (22.2%) are living below the poverty level. Within the married-couple family households, those with 1 or 2 children have the highest poverty rate, with 5 households (10.2%) falling below the poverty line. Among the single-parent households, those with 1 or 2 children have the highest poverty rate, with 8 household (47.1%) living below poverty.
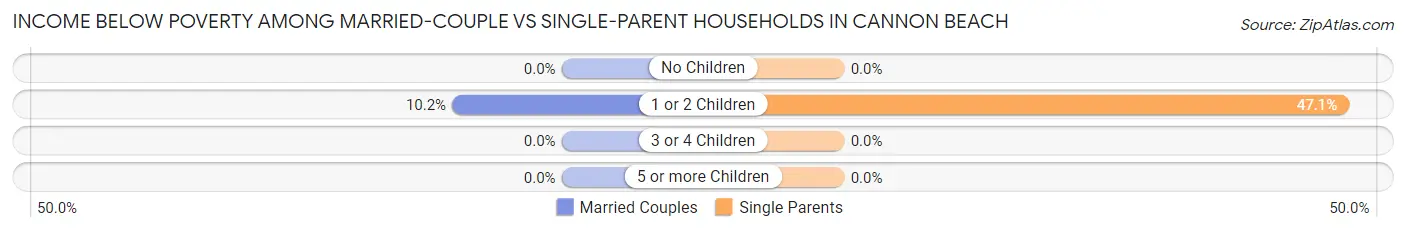
| Children | Married-Couple Families | Single-Parent Households |
| No Children | 0 (0.0%) | 0 (0.0%) |
| 1 or 2 Children | 5 (10.2%) | 8 (47.1%) |
| 3 or 4 Children | 0 (0.0%) | 0 (0.0%) |
| 5 or more Children | 0 (0.0%) | 0 (0.0%) |
| Total | 5 (2.3%) | 8 (22.2%) |
Race in Cannon Beach
The most populous races in Cannon Beach are White / Caucasian (806 | 63.4%), Hispanic or Latino (387 | 30.4%), and Two or more Races (311 | 24.5%).
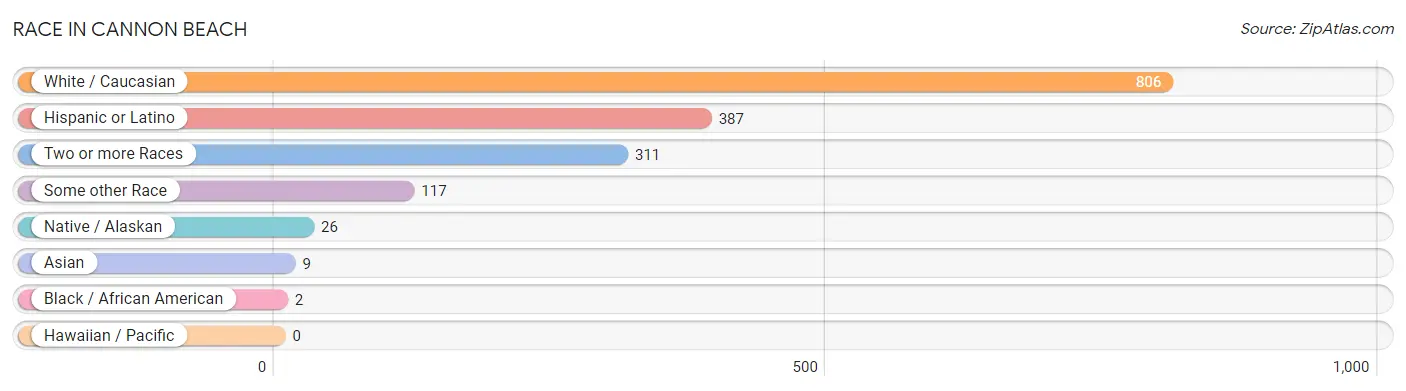
| Race | # Population | % Population |
| Asian | 9 | 0.7% |
| Black / African American | 2 | 0.2% |
| Hawaiian / Pacific | 0 | 0.0% |
| Hispanic or Latino | 387 | 30.4% |
| Native / Alaskan | 26 | 2.1% |
| White / Caucasian | 806 | 63.4% |
| Two or more Races | 311 | 24.5% |
| Some other Race | 117 | 9.2% |
| Total | 1,271 | 100.0% |
Ancestry in Cannon Beach
The most populous ancestries reported in Cannon Beach are German (343 | 27.0%), Mexican (311 | 24.5%), English (256 | 20.1%), Irish (166 | 13.1%), and Scottish (111 | 8.7%), together accounting for 93.4% of all Cannon Beach residents.
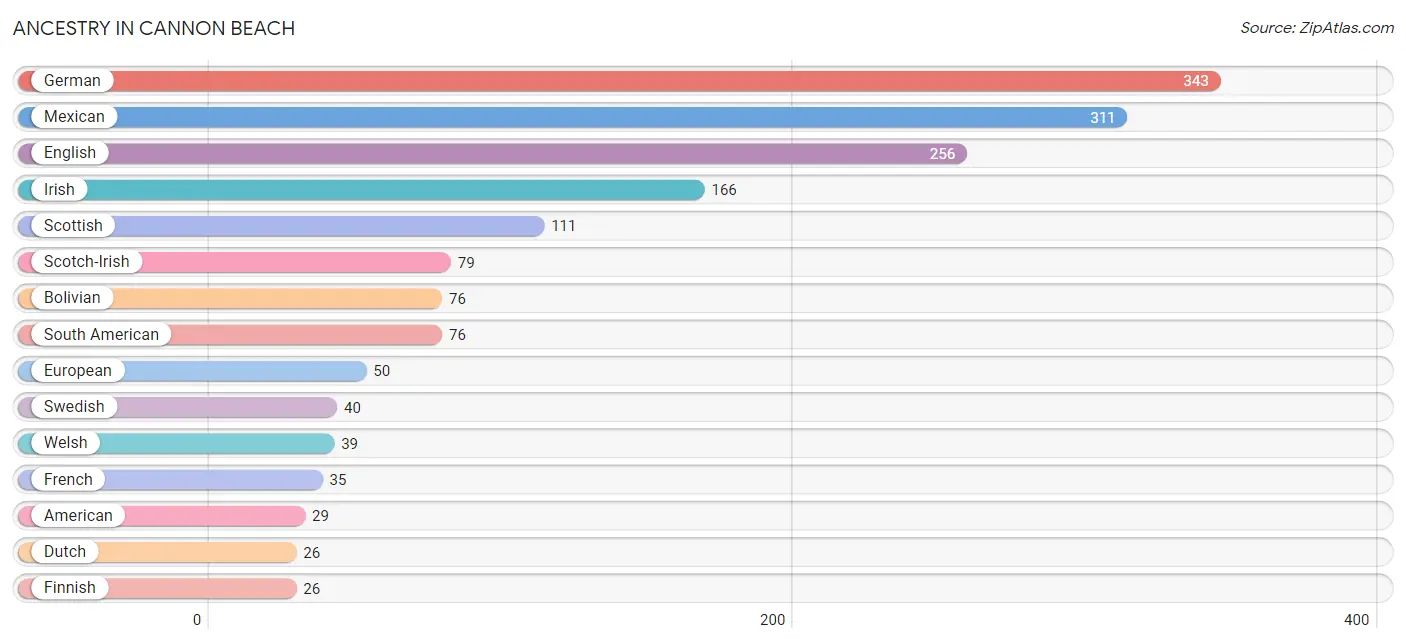
| Ancestry | # Population | % Population |
| African | 2 | 0.2% |
| American | 29 | 2.3% |
| Arab | 5 | 0.4% |
| Austrian | 7 | 0.5% |
| Bhutanese | 8 | 0.6% |
| Blackfeet | 15 | 1.2% |
| Bolivian | 76 | 6.0% |
| British | 7 | 0.5% |
| Burmese | 13 | 1.0% |
| Croatian | 11 | 0.9% |
| Danish | 24 | 1.9% |
| Dutch | 26 | 2.1% |
| English | 256 | 20.1% |
| European | 50 | 3.9% |
| Finnish | 26 | 2.1% |
| French | 35 | 2.8% |
| German | 343 | 27.0% |
| Indian (Asian) | 1 | 0.1% |
| Irish | 166 | 13.1% |
| Italian | 17 | 1.3% |
| Korean | 1 | 0.1% |
| Lebanese | 5 | 0.4% |
| Mexican | 311 | 24.5% |
| Norwegian | 14 | 1.1% |
| Portuguese | 8 | 0.6% |
| Russian | 17 | 1.3% |
| Scotch-Irish | 79 | 6.2% |
| Scottish | 111 | 8.7% |
| Sioux | 25 | 2.0% |
| South American | 76 | 6.0% |
| Subsaharan African | 2 | 0.2% |
| Swedish | 40 | 3.2% |
| Welsh | 39 | 3.1% | View All 33 Rows |
Immigrants in Cannon Beach
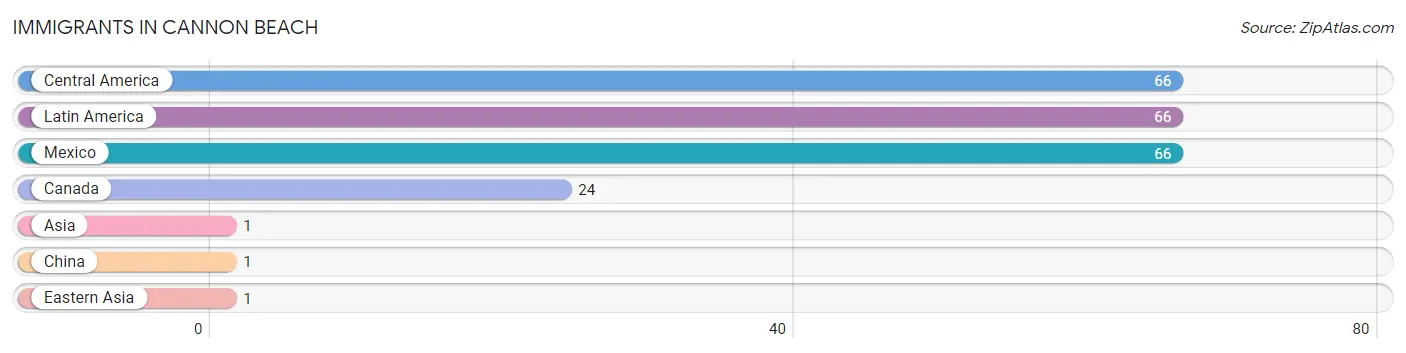
The most numerous immigrant groups reported in Cannon Beach came from Central America (66 | 5.2%), Latin America (66 | 5.2%), Mexico (66 | 5.2%), Canada (24 | 1.9%), and Asia (1 | 0.1%), together accounting for 17.5% of all Cannon Beach residents.
| Immigration Origin | # Population | % Population |
| Asia | 1 | 0.1% |
| Canada | 24 | 1.9% |
| Central America | 66 | 5.2% |
| China | 1 | 0.1% |
| Eastern Asia | 1 | 0.1% |
| Latin America | 66 | 5.2% |
| Mexico | 66 | 5.2% | View All 7 Rows |
Sex and Age in Cannon Beach
Sex and Age in Cannon Beach
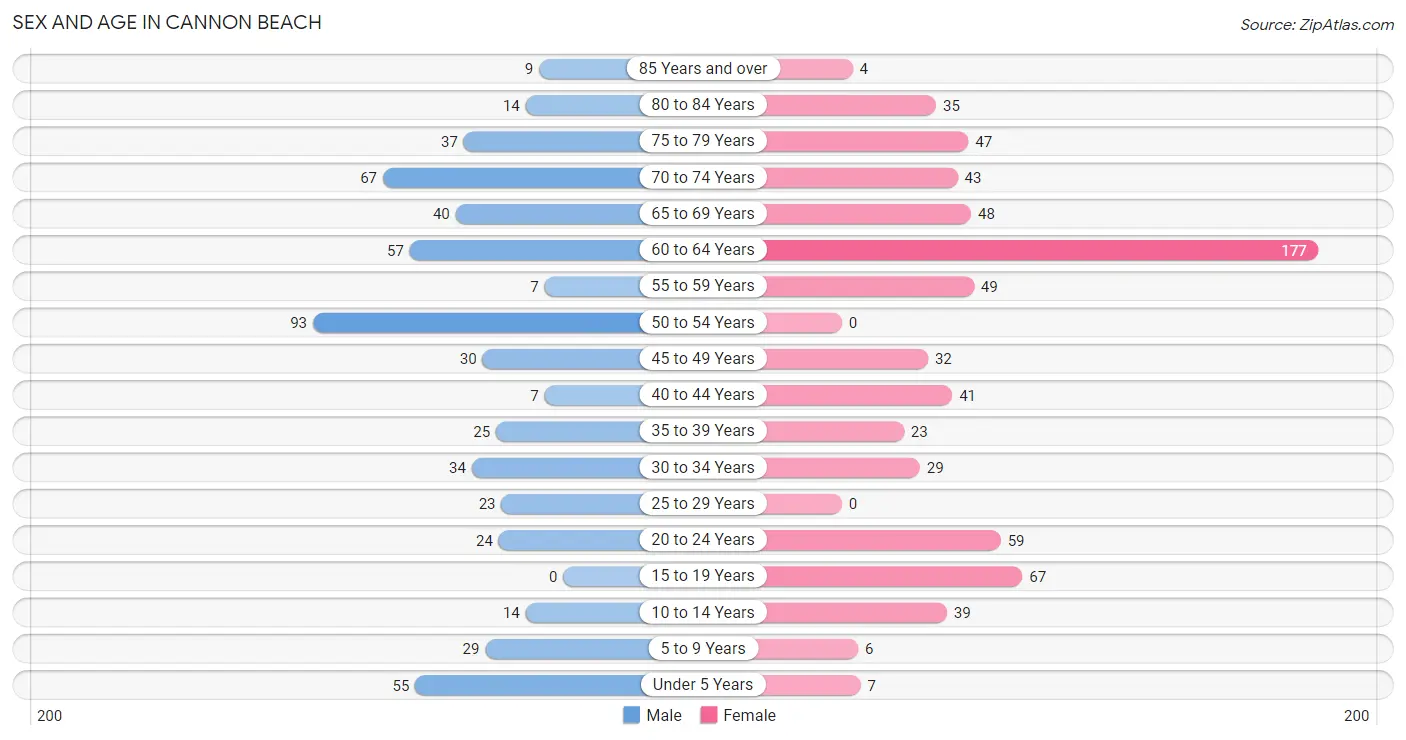
The most populous age groups in Cannon Beach are 50 to 54 Years (93 | 16.5%) for men and 60 to 64 Years (177 | 25.1%) for women.
| Age Bracket | Male | Female |
| Under 5 Years | 55 (9.7%) | 7 (1.0%) |
| 5 to 9 Years | 29 (5.1%) | 6 (0.9%) |
| 10 to 14 Years | 14 (2.5%) | 39 (5.5%) |
| 15 to 19 Years | 0 (0.0%) | 67 (9.5%) |
| 20 to 24 Years | 24 (4.3%) | 59 (8.4%) |
| 25 to 29 Years | 23 (4.1%) | 0 (0.0%) |
| 30 to 34 Years | 34 (6.0%) | 29 (4.1%) |
| 35 to 39 Years | 25 (4.4%) | 23 (3.3%) |
| 40 to 44 Years | 7 (1.2%) | 41 (5.8%) |
| 45 to 49 Years | 30 (5.3%) | 32 (4.5%) |
| 50 to 54 Years | 93 (16.5%) | 0 (0.0%) |
| 55 to 59 Years | 7 (1.2%) | 49 (6.9%) |
| 60 to 64 Years | 57 (10.1%) | 177 (25.1%) |
| 65 to 69 Years | 40 (7.1%) | 48 (6.8%) |
| 70 to 74 Years | 67 (11.9%) | 43 (6.1%) |
| 75 to 79 Years | 37 (6.6%) | 47 (6.7%) |
| 80 to 84 Years | 14 (2.5%) | 35 (5.0%) |
| 85 Years and over | 9 (1.6%) | 4 (0.6%) |
| Total | 565 (100.0%) | 706 (100.0%) |
Families and Households in Cannon Beach
Median Family Size in Cannon Beach
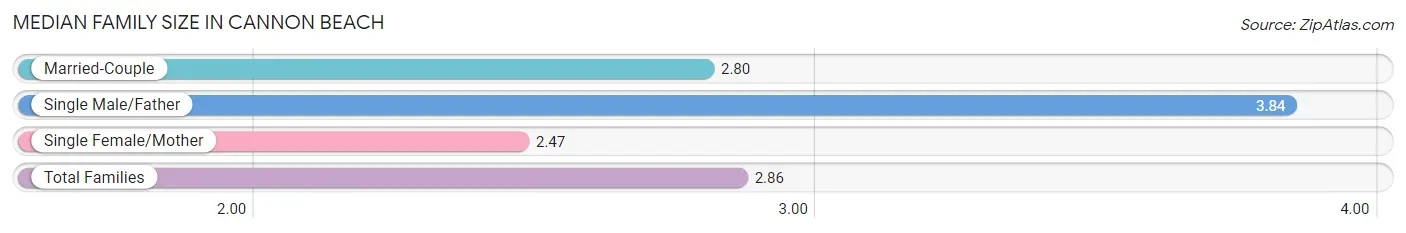
The median family size in Cannon Beach is 2.86 persons per family, with single male/father families (19 | 7.6%) accounting for the largest median family size of 3.84 persons per family. On the other hand, single female/mother families (17 | 6.8%) represent the smallest median family size with 2.47 persons per family.
| Family Type | # Families | Family Size |
| Married-Couple | 215 (85.7%) | 2.80 |
| Single Male/Father | 19 (7.6%) | 3.84 |
| Single Female/Mother | 17 (6.8%) | 2.47 |
| Total Families | 251 (100.0%) | 2.86 |
Median Household Size in Cannon Beach
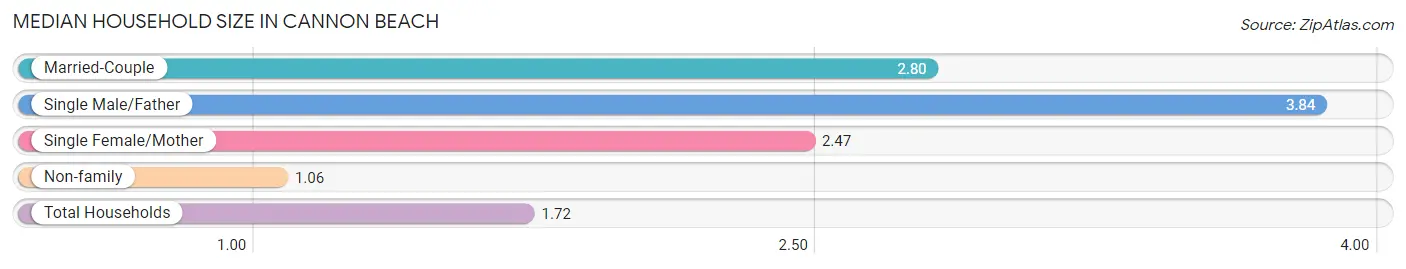
The median household size in Cannon Beach is 1.72 persons per household, with single male/father households (19 | 2.8%) accounting for the largest median household size of 3.84 persons per household. non-family households (426 | 62.9%) represent the smallest median household size with 1.06 persons per household.
| Household Type | # Households | Household Size |
| Married-Couple | 215 (31.8%) | 2.80 |
| Single Male/Father | 19 (2.8%) | 3.84 |
| Single Female/Mother | 17 (2.5%) | 2.47 |
| Non-family | 426 (62.9%) | 1.06 |
| Total Households | 677 (100.0%) | 1.72 |
Household Size by Marriage Status in Cannon Beach
Out of a total of 677 households in Cannon Beach, 251 (37.1%) are family households, while 426 (62.9%) are nonfamily households. The most numerous type of family households are 2-person households, comprising 180, and the most common type of nonfamily households are 1-person households, comprising 407.
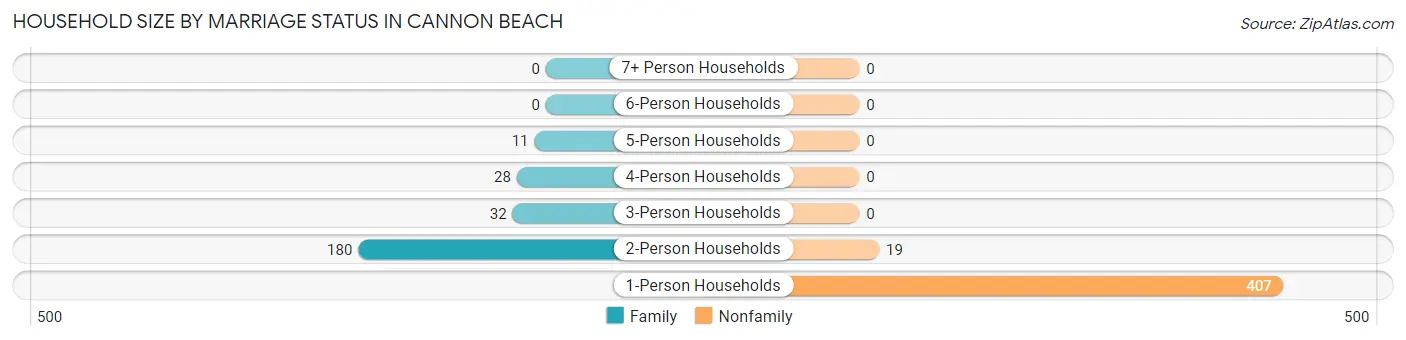
| Household Size | Family Households | Nonfamily Households |
| 1-Person Households | - | 407 (60.1%) |
| 2-Person Households | 180 (26.6%) | 19 (2.8%) |
| 3-Person Households | 32 (4.7%) | 0 (0.0%) |
| 4-Person Households | 28 (4.1%) | 0 (0.0%) |
| 5-Person Households | 11 (1.6%) | 0 (0.0%) |
| 6-Person Households | 0 (0.0%) | 0 (0.0%) |
| 7+ Person Households | 0 (0.0%) | 0 (0.0%) |
| Total | 251 (37.1%) | 426 (62.9%) |
Female Fertility in Cannon Beach
Fertility by Age in Cannon Beach
Average fertility rate in Cannon Beach is 48.0 births per 1,000 women. Women in the age bracket of 20 to 34 years have the highest fertility rate with 80.0 births per 1,000 women. Women in the age bracket of 20 to 34 years acount for 58.3% of all women with births.
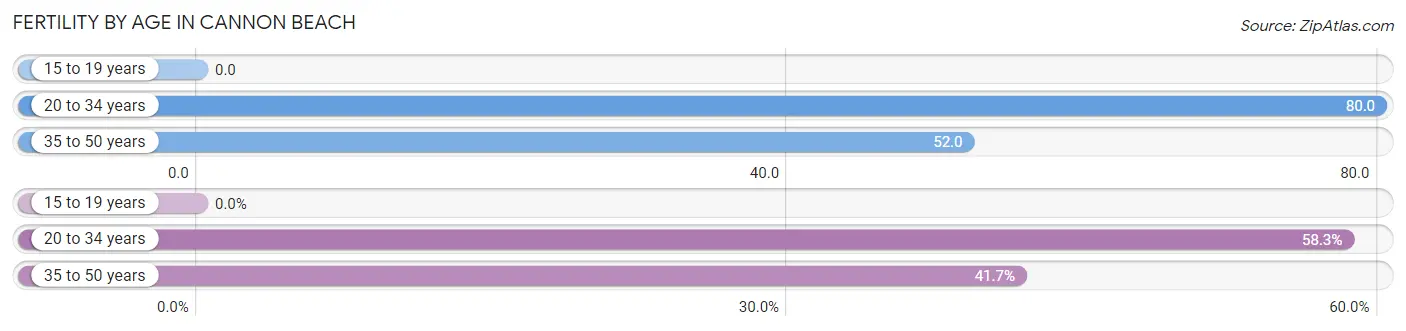
| Age Bracket | Women with Births | Births / 1,000 Women |
| 15 to 19 years | 0 (0.0%) | 0.0 |
| 20 to 34 years | 7 (58.3%) | 80.0 |
| 35 to 50 years | 5 (41.7%) | 52.0 |
| Total | 12 (100.0%) | 48.0 |
Fertility by Age by Marriage Status in Cannon Beach
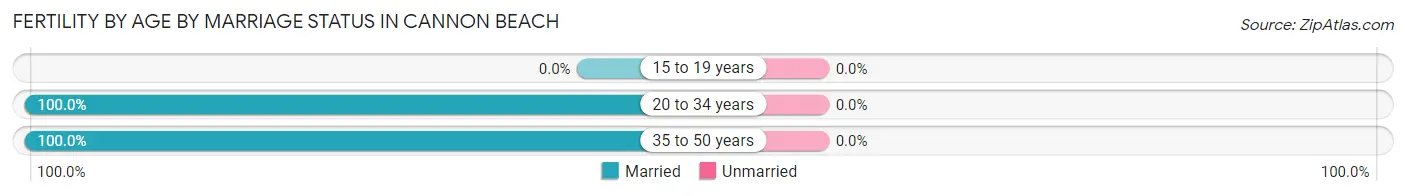
| Age Bracket | Married | Unmarried |
| 15 to 19 years | 0 (0.0%) | 0 (0.0%) |
| 20 to 34 years | 7 (100.0%) | 0 (0.0%) |
| 35 to 50 years | 5 (100.0%) | 0 (0.0%) |
| Total | 12 (100.0%) | 0 (0.0%) |
Fertility by Education in Cannon Beach
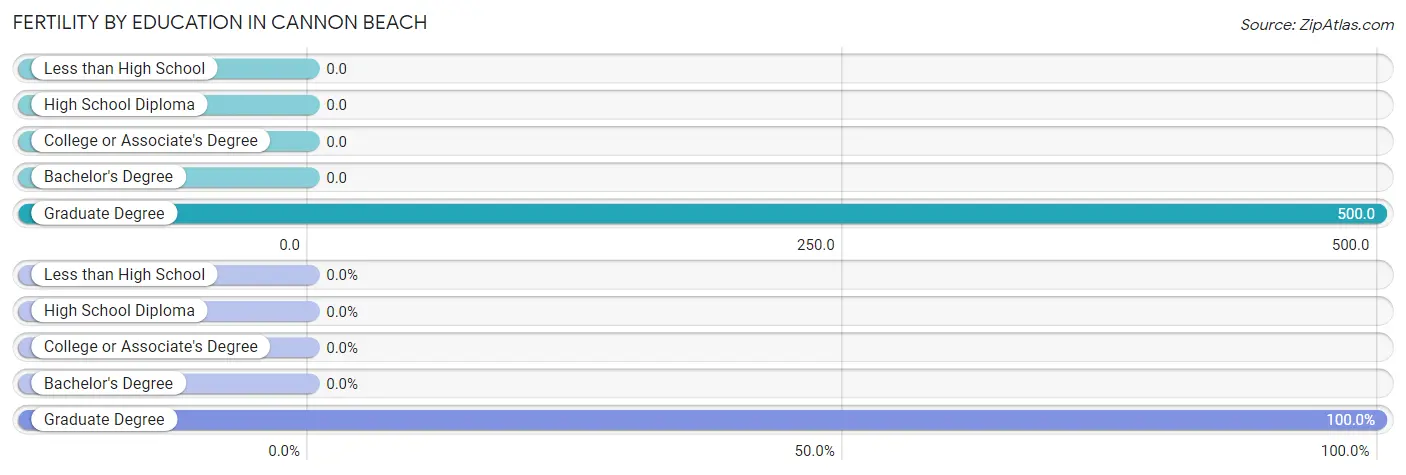
| Educational Attainment | Women with Births | Births / 1,000 Women |
| Less than High School | 0 (0.0%) | 0.0 |
| High School Diploma | 0 (0.0%) | 0.0 |
| College or Associate's Degree | 0 (0.0%) | 0.0 |
| Bachelor's Degree | 0 (0.0%) | 0.0 |
| Graduate Degree | 12 (100.0%) | 500.0 |
| Total | 12 (100.0%) | 48.0 |
Fertility by Education by Marriage Status in Cannon Beach
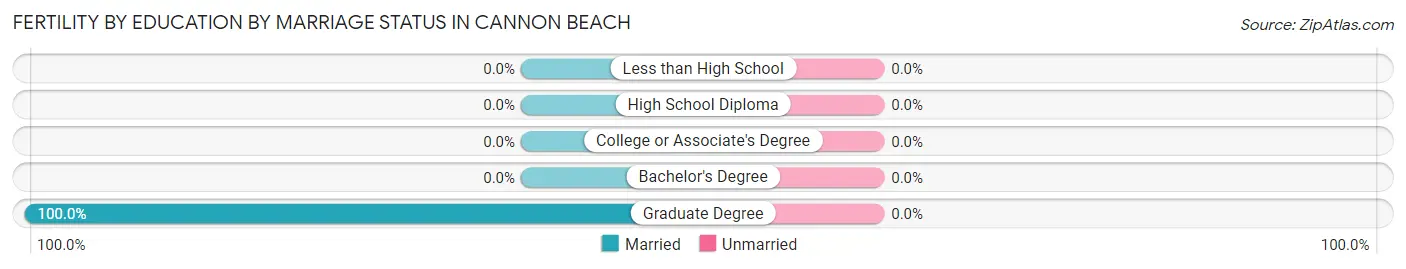
| Educational Attainment | Married | Unmarried |
| Less than High School | 0 (0.0%) | 0 (0.0%) |
| High School Diploma | 0 (0.0%) | 0 (0.0%) |
| College or Associate's Degree | 0 (0.0%) | 0 (0.0%) |
| Bachelor's Degree | 0 (0.0%) | 0 (0.0%) |
| Graduate Degree | 12 (100.0%) | 0 (0.0%) |
| Total | 12 (100.0%) | 0 (0.0%) |
Employment Characteristics in Cannon Beach
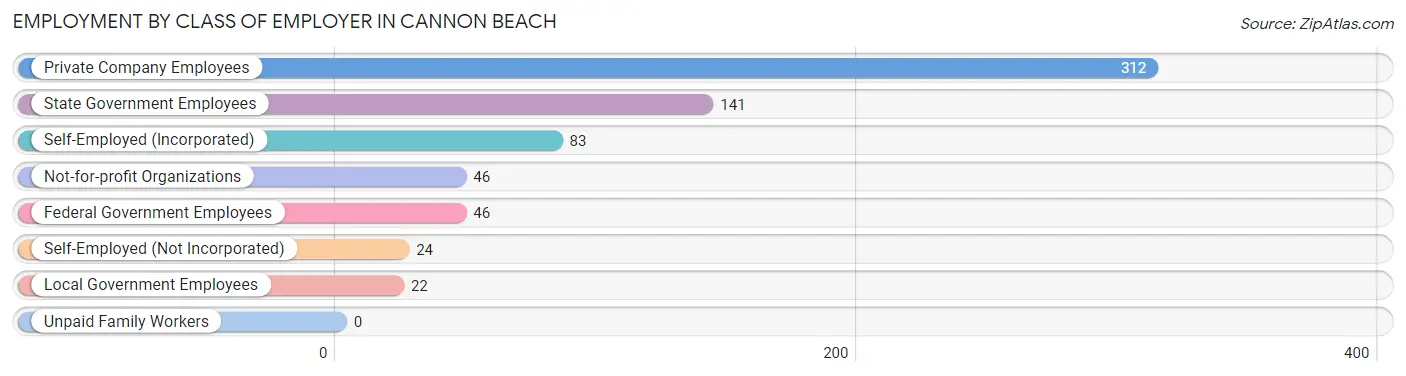
Employment by Class of Employer in Cannon Beach
Among the 674 employed individuals in Cannon Beach, private company employees (312 | 46.3%), state government employees (141 | 20.9%), and self-employed (incorporated) (83 | 12.3%) make up the most common classes of employment.
| Employer Class | # Employees | % Employees |
| Private Company Employees | 312 | 46.3% |
| Self-Employed (Incorporated) | 83 | 12.3% |
| Self-Employed (Not Incorporated) | 24 | 3.6% |
| Not-for-profit Organizations | 46 | 6.8% |
| Local Government Employees | 22 | 3.3% |
| State Government Employees | 141 | 20.9% |
| Federal Government Employees | 46 | 6.8% |
| Unpaid Family Workers | 0 | 0.0% |
| Total | 674 | 100.0% |
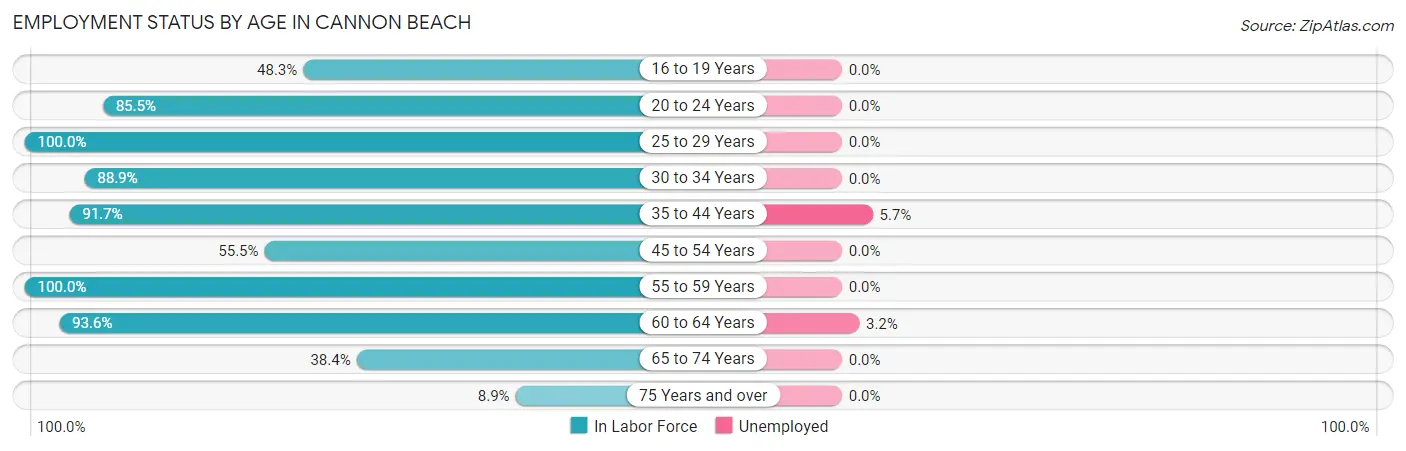
Employment Status by Age in Cannon Beach
According to the labor force statistics for Cannon Beach, out of the total population over 16 years of age (1,114), 64.4% or 717 individuals are in the labor force, with 1.7% or 12 of them unemployed. The age group with the highest labor force participation rate is 25 to 29 years, with 100.0% or 23 individuals in the labor force. Within the labor force, the 35 to 44 years age range has the highest percentage of unemployed individuals, with 5.7% or 5 of them being unemployed.
| Age Bracket | In Labor Force | Unemployed |
| 16 to 19 Years | 29 (48.3%) | 0 (0.0%) |
| 20 to 24 Years | 71 (85.5%) | 0 (0.0%) |
| 25 to 29 Years | 23 (100.0%) | 0 (0.0%) |
| 30 to 34 Years | 56 (88.9%) | 0 (0.0%) |
| 35 to 44 Years | 88 (91.7%) | 5 (5.7%) |
| 45 to 54 Years | 86 (55.5%) | 0 (0.0%) |
| 55 to 59 Years | 56 (100.0%) | 0 (0.0%) |
| 60 to 64 Years | 219 (93.6%) | 7 (3.2%) |
| 65 to 74 Years | 76 (38.4%) | 0 (0.0%) |
| 75 Years and over | 13 (8.9%) | 0 (0.0%) |
| Total | 717 (64.4%) | 12 (1.7%) |
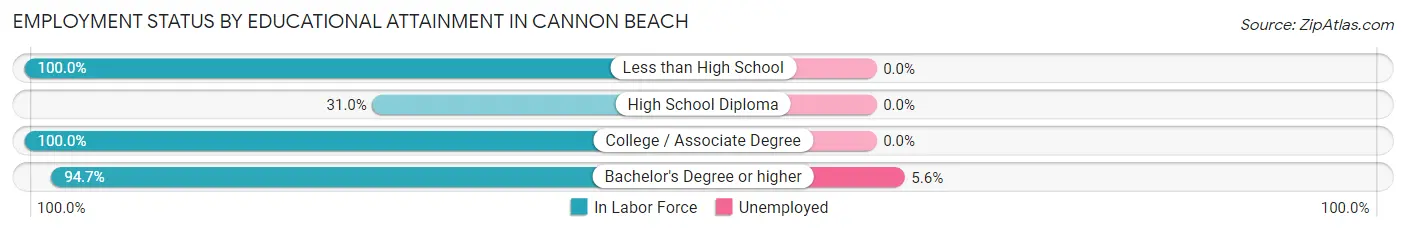
Employment Status by Educational Attainment in Cannon Beach
According to labor force statistics for Cannon Beach, 84.2% of individuals (528) out of the total population between 25 and 64 years of age (627) are in the labor force, with 2.3% or 12 of them being unemployed. The group with the highest labor force participation rate are those with the educational attainment of less than high school, with 100.0% or 29 individuals in the labor force. Within the labor force, individuals with bachelor's degree or higher education have the highest percentage of unemployment, with 5.6% or 12 of them being unemployed.
| Educational Attainment | In Labor Force | Unemployed |
| Less than High School | 29 (100.0%) | 0 (0.0%) |
| High School Diploma | 39 (31.0%) | 0 (0.0%) |
| College / Associate Degree | 244 (100.0%) | 0 (0.0%) |
| Bachelor's Degree or higher | 216 (94.7%) | 13 (5.6%) |
| Total | 528 (84.2%) | 14 (2.3%) |
Employment Occupations by Sex in Cannon Beach
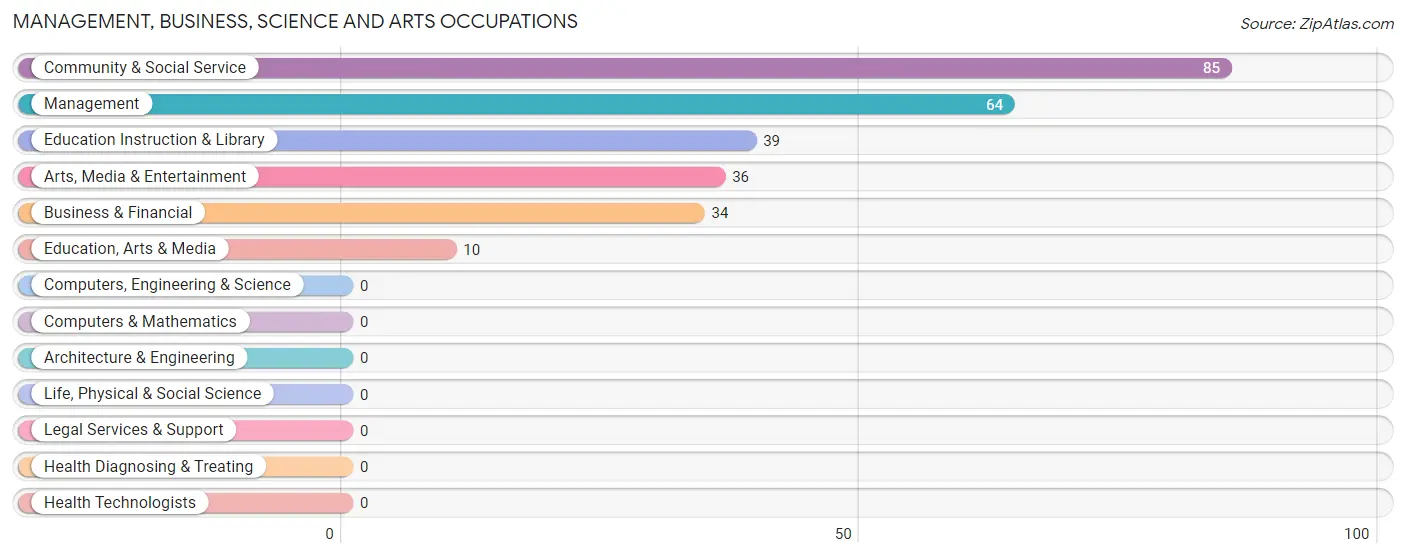
Management, Business, Science and Arts Occupations
The most common Management, Business, Science and Arts occupations in Cannon Beach are Community & Social Service (85 | 12.1%), Management (64 | 9.1%), Education Instruction & Library (39 | 5.5%), Arts, Media & Entertainment (36 | 5.1%), and Business & Financial (34 | 4.8%).
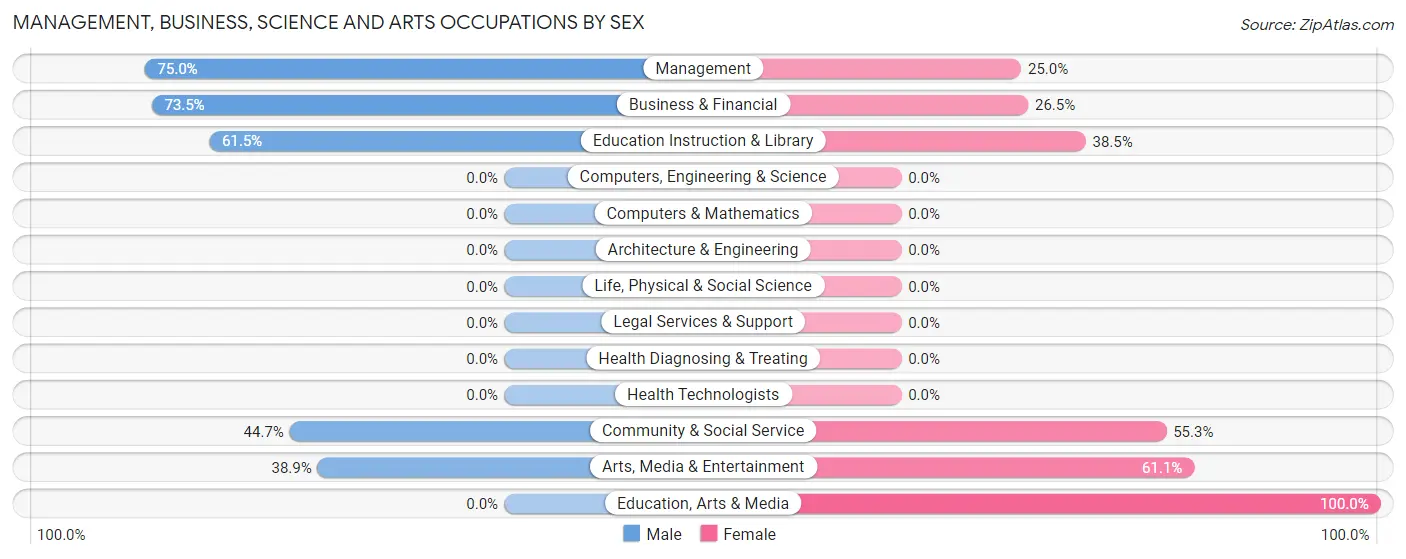
Management, Business, Science and Arts Occupations by Sex
Within the Management, Business, Science and Arts occupations in Cannon Beach, the most male-oriented occupations are Management (75.0%), Business & Financial (73.5%), and Education Instruction & Library (61.5%), while the most female-oriented occupations are Education, Arts & Media (100.0%), Arts, Media & Entertainment (61.1%), and Community & Social Service (55.3%).
| Occupation | Male | Female |
| Management | 48 (75.0%) | 16 (25.0%) |
| Business & Financial | 25 (73.5%) | 9 (26.5%) |
| Computers, Engineering & Science | 0 (0.0%) | 0 (0.0%) |
| Computers & Mathematics | 0 (0.0%) | 0 (0.0%) |
| Architecture & Engineering | 0 (0.0%) | 0 (0.0%) |
| Life, Physical & Social Science | 0 (0.0%) | 0 (0.0%) |
| Community & Social Service | 38 (44.7%) | 47 (55.3%) |
| Education, Arts & Media | 0 (0.0%) | 10 (100.0%) |
| Legal Services & Support | 0 (0.0%) | 0 (0.0%) |
| Education Instruction & Library | 24 (61.5%) | 15 (38.5%) |
| Arts, Media & Entertainment | 14 (38.9%) | 22 (61.1%) |
| Health Diagnosing & Treating | 0 (0.0%) | 0 (0.0%) |
| Health Technologists | 0 (0.0%) | 0 (0.0%) |
| Total (Category) | 111 (60.7%) | 72 (39.3%) |
| Total (Overall) | 263 (37.3%) | 442 (62.7%) |
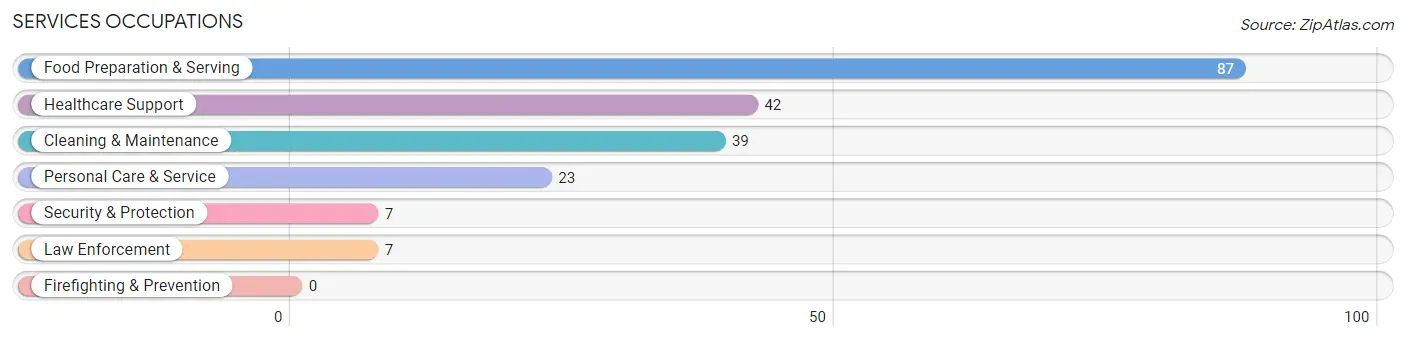
Services Occupations
The most common Services occupations in Cannon Beach are Food Preparation & Serving (87 | 12.3%), Healthcare Support (42 | 6.0%), Cleaning & Maintenance (39 | 5.5%), Personal Care & Service (23 | 3.3%), and Security & Protection (7 | 1.0%).
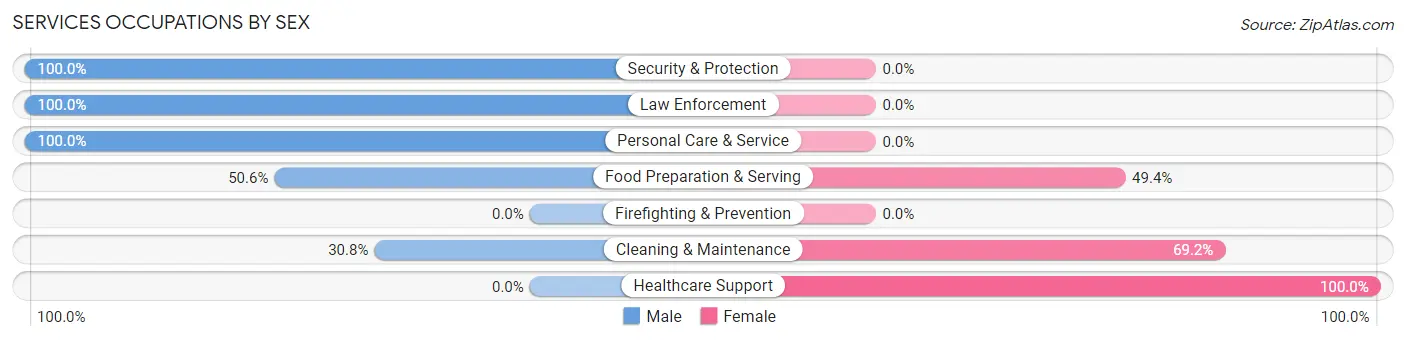
Services Occupations by Sex
Within the Services occupations in Cannon Beach, the most male-oriented occupations are Security & Protection (100.0%), Law Enforcement (100.0%), and Personal Care & Service (100.0%), while the most female-oriented occupations are Healthcare Support (100.0%), Cleaning & Maintenance (69.2%), and Food Preparation & Serving (49.4%).
| Occupation | Male | Female |
| Healthcare Support | 0 (0.0%) | 42 (100.0%) |
| Security & Protection | 7 (100.0%) | 0 (0.0%) |
| Firefighting & Prevention | 0 (0.0%) | 0 (0.0%) |
| Law Enforcement | 7 (100.0%) | 0 (0.0%) |
| Food Preparation & Serving | 44 (50.6%) | 43 (49.4%) |
| Cleaning & Maintenance | 12 (30.8%) | 27 (69.2%) |
| Personal Care & Service | 23 (100.0%) | 0 (0.0%) |
| Total (Category) | 86 (43.4%) | 112 (56.6%) |
| Total (Overall) | 263 (37.3%) | 442 (62.7%) |
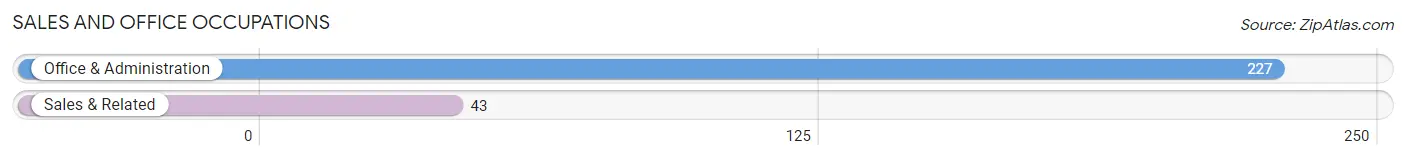
Sales and Office Occupations
The most common Sales and Office occupations in Cannon Beach are Office & Administration (227 | 32.2%), and Sales & Related (43 | 6.1%).
Sales and Office Occupations by Sex
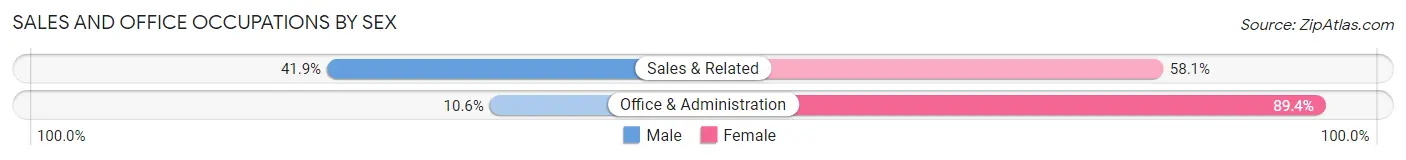
| Occupation | Male | Female |
| Sales & Related | 18 (41.9%) | 25 (58.1%) |
| Office & Administration | 24 (10.6%) | 203 (89.4%) |
| Total (Category) | 42 (15.6%) | 228 (84.4%) |
| Total (Overall) | 263 (37.3%) | 442 (62.7%) |
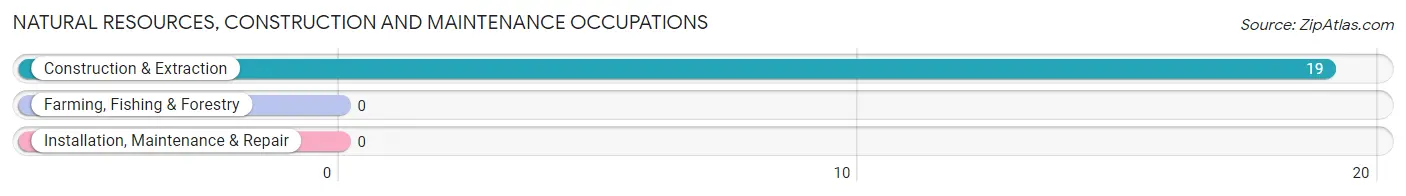
Natural Resources, Construction and Maintenance Occupations
The most common Natural Resources, Construction and Maintenance occupations in Cannon Beach are , and Construction & Extraction (19 | 2.7%).
Natural Resources, Construction and Maintenance Occupations by Sex
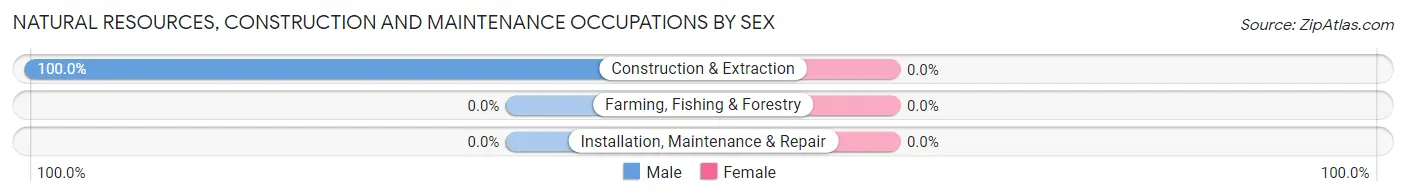
| Occupation | Male | Female |
| Farming, Fishing & Forestry | 0 (0.0%) | 0 (0.0%) |
| Construction & Extraction | 19 (100.0%) | 0 (0.0%) |
| Installation, Maintenance & Repair | 0 (0.0%) | 0 (0.0%) |
| Total (Category) | 19 (100.0%) | 0 (0.0%) |
| Total (Overall) | 263 (37.3%) | 442 (62.7%) |
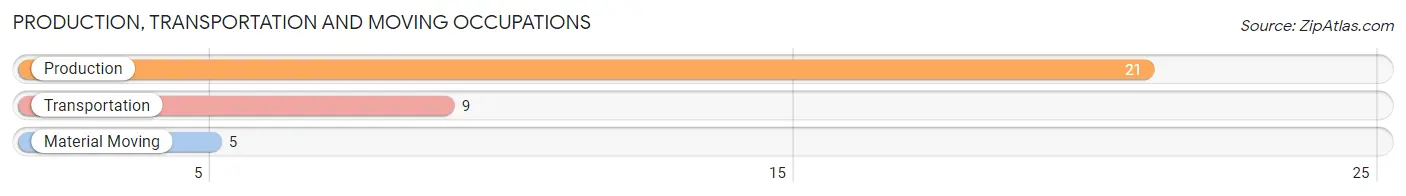
Production, Transportation and Moving Occupations
The most common Production, Transportation and Moving occupations in Cannon Beach are Production (21 | 3.0%), Transportation (9 | 1.3%), and Material Moving (5 | 0.7%).
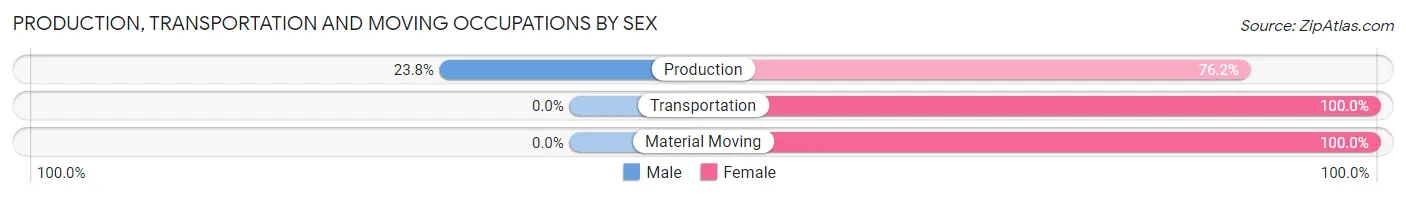
Production, Transportation and Moving Occupations by Sex
| Occupation | Male | Female |
| Production | 5 (23.8%) | 16 (76.2%) |
| Transportation | 0 (0.0%) | 9 (100.0%) |
| Material Moving | 0 (0.0%) | 5 (100.0%) |
| Total (Category) | 5 (14.3%) | 30 (85.7%) |
| Total (Overall) | 263 (37.3%) | 442 (62.7%) |
Employment Industries by Sex in Cannon Beach
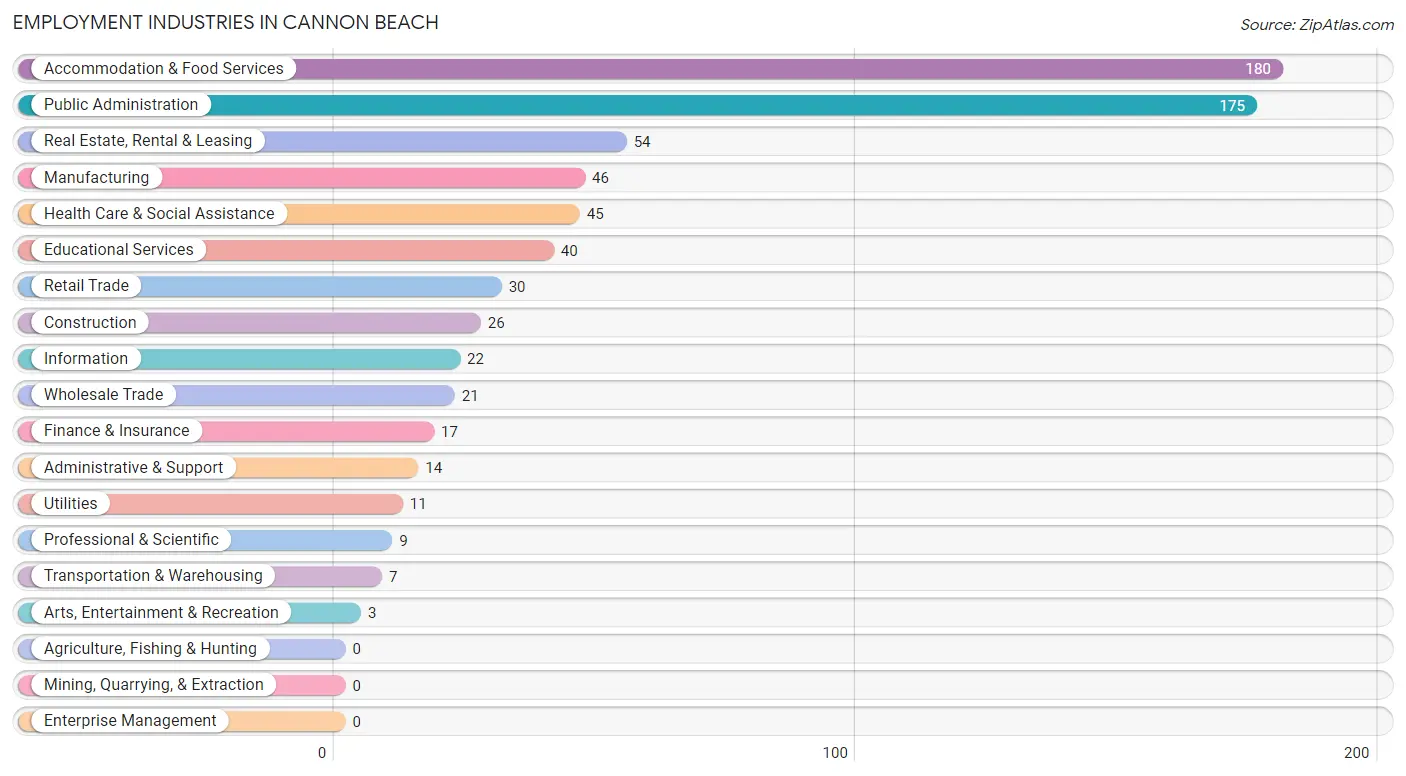
Employment Industries in Cannon Beach
The major employment industries in Cannon Beach include Accommodation & Food Services (180 | 25.5%), Public Administration (175 | 24.8%), Real Estate, Rental & Leasing (54 | 7.7%), Manufacturing (46 | 6.5%), and Health Care & Social Assistance (45 | 6.4%).
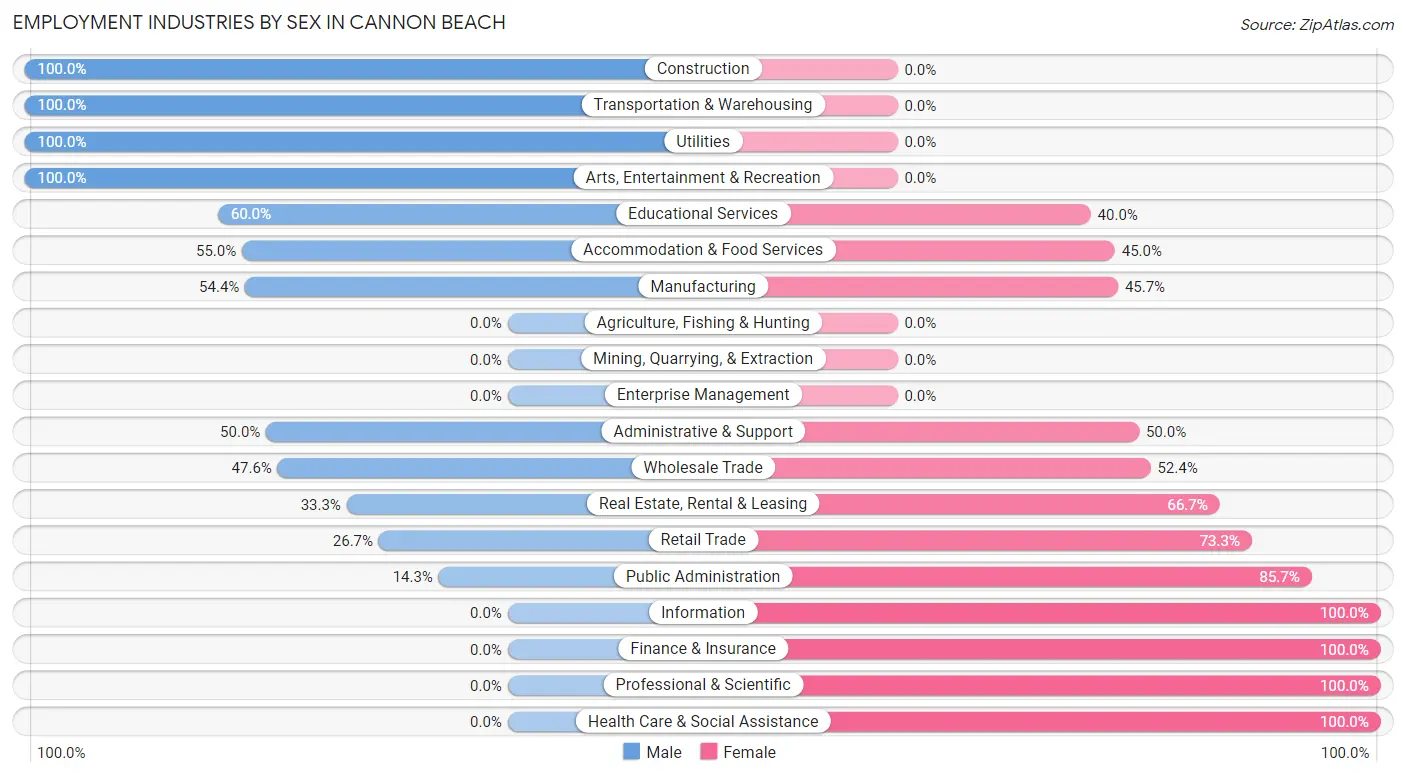
Employment Industries by Sex in Cannon Beach
The Cannon Beach industries that see more men than women are Construction (100.0%), Transportation & Warehousing (100.0%), and Utilities (100.0%), whereas the industries that tend to have a higher number of women are Information (100.0%), Finance & Insurance (100.0%), and Professional & Scientific (100.0%).
| Industry | Male | Female |
| Agriculture, Fishing & Hunting | 0 (0.0%) | 0 (0.0%) |
| Mining, Quarrying, & Extraction | 0 (0.0%) | 0 (0.0%) |
| Construction | 26 (100.0%) | 0 (0.0%) |
| Manufacturing | 25 (54.3%) | 21 (45.7%) |
| Wholesale Trade | 10 (47.6%) | 11 (52.4%) |
| Retail Trade | 8 (26.7%) | 22 (73.3%) |
| Transportation & Warehousing | 7 (100.0%) | 0 (0.0%) |
| Utilities | 11 (100.0%) | 0 (0.0%) |
| Information | 0 (0.0%) | 22 (100.0%) |
| Finance & Insurance | 0 (0.0%) | 17 (100.0%) |
| Real Estate, Rental & Leasing | 18 (33.3%) | 36 (66.7%) |
| Professional & Scientific | 0 (0.0%) | 9 (100.0%) |
| Enterprise Management | 0 (0.0%) | 0 (0.0%) |
| Administrative & Support | 7 (50.0%) | 7 (50.0%) |
| Educational Services | 24 (60.0%) | 16 (40.0%) |
| Health Care & Social Assistance | 0 (0.0%) | 45 (100.0%) |
| Arts, Entertainment & Recreation | 3 (100.0%) | 0 (0.0%) |
| Accommodation & Food Services | 99 (55.0%) | 81 (45.0%) |
| Public Administration | 25 (14.3%) | 150 (85.7%) |
| Total | 263 (37.3%) | 442 (62.7%) |
Education in Cannon Beach
School Enrollment in Cannon Beach
The most common levels of schooling among the 180 students in Cannon Beach are college / undergraduate (85 | 47.2%), middle school (53 | 29.4%), and kindergarten (16 | 8.9%).
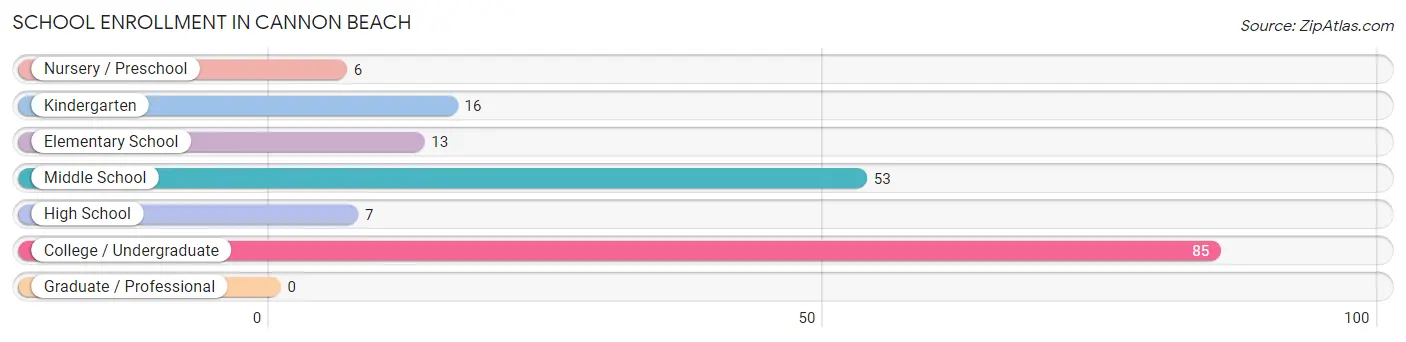
| School Level | # Students | % Students |
| Nursery / Preschool | 6 | 3.3% |
| Kindergarten | 16 | 8.9% |
| Elementary School | 13 | 7.2% |
| Middle School | 53 | 29.4% |
| High School | 7 | 3.9% |
| College / Undergraduate | 85 | 47.2% |
| Graduate / Professional | 0 | 0.0% |
| Total | 180 | 100.0% |
School Enrollment by Age by Funding Source in Cannon Beach
Out of a total of 180 students who are enrolled in schools in Cannon Beach, 50 (27.8%) attend a private institution, while the remaining 130 (72.2%) are enrolled in public schools. The age group of 5 to 9 year old has the highest likelihood of being enrolled in private schools, with 22 (62.9% in the age bracket) enrolled. Conversely, the age group of 10 to 14 year olds has the lowest likelihood of being enrolled in a private school, with 53 (100.0% in the age bracket) attending a public institution.
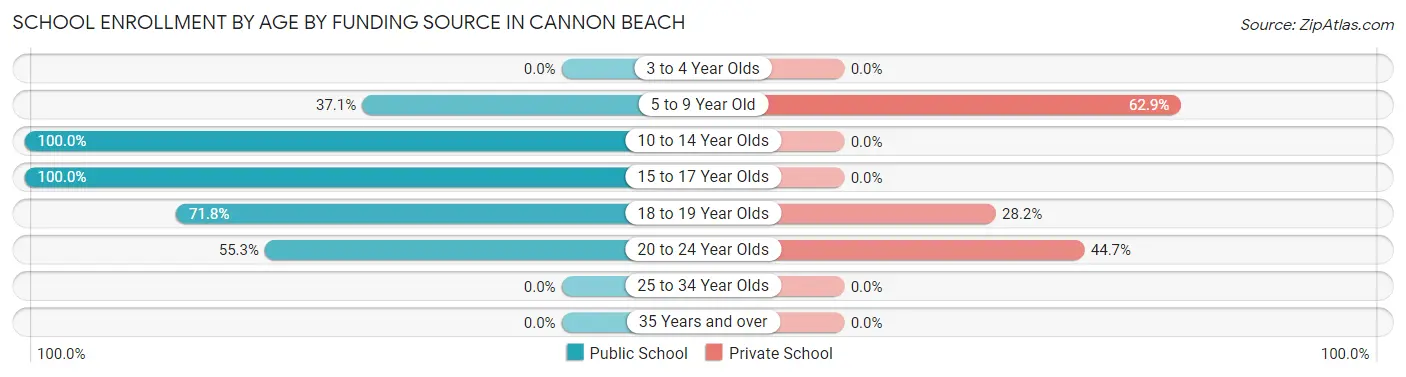
| Age Bracket | Public School | Private School |
| 3 to 4 Year Olds | 0 (0.0%) | 0 (0.0%) |
| 5 to 9 Year Old | 13 (37.1%) | 22 (62.9%) |
| 10 to 14 Year Olds | 53 (100.0%) | 0 (0.0%) |
| 15 to 17 Year Olds | 15 (100.0%) | 0 (0.0%) |
| 18 to 19 Year Olds | 28 (71.8%) | 11 (28.2%) |
| 20 to 24 Year Olds | 21 (55.3%) | 17 (44.7%) |
| 25 to 34 Year Olds | 0 (0.0%) | 0 (0.0%) |
| 35 Years and over | 0 (0.0%) | 0 (0.0%) |
| Total | 130 (72.2%) | 50 (27.8%) |
Educational Attainment by Field of Study in Cannon Beach
Business (118 | 25.8%), social sciences (72 | 15.7%), education (53 | 11.6%), literature & languages (43 | 9.4%), and arts & humanities (28 | 6.1%) are the most common fields of study among 458 individuals in Cannon Beach who have obtained a bachelor's degree or higher.
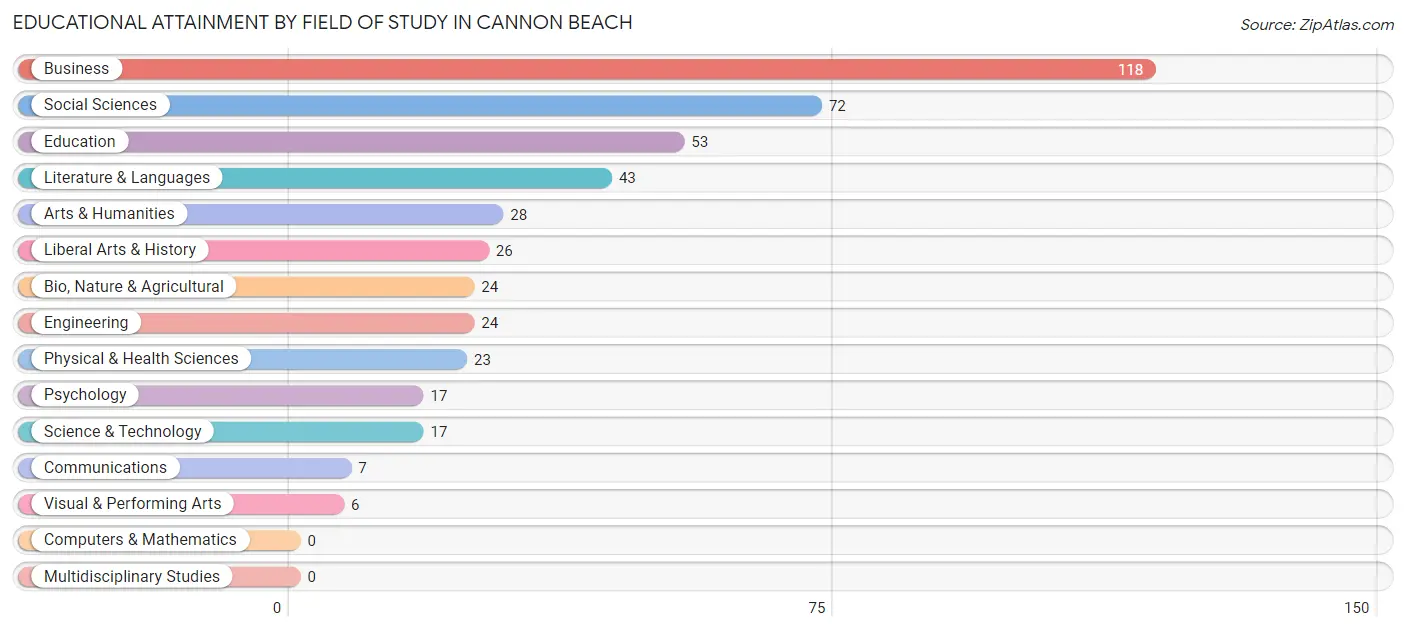
| Field of Study | # Graduates | % Graduates |
| Computers & Mathematics | 0 | 0.0% |
| Bio, Nature & Agricultural | 24 | 5.2% |
| Physical & Health Sciences | 23 | 5.0% |
| Psychology | 17 | 3.7% |
| Social Sciences | 72 | 15.7% |
| Engineering | 24 | 5.2% |
| Multidisciplinary Studies | 0 | 0.0% |
| Science & Technology | 17 | 3.7% |
| Business | 118 | 25.8% |
| Education | 53 | 11.6% |
| Literature & Languages | 43 | 9.4% |
| Liberal Arts & History | 26 | 5.7% |
| Visual & Performing Arts | 6 | 1.3% |
| Communications | 7 | 1.5% |
| Arts & Humanities | 28 | 6.1% |
| Total | 458 | 100.0% |
Transportation & Commute in Cannon Beach
Vehicle Availability by Sex in Cannon Beach
The most prevalent vehicle ownership categories in Cannon Beach are males with 2 vehicles (125, accounting for 52.1%) and females with 2 vehicles (114, making up 33.0%).
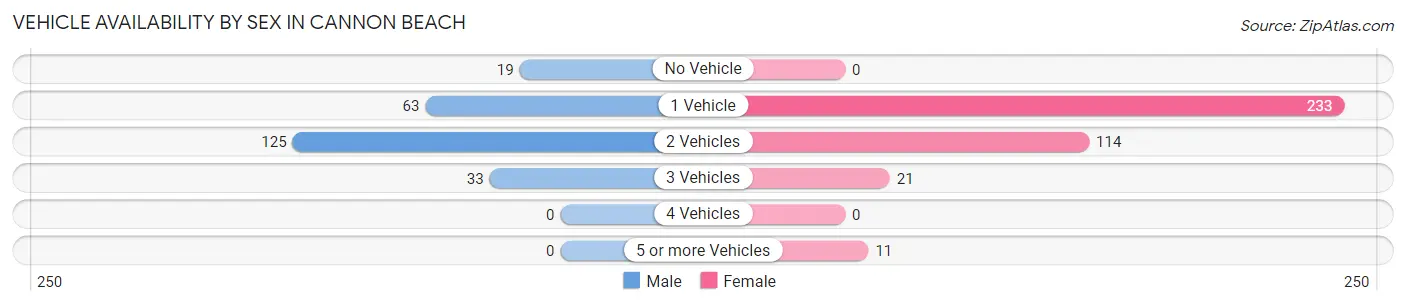
| Vehicles Available | Male | Female |
| No Vehicle | 19 (7.9%) | 0 (0.0%) |
| 1 Vehicle | 63 (26.3%) | 233 (61.5%) |
| 2 Vehicles | 125 (52.1%) | 114 (30.1%) |
| 3 Vehicles | 33 (13.8%) | 21 (5.5%) |
| 4 Vehicles | 0 (0.0%) | 0 (0.0%) |
| 5 or more Vehicles | 0 (0.0%) | 11 (2.9%) |
| Total | 240 (100.0%) | 379 (100.0%) |
Commute Time in Cannon Beach
The most frequently occuring commute durations in Cannon Beach are 10 to 14 minutes (162 commuters, 27.2%), 40 to 44 minutes (134 commuters, 22.5%), and 5 to 9 minutes (122 commuters, 20.5%).
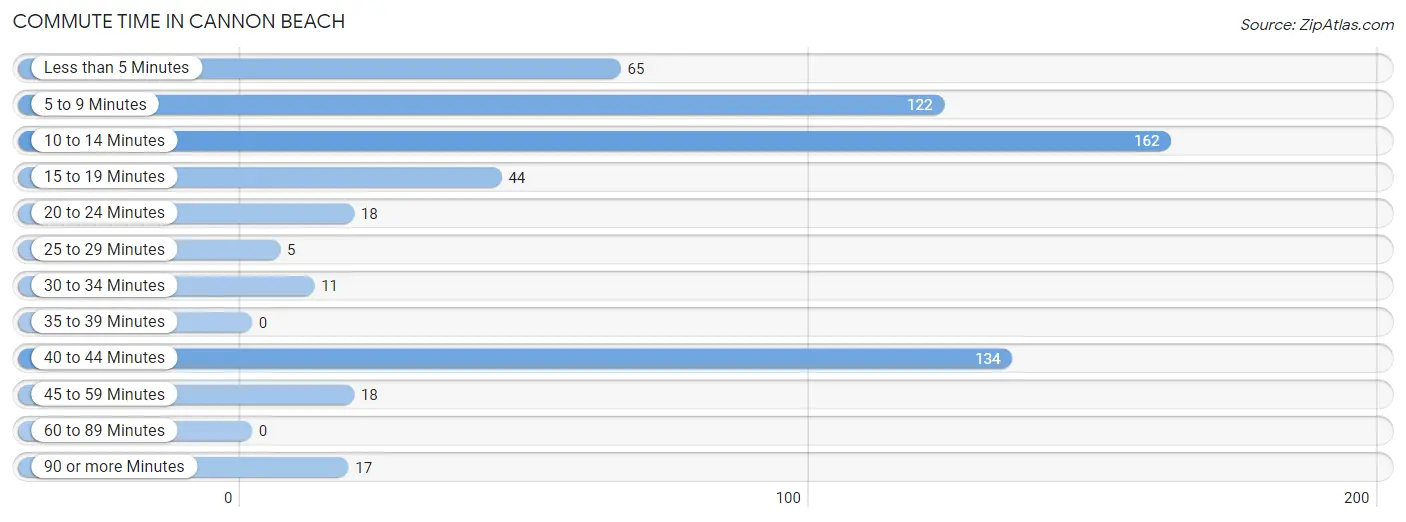
| Commute Time | # Commuters | % Commuters |
| Less than 5 Minutes | 65 | 10.9% |
| 5 to 9 Minutes | 122 | 20.5% |
| 10 to 14 Minutes | 162 | 27.2% |
| 15 to 19 Minutes | 44 | 7.4% |
| 20 to 24 Minutes | 18 | 3.0% |
| 25 to 29 Minutes | 5 | 0.8% |
| 30 to 34 Minutes | 11 | 1.8% |
| 35 to 39 Minutes | 0 | 0.0% |
| 40 to 44 Minutes | 134 | 22.5% |
| 45 to 59 Minutes | 18 | 3.0% |
| 60 to 89 Minutes | 0 | 0.0% |
| 90 or more Minutes | 17 | 2.9% |
Commute Time by Sex in Cannon Beach
The most common commute times in Cannon Beach are 10 to 14 minutes (110 commuters, 46.2%) for males and 40 to 44 minutes (134 commuters, 37.4%) for females.
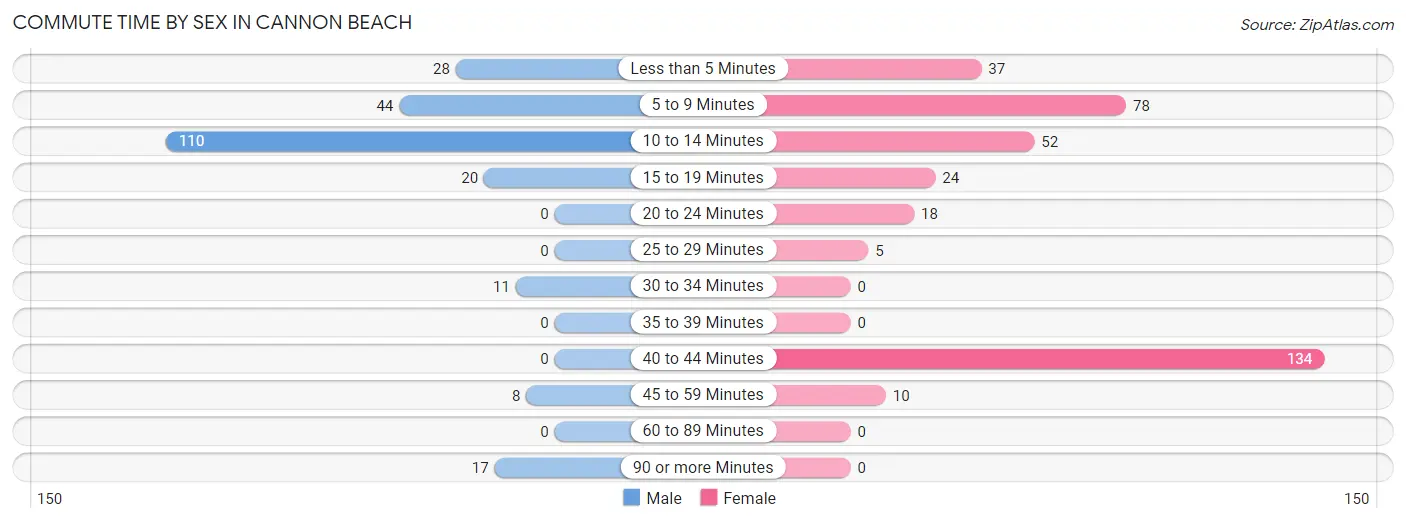
| Commute Time | Male | Female |
| Less than 5 Minutes | 28 (11.8%) | 37 (10.3%) |
| 5 to 9 Minutes | 44 (18.5%) | 78 (21.8%) |
| 10 to 14 Minutes | 110 (46.2%) | 52 (14.5%) |
| 15 to 19 Minutes | 20 (8.4%) | 24 (6.7%) |
| 20 to 24 Minutes | 0 (0.0%) | 18 (5.0%) |
| 25 to 29 Minutes | 0 (0.0%) | 5 (1.4%) |
| 30 to 34 Minutes | 11 (4.6%) | 0 (0.0%) |
| 35 to 39 Minutes | 0 (0.0%) | 0 (0.0%) |
| 40 to 44 Minutes | 0 (0.0%) | 134 (37.4%) |
| 45 to 59 Minutes | 8 (3.4%) | 10 (2.8%) |
| 60 to 89 Minutes | 0 (0.0%) | 0 (0.0%) |
| 90 or more Minutes | 17 (7.1%) | 0 (0.0%) |
Time of Departure to Work by Sex in Cannon Beach
The most frequent times of departure to work in Cannon Beach are 7:30 AM to 7:59 AM (66, 27.7%) for males and 6:00 AM to 6:29 AM (134, 37.4%) for females.
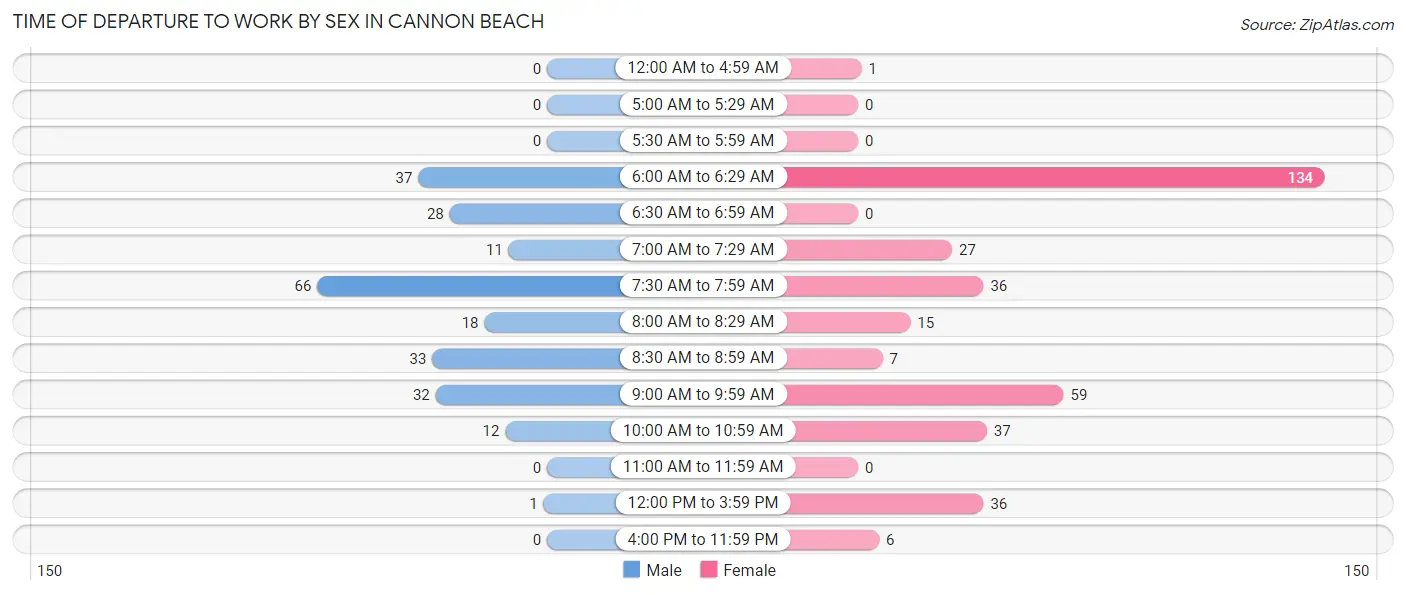
| Time of Departure | Male | Female |
| 12:00 AM to 4:59 AM | 0 (0.0%) | 1 (0.3%) |
| 5:00 AM to 5:29 AM | 0 (0.0%) | 0 (0.0%) |
| 5:30 AM to 5:59 AM | 0 (0.0%) | 0 (0.0%) |
| 6:00 AM to 6:29 AM | 37 (15.5%) | 134 (37.4%) |
| 6:30 AM to 6:59 AM | 28 (11.8%) | 0 (0.0%) |
| 7:00 AM to 7:29 AM | 11 (4.6%) | 27 (7.5%) |
| 7:30 AM to 7:59 AM | 66 (27.7%) | 36 (10.1%) |
| 8:00 AM to 8:29 AM | 18 (7.6%) | 15 (4.2%) |
| 8:30 AM to 8:59 AM | 33 (13.9%) | 7 (2.0%) |
| 9:00 AM to 9:59 AM | 32 (13.5%) | 59 (16.5%) |
| 10:00 AM to 10:59 AM | 12 (5.0%) | 37 (10.3%) |
| 11:00 AM to 11:59 AM | 0 (0.0%) | 0 (0.0%) |
| 12:00 PM to 3:59 PM | 1 (0.4%) | 36 (10.1%) |
| 4:00 PM to 11:59 PM | 0 (0.0%) | 6 (1.7%) |
| Total | 238 (100.0%) | 358 (100.0%) |
Housing Occupancy in Cannon Beach
Occupancy by Ownership in Cannon Beach
Of the total 677 dwellings in Cannon Beach, owner-occupied units account for 271 (40.0%), while renter-occupied units make up 406 (60.0%).
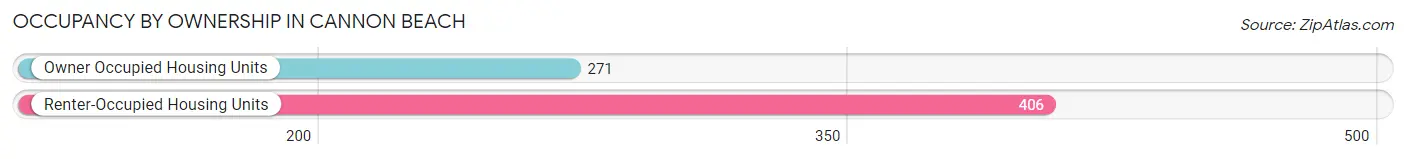
| Occupancy | # Housing Units | % Housing Units |
| Owner Occupied Housing Units | 271 | 40.0% |
| Renter-Occupied Housing Units | 406 | 60.0% |
| Total Occupied Housing Units | 677 | 100.0% |
Occupancy by Household Size in Cannon Beach
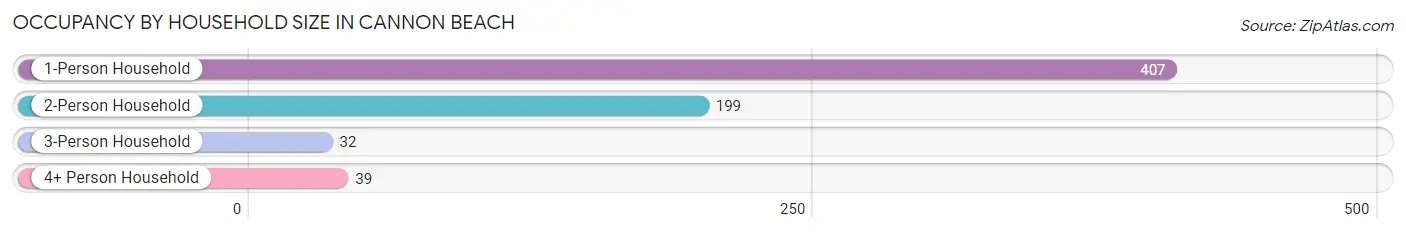
| Household Size | # Housing Units | % Housing Units |
| 1-Person Household | 407 | 60.1% |
| 2-Person Household | 199 | 29.4% |
| 3-Person Household | 32 | 4.7% |
| 4+ Person Household | 39 | 5.8% |
| Total Housing Units | 677 | 100.0% |
Occupancy by Ownership by Household Size in Cannon Beach
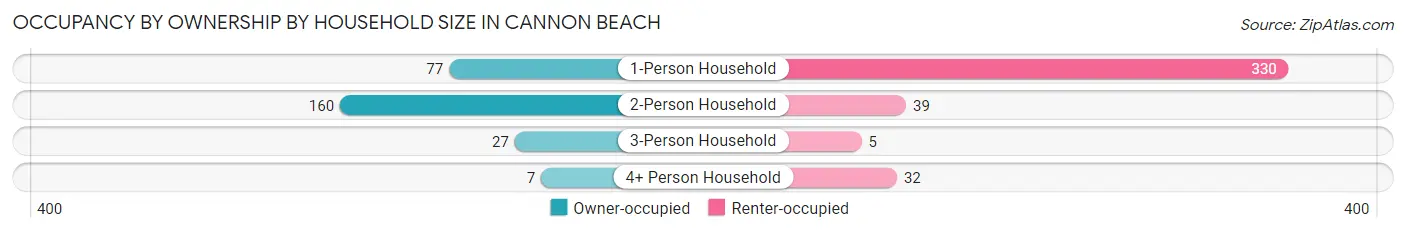
| Household Size | Owner-occupied | Renter-occupied |
| 1-Person Household | 77 (18.9%) | 330 (81.1%) |
| 2-Person Household | 160 (80.4%) | 39 (19.6%) |
| 3-Person Household | 27 (84.4%) | 5 (15.6%) |
| 4+ Person Household | 7 (17.9%) | 32 (82.1%) |
| Total Housing Units | 271 (40.0%) | 406 (60.0%) |
Occupancy by Educational Attainment in Cannon Beach
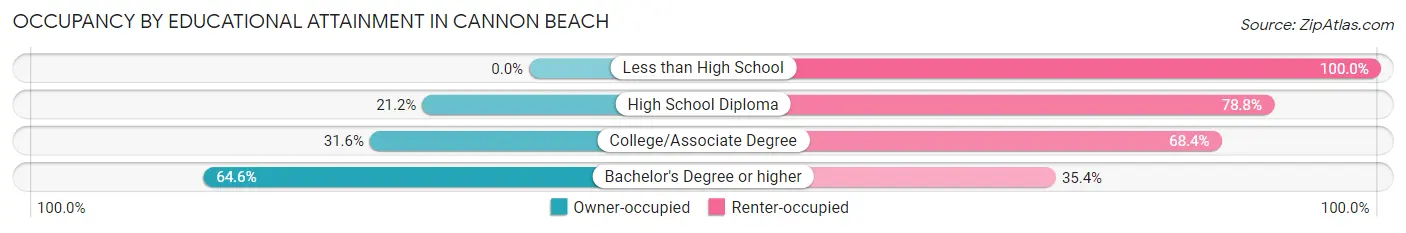
| Household Size | Owner-occupied | Renter-occupied |
| Less than High School | 0 (0.0%) | 21 (100.0%) |
| High School Diploma | 29 (21.2%) | 108 (78.8%) |
| College/Associate Degree | 89 (31.6%) | 193 (68.4%) |
| Bachelor's Degree or higher | 153 (64.6%) | 84 (35.4%) |
Occupancy by Age of Householder in Cannon Beach
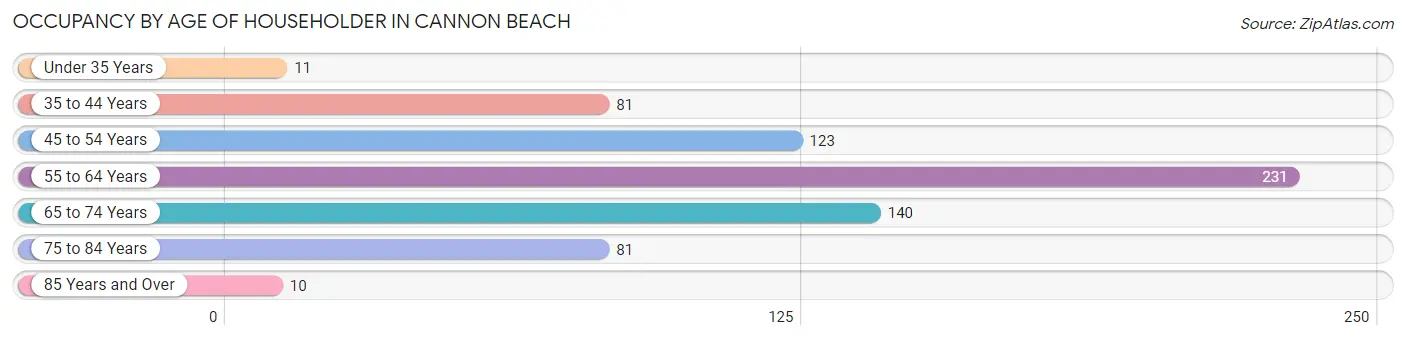
| Age Bracket | # Households | % Households |
| Under 35 Years | 11 | 1.6% |
| 35 to 44 Years | 81 | 12.0% |
| 45 to 54 Years | 123 | 18.2% |
| 55 to 64 Years | 231 | 34.1% |
| 65 to 74 Years | 140 | 20.7% |
| 75 to 84 Years | 81 | 12.0% |
| 85 Years and Over | 10 | 1.5% |
| Total | 677 | 100.0% |
Housing Finances in Cannon Beach
Median Income by Occupancy in Cannon Beach
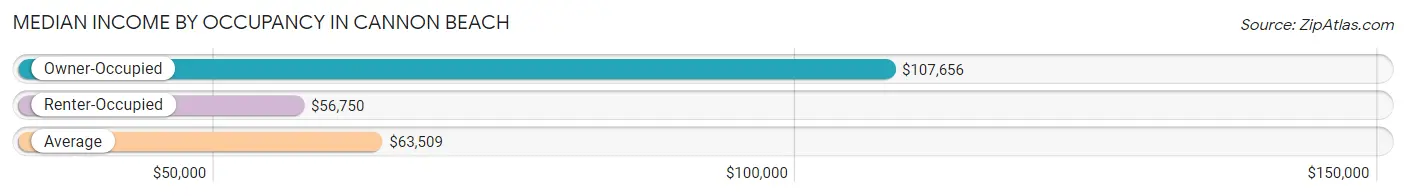
| Occupancy Type | # Households | Median Income |
| Owner-Occupied | 271 (40.0%) | $107,656 |
| Renter-Occupied | 406 (60.0%) | $56,750 |
| Average | 677 (100.0%) | $63,509 |
Occupancy by Householder Income Bracket in Cannon Beach
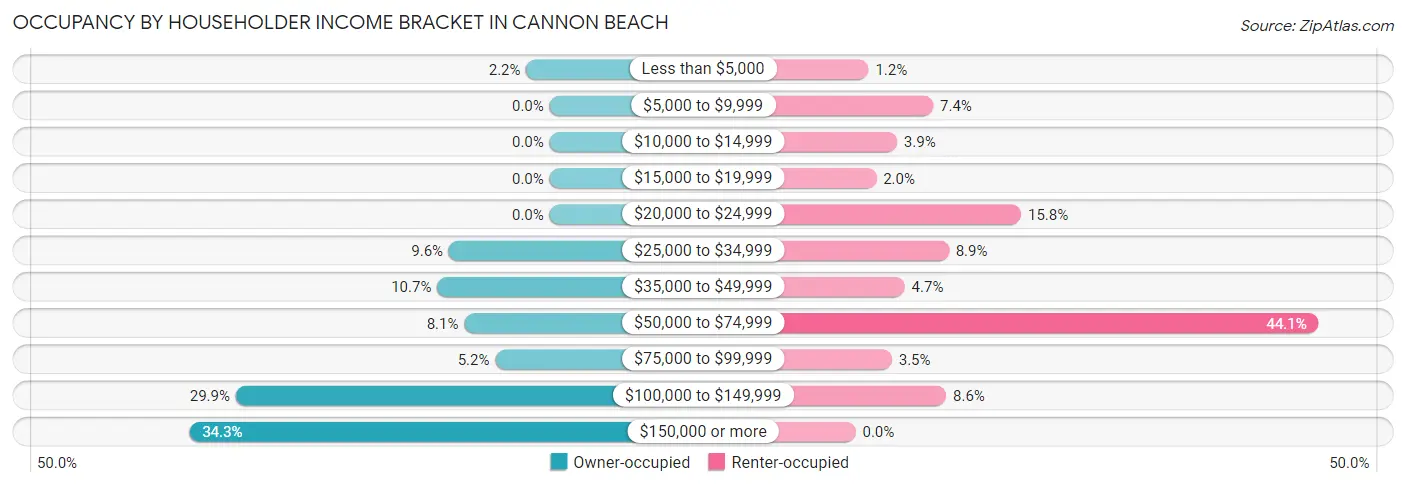
| Income Bracket | Owner-occupied | Renter-occupied |
| Less than $5,000 | 6 (2.2%) | 5 (1.2%) |
| $5,000 to $9,999 | 0 (0.0%) | 30 (7.4%) |
| $10,000 to $14,999 | 0 (0.0%) | 16 (3.9%) |
| $15,000 to $19,999 | 0 (0.0%) | 8 (2.0%) |
| $20,000 to $24,999 | 0 (0.0%) | 64 (15.8%) |
| $25,000 to $34,999 | 26 (9.6%) | 36 (8.9%) |
| $35,000 to $49,999 | 29 (10.7%) | 19 (4.7%) |
| $50,000 to $74,999 | 22 (8.1%) | 179 (44.1%) |
| $75,000 to $99,999 | 14 (5.2%) | 14 (3.5%) |
| $100,000 to $149,999 | 81 (29.9%) | 35 (8.6%) |
| $150,000 or more | 93 (34.3%) | 0 (0.0%) |
| Total | 271 (100.0%) | 406 (100.0%) |
Monthly Housing Cost Tiers in Cannon Beach
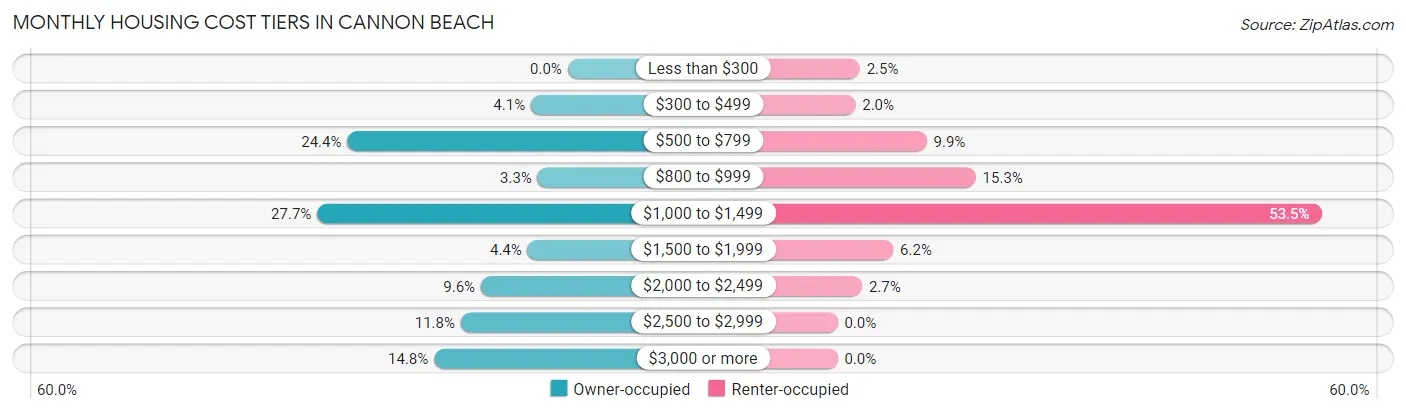
| Monthly Cost | Owner-occupied | Renter-occupied |
| Less than $300 | 0 (0.0%) | 10 (2.5%) |
| $300 to $499 | 11 (4.1%) | 8 (2.0%) |
| $500 to $799 | 66 (24.3%) | 40 (9.9%) |
| $800 to $999 | 9 (3.3%) | 62 (15.3%) |
| $1,000 to $1,499 | 75 (27.7%) | 217 (53.4%) |
| $1,500 to $1,999 | 12 (4.4%) | 25 (6.2%) |
| $2,000 to $2,499 | 26 (9.6%) | 11 (2.7%) |
| $2,500 to $2,999 | 32 (11.8%) | 0 (0.0%) |
| $3,000 or more | 40 (14.8%) | 0 (0.0%) |
| Total | 271 (100.0%) | 406 (100.0%) |
Physical Housing Characteristics in Cannon Beach
Housing Structures in Cannon Beach
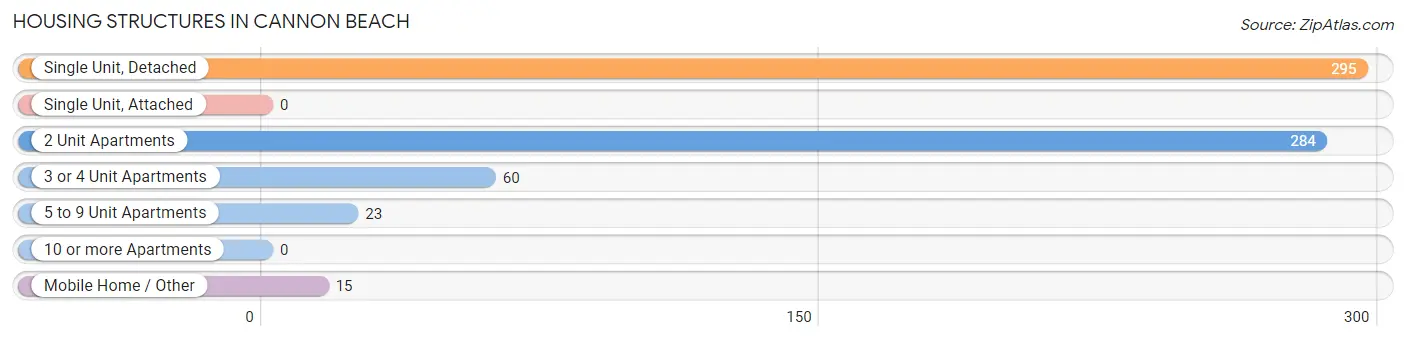
| Structure Type | # Housing Units | % Housing Units |
| Single Unit, Detached | 295 | 43.6% |
| Single Unit, Attached | 0 | 0.0% |
| 2 Unit Apartments | 284 | 41.9% |
| 3 or 4 Unit Apartments | 60 | 8.9% |
| 5 to 9 Unit Apartments | 23 | 3.4% |
| 10 or more Apartments | 0 | 0.0% |
| Mobile Home / Other | 15 | 2.2% |
| Total | 677 | 100.0% |
Housing Structures by Occupancy in Cannon Beach
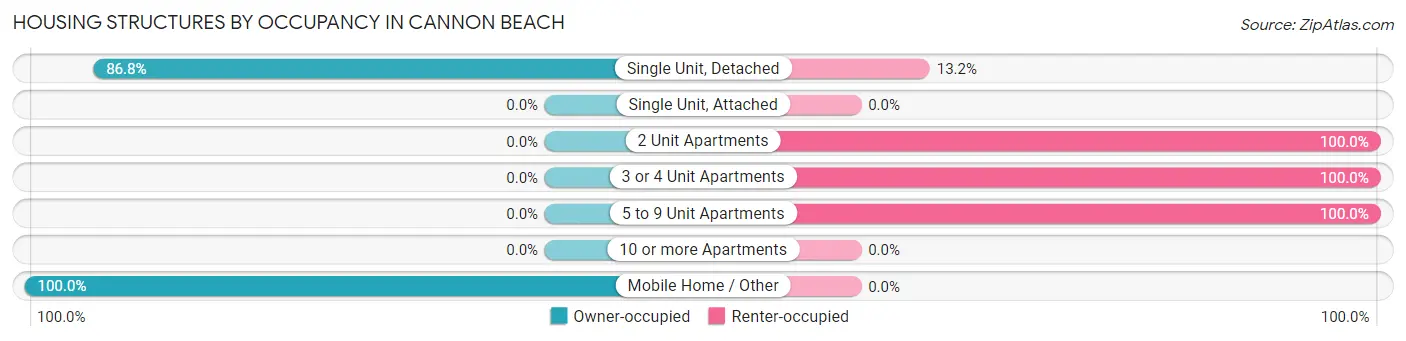
| Structure Type | Owner-occupied | Renter-occupied |
| Single Unit, Detached | 256 (86.8%) | 39 (13.2%) |
| Single Unit, Attached | 0 (0.0%) | 0 (0.0%) |
| 2 Unit Apartments | 0 (0.0%) | 284 (100.0%) |
| 3 or 4 Unit Apartments | 0 (0.0%) | 60 (100.0%) |
| 5 to 9 Unit Apartments | 0 (0.0%) | 23 (100.0%) |
| 10 or more Apartments | 0 (0.0%) | 0 (0.0%) |
| Mobile Home / Other | 15 (100.0%) | 0 (0.0%) |
| Total | 271 (40.0%) | 406 (60.0%) |
Housing Structures by Number of Rooms in Cannon Beach
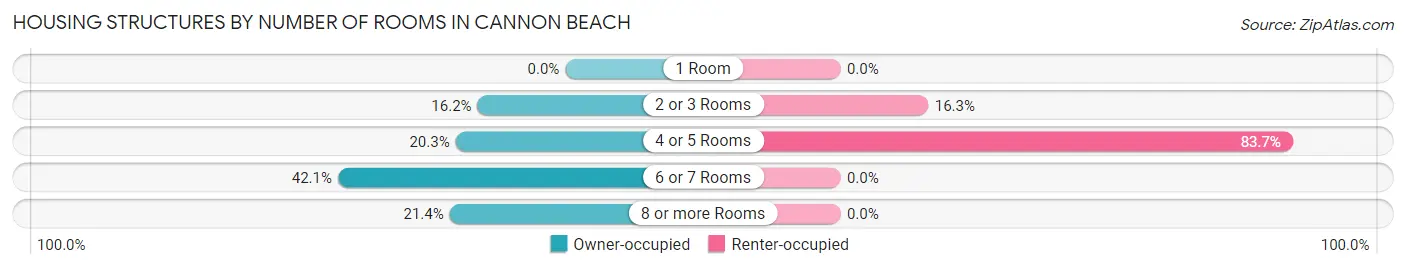
| Number of Rooms | Owner-occupied | Renter-occupied |
| 1 Room | 0 (0.0%) | 0 (0.0%) |
| 2 or 3 Rooms | 44 (16.2%) | 66 (16.3%) |
| 4 or 5 Rooms | 55 (20.3%) | 340 (83.7%) |
| 6 or 7 Rooms | 114 (42.1%) | 0 (0.0%) |
| 8 or more Rooms | 58 (21.4%) | 0 (0.0%) |
| Total | 271 (100.0%) | 406 (100.0%) |
Housing Structure by Heating Type in Cannon Beach
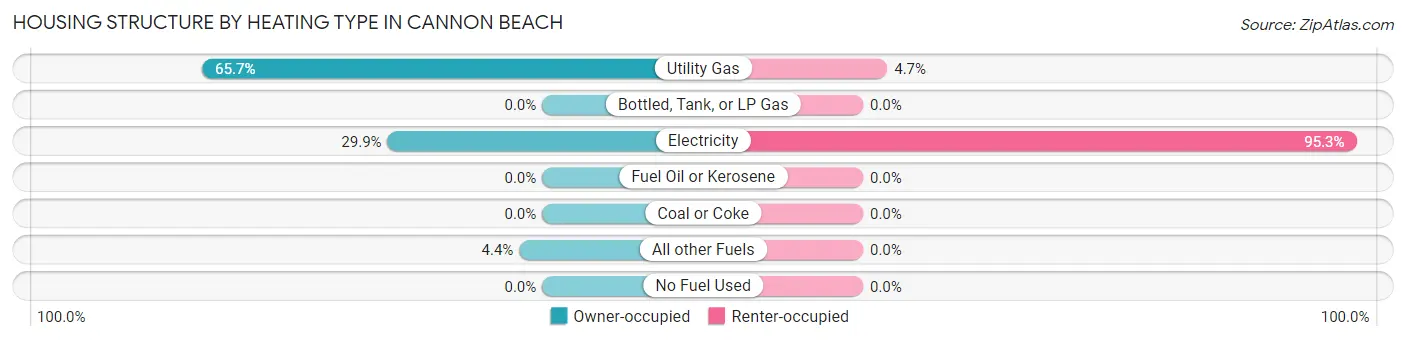
| Heating Type | Owner-occupied | Renter-occupied |
| Utility Gas | 178 (65.7%) | 19 (4.7%) |
| Bottled, Tank, or LP Gas | 0 (0.0%) | 0 (0.0%) |
| Electricity | 81 (29.9%) | 387 (95.3%) |
| Fuel Oil or Kerosene | 0 (0.0%) | 0 (0.0%) |
| Coal or Coke | 0 (0.0%) | 0 (0.0%) |
| All other Fuels | 12 (4.4%) | 0 (0.0%) |
| No Fuel Used | 0 (0.0%) | 0 (0.0%) |
| Total | 271 (100.0%) | 406 (100.0%) |
Household Vehicle Usage in Cannon Beach
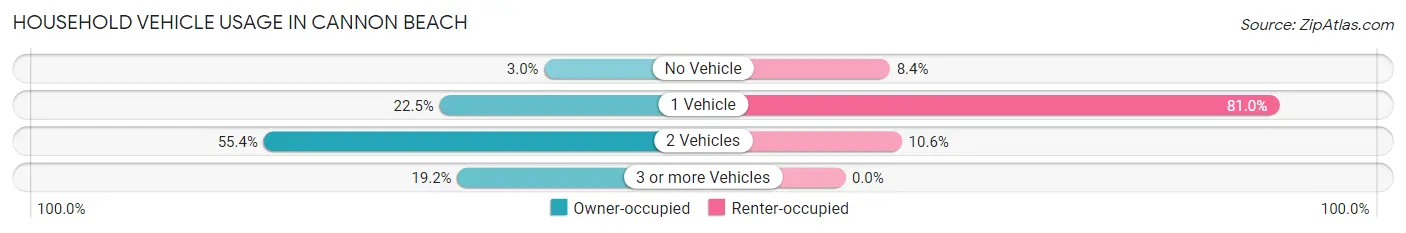
| Vehicles per Household | Owner-occupied | Renter-occupied |
| No Vehicle | 8 (2.9%) | 34 (8.4%) |
| 1 Vehicle | 61 (22.5%) | 329 (81.0%) |
| 2 Vehicles | 150 (55.3%) | 43 (10.6%) |
| 3 or more Vehicles | 52 (19.2%) | 0 (0.0%) |
| Total | 271 (100.0%) | 406 (100.0%) |
Real Estate & Mortgages in Cannon Beach
Real Estate and Mortgage Overview in Cannon Beach
| Characteristic | Without Mortgage | With Mortgage |
| Housing Units | 133 | 138 |
| Median Property Value | $625,000 | $684,800 |
| Median Household Income | $80,972 | $54 |
| Monthly Housing Costs | $713 | $40 |
| Real Estate Taxes | $4,750 | $9 |
Property Value by Mortgage Status in Cannon Beach
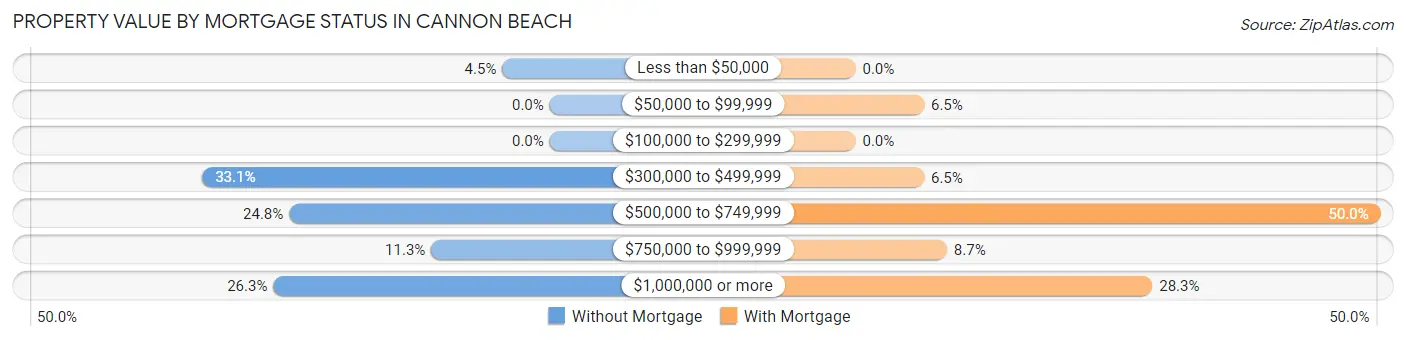
| Property Value | Without Mortgage | With Mortgage |
| Less than $50,000 | 6 (4.5%) | 0 (0.0%) |
| $50,000 to $99,999 | 0 (0.0%) | 9 (6.5%) |
| $100,000 to $299,999 | 0 (0.0%) | 0 (0.0%) |
| $300,000 to $499,999 | 44 (33.1%) | 9 (6.5%) |
| $500,000 to $749,999 | 33 (24.8%) | 69 (50.0%) |
| $750,000 to $999,999 | 15 (11.3%) | 12 (8.7%) |
| $1,000,000 or more | 35 (26.3%) | 39 (28.3%) |
| Total | 133 (100.0%) | 138 (100.0%) |
Household Income by Mortgage Status in Cannon Beach
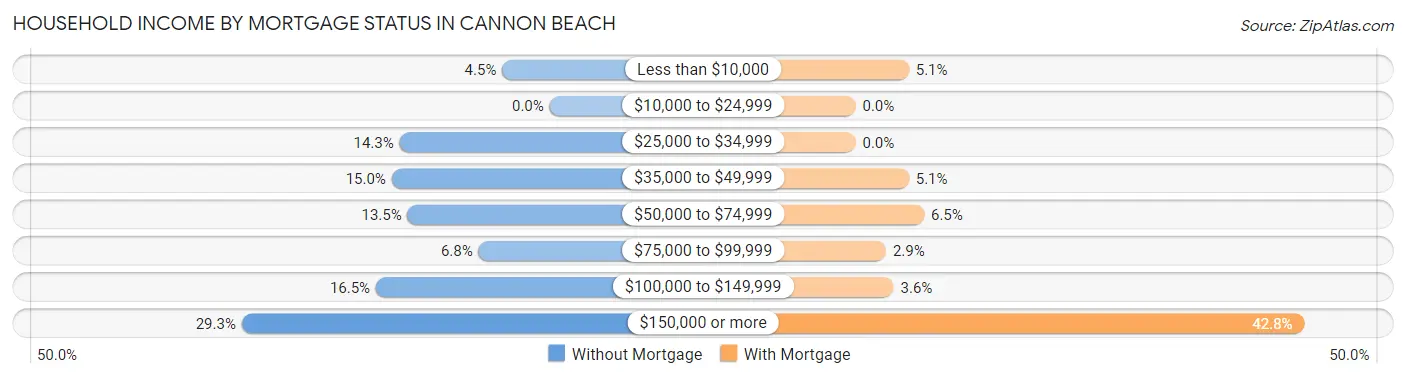
| Household Income | Without Mortgage | With Mortgage |
| Less than $10,000 | 6 (4.5%) | 7 (5.1%) |
| $10,000 to $24,999 | 0 (0.0%) | 0 (0.0%) |
| $25,000 to $34,999 | 19 (14.3%) | 0 (0.0%) |
| $35,000 to $49,999 | 20 (15.0%) | 7 (5.1%) |
| $50,000 to $74,999 | 18 (13.5%) | 9 (6.5%) |
| $75,000 to $99,999 | 9 (6.8%) | 4 (2.9%) |
| $100,000 to $149,999 | 22 (16.5%) | 5 (3.6%) |
| $150,000 or more | 39 (29.3%) | 59 (42.7%) |
| Total | 133 (100.0%) | 138 (100.0%) |
Property Value to Household Income Ratio in Cannon Beach
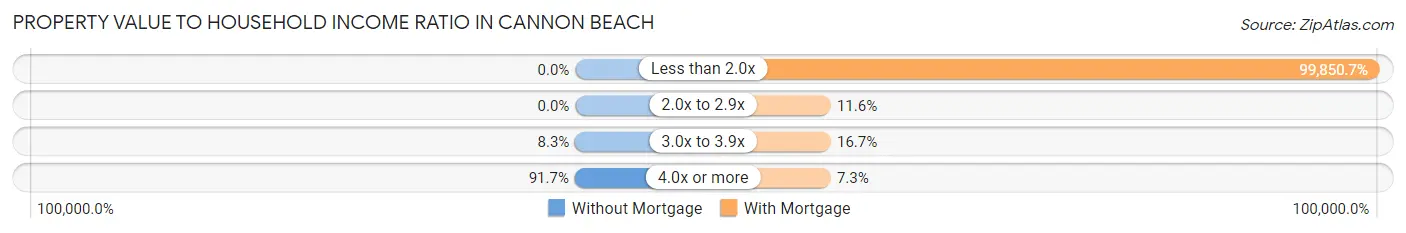
| Value-to-Income Ratio | Without Mortgage | With Mortgage |
| Less than 2.0x | 0 (0.0%) | 137,794 (99,850.7%) |
| 2.0x to 2.9x | 0 (0.0%) | 16 (11.6%) |
| 3.0x to 3.9x | 11 (8.3%) | 23 (16.7%) |
| 4.0x or more | 122 (91.7%) | 10 (7.2%) |
| Total | 133 (100.0%) | 138 (100.0%) |
Real Estate Taxes by Mortgage Status in Cannon Beach
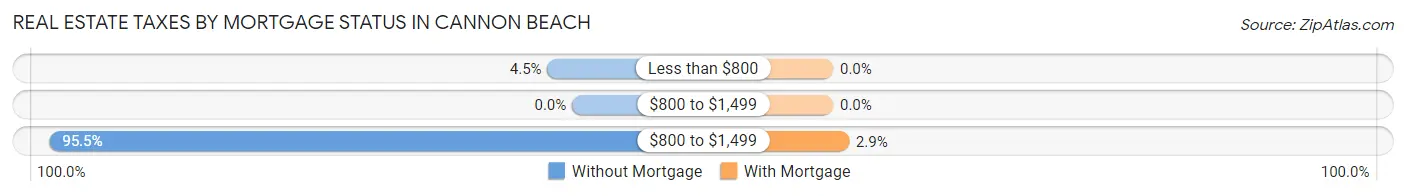
| Property Taxes | Without Mortgage | With Mortgage |
| Less than $800 | 6 (4.5%) | 0 (0.0%) |
| $800 to $1,499 | 0 (0.0%) | 0 (0.0%) |
| $800 to $1,499 | 127 (95.5%) | 4 (2.9%) |
| Total | 133 (100.0%) | 138 (100.0%) |
Health & Disability in Cannon Beach
Health Insurance Coverage by Age in Cannon Beach
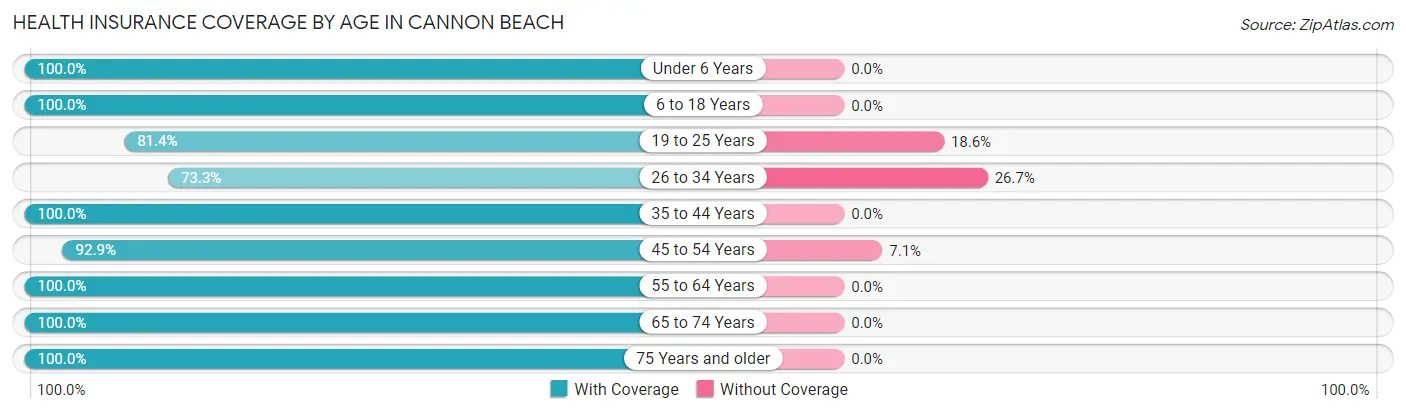
| Age Bracket | With Coverage | Without Coverage |
| Under 6 Years | 68 (100.0%) | 0 (0.0%) |
| 6 to 18 Years | 119 (100.0%) | 0 (0.0%) |
| 19 to 25 Years | 92 (81.4%) | 21 (18.6%) |
| 26 to 34 Years | 63 (73.3%) | 23 (26.7%) |
| 35 to 44 Years | 96 (100.0%) | 0 (0.0%) |
| 45 to 54 Years | 144 (92.9%) | 11 (7.1%) |
| 55 to 64 Years | 290 (100.0%) | 0 (0.0%) |
| 65 to 74 Years | 198 (100.0%) | 0 (0.0%) |
| 75 Years and older | 146 (100.0%) | 0 (0.0%) |
| Total | 1,216 (95.7%) | 55 (4.3%) |
Health Insurance Coverage by Citizenship Status in Cannon Beach
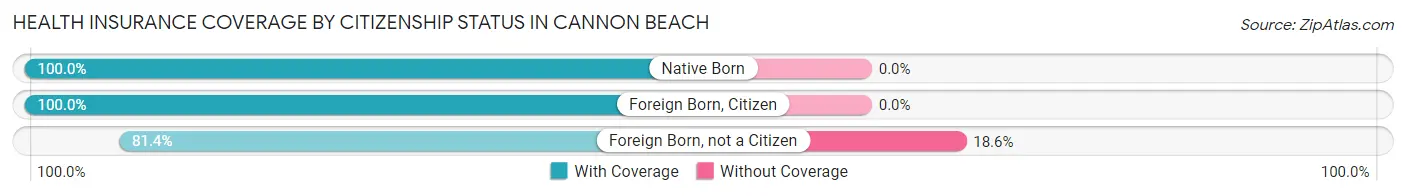
| Citizenship Status | With Coverage | Without Coverage |
| Native Born | 68 (100.0%) | 0 (0.0%) |
| Foreign Born, Citizen | 119 (100.0%) | 0 (0.0%) |
| Foreign Born, not a Citizen | 92 (81.4%) | 21 (18.6%) |
Health Insurance Coverage by Household Income in Cannon Beach
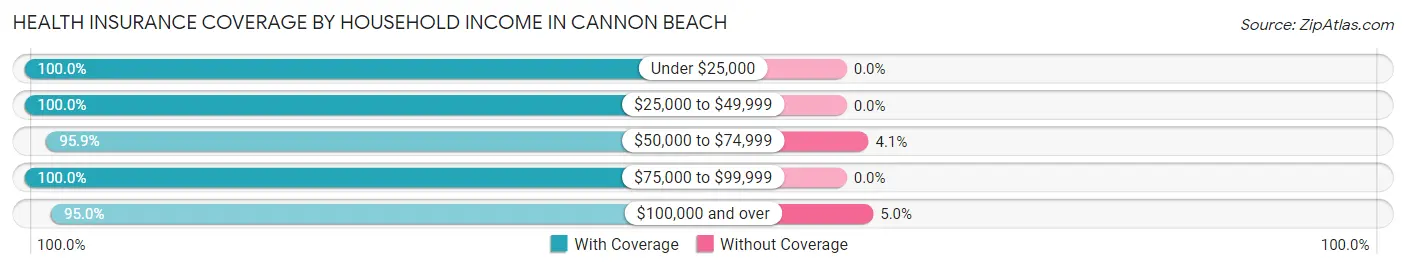
| Household Income | With Coverage | Without Coverage |
| Under $25,000 | 151 (100.0%) | 0 (0.0%) |
| $25,000 to $49,999 | 218 (100.0%) | 0 (0.0%) |
| $50,000 to $74,999 | 259 (95.9%) | 11 (4.1%) |
| $75,000 to $99,999 | 64 (100.0%) | 0 (0.0%) |
| $100,000 and over | 441 (95.0%) | 23 (5.0%) |
Public vs Private Health Insurance Coverage by Age in Cannon Beach
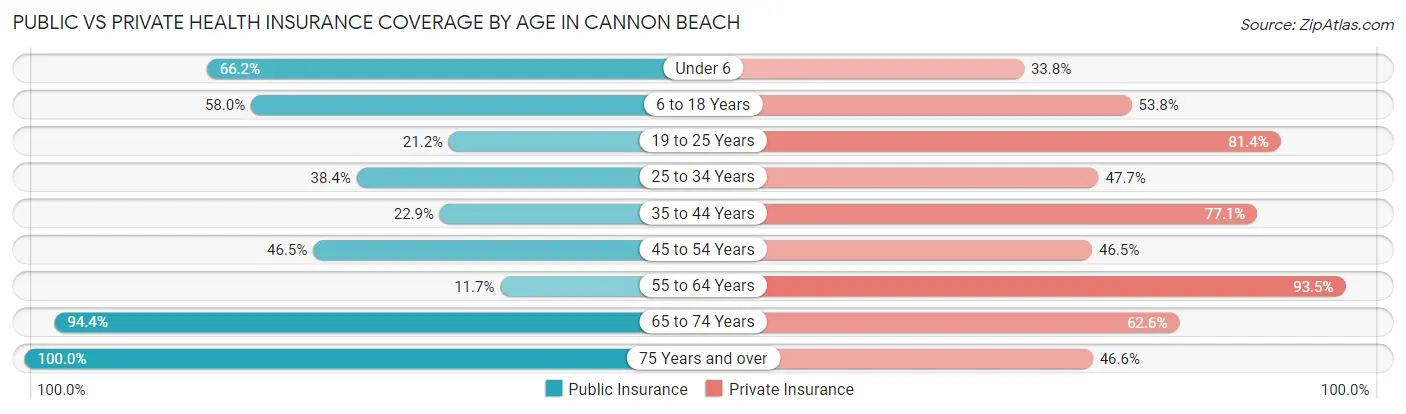
| Age Bracket | Public Insurance | Private Insurance |
| Under 6 | 45 (66.2%) | 23 (33.8%) |
| 6 to 18 Years | 69 (58.0%) | 64 (53.8%) |
| 19 to 25 Years | 24 (21.2%) | 92 (81.4%) |
| 25 to 34 Years | 33 (38.4%) | 41 (47.7%) |
| 35 to 44 Years | 22 (22.9%) | 74 (77.1%) |
| 45 to 54 Years | 72 (46.5%) | 72 (46.5%) |
| 55 to 64 Years | 34 (11.7%) | 271 (93.4%) |
| 65 to 74 Years | 187 (94.4%) | 124 (62.6%) |
| 75 Years and over | 146 (100.0%) | 68 (46.6%) |
| Total | 632 (49.7%) | 829 (65.2%) |
Disability Status by Sex by Age in Cannon Beach
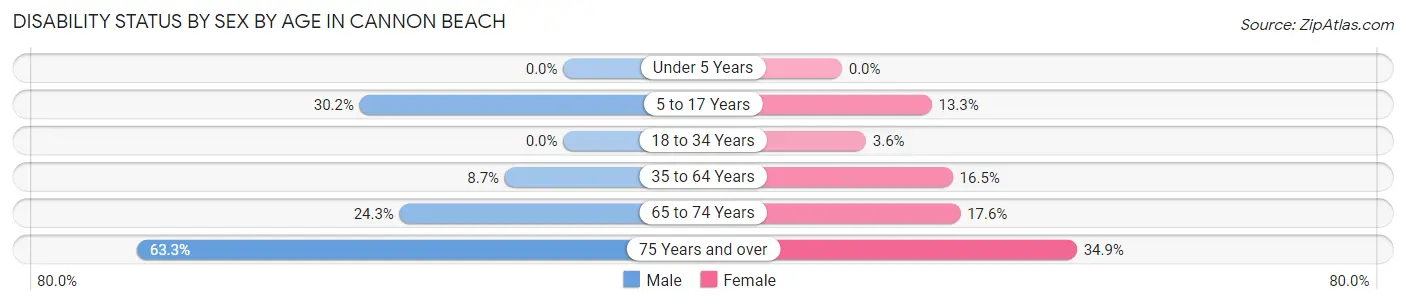
| Age Bracket | Male | Female |
| Under 5 Years | 0 (0.0%) | 0 (0.0%) |
| 5 to 17 Years | 13 (30.2%) | 8 (13.3%) |
| 18 to 34 Years | 0 (0.0%) | 5 (3.6%) |
| 35 to 64 Years | 19 (8.7%) | 53 (16.5%) |
| 65 to 74 Years | 26 (24.3%) | 16 (17.6%) |
| 75 Years and over | 38 (63.3%) | 30 (34.9%) |
Disability Class by Sex by Age in Cannon Beach
Disability Class: Hearing Difficulty
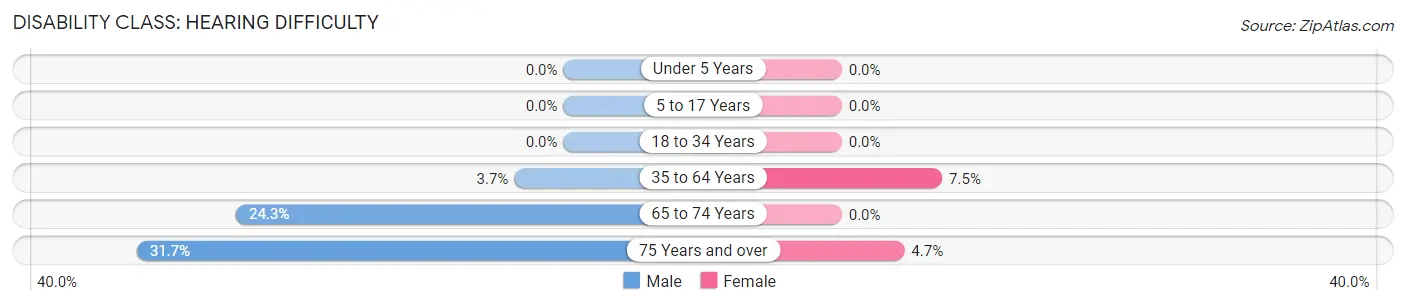
| Age Bracket | Male | Female |
| Under 5 Years | 0 (0.0%) | 0 (0.0%) |
| 5 to 17 Years | 0 (0.0%) | 0 (0.0%) |
| 18 to 34 Years | 0 (0.0%) | 0 (0.0%) |
| 35 to 64 Years | 8 (3.6%) | 24 (7.4%) |
| 65 to 74 Years | 26 (24.3%) | 0 (0.0%) |
| 75 Years and over | 19 (31.7%) | 4 (4.6%) |
Disability Class: Vision Difficulty
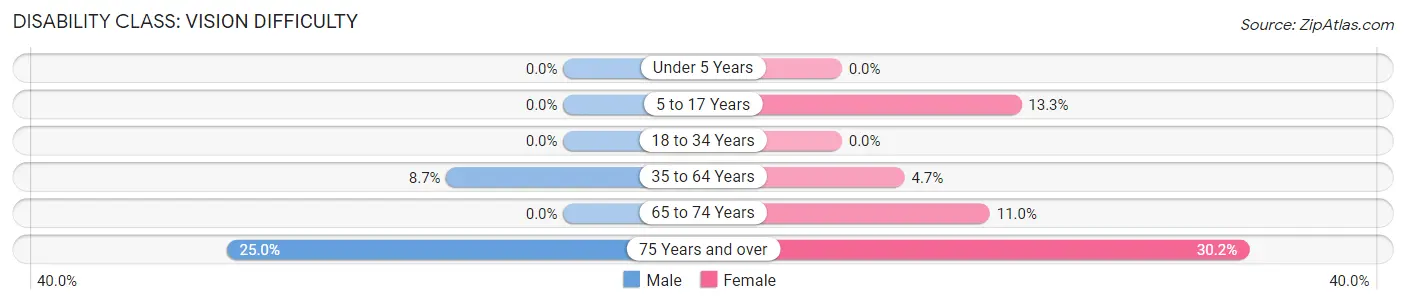
| Age Bracket | Male | Female |
| Under 5 Years | 0 (0.0%) | 0 (0.0%) |
| 5 to 17 Years | 0 (0.0%) | 8 (13.3%) |
| 18 to 34 Years | 0 (0.0%) | 0 (0.0%) |
| 35 to 64 Years | 19 (8.7%) | 15 (4.7%) |
| 65 to 74 Years | 0 (0.0%) | 10 (11.0%) |
| 75 Years and over | 15 (25.0%) | 26 (30.2%) |
Disability Class: Cognitive Difficulty
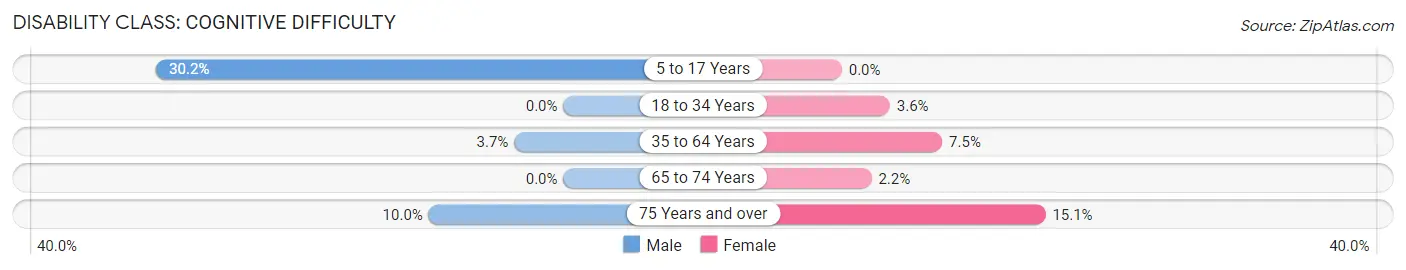
| Age Bracket | Male | Female |
| 5 to 17 Years | 13 (30.2%) | 0 (0.0%) |
| 18 to 34 Years | 0 (0.0%) | 5 (3.6%) |
| 35 to 64 Years | 8 (3.6%) | 24 (7.4%) |
| 65 to 74 Years | 0 (0.0%) | 2 (2.2%) |
| 75 Years and over | 6 (10.0%) | 13 (15.1%) |
Disability Class: Ambulatory Difficulty
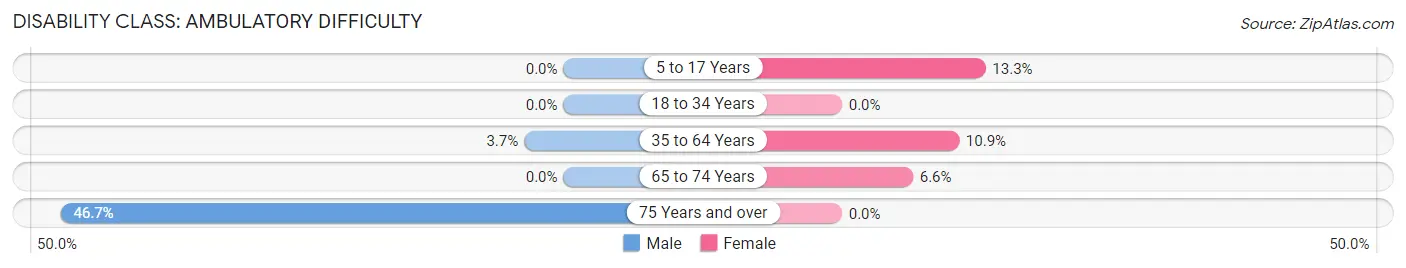
| Age Bracket | Male | Female |
| 5 to 17 Years | 0 (0.0%) | 8 (13.3%) |
| 18 to 34 Years | 0 (0.0%) | 0 (0.0%) |
| 35 to 64 Years | 8 (3.6%) | 35 (10.9%) |
| 65 to 74 Years | 0 (0.0%) | 6 (6.6%) |
| 75 Years and over | 28 (46.7%) | 0 (0.0%) |
Disability Class: Self-Care Difficulty
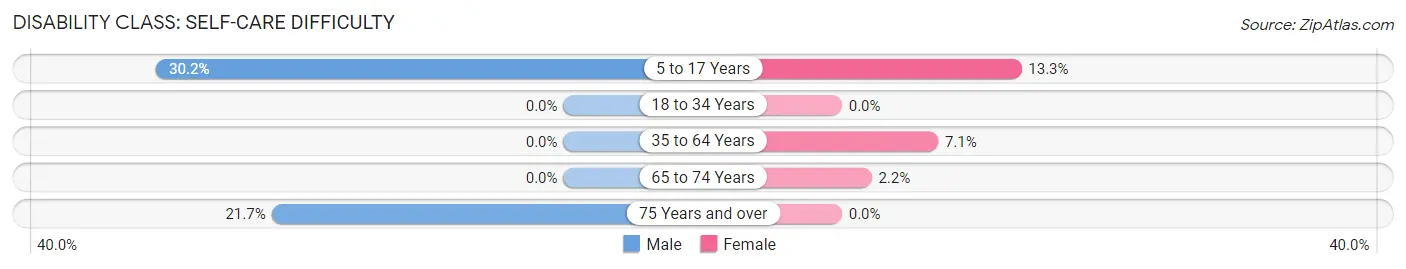
| Age Bracket | Male | Female |
| 5 to 17 Years | 13 (30.2%) | 8 (13.3%) |
| 18 to 34 Years | 0 (0.0%) | 0 (0.0%) |
| 35 to 64 Years | 0 (0.0%) | 23 (7.1%) |
| 65 to 74 Years | 0 (0.0%) | 2 (2.2%) |
| 75 Years and over | 13 (21.7%) | 0 (0.0%) |
Technology Access in Cannon Beach
Computing Device Access in Cannon Beach
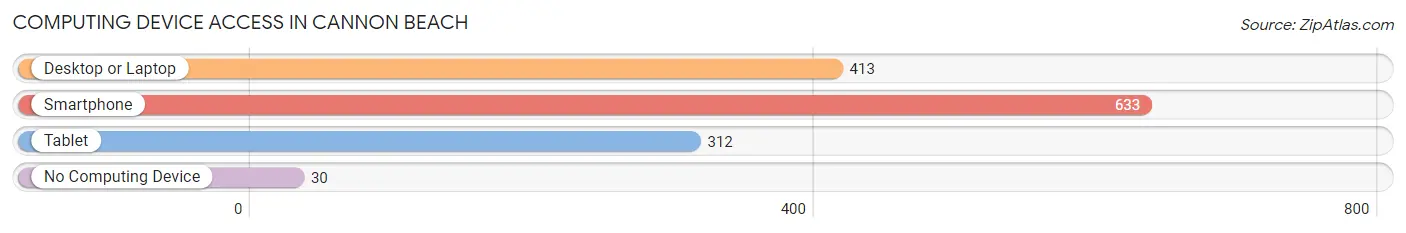
| Device Type | # Households | % Households |
| Desktop or Laptop | 413 | 61.0% |
| Smartphone | 633 | 93.5% |
| Tablet | 312 | 46.1% |
| No Computing Device | 30 | 4.4% |
| Total | 677 | 100.0% |
Internet Access in Cannon Beach
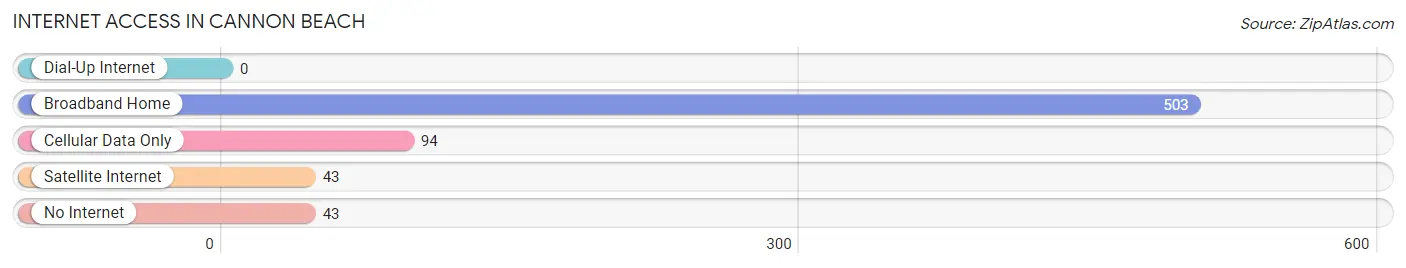
| Internet Type | # Households | % Households |
| Dial-Up Internet | 0 | 0.0% |
| Broadband Home | 503 | 74.3% |
| Cellular Data Only | 94 | 13.9% |
| Satellite Internet | 43 | 6.4% |
| No Internet | 43 | 6.4% |
| Total | 677 | 100.0% |
Cannon Beach Summary
Cannon Beach is a small city located in Clatsop County, Oregon, United States. It is situated on the Pacific Ocean, approximately 80 miles (130 km) west of Portland. The city is known for its beautiful beaches, stunning scenery, and its quaint downtown area.
History
The area that is now Cannon Beach was first inhabited by the Clatsop people, who lived in the area for thousands of years before the arrival of European settlers. The first European settlers arrived in the area in the early 1800s, and the town was officially founded in 1846. The town was named after a nearby cannon that had been placed there by the U.S. Army in 1846 to protect the area from Native American attacks.
In the late 1800s, the town began to grow as a popular tourist destination. The first hotel was built in 1891, and the town was incorporated in 1913. The town continued to grow throughout the 20th century, and today it is a popular destination for tourists from all over the world.
Geography
Cannon Beach is located in Clatsop County, Oregon, on the Pacific Ocean. The city is situated on a peninsula, with the ocean to the west and the Necanicum River to the east. The city is surrounded by the Ecola State Park to the north and the Oswald West State Park to the south. The city is approximately 80 miles (130 km) west of Portland.
The city has a total area of 2.2 square miles (5.7 km2), all of which is land. The city has a mild climate, with temperatures ranging from the mid-30s in the winter to the mid-70s in the summer.
Economy
Cannon Beach’s economy is largely based on tourism. The city is home to a variety of hotels, restaurants, and shops, as well as a number of art galleries and museums. The city is also home to a number of businesses that cater to tourists, such as kayak and whale watching tours.
The city is also home to a number of businesses that provide services to the local community, such as medical and dental offices, banks, and grocery stores. The city is also home to a number of manufacturing and technology companies.
Demographics
As of the 2010 census, the population of Cannon Beach was 1,690. The racial makeup of the city was 94.3% White, 0.7% African American, 0.7% Native American, 0.7% Asian, 0.1% Pacific Islander, 0.7% from other races, and 2.6% from two or more races. Hispanic or Latino of any race were 2.6% of the population.
The median income for a household in the city was $50,938, and the median income for a family was $60,000. The per capita income for the city was $30,938. About 8.3% of families and 11.3% of the population were below the poverty line, including 16.7% of those under age 18 and 4.3% of those age 65 or over.
Common Questions
What is Per Capita Income in Cannon Beach?
Per Capita income in Cannon Beach is $50,204.
What is the Median Family Income in Cannon Beach?
Median Family Income in Cannon Beach is $110,893.
What is the Median Household income in Cannon Beach?
Median Household Income in Cannon Beach is $63,509.
What is Inequality or Gini Index in Cannon Beach?
Inequality or Gini Index in Cannon Beach is 0.50.
What is the Total Population of Cannon Beach?
Total Population of Cannon Beach is 1,271.
What is the Total Male Population of Cannon Beach?
Total Male Population of Cannon Beach is 565.
What is the Total Female Population of Cannon Beach?
Total Female Population of Cannon Beach is 706.
What is the Ratio of Males per 100 Females in Cannon Beach?
There are 80.03 Males per 100 Females in Cannon Beach.
What is the Ratio of Females per 100 Males in Cannon Beach?
There are 124.96 Females per 100 Males in Cannon Beach.
What is the Median Population Age in Cannon Beach?
Median Population Age in Cannon Beach is 55.0 Years.
What is the Average Family Size in Cannon Beach
Average Family Size in Cannon Beach is 2.9 People.
What is the Average Household Size in Cannon Beach
Average Household Size in Cannon Beach is 1.7 People.
How Large is the Labor Force in Cannon Beach?
There are 717 People in the Labor Forcein in Cannon Beach.
What is the Percentage of People in the Labor Force in Cannon Beach?
64.4% of People are in the Labor Force in Cannon Beach.
What is the Unemployment Rate in Cannon Beach?
Unemployment Rate in Cannon Beach is 1.7%.