North Bend, OR Map & Demographics
North Bend Map
North Bend Overview
$40,699
PER CAPITA INCOME
$90,192
AVG FAMILY INCOME
$67,841
AVG HOUSEHOLD INCOME
9.7%
WAGE / INCOME GAP [ % ]
90.3¢/ $1
WAGE / INCOME GAP [ $ ]
0.47
INEQUALITY / GINI INDEX
10,250
TOTAL POPULATION
5,162
MALE POPULATION
5,088
FEMALE POPULATION
101.45
MALES / 100 FEMALES
98.57
FEMALES / 100 MALES
48.9
MEDIAN AGE
2.8
AVG FAMILY SIZE
2.3
AVG HOUSEHOLD SIZE
5,283
LABOR FORCE [ PEOPLE ]
60.5%
PERCENT IN LABOR FORCE
7.8%
UNEMPLOYMENT RATE
North Bend Zip Codes
North Bend Area Codes
Income in North Bend
Income Overview in North Bend
Per Capita Income in North Bend is $40,699, while median incomes of families and households are $90,192 and $67,841 respectively.
| Characteristic | Number | Measure |
| Per Capita Income | 10,250 | $40,699 |
| Median Family Income | 2,818 | $90,192 |
| Mean Family Income | 2,818 | $108,433 |
| Median Household Income | 4,304 | $67,841 |
| Mean Household Income | 4,304 | $94,546 |
| Income Deficit | 2,818 | $0 |
| Wage / Income Gap (%) | 10,250 | 9.72% |
| Wage / Income Gap ($) | 10,250 | 90.28¢ per $1 |
| Gini / Inequality Index | 10,250 | 0.47 |
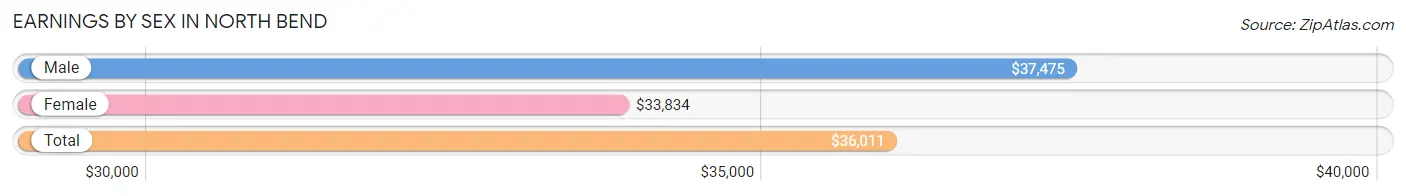
Earnings by Sex in North Bend
Average Earnings in North Bend are $36,011, $37,475 for men and $33,834 for women, a difference of 9.7%.
| Sex | Number | Average Earnings |
| Male | 2,781 (51.4%) | $37,475 |
| Female | 2,629 (48.6%) | $33,834 |
| Total | 5,410 (100.0%) | $36,011 |
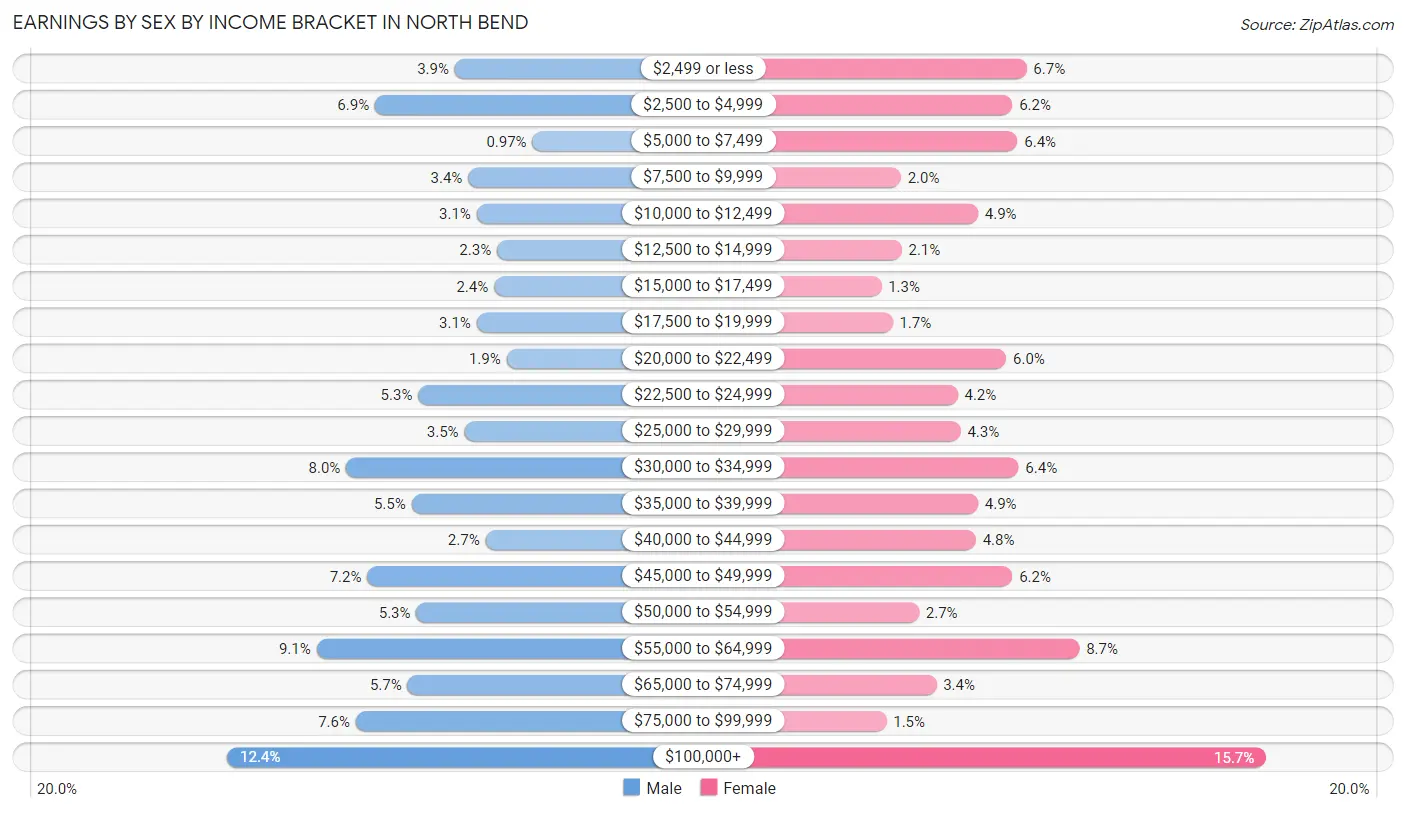
Earnings by Sex by Income Bracket in North Bend
The most common earnings brackets in North Bend are $100,000+ for men (345 | 12.4%) and $100,000+ for women (413 | 15.7%).
| Income | Male | Female |
| $2,499 or less | 108 (3.9%) | 177 (6.7%) |
| $2,500 to $4,999 | 191 (6.9%) | 163 (6.2%) |
| $5,000 to $7,499 | 27 (1.0%) | 168 (6.4%) |
| $7,500 to $9,999 | 94 (3.4%) | 53 (2.0%) |
| $10,000 to $12,499 | 85 (3.1%) | 129 (4.9%) |
| $12,500 to $14,999 | 64 (2.3%) | 54 (2.1%) |
| $15,000 to $17,499 | 67 (2.4%) | 34 (1.3%) |
| $17,500 to $19,999 | 85 (3.1%) | 45 (1.7%) |
| $20,000 to $22,499 | 54 (1.9%) | 157 (6.0%) |
| $22,500 to $24,999 | 146 (5.2%) | 109 (4.2%) |
| $25,000 to $29,999 | 98 (3.5%) | 112 (4.3%) |
| $30,000 to $34,999 | 221 (8.0%) | 169 (6.4%) |
| $35,000 to $39,999 | 153 (5.5%) | 129 (4.9%) |
| $40,000 to $44,999 | 76 (2.7%) | 127 (4.8%) |
| $45,000 to $49,999 | 199 (7.2%) | 163 (6.2%) |
| $50,000 to $54,999 | 148 (5.3%) | 71 (2.7%) |
| $55,000 to $64,999 | 252 (9.1%) | 229 (8.7%) |
| $65,000 to $74,999 | 157 (5.7%) | 88 (3.4%) |
| $75,000 to $99,999 | 211 (7.6%) | 39 (1.5%) |
| $100,000+ | 345 (12.4%) | 413 (15.7%) |
| Total | 2,781 (100.0%) | 2,629 (100.0%) |
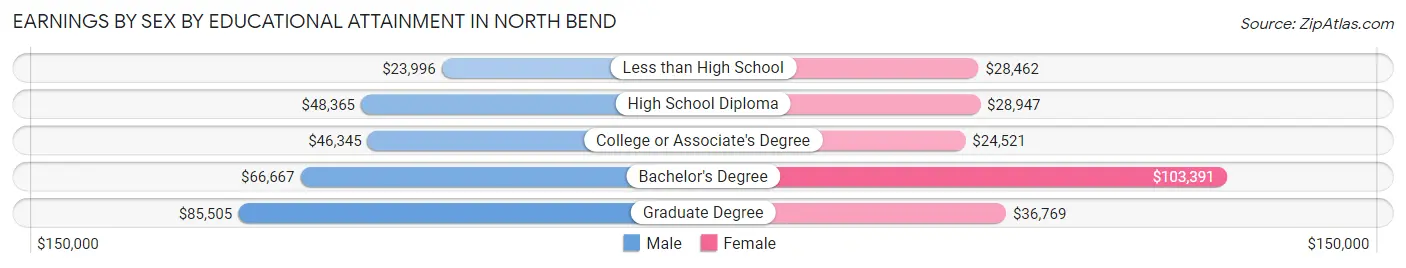
Earnings by Sex by Educational Attainment in North Bend
Average earnings in North Bend are $48,146 for men and $37,289 for women, a difference of 22.6%. Men with an educational attainment of graduate degree enjoy the highest average annual earnings of $85,505, while those with less than high school education earn the least with $23,996. Women with an educational attainment of bachelor's degree earn the most with the average annual earnings of $103,391, while those with college or associate's degree education have the smallest earnings of $24,521.
| Educational Attainment | Male Income | Female Income |
| Less than High School | $23,996 | $28,462 |
| High School Diploma | $48,365 | $28,947 |
| College or Associate's Degree | $46,345 | $24,521 |
| Bachelor's Degree | $66,667 | $103,391 |
| Graduate Degree | $85,505 | $36,769 |
| Total | $48,146 | $37,289 |
Family Income in North Bend
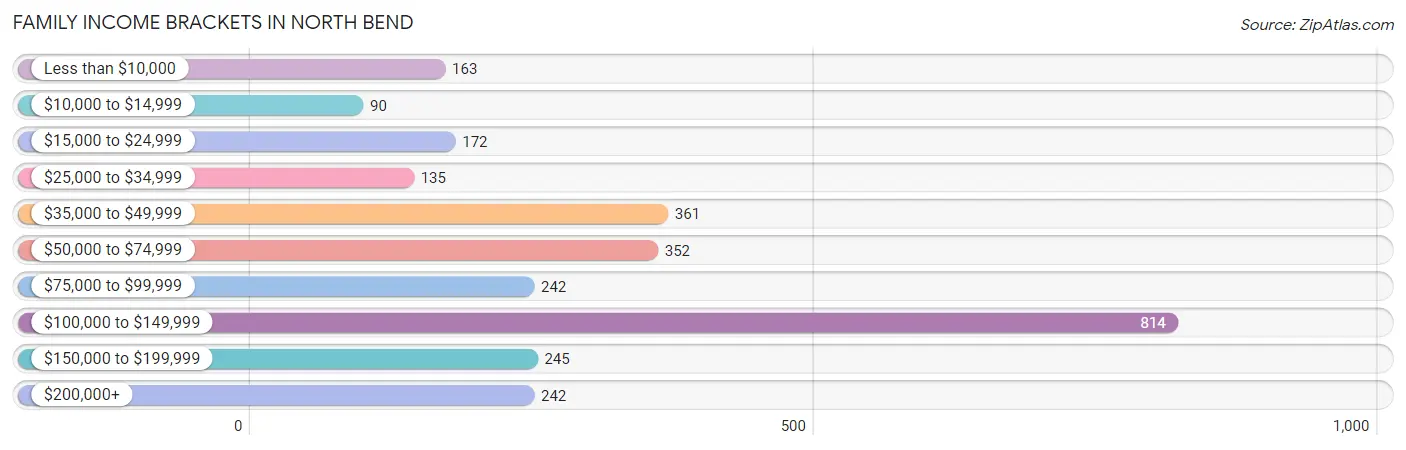
Family Income Brackets in North Bend
According to the North Bend family income data, there are 814 families falling into the $100,000 to $149,999 income range, which is the most common income bracket and makes up 28.9% of all families. Conversely, the $10,000 to $14,999 income bracket is the least frequent group with only 90 families (3.2%) belonging to this category.
| Income Bracket | # Families | % Families |
| Less than $10,000 | 163 | 5.8% |
| $10,000 to $14,999 | 90 | 3.2% |
| $15,000 to $24,999 | 172 | 6.1% |
| $25,000 to $34,999 | 135 | 4.8% |
| $35,000 to $49,999 | 361 | 12.8% |
| $50,000 to $74,999 | 352 | 12.5% |
| $75,000 to $99,999 | 242 | 8.6% |
| $100,000 to $149,999 | 814 | 28.9% |
| $150,000 to $199,999 | 245 | 8.7% |
| $200,000+ | 242 | 8.6% |
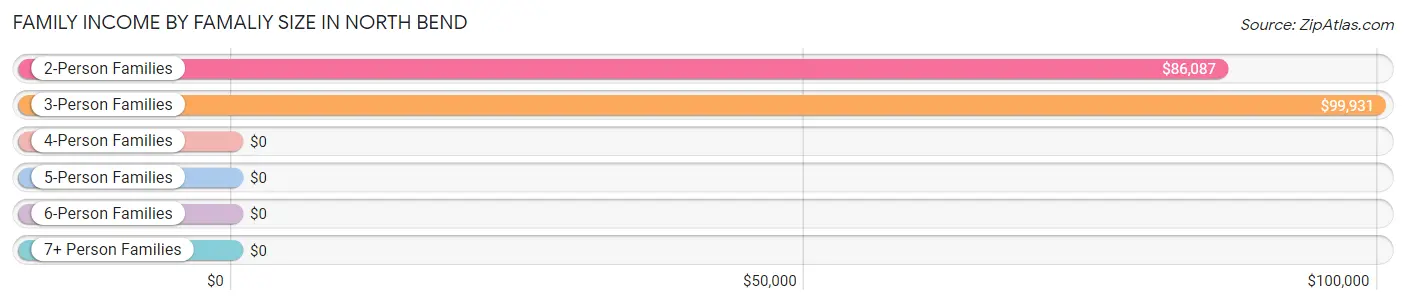
Family Income by Famaliy Size in North Bend
3-person families (551 | 19.6%) account for the highest median family income in North Bend with $99,931 per family, while 2-person families (1,682 | 59.7%) have the highest median income of $43,044 per family member.
| Income Bracket | # Families | Median Income |
| 2-Person Families | 1,682 (59.7%) | $86,087 |
| 3-Person Families | 551 (19.6%) | $99,931 |
| 4-Person Families | 320 (11.4%) | $0 |
| 5-Person Families | 222 (7.9%) | $0 |
| 6-Person Families | 17 (0.6%) | $0 |
| 7+ Person Families | 26 (0.9%) | $0 |
| Total | 2,818 (100.0%) | $90,192 |
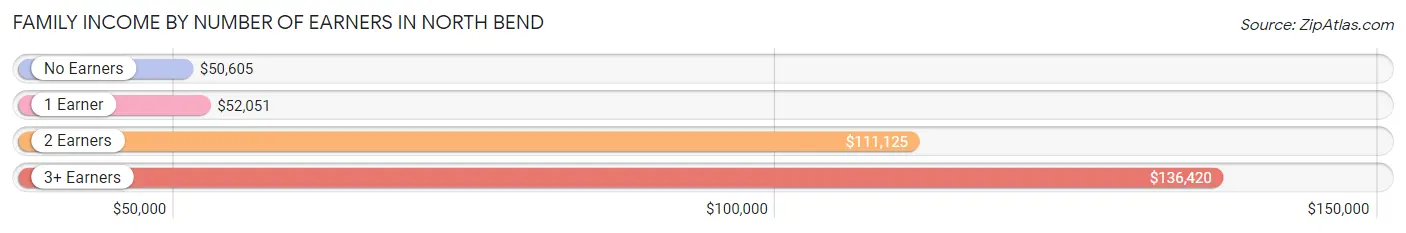
Family Income by Number of Earners in North Bend
The median family income in North Bend is $90,192, with families comprising 3+ earners (255) having the highest median family income of $136,420, while families with no earners (551) have the lowest median family income of $50,605, accounting for 9.0% and 19.6% of families, respectively.
| Number of Earners | # Families | Median Income |
| No Earners | 551 (19.6%) | $50,605 |
| 1 Earner | 1,165 (41.3%) | $52,051 |
| 2 Earners | 847 (30.1%) | $111,125 |
| 3+ Earners | 255 (9.0%) | $136,420 |
| Total | 2,818 (100.0%) | $90,192 |
Household Income in North Bend
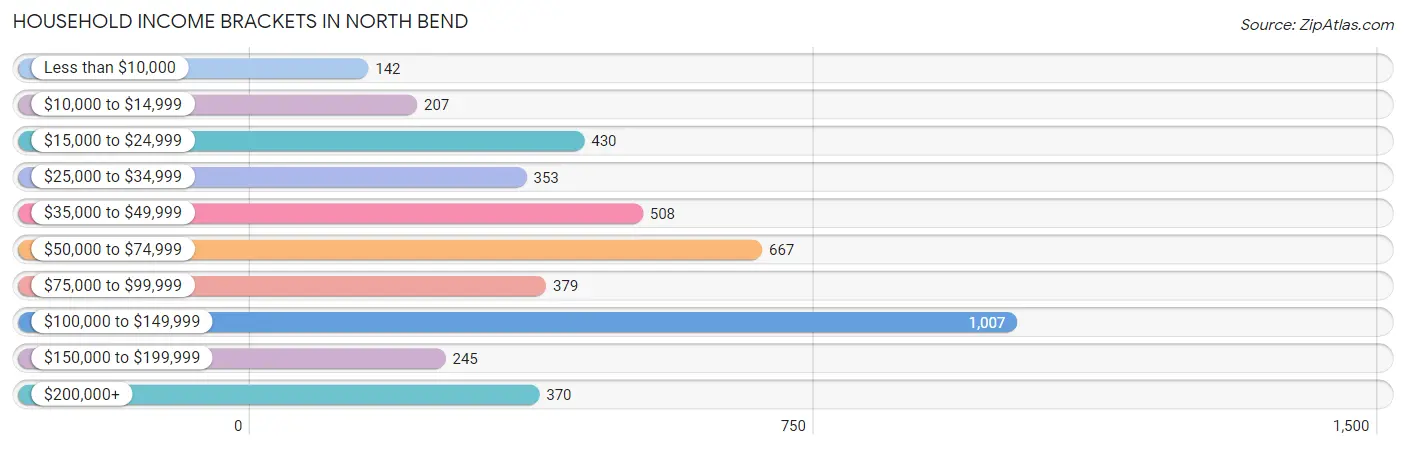
Household Income Brackets in North Bend
With 1,007 households falling in the category, the $100,000 to $149,999 income range is the most frequent in North Bend, accounting for 23.4% of all households. In contrast, only 142 households (3.3%) fall into the less than $10,000 income bracket, making it the least populous group.
| Income Bracket | # Households | % Households |
| Less than $10,000 | 142 | 3.3% |
| $10,000 to $14,999 | 207 | 4.8% |
| $15,000 to $24,999 | 430 | 10.0% |
| $25,000 to $34,999 | 353 | 8.2% |
| $35,000 to $49,999 | 508 | 11.8% |
| $50,000 to $74,999 | 667 | 15.5% |
| $75,000 to $99,999 | 379 | 8.8% |
| $100,000 to $149,999 | 1,007 | 23.4% |
| $150,000 to $199,999 | 245 | 5.7% |
| $200,000+ | 370 | 8.6% |
Household Income by Householder Age in North Bend
The median household income in North Bend is $67,841, with the highest median household income of $98,715 found in the 45 to 64 years age bracket for the primary householder. A total of 1,511 households (35.1%) fall into this category. Meanwhile, the 15 to 24 years age bracket for the primary householder has the lowest median household income of $0, with 162 households (3.8%) in this group.
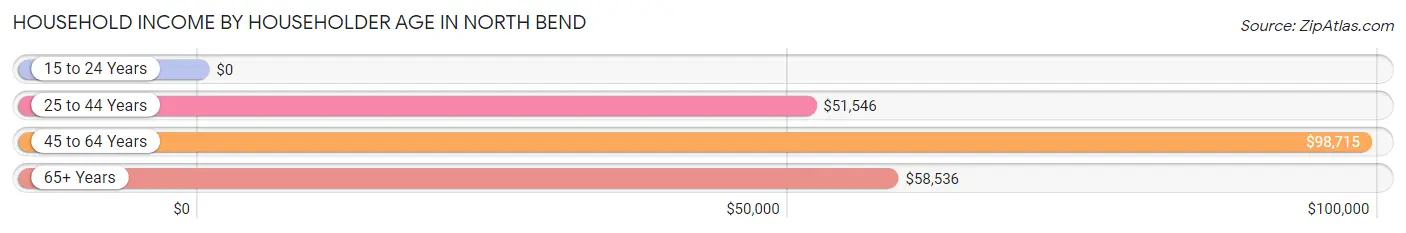
| Income Bracket | # Households | Median Income |
| 15 to 24 Years | 162 (3.8%) | $0 |
| 25 to 44 Years | 1,010 (23.5%) | $51,546 |
| 45 to 64 Years | 1,511 (35.1%) | $98,715 |
| 65+ Years | 1,621 (37.7%) | $58,536 |
| Total | 4,304 (100.0%) | $67,841 |
Poverty in North Bend
Income Below Poverty by Sex and Age in North Bend
With 15.8% poverty level for males and 16.4% for females among the residents of North Bend, 5 year old males and 35 to 44 year old females are the most vulnerable to poverty, with 108 males (60.7%) and 204 females (40.9%) in their respective age groups living below the poverty level.
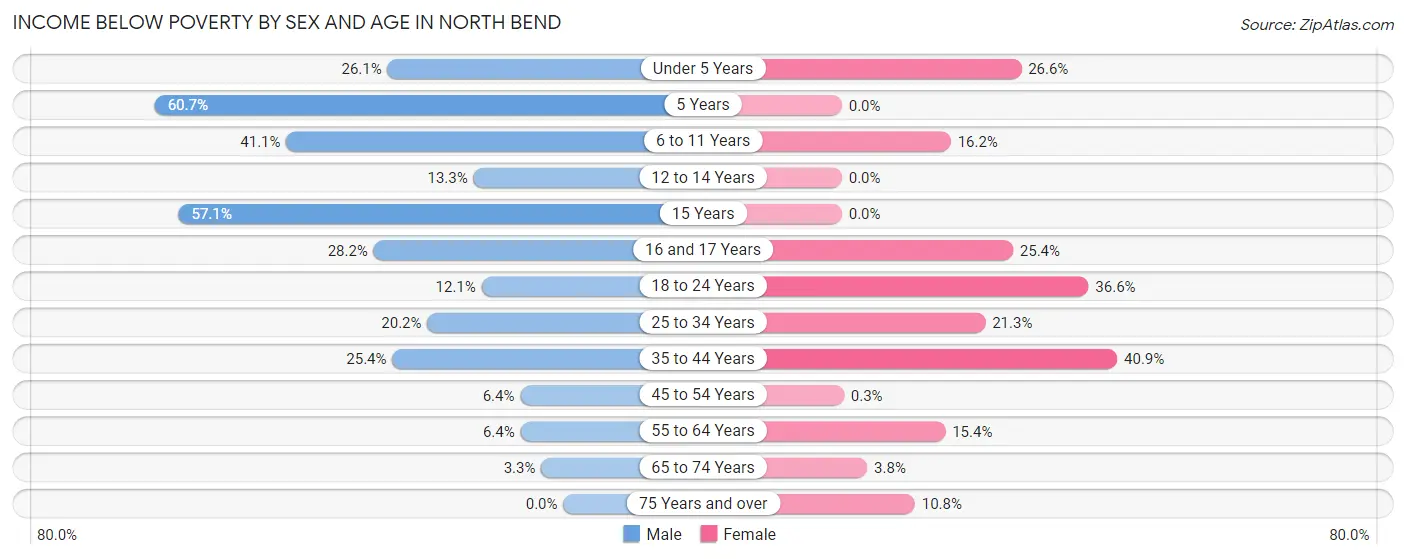
| Age Bracket | Male | Female |
| Under 5 Years | 47 (26.1%) | 69 (26.6%) |
| 5 Years | 108 (60.7%) | 0 (0.0%) |
| 6 to 11 Years | 116 (41.1%) | 43 (16.2%) |
| 12 to 14 Years | 22 (13.3%) | 0 (0.0%) |
| 15 Years | 32 (57.1%) | 0 (0.0%) |
| 16 and 17 Years | 87 (28.2%) | 32 (25.4%) |
| 18 to 24 Years | 38 (12.1%) | 145 (36.6%) |
| 25 to 34 Years | 84 (20.2%) | 128 (21.3%) |
| 35 to 44 Years | 147 (25.4%) | 204 (40.9%) |
| 45 to 54 Years | 43 (6.4%) | 2 (0.3%) |
| 55 to 64 Years | 55 (6.4%) | 116 (15.4%) |
| 65 to 74 Years | 25 (3.3%) | 34 (3.8%) |
| 75 Years and over | 0 (0.0%) | 53 (10.8%) |
| Total | 804 (15.8%) | 826 (16.4%) |
Income Above Poverty by Sex and Age in North Bend
According to the poverty statistics in North Bend, males aged 75 years and over and females aged 5 years are the age groups that are most secure financially, with 100.0% of males and 100.0% of females in these age groups living above the poverty line.
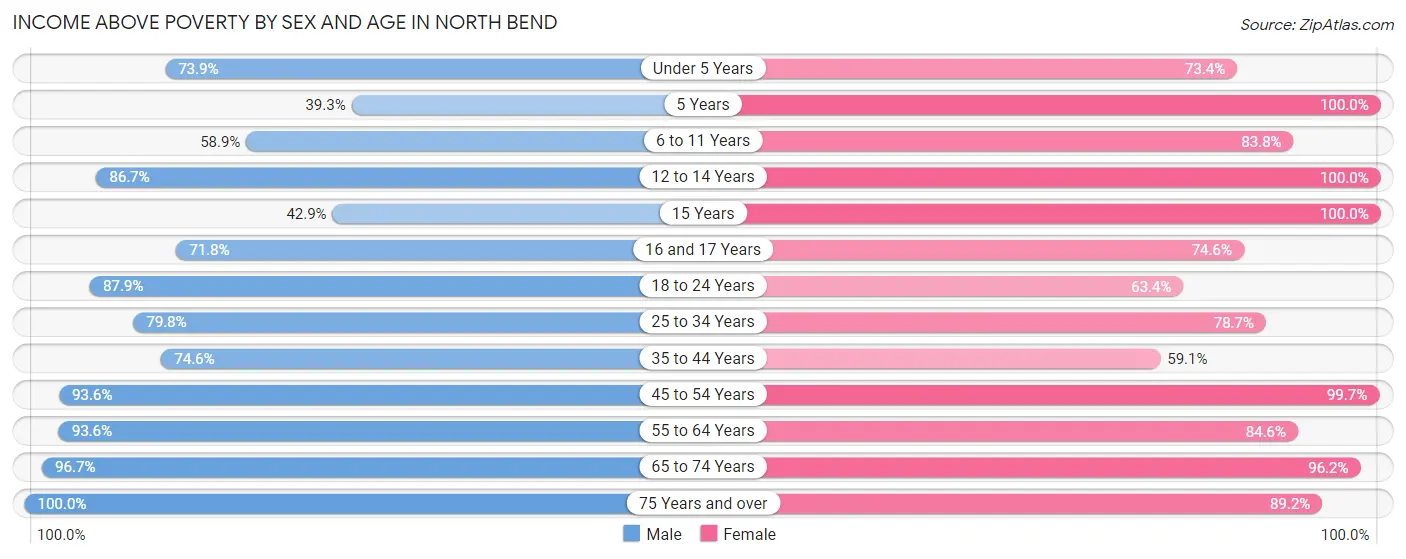
| Age Bracket | Male | Female |
| Under 5 Years | 133 (73.9%) | 190 (73.4%) |
| 5 Years | 70 (39.3%) | 1 (100.0%) |
| 6 to 11 Years | 166 (58.9%) | 223 (83.8%) |
| 12 to 14 Years | 143 (86.7%) | 54 (100.0%) |
| 15 Years | 24 (42.9%) | 25 (100.0%) |
| 16 and 17 Years | 222 (71.8%) | 94 (74.6%) |
| 18 to 24 Years | 275 (87.9%) | 251 (63.4%) |
| 25 to 34 Years | 332 (79.8%) | 473 (78.7%) |
| 35 to 44 Years | 432 (74.6%) | 295 (59.1%) |
| 45 to 54 Years | 630 (93.6%) | 670 (99.7%) |
| 55 to 64 Years | 810 (93.6%) | 639 (84.6%) |
| 65 to 74 Years | 739 (96.7%) | 868 (96.2%) |
| 75 Years and over | 304 (100.0%) | 436 (89.2%) |
| Total | 4,280 (84.2%) | 4,219 (83.6%) |
Income Below Poverty Among Married-Couple Families in North Bend
The poverty statistics for married-couple families in North Bend show that 8.5% or 183 of the total 2,158 families live below the poverty line. Families with 3 or 4 children have the highest poverty rate of 57.1%, comprising of 36 families. On the other hand, families with 5 or more children have the lowest poverty rate of 0.0%, which includes 0 families.
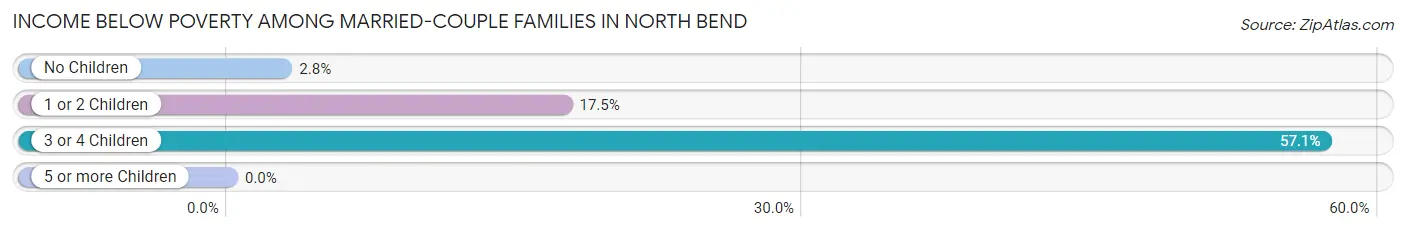
| Children | Above Poverty | Below Poverty |
| No Children | 1,437 (97.2%) | 42 (2.8%) |
| 1 or 2 Children | 496 (82.5%) | 105 (17.5%) |
| 3 or 4 Children | 27 (42.9%) | 36 (57.1%) |
| 5 or more Children | 15 (100.0%) | 0 (0.0%) |
| Total | 1,975 (91.5%) | 183 (8.5%) |
Income Below Poverty Among Single-Parent Households in North Bend
According to the poverty data in North Bend, 9.9% or 9 single-father households and 50.6% or 288 single-mother households are living below the poverty line. Among single-father households, those with 1 or 2 children have the highest poverty rate, with 9 households (16.4%) experiencing poverty. Likewise, among single-mother households, those with 1 or 2 children have the highest poverty rate, with 272 households (63.8%) falling below the poverty line.
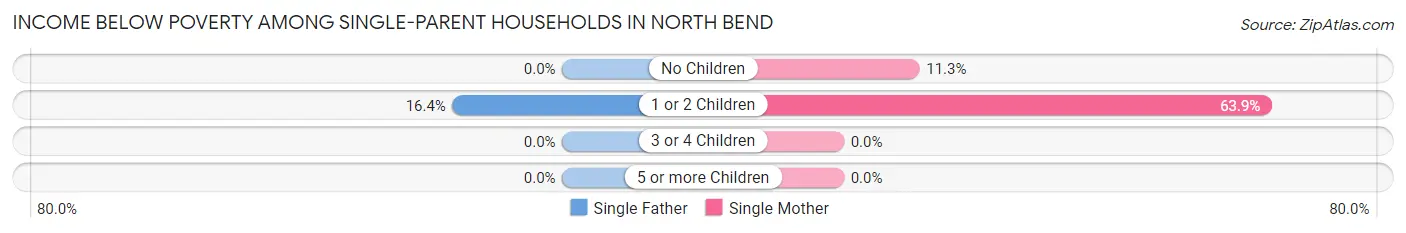
| Children | Single Father | Single Mother |
| No Children | 0 (0.0%) | 16 (11.3%) |
| 1 or 2 Children | 9 (16.4%) | 272 (63.8%) |
| 3 or 4 Children | 0 (0.0%) | 0 (0.0%) |
| 5 or more Children | 0 (0.0%) | 0 (0.0%) |
| Total | 9 (9.9%) | 288 (50.6%) |
Income Below Poverty Among Married-Couple vs Single-Parent Households in North Bend
The poverty data for North Bend shows that 183 of the married-couple family households (8.5%) and 297 of the single-parent households (45.0%) are living below the poverty level. Within the married-couple family households, those with 3 or 4 children have the highest poverty rate, with 36 households (57.1%) falling below the poverty line. Among the single-parent households, those with 1 or 2 children have the highest poverty rate, with 281 household (58.4%) living below poverty.
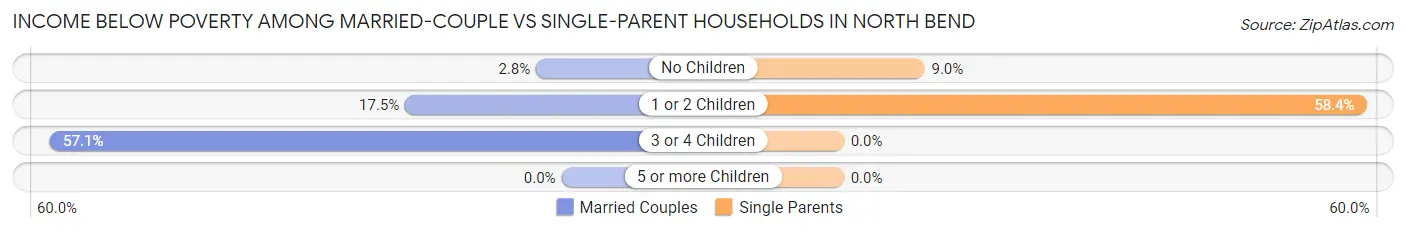
| Children | Married-Couple Families | Single-Parent Households |
| No Children | 42 (2.8%) | 16 (9.0%) |
| 1 or 2 Children | 105 (17.5%) | 281 (58.4%) |
| 3 or 4 Children | 36 (57.1%) | 0 (0.0%) |
| 5 or more Children | 0 (0.0%) | 0 (0.0%) |
| Total | 183 (8.5%) | 297 (45.0%) |
Race in North Bend
The most populous races in North Bend are White / Caucasian (8,299 | 81.0%), Two or more Races (990 | 9.7%), and Hispanic or Latino (741 | 7.2%).
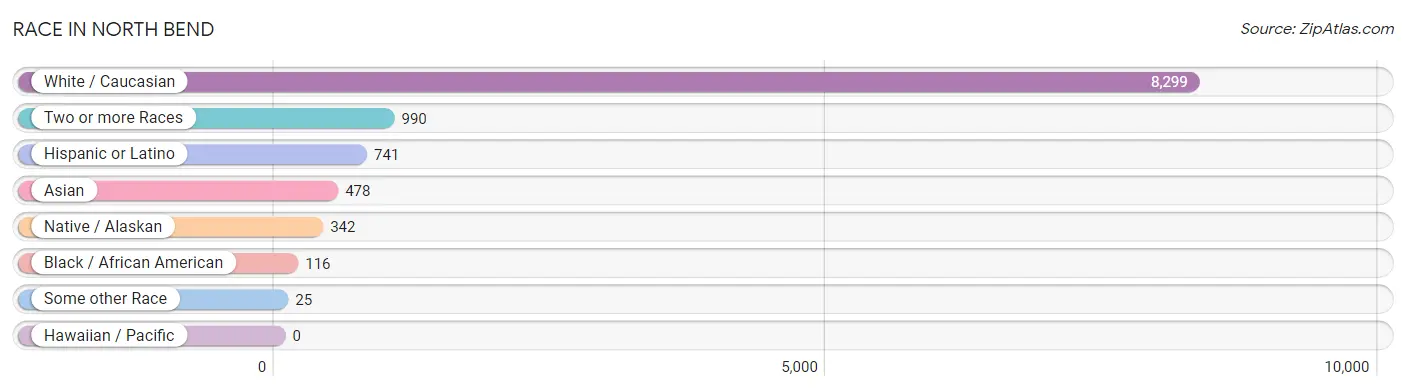
| Race | # Population | % Population |
| Asian | 478 | 4.7% |
| Black / African American | 116 | 1.1% |
| Hawaiian / Pacific | 0 | 0.0% |
| Hispanic or Latino | 741 | 7.2% |
| Native / Alaskan | 342 | 3.3% |
| White / Caucasian | 8,299 | 81.0% |
| Two or more Races | 990 | 9.7% |
| Some other Race | 25 | 0.2% |
| Total | 10,250 | 100.0% |
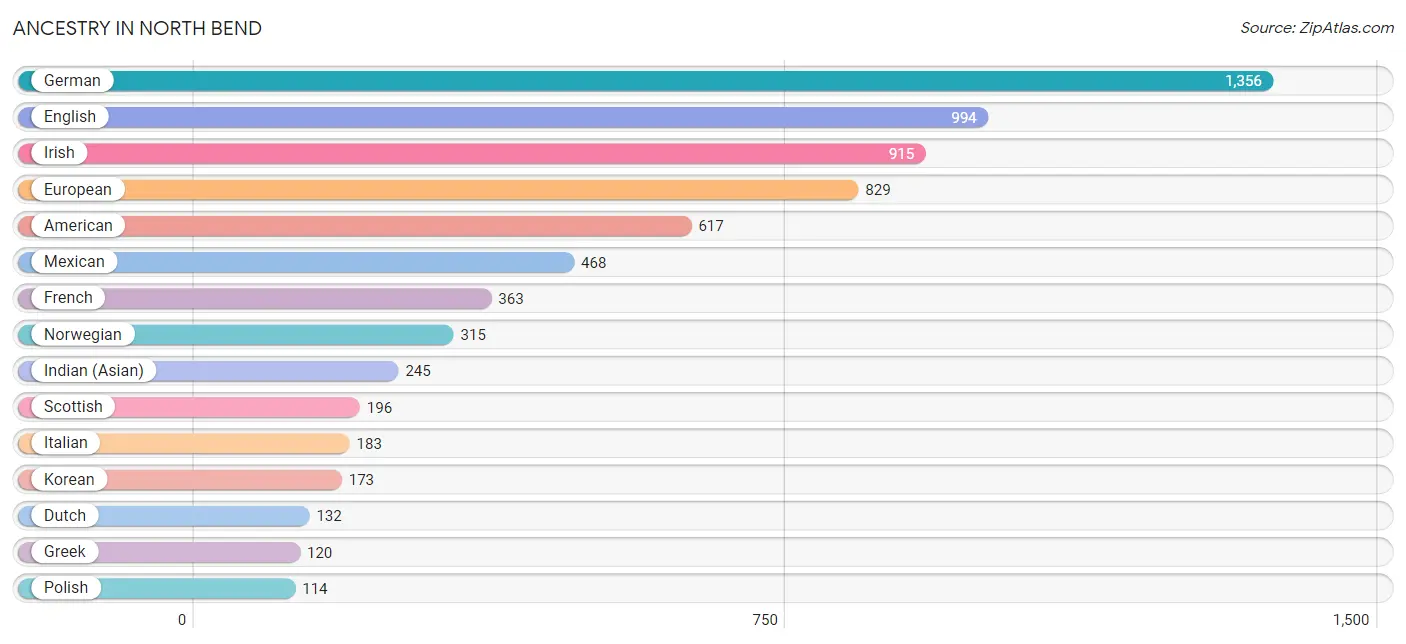
Ancestry in North Bend
The most populous ancestries reported in North Bend are German (1,356 | 13.2%), English (994 | 9.7%), Irish (915 | 8.9%), European (829 | 8.1%), and American (617 | 6.0%), together accounting for 46.0% of all North Bend residents.
| Ancestry | # Population | % Population |
| African | 7 | 0.1% |
| American | 617 | 6.0% |
| Arab | 11 | 0.1% |
| Armenian | 13 | 0.1% |
| Bhutanese | 13 | 0.1% |
| Blackfeet | 26 | 0.3% |
| British | 65 | 0.6% |
| Bulgarian | 29 | 0.3% |
| Burmese | 29 | 0.3% |
| Canadian | 26 | 0.3% |
| Central American | 42 | 0.4% |
| Cherokee | 41 | 0.4% |
| Chilean | 11 | 0.1% |
| Chinese | 18 | 0.2% |
| Choctaw | 66 | 0.6% |
| Colombian | 1 | 0.0% |
| Cuban | 22 | 0.2% |
| Czech | 9 | 0.1% |
| Danish | 33 | 0.3% |
| Dutch | 132 | 1.3% |
| Eastern European | 18 | 0.2% |
| English | 994 | 9.7% |
| European | 829 | 8.1% |
| Filipino | 1 | 0.0% |
| Finnish | 22 | 0.2% |
| French | 363 | 3.5% |
| French Canadian | 30 | 0.3% |
| German | 1,356 | 13.2% |
| Greek | 120 | 1.2% |
| Guatemalan | 30 | 0.3% |
| Haitian | 7 | 0.1% |
| Hungarian | 47 | 0.5% |
| Indian (Asian) | 245 | 2.4% |
| Indonesian | 108 | 1.1% |
| Inupiat | 42 | 0.4% |
| Irish | 915 | 8.9% |
| Iroquois | 5 | 0.1% |
| Italian | 183 | 1.8% |
| Jamaican | 13 | 0.1% |
| Korean | 173 | 1.7% |
| Lithuanian | 16 | 0.2% |
| Mexican | 468 | 4.6% |
| Mexican American Indian | 2 | 0.0% |
| Native Hawaiian | 18 | 0.2% |
| Northern European | 44 | 0.4% |
| Norwegian | 315 | 3.1% |
| Paiute | 12 | 0.1% |
| Panamanian | 12 | 0.1% |
| Pennsylvania German | 13 | 0.1% |
| Polish | 114 | 1.1% |
| Portuguese | 21 | 0.2% |
| Puget Sound Salish | 72 | 0.7% |
| Romanian | 15 | 0.2% |
| Russian | 65 | 0.6% |
| Samoan | 74 | 0.7% |
| Scandinavian | 65 | 0.6% |
| Scotch-Irish | 78 | 0.8% |
| Scottish | 196 | 1.9% |
| Sioux | 29 | 0.3% |
| South American | 12 | 0.1% |
| Spaniard | 60 | 0.6% |
| Spanish | 106 | 1.0% |
| Sri Lankan | 35 | 0.3% |
| Subsaharan African | 7 | 0.1% |
| Swedish | 89 | 0.9% |
| Swiss | 10 | 0.1% |
| Turkish | 13 | 0.1% |
| Ukrainian | 8 | 0.1% |
| Vietnamese | 61 | 0.6% |
| Welsh | 13 | 0.1% |
| Yup'ik | 42 | 0.4% | View All 71 Rows |
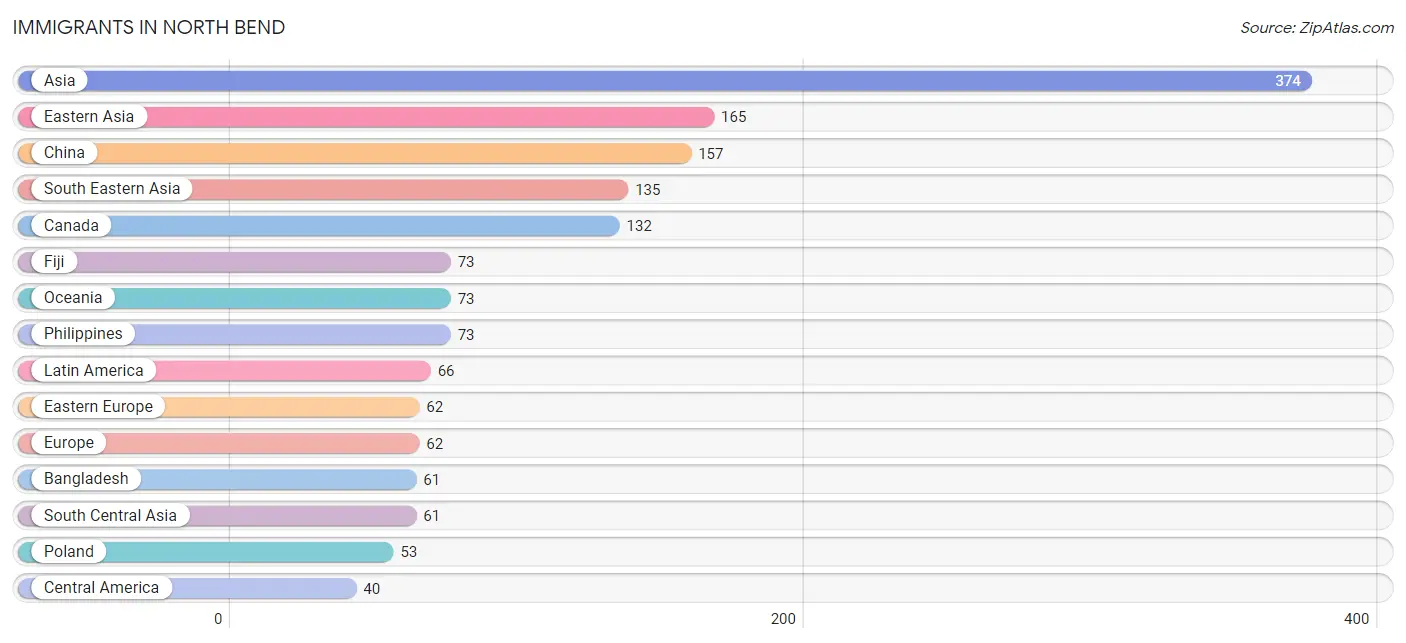
Immigrants in North Bend
The most numerous immigrant groups reported in North Bend came from Asia (374 | 3.6%), Eastern Asia (165 | 1.6%), China (157 | 1.5%), South Eastern Asia (135 | 1.3%), and Canada (132 | 1.3%), together accounting for 9.4% of all North Bend residents.
| Immigration Origin | # Population | % Population |
| Asia | 374 | 3.6% |
| Bangladesh | 61 | 0.6% |
| Bulgaria | 9 | 0.1% |
| Canada | 132 | 1.3% |
| Caribbean | 26 | 0.3% |
| Central America | 40 | 0.4% |
| China | 157 | 1.5% |
| Cuba | 13 | 0.1% |
| Eastern Asia | 165 | 1.6% |
| Eastern Europe | 62 | 0.6% |
| Europe | 62 | 0.6% |
| Fiji | 73 | 0.7% |
| Guatemala | 14 | 0.1% |
| Haiti | 13 | 0.1% |
| Israel | 13 | 0.1% |
| Korea | 8 | 0.1% |
| Latin America | 66 | 0.6% |
| Mexico | 26 | 0.3% |
| Oceania | 73 | 0.7% |
| Philippines | 73 | 0.7% |
| Poland | 53 | 0.5% |
| South Central Asia | 61 | 0.6% |
| South Eastern Asia | 135 | 1.3% |
| Vietnam | 10 | 0.1% |
| Western Asia | 13 | 0.1% | View All 25 Rows |
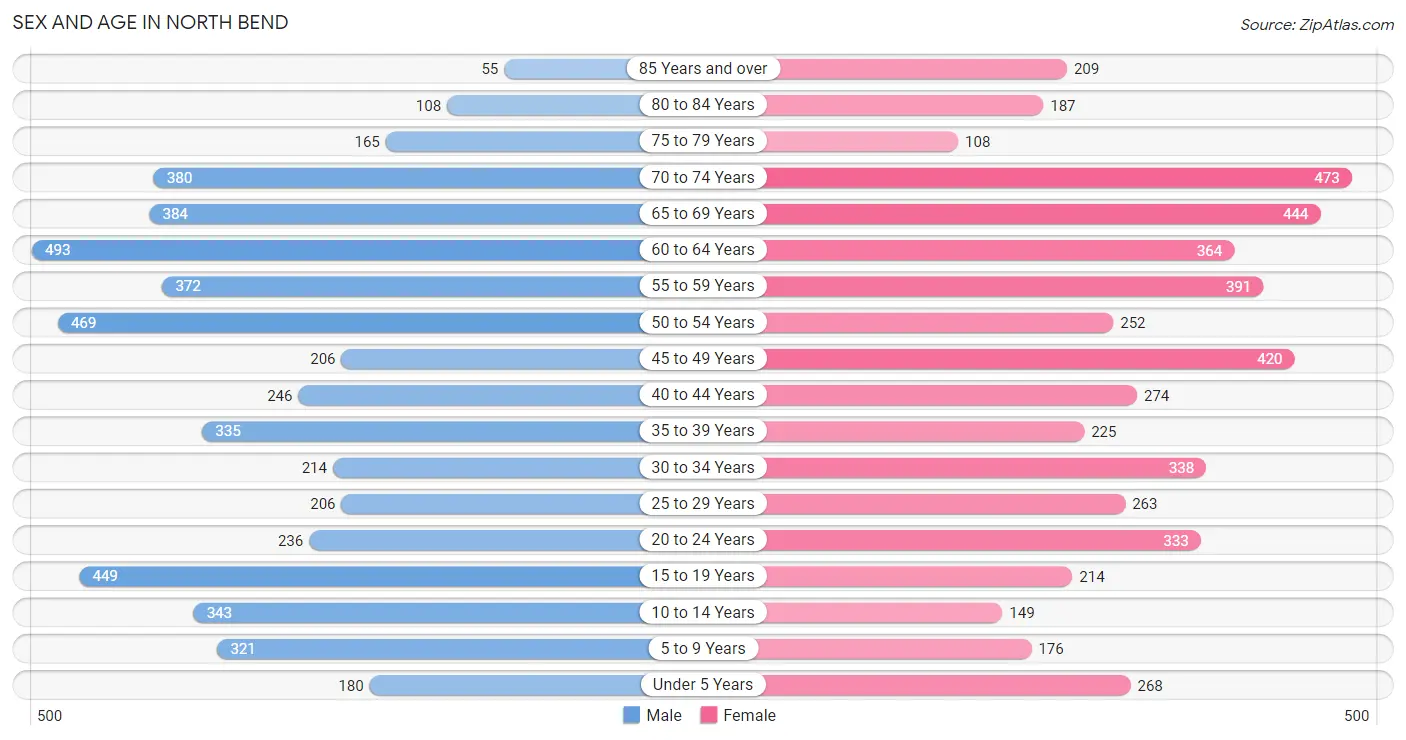
Sex and Age in North Bend
Sex and Age in North Bend
The most populous age groups in North Bend are 60 to 64 Years (493 | 9.6%) for men and 70 to 74 Years (473 | 9.3%) for women.
| Age Bracket | Male | Female |
| Under 5 Years | 180 (3.5%) | 268 (5.3%) |
| 5 to 9 Years | 321 (6.2%) | 176 (3.5%) |
| 10 to 14 Years | 343 (6.6%) | 149 (2.9%) |
| 15 to 19 Years | 449 (8.7%) | 214 (4.2%) |
| 20 to 24 Years | 236 (4.6%) | 333 (6.5%) |
| 25 to 29 Years | 206 (4.0%) | 263 (5.2%) |
| 30 to 34 Years | 214 (4.2%) | 338 (6.6%) |
| 35 to 39 Years | 335 (6.5%) | 225 (4.4%) |
| 40 to 44 Years | 246 (4.8%) | 274 (5.4%) |
| 45 to 49 Years | 206 (4.0%) | 420 (8.3%) |
| 50 to 54 Years | 469 (9.1%) | 252 (5.0%) |
| 55 to 59 Years | 372 (7.2%) | 391 (7.7%) |
| 60 to 64 Years | 493 (9.6%) | 364 (7.1%) |
| 65 to 69 Years | 384 (7.4%) | 444 (8.7%) |
| 70 to 74 Years | 380 (7.4%) | 473 (9.3%) |
| 75 to 79 Years | 165 (3.2%) | 108 (2.1%) |
| 80 to 84 Years | 108 (2.1%) | 187 (3.7%) |
| 85 Years and over | 55 (1.1%) | 209 (4.1%) |
| Total | 5,162 (100.0%) | 5,088 (100.0%) |
Families and Households in North Bend
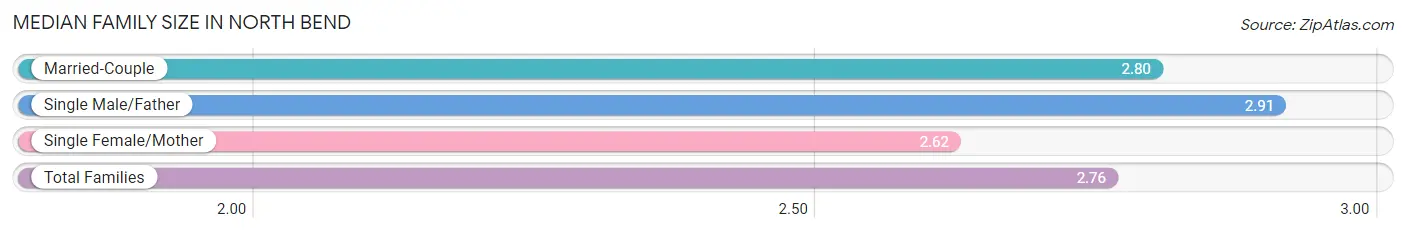
Median Family Size in North Bend
The median family size in North Bend is 2.76 persons per family, with single male/father families (91 | 3.2%) accounting for the largest median family size of 2.91 persons per family. On the other hand, single female/mother families (569 | 20.2%) represent the smallest median family size with 2.62 persons per family.
| Family Type | # Families | Family Size |
| Married-Couple | 2,158 (76.6%) | 2.80 |
| Single Male/Father | 91 (3.2%) | 2.91 |
| Single Female/Mother | 569 (20.2%) | 2.62 |
| Total Families | 2,818 (100.0%) | 2.76 |
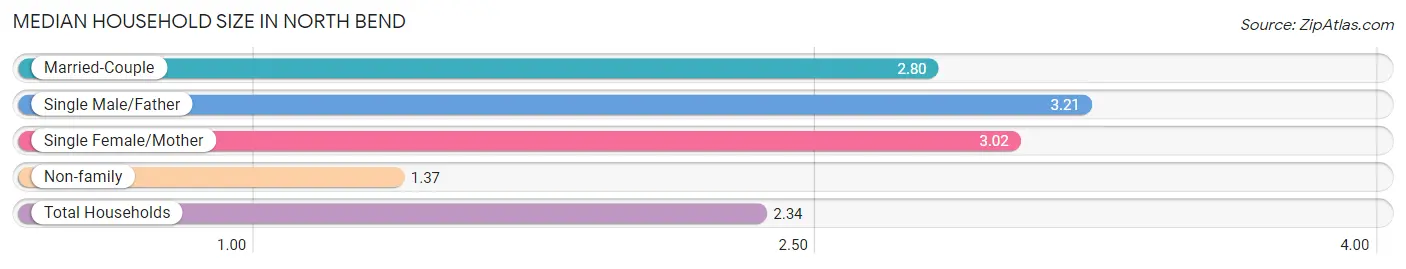
Median Household Size in North Bend
The median household size in North Bend is 2.34 persons per household, with single male/father households (91 | 2.1%) accounting for the largest median household size of 3.21 persons per household. non-family households (1,486 | 34.5%) represent the smallest median household size with 1.37 persons per household.
| Household Type | # Households | Household Size |
| Married-Couple | 2,158 (50.1%) | 2.80 |
| Single Male/Father | 91 (2.1%) | 3.21 |
| Single Female/Mother | 569 (13.2%) | 3.02 |
| Non-family | 1,486 (34.5%) | 1.37 |
| Total Households | 4,304 (100.0%) | 2.34 |
Household Size by Marriage Status in North Bend
Out of a total of 4,304 households in North Bend, 2,818 (65.5%) are family households, while 1,486 (34.5%) are nonfamily households. The most numerous type of family households are 2-person households, comprising 1,556, and the most common type of nonfamily households are 1-person households, comprising 1,116.
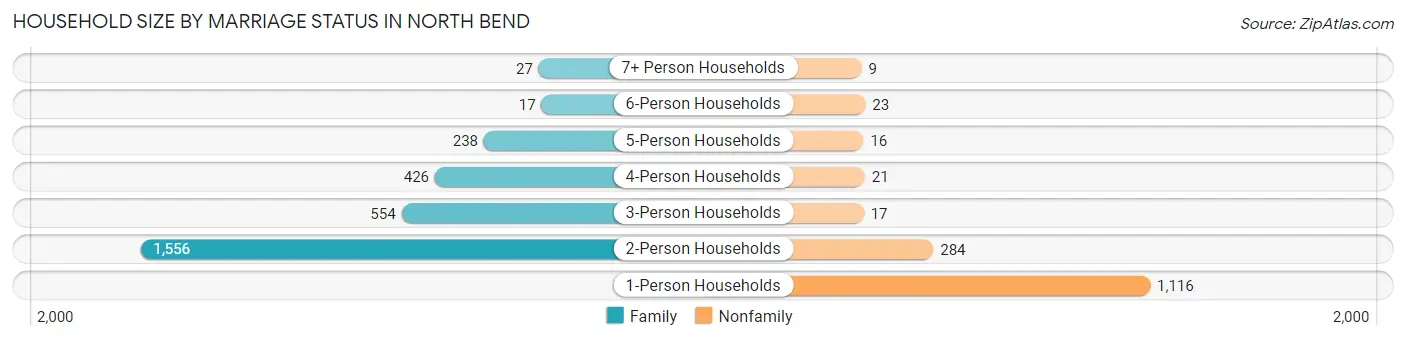
| Household Size | Family Households | Nonfamily Households |
| 1-Person Households | - | 1,116 (25.9%) |
| 2-Person Households | 1,556 (36.1%) | 284 (6.6%) |
| 3-Person Households | 554 (12.9%) | 17 (0.4%) |
| 4-Person Households | 426 (9.9%) | 21 (0.5%) |
| 5-Person Households | 238 (5.5%) | 16 (0.4%) |
| 6-Person Households | 17 (0.4%) | 23 (0.5%) |
| 7+ Person Households | 27 (0.6%) | 9 (0.2%) |
| Total | 2,818 (65.5%) | 1,486 (34.5%) |
Female Fertility in North Bend
Fertility by Age in North Bend
Average fertility rate in North Bend is 71.0 births per 1,000 women. Women in the age bracket of 20 to 34 years have the highest fertility rate with 160.0 births per 1,000 women. Women in the age bracket of 20 to 34 years acount for 100.0% of all women with births.
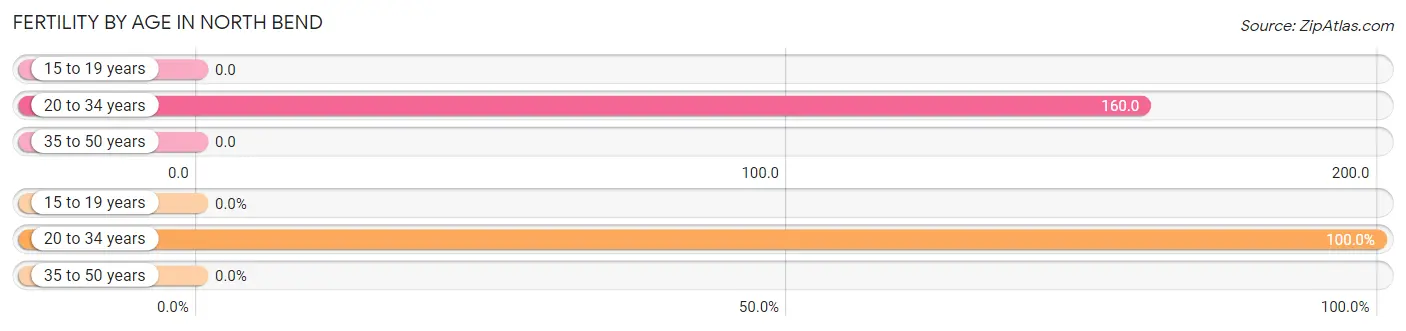
| Age Bracket | Women with Births | Births / 1,000 Women |
| 15 to 19 years | 0 (0.0%) | 0.0 |
| 20 to 34 years | 149 (100.0%) | 160.0 |
| 35 to 50 years | 0 (0.0%) | 0.0 |
| Total | 149 (100.0%) | 71.0 |
Fertility by Age by Marriage Status in North Bend
60.4% of women with births (149) in North Bend are married. The highest percentage of unmarried women with births falls into 20 to 34 years age bracket with 39.6% of them unmarried at the time of birth, while the lowest percentage of unmarried women with births belong to 20 to 34 years age bracket with 39.6% of them unmarried.
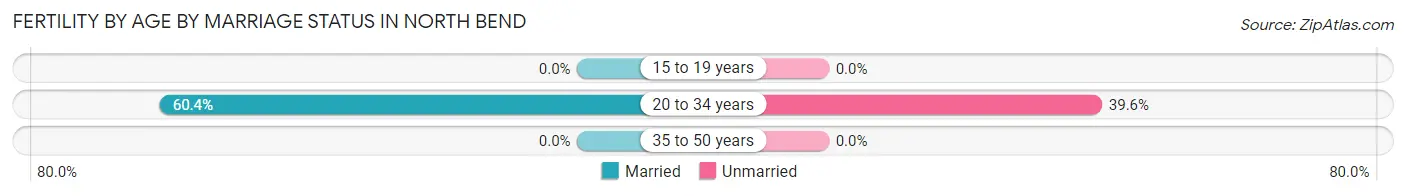
| Age Bracket | Married | Unmarried |
| 15 to 19 years | 0 (0.0%) | 0 (0.0%) |
| 20 to 34 years | 90 (60.4%) | 59 (39.6%) |
| 35 to 50 years | 0 (0.0%) | 0 (0.0%) |
| Total | 90 (60.4%) | 59 (39.6%) |
Fertility by Education in North Bend
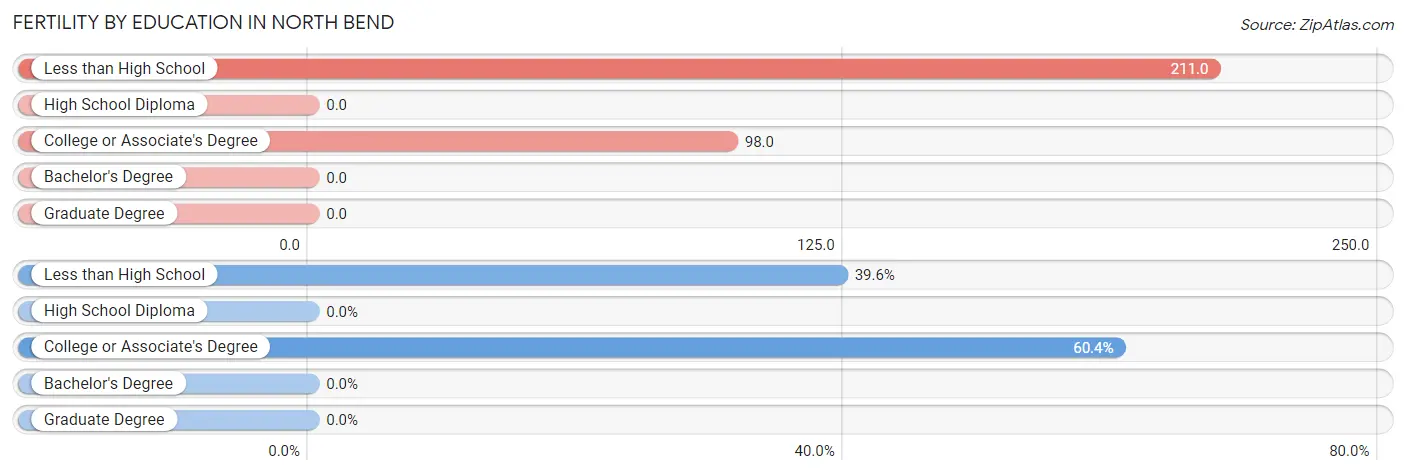
| Educational Attainment | Women with Births | Births / 1,000 Women |
| Less than High School | 59 (39.6%) | 211.0 |
| High School Diploma | 0 (0.0%) | 0.0 |
| College or Associate's Degree | 90 (60.4%) | 98.0 |
| Bachelor's Degree | 0 (0.0%) | 0.0 |
| Graduate Degree | 0 (0.0%) | 0.0 |
| Total | 149 (100.0%) | 71.0 |
Fertility by Education by Marriage Status in North Bend
39.6% of women with births in North Bend are unmarried. Women with the educational attainment of college or associate's degree are most likely to be married with 100.0% of them married at childbirth, while women with the educational attainment of less than high school are least likely to be married with 100.0% of them unmarried at childbirth.
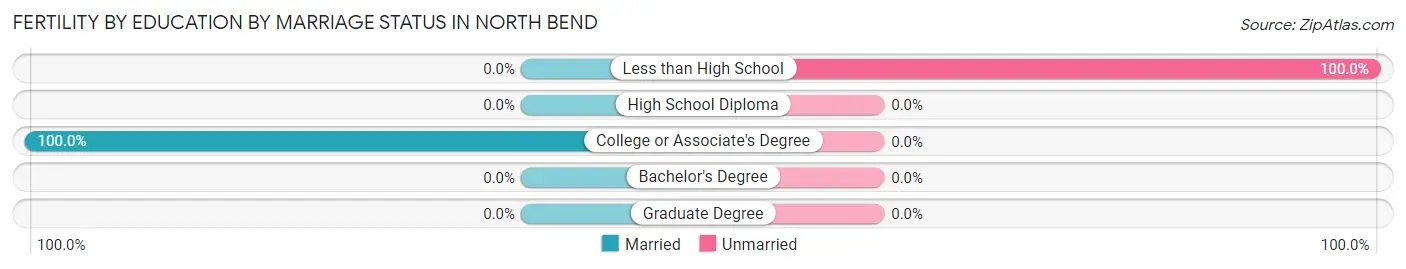
| Educational Attainment | Married | Unmarried |
| Less than High School | 0 (0.0%) | 59 (100.0%) |
| High School Diploma | 0 (0.0%) | 0 (0.0%) |
| College or Associate's Degree | 90 (100.0%) | 0 (0.0%) |
| Bachelor's Degree | 0 (0.0%) | 0 (0.0%) |
| Graduate Degree | 0 (0.0%) | 0 (0.0%) |
| Total | 90 (60.4%) | 59 (39.6%) |
Employment Characteristics in North Bend
Employment by Class of Employer in North Bend
Among the 4,715 employed individuals in North Bend, private company employees (2,809 | 59.6%), not-for-profit organizations (618 | 13.1%), and local government employees (427 | 9.1%) make up the most common classes of employment.
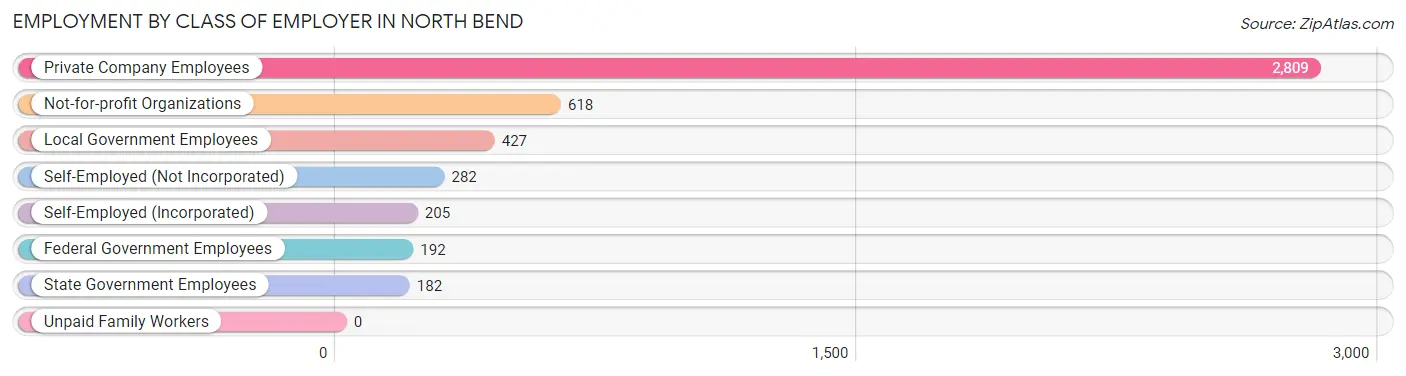
| Employer Class | # Employees | % Employees |
| Private Company Employees | 2,809 | 59.6% |
| Self-Employed (Incorporated) | 205 | 4.3% |
| Self-Employed (Not Incorporated) | 282 | 6.0% |
| Not-for-profit Organizations | 618 | 13.1% |
| Local Government Employees | 427 | 9.1% |
| State Government Employees | 182 | 3.9% |
| Federal Government Employees | 192 | 4.1% |
| Unpaid Family Workers | 0 | 0.0% |
| Total | 4,715 | 100.0% |
Employment Status by Age in North Bend
According to the labor force statistics for North Bend, out of the total population over 16 years of age (8,732), 60.5% or 5,283 individuals are in the labor force, with 7.8% or 412 of them unemployed. The age group with the highest labor force participation rate is 35 to 44 years, with 83.8% or 905 individuals in the labor force. Within the labor force, the 20 to 24 years age range has the highest percentage of unemployed individuals, with 20.5% or 90 of them being unemployed.
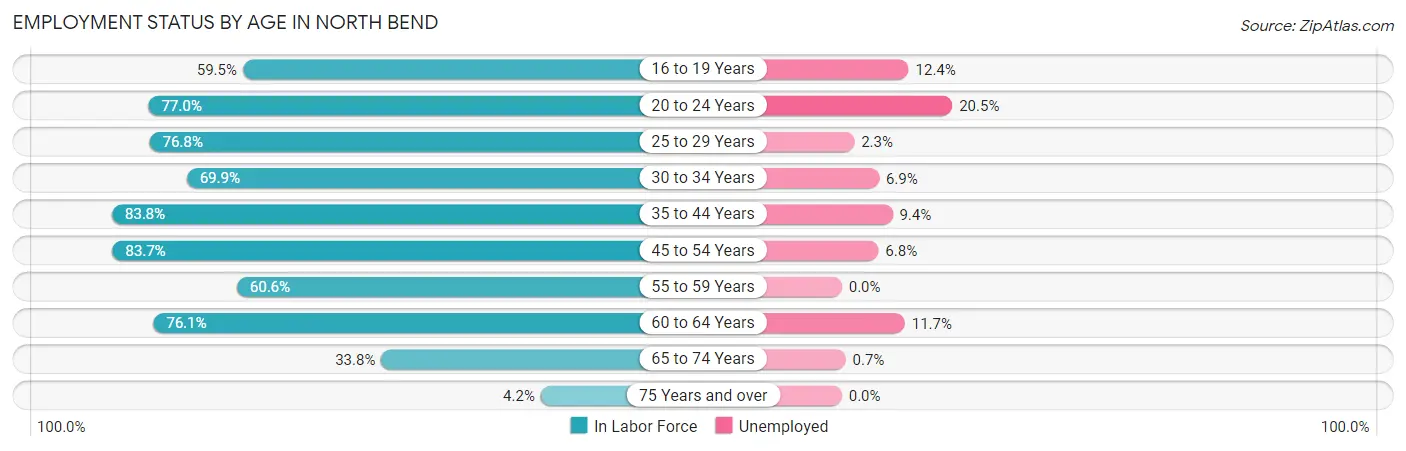
| Age Bracket | In Labor Force | Unemployed |
| 16 to 19 Years | 346 (59.5%) | 43 (12.4%) |
| 20 to 24 Years | 438 (77.0%) | 90 (20.5%) |
| 25 to 29 Years | 360 (76.8%) | 8 (2.3%) |
| 30 to 34 Years | 386 (69.9%) | 27 (6.9%) |
| 35 to 44 Years | 905 (83.8%) | 85 (9.4%) |
| 45 to 54 Years | 1,127 (83.7%) | 77 (6.8%) |
| 55 to 59 Years | 462 (60.6%) | 0 (0.0%) |
| 60 to 64 Years | 652 (76.1%) | 76 (11.7%) |
| 65 to 74 Years | 568 (33.8%) | 4 (0.7%) |
| 75 Years and over | 35 (4.2%) | 0 (0.0%) |
| Total | 5,283 (60.5%) | 412 (7.8%) |
Employment Status by Educational Attainment in North Bend
According to labor force statistics for North Bend, 76.8% of individuals (3,892) out of the total population between 25 and 64 years of age (5,068) are in the labor force, with 7.0% or 272 of them being unemployed. The group with the highest labor force participation rate are those with the educational attainment of bachelor's degree or higher, with 90.5% or 1,005 individuals in the labor force. Within the labor force, individuals with less than high school education have the highest percentage of unemployment, with 18.5% or 66 of them being unemployed.
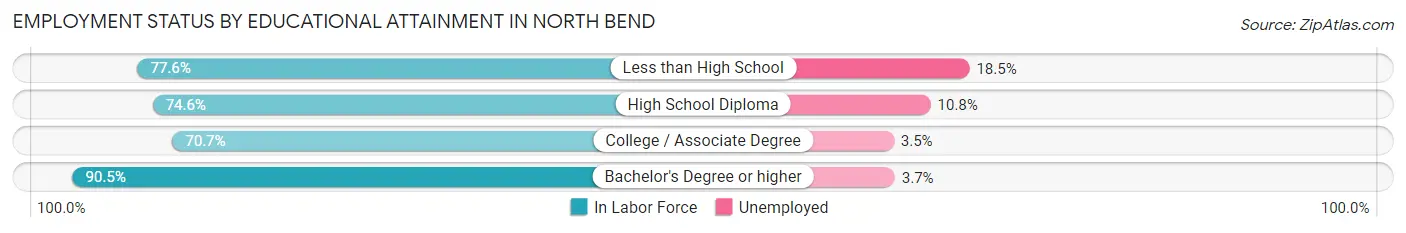
| Educational Attainment | In Labor Force | Unemployed |
| Less than High School | 356 (77.6%) | 85 (18.5%) |
| High School Diploma | 1,126 (74.6%) | 163 (10.8%) |
| College / Associate Degree | 1,406 (70.7%) | 70 (3.5%) |
| Bachelor's Degree or higher | 1,005 (90.5%) | 41 (3.7%) |
| Total | 3,892 (76.8%) | 355 (7.0%) |
Employment Occupations by Sex in North Bend
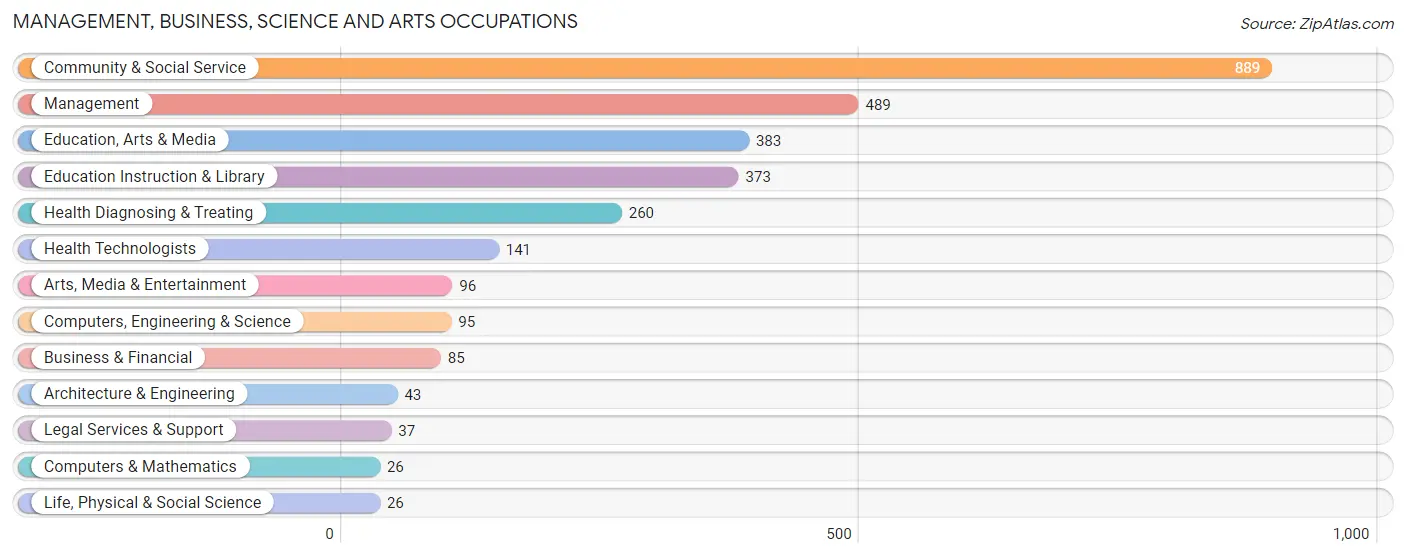
Management, Business, Science and Arts Occupations
The most common Management, Business, Science and Arts occupations in North Bend are Community & Social Service (889 | 18.4%), Management (489 | 10.1%), Education, Arts & Media (383 | 7.9%), Education Instruction & Library (373 | 7.7%), and Health Diagnosing & Treating (260 | 5.4%).
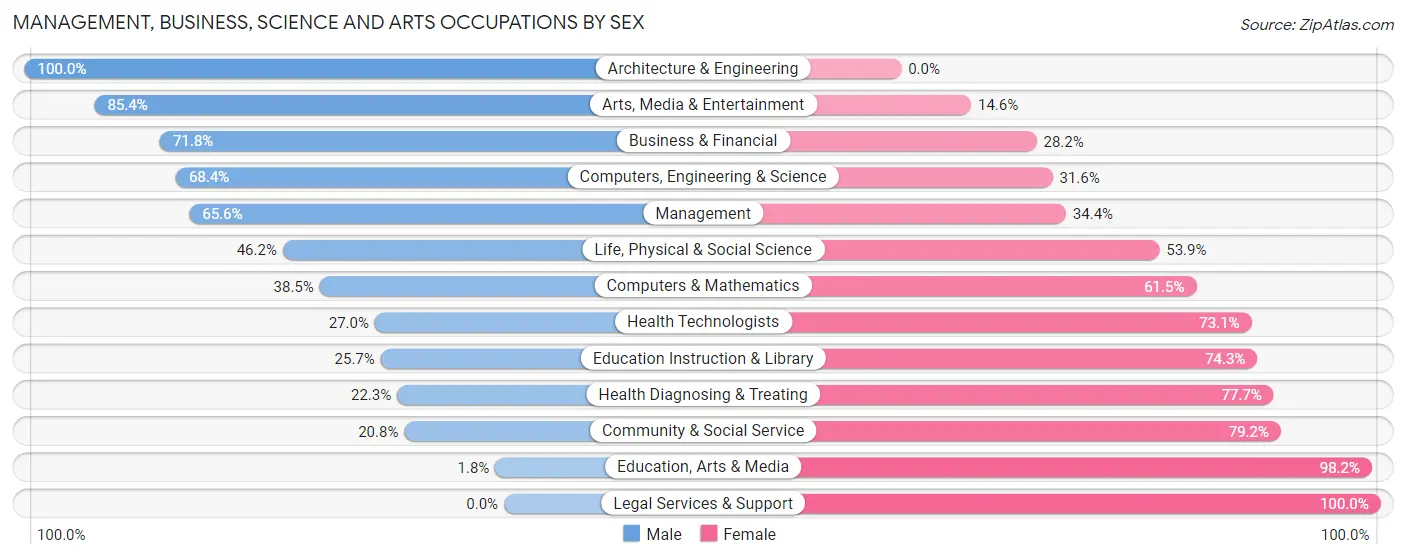
Management, Business, Science and Arts Occupations by Sex
Within the Management, Business, Science and Arts occupations in North Bend, the most male-oriented occupations are Architecture & Engineering (100.0%), Arts, Media & Entertainment (85.4%), and Business & Financial (71.8%), while the most female-oriented occupations are Legal Services & Support (100.0%), Education, Arts & Media (98.2%), and Community & Social Service (79.2%).
| Occupation | Male | Female |
| Management | 321 (65.6%) | 168 (34.4%) |
| Business & Financial | 61 (71.8%) | 24 (28.2%) |
| Computers, Engineering & Science | 65 (68.4%) | 30 (31.6%) |
| Computers & Mathematics | 10 (38.5%) | 16 (61.5%) |
| Architecture & Engineering | 43 (100.0%) | 0 (0.0%) |
| Life, Physical & Social Science | 12 (46.2%) | 14 (53.8%) |
| Community & Social Service | 185 (20.8%) | 704 (79.2%) |
| Education, Arts & Media | 7 (1.8%) | 376 (98.2%) |
| Legal Services & Support | 0 (0.0%) | 37 (100.0%) |
| Education Instruction & Library | 96 (25.7%) | 277 (74.3%) |
| Arts, Media & Entertainment | 82 (85.4%) | 14 (14.6%) |
| Health Diagnosing & Treating | 58 (22.3%) | 202 (77.7%) |
| Health Technologists | 38 (27.0%) | 103 (73.1%) |
| Total (Category) | 690 (38.0%) | 1,128 (62.1%) |
| Total (Overall) | 2,449 (50.6%) | 2,393 (49.4%) |
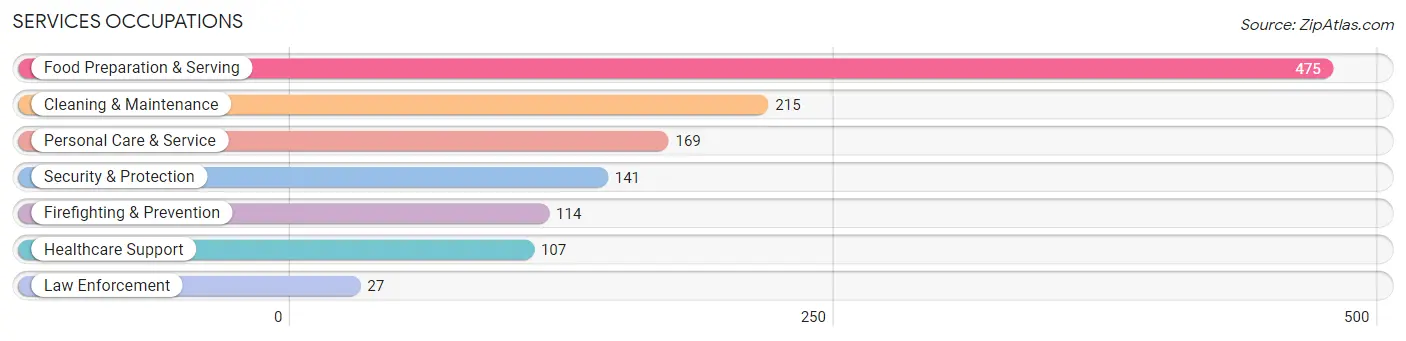
Services Occupations
The most common Services occupations in North Bend are Food Preparation & Serving (475 | 9.8%), Cleaning & Maintenance (215 | 4.4%), Personal Care & Service (169 | 3.5%), Security & Protection (141 | 2.9%), and Firefighting & Prevention (114 | 2.4%).
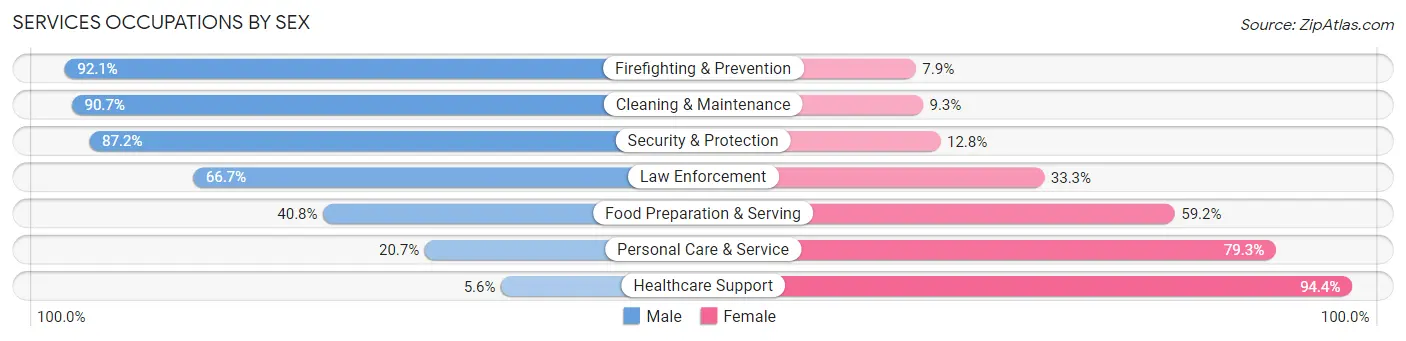
Services Occupations by Sex
Within the Services occupations in North Bend, the most male-oriented occupations are Firefighting & Prevention (92.1%), Cleaning & Maintenance (90.7%), and Security & Protection (87.2%), while the most female-oriented occupations are Healthcare Support (94.4%), Personal Care & Service (79.3%), and Food Preparation & Serving (59.2%).
| Occupation | Male | Female |
| Healthcare Support | 6 (5.6%) | 101 (94.4%) |
| Security & Protection | 123 (87.2%) | 18 (12.8%) |
| Firefighting & Prevention | 105 (92.1%) | 9 (7.9%) |
| Law Enforcement | 18 (66.7%) | 9 (33.3%) |
| Food Preparation & Serving | 194 (40.8%) | 281 (59.2%) |
| Cleaning & Maintenance | 195 (90.7%) | 20 (9.3%) |
| Personal Care & Service | 35 (20.7%) | 134 (79.3%) |
| Total (Category) | 553 (49.9%) | 554 (50.0%) |
| Total (Overall) | 2,449 (50.6%) | 2,393 (49.4%) |
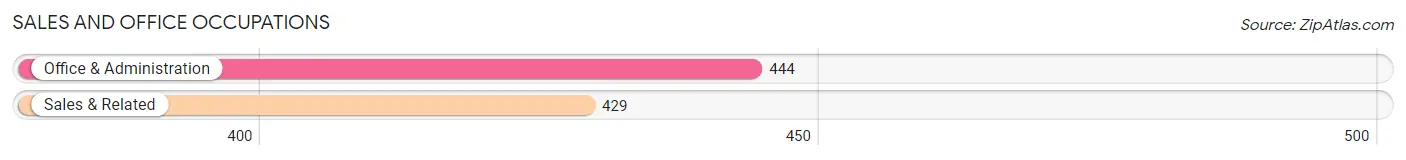
Sales and Office Occupations
The most common Sales and Office occupations in North Bend are Office & Administration (444 | 9.2%), and Sales & Related (429 | 8.9%).
Sales and Office Occupations by Sex
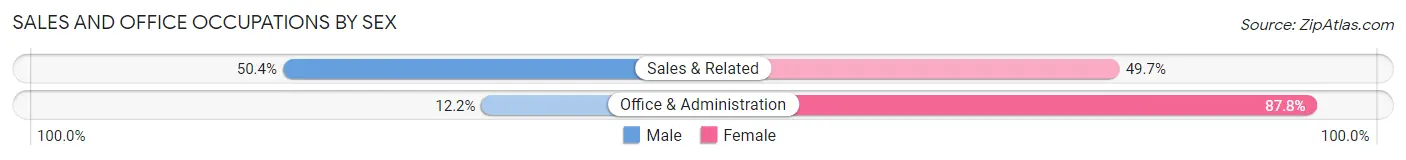
| Occupation | Male | Female |
| Sales & Related | 216 (50.3%) | 213 (49.6%) |
| Office & Administration | 54 (12.2%) | 390 (87.8%) |
| Total (Category) | 270 (30.9%) | 603 (69.1%) |
| Total (Overall) | 2,449 (50.6%) | 2,393 (49.4%) |
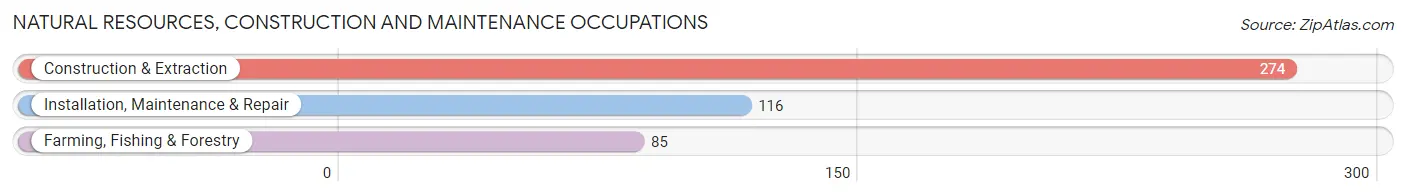
Natural Resources, Construction and Maintenance Occupations
The most common Natural Resources, Construction and Maintenance occupations in North Bend are Construction & Extraction (274 | 5.7%), Installation, Maintenance & Repair (116 | 2.4%), and Farming, Fishing & Forestry (85 | 1.8%).
Natural Resources, Construction and Maintenance Occupations by Sex
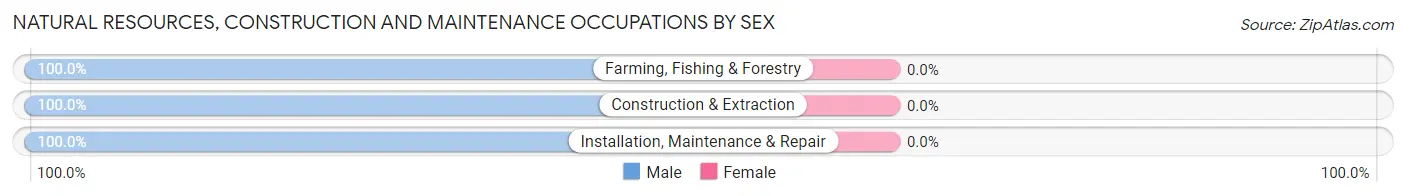
| Occupation | Male | Female |
| Farming, Fishing & Forestry | 85 (100.0%) | 0 (0.0%) |
| Construction & Extraction | 274 (100.0%) | 0 (0.0%) |
| Installation, Maintenance & Repair | 116 (100.0%) | 0 (0.0%) |
| Total (Category) | 475 (100.0%) | 0 (0.0%) |
| Total (Overall) | 2,449 (50.6%) | 2,393 (49.4%) |
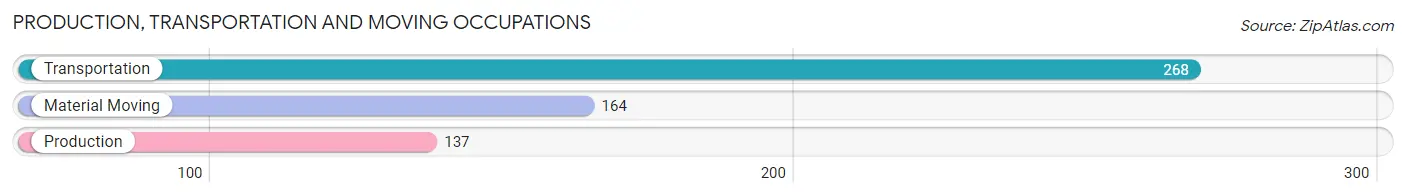
Production, Transportation and Moving Occupations
The most common Production, Transportation and Moving occupations in North Bend are Transportation (268 | 5.5%), Material Moving (164 | 3.4%), and Production (137 | 2.8%).
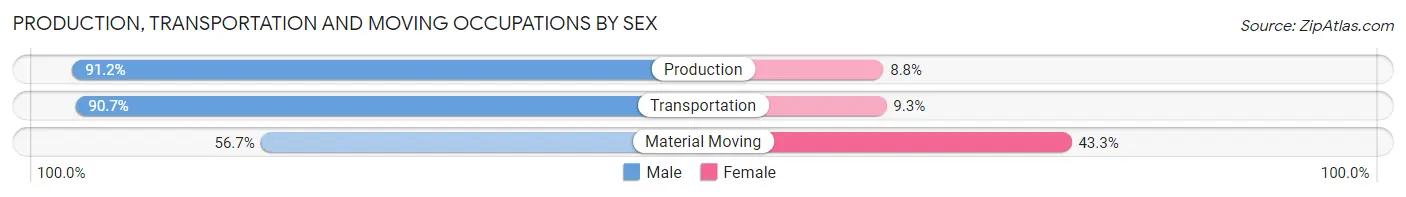
Production, Transportation and Moving Occupations by Sex
| Occupation | Male | Female |
| Production | 125 (91.2%) | 12 (8.8%) |
| Transportation | 243 (90.7%) | 25 (9.3%) |
| Material Moving | 93 (56.7%) | 71 (43.3%) |
| Total (Category) | 461 (81.0%) | 108 (19.0%) |
| Total (Overall) | 2,449 (50.6%) | 2,393 (49.4%) |
Employment Industries by Sex in North Bend
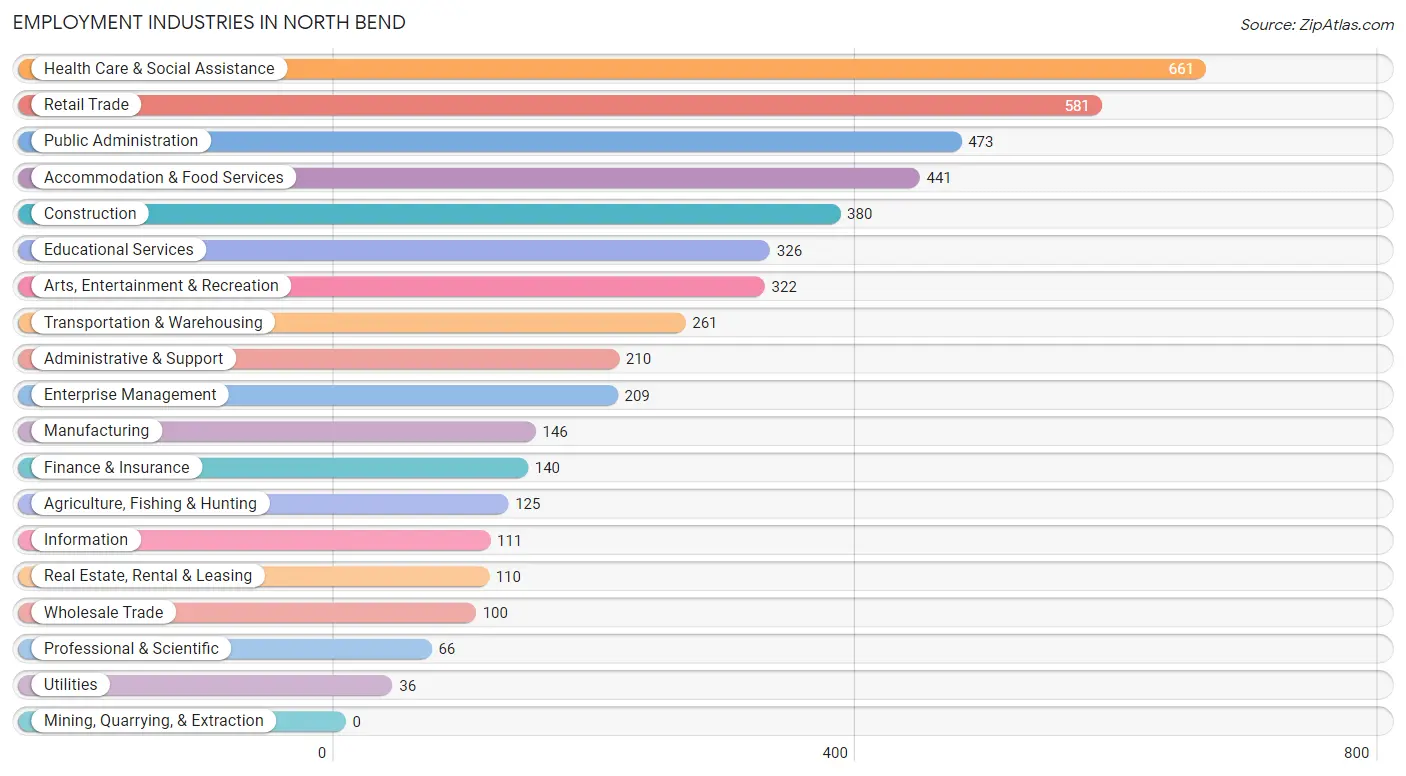
Employment Industries in North Bend
The major employment industries in North Bend include Health Care & Social Assistance (661 | 13.7%), Retail Trade (581 | 12.0%), Public Administration (473 | 9.8%), Accommodation & Food Services (441 | 9.1%), and Construction (380 | 7.9%).
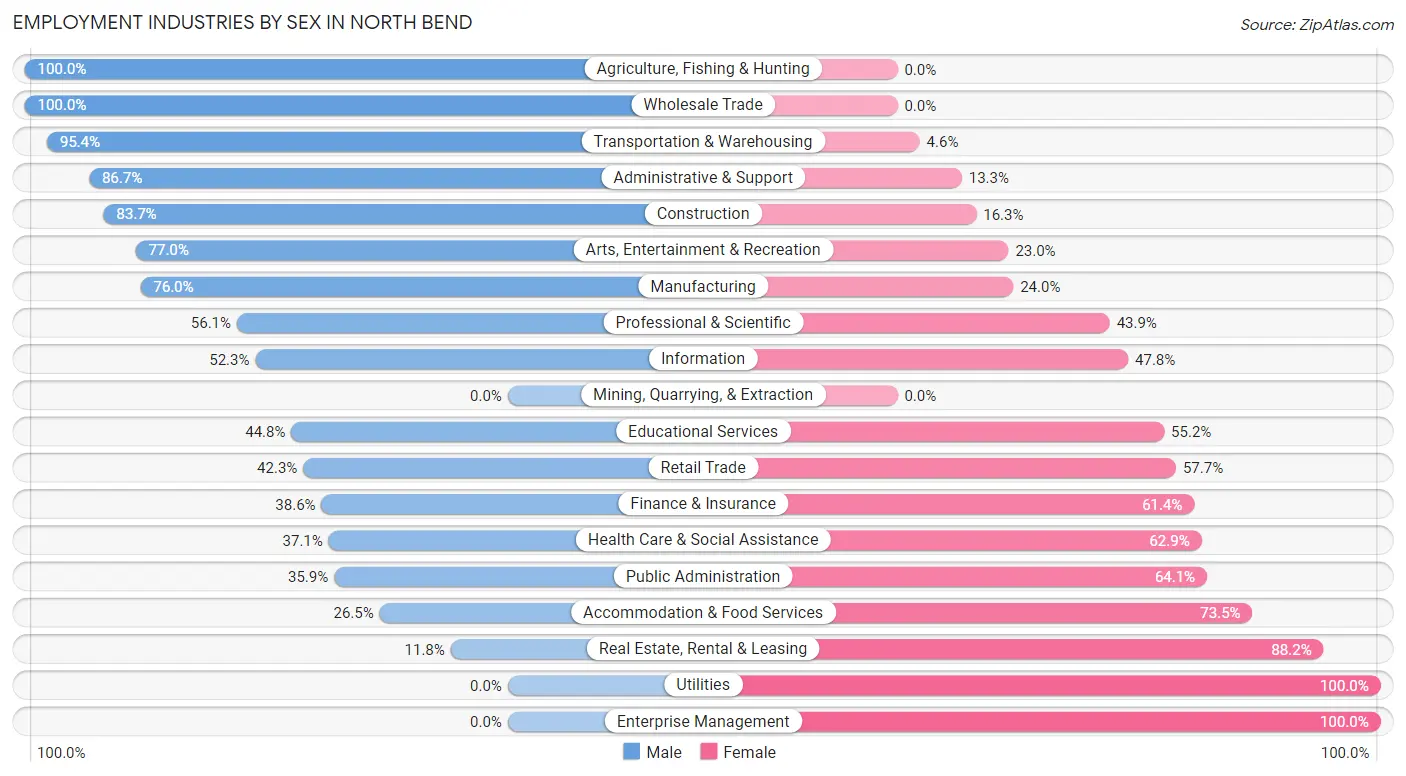
Employment Industries by Sex in North Bend
The North Bend industries that see more men than women are Agriculture, Fishing & Hunting (100.0%), Wholesale Trade (100.0%), and Transportation & Warehousing (95.4%), whereas the industries that tend to have a higher number of women are Utilities (100.0%), Enterprise Management (100.0%), and Real Estate, Rental & Leasing (88.2%).
| Industry | Male | Female |
| Agriculture, Fishing & Hunting | 125 (100.0%) | 0 (0.0%) |
| Mining, Quarrying, & Extraction | 0 (0.0%) | 0 (0.0%) |
| Construction | 318 (83.7%) | 62 (16.3%) |
| Manufacturing | 111 (76.0%) | 35 (24.0%) |
| Wholesale Trade | 100 (100.0%) | 0 (0.0%) |
| Retail Trade | 246 (42.3%) | 335 (57.7%) |
| Transportation & Warehousing | 249 (95.4%) | 12 (4.6%) |
| Utilities | 0 (0.0%) | 36 (100.0%) |
| Information | 58 (52.2%) | 53 (47.7%) |
| Finance & Insurance | 54 (38.6%) | 86 (61.4%) |
| Real Estate, Rental & Leasing | 13 (11.8%) | 97 (88.2%) |
| Professional & Scientific | 37 (56.1%) | 29 (43.9%) |
| Enterprise Management | 0 (0.0%) | 209 (100.0%) |
| Administrative & Support | 182 (86.7%) | 28 (13.3%) |
| Educational Services | 146 (44.8%) | 180 (55.2%) |
| Health Care & Social Assistance | 245 (37.1%) | 416 (62.9%) |
| Arts, Entertainment & Recreation | 248 (77.0%) | 74 (23.0%) |
| Accommodation & Food Services | 117 (26.5%) | 324 (73.5%) |
| Public Administration | 170 (35.9%) | 303 (64.1%) |
| Total | 2,449 (50.6%) | 2,393 (49.4%) |
Education in North Bend
School Enrollment in North Bend
The most common levels of schooling among the 1,885 students in North Bend are high school (501 | 26.6%), middle school (449 | 23.8%), and college / undergraduate (360 | 19.1%).
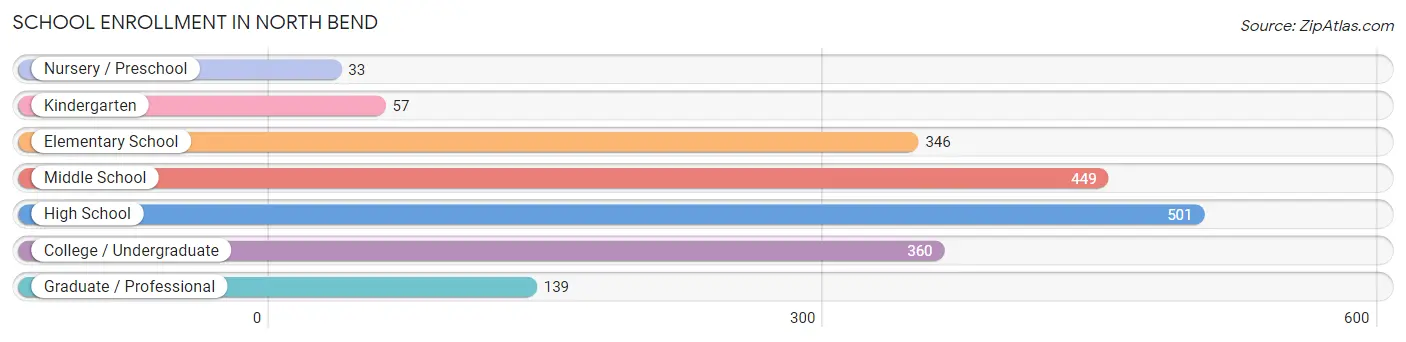
| School Level | # Students | % Students |
| Nursery / Preschool | 33 | 1.8% |
| Kindergarten | 57 | 3.0% |
| Elementary School | 346 | 18.4% |
| Middle School | 449 | 23.8% |
| High School | 501 | 26.6% |
| College / Undergraduate | 360 | 19.1% |
| Graduate / Professional | 139 | 7.4% |
| Total | 1,885 | 100.0% |
School Enrollment by Age by Funding Source in North Bend
Out of a total of 1,885 students who are enrolled in schools in North Bend, 149 (7.9%) attend a private institution, while the remaining 1,736 (92.1%) are enrolled in public schools. The age group of 18 to 19 year olds has the highest likelihood of being enrolled in private schools, with 11 (13.4% in the age bracket) enrolled. Conversely, the age group of 20 to 24 year olds has the lowest likelihood of being enrolled in a private school, with 181 (100.0% in the age bracket) attending a public institution.
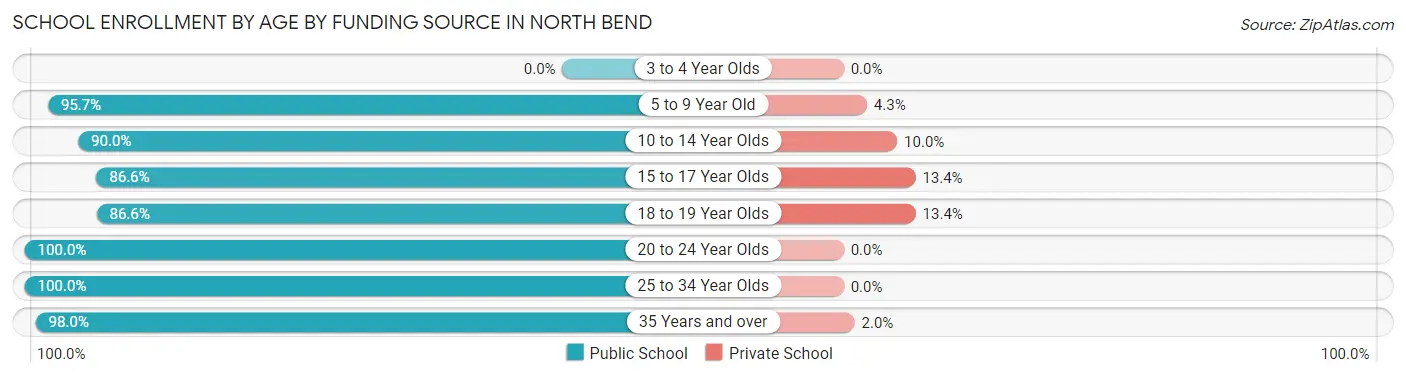
| Age Bracket | Public School | Private School |
| 3 to 4 Year Olds | 0 (0.0%) | 0 (0.0%) |
| 5 to 9 Year Old | 376 (95.7%) | 17 (4.3%) |
| 10 to 14 Year Olds | 443 (90.0%) | 49 (10.0%) |
| 15 to 17 Year Olds | 447 (86.6%) | 69 (13.4%) |
| 18 to 19 Year Olds | 71 (86.6%) | 11 (13.4%) |
| 20 to 24 Year Olds | 181 (100.0%) | 0 (0.0%) |
| 25 to 34 Year Olds | 74 (100.0%) | 0 (0.0%) |
| 35 Years and over | 144 (98.0%) | 3 (2.0%) |
| Total | 1,736 (92.1%) | 149 (7.9%) |
Educational Attainment by Field of Study in North Bend
Education (432 | 19.2%), social sciences (307 | 13.6%), arts & humanities (261 | 11.6%), bio, nature & agricultural (189 | 8.4%), and business (156 | 6.9%) are the most common fields of study among 2,252 individuals in North Bend who have obtained a bachelor's degree or higher.
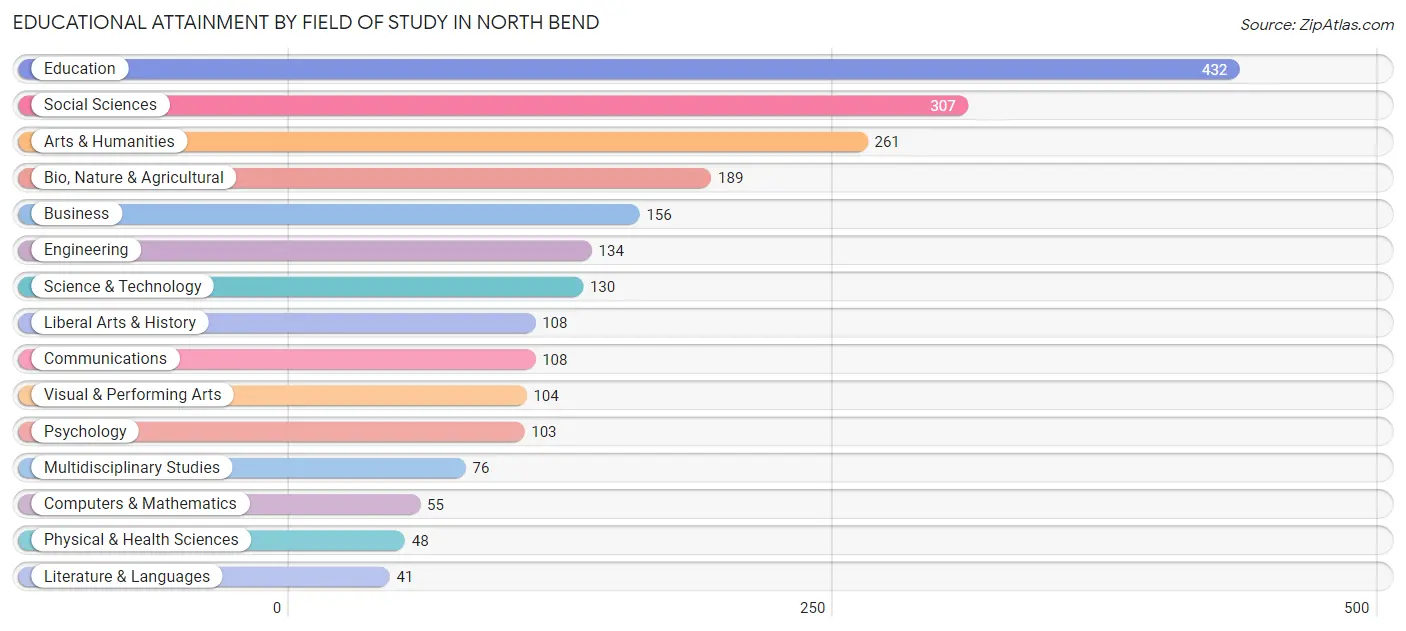
| Field of Study | # Graduates | % Graduates |
| Computers & Mathematics | 55 | 2.4% |
| Bio, Nature & Agricultural | 189 | 8.4% |
| Physical & Health Sciences | 48 | 2.1% |
| Psychology | 103 | 4.6% |
| Social Sciences | 307 | 13.6% |
| Engineering | 134 | 5.9% |
| Multidisciplinary Studies | 76 | 3.4% |
| Science & Technology | 130 | 5.8% |
| Business | 156 | 6.9% |
| Education | 432 | 19.2% |
| Literature & Languages | 41 | 1.8% |
| Liberal Arts & History | 108 | 4.8% |
| Visual & Performing Arts | 104 | 4.6% |
| Communications | 108 | 4.8% |
| Arts & Humanities | 261 | 11.6% |
| Total | 2,252 | 100.0% |
Transportation & Commute in North Bend
Vehicle Availability by Sex in North Bend
The most prevalent vehicle ownership categories in North Bend are males with 2 vehicles (1,017, accounting for 41.9%) and females with 2 vehicles (995, making up 44.6%).
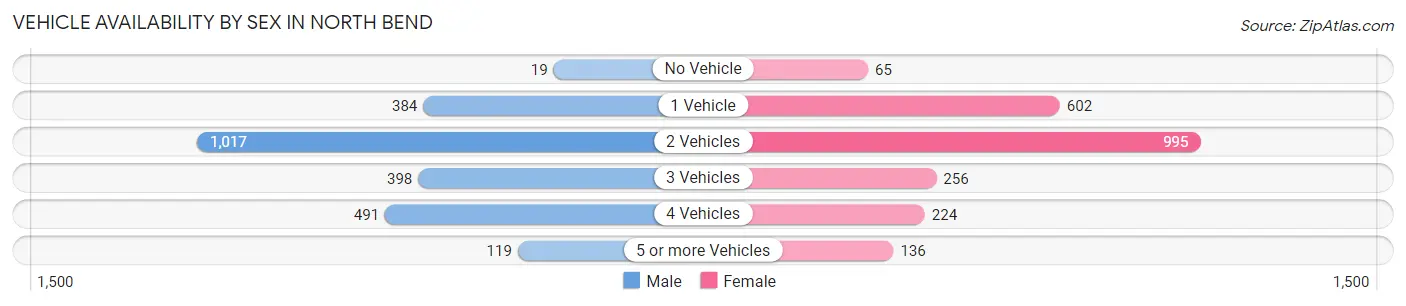
| Vehicles Available | Male | Female |
| No Vehicle | 19 (0.8%) | 65 (2.9%) |
| 1 Vehicle | 384 (15.8%) | 602 (26.4%) |
| 2 Vehicles | 1,017 (41.9%) | 995 (43.7%) |
| 3 Vehicles | 398 (16.4%) | 256 (11.2%) |
| 4 Vehicles | 491 (20.2%) | 224 (9.8%) |
| 5 or more Vehicles | 119 (4.9%) | 136 (6.0%) |
| Total | 2,428 (100.0%) | 2,278 (100.0%) |
Commute Time in North Bend
The most frequently occuring commute durations in North Bend are 5 to 9 minutes (1,057 commuters, 23.3%), 15 to 19 minutes (991 commuters, 21.8%), and 10 to 14 minutes (909 commuters, 20.0%).
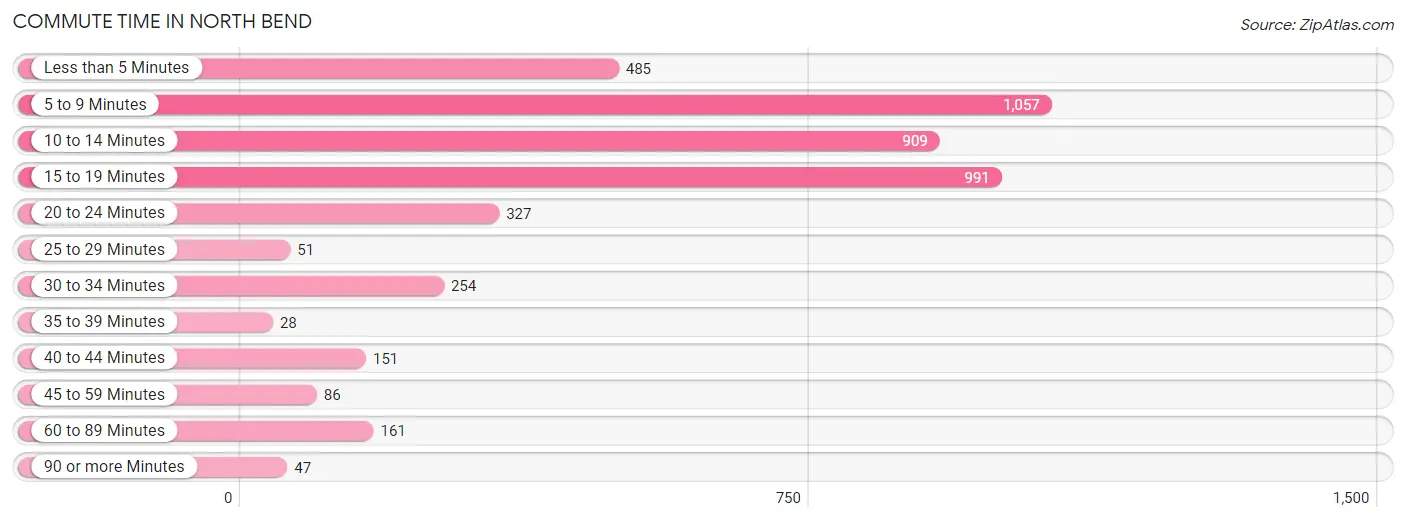
| Commute Time | # Commuters | % Commuters |
| Less than 5 Minutes | 485 | 10.7% |
| 5 to 9 Minutes | 1,057 | 23.3% |
| 10 to 14 Minutes | 909 | 20.0% |
| 15 to 19 Minutes | 991 | 21.8% |
| 20 to 24 Minutes | 327 | 7.2% |
| 25 to 29 Minutes | 51 | 1.1% |
| 30 to 34 Minutes | 254 | 5.6% |
| 35 to 39 Minutes | 28 | 0.6% |
| 40 to 44 Minutes | 151 | 3.3% |
| 45 to 59 Minutes | 86 | 1.9% |
| 60 to 89 Minutes | 161 | 3.5% |
| 90 or more Minutes | 47 | 1.0% |
Commute Time by Sex in North Bend
The most common commute times in North Bend are 5 to 9 minutes (550 commuters, 23.7%) for males and 15 to 19 minutes (538 commuters, 24.2%) for females.
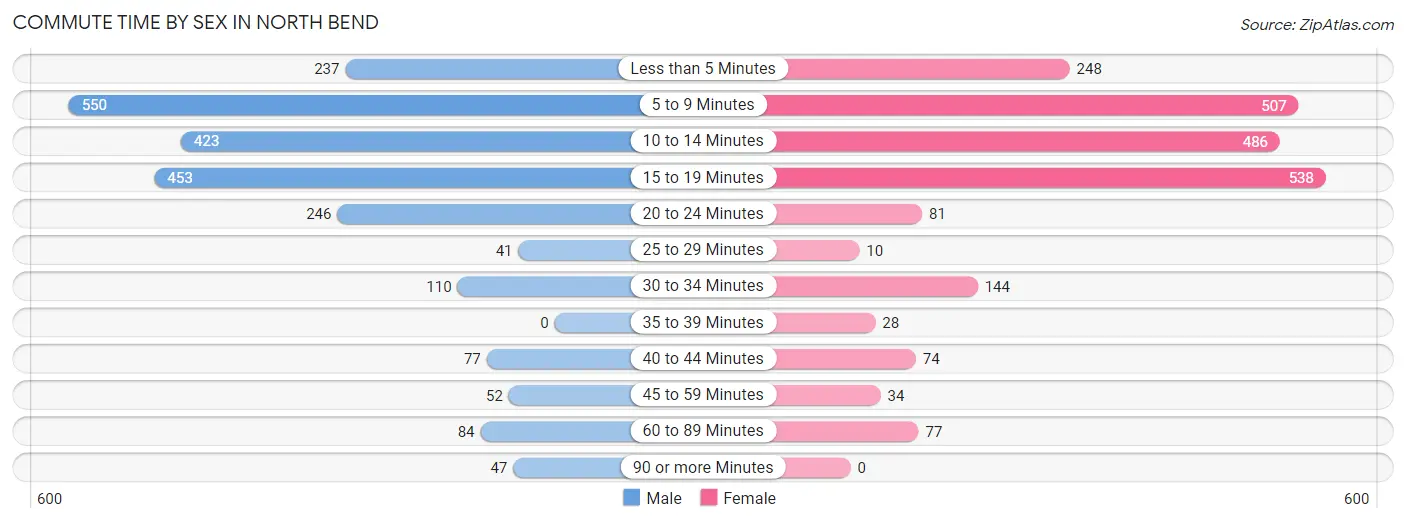
| Commute Time | Male | Female |
| Less than 5 Minutes | 237 (10.2%) | 248 (11.1%) |
| 5 to 9 Minutes | 550 (23.7%) | 507 (22.8%) |
| 10 to 14 Minutes | 423 (18.2%) | 486 (21.8%) |
| 15 to 19 Minutes | 453 (19.5%) | 538 (24.2%) |
| 20 to 24 Minutes | 246 (10.6%) | 81 (3.6%) |
| 25 to 29 Minutes | 41 (1.8%) | 10 (0.4%) |
| 30 to 34 Minutes | 110 (4.7%) | 144 (6.5%) |
| 35 to 39 Minutes | 0 (0.0%) | 28 (1.3%) |
| 40 to 44 Minutes | 77 (3.3%) | 74 (3.3%) |
| 45 to 59 Minutes | 52 (2.2%) | 34 (1.5%) |
| 60 to 89 Minutes | 84 (3.6%) | 77 (3.5%) |
| 90 or more Minutes | 47 (2.0%) | 0 (0.0%) |
Time of Departure to Work by Sex in North Bend
The most frequent times of departure to work in North Bend are 7:00 AM to 7:29 AM (418, 18.0%) for males and 7:00 AM to 7:29 AM (544, 24.4%) for females.
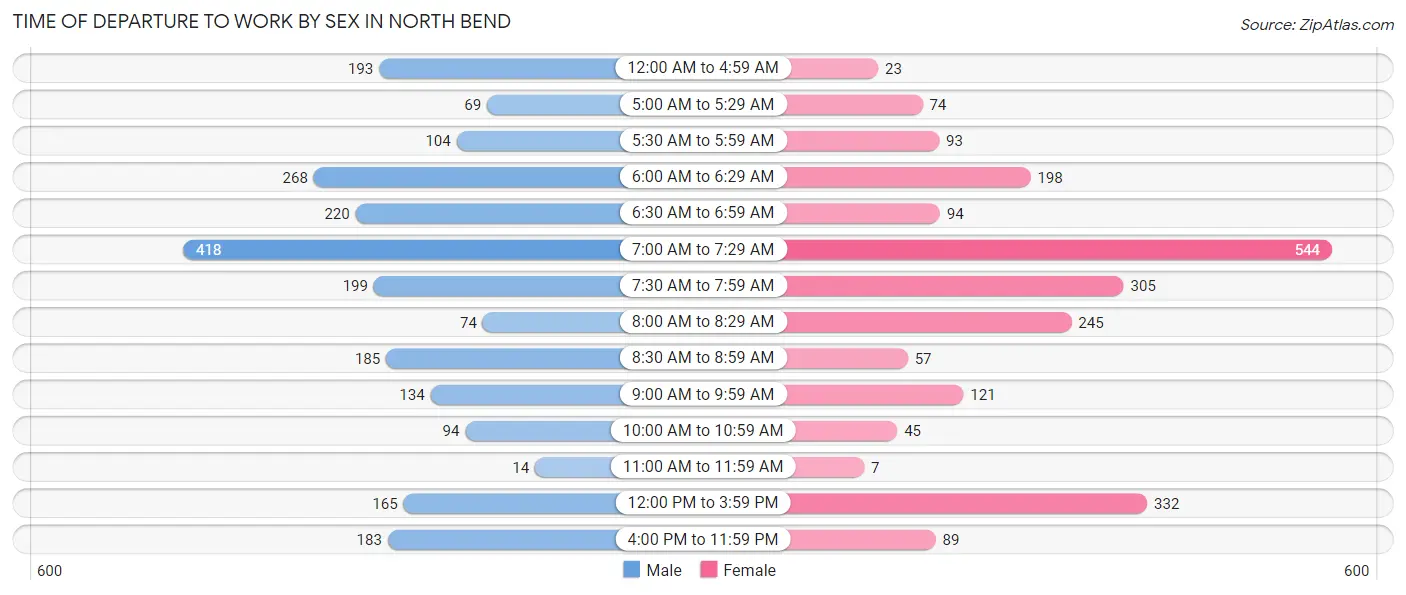
| Time of Departure | Male | Female |
| 12:00 AM to 4:59 AM | 193 (8.3%) | 23 (1.0%) |
| 5:00 AM to 5:29 AM | 69 (3.0%) | 74 (3.3%) |
| 5:30 AM to 5:59 AM | 104 (4.5%) | 93 (4.2%) |
| 6:00 AM to 6:29 AM | 268 (11.6%) | 198 (8.9%) |
| 6:30 AM to 6:59 AM | 220 (9.5%) | 94 (4.2%) |
| 7:00 AM to 7:29 AM | 418 (18.0%) | 544 (24.4%) |
| 7:30 AM to 7:59 AM | 199 (8.6%) | 305 (13.7%) |
| 8:00 AM to 8:29 AM | 74 (3.2%) | 245 (11.0%) |
| 8:30 AM to 8:59 AM | 185 (8.0%) | 57 (2.6%) |
| 9:00 AM to 9:59 AM | 134 (5.8%) | 121 (5.4%) |
| 10:00 AM to 10:59 AM | 94 (4.1%) | 45 (2.0%) |
| 11:00 AM to 11:59 AM | 14 (0.6%) | 7 (0.3%) |
| 12:00 PM to 3:59 PM | 165 (7.1%) | 332 (14.9%) |
| 4:00 PM to 11:59 PM | 183 (7.9%) | 89 (4.0%) |
| Total | 2,320 (100.0%) | 2,227 (100.0%) |
Housing Occupancy in North Bend
Occupancy by Ownership in North Bend
Of the total 4,304 dwellings in North Bend, owner-occupied units account for 2,545 (59.1%), while renter-occupied units make up 1,759 (40.9%).
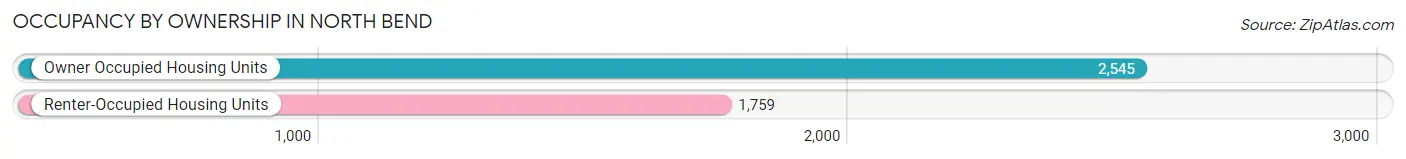
| Occupancy | # Housing Units | % Housing Units |
| Owner Occupied Housing Units | 2,545 | 59.1% |
| Renter-Occupied Housing Units | 1,759 | 40.9% |
| Total Occupied Housing Units | 4,304 | 100.0% |
Occupancy by Household Size in North Bend
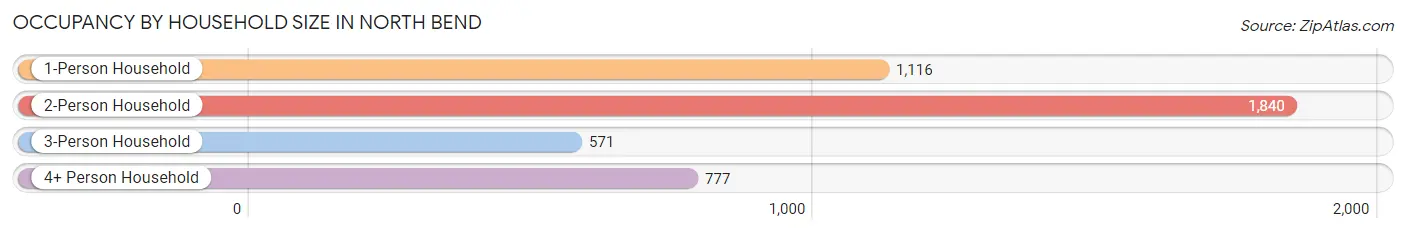
| Household Size | # Housing Units | % Housing Units |
| 1-Person Household | 1,116 | 25.9% |
| 2-Person Household | 1,840 | 42.7% |
| 3-Person Household | 571 | 13.3% |
| 4+ Person Household | 777 | 18.0% |
| Total Housing Units | 4,304 | 100.0% |
Occupancy by Ownership by Household Size in North Bend
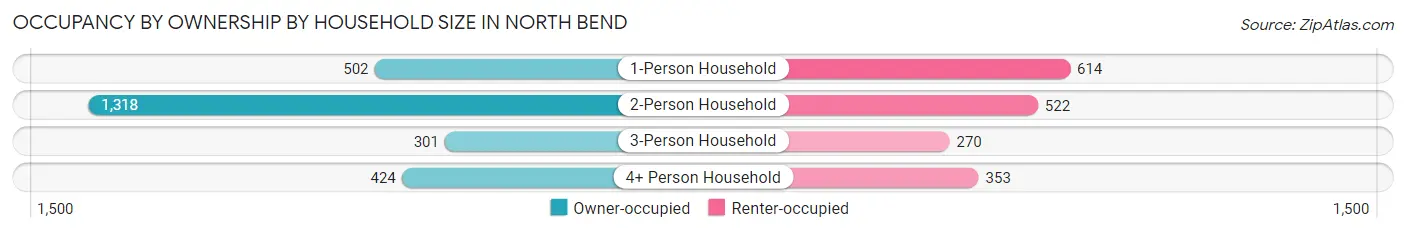
| Household Size | Owner-occupied | Renter-occupied |
| 1-Person Household | 502 (45.0%) | 614 (55.0%) |
| 2-Person Household | 1,318 (71.6%) | 522 (28.4%) |
| 3-Person Household | 301 (52.7%) | 270 (47.3%) |
| 4+ Person Household | 424 (54.6%) | 353 (45.4%) |
| Total Housing Units | 2,545 (59.1%) | 1,759 (40.9%) |
Occupancy by Educational Attainment in North Bend
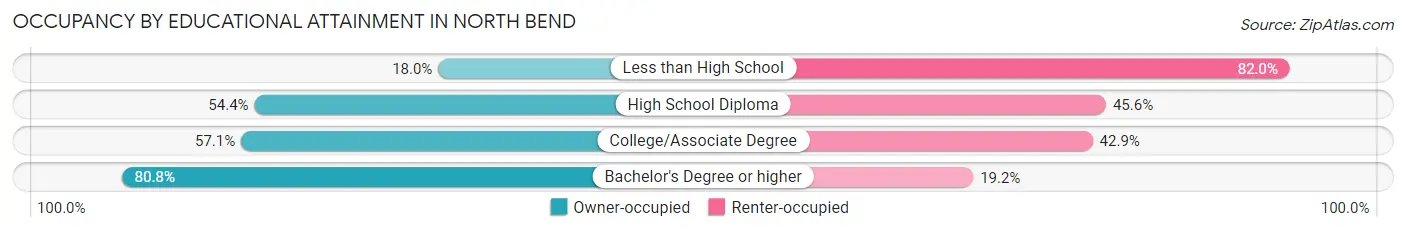
| Household Size | Owner-occupied | Renter-occupied |
| Less than High School | 63 (18.0%) | 287 (82.0%) |
| High School Diploma | 637 (54.4%) | 533 (45.6%) |
| College/Associate Degree | 972 (57.1%) | 731 (42.9%) |
| Bachelor's Degree or higher | 873 (80.8%) | 208 (19.2%) |
Occupancy by Age of Householder in North Bend
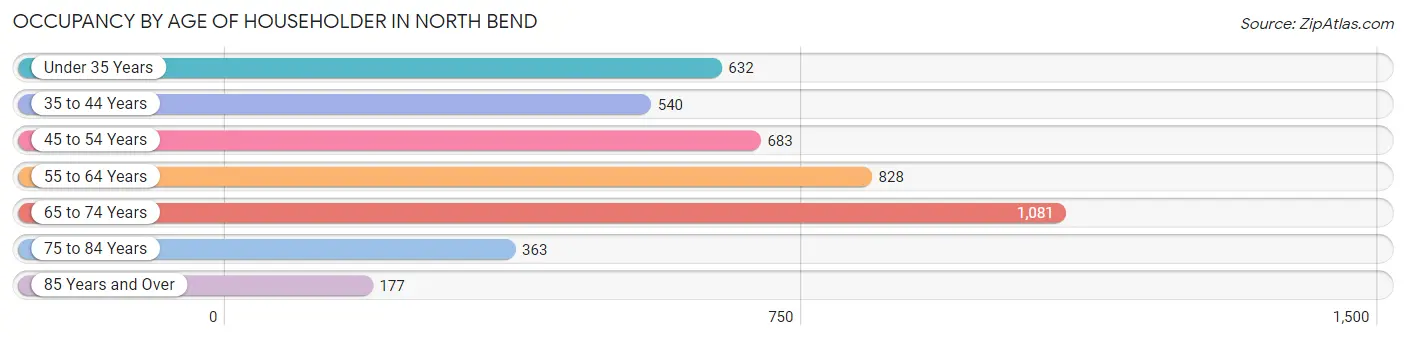
| Age Bracket | # Households | % Households |
| Under 35 Years | 632 | 14.7% |
| 35 to 44 Years | 540 | 12.6% |
| 45 to 54 Years | 683 | 15.9% |
| 55 to 64 Years | 828 | 19.2% |
| 65 to 74 Years | 1,081 | 25.1% |
| 75 to 84 Years | 363 | 8.4% |
| 85 Years and Over | 177 | 4.1% |
| Total | 4,304 | 100.0% |
Housing Finances in North Bend
Median Income by Occupancy in North Bend
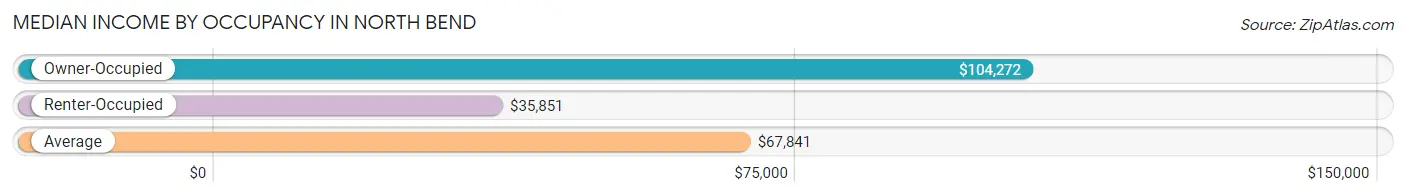
| Occupancy Type | # Households | Median Income |
| Owner-Occupied | 2,545 (59.1%) | $104,272 |
| Renter-Occupied | 1,759 (40.9%) | $35,851 |
| Average | 4,304 (100.0%) | $67,841 |
Occupancy by Householder Income Bracket in North Bend
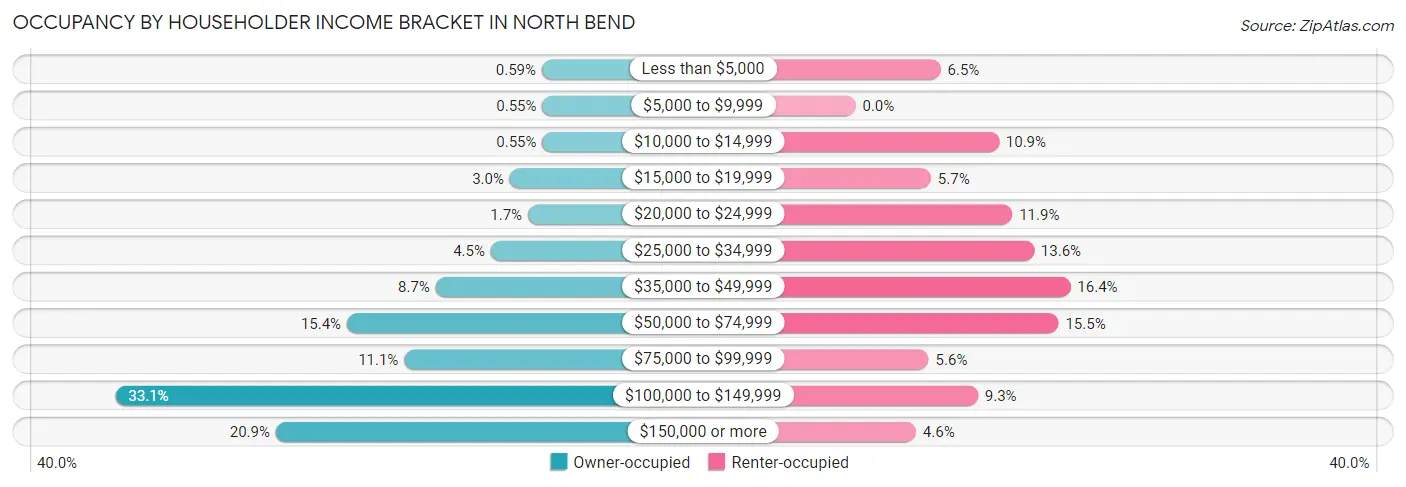
| Income Bracket | Owner-occupied | Renter-occupied |
| Less than $5,000 | 15 (0.6%) | 114 (6.5%) |
| $5,000 to $9,999 | 14 (0.5%) | 0 (0.0%) |
| $10,000 to $14,999 | 14 (0.5%) | 192 (10.9%) |
| $15,000 to $19,999 | 77 (3.0%) | 101 (5.7%) |
| $20,000 to $24,999 | 42 (1.7%) | 210 (11.9%) |
| $25,000 to $34,999 | 114 (4.5%) | 239 (13.6%) |
| $35,000 to $49,999 | 221 (8.7%) | 288 (16.4%) |
| $50,000 to $74,999 | 393 (15.4%) | 272 (15.5%) |
| $75,000 to $99,999 | 282 (11.1%) | 98 (5.6%) |
| $100,000 to $149,999 | 842 (33.1%) | 164 (9.3%) |
| $150,000 or more | 531 (20.9%) | 81 (4.6%) |
| Total | 2,545 (100.0%) | 1,759 (100.0%) |
Monthly Housing Cost Tiers in North Bend
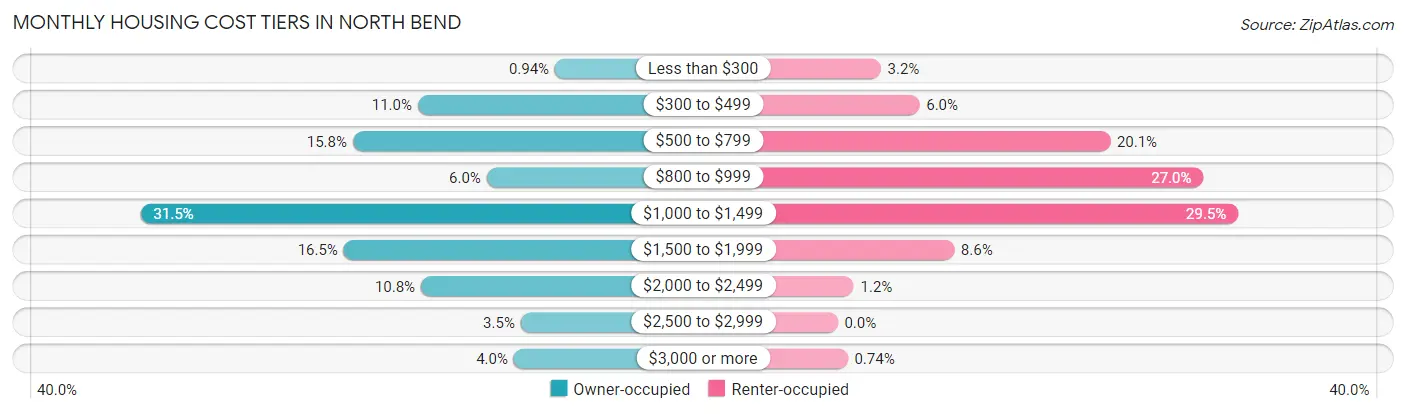
| Monthly Cost | Owner-occupied | Renter-occupied |
| Less than $300 | 24 (0.9%) | 56 (3.2%) |
| $300 to $499 | 281 (11.0%) | 106 (6.0%) |
| $500 to $799 | 403 (15.8%) | 353 (20.1%) |
| $800 to $999 | 152 (6.0%) | 474 (27.0%) |
| $1,000 to $1,499 | 801 (31.5%) | 519 (29.5%) |
| $1,500 to $1,999 | 420 (16.5%) | 151 (8.6%) |
| $2,000 to $2,499 | 275 (10.8%) | 21 (1.2%) |
| $2,500 to $2,999 | 88 (3.5%) | 0 (0.0%) |
| $3,000 or more | 101 (4.0%) | 13 (0.7%) |
| Total | 2,545 (100.0%) | 1,759 (100.0%) |
Physical Housing Characteristics in North Bend
Housing Structures in North Bend
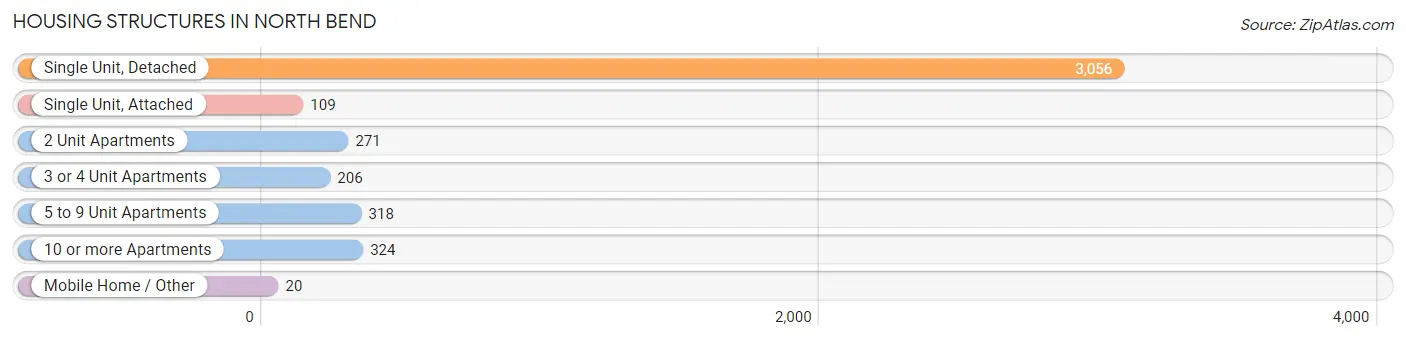
| Structure Type | # Housing Units | % Housing Units |
| Single Unit, Detached | 3,056 | 71.0% |
| Single Unit, Attached | 109 | 2.5% |
| 2 Unit Apartments | 271 | 6.3% |
| 3 or 4 Unit Apartments | 206 | 4.8% |
| 5 to 9 Unit Apartments | 318 | 7.4% |
| 10 or more Apartments | 324 | 7.5% |
| Mobile Home / Other | 20 | 0.5% |
| Total | 4,304 | 100.0% |
Housing Structures by Occupancy in North Bend
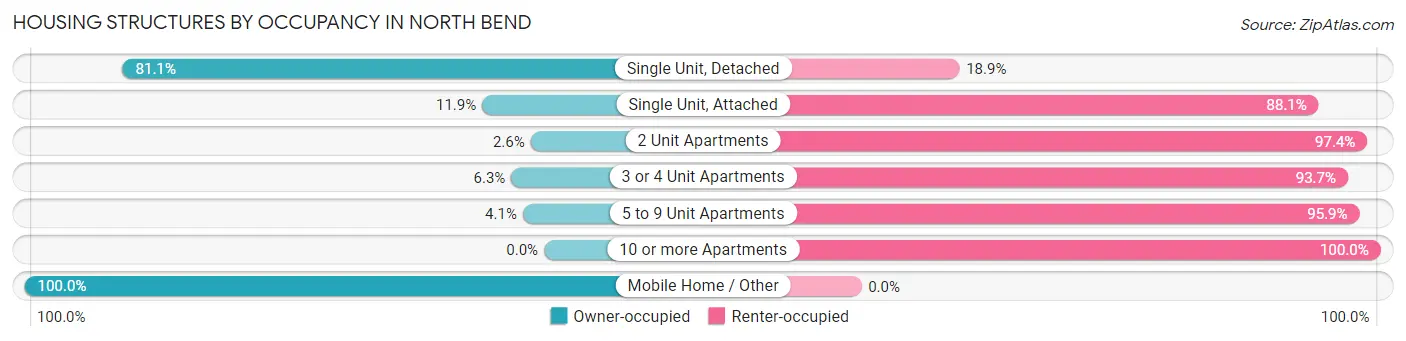
| Structure Type | Owner-occupied | Renter-occupied |
| Single Unit, Detached | 2,479 (81.1%) | 577 (18.9%) |
| Single Unit, Attached | 13 (11.9%) | 96 (88.1%) |
| 2 Unit Apartments | 7 (2.6%) | 264 (97.4%) |
| 3 or 4 Unit Apartments | 13 (6.3%) | 193 (93.7%) |
| 5 to 9 Unit Apartments | 13 (4.1%) | 305 (95.9%) |
| 10 or more Apartments | 0 (0.0%) | 324 (100.0%) |
| Mobile Home / Other | 20 (100.0%) | 0 (0.0%) |
| Total | 2,545 (59.1%) | 1,759 (40.9%) |
Housing Structures by Number of Rooms in North Bend
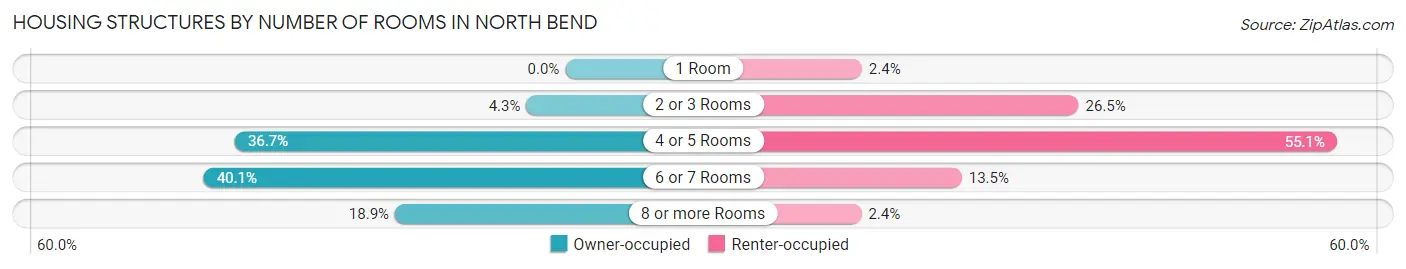
| Number of Rooms | Owner-occupied | Renter-occupied |
| 1 Room | 0 (0.0%) | 43 (2.4%) |
| 2 or 3 Rooms | 110 (4.3%) | 466 (26.5%) |
| 4 or 5 Rooms | 933 (36.7%) | 970 (55.1%) |
| 6 or 7 Rooms | 1,021 (40.1%) | 238 (13.5%) |
| 8 or more Rooms | 481 (18.9%) | 42 (2.4%) |
| Total | 2,545 (100.0%) | 1,759 (100.0%) |
Housing Structure by Heating Type in North Bend
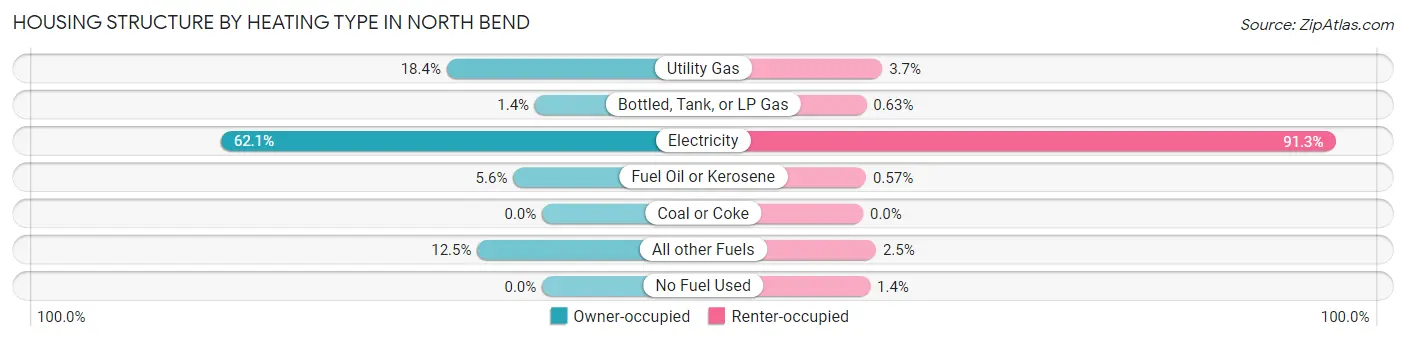
| Heating Type | Owner-occupied | Renter-occupied |
| Utility Gas | 469 (18.4%) | 65 (3.7%) |
| Bottled, Tank, or LP Gas | 35 (1.4%) | 11 (0.6%) |
| Electricity | 1,580 (62.1%) | 1,605 (91.2%) |
| Fuel Oil or Kerosene | 142 (5.6%) | 10 (0.6%) |
| Coal or Coke | 0 (0.0%) | 0 (0.0%) |
| All other Fuels | 319 (12.5%) | 44 (2.5%) |
| No Fuel Used | 0 (0.0%) | 24 (1.4%) |
| Total | 2,545 (100.0%) | 1,759 (100.0%) |
Household Vehicle Usage in North Bend
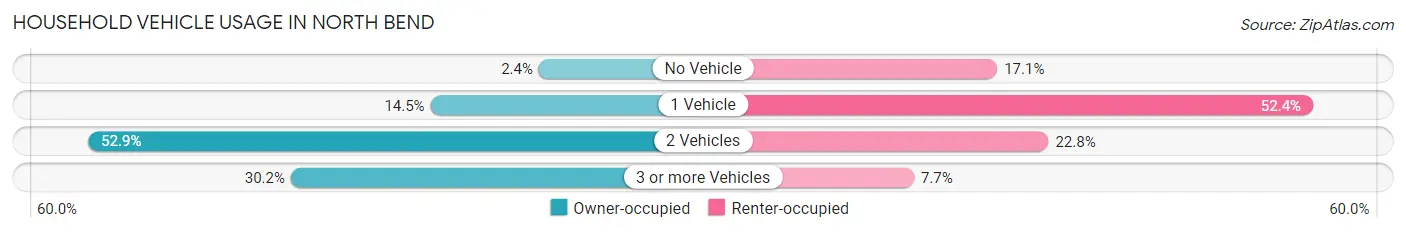
| Vehicles per Household | Owner-occupied | Renter-occupied |
| No Vehicle | 61 (2.4%) | 300 (17.1%) |
| 1 Vehicle | 370 (14.5%) | 922 (52.4%) |
| 2 Vehicles | 1,346 (52.9%) | 401 (22.8%) |
| 3 or more Vehicles | 768 (30.2%) | 136 (7.7%) |
| Total | 2,545 (100.0%) | 1,759 (100.0%) |
Real Estate & Mortgages in North Bend
Real Estate and Mortgage Overview in North Bend
| Characteristic | Without Mortgage | With Mortgage |
| Housing Units | 739 | 1,806 |
| Median Property Value | $277,500 | $283,300 |
| Median Household Income | $85,156 | $360 |
| Monthly Housing Costs | $556 | $63 |
| Real Estate Taxes | $2,484 | $40 |
Property Value by Mortgage Status in North Bend
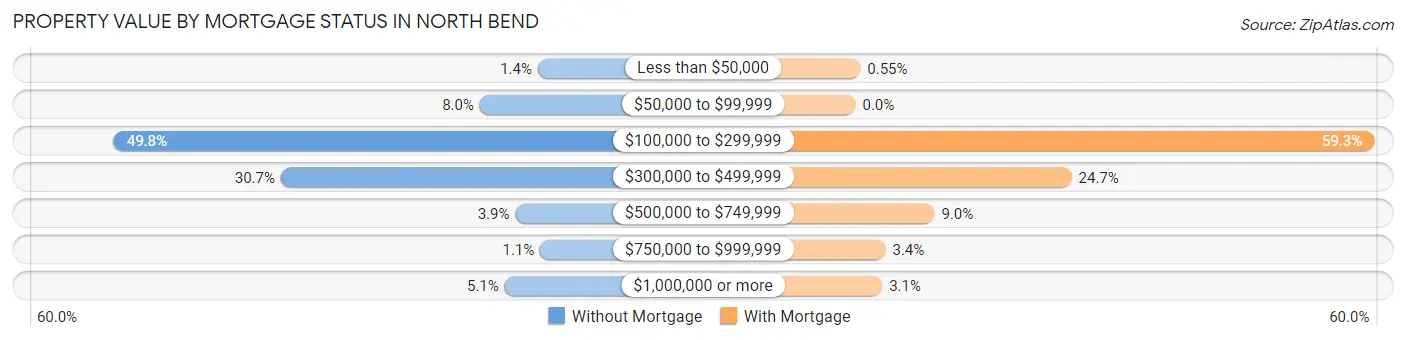
| Property Value | Without Mortgage | With Mortgage |
| Less than $50,000 | 10 (1.3%) | 10 (0.5%) |
| $50,000 to $99,999 | 59 (8.0%) | 0 (0.0%) |
| $100,000 to $299,999 | 368 (49.8%) | 1,070 (59.3%) |
| $300,000 to $499,999 | 227 (30.7%) | 446 (24.7%) |
| $500,000 to $749,999 | 29 (3.9%) | 163 (9.0%) |
| $750,000 to $999,999 | 8 (1.1%) | 62 (3.4%) |
| $1,000,000 or more | 38 (5.1%) | 55 (3.0%) |
| Total | 739 (100.0%) | 1,806 (100.0%) |
Household Income by Mortgage Status in North Bend
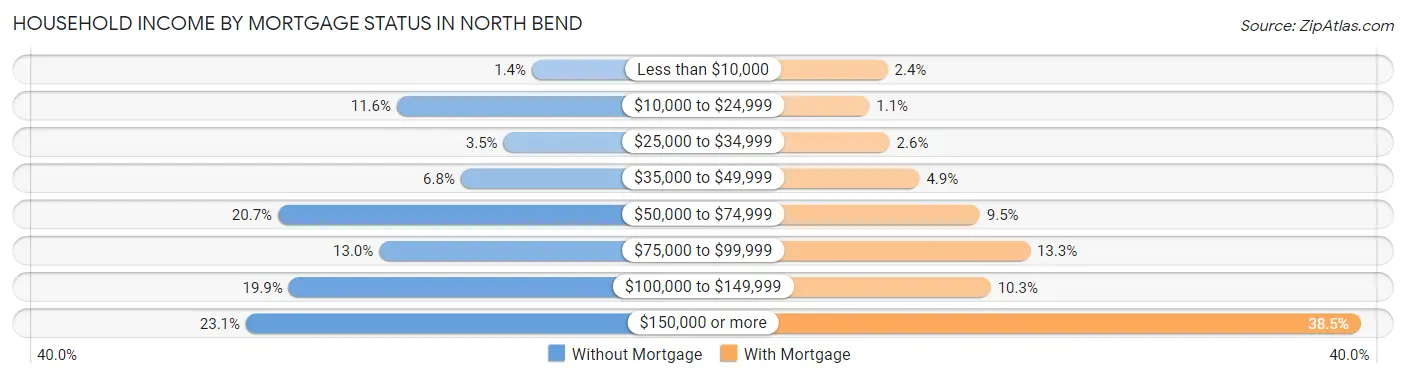
| Household Income | Without Mortgage | With Mortgage |
| Less than $10,000 | 10 (1.3%) | 44 (2.4%) |
| $10,000 to $24,999 | 86 (11.6%) | 19 (1.1%) |
| $25,000 to $34,999 | 26 (3.5%) | 47 (2.6%) |
| $35,000 to $49,999 | 50 (6.8%) | 88 (4.9%) |
| $50,000 to $74,999 | 153 (20.7%) | 171 (9.5%) |
| $75,000 to $99,999 | 96 (13.0%) | 240 (13.3%) |
| $100,000 to $149,999 | 147 (19.9%) | 186 (10.3%) |
| $150,000 or more | 171 (23.1%) | 695 (38.5%) |
| Total | 739 (100.0%) | 1,806 (100.0%) |
Property Value to Household Income Ratio in North Bend
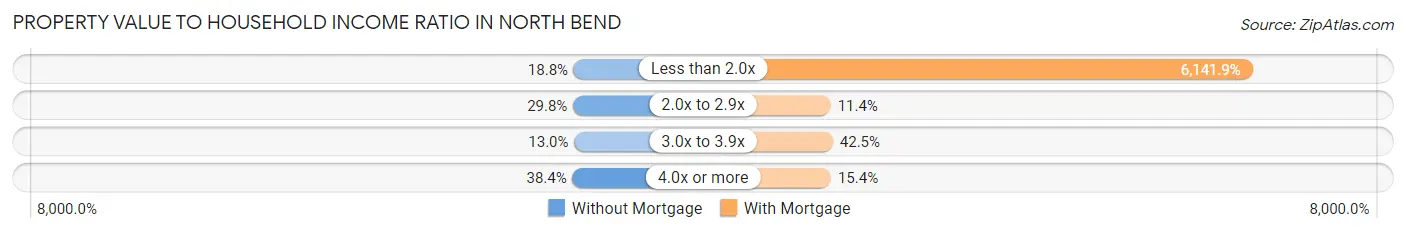
| Value-to-Income Ratio | Without Mortgage | With Mortgage |
| Less than 2.0x | 139 (18.8%) | 110,923 (6,141.9%) |
| 2.0x to 2.9x | 220 (29.8%) | 205 (11.4%) |
| 3.0x to 3.9x | 96 (13.0%) | 767 (42.5%) |
| 4.0x or more | 284 (38.4%) | 278 (15.4%) |
| Total | 739 (100.0%) | 1,806 (100.0%) |
Real Estate Taxes by Mortgage Status in North Bend
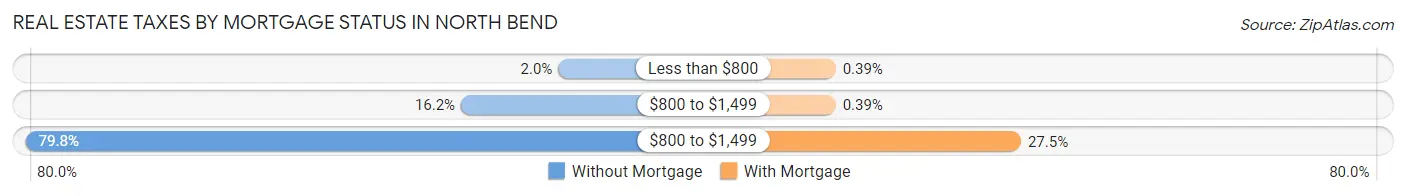
| Property Taxes | Without Mortgage | With Mortgage |
| Less than $800 | 15 (2.0%) | 7 (0.4%) |
| $800 to $1,499 | 120 (16.2%) | 7 (0.4%) |
| $800 to $1,499 | 590 (79.8%) | 496 (27.5%) |
| Total | 739 (100.0%) | 1,806 (100.0%) |
Health & Disability in North Bend
Health Insurance Coverage by Age in North Bend
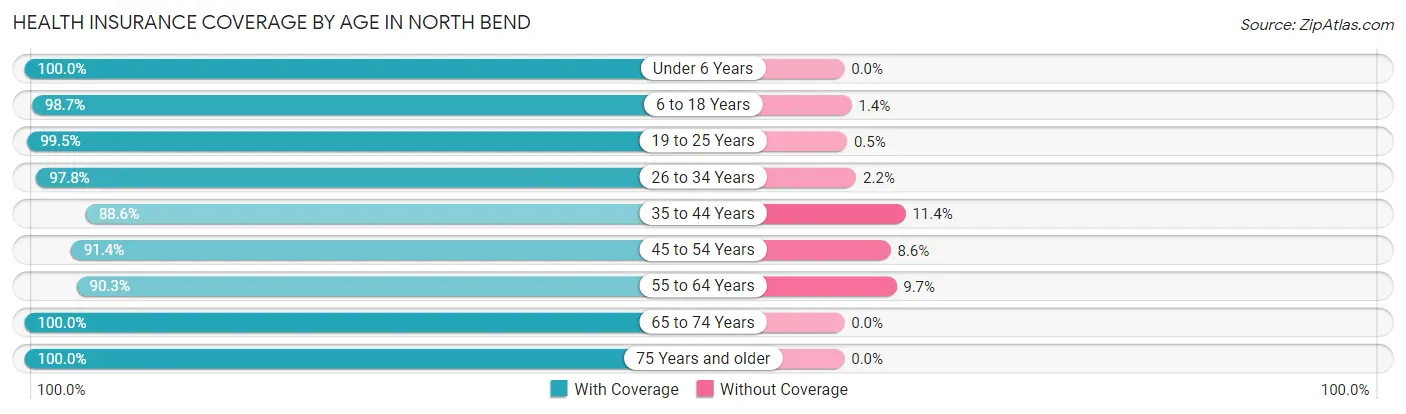
| Age Bracket | With Coverage | Without Coverage |
| Under 6 Years | 638 (100.0%) | 0 (0.0%) |
| 6 to 18 Years | 1,385 (98.7%) | 19 (1.3%) |
| 19 to 25 Years | 793 (99.5%) | 4 (0.5%) |
| 26 to 34 Years | 795 (97.8%) | 18 (2.2%) |
| 35 to 44 Years | 955 (88.6%) | 123 (11.4%) |
| 45 to 54 Years | 1,229 (91.4%) | 116 (8.6%) |
| 55 to 64 Years | 1,463 (90.3%) | 157 (9.7%) |
| 65 to 74 Years | 1,666 (100.0%) | 0 (0.0%) |
| 75 Years and older | 793 (100.0%) | 0 (0.0%) |
| Total | 9,717 (95.7%) | 437 (4.3%) |
Health Insurance Coverage by Citizenship Status in North Bend
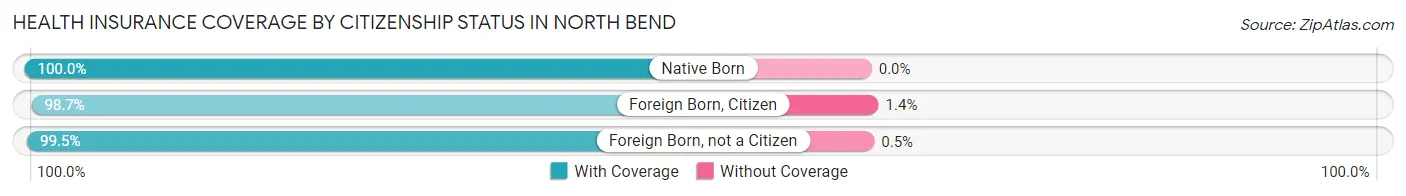
| Citizenship Status | With Coverage | Without Coverage |
| Native Born | 638 (100.0%) | 0 (0.0%) |
| Foreign Born, Citizen | 1,385 (98.7%) | 19 (1.3%) |
| Foreign Born, not a Citizen | 793 (99.5%) | 4 (0.5%) |
Health Insurance Coverage by Household Income in North Bend
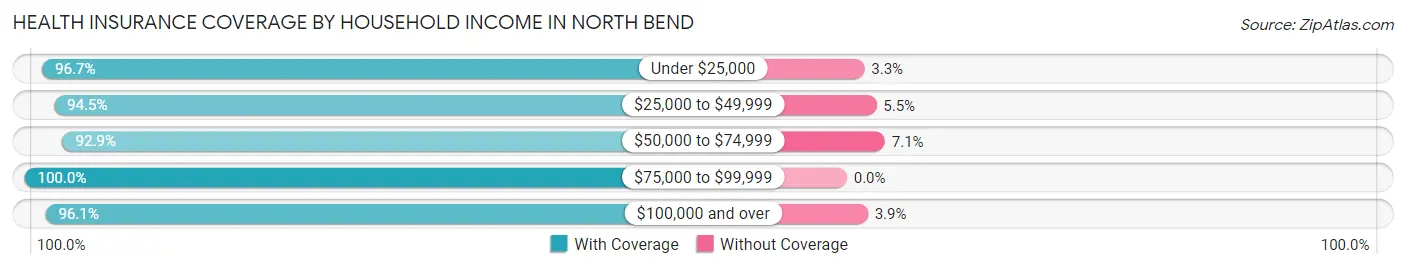
| Household Income | With Coverage | Without Coverage |
| Under $25,000 | 1,175 (96.7%) | 40 (3.3%) |
| $25,000 to $49,999 | 1,909 (94.5%) | 112 (5.5%) |
| $50,000 to $74,999 | 1,432 (92.9%) | 110 (7.1%) |
| $75,000 to $99,999 | 838 (100.0%) | 0 (0.0%) |
| $100,000 and over | 4,269 (96.1%) | 174 (3.9%) |
Public vs Private Health Insurance Coverage by Age in North Bend
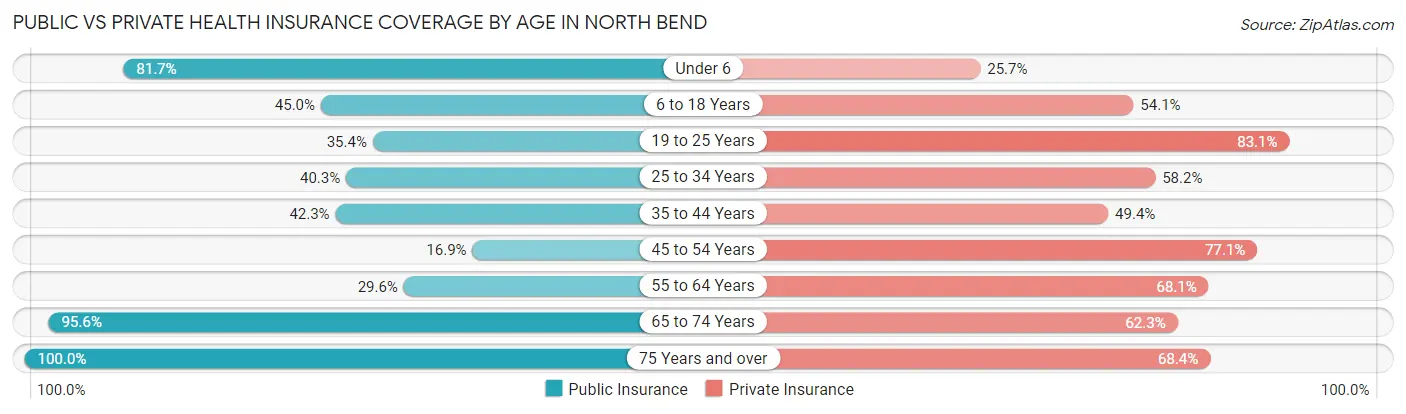
| Age Bracket | Public Insurance | Private Insurance |
| Under 6 | 521 (81.7%) | 164 (25.7%) |
| 6 to 18 Years | 632 (45.0%) | 760 (54.1%) |
| 19 to 25 Years | 282 (35.4%) | 662 (83.1%) |
| 25 to 34 Years | 328 (40.3%) | 473 (58.2%) |
| 35 to 44 Years | 456 (42.3%) | 533 (49.4%) |
| 45 to 54 Years | 227 (16.9%) | 1,037 (77.1%) |
| 55 to 64 Years | 480 (29.6%) | 1,103 (68.1%) |
| 65 to 74 Years | 1,592 (95.6%) | 1,038 (62.3%) |
| 75 Years and over | 793 (100.0%) | 542 (68.3%) |
| Total | 5,311 (52.3%) | 6,312 (62.2%) |
Disability Status by Sex by Age in North Bend
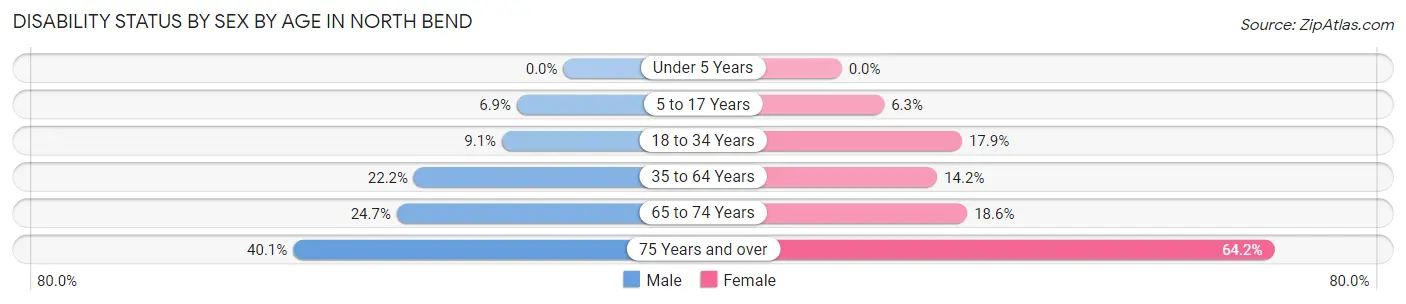
| Age Bracket | Male | Female |
| Under 5 Years | 0 (0.0%) | 0 (0.0%) |
| 5 to 17 Years | 71 (6.9%) | 30 (6.3%) |
| 18 to 34 Years | 64 (9.1%) | 178 (17.8%) |
| 35 to 64 Years | 470 (22.2%) | 273 (14.2%) |
| 65 to 74 Years | 189 (24.7%) | 168 (18.6%) |
| 75 Years and over | 122 (40.1%) | 314 (64.2%) |
Disability Class by Sex by Age in North Bend
Disability Class: Hearing Difficulty
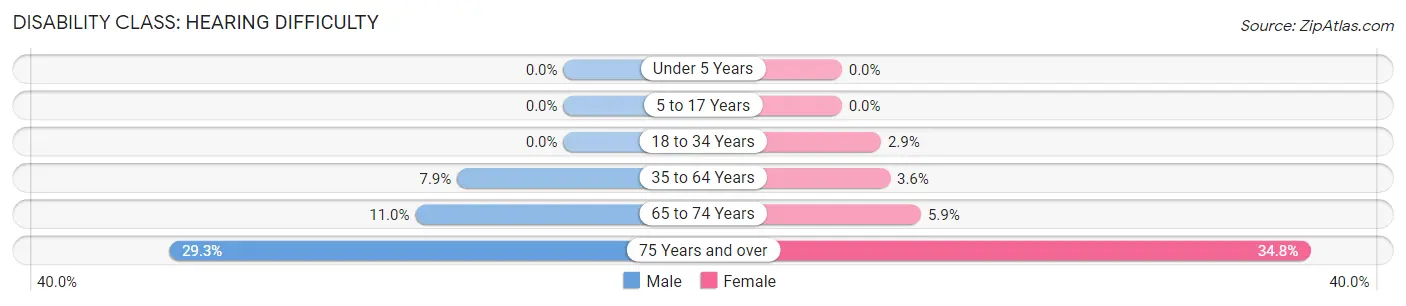
| Age Bracket | Male | Female |
| Under 5 Years | 0 (0.0%) | 0 (0.0%) |
| 5 to 17 Years | 0 (0.0%) | 0 (0.0%) |
| 18 to 34 Years | 0 (0.0%) | 29 (2.9%) |
| 35 to 64 Years | 167 (7.9%) | 69 (3.6%) |
| 65 to 74 Years | 84 (11.0%) | 53 (5.9%) |
| 75 Years and over | 89 (29.3%) | 170 (34.8%) |
Disability Class: Vision Difficulty
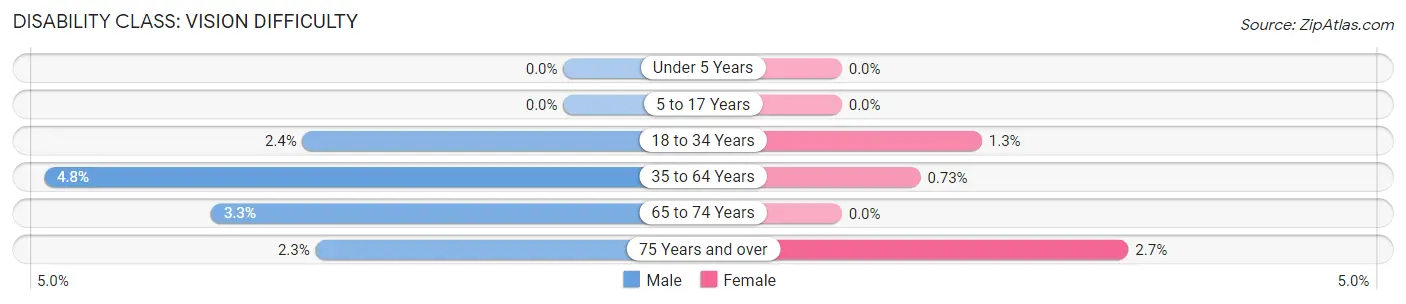
| Age Bracket | Male | Female |
| Under 5 Years | 0 (0.0%) | 0 (0.0%) |
| 5 to 17 Years | 0 (0.0%) | 0 (0.0%) |
| 18 to 34 Years | 17 (2.4%) | 13 (1.3%) |
| 35 to 64 Years | 102 (4.8%) | 14 (0.7%) |
| 65 to 74 Years | 25 (3.3%) | 0 (0.0%) |
| 75 Years and over | 7 (2.3%) | 13 (2.7%) |
Disability Class: Cognitive Difficulty
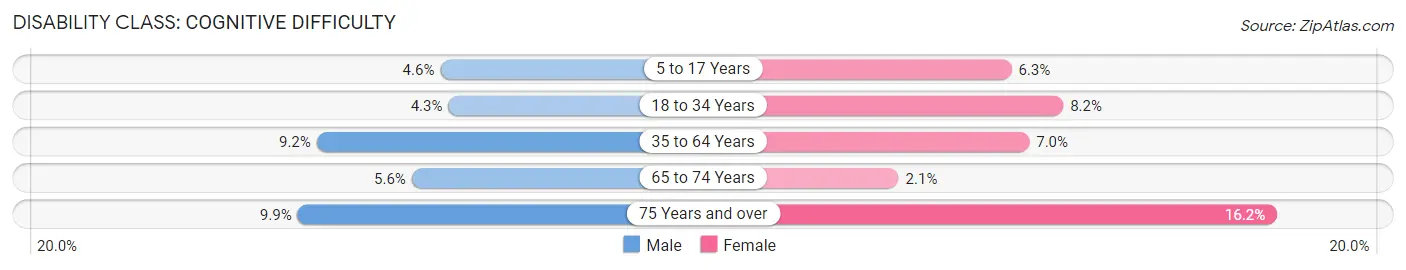
| Age Bracket | Male | Female |
| 5 to 17 Years | 47 (4.6%) | 30 (6.3%) |
| 18 to 34 Years | 30 (4.3%) | 82 (8.2%) |
| 35 to 64 Years | 194 (9.2%) | 134 (7.0%) |
| 65 to 74 Years | 43 (5.6%) | 19 (2.1%) |
| 75 Years and over | 30 (9.9%) | 79 (16.2%) |
Disability Class: Ambulatory Difficulty
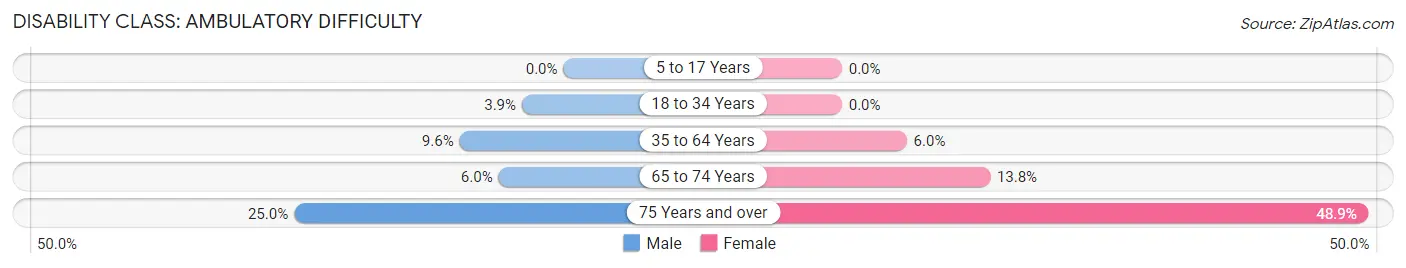
| Age Bracket | Male | Female |
| 5 to 17 Years | 0 (0.0%) | 0 (0.0%) |
| 18 to 34 Years | 27 (3.8%) | 0 (0.0%) |
| 35 to 64 Years | 204 (9.6%) | 116 (6.0%) |
| 65 to 74 Years | 46 (6.0%) | 124 (13.8%) |
| 75 Years and over | 76 (25.0%) | 239 (48.9%) |
Disability Class: Self-Care Difficulty
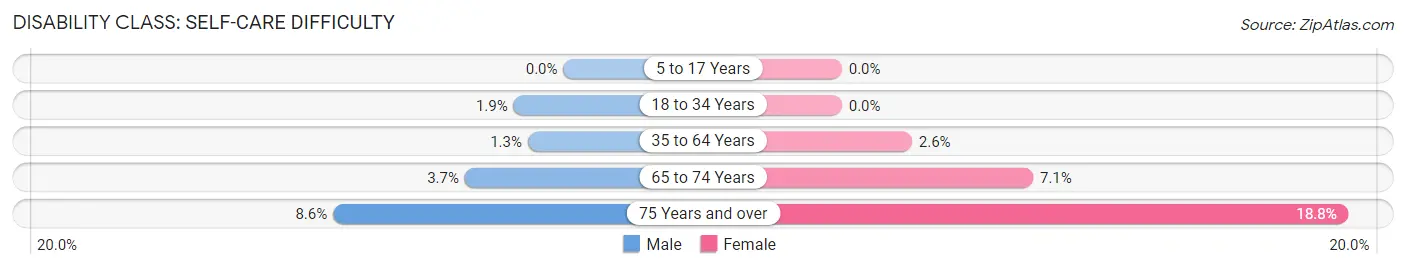
| Age Bracket | Male | Female |
| 5 to 17 Years | 0 (0.0%) | 0 (0.0%) |
| 18 to 34 Years | 13 (1.8%) | 0 (0.0%) |
| 35 to 64 Years | 28 (1.3%) | 50 (2.6%) |
| 65 to 74 Years | 28 (3.7%) | 64 (7.1%) |
| 75 Years and over | 26 (8.6%) | 92 (18.8%) |
Technology Access in North Bend
Computing Device Access in North Bend
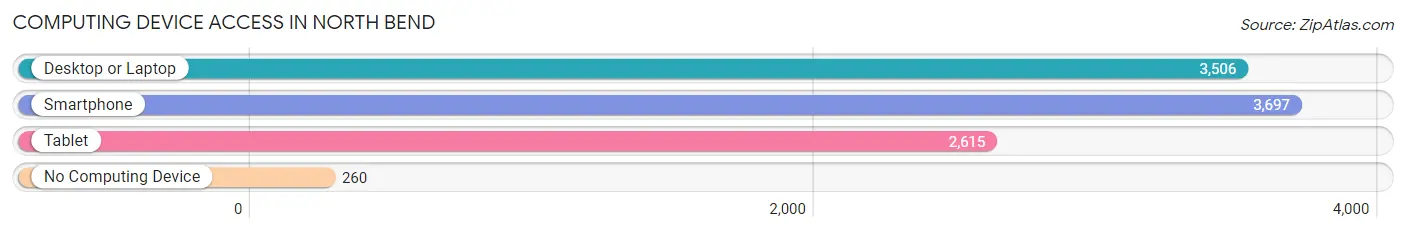
| Device Type | # Households | % Households |
| Desktop or Laptop | 3,506 | 81.5% |
| Smartphone | 3,697 | 85.9% |
| Tablet | 2,615 | 60.8% |
| No Computing Device | 260 | 6.0% |
| Total | 4,304 | 100.0% |
Internet Access in North Bend
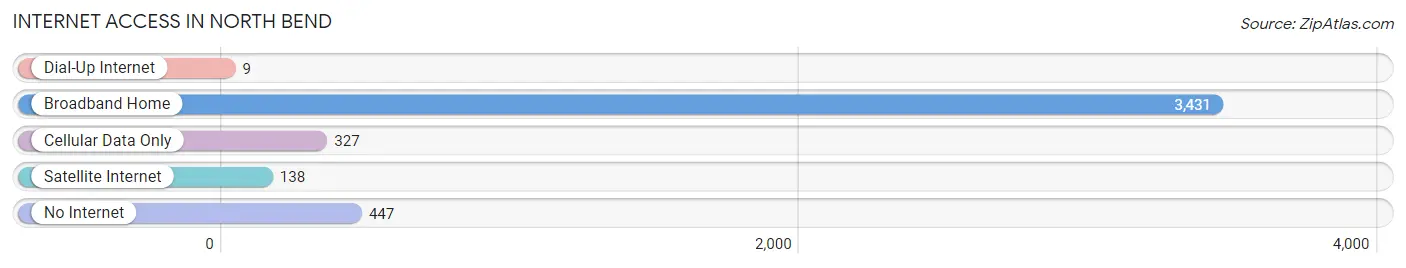
| Internet Type | # Households | % Households |
| Dial-Up Internet | 9 | 0.2% |
| Broadband Home | 3,431 | 79.7% |
| Cellular Data Only | 327 | 7.6% |
| Satellite Internet | 138 | 3.2% |
| No Internet | 447 | 10.4% |
| Total | 4,304 | 100.0% |
North Bend Summary
North Bend is a city located in Coos County, Oregon, United States. It is situated on the Coos Bay, an estuary of the Pacific Ocean. The city is located on the south side of the bay, approximately 25 miles south of Coos Bay and about 50 miles south of Eugene. The population of North Bend was 9,695 at the 2010 census.
Geography
North Bend is located at the mouth of the Coos River, which flows into the Coos Bay. The city is situated on the south side of the bay, approximately 25 miles south of Coos Bay and about 50 miles south of Eugene. The city is surrounded by the Coos Bay National Wildlife Refuge, which is home to a variety of wildlife, including bald eagles, ospreys, and other birds. The city is also located near the Oregon Dunes National Recreation Area, which is a popular destination for outdoor recreation.
The city has a total area of 8.2 square miles, of which 8.1 square miles is land and 0.1 square miles is water. The city is located at an elevation of approximately 20 feet above sea level.
History
North Bend was founded in 1853 by a group of settlers from the East Coast. The city was named after the nearby North Bend of the Coos River. The city was incorporated in 1891 and was the first city in Coos County to be incorporated.
The city was a major port for the lumber industry in the late 19th and early 20th centuries. The city was also a major center for the fishing industry, with a large fleet of fishing boats operating out of the city.
Economy
North Bend is a major center for the timber industry, with several large lumber mills located in the city. The city is also home to a number of other industries, including manufacturing, tourism, and retail.
The city is home to a number of major employers, including Georgia-Pacific, Coos Bay Lumber Company, and Oregon Pacific Bank. The city is also home to a number of smaller businesses, including restaurants, retail stores, and other services.
Demographics
As of the 2010 census, the population of North Bend was 9,695. The racial makeup of the city was 91.2% White, 0.7% African American, 0.7% Native American, 0.7% Asian, 0.2% Pacific Islander, 4.2% from other races, and 2.2% from two or more races. Hispanic or Latino of any race were 8.2% of the population.
The median income for a household in the city was $37,917, and the median income for a family was $45,917. The per capita income for the city was $20,917. About 13.2% of families and 16.2% of the population were below the poverty line, including 22.2% of those under age 18 and 8.2% of those age 65 or over.
North Bend is served by the Coos Bay School District, which includes North Bend High School, North Bend Middle School, and North Bend Elementary School. The city is also home to Southwestern Oregon Community College, which offers a variety of degree and certificate programs.
Common Questions
What is Per Capita Income in North Bend?
Per Capita income in North Bend is $40,699.
What is the Median Family Income in North Bend?
Median Family Income in North Bend is $90,192.
What is the Median Household income in North Bend?
Median Household Income in North Bend is $67,841.
What is Income or Wage Gap in North Bend?
Income or Wage Gap in North Bend is 9.7%.
Women in North Bend earn 90.3 cents for every dollar earned by a man.
What is Inequality or Gini Index in North Bend?
Inequality or Gini Index in North Bend is 0.47.
What is the Total Population of North Bend?
Total Population of North Bend is 10,250.
What is the Total Male Population of North Bend?
Total Male Population of North Bend is 5,162.
What is the Total Female Population of North Bend?
Total Female Population of North Bend is 5,088.
What is the Ratio of Males per 100 Females in North Bend?
There are 101.45 Males per 100 Females in North Bend.
What is the Ratio of Females per 100 Males in North Bend?
There are 98.57 Females per 100 Males in North Bend.
What is the Median Population Age in North Bend?
Median Population Age in North Bend is 48.9 Years.
What is the Average Family Size in North Bend
Average Family Size in North Bend is 2.8 People.
What is the Average Household Size in North Bend
Average Household Size in North Bend is 2.3 People.
How Large is the Labor Force in North Bend?
There are 5,283 People in the Labor Forcein in North Bend.
What is the Percentage of People in the Labor Force in North Bend?
60.5% of People are in the Labor Force in North Bend.
What is the Unemployment Rate in North Bend?
Unemployment Rate in North Bend is 7.8%.