Nehalem, OR Map & Demographics
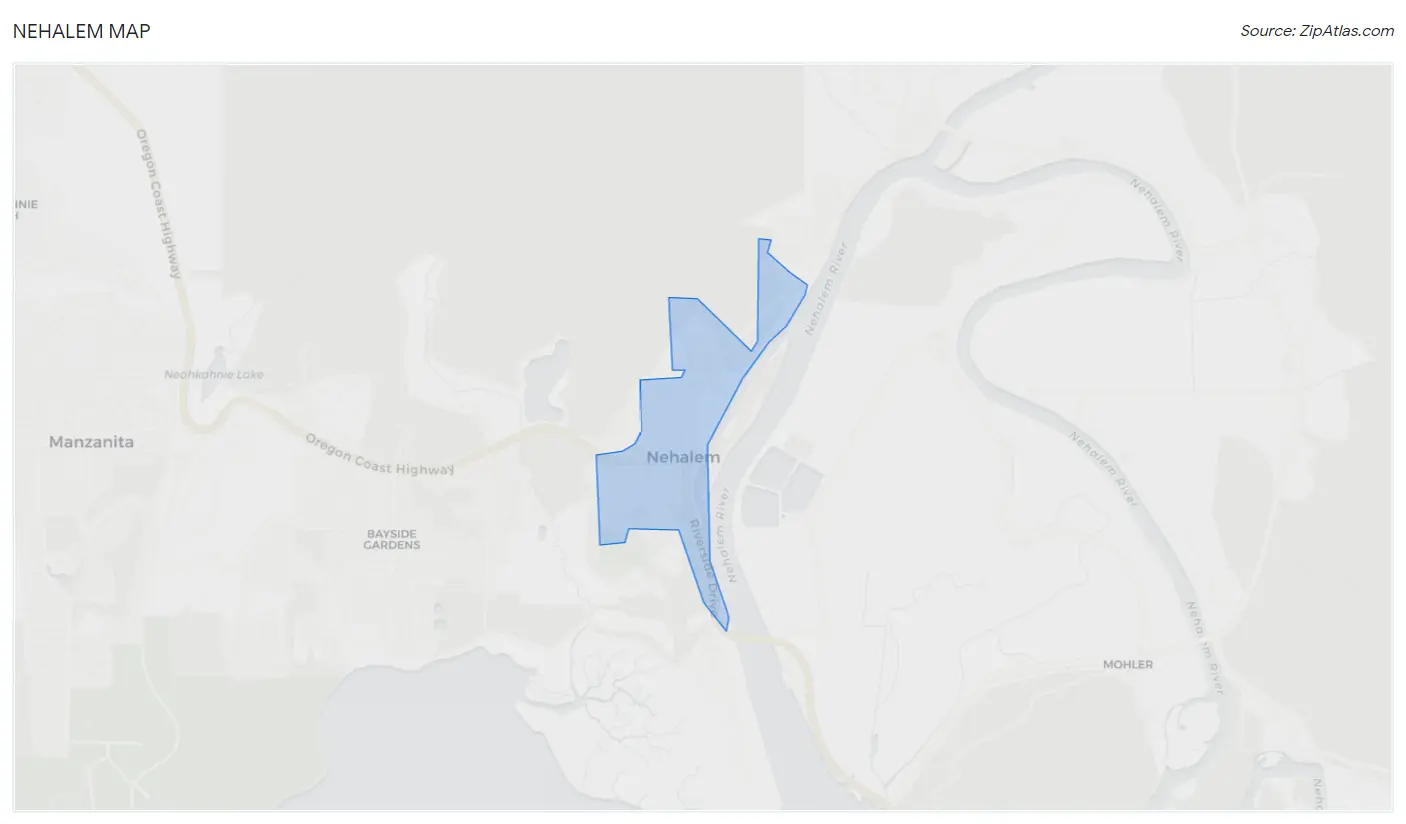
Nehalem Map
Nehalem Overview
$31,617
PER CAPITA INCOME
$74,531
AVG FAMILY INCOME
$66,964
AVG HOUSEHOLD INCOME
11.5%
WAGE / INCOME GAP [ % ]
88.5¢/ $1
WAGE / INCOME GAP [ $ ]
0.35
INEQUALITY / GINI INDEX
269
TOTAL POPULATION
134
MALE POPULATION
135
FEMALE POPULATION
99.26
MALES / 100 FEMALES
100.75
FEMALES / 100 MALES
52.6
MEDIAN AGE
2.6
AVG FAMILY SIZE
2.3
AVG HOUSEHOLD SIZE
152
LABOR FORCE [ PEOPLE ]
65.8%
PERCENT IN LABOR FORCE
15.8%
UNEMPLOYMENT RATE
Nehalem Zip Codes
Income in Nehalem
Income Overview in Nehalem
Per Capita Income in Nehalem is $31,617, while median incomes of families and households are $74,531 and $66,964 respectively.
| Characteristic | Number | Measure |
| Per Capita Income | 269 | $31,617 |
| Median Family Income | 73 | $74,531 |
| Mean Family Income | 73 | $85,225 |
| Median Household Income | 119 | $66,964 |
| Mean Household Income | 119 | $72,121 |
| Income Deficit | 73 | $0 |
| Wage / Income Gap (%) | 269 | 11.50% |
| Wage / Income Gap ($) | 269 | 88.50¢ per $1 |
| Gini / Inequality Index | 269 | 0.35 |
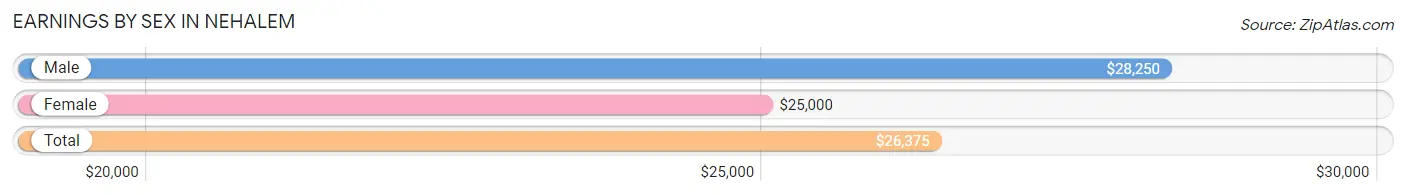
Earnings by Sex in Nehalem
Average Earnings in Nehalem are $26,375, $28,250 for men and $25,000 for women, a difference of 11.5%.
| Sex | Number | Average Earnings |
| Male | 81 (50.3%) | $28,250 |
| Female | 80 (49.7%) | $25,000 |
| Total | 161 (100.0%) | $26,375 |
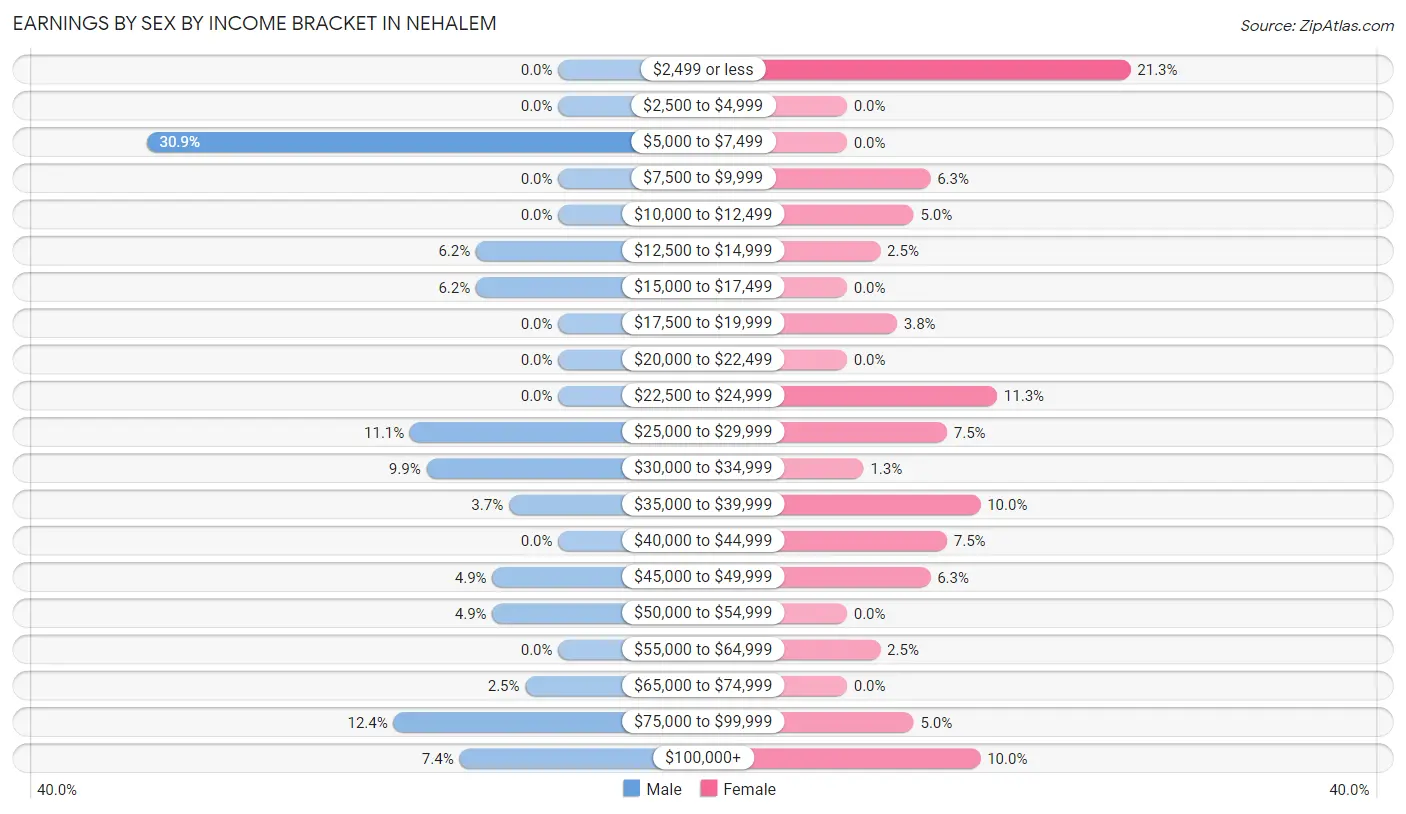
Earnings by Sex by Income Bracket in Nehalem
The most common earnings brackets in Nehalem are $5,000 to $7,499 for men (25 | 30.9%) and $2,499 or less for women (17 | 21.2%).
| Income | Male | Female |
| $2,499 or less | 0 (0.0%) | 17 (21.2%) |
| $2,500 to $4,999 | 0 (0.0%) | 0 (0.0%) |
| $5,000 to $7,499 | 25 (30.9%) | 0 (0.0%) |
| $7,500 to $9,999 | 0 (0.0%) | 5 (6.2%) |
| $10,000 to $12,499 | 0 (0.0%) | 4 (5.0%) |
| $12,500 to $14,999 | 5 (6.2%) | 2 (2.5%) |
| $15,000 to $17,499 | 5 (6.2%) | 0 (0.0%) |
| $17,500 to $19,999 | 0 (0.0%) | 3 (3.7%) |
| $20,000 to $22,499 | 0 (0.0%) | 0 (0.0%) |
| $22,500 to $24,999 | 0 (0.0%) | 9 (11.3%) |
| $25,000 to $29,999 | 9 (11.1%) | 6 (7.5%) |
| $30,000 to $34,999 | 8 (9.9%) | 1 (1.3%) |
| $35,000 to $39,999 | 3 (3.7%) | 8 (10.0%) |
| $40,000 to $44,999 | 0 (0.0%) | 6 (7.5%) |
| $45,000 to $49,999 | 4 (4.9%) | 5 (6.2%) |
| $50,000 to $54,999 | 4 (4.9%) | 0 (0.0%) |
| $55,000 to $64,999 | 0 (0.0%) | 2 (2.5%) |
| $65,000 to $74,999 | 2 (2.5%) | 0 (0.0%) |
| $75,000 to $99,999 | 10 (12.3%) | 4 (5.0%) |
| $100,000+ | 6 (7.4%) | 8 (10.0%) |
| Total | 81 (100.0%) | 80 (100.0%) |
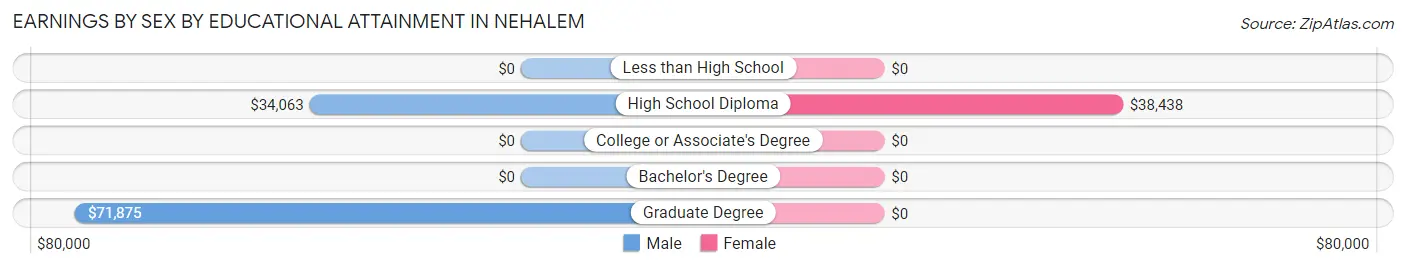
Earnings by Sex by Educational Attainment in Nehalem
Average earnings in Nehalem are $28,250 for men and $25,833 for women, a difference of 8.6%. Men with an educational attainment of graduate degree enjoy the highest average annual earnings of $71,875, while those with high school diploma education earn the least with $34,063. Women with an educational attainment of high school diploma earn the most with the average annual earnings of $38,438, while those with high school diploma education have the smallest earnings of $38,438.
| Educational Attainment | Male Income | Female Income |
| Less than High School | - | - |
| High School Diploma | $34,063 | $38,438 |
| College or Associate's Degree | - | - |
| Bachelor's Degree | - | - |
| Graduate Degree | $71,875 | $0 |
| Total | $28,250 | $25,833 |
Family Income in Nehalem
Family Income Brackets in Nehalem
According to the Nehalem family income data, there are 18 families falling into the $50,000 to $74,999 income range, which is the most common income bracket and makes up 24.7% of all families.
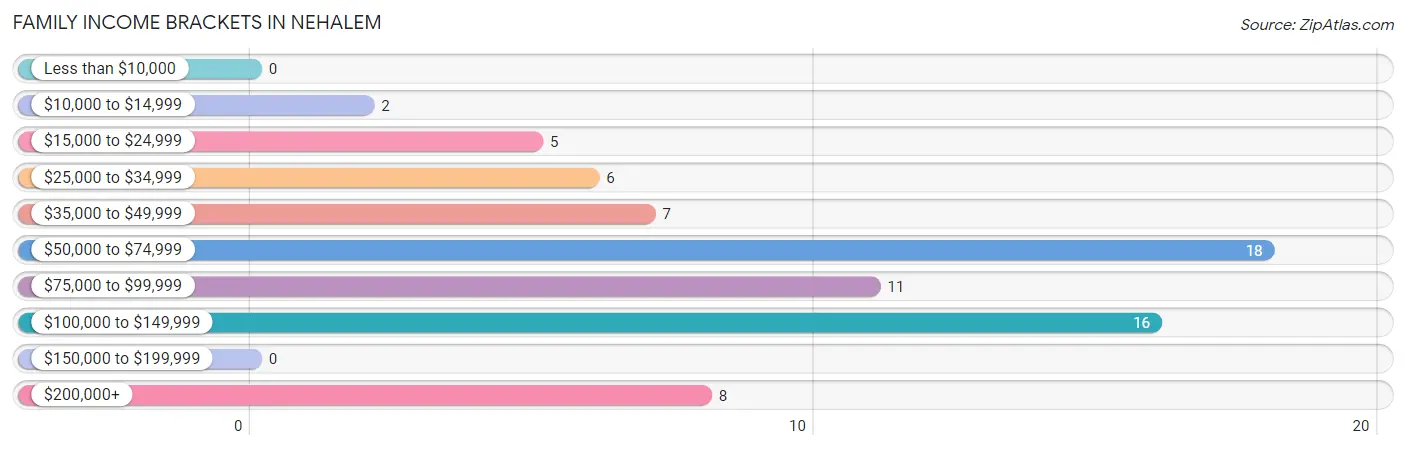
| Income Bracket | # Families | % Families |
| Less than $10,000 | 0 | 0.0% |
| $10,000 to $14,999 | 2 | 2.7% |
| $15,000 to $24,999 | 5 | 6.8% |
| $25,000 to $34,999 | 6 | 8.2% |
| $35,000 to $49,999 | 7 | 9.6% |
| $50,000 to $74,999 | 18 | 24.7% |
| $75,000 to $99,999 | 11 | 15.1% |
| $100,000 to $149,999 | 16 | 21.9% |
| $150,000 to $199,999 | 0 | 0.0% |
| $200,000+ | 8 | 11.0% |
Family Income by Famaliy Size in Nehalem
3-person families (11 | 15.1%) account for the highest median family income in Nehalem with $109,219 per family, while 2-person families (56 | 76.7%) have the highest median income of $36,875 per family member.
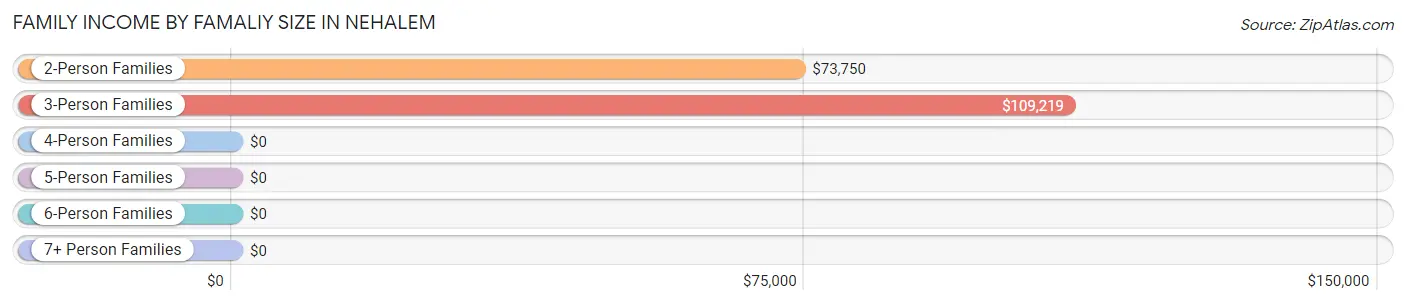
| Income Bracket | # Families | Median Income |
| 2-Person Families | 56 (76.7%) | $73,750 |
| 3-Person Families | 11 (15.1%) | $109,219 |
| 4-Person Families | 0 (0.0%) | $0 |
| 5-Person Families | 0 (0.0%) | $0 |
| 6-Person Families | 0 (0.0%) | $0 |
| 7+ Person Families | 6 (8.2%) | $0 |
| Total | 73 (100.0%) | $74,531 |
Family Income by Number of Earners in Nehalem
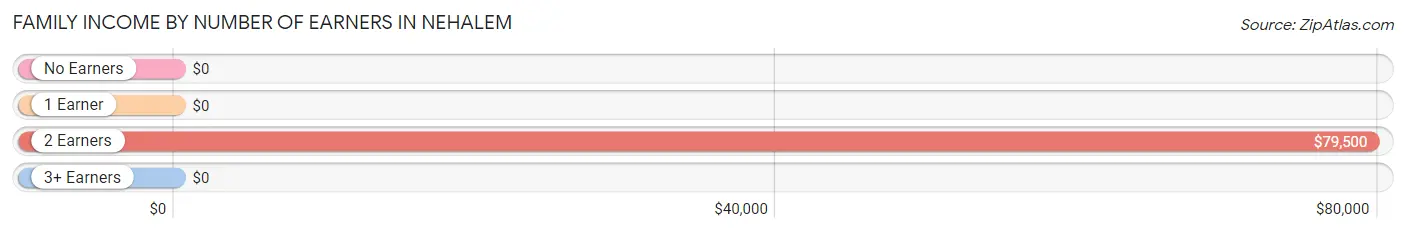
| Number of Earners | # Families | Median Income |
| No Earners | 6 (8.2%) | $0 |
| 1 Earner | 17 (23.3%) | $0 |
| 2 Earners | 50 (68.5%) | $79,500 |
| 3+ Earners | 0 (0.0%) | $0 |
| Total | 73 (100.0%) | $74,531 |
Household Income in Nehalem
Household Income Brackets in Nehalem
With 25 households falling in the category, the $50,000 to $74,999 income range is the most frequent in Nehalem, accounting for 21.0% of all households.
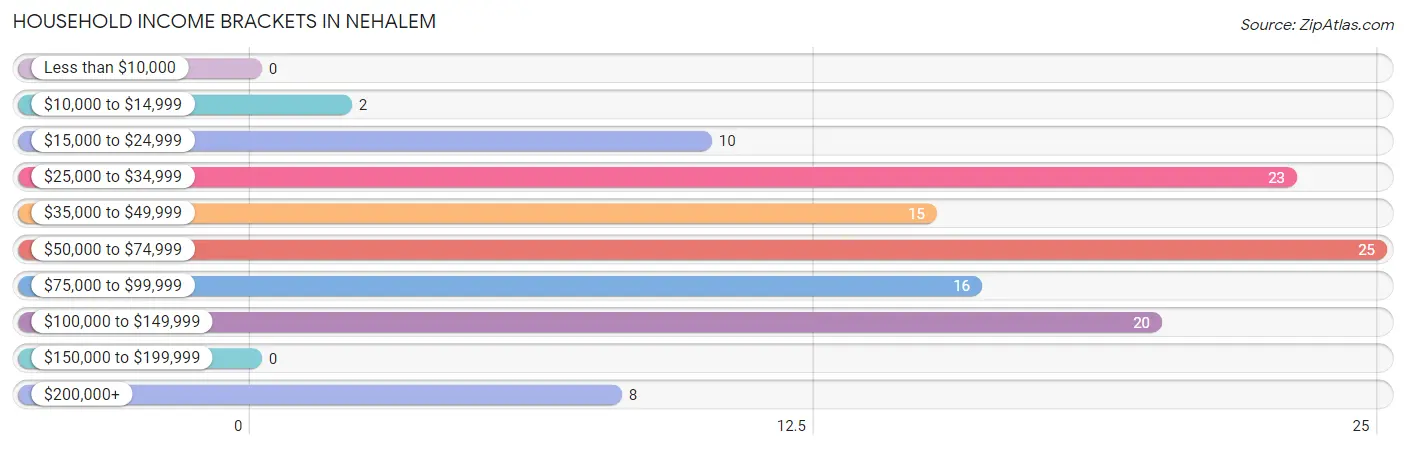
| Income Bracket | # Households | % Households |
| Less than $10,000 | 0 | 0.0% |
| $10,000 to $14,999 | 2 | 1.7% |
| $15,000 to $24,999 | 10 | 8.4% |
| $25,000 to $34,999 | 23 | 19.3% |
| $35,000 to $49,999 | 15 | 12.6% |
| $50,000 to $74,999 | 25 | 21.0% |
| $75,000 to $99,999 | 16 | 13.4% |
| $100,000 to $149,999 | 20 | 16.8% |
| $150,000 to $199,999 | 0 | 0.0% |
| $200,000+ | 8 | 6.7% |
Household Income by Householder Age in Nehalem
The median household income in Nehalem is $66,964, with the highest median household income of $91,875 found in the 25 to 44 years age bracket for the primary householder. A total of 22 households (18.5%) fall into this category.
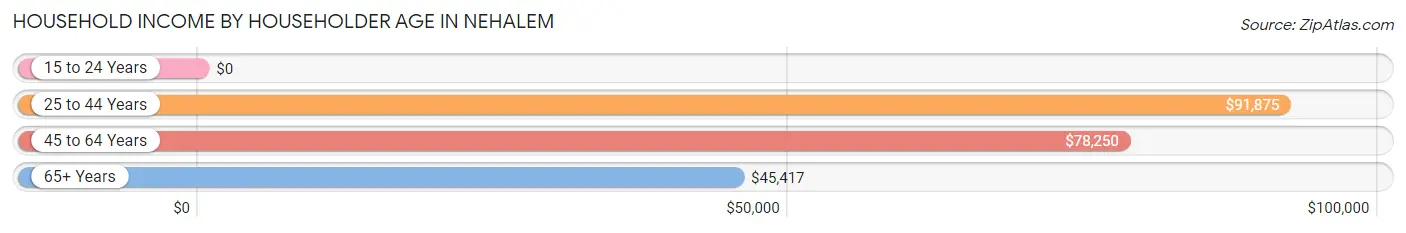
| Income Bracket | # Households | Median Income |
| 15 to 24 Years | 0 (0.0%) | $0 |
| 25 to 44 Years | 22 (18.5%) | $91,875 |
| 45 to 64 Years | 43 (36.1%) | $78,250 |
| 65+ Years | 54 (45.4%) | $45,417 |
| Total | 119 (100.0%) | $66,964 |
Poverty in Nehalem
Income Below Poverty by Sex and Age in Nehalem
With 10.4% poverty level for males and 23.0% for females among the residents of Nehalem, 16 and 17 year old males and 5 year old females are the most vulnerable to poverty, with 2 males (100.0%) and 5 females (100.0%) in their respective age groups living below the poverty level.
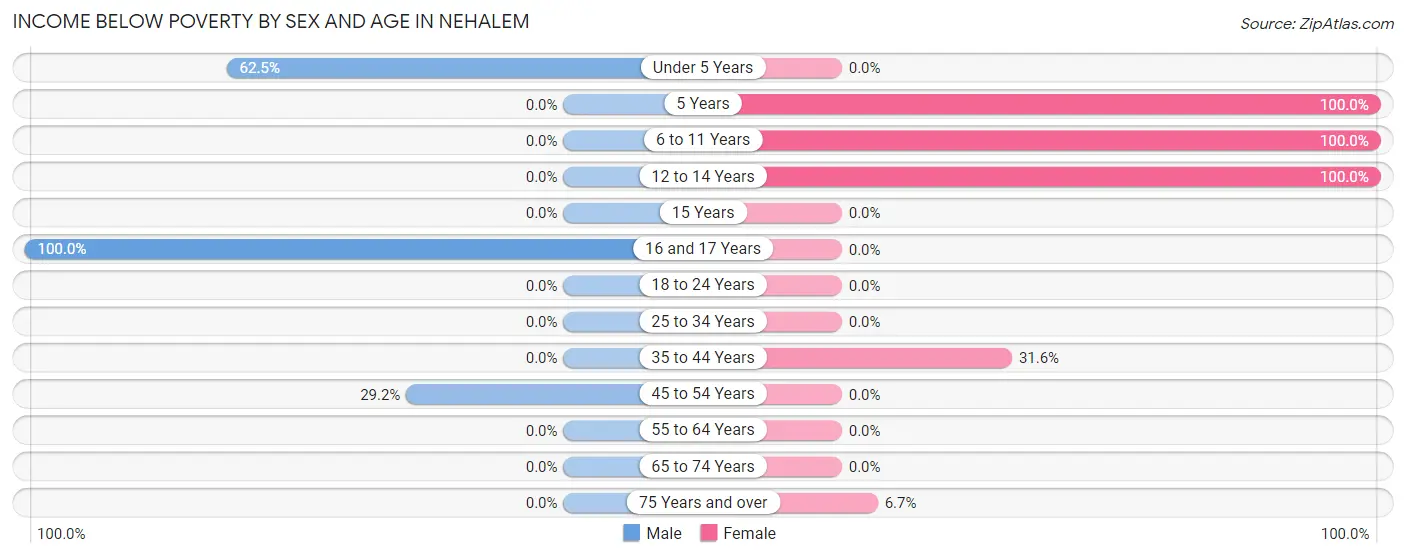
| Age Bracket | Male | Female |
| Under 5 Years | 5 (62.5%) | 0 (0.0%) |
| 5 Years | 0 (0.0%) | 5 (100.0%) |
| 6 to 11 Years | 0 (0.0%) | 6 (100.0%) |
| 12 to 14 Years | 0 (0.0%) | 12 (100.0%) |
| 15 Years | 0 (0.0%) | 0 (0.0%) |
| 16 and 17 Years | 2 (100.0%) | 0 (0.0%) |
| 18 to 24 Years | 0 (0.0%) | 0 (0.0%) |
| 25 to 34 Years | 0 (0.0%) | 0 (0.0%) |
| 35 to 44 Years | 0 (0.0%) | 6 (31.6%) |
| 45 to 54 Years | 7 (29.2%) | 0 (0.0%) |
| 55 to 64 Years | 0 (0.0%) | 0 (0.0%) |
| 65 to 74 Years | 0 (0.0%) | 0 (0.0%) |
| 75 Years and over | 0 (0.0%) | 2 (6.7%) |
| Total | 14 (10.4%) | 31 (23.0%) |
Income Above Poverty by Sex and Age in Nehalem
According to the poverty statistics in Nehalem, males aged 6 to 11 years and females aged 16 and 17 years are the age groups that are most secure financially, with 100.0% of males and 100.0% of females in these age groups living above the poverty line.
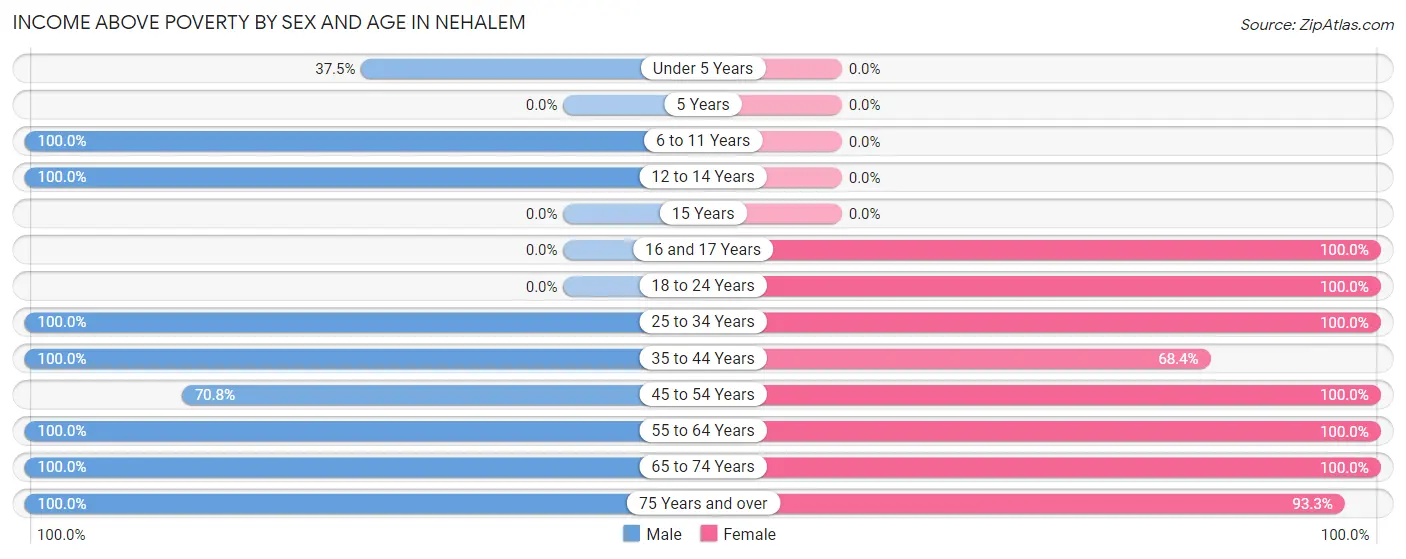
| Age Bracket | Male | Female |
| Under 5 Years | 3 (37.5%) | 0 (0.0%) |
| 5 Years | 0 (0.0%) | 0 (0.0%) |
| 6 to 11 Years | 5 (100.0%) | 0 (0.0%) |
| 12 to 14 Years | 2 (100.0%) | 0 (0.0%) |
| 15 Years | 0 (0.0%) | 0 (0.0%) |
| 16 and 17 Years | 0 (0.0%) | 3 (100.0%) |
| 18 to 24 Years | 0 (0.0%) | 4 (100.0%) |
| 25 to 34 Years | 28 (100.0%) | 5 (100.0%) |
| 35 to 44 Years | 9 (100.0%) | 13 (68.4%) |
| 45 to 54 Years | 17 (70.8%) | 25 (100.0%) |
| 55 to 64 Years | 16 (100.0%) | 16 (100.0%) |
| 65 to 74 Years | 26 (100.0%) | 10 (100.0%) |
| 75 Years and over | 14 (100.0%) | 28 (93.3%) |
| Total | 120 (89.5%) | 104 (77.0%) |
Income Below Poverty Among Married-Couple Families in Nehalem
The poverty statistics for married-couple families in Nehalem show that 10.2% or 6 of the total 59 families live below the poverty line. Families with 5 or more children have the highest poverty rate of 100.0%, comprising of 6 families. On the other hand, families with no children have the lowest poverty rate of 0.0%, which includes 0 families.
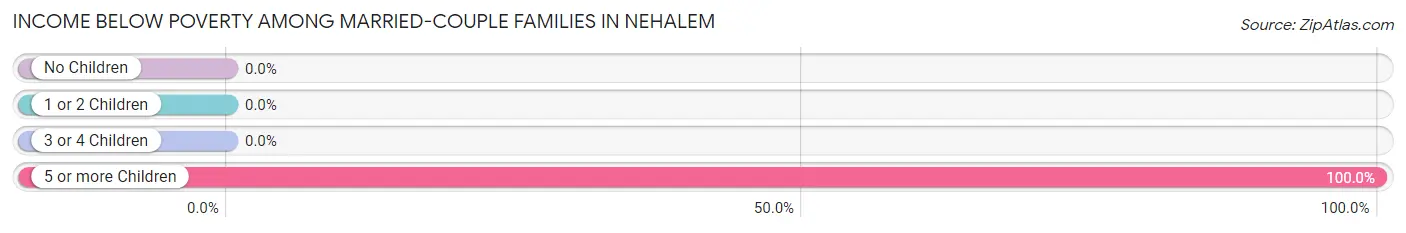
| Children | Above Poverty | Below Poverty |
| No Children | 42 (100.0%) | 0 (0.0%) |
| 1 or 2 Children | 11 (100.0%) | 0 (0.0%) |
| 3 or 4 Children | 0 (0.0%) | 0 (0.0%) |
| 5 or more Children | 0 (0.0%) | 6 (100.0%) |
| Total | 53 (89.8%) | 6 (10.2%) |
Income Below Poverty Among Single-Parent Households in Nehalem
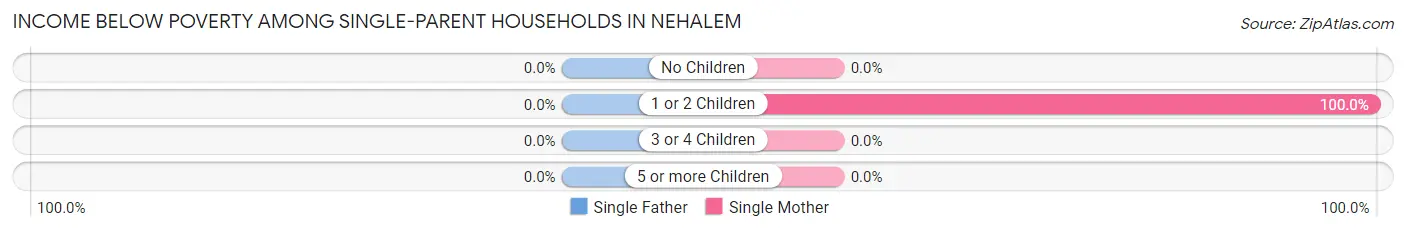
| Children | Single Father | Single Mother |
| No Children | 0 (0.0%) | 0 (0.0%) |
| 1 or 2 Children | 0 (0.0%) | 2 (100.0%) |
| 3 or 4 Children | 0 (0.0%) | 0 (0.0%) |
| 5 or more Children | 0 (0.0%) | 0 (0.0%) |
| Total | 0 (0.0%) | 2 (20.0%) |
Income Below Poverty Among Married-Couple vs Single-Parent Households in Nehalem
The poverty data for Nehalem shows that 6 of the married-couple family households (10.2%) and 2 of the single-parent households (14.3%) are living below the poverty level. Within the married-couple family households, those with 5 or more children have the highest poverty rate, with 6 households (100.0%) falling below the poverty line. Among the single-parent households, those with 1 or 2 children have the highest poverty rate, with 2 household (33.3%) living below poverty.
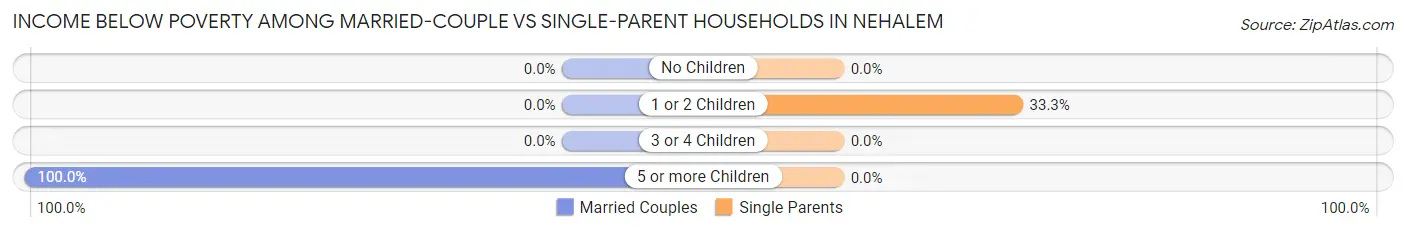
| Children | Married-Couple Families | Single-Parent Households |
| No Children | 0 (0.0%) | 0 (0.0%) |
| 1 or 2 Children | 0 (0.0%) | 2 (33.3%) |
| 3 or 4 Children | 0 (0.0%) | 0 (0.0%) |
| 5 or more Children | 6 (100.0%) | 0 (0.0%) |
| Total | 6 (10.2%) | 2 (14.3%) |
Race in Nehalem
The most populous races in Nehalem are White / Caucasian (238 | 88.5%), Two or more Races (25 | 9.3%), and Native / Alaskan (6 | 2.2%).
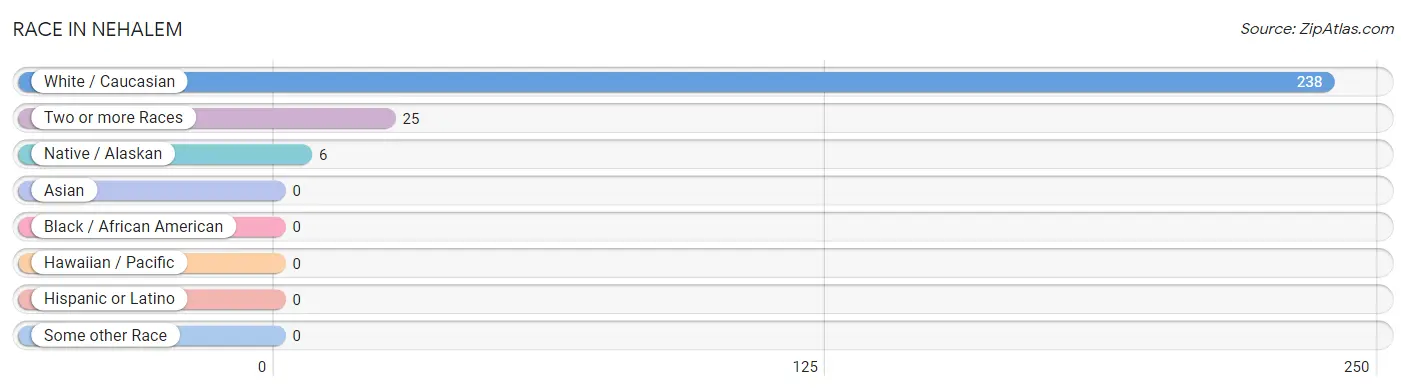
| Race | # Population | % Population |
| Asian | 0 | 0.0% |
| Black / African American | 0 | 0.0% |
| Hawaiian / Pacific | 0 | 0.0% |
| Hispanic or Latino | 0 | 0.0% |
| Native / Alaskan | 6 | 2.2% |
| White / Caucasian | 238 | 88.5% |
| Two or more Races | 25 | 9.3% |
| Some other Race | 0 | 0.0% |
| Total | 269 | 100.0% |
Ancestry in Nehalem
The most populous ancestries reported in Nehalem are German (67 | 24.9%), Irish (58 | 21.6%), English (25 | 9.3%), Norwegian (24 | 8.9%), and Swedish (18 | 6.7%), together accounting for 71.4% of all Nehalem residents.
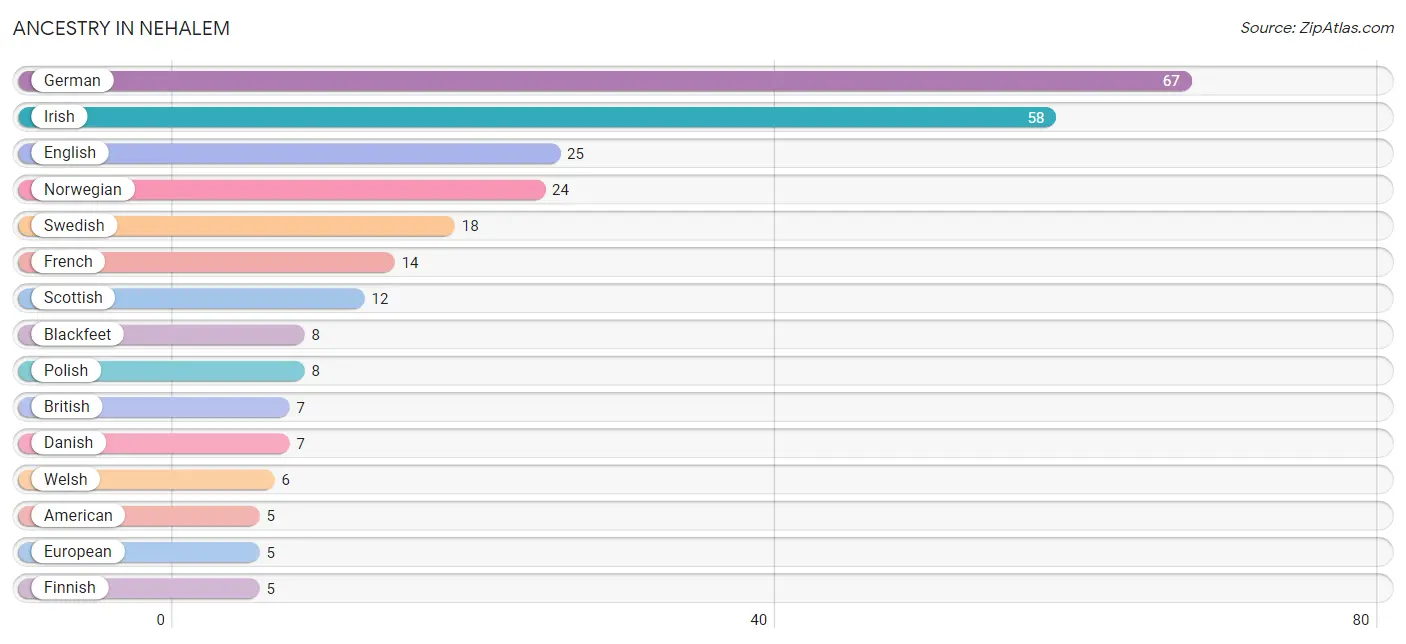
| Ancestry | # Population | % Population |
| Alaskan Athabascan | 2 | 0.7% |
| American | 5 | 1.9% |
| Blackfeet | 8 | 3.0% |
| British | 7 | 2.6% |
| Canadian | 4 | 1.5% |
| Danish | 7 | 2.6% |
| English | 25 | 9.3% |
| European | 5 | 1.9% |
| Finnish | 5 | 1.9% |
| French | 14 | 5.2% |
| French American Indian | 2 | 0.7% |
| French Canadian | 2 | 0.7% |
| German | 67 | 24.9% |
| Hungarian | 2 | 0.7% |
| Irish | 58 | 21.6% |
| Italian | 2 | 0.7% |
| Northern European | 4 | 1.5% |
| Norwegian | 24 | 8.9% |
| Polish | 8 | 3.0% |
| Scottish | 12 | 4.5% |
| Sioux | 4 | 1.5% |
| Swedish | 18 | 6.7% |
| Swiss | 2 | 0.7% |
| Welsh | 6 | 2.2% | View All 24 Rows |
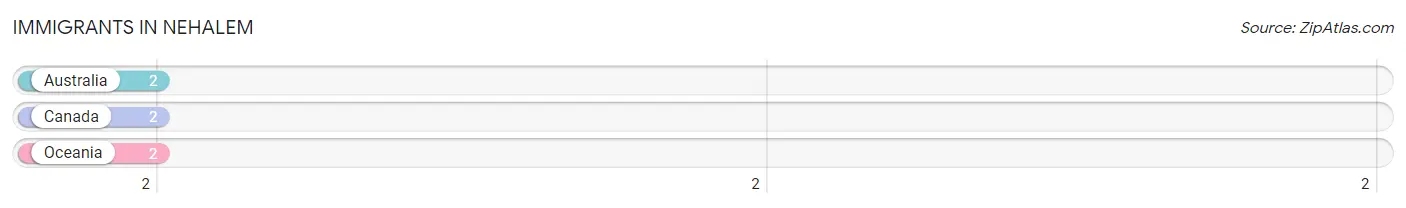
Immigrants in Nehalem
The most numerous immigrant groups reported in Nehalem came from Australia (2 | 0.7%), Canada (2 | 0.7%), and Oceania (2 | 0.7%), together accounting for 2.2% of all Nehalem residents.
| Immigration Origin | # Population | % Population |
| Australia | 2 | 0.7% |
| Canada | 2 | 0.7% |
| Oceania | 2 | 0.7% | View All 3 Rows |
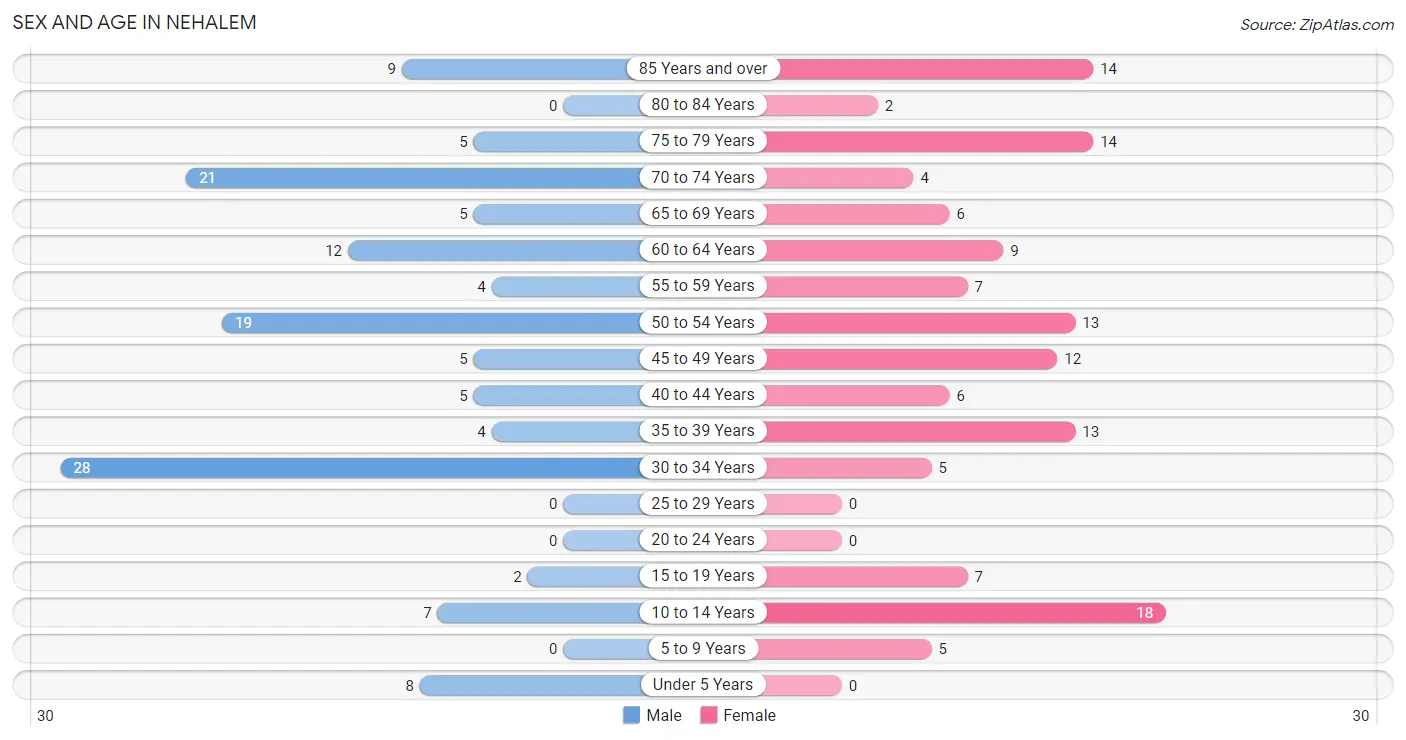
Sex and Age in Nehalem
Sex and Age in Nehalem
The most populous age groups in Nehalem are 30 to 34 Years (28 | 20.9%) for men and 10 to 14 Years (18 | 13.3%) for women.
| Age Bracket | Male | Female |
| Under 5 Years | 8 (6.0%) | 0 (0.0%) |
| 5 to 9 Years | 0 (0.0%) | 5 (3.7%) |
| 10 to 14 Years | 7 (5.2%) | 18 (13.3%) |
| 15 to 19 Years | 2 (1.5%) | 7 (5.2%) |
| 20 to 24 Years | 0 (0.0%) | 0 (0.0%) |
| 25 to 29 Years | 0 (0.0%) | 0 (0.0%) |
| 30 to 34 Years | 28 (20.9%) | 5 (3.7%) |
| 35 to 39 Years | 4 (3.0%) | 13 (9.6%) |
| 40 to 44 Years | 5 (3.7%) | 6 (4.4%) |
| 45 to 49 Years | 5 (3.7%) | 12 (8.9%) |
| 50 to 54 Years | 19 (14.2%) | 13 (9.6%) |
| 55 to 59 Years | 4 (3.0%) | 7 (5.2%) |
| 60 to 64 Years | 12 (9.0%) | 9 (6.7%) |
| 65 to 69 Years | 5 (3.7%) | 6 (4.4%) |
| 70 to 74 Years | 21 (15.7%) | 4 (3.0%) |
| 75 to 79 Years | 5 (3.7%) | 14 (10.4%) |
| 80 to 84 Years | 0 (0.0%) | 2 (1.5%) |
| 85 Years and over | 9 (6.7%) | 14 (10.4%) |
| Total | 134 (100.0%) | 135 (100.0%) |
Families and Households in Nehalem
Median Family Size in Nehalem
The median family size in Nehalem is 2.64 persons per family, with single female/mother families (10 | 13.7%) accounting for the largest median family size of 4 persons per family. On the other hand, single male/father families (4 | 5.5%) represent the smallest median family size with 1.75 persons per family.

| Family Type | # Families | Family Size |
| Married-Couple | 59 (80.8%) | 2.47 |
| Single Male/Father | 4 (5.5%) | 1.75 |
| Single Female/Mother | 10 (13.7%) | 4.00 |
| Total Families | 73 (100.0%) | 2.64 |
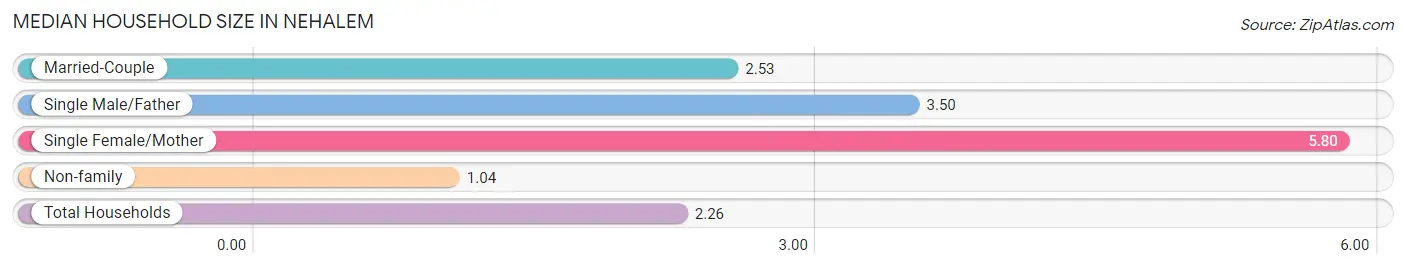
Median Household Size in Nehalem
The median household size in Nehalem is 2.26 persons per household, with single female/mother households (10 | 8.4%) accounting for the largest median household size of 5.8 persons per household. non-family households (46 | 38.7%) represent the smallest median household size with 1.04 persons per household.
| Household Type | # Households | Household Size |
| Married-Couple | 59 (49.6%) | 2.53 |
| Single Male/Father | 4 (3.4%) | 3.50 |
| Single Female/Mother | 10 (8.4%) | 5.80 |
| Non-family | 46 (38.7%) | 1.04 |
| Total Households | 119 (100.0%) | 2.26 |
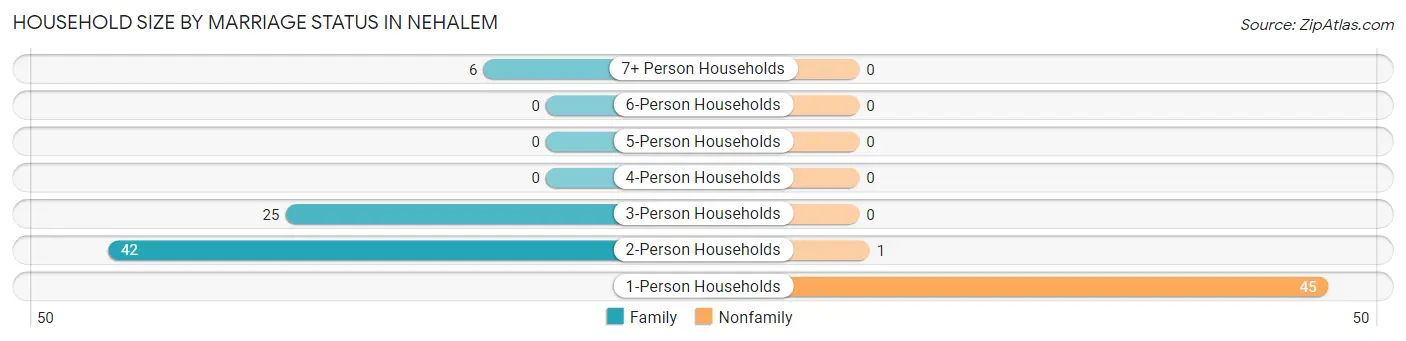
Household Size by Marriage Status in Nehalem
Out of a total of 119 households in Nehalem, 73 (61.3%) are family households, while 46 (38.7%) are nonfamily households. The most numerous type of family households are 2-person households, comprising 42, and the most common type of nonfamily households are 1-person households, comprising 45.
| Household Size | Family Households | Nonfamily Households |
| 1-Person Households | - | 45 (37.8%) |
| 2-Person Households | 42 (35.3%) | 1 (0.8%) |
| 3-Person Households | 25 (21.0%) | 0 (0.0%) |
| 4-Person Households | 0 (0.0%) | 0 (0.0%) |
| 5-Person Households | 0 (0.0%) | 0 (0.0%) |
| 6-Person Households | 0 (0.0%) | 0 (0.0%) |
| 7+ Person Households | 6 (5.0%) | 0 (0.0%) |
| Total | 73 (61.3%) | 46 (38.7%) |
Female Fertility in Nehalem
Fertility by Age in Nehalem
Average fertility rate in Nehalem is 163.0 births per 1,000 women. Women in the age bracket of 35 to 50 years have the highest fertility rate with 226.0 births per 1,000 women. Women in the age bracket of 35 to 50 years acount for 100.0% of all women with births.
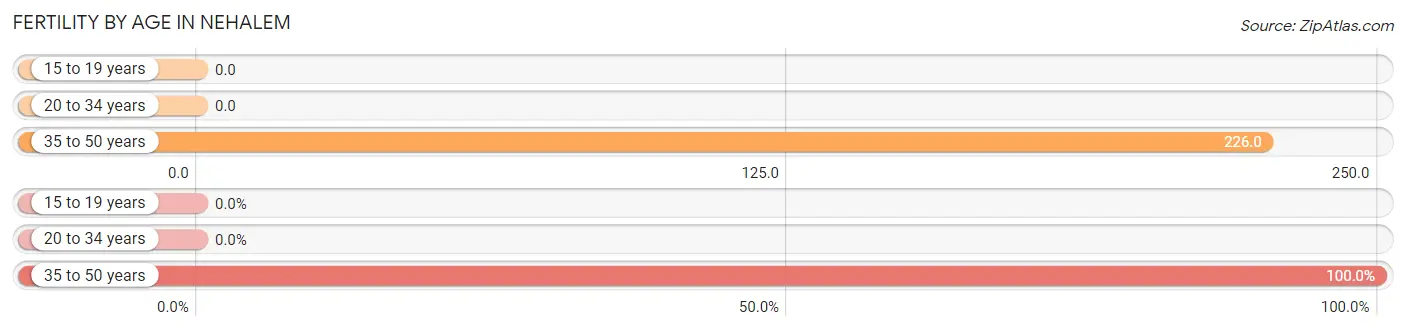
| Age Bracket | Women with Births | Births / 1,000 Women |
| 15 to 19 years | 0 (0.0%) | 0.0 |
| 20 to 34 years | 0 (0.0%) | 0.0 |
| 35 to 50 years | 7 (100.0%) | 226.0 |
| Total | 7 (100.0%) | 163.0 |
Fertility by Age by Marriage Status in Nehalem
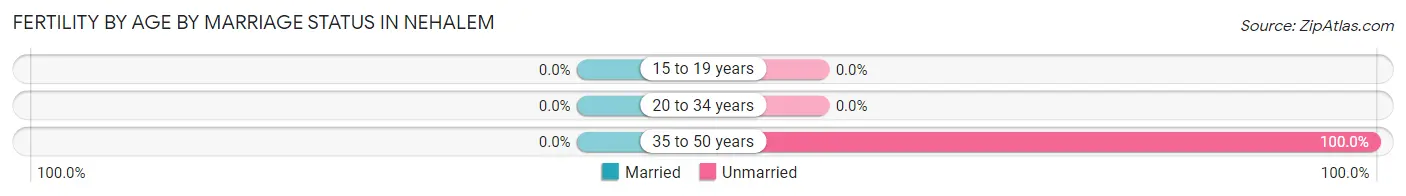
| Age Bracket | Married | Unmarried |
| 15 to 19 years | 0 (0.0%) | 0 (0.0%) |
| 20 to 34 years | 0 (0.0%) | 0 (0.0%) |
| 35 to 50 years | 0 (0.0%) | 7 (100.0%) |
| Total | 0 (0.0%) | 7 (100.0%) |
Fertility by Education in Nehalem
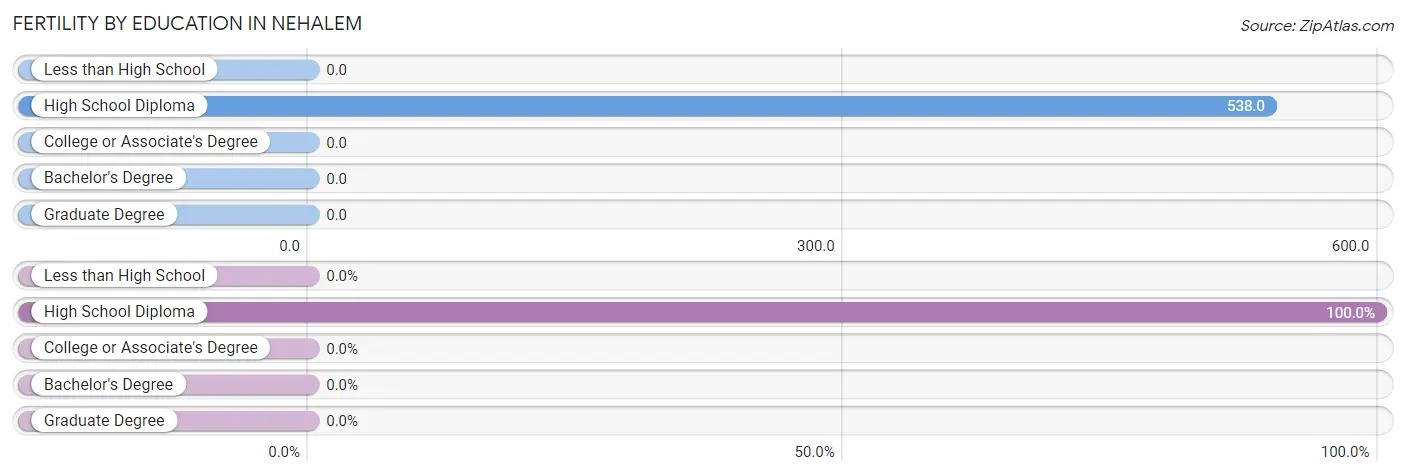
| Educational Attainment | Women with Births | Births / 1,000 Women |
| Less than High School | 0 (0.0%) | 0.0 |
| High School Diploma | 7 (100.0%) | 538.0 |
| College or Associate's Degree | 0 (0.0%) | 0.0 |
| Bachelor's Degree | 0 (0.0%) | 0.0 |
| Graduate Degree | 0 (0.0%) | 0.0 |
| Total | 7 (100.0%) | 163.0 |
Fertility by Education by Marriage Status in Nehalem
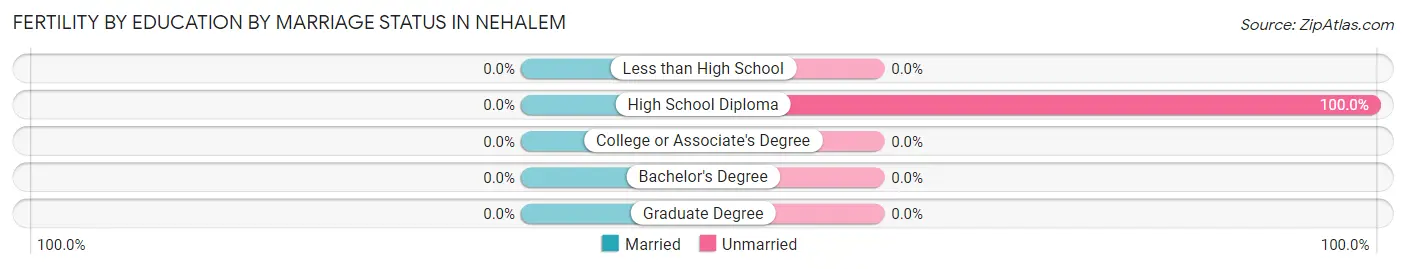
| Educational Attainment | Married | Unmarried |
| Less than High School | 0 (0.0%) | 0 (0.0%) |
| High School Diploma | 0 (0.0%) | 7 (100.0%) |
| College or Associate's Degree | 0 (0.0%) | 0 (0.0%) |
| Bachelor's Degree | 0 (0.0%) | 0 (0.0%) |
| Graduate Degree | 0 (0.0%) | 0 (0.0%) |
| Total | 0 (0.0%) | 7 (100.0%) |
Employment Characteristics in Nehalem
Employment by Class of Employer in Nehalem
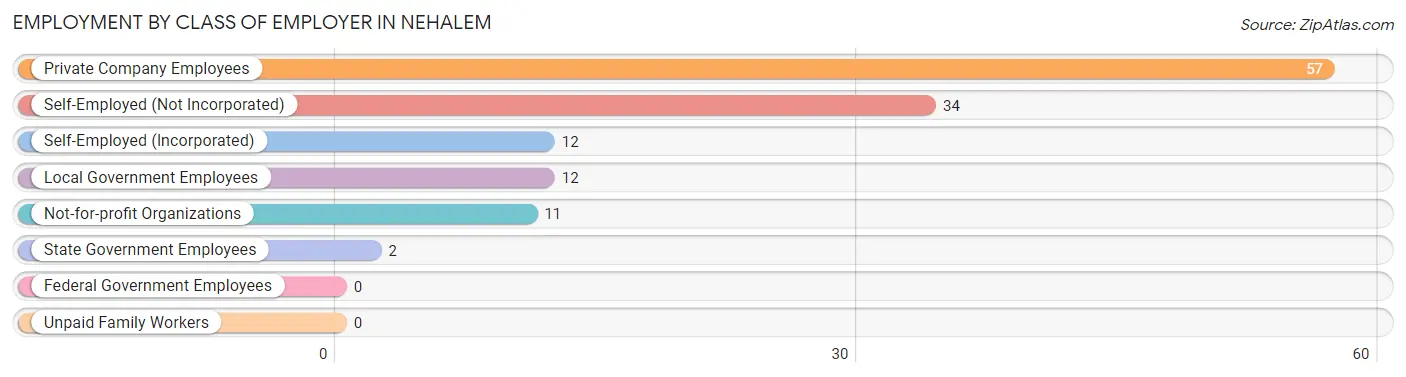
Among the 128 employed individuals in Nehalem, private company employees (57 | 44.5%), self-employed (not incorporated) (34 | 26.6%), and self-employed (incorporated) (12 | 9.4%) make up the most common classes of employment.
| Employer Class | # Employees | % Employees |
| Private Company Employees | 57 | 44.5% |
| Self-Employed (Incorporated) | 12 | 9.4% |
| Self-Employed (Not Incorporated) | 34 | 26.6% |
| Not-for-profit Organizations | 11 | 8.6% |
| Local Government Employees | 12 | 9.4% |
| State Government Employees | 2 | 1.6% |
| Federal Government Employees | 0 | 0.0% |
| Unpaid Family Workers | 0 | 0.0% |
| Total | 128 | 100.0% |
Employment Status by Age in Nehalem
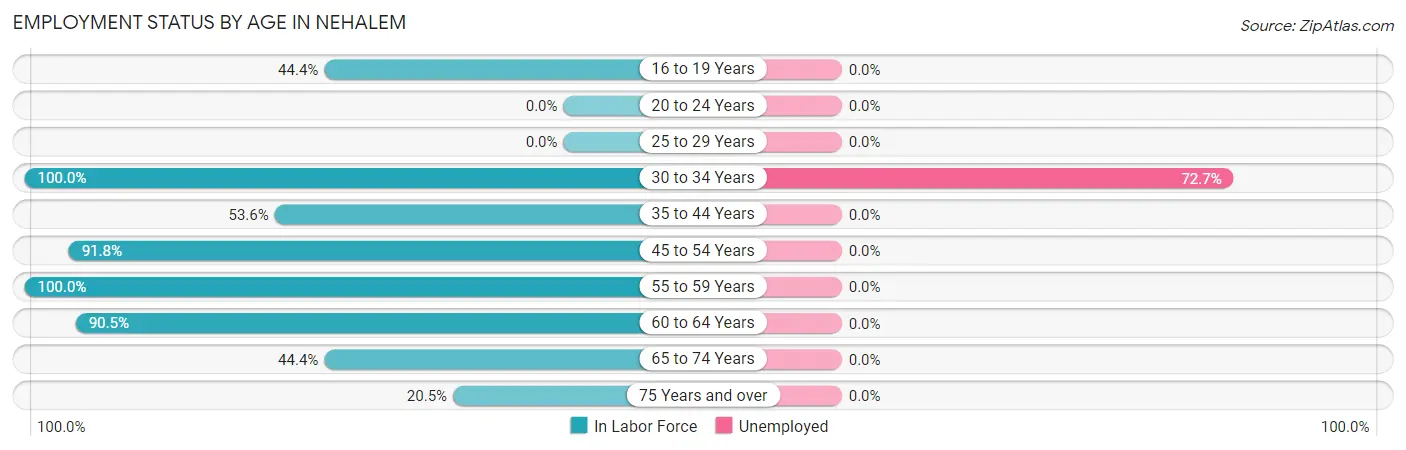
According to the labor force statistics for Nehalem, out of the total population over 16 years of age (231), 65.8% or 152 individuals are in the labor force, with 15.8% or 24 of them unemployed. The age group with the highest labor force participation rate is 30 to 34 years, with 100.0% or 33 individuals in the labor force. Within the labor force, the 30 to 34 years age range has the highest percentage of unemployed individuals, with 72.7% or 24 of them being unemployed.
| Age Bracket | In Labor Force | Unemployed |
| 16 to 19 Years | 4 (44.4%) | 0 (0.0%) |
| 20 to 24 Years | 0 (0.0%) | 0 (0.0%) |
| 25 to 29 Years | 0 (0.0%) | 0 (0.0%) |
| 30 to 34 Years | 33 (100.0%) | 24 (72.7%) |
| 35 to 44 Years | 15 (53.6%) | 0 (0.0%) |
| 45 to 54 Years | 45 (91.8%) | 0 (0.0%) |
| 55 to 59 Years | 11 (100.0%) | 0 (0.0%) |
| 60 to 64 Years | 19 (90.5%) | 0 (0.0%) |
| 65 to 74 Years | 16 (44.4%) | 0 (0.0%) |
| 75 Years and over | 9 (20.5%) | 0 (0.0%) |
| Total | 152 (65.8%) | 24 (15.8%) |
Employment Status by Educational Attainment in Nehalem
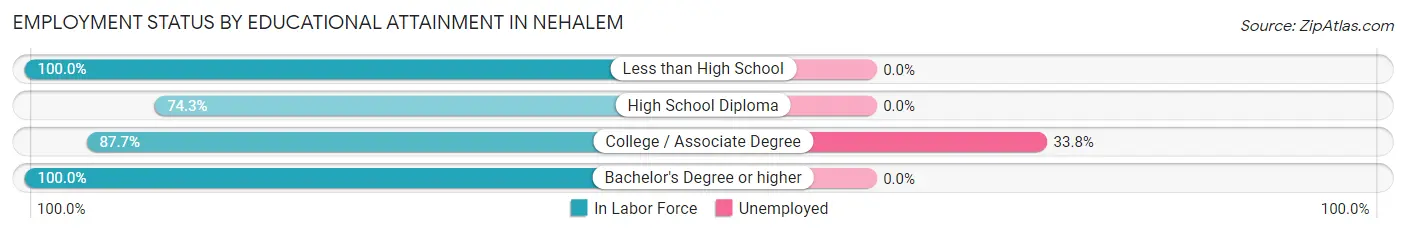
According to labor force statistics for Nehalem, 86.6% of individuals (123) out of the total population between 25 and 64 years of age (142) are in the labor force, with 19.5% or 24 of them being unemployed. The group with the highest labor force participation rate are those with the educational attainment of less than high school, with 100.0% or 12 individuals in the labor force. Within the labor force, individuals with college / associate degree education have the highest percentage of unemployment, with 33.8% or 24 of them being unemployed.
| Educational Attainment | In Labor Force | Unemployed |
| Less than High School | 12 (100.0%) | 0 (0.0%) |
| High School Diploma | 26 (74.3%) | 0 (0.0%) |
| College / Associate Degree | 71 (87.7%) | 27 (33.8%) |
| Bachelor's Degree or higher | 14 (100.0%) | 0 (0.0%) |
| Total | 123 (86.6%) | 28 (19.5%) |
Employment Occupations by Sex in Nehalem
Management, Business, Science and Arts Occupations
The most common Management, Business, Science and Arts occupations in Nehalem are Community & Social Service (16 | 12.5%), Management (15 | 11.7%), Arts, Media & Entertainment (12 | 9.4%), Business & Financial (5 | 3.9%), and Computers, Engineering & Science (4 | 3.1%).

Management, Business, Science and Arts Occupations by Sex
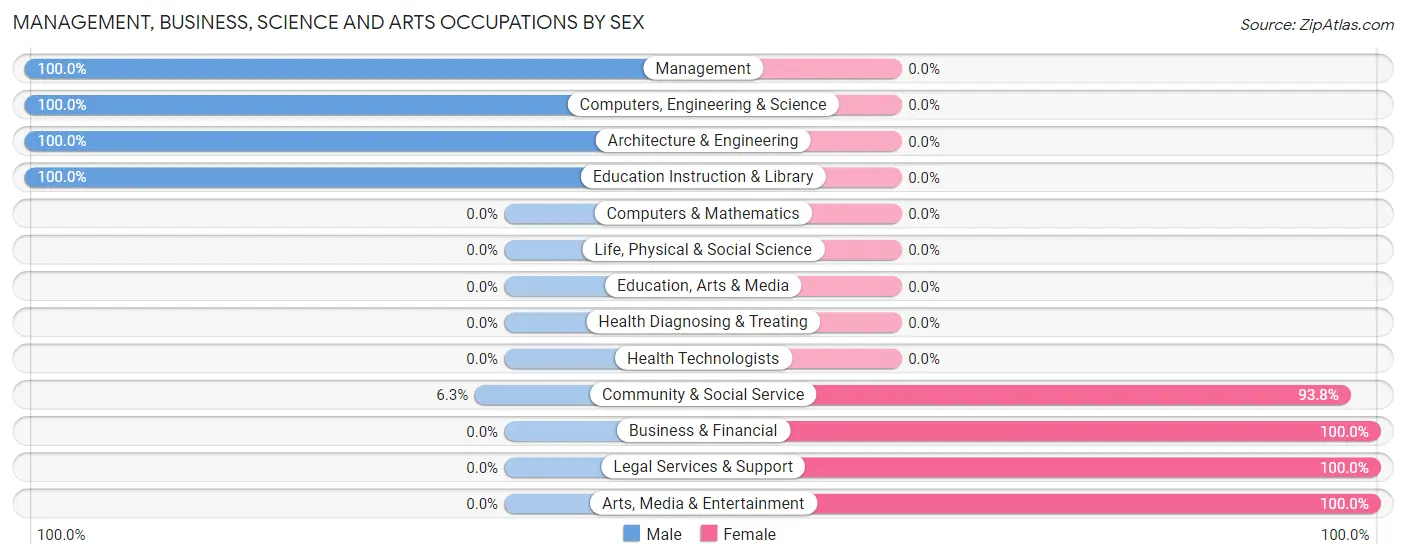
Within the Management, Business, Science and Arts occupations in Nehalem, the most male-oriented occupations are Management (100.0%), Computers, Engineering & Science (100.0%), and Architecture & Engineering (100.0%), while the most female-oriented occupations are Business & Financial (100.0%), Legal Services & Support (100.0%), and Arts, Media & Entertainment (100.0%).
| Occupation | Male | Female |
| Management | 15 (100.0%) | 0 (0.0%) |
| Business & Financial | 0 (0.0%) | 5 (100.0%) |
| Computers, Engineering & Science | 4 (100.0%) | 0 (0.0%) |
| Computers & Mathematics | 0 (0.0%) | 0 (0.0%) |
| Architecture & Engineering | 4 (100.0%) | 0 (0.0%) |
| Life, Physical & Social Science | 0 (0.0%) | 0 (0.0%) |
| Community & Social Service | 1 (6.2%) | 15 (93.8%) |
| Education, Arts & Media | 0 (0.0%) | 0 (0.0%) |
| Legal Services & Support | 0 (0.0%) | 3 (100.0%) |
| Education Instruction & Library | 1 (100.0%) | 0 (0.0%) |
| Arts, Media & Entertainment | 0 (0.0%) | 12 (100.0%) |
| Health Diagnosing & Treating | 0 (0.0%) | 0 (0.0%) |
| Health Technologists | 0 (0.0%) | 0 (0.0%) |
| Total (Category) | 20 (50.0%) | 20 (50.0%) |
| Total (Overall) | 55 (43.0%) | 73 (57.0%) |
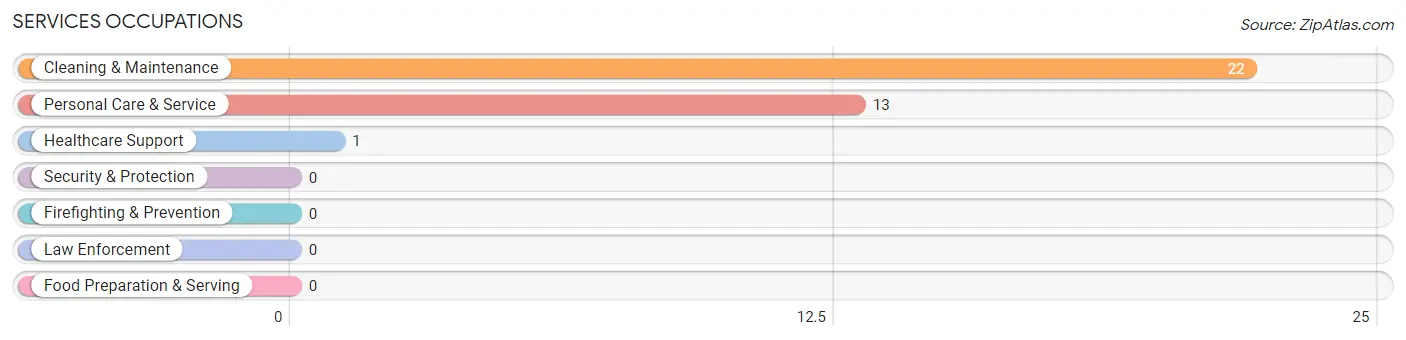
Services Occupations
The most common Services occupations in Nehalem are Cleaning & Maintenance (22 | 17.2%), Personal Care & Service (13 | 10.2%), and Healthcare Support (1 | 0.8%).
Services Occupations by Sex
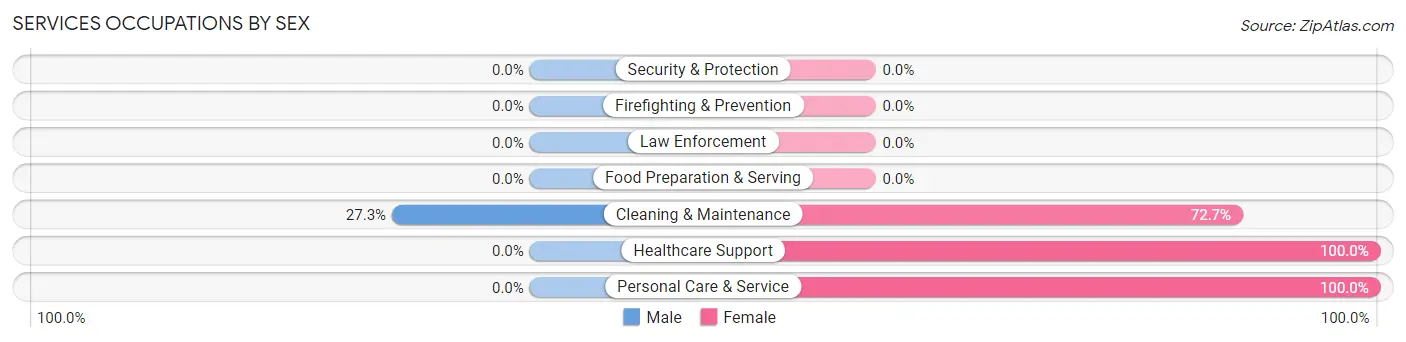
| Occupation | Male | Female |
| Healthcare Support | 0 (0.0%) | 1 (100.0%) |
| Security & Protection | 0 (0.0%) | 0 (0.0%) |
| Firefighting & Prevention | 0 (0.0%) | 0 (0.0%) |
| Law Enforcement | 0 (0.0%) | 0 (0.0%) |
| Food Preparation & Serving | 0 (0.0%) | 0 (0.0%) |
| Cleaning & Maintenance | 6 (27.3%) | 16 (72.7%) |
| Personal Care & Service | 0 (0.0%) | 13 (100.0%) |
| Total (Category) | 6 (16.7%) | 30 (83.3%) |
| Total (Overall) | 55 (43.0%) | 73 (57.0%) |
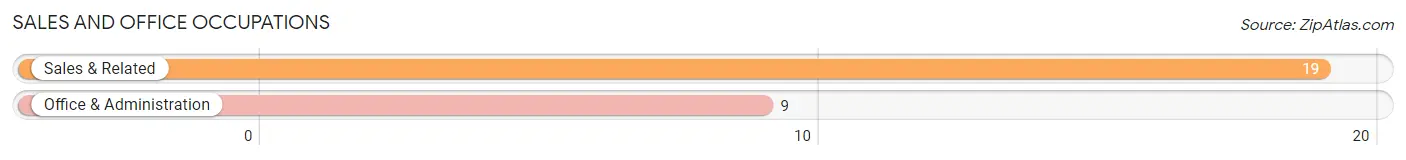
Sales and Office Occupations
The most common Sales and Office occupations in Nehalem are Sales & Related (19 | 14.8%), and Office & Administration (9 | 7.0%).
Sales and Office Occupations by Sex
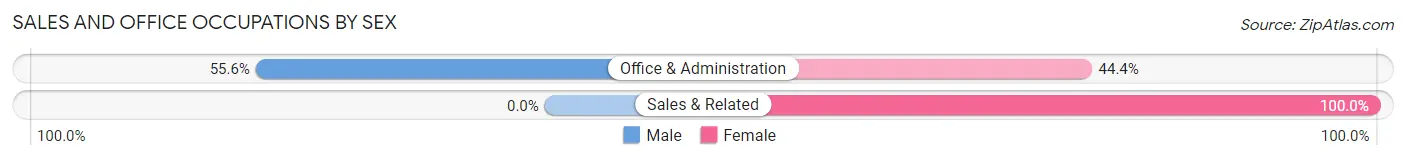
| Occupation | Male | Female |
| Sales & Related | 0 (0.0%) | 19 (100.0%) |
| Office & Administration | 5 (55.6%) | 4 (44.4%) |
| Total (Category) | 5 (17.9%) | 23 (82.1%) |
| Total (Overall) | 55 (43.0%) | 73 (57.0%) |
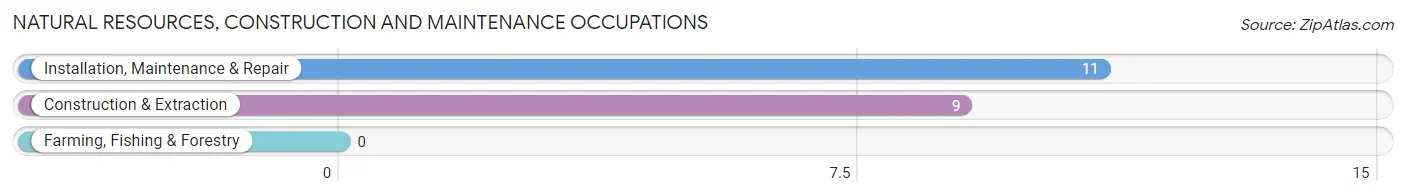
Natural Resources, Construction and Maintenance Occupations
The most common Natural Resources, Construction and Maintenance occupations in Nehalem are Installation, Maintenance & Repair (11 | 8.6%), and Construction & Extraction (9 | 7.0%).
Natural Resources, Construction and Maintenance Occupations by Sex
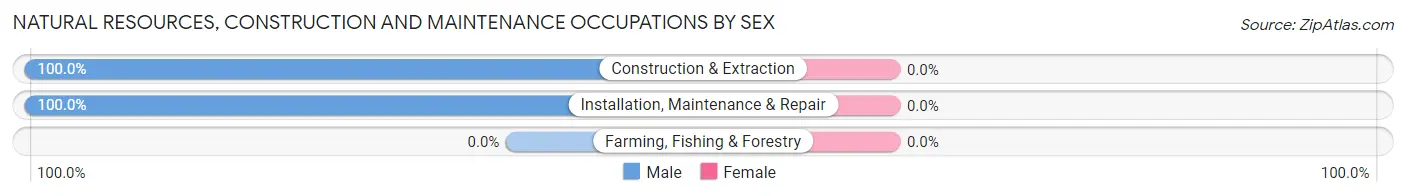
| Occupation | Male | Female |
| Farming, Fishing & Forestry | 0 (0.0%) | 0 (0.0%) |
| Construction & Extraction | 9 (100.0%) | 0 (0.0%) |
| Installation, Maintenance & Repair | 11 (100.0%) | 0 (0.0%) |
| Total (Category) | 20 (100.0%) | 0 (0.0%) |
| Total (Overall) | 55 (43.0%) | 73 (57.0%) |
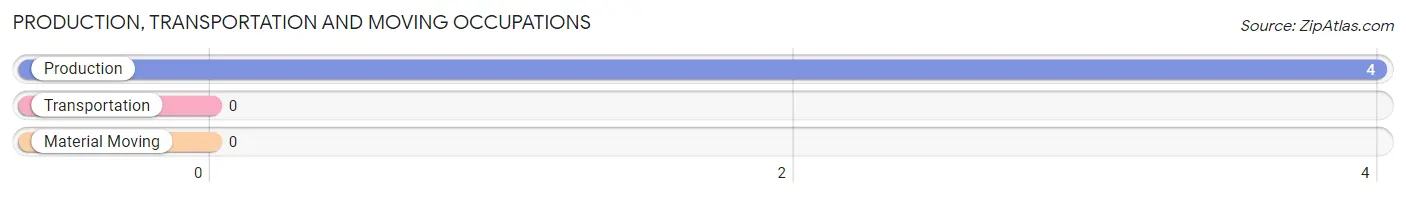
Production, Transportation and Moving Occupations
The most common Production, Transportation and Moving occupations in Nehalem are , and Production (4 | 3.1%).
Production, Transportation and Moving Occupations by Sex
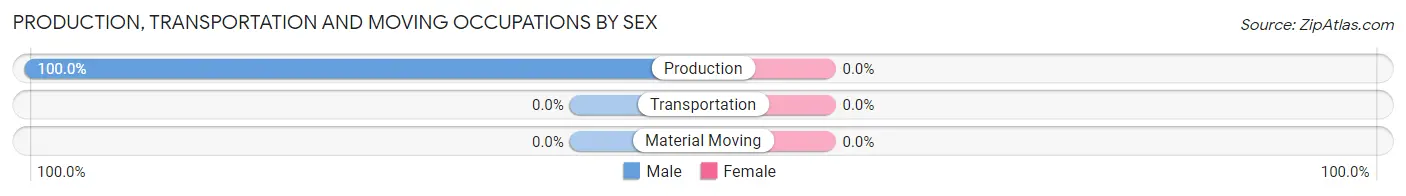
| Occupation | Male | Female |
| Production | 4 (100.0%) | 0 (0.0%) |
| Transportation | 0 (0.0%) | 0 (0.0%) |
| Material Moving | 0 (0.0%) | 0 (0.0%) |
| Total (Category) | 4 (100.0%) | 0 (0.0%) |
| Total (Overall) | 55 (43.0%) | 73 (57.0%) |
Employment Industries by Sex in Nehalem
Employment Industries in Nehalem
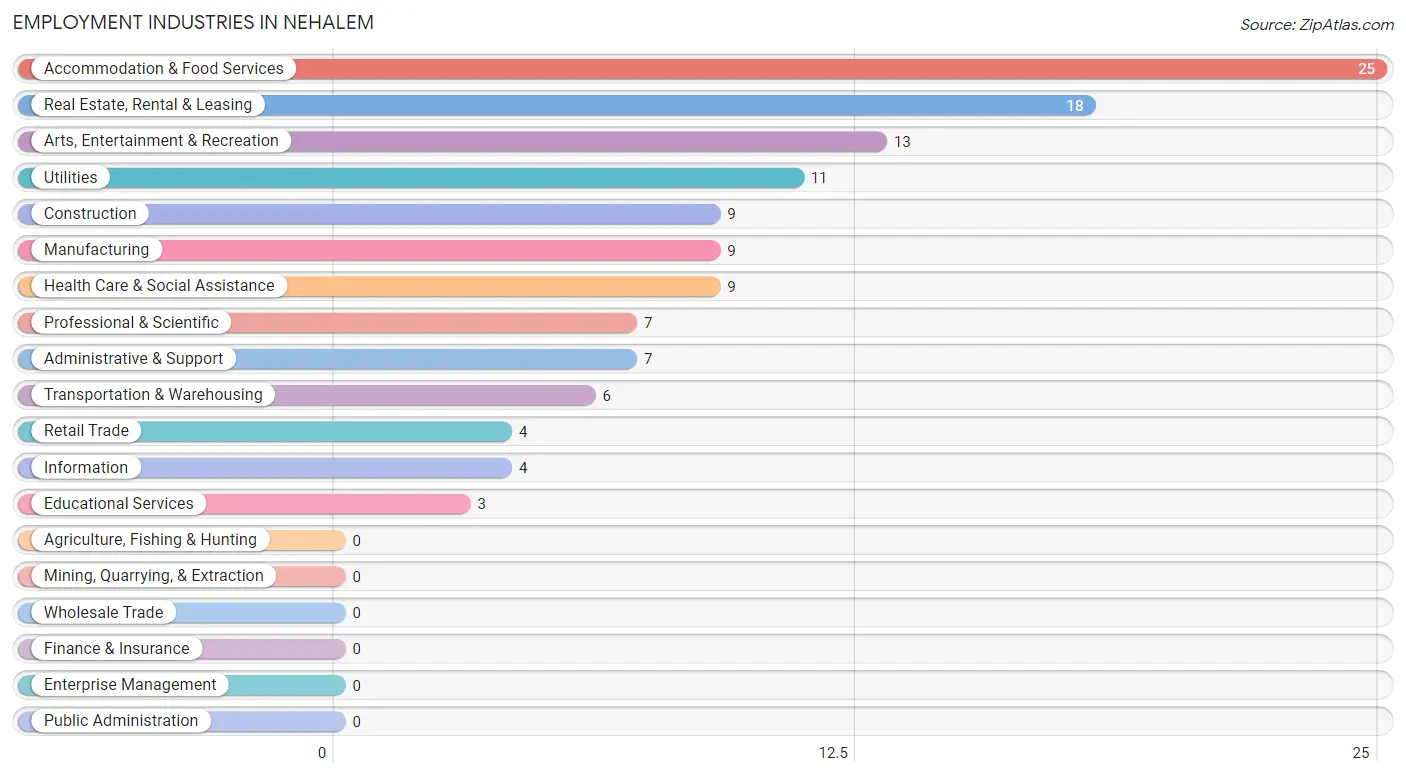
The major employment industries in Nehalem include Accommodation & Food Services (25 | 19.5%), Real Estate, Rental & Leasing (18 | 14.1%), Arts, Entertainment & Recreation (13 | 10.2%), Utilities (11 | 8.6%), and Construction (9 | 7.0%).
Employment Industries by Sex in Nehalem
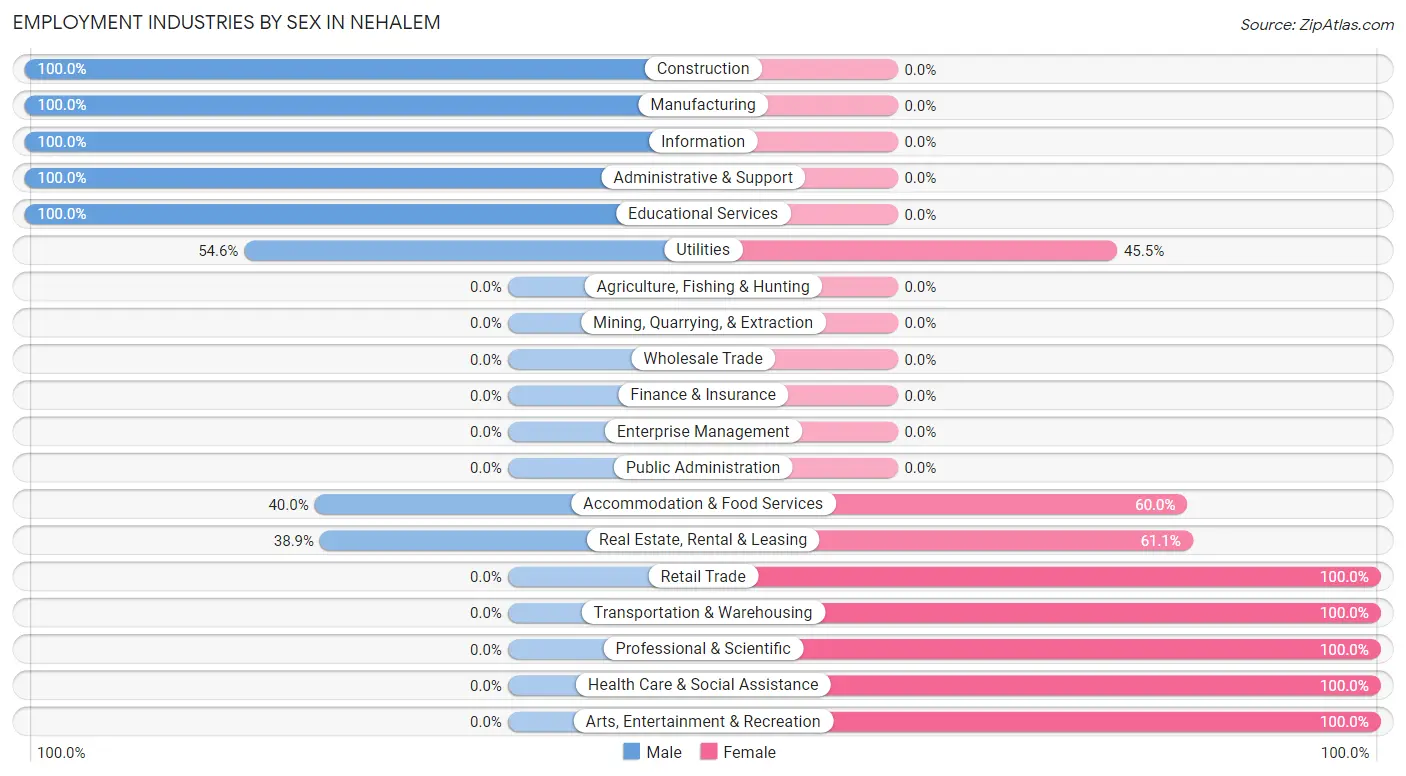
The Nehalem industries that see more men than women are Construction (100.0%), Manufacturing (100.0%), and Information (100.0%), whereas the industries that tend to have a higher number of women are Retail Trade (100.0%), Transportation & Warehousing (100.0%), and Professional & Scientific (100.0%).
| Industry | Male | Female |
| Agriculture, Fishing & Hunting | 0 (0.0%) | 0 (0.0%) |
| Mining, Quarrying, & Extraction | 0 (0.0%) | 0 (0.0%) |
| Construction | 9 (100.0%) | 0 (0.0%) |
| Manufacturing | 9 (100.0%) | 0 (0.0%) |
| Wholesale Trade | 0 (0.0%) | 0 (0.0%) |
| Retail Trade | 0 (0.0%) | 4 (100.0%) |
| Transportation & Warehousing | 0 (0.0%) | 6 (100.0%) |
| Utilities | 6 (54.5%) | 5 (45.5%) |
| Information | 4 (100.0%) | 0 (0.0%) |
| Finance & Insurance | 0 (0.0%) | 0 (0.0%) |
| Real Estate, Rental & Leasing | 7 (38.9%) | 11 (61.1%) |
| Professional & Scientific | 0 (0.0%) | 7 (100.0%) |
| Enterprise Management | 0 (0.0%) | 0 (0.0%) |
| Administrative & Support | 7 (100.0%) | 0 (0.0%) |
| Educational Services | 3 (100.0%) | 0 (0.0%) |
| Health Care & Social Assistance | 0 (0.0%) | 9 (100.0%) |
| Arts, Entertainment & Recreation | 0 (0.0%) | 13 (100.0%) |
| Accommodation & Food Services | 10 (40.0%) | 15 (60.0%) |
| Public Administration | 0 (0.0%) | 0 (0.0%) |
| Total | 55 (43.0%) | 73 (57.0%) |
Education in Nehalem
School Enrollment in Nehalem
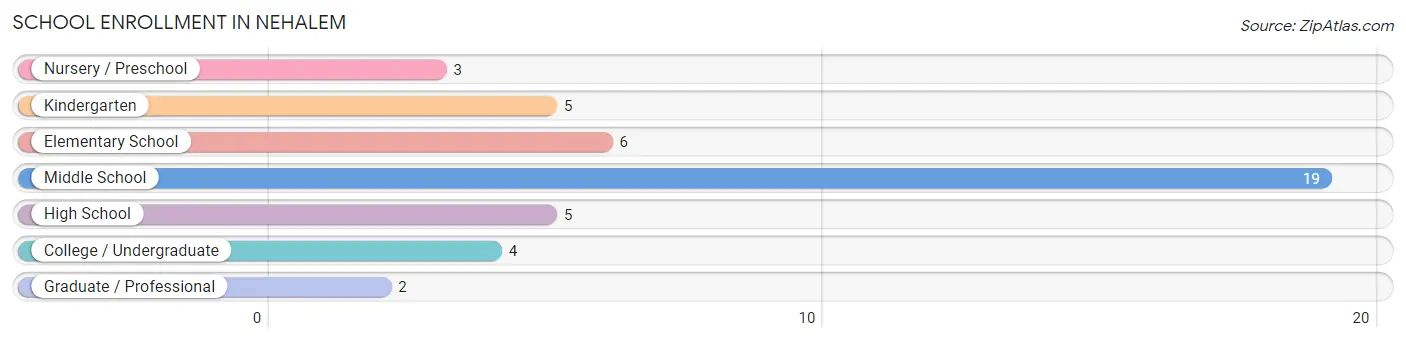
The most common levels of schooling among the 44 students in Nehalem are middle school (19 | 43.2%), elementary school (6 | 13.6%), and kindergarten (5 | 11.4%).
| School Level | # Students | % Students |
| Nursery / Preschool | 3 | 6.8% |
| Kindergarten | 5 | 11.4% |
| Elementary School | 6 | 13.6% |
| Middle School | 19 | 43.2% |
| High School | 5 | 11.4% |
| College / Undergraduate | 4 | 9.1% |
| Graduate / Professional | 2 | 4.5% |
| Total | 44 | 100.0% |
School Enrollment by Age by Funding Source in Nehalem
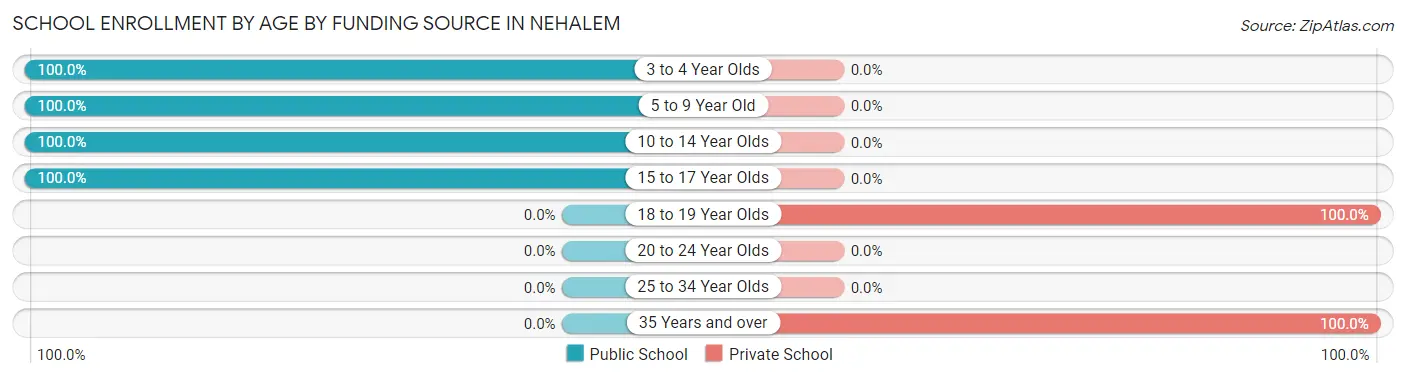
Out of a total of 44 students who are enrolled in schools in Nehalem, 6 (13.6%) attend a private institution, while the remaining 38 (86.4%) are enrolled in public schools. The age group of 18 to 19 year olds has the highest likelihood of being enrolled in private schools, with 4 (100.0% in the age bracket) enrolled. Conversely, the age group of 3 to 4 year olds has the lowest likelihood of being enrolled in a private school, with 3 (100.0% in the age bracket) attending a public institution.
| Age Bracket | Public School | Private School |
| 3 to 4 Year Olds | 3 (100.0%) | 0 (0.0%) |
| 5 to 9 Year Old | 5 (100.0%) | 0 (0.0%) |
| 10 to 14 Year Olds | 25 (100.0%) | 0 (0.0%) |
| 15 to 17 Year Olds | 5 (100.0%) | 0 (0.0%) |
| 18 to 19 Year Olds | 0 (0.0%) | 4 (100.0%) |
| 20 to 24 Year Olds | 0 (0.0%) | 0 (0.0%) |
| 25 to 34 Year Olds | 0 (0.0%) | 0 (0.0%) |
| 35 Years and over | 0 (0.0%) | 2 (100.0%) |
| Total | 38 (86.4%) | 6 (13.6%) |
Educational Attainment by Field of Study in Nehalem
Business (12 | 24.5%), visual & performing arts (11 | 22.5%), physical & health sciences (7 | 14.3%), liberal arts & history (7 | 14.3%), and social sciences (5 | 10.2%) are the most common fields of study among 49 individuals in Nehalem who have obtained a bachelor's degree or higher.
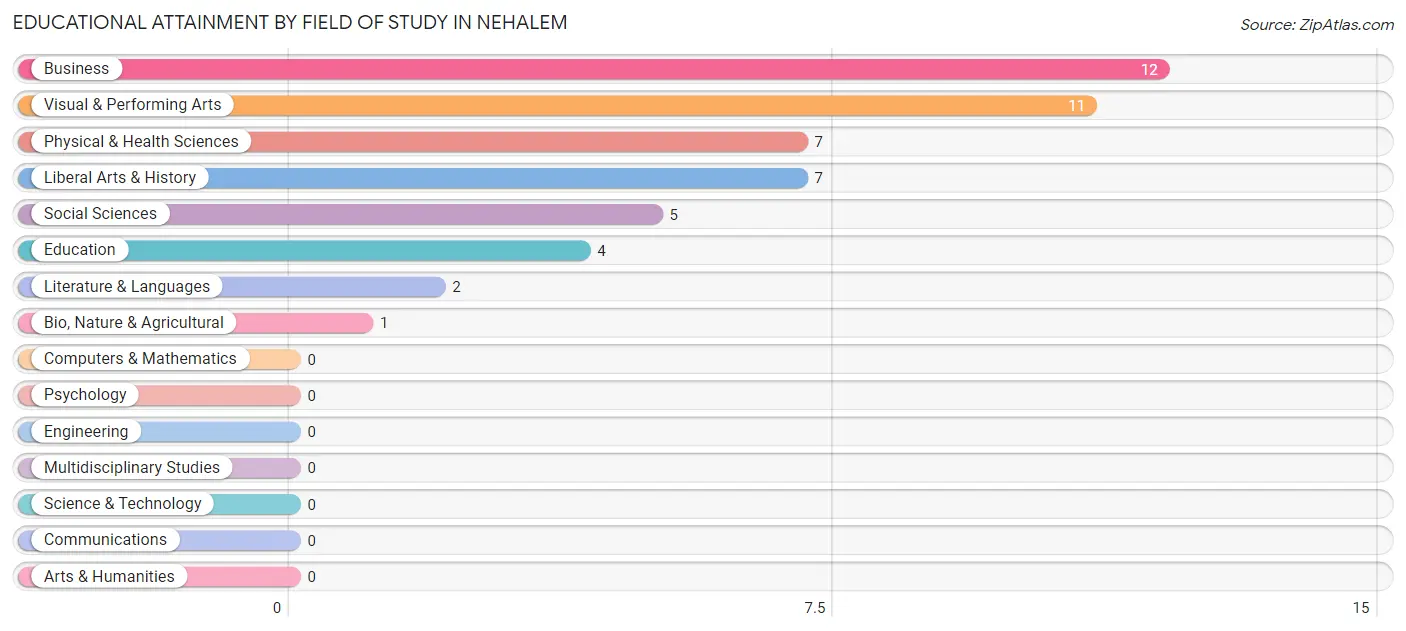
| Field of Study | # Graduates | % Graduates |
| Computers & Mathematics | 0 | 0.0% |
| Bio, Nature & Agricultural | 1 | 2.0% |
| Physical & Health Sciences | 7 | 14.3% |
| Psychology | 0 | 0.0% |
| Social Sciences | 5 | 10.2% |
| Engineering | 0 | 0.0% |
| Multidisciplinary Studies | 0 | 0.0% |
| Science & Technology | 0 | 0.0% |
| Business | 12 | 24.5% |
| Education | 4 | 8.2% |
| Literature & Languages | 2 | 4.1% |
| Liberal Arts & History | 7 | 14.3% |
| Visual & Performing Arts | 11 | 22.5% |
| Communications | 0 | 0.0% |
| Arts & Humanities | 0 | 0.0% |
| Total | 49 | 100.0% |
Transportation & Commute in Nehalem
Vehicle Availability by Sex in Nehalem
The most prevalent vehicle ownership categories in Nehalem are males with 2 vehicles (26, accounting for 47.3%) and females with 2 vehicles (42, making up 35.6%).
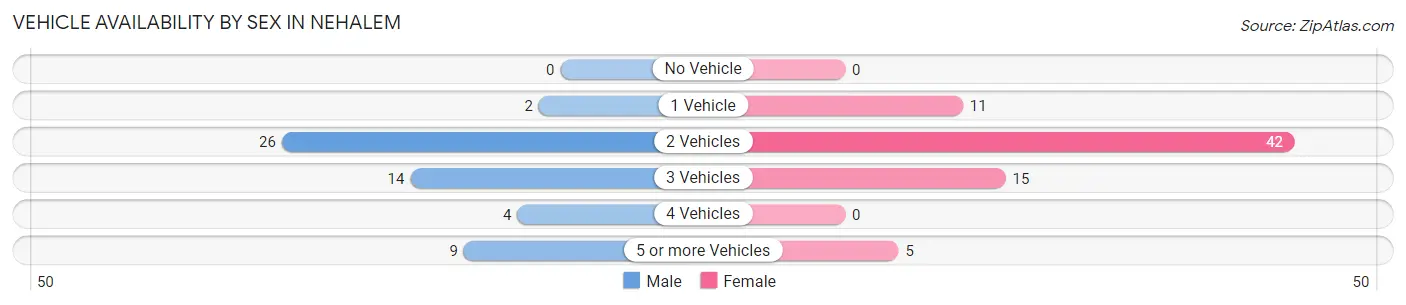
| Vehicles Available | Male | Female |
| No Vehicle | 0 (0.0%) | 0 (0.0%) |
| 1 Vehicle | 2 (3.6%) | 11 (15.1%) |
| 2 Vehicles | 26 (47.3%) | 42 (57.5%) |
| 3 Vehicles | 14 (25.5%) | 15 (20.5%) |
| 4 Vehicles | 4 (7.3%) | 0 (0.0%) |
| 5 or more Vehicles | 9 (16.4%) | 5 (6.9%) |
| Total | 55 (100.0%) | 73 (100.0%) |
Commute Time in Nehalem
The most frequently occuring commute durations in Nehalem are 5 to 9 minutes (37 commuters, 36.6%), less than 5 minutes (18 commuters, 17.8%), and 20 to 24 minutes (17 commuters, 16.8%).
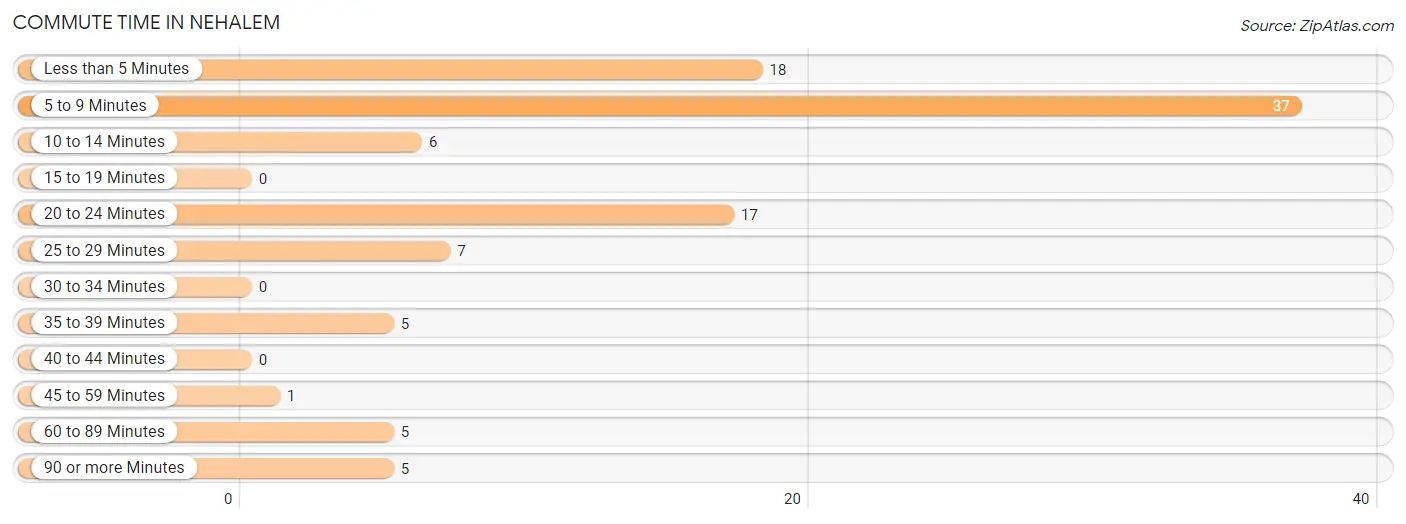
| Commute Time | # Commuters | % Commuters |
| Less than 5 Minutes | 18 | 17.8% |
| 5 to 9 Minutes | 37 | 36.6% |
| 10 to 14 Minutes | 6 | 5.9% |
| 15 to 19 Minutes | 0 | 0.0% |
| 20 to 24 Minutes | 17 | 16.8% |
| 25 to 29 Minutes | 7 | 6.9% |
| 30 to 34 Minutes | 0 | 0.0% |
| 35 to 39 Minutes | 5 | 5.0% |
| 40 to 44 Minutes | 0 | 0.0% |
| 45 to 59 Minutes | 1 | 1.0% |
| 60 to 89 Minutes | 5 | 5.0% |
| 90 or more Minutes | 5 | 5.0% |
Commute Time by Sex in Nehalem
The most common commute times in Nehalem are less than 5 minutes (14 commuters, 27.5%) for males and 5 to 9 minutes (23 commuters, 46.0%) for females.
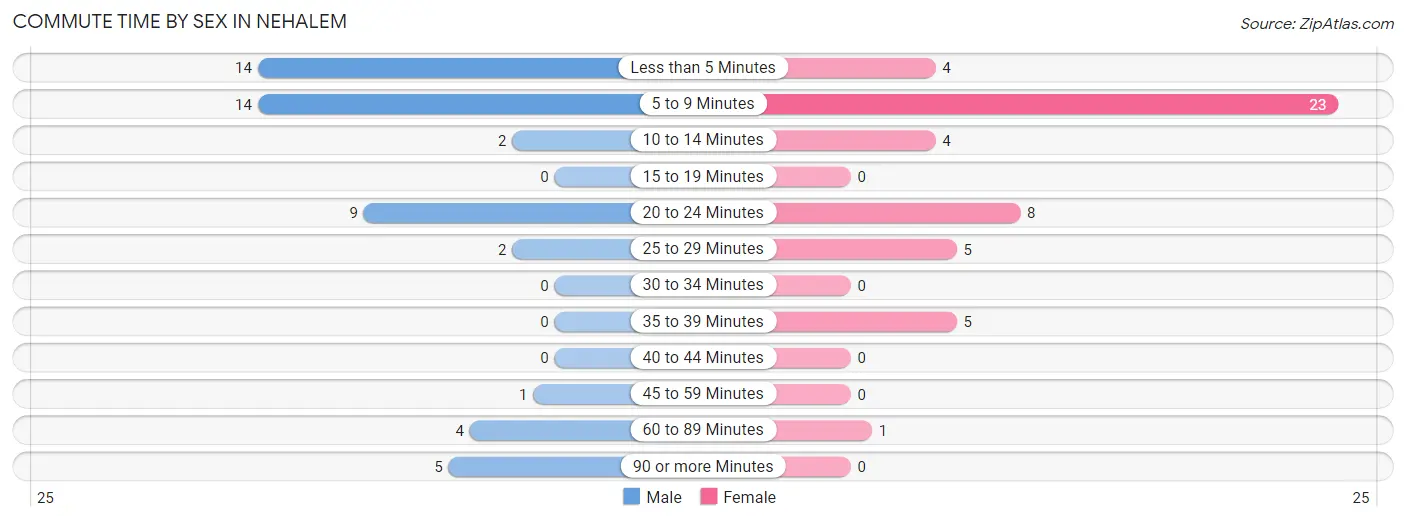
| Commute Time | Male | Female |
| Less than 5 Minutes | 14 (27.5%) | 4 (8.0%) |
| 5 to 9 Minutes | 14 (27.5%) | 23 (46.0%) |
| 10 to 14 Minutes | 2 (3.9%) | 4 (8.0%) |
| 15 to 19 Minutes | 0 (0.0%) | 0 (0.0%) |
| 20 to 24 Minutes | 9 (17.6%) | 8 (16.0%) |
| 25 to 29 Minutes | 2 (3.9%) | 5 (10.0%) |
| 30 to 34 Minutes | 0 (0.0%) | 0 (0.0%) |
| 35 to 39 Minutes | 0 (0.0%) | 5 (10.0%) |
| 40 to 44 Minutes | 0 (0.0%) | 0 (0.0%) |
| 45 to 59 Minutes | 1 (2.0%) | 0 (0.0%) |
| 60 to 89 Minutes | 4 (7.8%) | 1 (2.0%) |
| 90 or more Minutes | 5 (9.8%) | 0 (0.0%) |
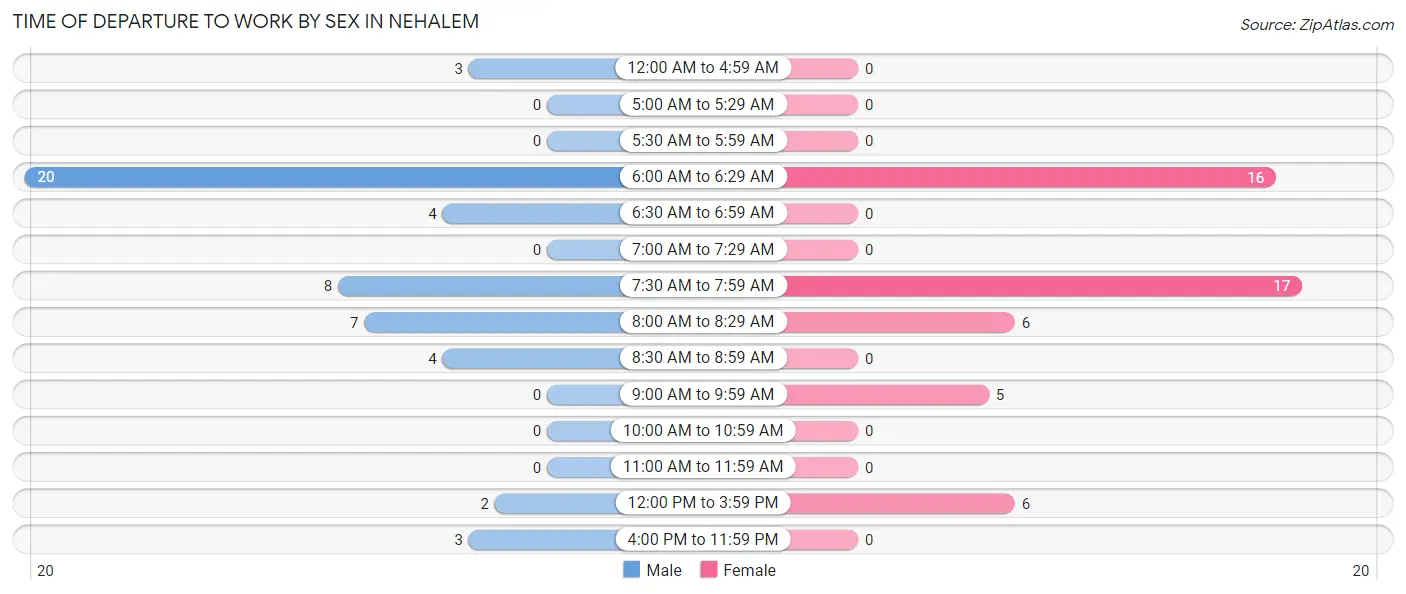
Time of Departure to Work by Sex in Nehalem
The most frequent times of departure to work in Nehalem are 6:00 AM to 6:29 AM (20, 39.2%) for males and 7:30 AM to 7:59 AM (17, 34.0%) for females.
| Time of Departure | Male | Female |
| 12:00 AM to 4:59 AM | 3 (5.9%) | 0 (0.0%) |
| 5:00 AM to 5:29 AM | 0 (0.0%) | 0 (0.0%) |
| 5:30 AM to 5:59 AM | 0 (0.0%) | 0 (0.0%) |
| 6:00 AM to 6:29 AM | 20 (39.2%) | 16 (32.0%) |
| 6:30 AM to 6:59 AM | 4 (7.8%) | 0 (0.0%) |
| 7:00 AM to 7:29 AM | 0 (0.0%) | 0 (0.0%) |
| 7:30 AM to 7:59 AM | 8 (15.7%) | 17 (34.0%) |
| 8:00 AM to 8:29 AM | 7 (13.7%) | 6 (12.0%) |
| 8:30 AM to 8:59 AM | 4 (7.8%) | 0 (0.0%) |
| 9:00 AM to 9:59 AM | 0 (0.0%) | 5 (10.0%) |
| 10:00 AM to 10:59 AM | 0 (0.0%) | 0 (0.0%) |
| 11:00 AM to 11:59 AM | 0 (0.0%) | 0 (0.0%) |
| 12:00 PM to 3:59 PM | 2 (3.9%) | 6 (12.0%) |
| 4:00 PM to 11:59 PM | 3 (5.9%) | 0 (0.0%) |
| Total | 51 (100.0%) | 50 (100.0%) |
Housing Occupancy in Nehalem
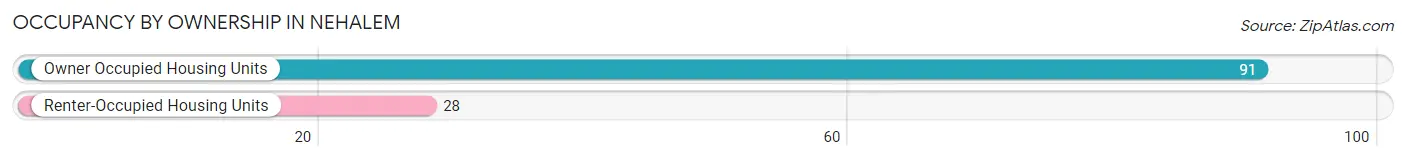
Occupancy by Ownership in Nehalem
Of the total 119 dwellings in Nehalem, owner-occupied units account for 91 (76.5%), while renter-occupied units make up 28 (23.5%).
| Occupancy | # Housing Units | % Housing Units |
| Owner Occupied Housing Units | 91 | 76.5% |
| Renter-Occupied Housing Units | 28 | 23.5% |
| Total Occupied Housing Units | 119 | 100.0% |
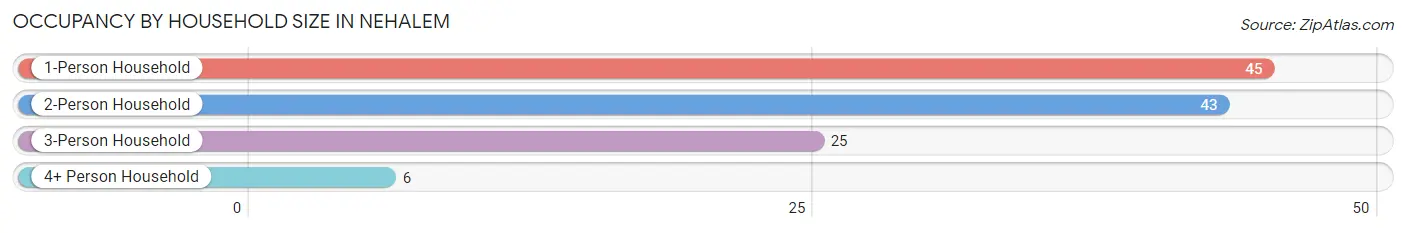
Occupancy by Household Size in Nehalem
| Household Size | # Housing Units | % Housing Units |
| 1-Person Household | 45 | 37.8% |
| 2-Person Household | 43 | 36.1% |
| 3-Person Household | 25 | 21.0% |
| 4+ Person Household | 6 | 5.0% |
| Total Housing Units | 119 | 100.0% |
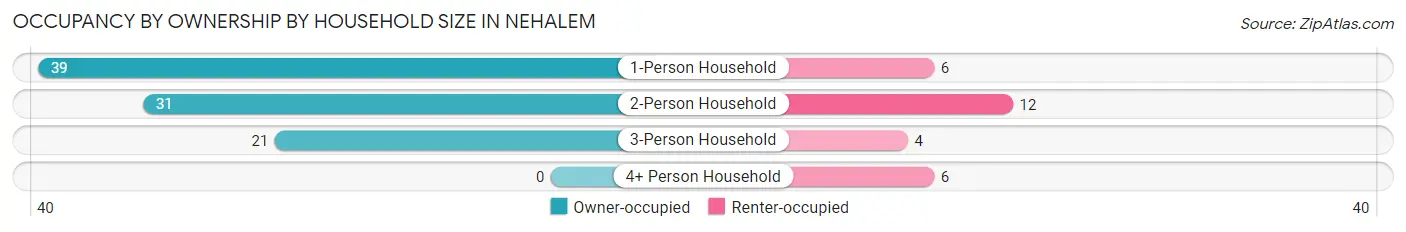
Occupancy by Ownership by Household Size in Nehalem
| Household Size | Owner-occupied | Renter-occupied |
| 1-Person Household | 39 (86.7%) | 6 (13.3%) |
| 2-Person Household | 31 (72.1%) | 12 (27.9%) |
| 3-Person Household | 21 (84.0%) | 4 (16.0%) |
| 4+ Person Household | 0 (0.0%) | 6 (100.0%) |
| Total Housing Units | 91 (76.5%) | 28 (23.5%) |
Occupancy by Educational Attainment in Nehalem
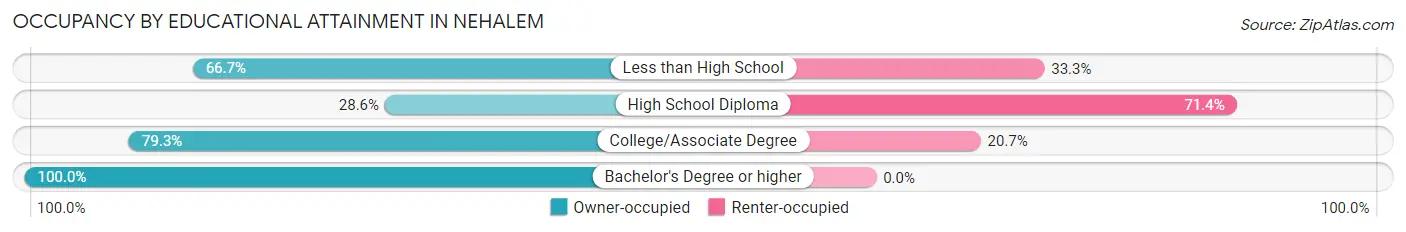
| Household Size | Owner-occupied | Renter-occupied |
| Less than High School | 2 (66.7%) | 1 (33.3%) |
| High School Diploma | 6 (28.6%) | 15 (71.4%) |
| College/Associate Degree | 46 (79.3%) | 12 (20.7%) |
| Bachelor's Degree or higher | 37 (100.0%) | 0 (0.0%) |
Occupancy by Age of Householder in Nehalem
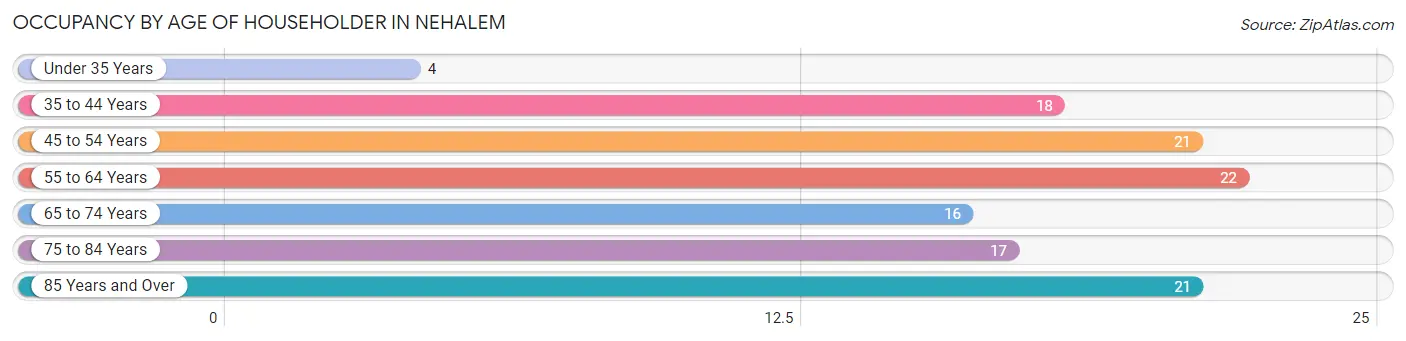
| Age Bracket | # Households | % Households |
| Under 35 Years | 4 | 3.4% |
| 35 to 44 Years | 18 | 15.1% |
| 45 to 54 Years | 21 | 17.6% |
| 55 to 64 Years | 22 | 18.5% |
| 65 to 74 Years | 16 | 13.5% |
| 75 to 84 Years | 17 | 14.3% |
| 85 Years and Over | 21 | 17.6% |
| Total | 119 | 100.0% |
Housing Finances in Nehalem
Median Income by Occupancy in Nehalem
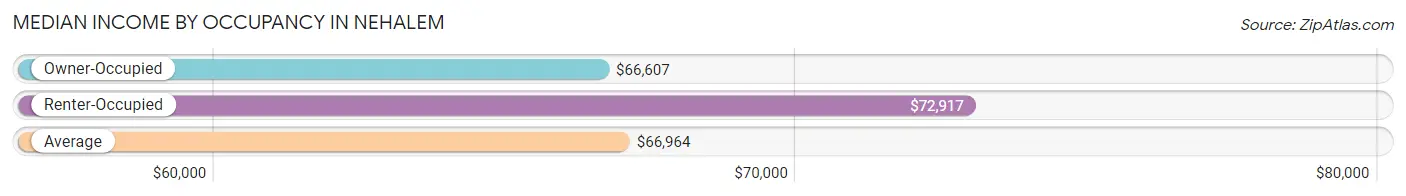
| Occupancy Type | # Households | Median Income |
| Owner-Occupied | 91 (76.5%) | $66,607 |
| Renter-Occupied | 28 (23.5%) | $72,917 |
| Average | 119 (100.0%) | $66,964 |
Occupancy by Householder Income Bracket in Nehalem
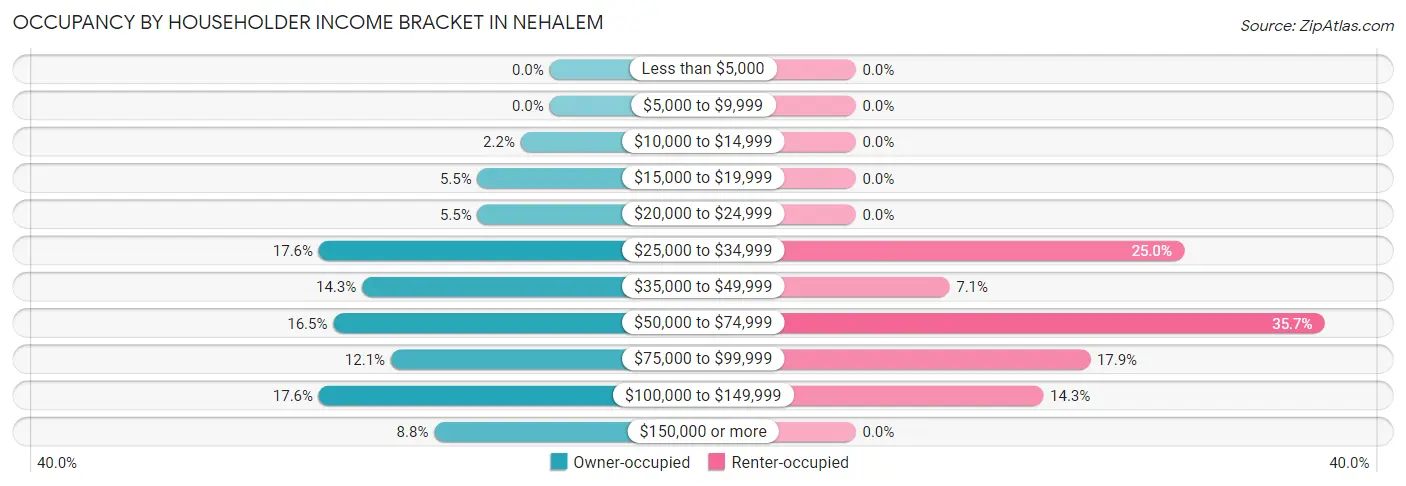
| Income Bracket | Owner-occupied | Renter-occupied |
| Less than $5,000 | 0 (0.0%) | 0 (0.0%) |
| $5,000 to $9,999 | 0 (0.0%) | 0 (0.0%) |
| $10,000 to $14,999 | 2 (2.2%) | 0 (0.0%) |
| $15,000 to $19,999 | 5 (5.5%) | 0 (0.0%) |
| $20,000 to $24,999 | 5 (5.5%) | 0 (0.0%) |
| $25,000 to $34,999 | 16 (17.6%) | 7 (25.0%) |
| $35,000 to $49,999 | 13 (14.3%) | 2 (7.1%) |
| $50,000 to $74,999 | 15 (16.5%) | 10 (35.7%) |
| $75,000 to $99,999 | 11 (12.1%) | 5 (17.9%) |
| $100,000 to $149,999 | 16 (17.6%) | 4 (14.3%) |
| $150,000 or more | 8 (8.8%) | 0 (0.0%) |
| Total | 91 (100.0%) | 28 (100.0%) |
Monthly Housing Cost Tiers in Nehalem
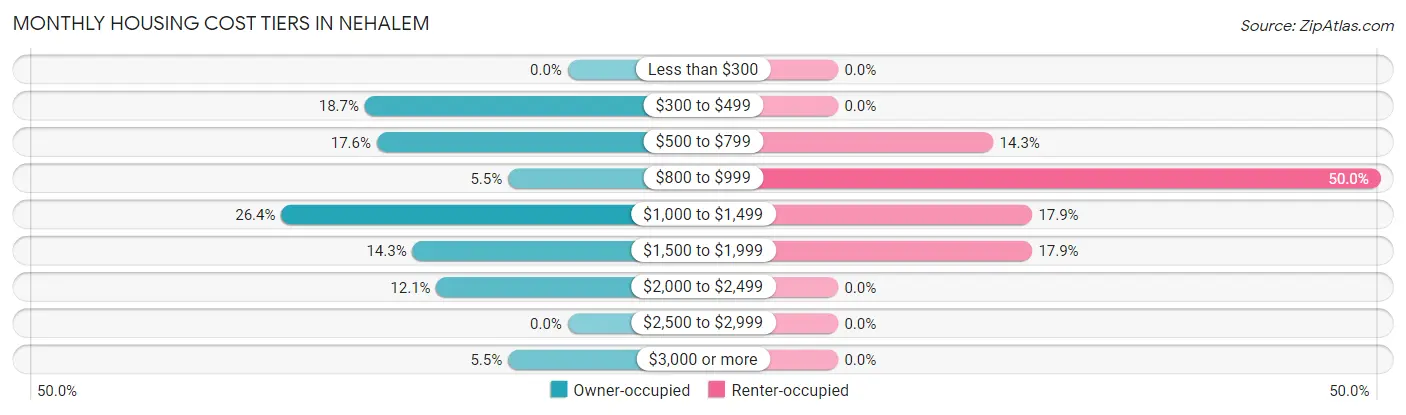
| Monthly Cost | Owner-occupied | Renter-occupied |
| Less than $300 | 0 (0.0%) | 0 (0.0%) |
| $300 to $499 | 17 (18.7%) | 0 (0.0%) |
| $500 to $799 | 16 (17.6%) | 4 (14.3%) |
| $800 to $999 | 5 (5.5%) | 14 (50.0%) |
| $1,000 to $1,499 | 24 (26.4%) | 5 (17.9%) |
| $1,500 to $1,999 | 13 (14.3%) | 5 (17.9%) |
| $2,000 to $2,499 | 11 (12.1%) | 0 (0.0%) |
| $2,500 to $2,999 | 0 (0.0%) | 0 (0.0%) |
| $3,000 or more | 5 (5.5%) | 0 (0.0%) |
| Total | 91 (100.0%) | 28 (100.0%) |
Physical Housing Characteristics in Nehalem
Housing Structures in Nehalem
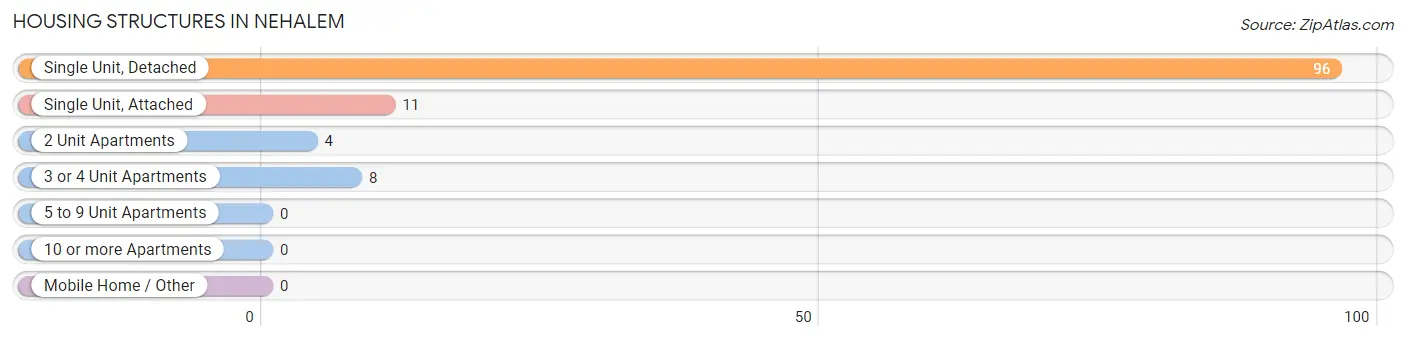
| Structure Type | # Housing Units | % Housing Units |
| Single Unit, Detached | 96 | 80.7% |
| Single Unit, Attached | 11 | 9.2% |
| 2 Unit Apartments | 4 | 3.4% |
| 3 or 4 Unit Apartments | 8 | 6.7% |
| 5 to 9 Unit Apartments | 0 | 0.0% |
| 10 or more Apartments | 0 | 0.0% |
| Mobile Home / Other | 0 | 0.0% |
| Total | 119 | 100.0% |
Housing Structures by Occupancy in Nehalem
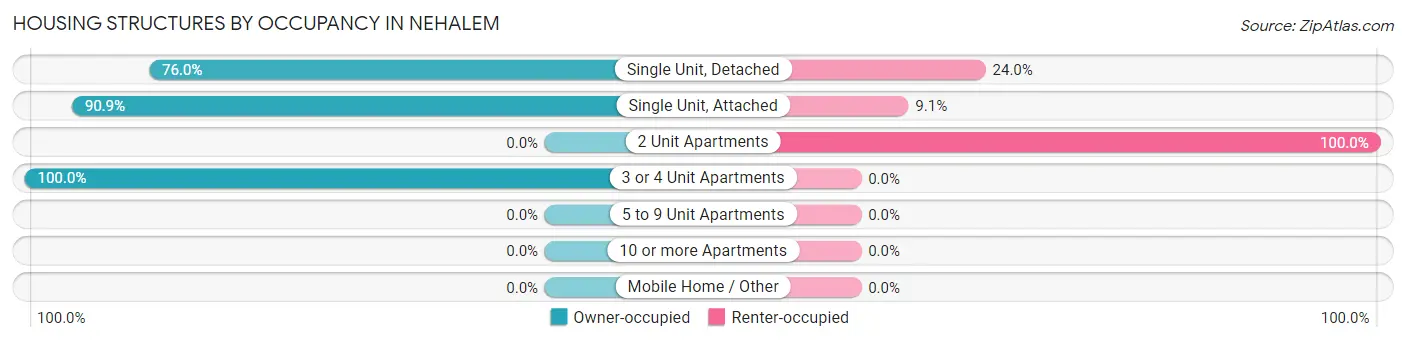
| Structure Type | Owner-occupied | Renter-occupied |
| Single Unit, Detached | 73 (76.0%) | 23 (24.0%) |
| Single Unit, Attached | 10 (90.9%) | 1 (9.1%) |
| 2 Unit Apartments | 0 (0.0%) | 4 (100.0%) |
| 3 or 4 Unit Apartments | 8 (100.0%) | 0 (0.0%) |
| 5 to 9 Unit Apartments | 0 (0.0%) | 0 (0.0%) |
| 10 or more Apartments | 0 (0.0%) | 0 (0.0%) |
| Mobile Home / Other | 0 (0.0%) | 0 (0.0%) |
| Total | 91 (76.5%) | 28 (23.5%) |
Housing Structures by Number of Rooms in Nehalem
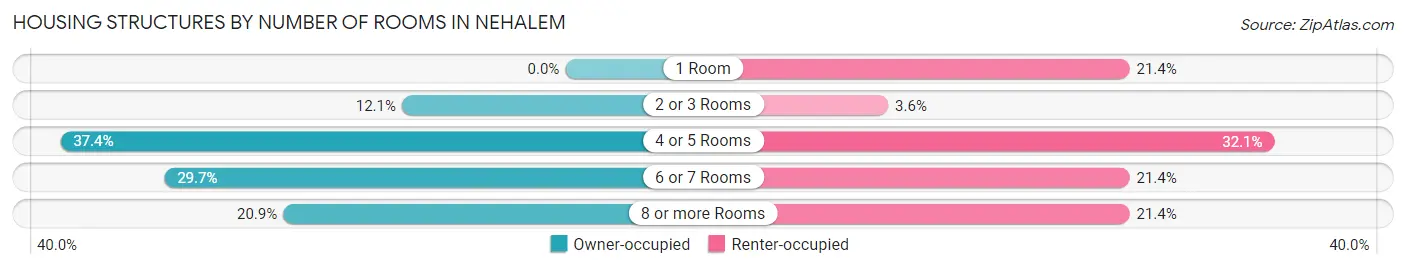
| Number of Rooms | Owner-occupied | Renter-occupied |
| 1 Room | 0 (0.0%) | 6 (21.4%) |
| 2 or 3 Rooms | 11 (12.1%) | 1 (3.6%) |
| 4 or 5 Rooms | 34 (37.4%) | 9 (32.1%) |
| 6 or 7 Rooms | 27 (29.7%) | 6 (21.4%) |
| 8 or more Rooms | 19 (20.9%) | 6 (21.4%) |
| Total | 91 (100.0%) | 28 (100.0%) |
Housing Structure by Heating Type in Nehalem
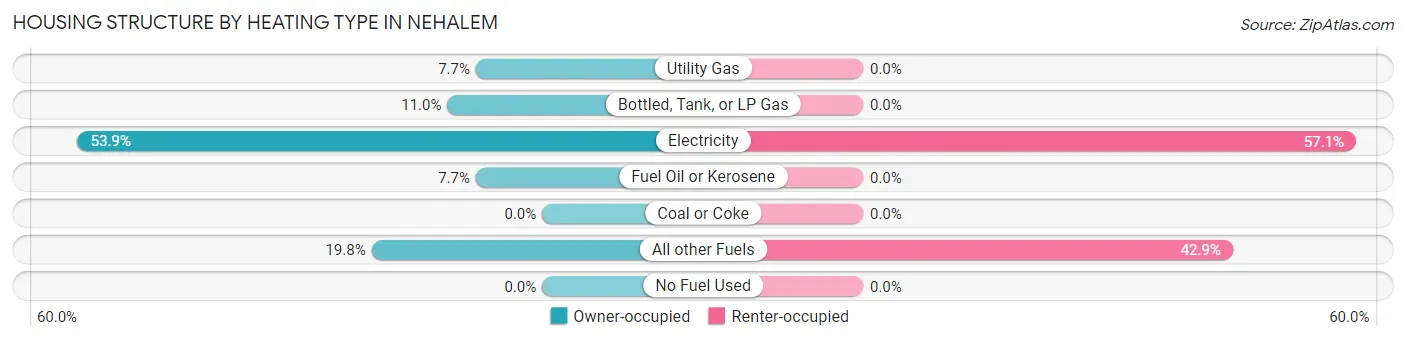
| Heating Type | Owner-occupied | Renter-occupied |
| Utility Gas | 7 (7.7%) | 0 (0.0%) |
| Bottled, Tank, or LP Gas | 10 (11.0%) | 0 (0.0%) |
| Electricity | 49 (53.8%) | 16 (57.1%) |
| Fuel Oil or Kerosene | 7 (7.7%) | 0 (0.0%) |
| Coal or Coke | 0 (0.0%) | 0 (0.0%) |
| All other Fuels | 18 (19.8%) | 12 (42.9%) |
| No Fuel Used | 0 (0.0%) | 0 (0.0%) |
| Total | 91 (100.0%) | 28 (100.0%) |
Household Vehicle Usage in Nehalem
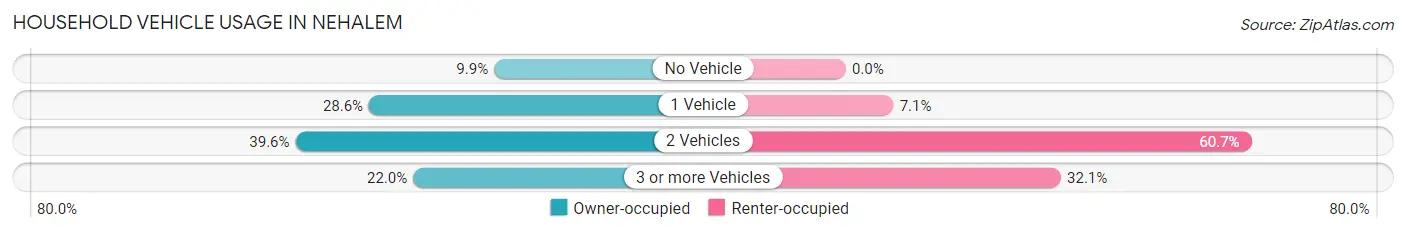
| Vehicles per Household | Owner-occupied | Renter-occupied |
| No Vehicle | 9 (9.9%) | 0 (0.0%) |
| 1 Vehicle | 26 (28.6%) | 2 (7.1%) |
| 2 Vehicles | 36 (39.6%) | 17 (60.7%) |
| 3 or more Vehicles | 20 (22.0%) | 9 (32.1%) |
| Total | 91 (100.0%) | 28 (100.0%) |
Real Estate & Mortgages in Nehalem
Real Estate and Mortgage Overview in Nehalem
| Characteristic | Without Mortgage | With Mortgage |
| Housing Units | 39 | 52 |
| Median Property Value | $358,300 | $333,300 |
| Median Household Income | - | - |
| Monthly Housing Costs | $636 | $5 |
| Real Estate Taxes | $2,250 | $0 |
Property Value by Mortgage Status in Nehalem
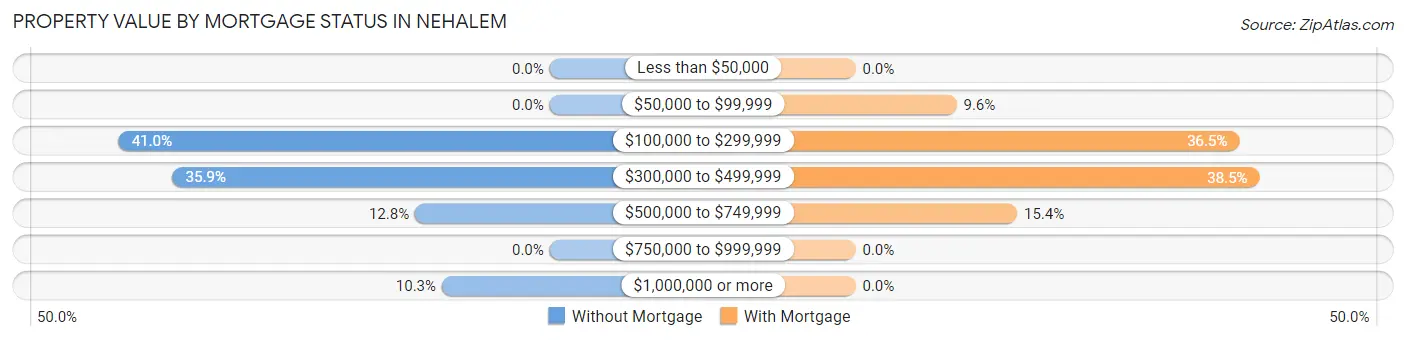
| Property Value | Without Mortgage | With Mortgage |
| Less than $50,000 | 0 (0.0%) | 0 (0.0%) |
| $50,000 to $99,999 | 0 (0.0%) | 5 (9.6%) |
| $100,000 to $299,999 | 16 (41.0%) | 19 (36.5%) |
| $300,000 to $499,999 | 14 (35.9%) | 20 (38.5%) |
| $500,000 to $749,999 | 5 (12.8%) | 8 (15.4%) |
| $750,000 to $999,999 | 0 (0.0%) | 0 (0.0%) |
| $1,000,000 or more | 4 (10.3%) | 0 (0.0%) |
| Total | 39 (100.0%) | 52 (100.0%) |
Household Income by Mortgage Status in Nehalem
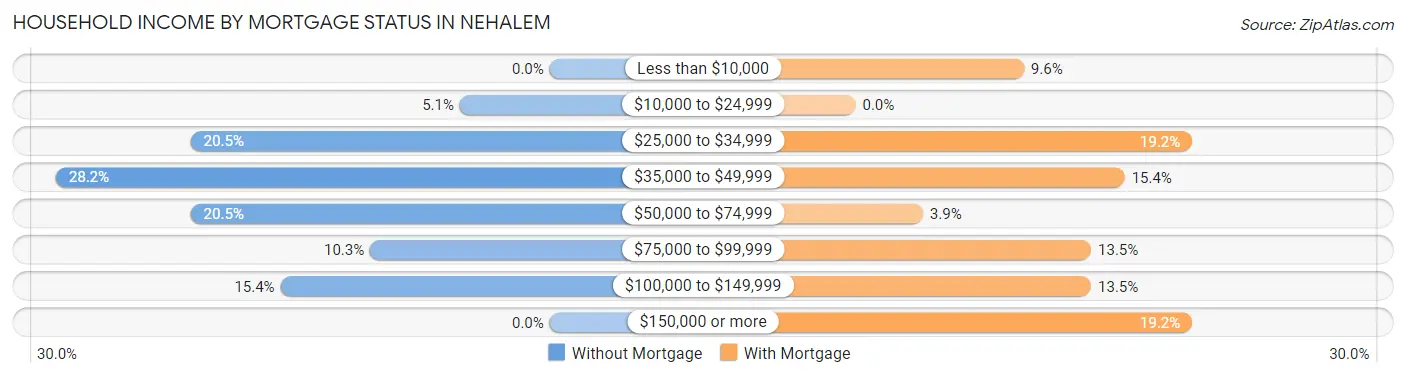
| Household Income | Without Mortgage | With Mortgage |
| Less than $10,000 | 0 (0.0%) | 5 (9.6%) |
| $10,000 to $24,999 | 2 (5.1%) | 0 (0.0%) |
| $25,000 to $34,999 | 8 (20.5%) | 10 (19.2%) |
| $35,000 to $49,999 | 11 (28.2%) | 8 (15.4%) |
| $50,000 to $74,999 | 8 (20.5%) | 2 (3.8%) |
| $75,000 to $99,999 | 4 (10.3%) | 7 (13.5%) |
| $100,000 to $149,999 | 6 (15.4%) | 7 (13.5%) |
| $150,000 or more | 0 (0.0%) | 10 (19.2%) |
| Total | 39 (100.0%) | 52 (100.0%) |
Property Value to Household Income Ratio in Nehalem
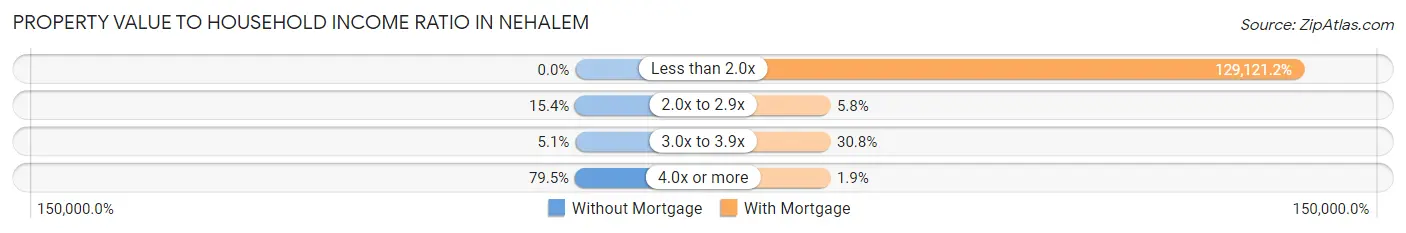
| Value-to-Income Ratio | Without Mortgage | With Mortgage |
| Less than 2.0x | 0 (0.0%) | 67,143 (129,121.1%) |
| 2.0x to 2.9x | 6 (15.4%) | 3 (5.8%) |
| 3.0x to 3.9x | 2 (5.1%) | 16 (30.8%) |
| 4.0x or more | 31 (79.5%) | 1 (1.9%) |
| Total | 39 (100.0%) | 52 (100.0%) |
Real Estate Taxes by Mortgage Status in Nehalem
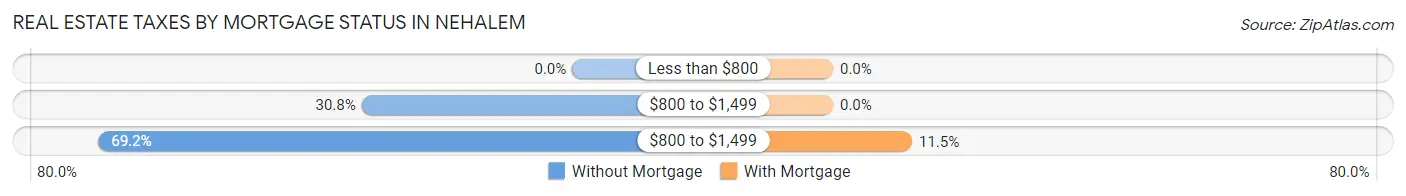
| Property Taxes | Without Mortgage | With Mortgage |
| Less than $800 | 0 (0.0%) | 0 (0.0%) |
| $800 to $1,499 | 12 (30.8%) | 0 (0.0%) |
| $800 to $1,499 | 27 (69.2%) | 6 (11.5%) |
| Total | 39 (100.0%) | 52 (100.0%) |
Health & Disability in Nehalem
Health Insurance Coverage by Age in Nehalem
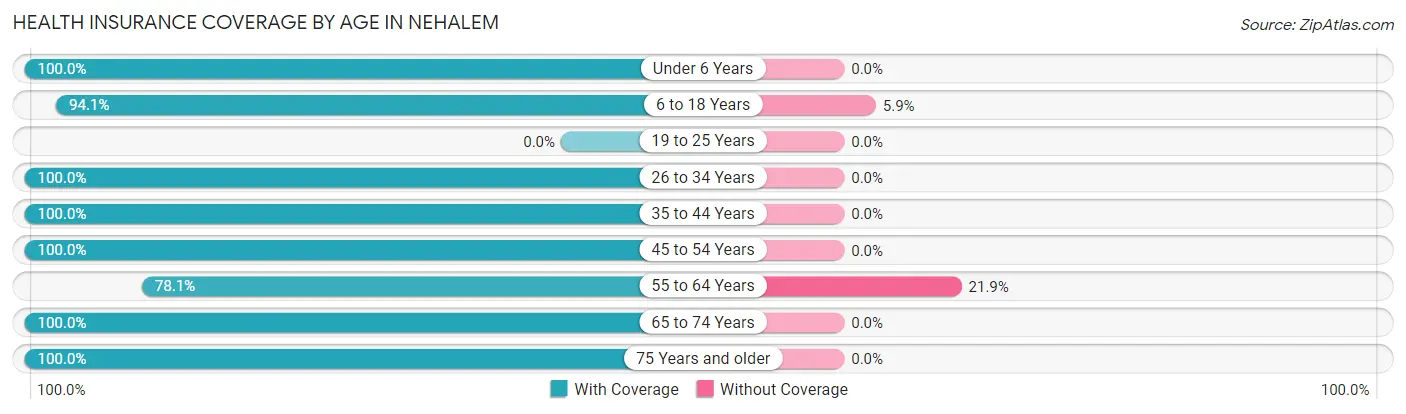
| Age Bracket | With Coverage | Without Coverage |
| Under 6 Years | 13 (100.0%) | 0 (0.0%) |
| 6 to 18 Years | 32 (94.1%) | 2 (5.9%) |
| 19 to 25 Years | 0 (0.0%) | 0 (0.0%) |
| 26 to 34 Years | 33 (100.0%) | 0 (0.0%) |
| 35 to 44 Years | 28 (100.0%) | 0 (0.0%) |
| 45 to 54 Years | 49 (100.0%) | 0 (0.0%) |
| 55 to 64 Years | 25 (78.1%) | 7 (21.9%) |
| 65 to 74 Years | 36 (100.0%) | 0 (0.0%) |
| 75 Years and older | 44 (100.0%) | 0 (0.0%) |
| Total | 260 (96.7%) | 9 (3.4%) |
Health Insurance Coverage by Citizenship Status in Nehalem
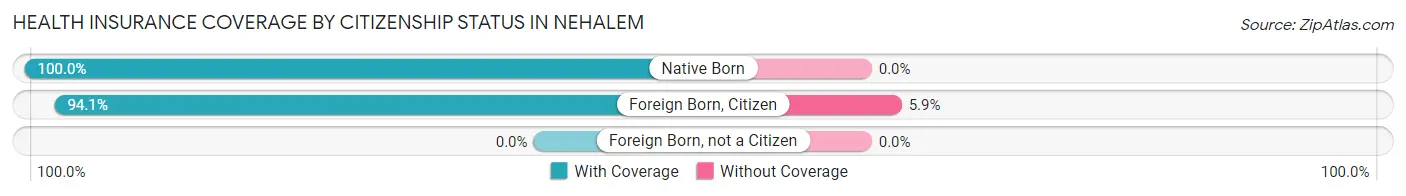
| Citizenship Status | With Coverage | Without Coverage |
| Native Born | 13 (100.0%) | 0 (0.0%) |
| Foreign Born, Citizen | 32 (94.1%) | 2 (5.9%) |
| Foreign Born, not a Citizen | 0 (0.0%) | 0 (0.0%) |
Health Insurance Coverage by Household Income in Nehalem
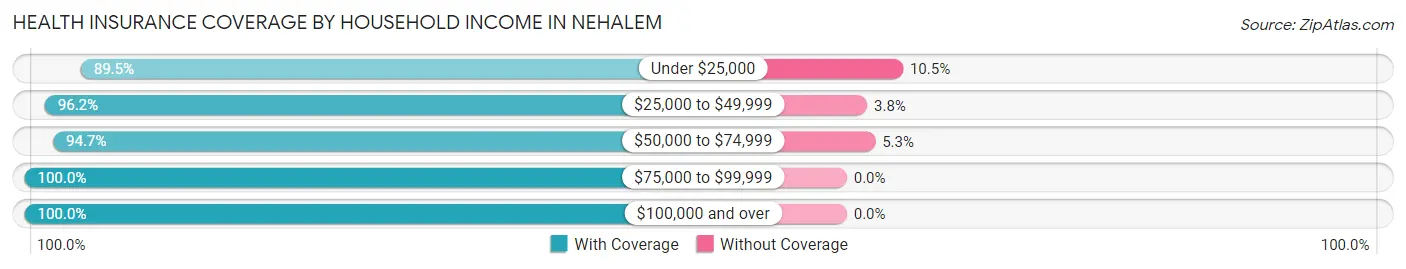
| Household Income | With Coverage | Without Coverage |
| Under $25,000 | 17 (89.5%) | 2 (10.5%) |
| $25,000 to $49,999 | 76 (96.2%) | 3 (3.8%) |
| $50,000 to $74,999 | 71 (94.7%) | 4 (5.3%) |
| $75,000 to $99,999 | 27 (100.0%) | 0 (0.0%) |
| $100,000 and over | 69 (100.0%) | 0 (0.0%) |
Public vs Private Health Insurance Coverage by Age in Nehalem
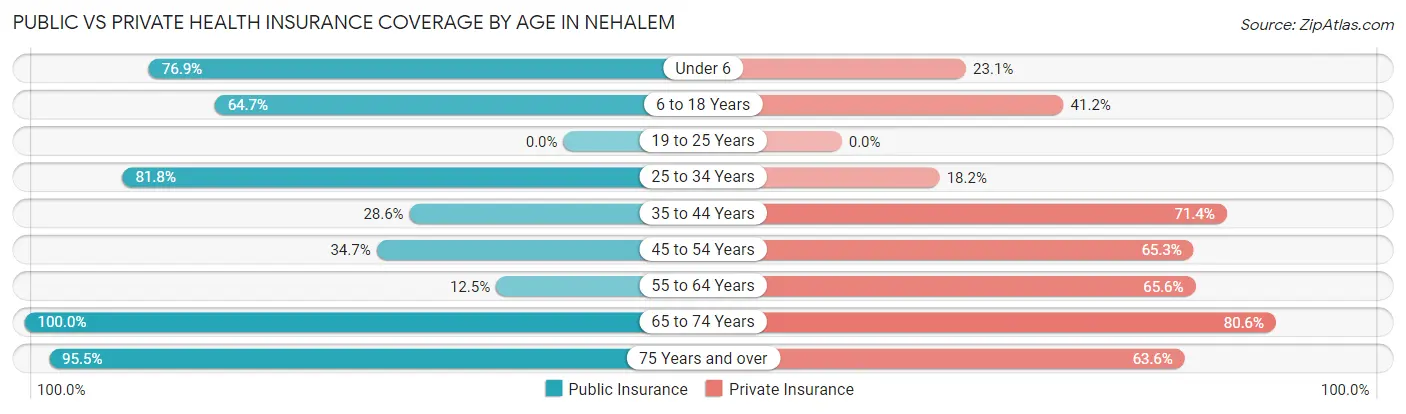
| Age Bracket | Public Insurance | Private Insurance |
| Under 6 | 10 (76.9%) | 3 (23.1%) |
| 6 to 18 Years | 22 (64.7%) | 14 (41.2%) |
| 19 to 25 Years | 0 (0.0%) | 0 (0.0%) |
| 25 to 34 Years | 27 (81.8%) | 6 (18.2%) |
| 35 to 44 Years | 8 (28.6%) | 20 (71.4%) |
| 45 to 54 Years | 17 (34.7%) | 32 (65.3%) |
| 55 to 64 Years | 4 (12.5%) | 21 (65.6%) |
| 65 to 74 Years | 36 (100.0%) | 29 (80.6%) |
| 75 Years and over | 42 (95.5%) | 28 (63.6%) |
| Total | 166 (61.7%) | 153 (56.9%) |
Disability Status by Sex by Age in Nehalem
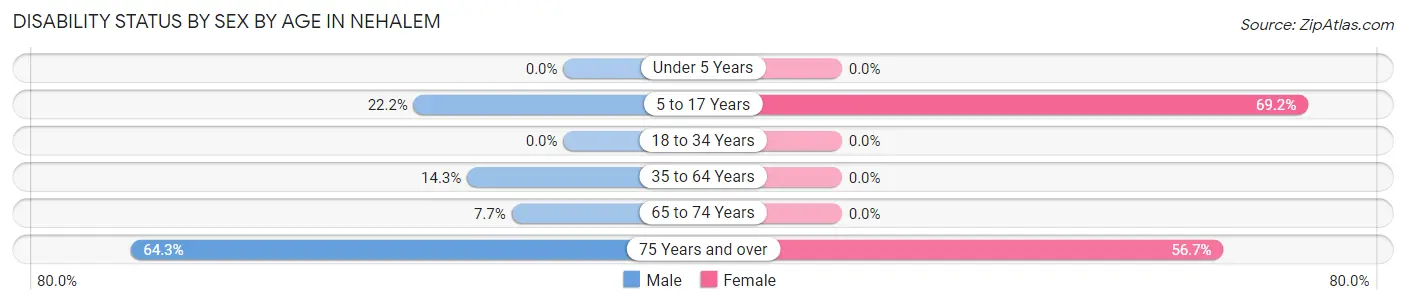
| Age Bracket | Male | Female |
| Under 5 Years | 0 (0.0%) | 0 (0.0%) |
| 5 to 17 Years | 2 (22.2%) | 18 (69.2%) |
| 18 to 34 Years | 0 (0.0%) | 0 (0.0%) |
| 35 to 64 Years | 7 (14.3%) | 0 (0.0%) |
| 65 to 74 Years | 2 (7.7%) | 0 (0.0%) |
| 75 Years and over | 9 (64.3%) | 17 (56.7%) |
Disability Class by Sex by Age in Nehalem
Disability Class: Hearing Difficulty
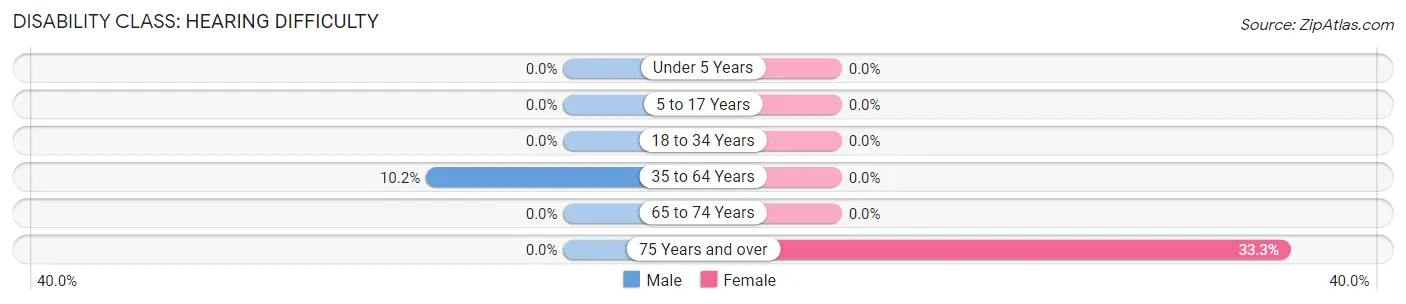
| Age Bracket | Male | Female |
| Under 5 Years | 0 (0.0%) | 0 (0.0%) |
| 5 to 17 Years | 0 (0.0%) | 0 (0.0%) |
| 18 to 34 Years | 0 (0.0%) | 0 (0.0%) |
| 35 to 64 Years | 5 (10.2%) | 0 (0.0%) |
| 65 to 74 Years | 0 (0.0%) | 0 (0.0%) |
| 75 Years and over | 0 (0.0%) | 10 (33.3%) |
Disability Class: Vision Difficulty
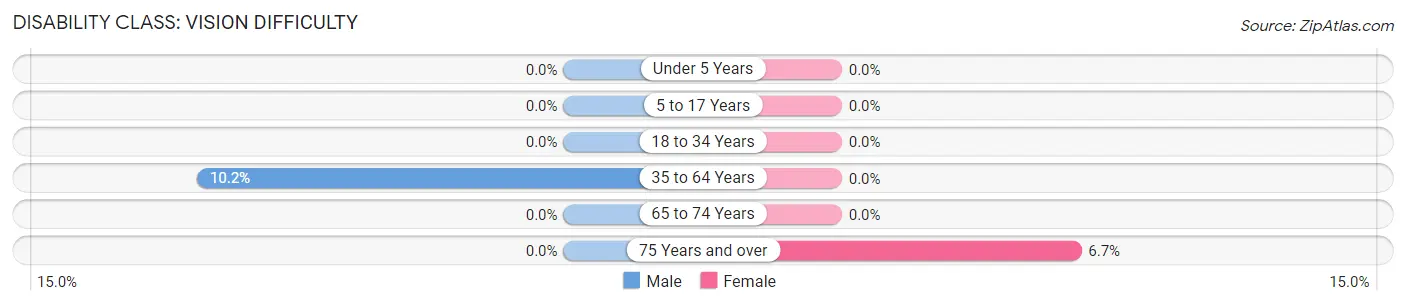
| Age Bracket | Male | Female |
| Under 5 Years | 0 (0.0%) | 0 (0.0%) |
| 5 to 17 Years | 0 (0.0%) | 0 (0.0%) |
| 18 to 34 Years | 0 (0.0%) | 0 (0.0%) |
| 35 to 64 Years | 5 (10.2%) | 0 (0.0%) |
| 65 to 74 Years | 0 (0.0%) | 0 (0.0%) |
| 75 Years and over | 0 (0.0%) | 2 (6.7%) |
Disability Class: Cognitive Difficulty
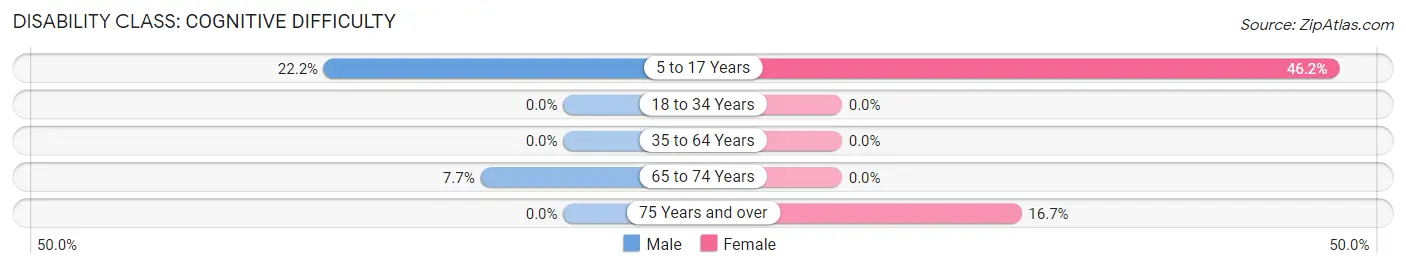
| Age Bracket | Male | Female |
| 5 to 17 Years | 2 (22.2%) | 12 (46.2%) |
| 18 to 34 Years | 0 (0.0%) | 0 (0.0%) |
| 35 to 64 Years | 0 (0.0%) | 0 (0.0%) |
| 65 to 74 Years | 2 (7.7%) | 0 (0.0%) |
| 75 Years and over | 0 (0.0%) | 5 (16.7%) |
Disability Class: Ambulatory Difficulty
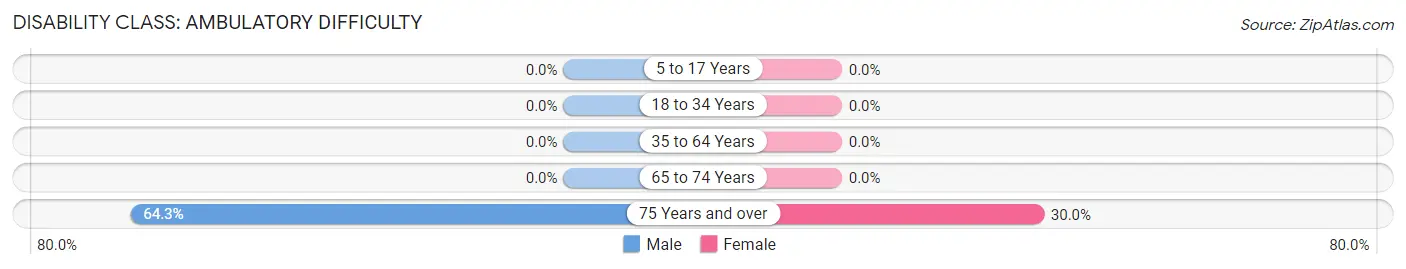
| Age Bracket | Male | Female |
| 5 to 17 Years | 0 (0.0%) | 0 (0.0%) |
| 18 to 34 Years | 0 (0.0%) | 0 (0.0%) |
| 35 to 64 Years | 0 (0.0%) | 0 (0.0%) |
| 65 to 74 Years | 0 (0.0%) | 0 (0.0%) |
| 75 Years and over | 9 (64.3%) | 9 (30.0%) |
Disability Class: Self-Care Difficulty
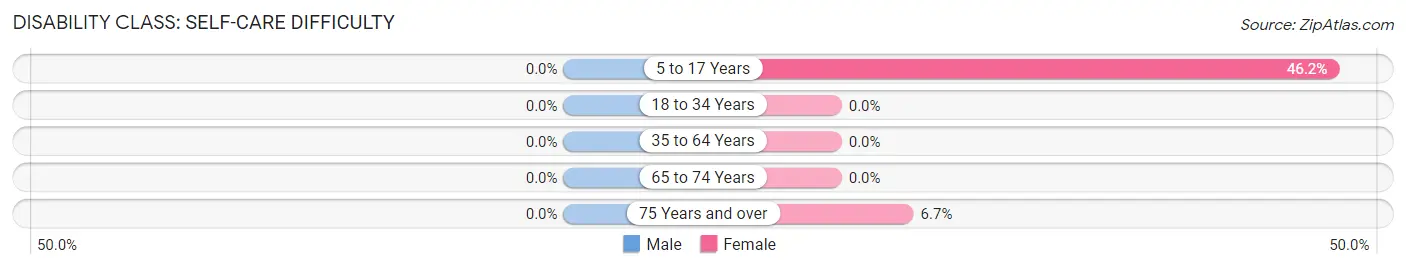
| Age Bracket | Male | Female |
| 5 to 17 Years | 0 (0.0%) | 12 (46.2%) |
| 18 to 34 Years | 0 (0.0%) | 0 (0.0%) |
| 35 to 64 Years | 0 (0.0%) | 0 (0.0%) |
| 65 to 74 Years | 0 (0.0%) | 0 (0.0%) |
| 75 Years and over | 0 (0.0%) | 2 (6.7%) |
Technology Access in Nehalem
Computing Device Access in Nehalem
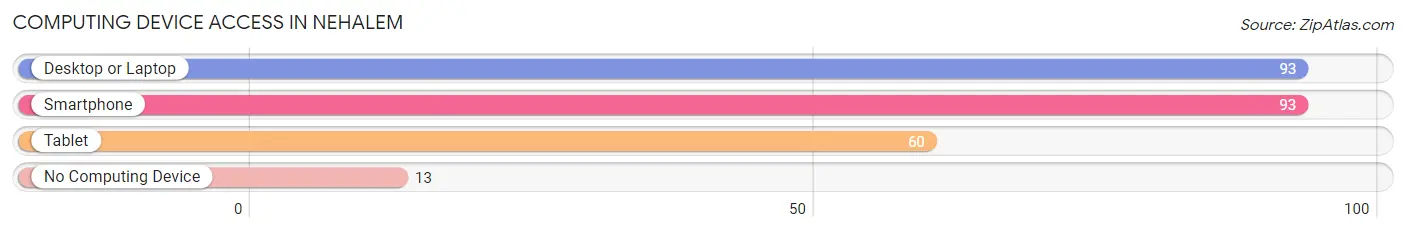
| Device Type | # Households | % Households |
| Desktop or Laptop | 93 | 78.1% |
| Smartphone | 93 | 78.1% |
| Tablet | 60 | 50.4% |
| No Computing Device | 13 | 10.9% |
| Total | 119 | 100.0% |
Internet Access in Nehalem
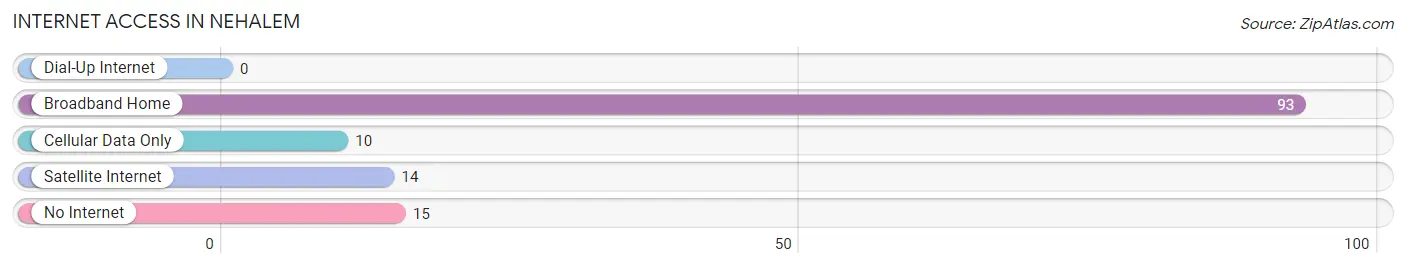
| Internet Type | # Households | % Households |
| Dial-Up Internet | 0 | 0.0% |
| Broadband Home | 93 | 78.1% |
| Cellular Data Only | 10 | 8.4% |
| Satellite Internet | 14 | 11.8% |
| No Internet | 15 | 12.6% |
| Total | 119 | 100.0% |
Nehalem Summary
Nehalem is a small unincorporated community located in Tillamook County, Oregon, United States. It is situated on the Nehalem River, approximately 10 miles (16 km) south of the city of Tillamook. The population of Nehalem was estimated to be around 1,000 in 2020.
History
The area that is now Nehalem was first inhabited by the Tillamook people, who lived in the area for thousands of years before the arrival of European settlers. The first European settlers arrived in the area in the late 19th century, and the town of Nehalem was officially established in 1891. The town was named after the Nehalem River, which was named by the Tillamook people.
The town of Nehalem was originally a logging and fishing community, and it remained so until the mid-20th century. In the 1950s, the town began to experience a period of growth and development, as it became a popular tourist destination. The town was also home to a number of small businesses, including a sawmill, a cannery, and a fish processing plant.
Geography
Nehalem is located in the northern part of Tillamook County, Oregon, approximately 10 miles (16 km) south of the city of Tillamook. The town is situated on the Nehalem River, which flows through the town and empties into the Pacific Ocean. The town is surrounded by lush forests and is home to a number of parks and recreational areas, including Nehalem Bay State Park and Nehalem Bay National Wildlife Refuge.
Economy
The economy of Nehalem is largely based on tourism and recreation. The town is home to a number of small businesses, including restaurants, shops, and lodging. The town is also home to a number of recreational activities, including fishing, boating, and hiking.
Demographics
As of the 2010 census, the population of Nehalem was estimated to be around 1,000. The racial makeup of the town was 94.3% White, 0.7% Native American, 0.3% Asian, 0.2% African American, and 4.5% from other races. The median household income in Nehalem was $41,250, and the median family income was $50,000. The per capita income in Nehalem was $20,000.
Common Questions
What is Per Capita Income in Nehalem?
Per Capita income in Nehalem is $31,617.
What is the Median Family Income in Nehalem?
Median Family Income in Nehalem is $74,531.
What is the Median Household income in Nehalem?
Median Household Income in Nehalem is $66,964.
What is Income or Wage Gap in Nehalem?
Income or Wage Gap in Nehalem is 11.5%.
Women in Nehalem earn 88.5 cents for every dollar earned by a man.
What is Inequality or Gini Index in Nehalem?
Inequality or Gini Index in Nehalem is 0.35.
What is the Total Population of Nehalem?
Total Population of Nehalem is 269.
What is the Total Male Population of Nehalem?
Total Male Population of Nehalem is 134.
What is the Total Female Population of Nehalem?
Total Female Population of Nehalem is 135.
What is the Ratio of Males per 100 Females in Nehalem?
There are 99.26 Males per 100 Females in Nehalem.
What is the Ratio of Females per 100 Males in Nehalem?
There are 100.75 Females per 100 Males in Nehalem.
What is the Median Population Age in Nehalem?
Median Population Age in Nehalem is 52.6 Years.
What is the Average Family Size in Nehalem
Average Family Size in Nehalem is 2.6 People.
What is the Average Household Size in Nehalem
Average Household Size in Nehalem is 2.3 People.
How Large is the Labor Force in Nehalem?
There are 152 People in the Labor Forcein in Nehalem.
What is the Percentage of People in the Labor Force in Nehalem?
65.8% of People are in the Labor Force in Nehalem.
What is the Unemployment Rate in Nehalem?
Unemployment Rate in Nehalem is 15.8%.