Unity, OR Map & Demographics
Unity Map
Unity Overview
$41,076
PER CAPITA INCOME
$41,250
AVG HOUSEHOLD INCOME
0.49
INEQUALITY / GINI INDEX
37
TOTAL POPULATION
23
MALE POPULATION
14
FEMALE POPULATION
164.29
MALES / 100 FEMALES
60.87
FEMALES / 100 MALES
69.7
MEDIAN AGE
2.1
AVG FAMILY SIZE
1.3
AVG HOUSEHOLD SIZE
9
LABOR FORCE [ PEOPLE ]
27.3%
PERCENT IN LABOR FORCE
Unity Zip Codes
Unity Area Codes
Income in Unity
Income Overview in Unity
| Characteristic | Number | Measure |
| Per Capita Income | 37 | $41,076 |
| Median Family Income | 8 | $0 |
| Mean Family Income | 8 | $113,663 |
| Median Household Income | 28 | $41,250 |
| Mean Household Income | 28 | $56,568 |
| Income Deficit | 8 | $0 |
| Wage / Income Gap (%) | 37 | 0.00% |
| Wage / Income Gap ($) | 37 | 100.00¢ per $1 |
| Gini / Inequality Index | 37 | 0.49 |
Earnings by Sex in Unity
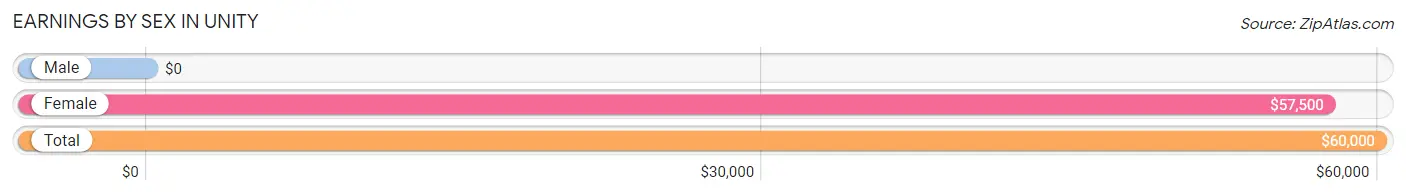
| Sex | Number | Average Earnings |
| Male | 6 (60.0%) | $0 |
| Female | 4 (40.0%) | $57,500 |
| Total | 10 (100.0%) | $60,000 |
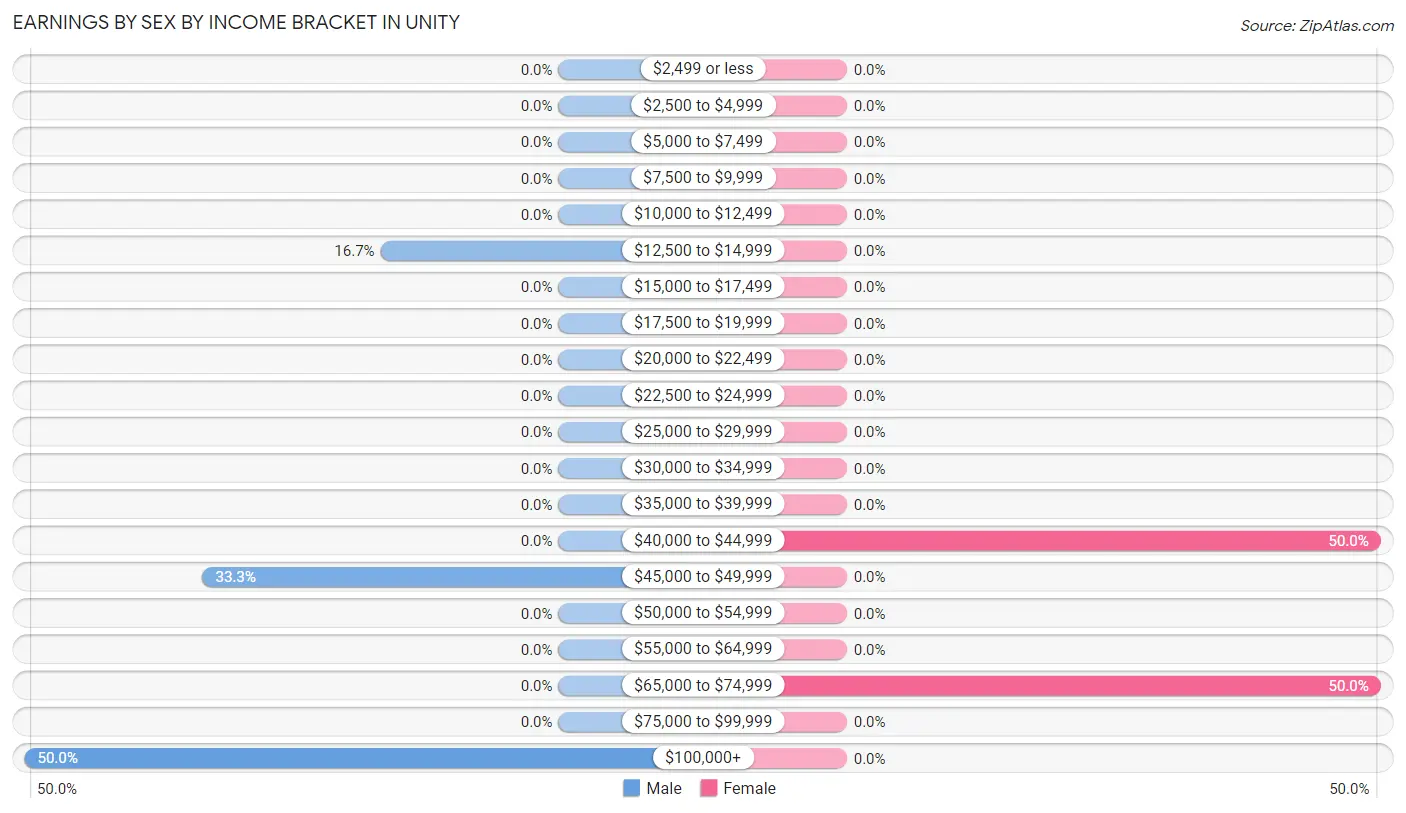
Earnings by Sex by Income Bracket in Unity
The most common earnings brackets in Unity are $100,000+ for men (3 | 50.0%) and $40,000 to $44,999 for women (2 | 50.0%).
| Income | Male | Female |
| $2,499 or less | 0 (0.0%) | 0 (0.0%) |
| $2,500 to $4,999 | 0 (0.0%) | 0 (0.0%) |
| $5,000 to $7,499 | 0 (0.0%) | 0 (0.0%) |
| $7,500 to $9,999 | 0 (0.0%) | 0 (0.0%) |
| $10,000 to $12,499 | 0 (0.0%) | 0 (0.0%) |
| $12,500 to $14,999 | 1 (16.7%) | 0 (0.0%) |
| $15,000 to $17,499 | 0 (0.0%) | 0 (0.0%) |
| $17,500 to $19,999 | 0 (0.0%) | 0 (0.0%) |
| $20,000 to $22,499 | 0 (0.0%) | 0 (0.0%) |
| $22,500 to $24,999 | 0 (0.0%) | 0 (0.0%) |
| $25,000 to $29,999 | 0 (0.0%) | 0 (0.0%) |
| $30,000 to $34,999 | 0 (0.0%) | 0 (0.0%) |
| $35,000 to $39,999 | 0 (0.0%) | 0 (0.0%) |
| $40,000 to $44,999 | 0 (0.0%) | 2 (50.0%) |
| $45,000 to $49,999 | 2 (33.3%) | 0 (0.0%) |
| $50,000 to $54,999 | 0 (0.0%) | 0 (0.0%) |
| $55,000 to $64,999 | 0 (0.0%) | 0 (0.0%) |
| $65,000 to $74,999 | 0 (0.0%) | 2 (50.0%) |
| $75,000 to $99,999 | 0 (0.0%) | 0 (0.0%) |
| $100,000+ | 3 (50.0%) | 0 (0.0%) |
| Total | 6 (100.0%) | 4 (100.0%) |
Earnings by Sex by Educational Attainment in Unity
| Educational Attainment | Male Income | Female Income |
| Less than High School | - | - |
| High School Diploma | - | - |
| College or Associate's Degree | - | - |
| Bachelor's Degree | - | - |
| Graduate Degree | - | - |
| Total | - | - |
Family Income in Unity
Family Income Brackets in Unity
According to the Unity family income data, there are 2 families falling into the $15,000 to $24,999 income range, which is the most common income bracket and makes up 25.0% of all families.
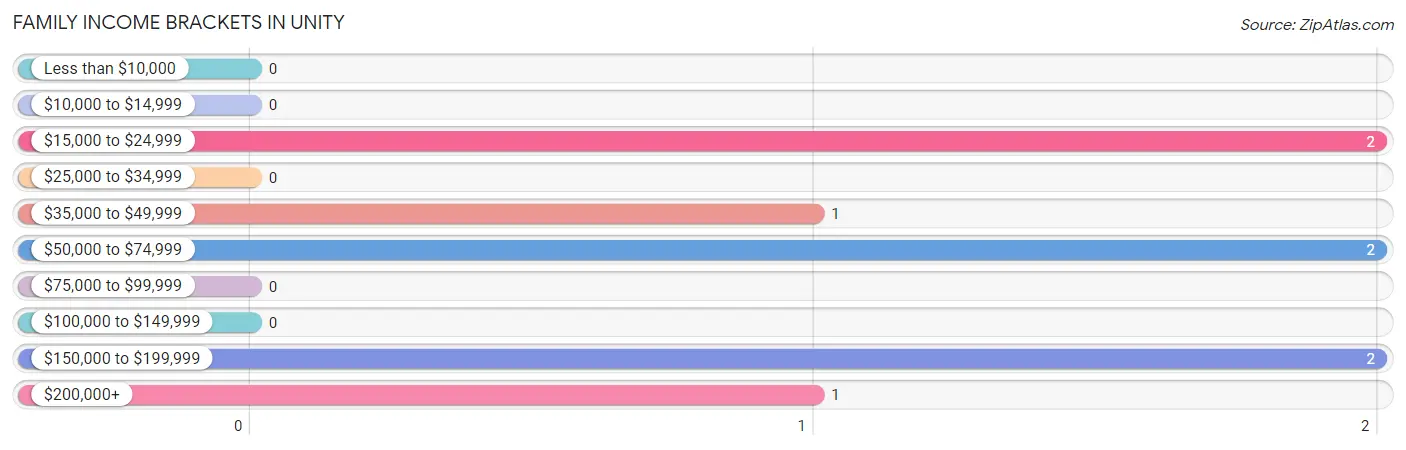
| Income Bracket | # Families | % Families |
| Less than $10,000 | 0 | 0.0% |
| $10,000 to $14,999 | 0 | 0.0% |
| $15,000 to $24,999 | 2 | 25.0% |
| $25,000 to $34,999 | 0 | 0.0% |
| $35,000 to $49,999 | 1 | 12.5% |
| $50,000 to $74,999 | 2 | 25.0% |
| $75,000 to $99,999 | 0 | 0.0% |
| $100,000 to $149,999 | 0 | 0.0% |
| $150,000 to $199,999 | 2 | 25.0% |
| $200,000+ | 1 | 12.5% |
Family Income by Famaliy Size in Unity
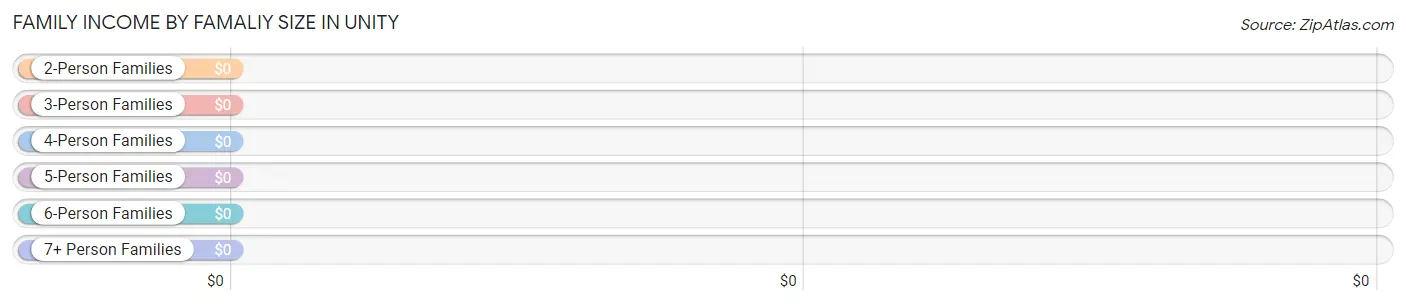
| Income Bracket | # Families | Median Income |
| 2-Person Families | 6 (75.0%) | $0 |
| 3-Person Families | 2 (25.0%) | $0 |
| 4-Person Families | 0 (0.0%) | $0 |
| 5-Person Families | 0 (0.0%) | $0 |
| 6-Person Families | 0 (0.0%) | $0 |
| 7+ Person Families | 0 (0.0%) | $0 |
| Total | 8 (100.0%) | $0 |
Family Income by Number of Earners in Unity
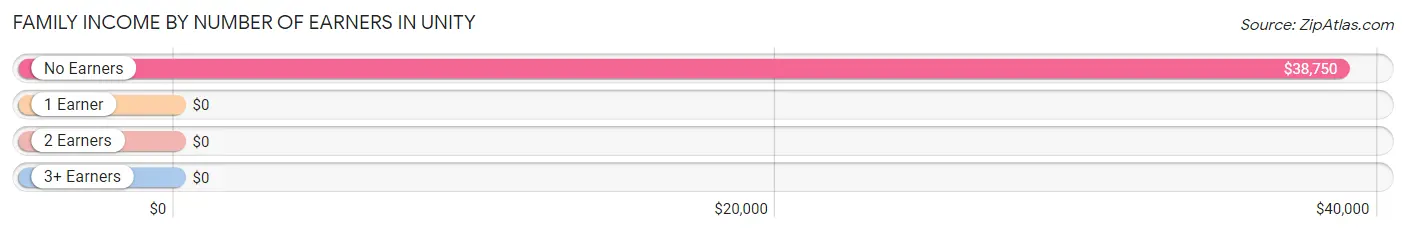
| Number of Earners | # Families | Median Income |
| No Earners | 5 (62.5%) | $38,750 |
| 1 Earner | 0 (0.0%) | $0 |
| 2 Earners | 3 (37.5%) | $0 |
| 3+ Earners | 0 (0.0%) | $0 |
| Total | 8 (100.0%) | $0 |
Household Income in Unity
Household Income Brackets in Unity
With 8 households falling in the category, the $35,000 to $49,999 income range is the most frequent in Unity, accounting for 28.6% of all households.
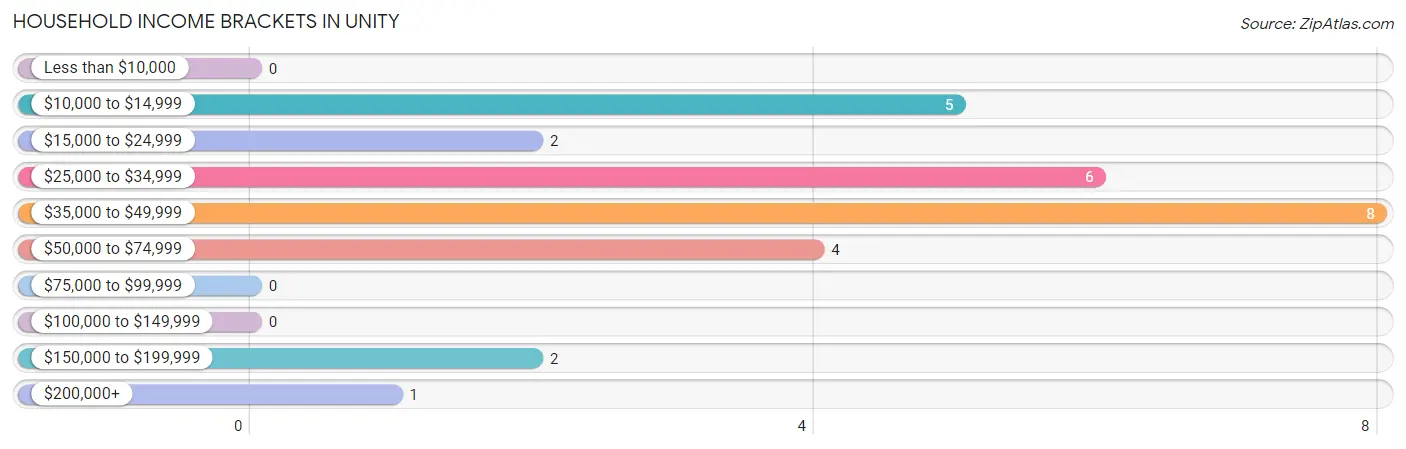
| Income Bracket | # Households | % Households |
| Less than $10,000 | 0 | 0.0% |
| $10,000 to $14,999 | 5 | 17.9% |
| $15,000 to $24,999 | 2 | 7.1% |
| $25,000 to $34,999 | 6 | 21.4% |
| $35,000 to $49,999 | 8 | 28.6% |
| $50,000 to $74,999 | 4 | 14.3% |
| $75,000 to $99,999 | 0 | 0.0% |
| $100,000 to $149,999 | 0 | 0.0% |
| $150,000 to $199,999 | 2 | 7.1% |
| $200,000+ | 1 | 3.6% |
Household Income by Householder Age in Unity
The median household income in Unity is $41,250, with the highest median household income of $38,750 found in the 65+ years age bracket for the primary householder. A total of 21 households (75.0%) fall into this category.
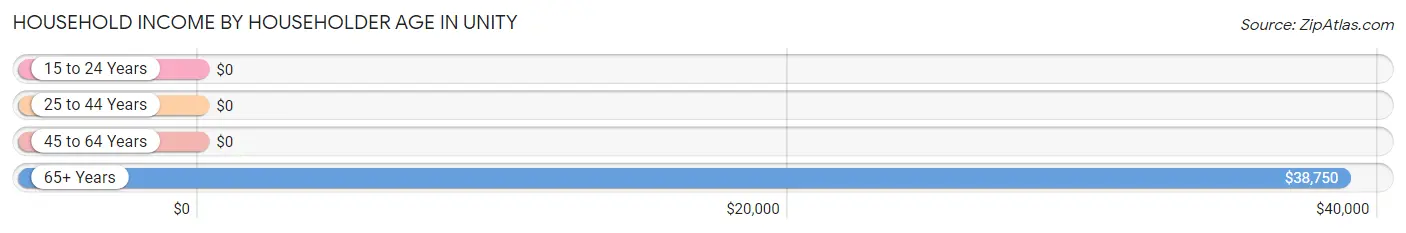
| Income Bracket | # Households | Median Income |
| 15 to 24 Years | 0 (0.0%) | $0 |
| 25 to 44 Years | 2 (7.1%) | $0 |
| 45 to 64 Years | 5 (17.9%) | $0 |
| 65+ Years | 21 (75.0%) | $38,750 |
| Total | 28 (100.0%) | $41,250 |
Poverty in Unity
Income Below Poverty by Sex and Age in Unity
With 21.7% poverty level for males and 42.9% for females among the residents of Unity, 55 to 64 year old males and 6 to 11 year old females are the most vulnerable to poverty, with 1 males (100.0%) and 4 females (100.0%) in their respective age groups living below the poverty level.
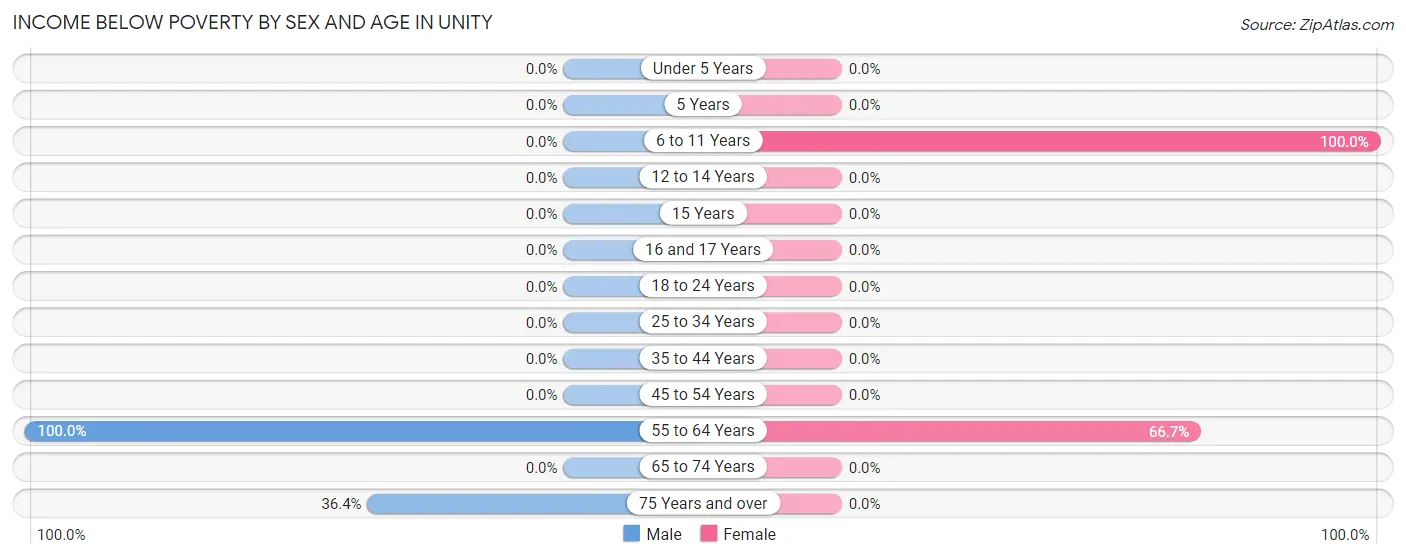
| Age Bracket | Male | Female |
| Under 5 Years | 0 (0.0%) | 0 (0.0%) |
| 5 Years | 0 (0.0%) | 0 (0.0%) |
| 6 to 11 Years | 0 (0.0%) | 4 (100.0%) |
| 12 to 14 Years | 0 (0.0%) | 0 (0.0%) |
| 15 Years | 0 (0.0%) | 0 (0.0%) |
| 16 and 17 Years | 0 (0.0%) | 0 (0.0%) |
| 18 to 24 Years | 0 (0.0%) | 0 (0.0%) |
| 25 to 34 Years | 0 (0.0%) | 0 (0.0%) |
| 35 to 44 Years | 0 (0.0%) | 0 (0.0%) |
| 45 to 54 Years | 0 (0.0%) | 0 (0.0%) |
| 55 to 64 Years | 1 (100.0%) | 2 (66.7%) |
| 65 to 74 Years | 0 (0.0%) | 0 (0.0%) |
| 75 Years and over | 4 (36.4%) | 0 (0.0%) |
| Total | 5 (21.7%) | 6 (42.9%) |
Income Above Poverty by Sex and Age in Unity
According to the poverty statistics in Unity, males aged 45 to 54 years and females aged 35 to 44 years are the age groups that are most secure financially, with 100.0% of males and 100.0% of females in these age groups living above the poverty line.
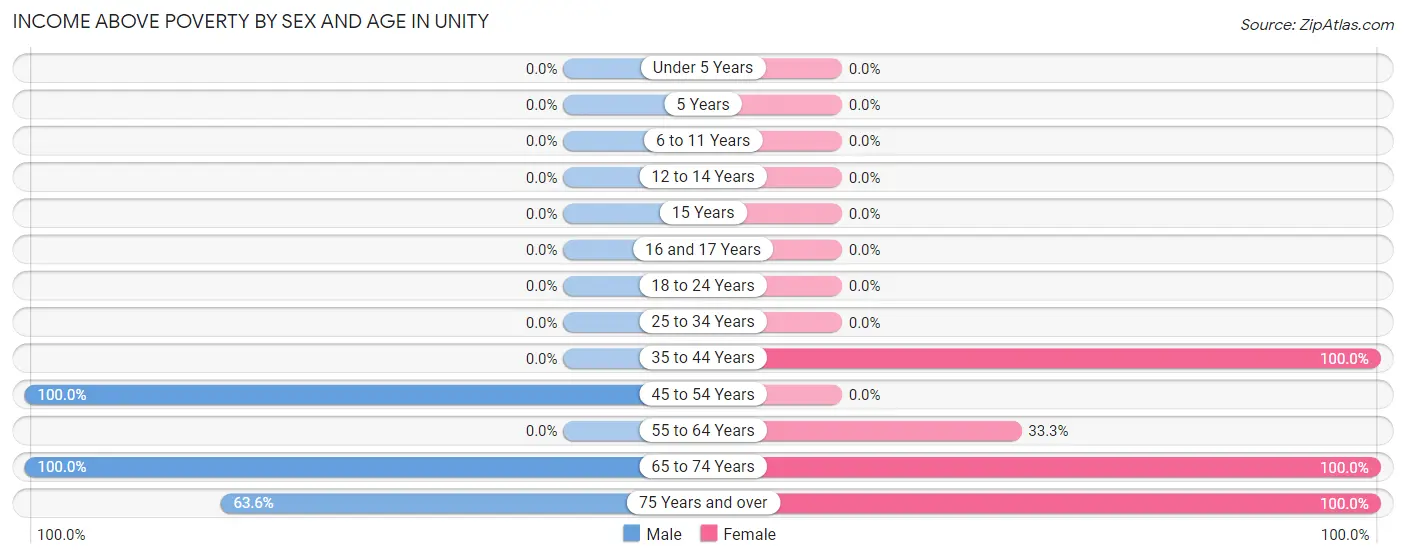
| Age Bracket | Male | Female |
| Under 5 Years | 0 (0.0%) | 0 (0.0%) |
| 5 Years | 0 (0.0%) | 0 (0.0%) |
| 6 to 11 Years | 0 (0.0%) | 0 (0.0%) |
| 12 to 14 Years | 0 (0.0%) | 0 (0.0%) |
| 15 Years | 0 (0.0%) | 0 (0.0%) |
| 16 and 17 Years | 0 (0.0%) | 0 (0.0%) |
| 18 to 24 Years | 0 (0.0%) | 0 (0.0%) |
| 25 to 34 Years | 0 (0.0%) | 0 (0.0%) |
| 35 to 44 Years | 0 (0.0%) | 2 (100.0%) |
| 45 to 54 Years | 2 (100.0%) | 0 (0.0%) |
| 55 to 64 Years | 0 (0.0%) | 1 (33.3%) |
| 65 to 74 Years | 9 (100.0%) | 4 (100.0%) |
| 75 Years and over | 7 (63.6%) | 1 (100.0%) |
| Total | 18 (78.3%) | 8 (57.1%) |
Income Below Poverty Among Married-Couple Families in Unity
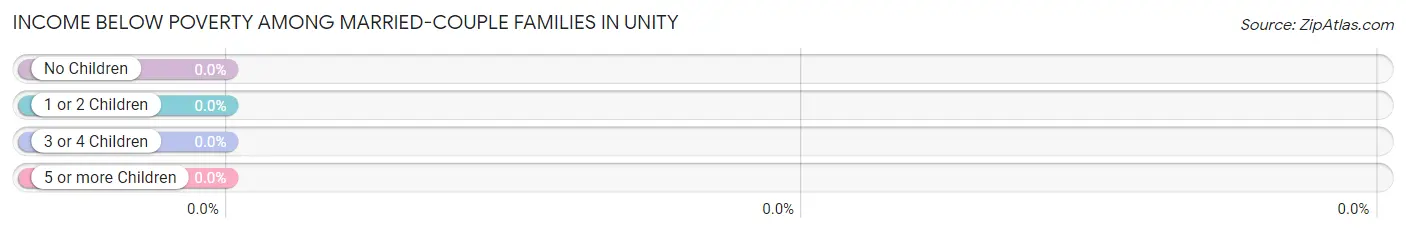
| Children | Above Poverty | Below Poverty |
| No Children | 6 (100.0%) | 0 (0.0%) |
| 1 or 2 Children | 0 (0.0%) | 0 (0.0%) |
| 3 or 4 Children | 0 (0.0%) | 0 (0.0%) |
| 5 or more Children | 0 (0.0%) | 0 (0.0%) |
| Total | 6 (100.0%) | 0 (0.0%) |
Income Below Poverty Among Single-Parent Households in Unity
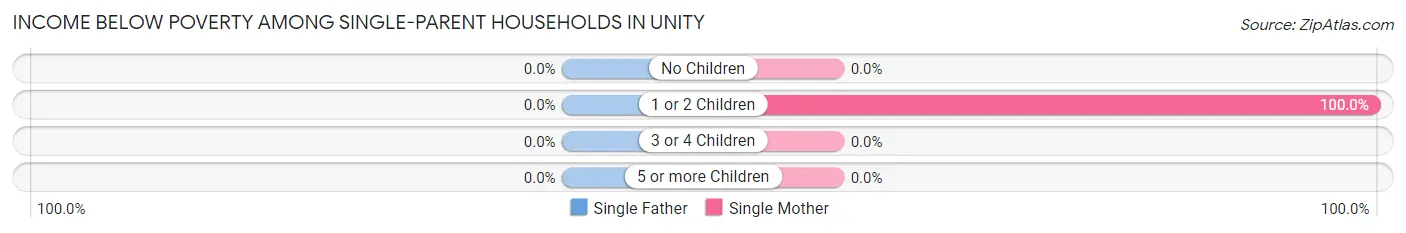
| Children | Single Father | Single Mother |
| No Children | 0 (0.0%) | 0 (0.0%) |
| 1 or 2 Children | 0 (0.0%) | 2 (100.0%) |
| 3 or 4 Children | 0 (0.0%) | 0 (0.0%) |
| 5 or more Children | 0 (0.0%) | 0 (0.0%) |
| Total | 0 (0.0%) | 2 (100.0%) |
Income Below Poverty Among Married-Couple vs Single-Parent Households in Unity
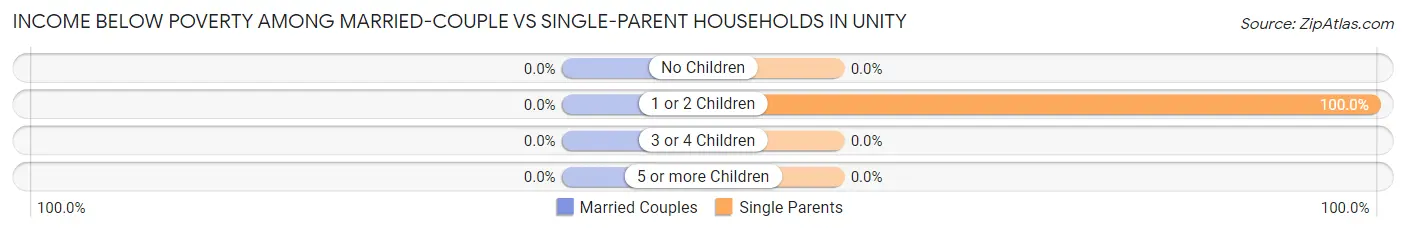
| Children | Married-Couple Families | Single-Parent Households |
| No Children | 0 (0.0%) | 0 (0.0%) |
| 1 or 2 Children | 0 (0.0%) | 2 (100.0%) |
| 3 or 4 Children | 0 (0.0%) | 0 (0.0%) |
| 5 or more Children | 0 (0.0%) | 0 (0.0%) |
| Total | 0 (0.0%) | 2 (100.0%) |
Race in Unity
The most populous races in Unity are , and White / Caucasian (37 | 100.0%).
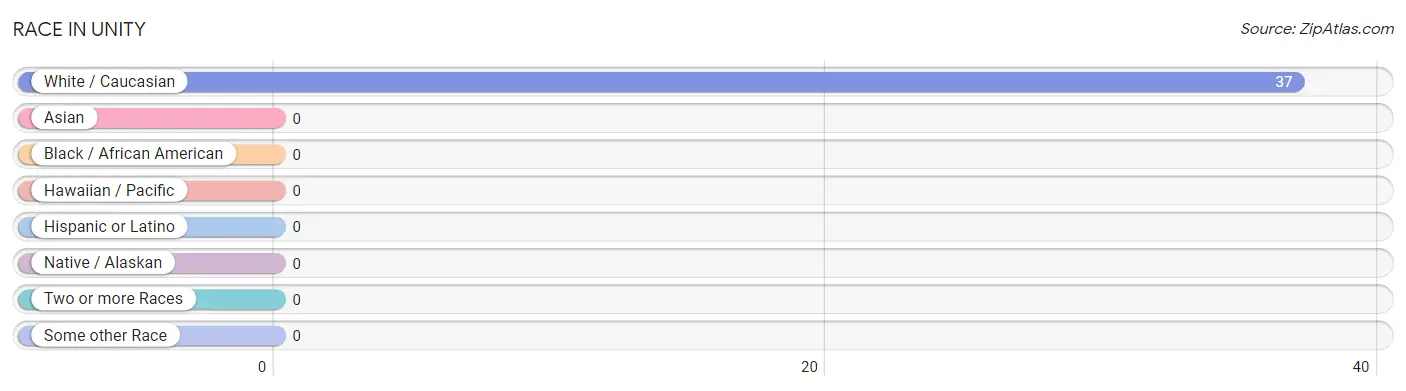
| Race | # Population | % Population |
| Asian | 0 | 0.0% |
| Black / African American | 0 | 0.0% |
| Hawaiian / Pacific | 0 | 0.0% |
| Hispanic or Latino | 0 | 0.0% |
| Native / Alaskan | 0 | 0.0% |
| White / Caucasian | 37 | 100.0% |
| Two or more Races | 0 | 0.0% |
| Some other Race | 0 | 0.0% |
| Total | 37 | 100.0% |
Ancestry in Unity
The most populous ancestries reported in Unity are German (13 | 35.1%), Dutch (7 | 18.9%), English (6 | 16.2%), French (4 | 10.8%), and Irish (3 | 8.1%), together accounting for 89.2% of all Unity residents.
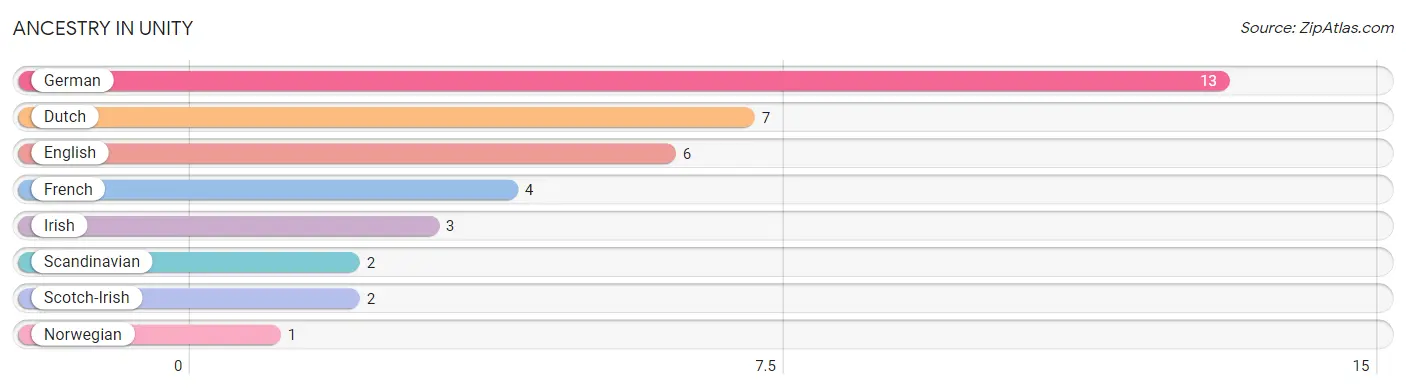
| Ancestry | # Population | % Population |
| Dutch | 7 | 18.9% |
| English | 6 | 16.2% |
| French | 4 | 10.8% |
| German | 13 | 35.1% |
| Irish | 3 | 8.1% |
| Norwegian | 1 | 2.7% |
| Scandinavian | 2 | 5.4% |
| Scotch-Irish | 2 | 5.4% | View All 8 Rows |
Immigrants in Unity

| Immigration Origin | # Population | % Population | View All 0 Rows |
Sex and Age in Unity
Sex and Age in Unity
The most populous age groups in Unity are 65 to 69 Years (7 | 30.4%) for men and 5 to 9 Years (4 | 28.6%) for women.
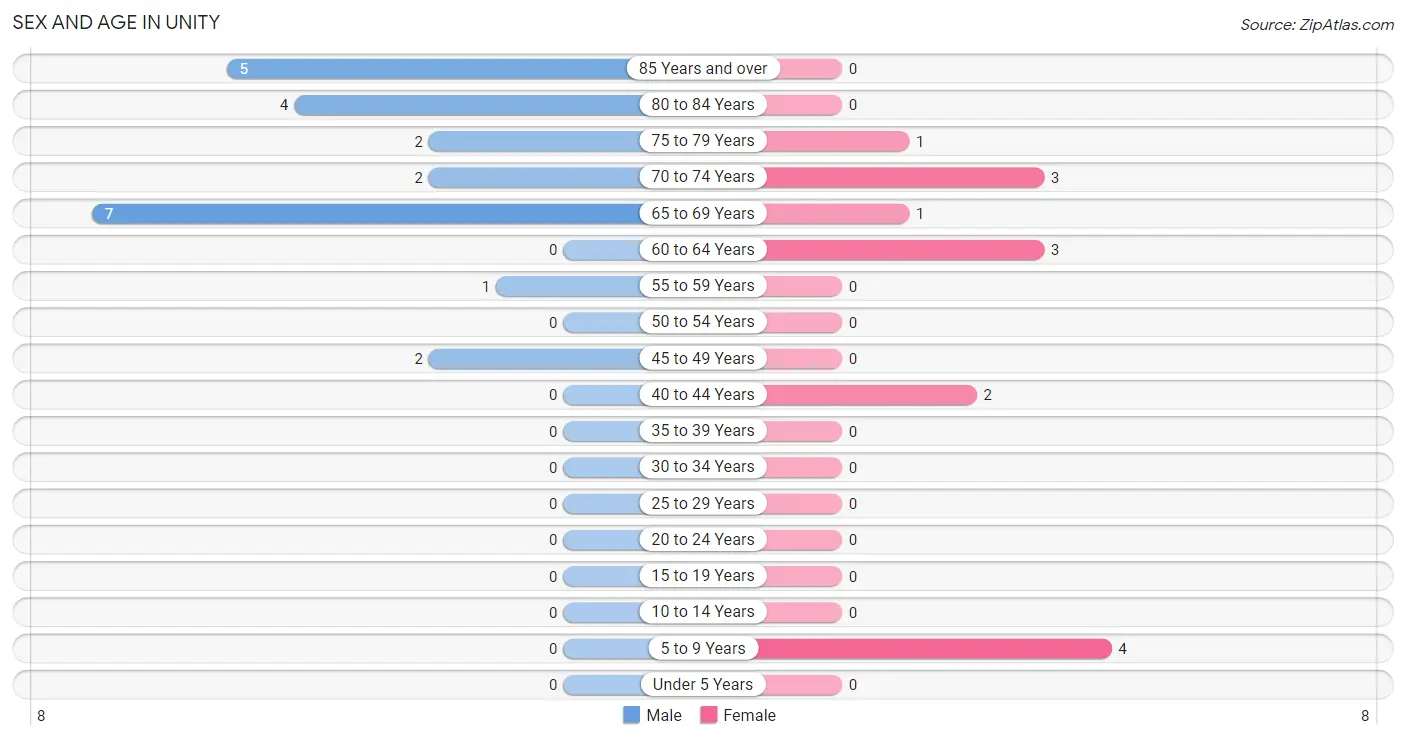
| Age Bracket | Male | Female |
| Under 5 Years | 0 (0.0%) | 0 (0.0%) |
| 5 to 9 Years | 0 (0.0%) | 4 (28.6%) |
| 10 to 14 Years | 0 (0.0%) | 0 (0.0%) |
| 15 to 19 Years | 0 (0.0%) | 0 (0.0%) |
| 20 to 24 Years | 0 (0.0%) | 0 (0.0%) |
| 25 to 29 Years | 0 (0.0%) | 0 (0.0%) |
| 30 to 34 Years | 0 (0.0%) | 0 (0.0%) |
| 35 to 39 Years | 0 (0.0%) | 0 (0.0%) |
| 40 to 44 Years | 0 (0.0%) | 2 (14.3%) |
| 45 to 49 Years | 2 (8.7%) | 0 (0.0%) |
| 50 to 54 Years | 0 (0.0%) | 0 (0.0%) |
| 55 to 59 Years | 1 (4.3%) | 0 (0.0%) |
| 60 to 64 Years | 0 (0.0%) | 3 (21.4%) |
| 65 to 69 Years | 7 (30.4%) | 1 (7.1%) |
| 70 to 74 Years | 2 (8.7%) | 3 (21.4%) |
| 75 to 79 Years | 2 (8.7%) | 1 (7.1%) |
| 80 to 84 Years | 4 (17.4%) | 0 (0.0%) |
| 85 Years and over | 5 (21.7%) | 0 (0.0%) |
| Total | 23 (100.0%) | 14 (100.0%) |
Families and Households in Unity
Median Family Size in Unity
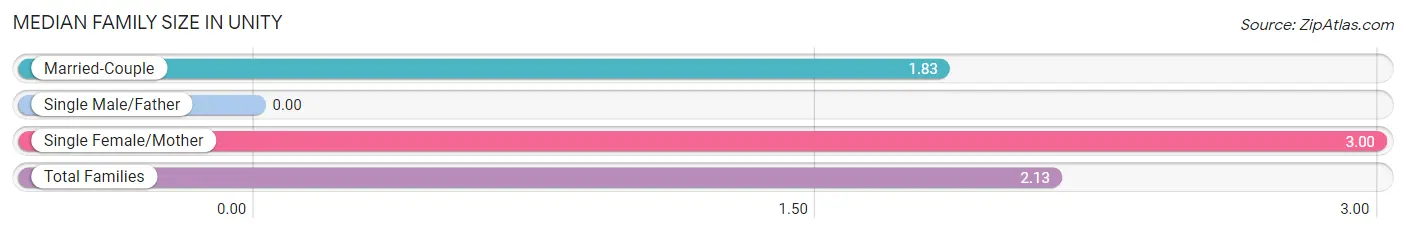
| Family Type | # Families | Family Size |
| Married-Couple | 6 (75.0%) | 1.83 |
| Single Male/Father | 0 (0.0%) | - |
| Single Female/Mother | 2 (25.0%) | 3.00 |
| Total Families | 8 (100.0%) | 2.13 |
Median Household Size in Unity
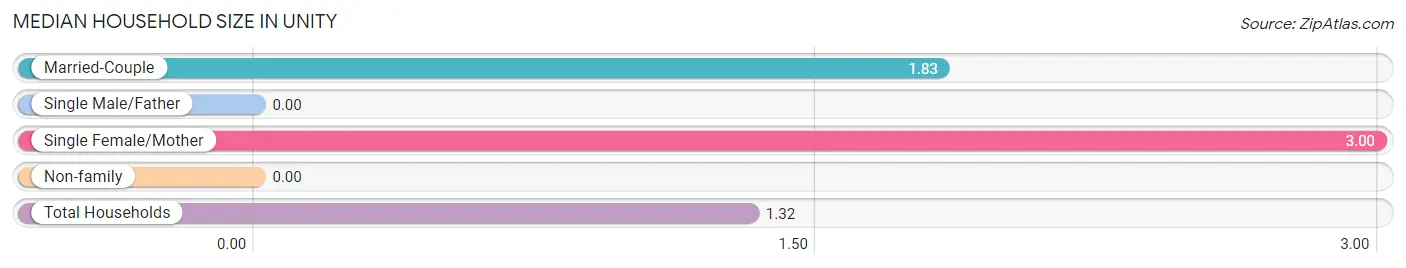
| Household Type | # Households | Household Size |
| Married-Couple | 6 (21.4%) | 1.83 |
| Single Male/Father | 0 (0.0%) | - |
| Single Female/Mother | 2 (7.1%) | 3.00 |
| Non-family | 20 (71.4%) | - |
| Total Households | 28 (100.0%) | 1.32 |
Household Size by Marriage Status in Unity
Out of a total of 28 households in Unity, 8 (28.6%) are family households, while 20 (71.4%) are nonfamily households. The most numerous type of family households are 2-person households, comprising 6, and the most common type of nonfamily households are 1-person households, comprising 20.
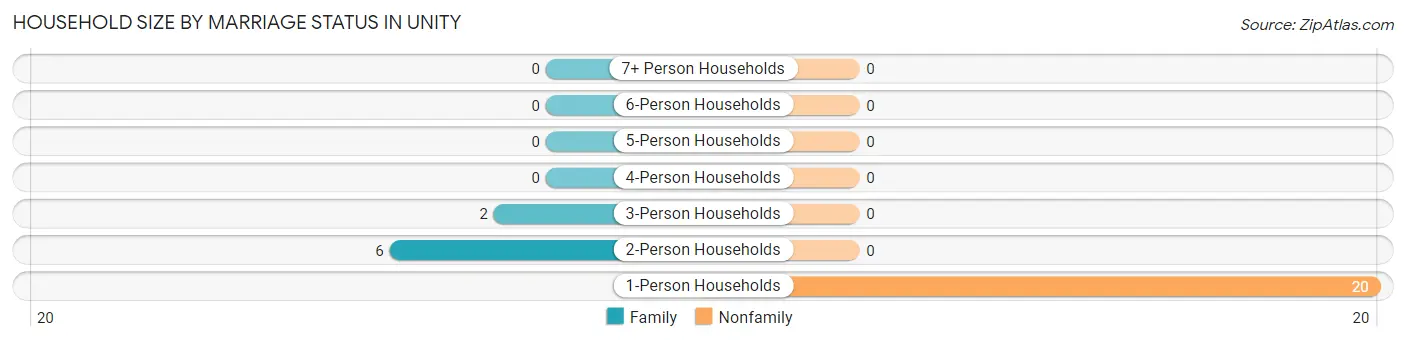
| Household Size | Family Households | Nonfamily Households |
| 1-Person Households | - | 20 (71.4%) |
| 2-Person Households | 6 (21.4%) | 0 (0.0%) |
| 3-Person Households | 2 (7.1%) | 0 (0.0%) |
| 4-Person Households | 0 (0.0%) | 0 (0.0%) |
| 5-Person Households | 0 (0.0%) | 0 (0.0%) |
| 6-Person Households | 0 (0.0%) | 0 (0.0%) |
| 7+ Person Households | 0 (0.0%) | 0 (0.0%) |
| Total | 8 (28.6%) | 20 (71.4%) |
Female Fertility in Unity
Fertility by Age in Unity
| Age Bracket | Women with Births | Births / 1,000 Women |
| 15 to 19 years | 0 (0.0%) | 0.0 |
| 20 to 34 years | 0 (0.0%) | 0.0 |
| 35 to 50 years | 0 (0.0%) | 0.0 |
| Total | 0 (0.0%) | 0.0 |
Fertility by Age by Marriage Status in Unity
| Age Bracket | Married | Unmarried |
| 15 to 19 years | 0 (0.0%) | 0 (0.0%) |
| 20 to 34 years | 0 (0.0%) | 0 (0.0%) |
| 35 to 50 years | 0 (0.0%) | 0 (0.0%) |
| Total | 0 (0.0%) | 0 (0.0%) |
Fertility by Education in Unity
| Educational Attainment | Women with Births | Births / 1,000 Women |
| Less than High School | 0 (0.0%) | 0.0 |
| High School Diploma | 0 (0.0%) | 0.0 |
| College or Associate's Degree | 0 (0.0%) | 0.0 |
| Bachelor's Degree | 0 (0.0%) | 0.0 |
| Graduate Degree | 0 (0.0%) | 0.0 |
| Total | 0 (0.0%) | 0.0 |
Fertility by Education by Marriage Status in Unity
| Educational Attainment | Married | Unmarried |
| Less than High School | 0 (0.0%) | 0 (0.0%) |
| High School Diploma | 0 (0.0%) | 0 (0.0%) |
| College or Associate's Degree | 0 (0.0%) | 0 (0.0%) |
| Bachelor's Degree | 0 (0.0%) | 0 (0.0%) |
| Graduate Degree | 0 (0.0%) | 0 (0.0%) |
| Total | 0 (0.0%) | 0 (0.0%) |
Employment Characteristics in Unity
Employment by Class of Employer in Unity
Among the 9 employed individuals in Unity, local government employees (6 | 66.7%), and self-employed (not incorporated) (3 | 33.3%) make up the most common classes of employment.
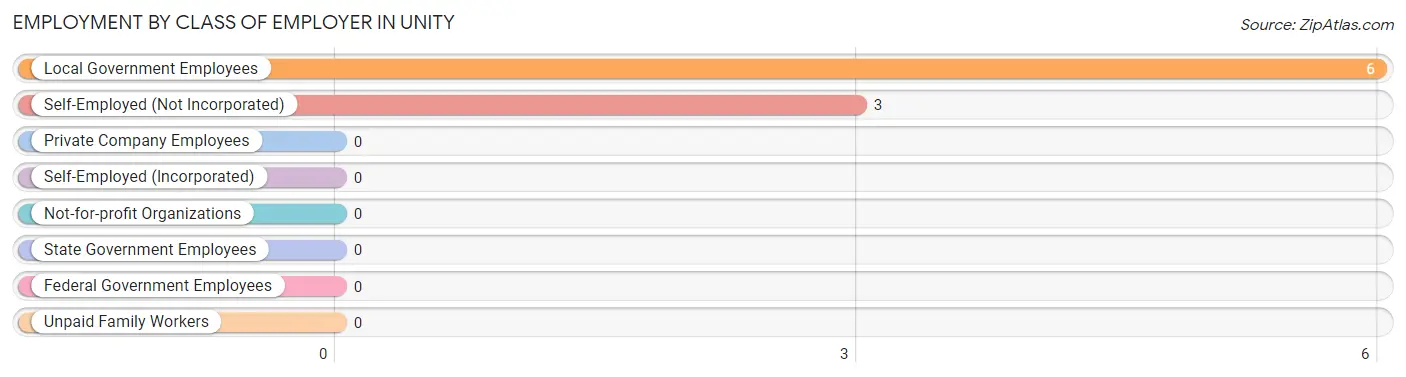
| Employer Class | # Employees | % Employees |
| Private Company Employees | 0 | 0.0% |
| Self-Employed (Incorporated) | 0 | 0.0% |
| Self-Employed (Not Incorporated) | 3 | 33.3% |
| Not-for-profit Organizations | 0 | 0.0% |
| Local Government Employees | 6 | 66.7% |
| State Government Employees | 0 | 0.0% |
| Federal Government Employees | 0 | 0.0% |
| Unpaid Family Workers | 0 | 0.0% |
| Total | 9 | 100.0% |
Employment Status by Age in Unity
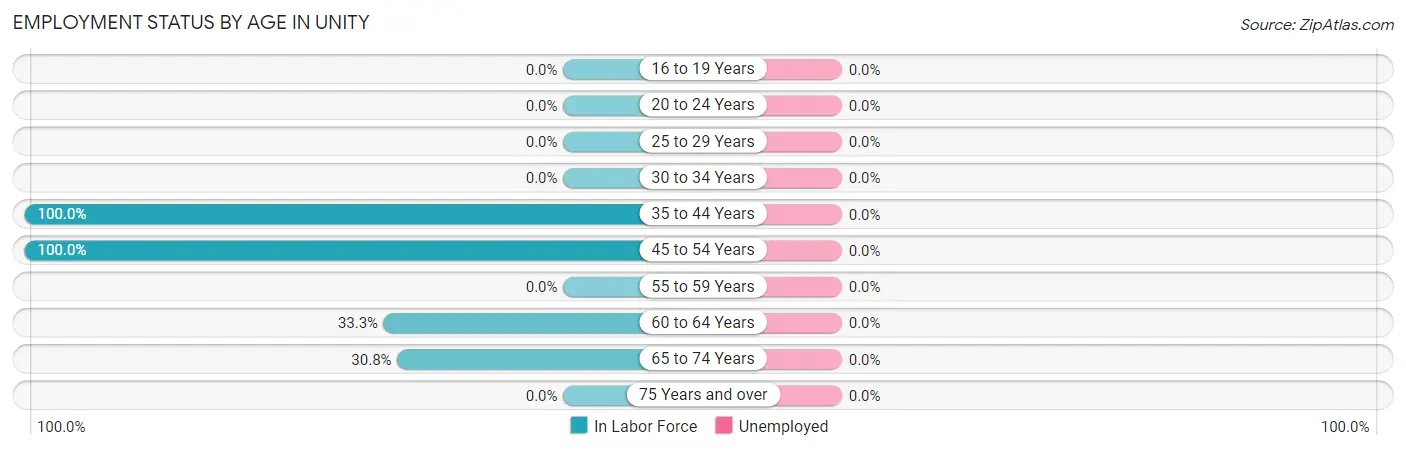
| Age Bracket | In Labor Force | Unemployed |
| 16 to 19 Years | 0 (0.0%) | 0 (0.0%) |
| 20 to 24 Years | 0 (0.0%) | 0 (0.0%) |
| 25 to 29 Years | 0 (0.0%) | 0 (0.0%) |
| 30 to 34 Years | 0 (0.0%) | 0 (0.0%) |
| 35 to 44 Years | 2 (100.0%) | 0 (0.0%) |
| 45 to 54 Years | 2 (100.0%) | 0 (0.0%) |
| 55 to 59 Years | 0 (0.0%) | 0 (0.0%) |
| 60 to 64 Years | 1 (33.3%) | 0 (0.0%) |
| 65 to 74 Years | 4 (30.8%) | 0 (0.0%) |
| 75 Years and over | 0 (0.0%) | 0 (0.0%) |
| Total | 9 (27.3%) | 0 (0.0%) |
Employment Status by Educational Attainment in Unity
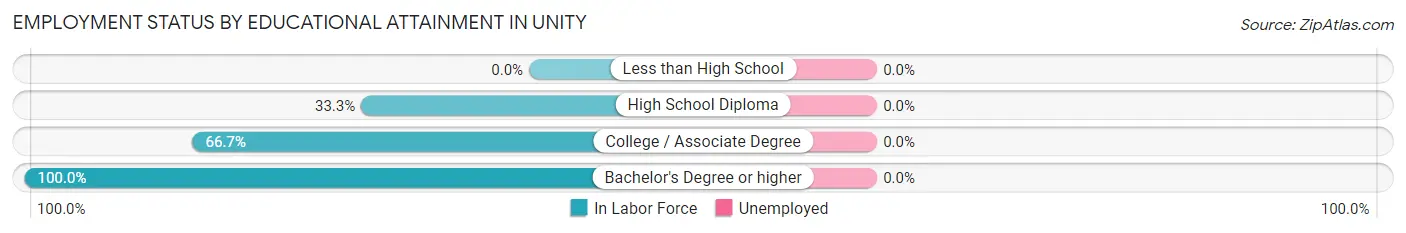
| Educational Attainment | In Labor Force | Unemployed |
| Less than High School | 0 (0.0%) | 0 (0.0%) |
| High School Diploma | 1 (33.3%) | 0 (0.0%) |
| College / Associate Degree | 2 (66.7%) | 0 (0.0%) |
| Bachelor's Degree or higher | 2 (100.0%) | 0 (0.0%) |
| Total | 5 (62.5%) | 0 (0.0%) |
Employment Occupations by Sex in Unity
Management, Business, Science and Arts Occupations
The most common Management, Business, Science and Arts occupations in Unity are Management (2 | 22.2%), Community & Social Service (2 | 22.2%), and Education Instruction & Library (2 | 22.2%).
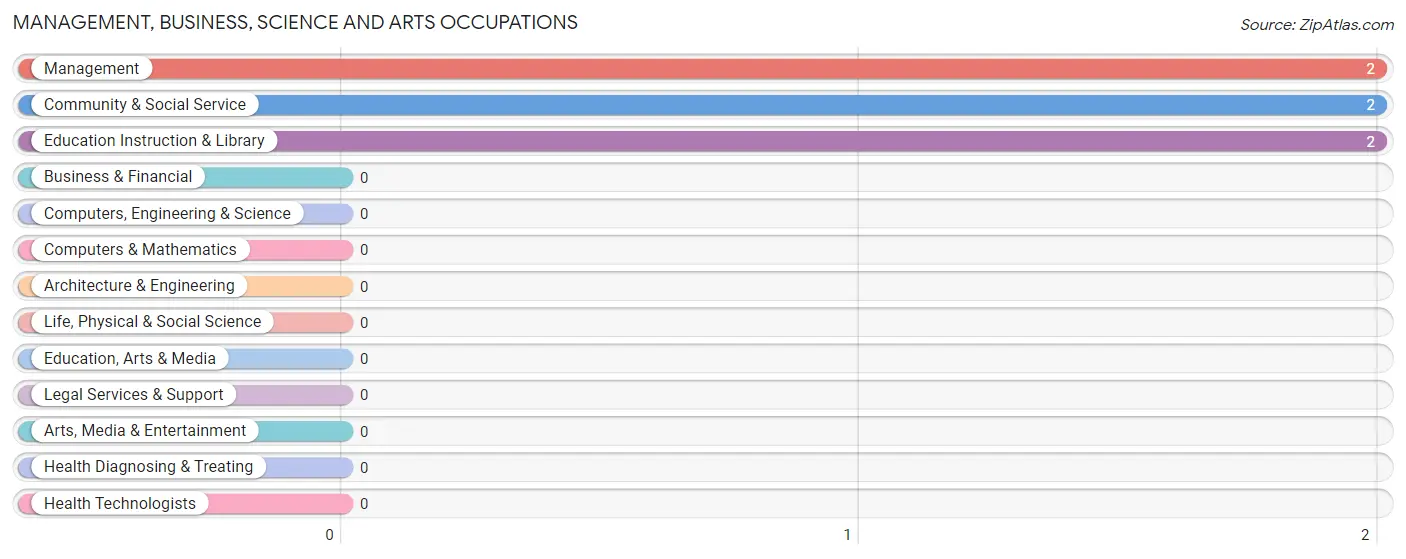
Management, Business, Science and Arts Occupations by Sex
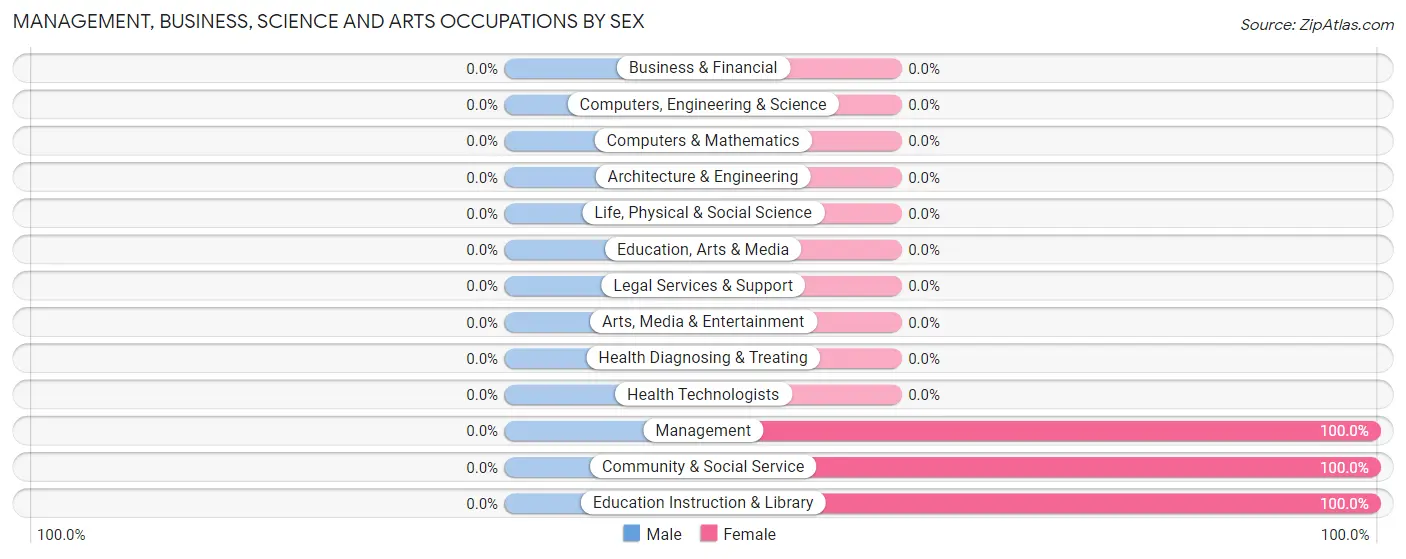
| Occupation | Male | Female |
| Management | 0 (0.0%) | 2 (100.0%) |
| Business & Financial | 0 (0.0%) | 0 (0.0%) |
| Computers, Engineering & Science | 0 (0.0%) | 0 (0.0%) |
| Computers & Mathematics | 0 (0.0%) | 0 (0.0%) |
| Architecture & Engineering | 0 (0.0%) | 0 (0.0%) |
| Life, Physical & Social Science | 0 (0.0%) | 0 (0.0%) |
| Community & Social Service | 0 (0.0%) | 2 (100.0%) |
| Education, Arts & Media | 0 (0.0%) | 0 (0.0%) |
| Legal Services & Support | 0 (0.0%) | 0 (0.0%) |
| Education Instruction & Library | 0 (0.0%) | 2 (100.0%) |
| Arts, Media & Entertainment | 0 (0.0%) | 0 (0.0%) |
| Health Diagnosing & Treating | 0 (0.0%) | 0 (0.0%) |
| Health Technologists | 0 (0.0%) | 0 (0.0%) |
| Total (Category) | 0 (0.0%) | 4 (100.0%) |
| Total (Overall) | 5 (55.6%) | 4 (44.4%) |
Services Occupations
The most common Services occupations in Unity are , and Cleaning & Maintenance (2 | 22.2%).
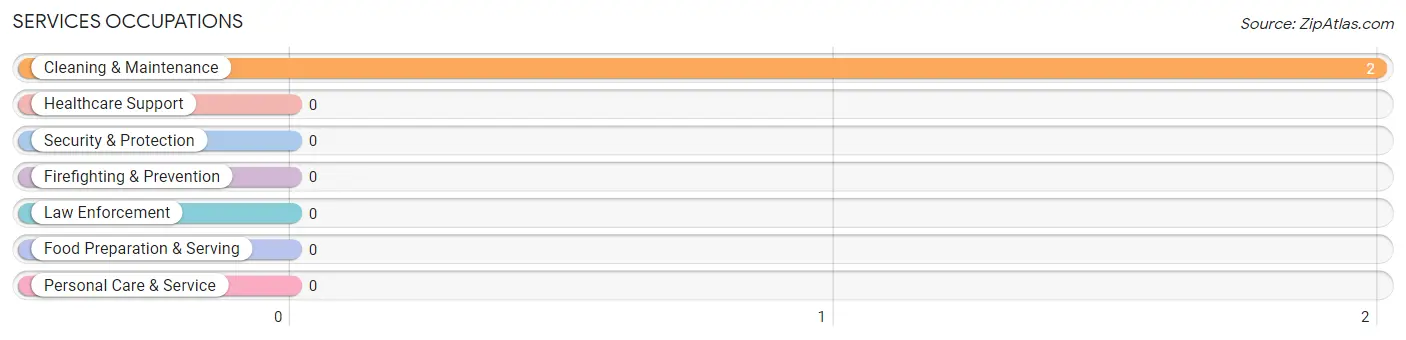
Services Occupations by Sex
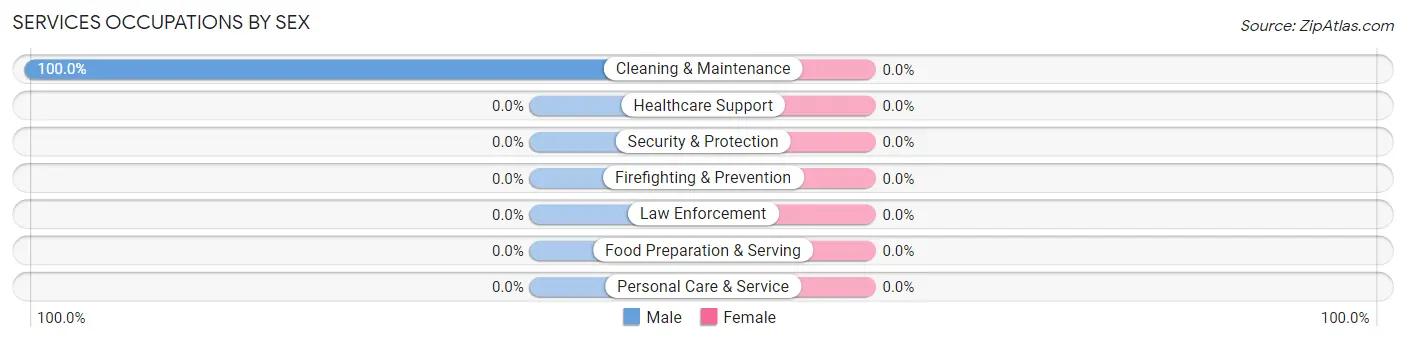
| Occupation | Male | Female |
| Healthcare Support | 0 (0.0%) | 0 (0.0%) |
| Security & Protection | 0 (0.0%) | 0 (0.0%) |
| Firefighting & Prevention | 0 (0.0%) | 0 (0.0%) |
| Law Enforcement | 0 (0.0%) | 0 (0.0%) |
| Food Preparation & Serving | 0 (0.0%) | 0 (0.0%) |
| Cleaning & Maintenance | 2 (100.0%) | 0 (0.0%) |
| Personal Care & Service | 0 (0.0%) | 0 (0.0%) |
| Total (Category) | 2 (100.0%) | 0 (0.0%) |
| Total (Overall) | 5 (55.6%) | 4 (44.4%) |
Sales and Office Occupations
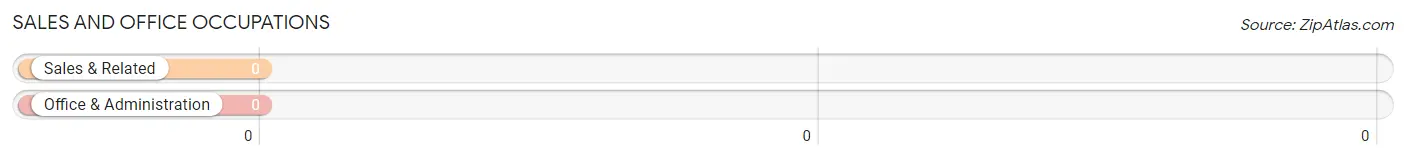
Sales and Office Occupations by Sex
| Occupation | Male | Female |
| Sales & Related | 0 (0.0%) | 0 (0.0%) |
| Office & Administration | 0 (0.0%) | 0 (0.0%) |
| Total (Category) | 0 (0.0%) | 0 (0.0%) |
| Total (Overall) | 5 (55.6%) | 4 (44.4%) |
Natural Resources, Construction and Maintenance Occupations
Natural Resources, Construction and Maintenance Occupations by Sex
| Occupation | Male | Female |
| Farming, Fishing & Forestry | 0 (0.0%) | 0 (0.0%) |
| Construction & Extraction | 0 (0.0%) | 0 (0.0%) |
| Installation, Maintenance & Repair | 0 (0.0%) | 0 (0.0%) |
| Total (Category) | 0 (0.0%) | 0 (0.0%) |
| Total (Overall) | 5 (55.6%) | 4 (44.4%) |
Production, Transportation and Moving Occupations
The most common Production, Transportation and Moving occupations in Unity are , and Transportation (3 | 33.3%).
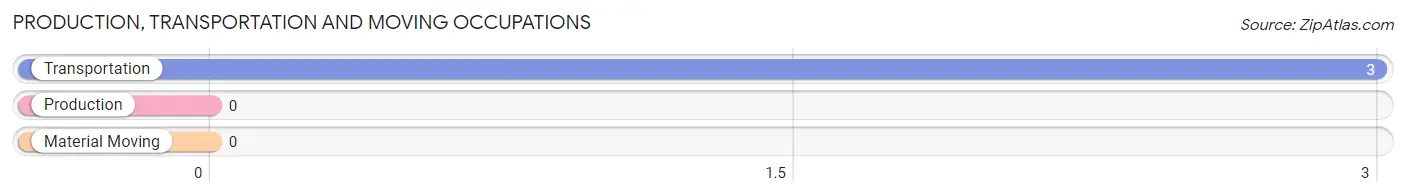
Production, Transportation and Moving Occupations by Sex
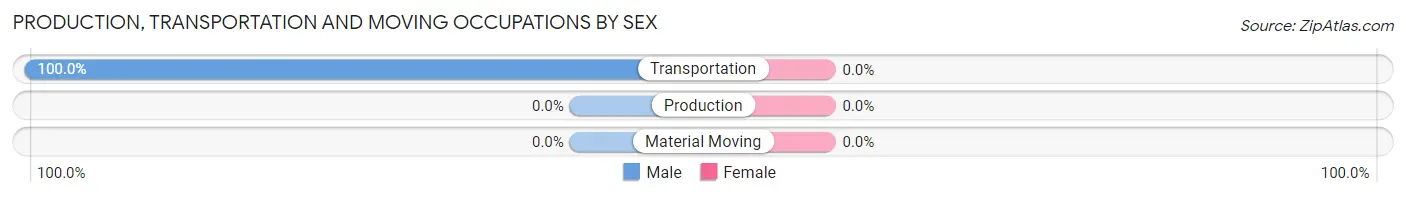
| Occupation | Male | Female |
| Production | 0 (0.0%) | 0 (0.0%) |
| Transportation | 3 (100.0%) | 0 (0.0%) |
| Material Moving | 0 (0.0%) | 0 (0.0%) |
| Total (Category) | 3 (100.0%) | 0 (0.0%) |
| Total (Overall) | 5 (55.6%) | 4 (44.4%) |
Employment Industries by Sex in Unity
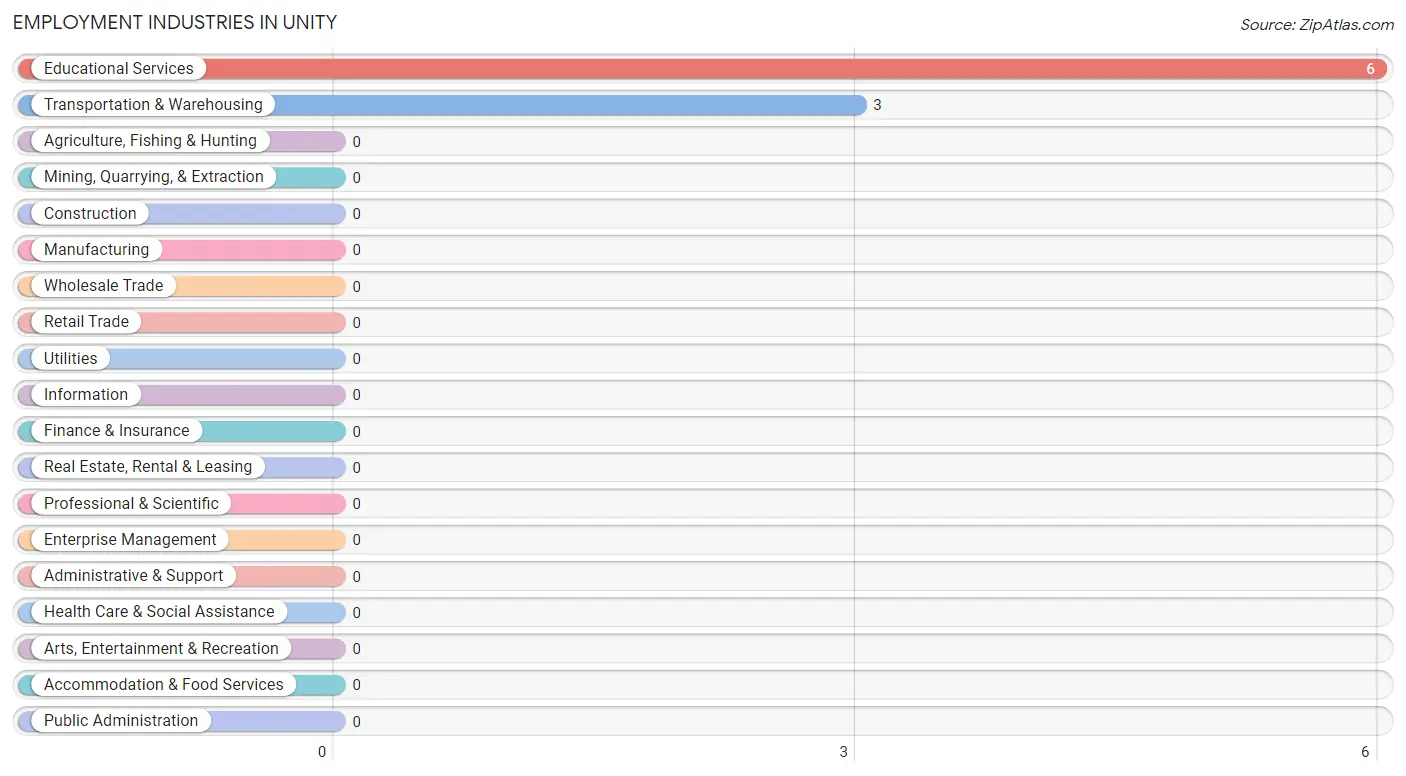
Employment Industries in Unity
The major employment industries in Unity include Educational Services (6 | 66.7%), and Transportation & Warehousing (3 | 33.3%).
Employment Industries by Sex in Unity
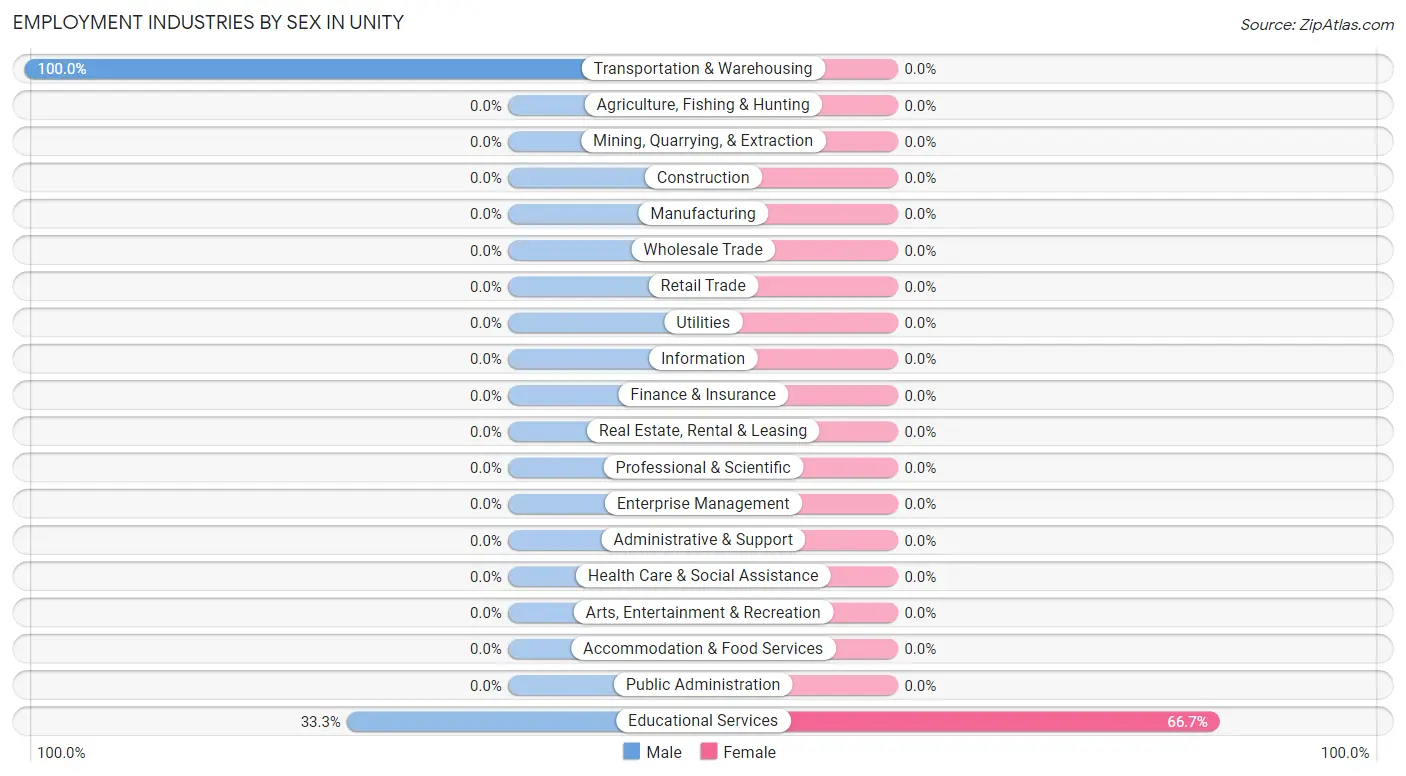
| Industry | Male | Female |
| Agriculture, Fishing & Hunting | 0 (0.0%) | 0 (0.0%) |
| Mining, Quarrying, & Extraction | 0 (0.0%) | 0 (0.0%) |
| Construction | 0 (0.0%) | 0 (0.0%) |
| Manufacturing | 0 (0.0%) | 0 (0.0%) |
| Wholesale Trade | 0 (0.0%) | 0 (0.0%) |
| Retail Trade | 0 (0.0%) | 0 (0.0%) |
| Transportation & Warehousing | 3 (100.0%) | 0 (0.0%) |
| Utilities | 0 (0.0%) | 0 (0.0%) |
| Information | 0 (0.0%) | 0 (0.0%) |
| Finance & Insurance | 0 (0.0%) | 0 (0.0%) |
| Real Estate, Rental & Leasing | 0 (0.0%) | 0 (0.0%) |
| Professional & Scientific | 0 (0.0%) | 0 (0.0%) |
| Enterprise Management | 0 (0.0%) | 0 (0.0%) |
| Administrative & Support | 0 (0.0%) | 0 (0.0%) |
| Educational Services | 2 (33.3%) | 4 (66.7%) |
| Health Care & Social Assistance | 0 (0.0%) | 0 (0.0%) |
| Arts, Entertainment & Recreation | 0 (0.0%) | 0 (0.0%) |
| Accommodation & Food Services | 0 (0.0%) | 0 (0.0%) |
| Public Administration | 0 (0.0%) | 0 (0.0%) |
| Total | 5 (55.6%) | 4 (44.4%) |
Education in Unity
School Enrollment in Unity
The most common levels of schooling among the 4 students in Unity are nursery / preschool (2 | 50.0%), and elementary school (2 | 50.0%).
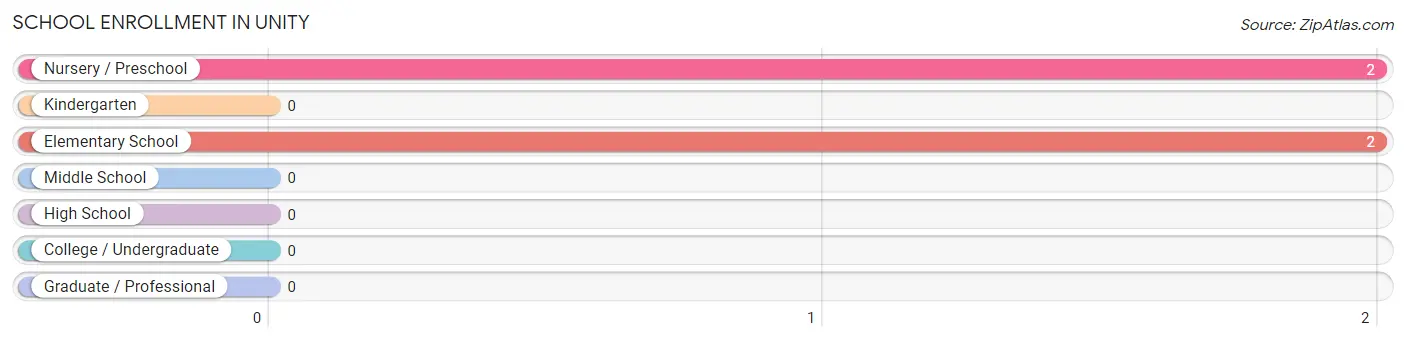
| School Level | # Students | % Students |
| Nursery / Preschool | 2 | 50.0% |
| Kindergarten | 0 | 0.0% |
| Elementary School | 2 | 50.0% |
| Middle School | 0 | 0.0% |
| High School | 0 | 0.0% |
| College / Undergraduate | 0 | 0.0% |
| Graduate / Professional | 0 | 0.0% |
| Total | 4 | 100.0% |
School Enrollment by Age by Funding Source in Unity
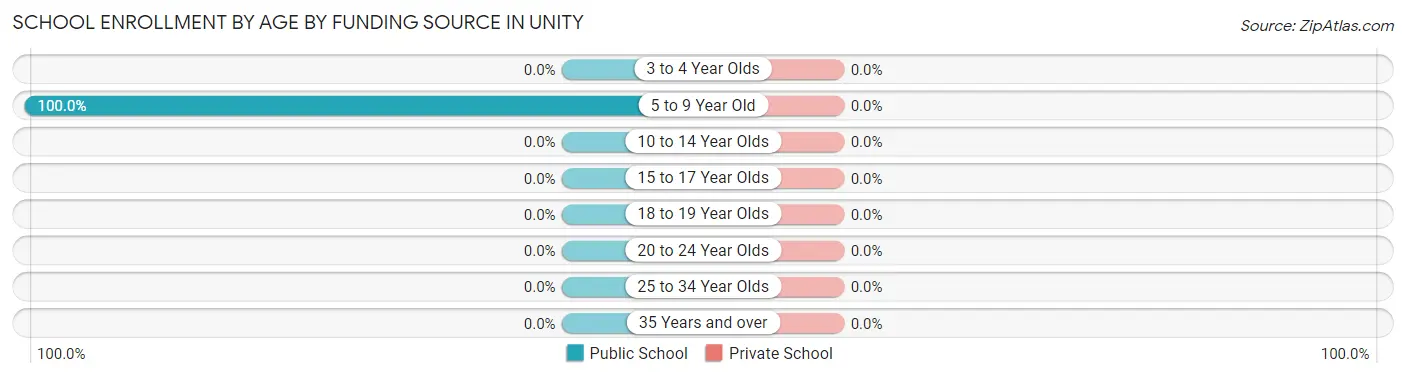
| Age Bracket | Public School | Private School |
| 3 to 4 Year Olds | 0 (0.0%) | 0 (0.0%) |
| 5 to 9 Year Old | 4 (100.0%) | 0 (0.0%) |
| 10 to 14 Year Olds | 0 (0.0%) | 0 (0.0%) |
| 15 to 17 Year Olds | 0 (0.0%) | 0 (0.0%) |
| 18 to 19 Year Olds | 0 (0.0%) | 0 (0.0%) |
| 20 to 24 Year Olds | 0 (0.0%) | 0 (0.0%) |
| 25 to 34 Year Olds | 0 (0.0%) | 0 (0.0%) |
| 35 Years and over | 0 (0.0%) | 0 (0.0%) |
| Total | 4 (100.0%) | 0 (0.0%) |
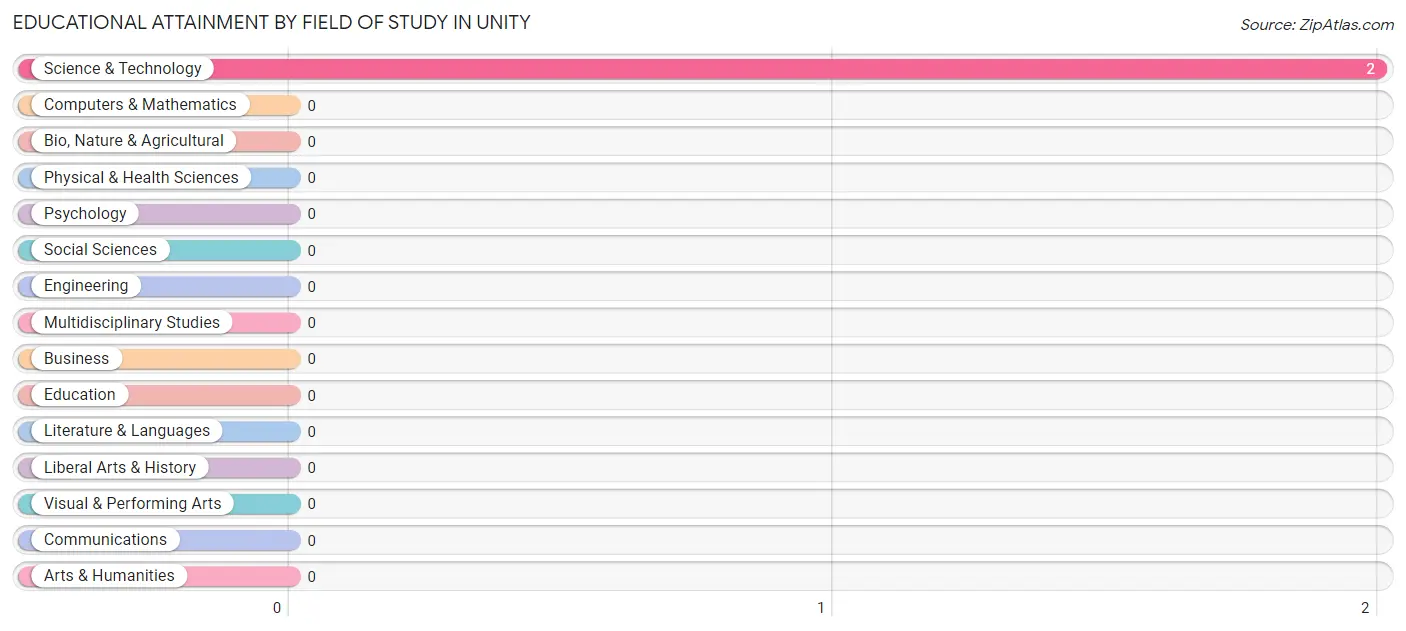
Educational Attainment by Field of Study in Unity
, and science & technology (2 | 100.0%) are the most common fields of study among 2 individuals in Unity who have obtained a bachelor's degree or higher.
| Field of Study | # Graduates | % Graduates |
| Computers & Mathematics | 0 | 0.0% |
| Bio, Nature & Agricultural | 0 | 0.0% |
| Physical & Health Sciences | 0 | 0.0% |
| Psychology | 0 | 0.0% |
| Social Sciences | 0 | 0.0% |
| Engineering | 0 | 0.0% |
| Multidisciplinary Studies | 0 | 0.0% |
| Science & Technology | 2 | 100.0% |
| Business | 0 | 0.0% |
| Education | 0 | 0.0% |
| Literature & Languages | 0 | 0.0% |
| Liberal Arts & History | 0 | 0.0% |
| Visual & Performing Arts | 0 | 0.0% |
| Communications | 0 | 0.0% |
| Arts & Humanities | 0 | 0.0% |
| Total | 2 | 100.0% |
Transportation & Commute in Unity
Vehicle Availability by Sex in Unity
The most prevalent vehicle ownership categories in Unity are males with 1 vehicle (2, accounting for 40.0%) and females with 1 vehicle (2, making up 50.0%).
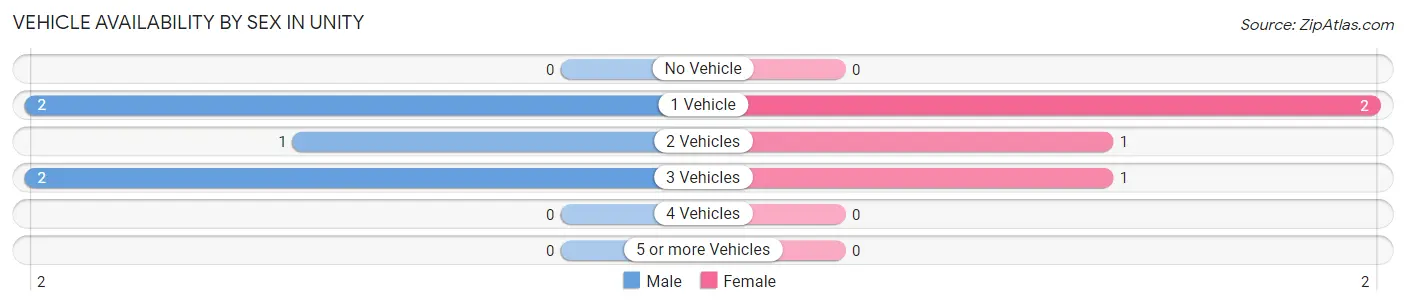
| Vehicles Available | Male | Female |
| No Vehicle | 0 (0.0%) | 0 (0.0%) |
| 1 Vehicle | 2 (40.0%) | 2 (50.0%) |
| 2 Vehicles | 1 (20.0%) | 1 (25.0%) |
| 3 Vehicles | 2 (40.0%) | 1 (25.0%) |
| 4 Vehicles | 0 (0.0%) | 0 (0.0%) |
| 5 or more Vehicles | 0 (0.0%) | 0 (0.0%) |
| Total | 5 (100.0%) | 4 (100.0%) |
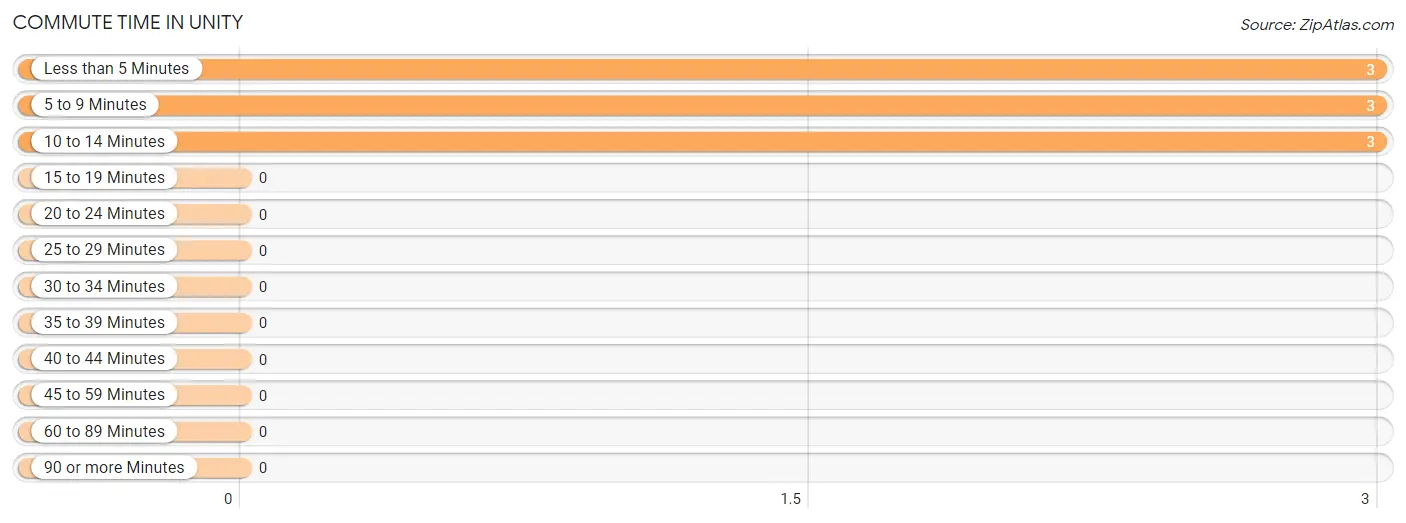
Commute Time in Unity
The most frequently occuring commute durations in Unity are less than 5 minutes (3 commuters, 33.3%), 5 to 9 minutes (3 commuters, 33.3%), and 10 to 14 minutes (3 commuters, 33.3%).
| Commute Time | # Commuters | % Commuters |
| Less than 5 Minutes | 3 | 33.3% |
| 5 to 9 Minutes | 3 | 33.3% |
| 10 to 14 Minutes | 3 | 33.3% |
| 15 to 19 Minutes | 0 | 0.0% |
| 20 to 24 Minutes | 0 | 0.0% |
| 25 to 29 Minutes | 0 | 0.0% |
| 30 to 34 Minutes | 0 | 0.0% |
| 35 to 39 Minutes | 0 | 0.0% |
| 40 to 44 Minutes | 0 | 0.0% |
| 45 to 59 Minutes | 0 | 0.0% |
| 60 to 89 Minutes | 0 | 0.0% |
| 90 or more Minutes | 0 | 0.0% |
Commute Time by Sex in Unity
The most common commute times in Unity are less than 5 minutes (3 commuters, 60.0%) for males and 5 to 9 minutes (3 commuters, 75.0%) for females.
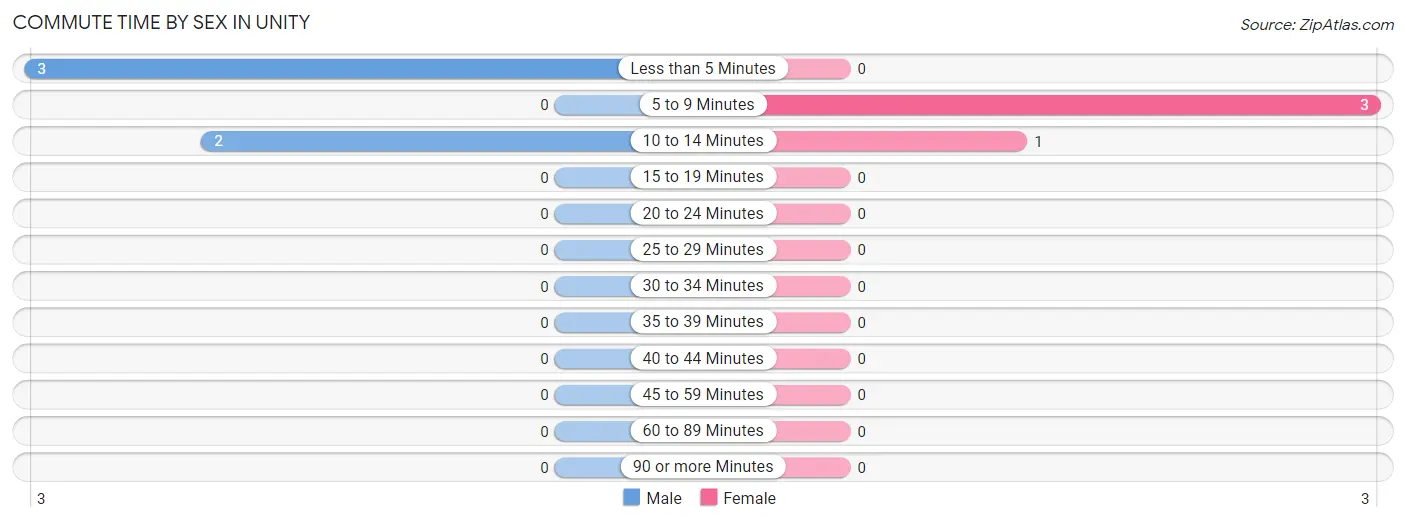
| Commute Time | Male | Female |
| Less than 5 Minutes | 3 (60.0%) | 0 (0.0%) |
| 5 to 9 Minutes | 0 (0.0%) | 3 (75.0%) |
| 10 to 14 Minutes | 2 (40.0%) | 1 (25.0%) |
| 15 to 19 Minutes | 0 (0.0%) | 0 (0.0%) |
| 20 to 24 Minutes | 0 (0.0%) | 0 (0.0%) |
| 25 to 29 Minutes | 0 (0.0%) | 0 (0.0%) |
| 30 to 34 Minutes | 0 (0.0%) | 0 (0.0%) |
| 35 to 39 Minutes | 0 (0.0%) | 0 (0.0%) |
| 40 to 44 Minutes | 0 (0.0%) | 0 (0.0%) |
| 45 to 59 Minutes | 0 (0.0%) | 0 (0.0%) |
| 60 to 89 Minutes | 0 (0.0%) | 0 (0.0%) |
| 90 or more Minutes | 0 (0.0%) | 0 (0.0%) |
Time of Departure to Work by Sex in Unity
The most frequent times of departure to work in Unity are 5:30 AM to 5:59 AM (3, 60.0%) for males and 7:30 AM to 7:59 AM (3, 75.0%) for females.
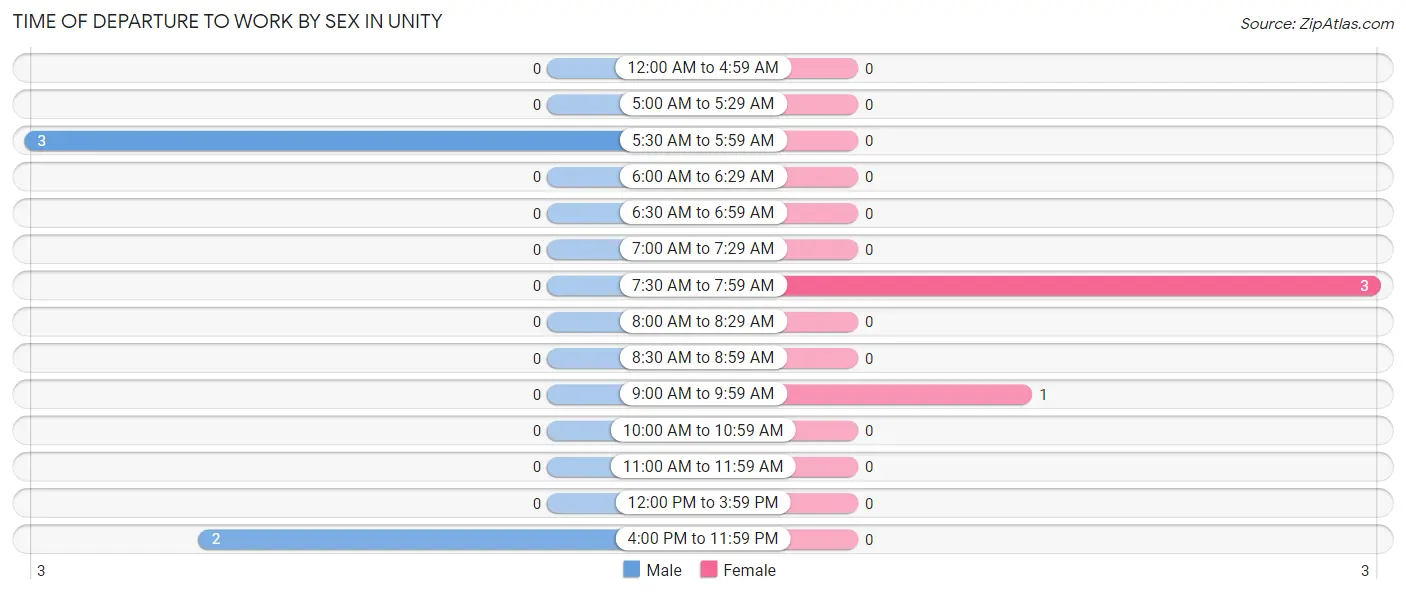
| Time of Departure | Male | Female |
| 12:00 AM to 4:59 AM | 0 (0.0%) | 0 (0.0%) |
| 5:00 AM to 5:29 AM | 0 (0.0%) | 0 (0.0%) |
| 5:30 AM to 5:59 AM | 3 (60.0%) | 0 (0.0%) |
| 6:00 AM to 6:29 AM | 0 (0.0%) | 0 (0.0%) |
| 6:30 AM to 6:59 AM | 0 (0.0%) | 0 (0.0%) |
| 7:00 AM to 7:29 AM | 0 (0.0%) | 0 (0.0%) |
| 7:30 AM to 7:59 AM | 0 (0.0%) | 3 (75.0%) |
| 8:00 AM to 8:29 AM | 0 (0.0%) | 0 (0.0%) |
| 8:30 AM to 8:59 AM | 0 (0.0%) | 0 (0.0%) |
| 9:00 AM to 9:59 AM | 0 (0.0%) | 1 (25.0%) |
| 10:00 AM to 10:59 AM | 0 (0.0%) | 0 (0.0%) |
| 11:00 AM to 11:59 AM | 0 (0.0%) | 0 (0.0%) |
| 12:00 PM to 3:59 PM | 0 (0.0%) | 0 (0.0%) |
| 4:00 PM to 11:59 PM | 2 (40.0%) | 0 (0.0%) |
| Total | 5 (100.0%) | 4 (100.0%) |
Housing Occupancy in Unity
Occupancy by Ownership in Unity
Of the total 28 dwellings in Unity, owner-occupied units account for 18 (64.3%), while renter-occupied units make up 10 (35.7%).
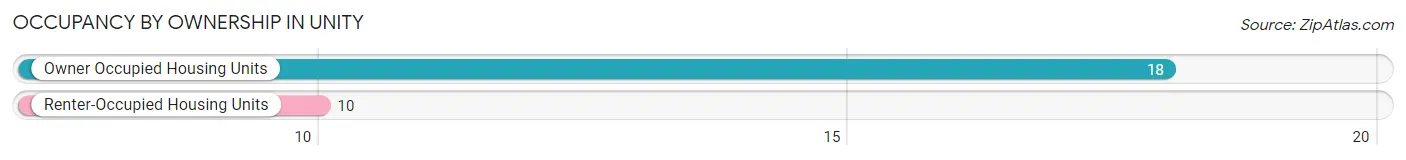
| Occupancy | # Housing Units | % Housing Units |
| Owner Occupied Housing Units | 18 | 64.3% |
| Renter-Occupied Housing Units | 10 | 35.7% |
| Total Occupied Housing Units | 28 | 100.0% |
Occupancy by Household Size in Unity
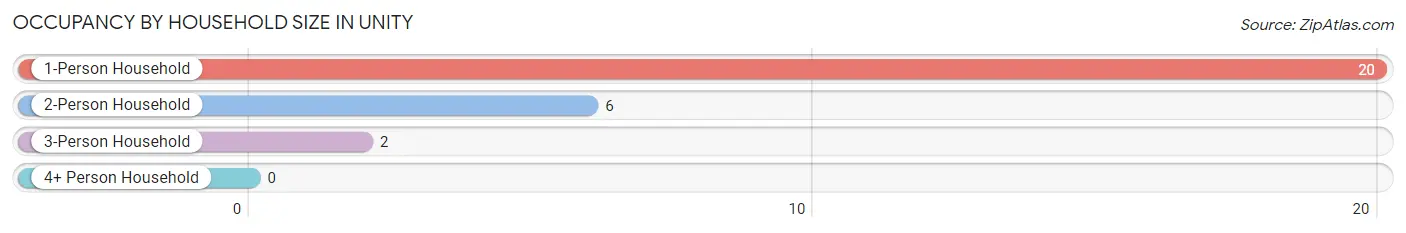
| Household Size | # Housing Units | % Housing Units |
| 1-Person Household | 20 | 71.4% |
| 2-Person Household | 6 | 21.4% |
| 3-Person Household | 2 | 7.1% |
| 4+ Person Household | 0 | 0.0% |
| Total Housing Units | 28 | 100.0% |
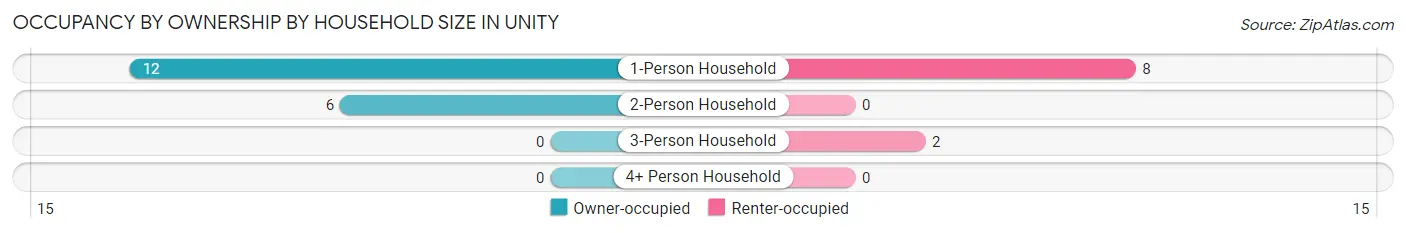
Occupancy by Ownership by Household Size in Unity
| Household Size | Owner-occupied | Renter-occupied |
| 1-Person Household | 12 (60.0%) | 8 (40.0%) |
| 2-Person Household | 6 (100.0%) | 0 (0.0%) |
| 3-Person Household | 0 (0.0%) | 2 (100.0%) |
| 4+ Person Household | 0 (0.0%) | 0 (0.0%) |
| Total Housing Units | 18 (64.3%) | 10 (35.7%) |
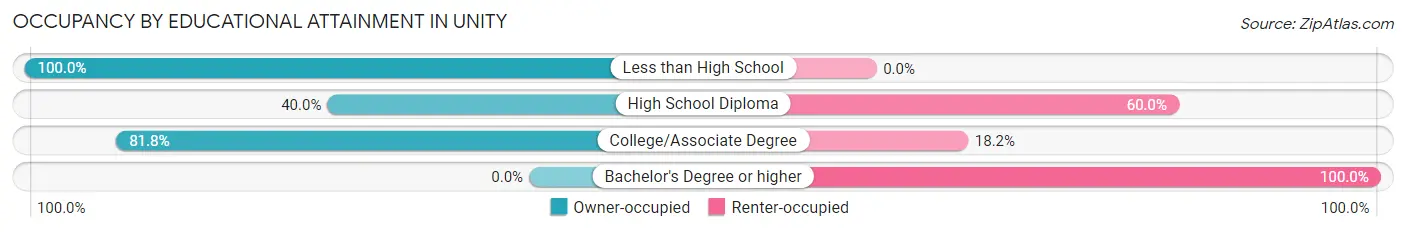
Occupancy by Educational Attainment in Unity
| Household Size | Owner-occupied | Renter-occupied |
| Less than High School | 5 (100.0%) | 0 (0.0%) |
| High School Diploma | 4 (40.0%) | 6 (60.0%) |
| College/Associate Degree | 9 (81.8%) | 2 (18.2%) |
| Bachelor's Degree or higher | 0 (0.0%) | 2 (100.0%) |
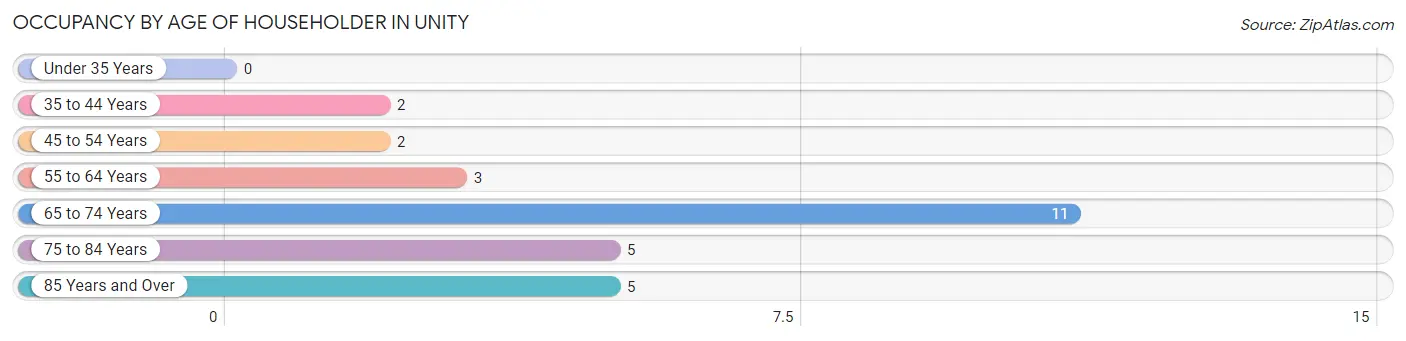
Occupancy by Age of Householder in Unity
| Age Bracket | # Households | % Households |
| Under 35 Years | 0 | 0.0% |
| 35 to 44 Years | 2 | 7.1% |
| 45 to 54 Years | 2 | 7.1% |
| 55 to 64 Years | 3 | 10.7% |
| 65 to 74 Years | 11 | 39.3% |
| 75 to 84 Years | 5 | 17.9% |
| 85 Years and Over | 5 | 17.9% |
| Total | 28 | 100.0% |
Housing Finances in Unity
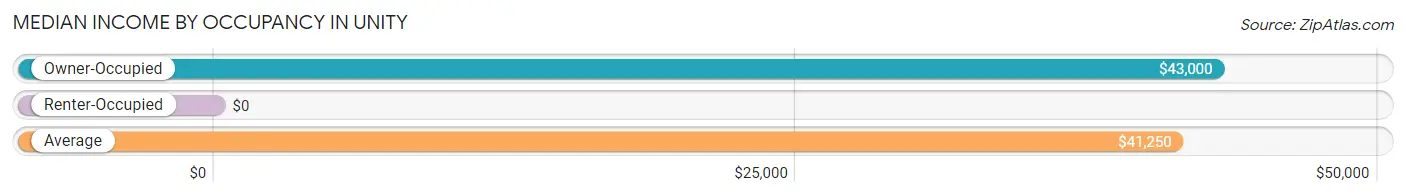
Median Income by Occupancy in Unity
| Occupancy Type | # Households | Median Income |
| Owner-Occupied | 18 (64.3%) | $43,000 |
| Renter-Occupied | 10 (35.7%) | $0 |
| Average | 28 (100.0%) | $41,250 |
Occupancy by Householder Income Bracket in Unity
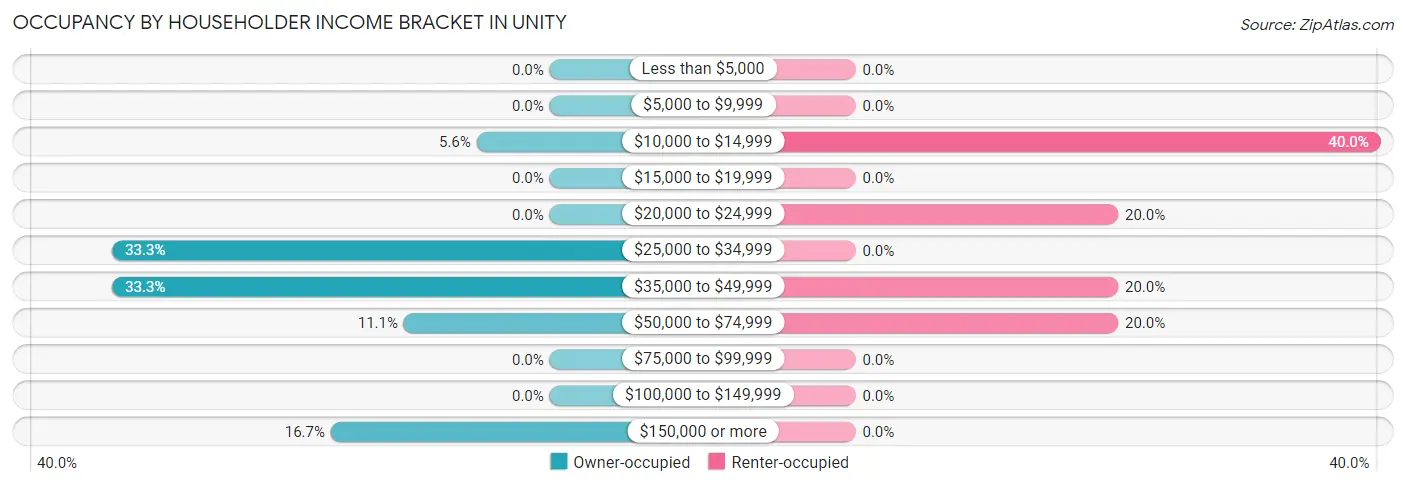
| Income Bracket | Owner-occupied | Renter-occupied |
| Less than $5,000 | 0 (0.0%) | 0 (0.0%) |
| $5,000 to $9,999 | 0 (0.0%) | 0 (0.0%) |
| $10,000 to $14,999 | 1 (5.6%) | 4 (40.0%) |
| $15,000 to $19,999 | 0 (0.0%) | 0 (0.0%) |
| $20,000 to $24,999 | 0 (0.0%) | 2 (20.0%) |
| $25,000 to $34,999 | 6 (33.3%) | 0 (0.0%) |
| $35,000 to $49,999 | 6 (33.3%) | 2 (20.0%) |
| $50,000 to $74,999 | 2 (11.1%) | 2 (20.0%) |
| $75,000 to $99,999 | 0 (0.0%) | 0 (0.0%) |
| $100,000 to $149,999 | 0 (0.0%) | 0 (0.0%) |
| $150,000 or more | 3 (16.7%) | 0 (0.0%) |
| Total | 18 (100.0%) | 10 (100.0%) |
Monthly Housing Cost Tiers in Unity
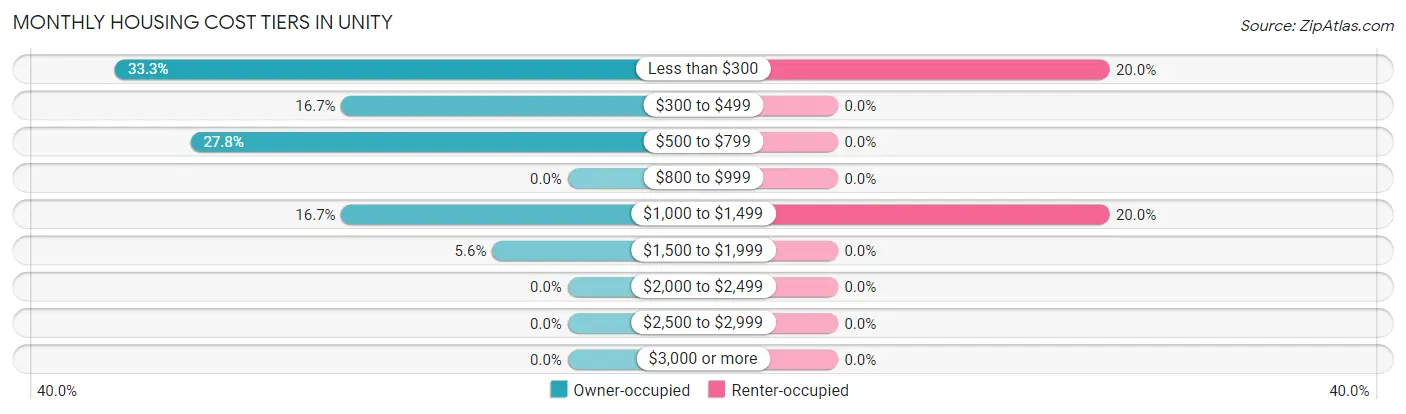
| Monthly Cost | Owner-occupied | Renter-occupied |
| Less than $300 | 6 (33.3%) | 2 (20.0%) |
| $300 to $499 | 3 (16.7%) | 0 (0.0%) |
| $500 to $799 | 5 (27.8%) | 0 (0.0%) |
| $800 to $999 | 0 (0.0%) | 0 (0.0%) |
| $1,000 to $1,499 | 3 (16.7%) | 2 (20.0%) |
| $1,500 to $1,999 | 1 (5.6%) | 0 (0.0%) |
| $2,000 to $2,499 | 0 (0.0%) | 0 (0.0%) |
| $2,500 to $2,999 | 0 (0.0%) | 0 (0.0%) |
| $3,000 or more | 0 (0.0%) | 0 (0.0%) |
| Total | 18 (100.0%) | 10 (100.0%) |
Physical Housing Characteristics in Unity
Housing Structures in Unity
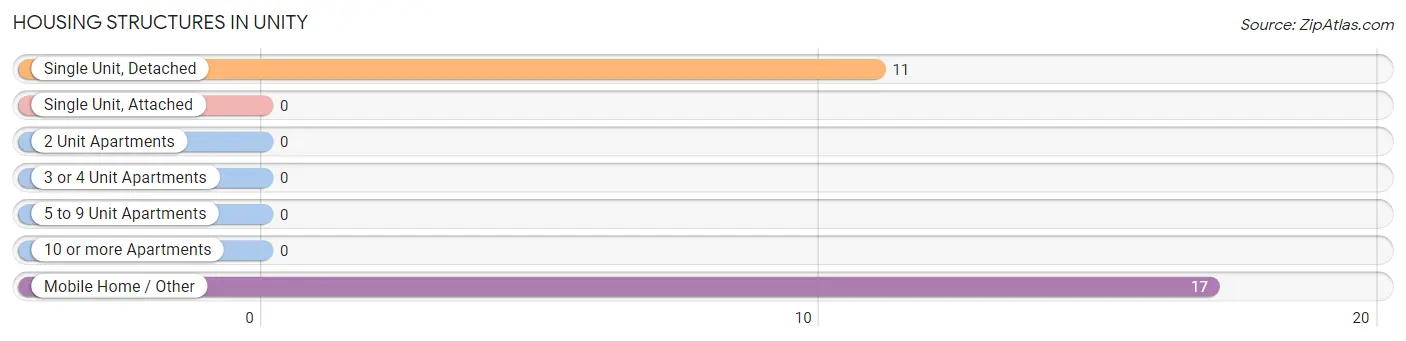
| Structure Type | # Housing Units | % Housing Units |
| Single Unit, Detached | 11 | 39.3% |
| Single Unit, Attached | 0 | 0.0% |
| 2 Unit Apartments | 0 | 0.0% |
| 3 or 4 Unit Apartments | 0 | 0.0% |
| 5 to 9 Unit Apartments | 0 | 0.0% |
| 10 or more Apartments | 0 | 0.0% |
| Mobile Home / Other | 17 | 60.7% |
| Total | 28 | 100.0% |
Housing Structures by Occupancy in Unity
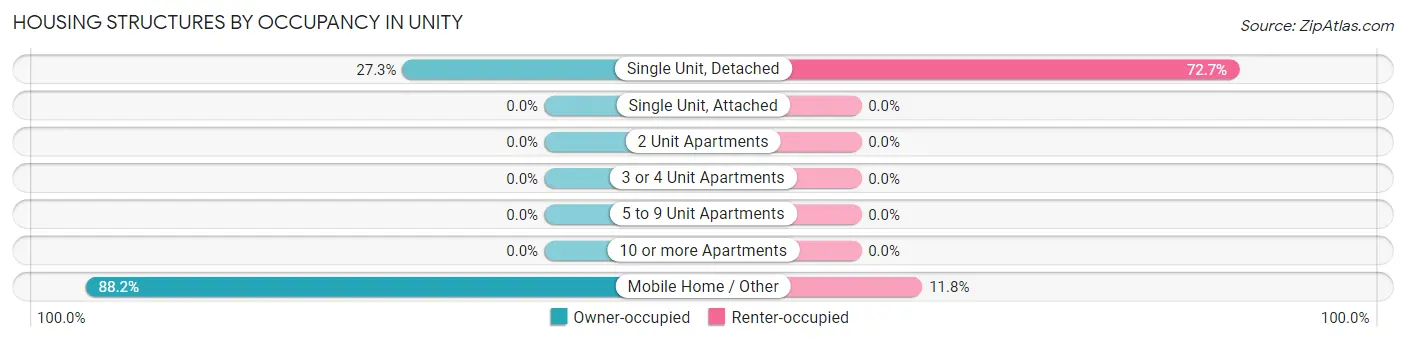
| Structure Type | Owner-occupied | Renter-occupied |
| Single Unit, Detached | 3 (27.3%) | 8 (72.7%) |
| Single Unit, Attached | 0 (0.0%) | 0 (0.0%) |
| 2 Unit Apartments | 0 (0.0%) | 0 (0.0%) |
| 3 or 4 Unit Apartments | 0 (0.0%) | 0 (0.0%) |
| 5 to 9 Unit Apartments | 0 (0.0%) | 0 (0.0%) |
| 10 or more Apartments | 0 (0.0%) | 0 (0.0%) |
| Mobile Home / Other | 15 (88.2%) | 2 (11.8%) |
| Total | 18 (64.3%) | 10 (35.7%) |
Housing Structures by Number of Rooms in Unity
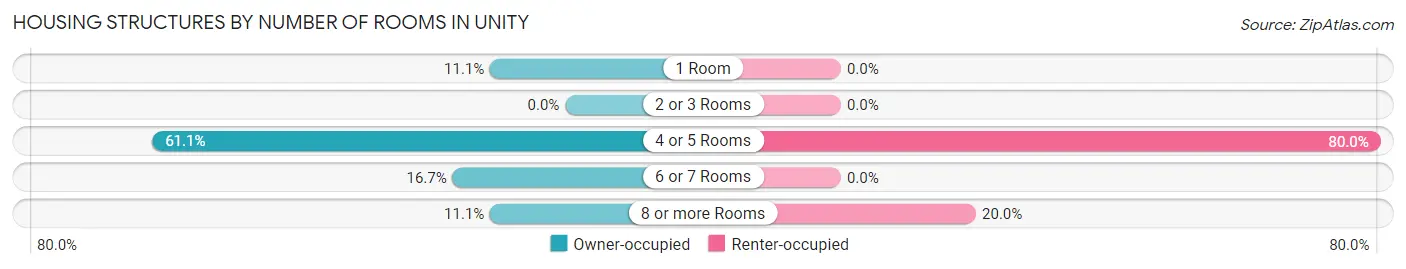
| Number of Rooms | Owner-occupied | Renter-occupied |
| 1 Room | 2 (11.1%) | 0 (0.0%) |
| 2 or 3 Rooms | 0 (0.0%) | 0 (0.0%) |
| 4 or 5 Rooms | 11 (61.1%) | 8 (80.0%) |
| 6 or 7 Rooms | 3 (16.7%) | 0 (0.0%) |
| 8 or more Rooms | 2 (11.1%) | 2 (20.0%) |
| Total | 18 (100.0%) | 10 (100.0%) |
Housing Structure by Heating Type in Unity
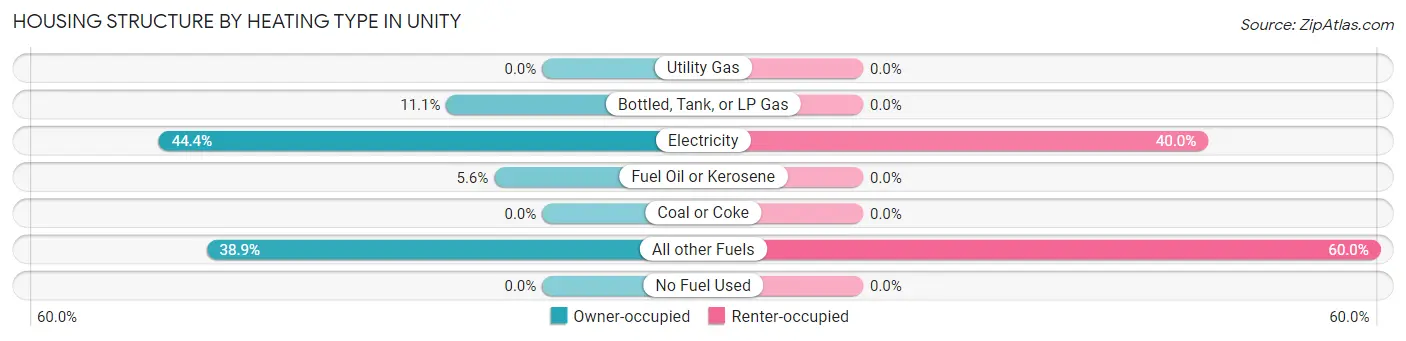
| Heating Type | Owner-occupied | Renter-occupied |
| Utility Gas | 0 (0.0%) | 0 (0.0%) |
| Bottled, Tank, or LP Gas | 2 (11.1%) | 0 (0.0%) |
| Electricity | 8 (44.4%) | 4 (40.0%) |
| Fuel Oil or Kerosene | 1 (5.6%) | 0 (0.0%) |
| Coal or Coke | 0 (0.0%) | 0 (0.0%) |
| All other Fuels | 7 (38.9%) | 6 (60.0%) |
| No Fuel Used | 0 (0.0%) | 0 (0.0%) |
| Total | 18 (100.0%) | 10 (100.0%) |
Household Vehicle Usage in Unity
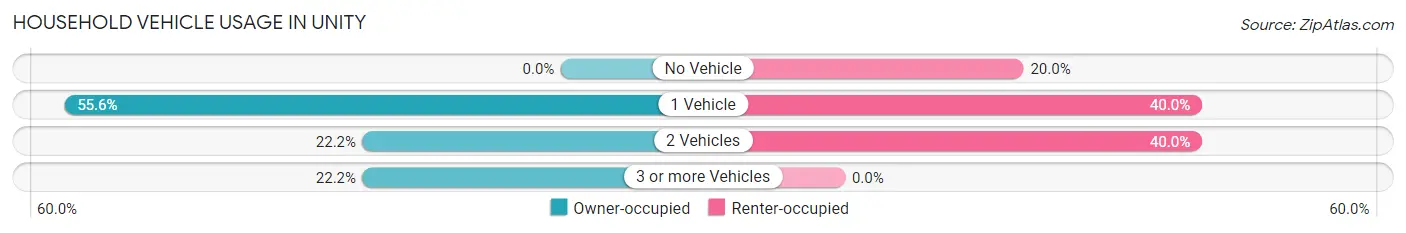
| Vehicles per Household | Owner-occupied | Renter-occupied |
| No Vehicle | 0 (0.0%) | 2 (20.0%) |
| 1 Vehicle | 10 (55.6%) | 4 (40.0%) |
| 2 Vehicles | 4 (22.2%) | 4 (40.0%) |
| 3 or more Vehicles | 4 (22.2%) | 0 (0.0%) |
| Total | 18 (100.0%) | 10 (100.0%) |
Real Estate & Mortgages in Unity
Real Estate and Mortgage Overview in Unity
| Characteristic | Without Mortgage | With Mortgage |
| Housing Units | 15 | 3 |
| Median Property Value | - | - |
| Median Household Income | $38,750 | $3 |
| Monthly Housing Costs | $425 | $0 |
| Real Estate Taxes | - | - |
Property Value by Mortgage Status in Unity
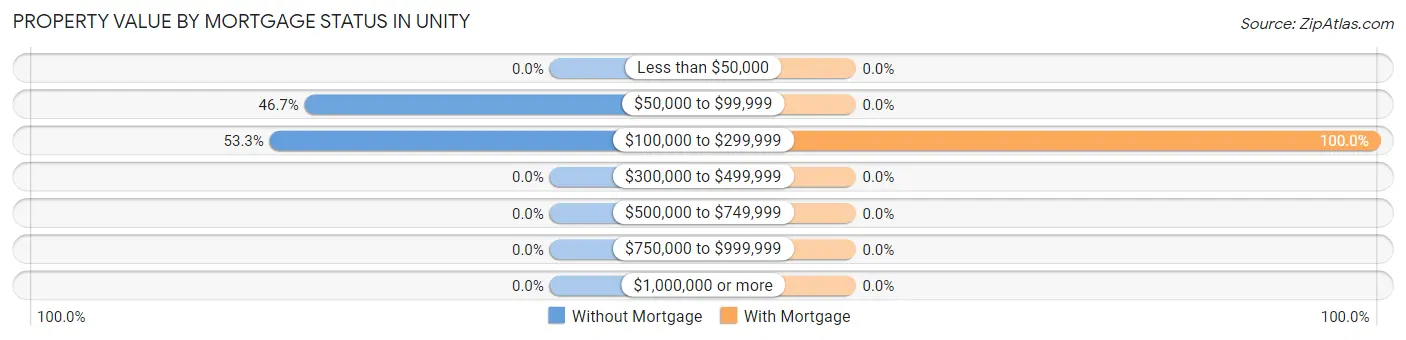
| Property Value | Without Mortgage | With Mortgage |
| Less than $50,000 | 0 (0.0%) | 0 (0.0%) |
| $50,000 to $99,999 | 7 (46.7%) | 0 (0.0%) |
| $100,000 to $299,999 | 8 (53.3%) | 3 (100.0%) |
| $300,000 to $499,999 | 0 (0.0%) | 0 (0.0%) |
| $500,000 to $749,999 | 0 (0.0%) | 0 (0.0%) |
| $750,000 to $999,999 | 0 (0.0%) | 0 (0.0%) |
| $1,000,000 or more | 0 (0.0%) | 0 (0.0%) |
| Total | 15 (100.0%) | 3 (100.0%) |
Household Income by Mortgage Status in Unity
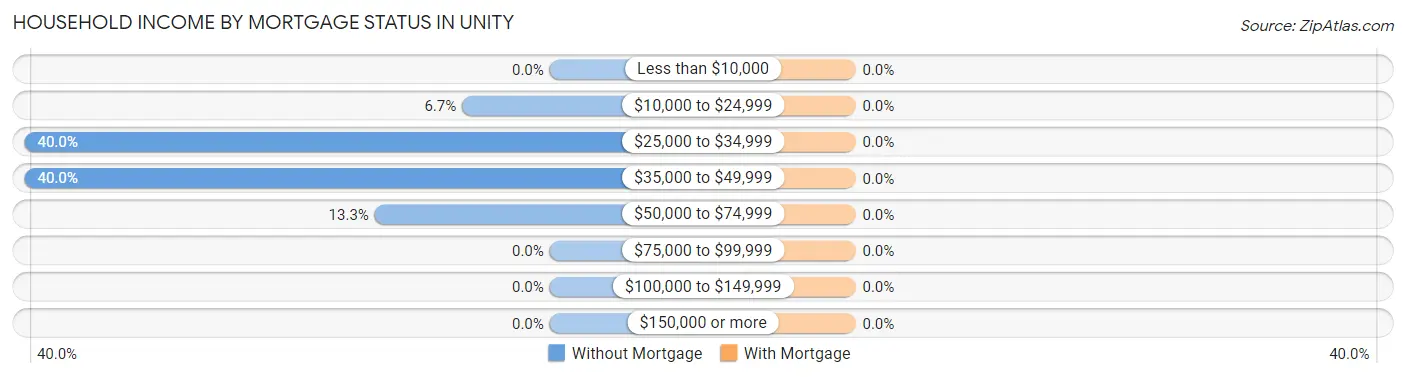
| Household Income | Without Mortgage | With Mortgage |
| Less than $10,000 | 0 (0.0%) | 0 (0.0%) |
| $10,000 to $24,999 | 1 (6.7%) | 0 (0.0%) |
| $25,000 to $34,999 | 6 (40.0%) | 0 (0.0%) |
| $35,000 to $49,999 | 6 (40.0%) | 0 (0.0%) |
| $50,000 to $74,999 | 2 (13.3%) | 0 (0.0%) |
| $75,000 to $99,999 | 0 (0.0%) | 0 (0.0%) |
| $100,000 to $149,999 | 0 (0.0%) | 0 (0.0%) |
| $150,000 or more | 0 (0.0%) | 0 (0.0%) |
| Total | 15 (100.0%) | 3 (100.0%) |
Property Value to Household Income Ratio in Unity
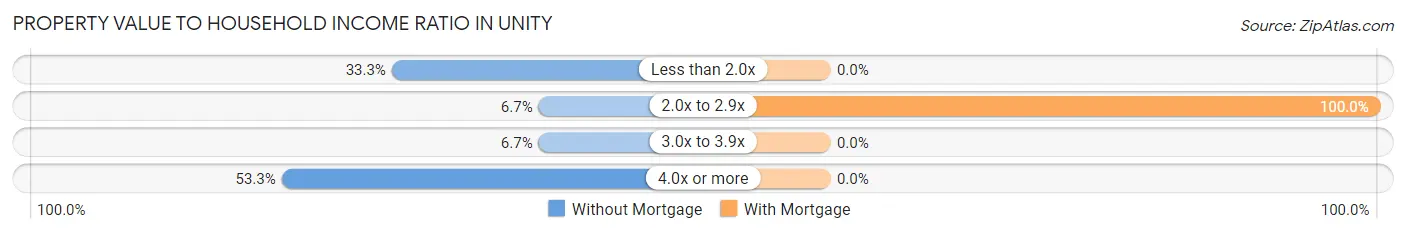
| Value-to-Income Ratio | Without Mortgage | With Mortgage |
| Less than 2.0x | 5 (33.3%) | 0 (0.0%) |
| 2.0x to 2.9x | 1 (6.7%) | 3 (100.0%) |
| 3.0x to 3.9x | 1 (6.7%) | 0 (0.0%) |
| 4.0x or more | 8 (53.3%) | 0 (0.0%) |
| Total | 15 (100.0%) | 3 (100.0%) |
Real Estate Taxes by Mortgage Status in Unity
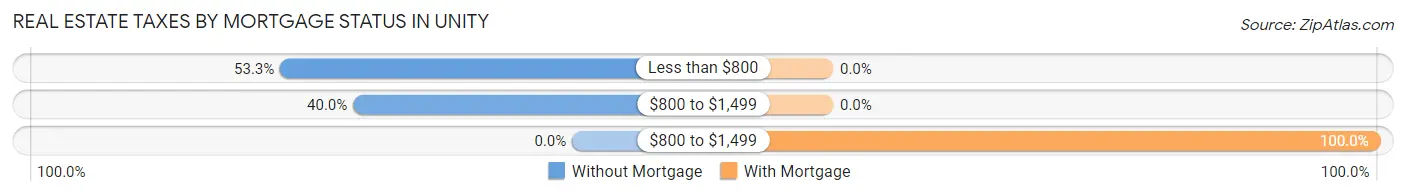
| Property Taxes | Without Mortgage | With Mortgage |
| Less than $800 | 8 (53.3%) | 0 (0.0%) |
| $800 to $1,499 | 6 (40.0%) | 0 (0.0%) |
| $800 to $1,499 | 0 (0.0%) | 3 (100.0%) |
| Total | 15 (100.0%) | 3 (100.0%) |
Health & Disability in Unity
Health Insurance Coverage by Age in Unity
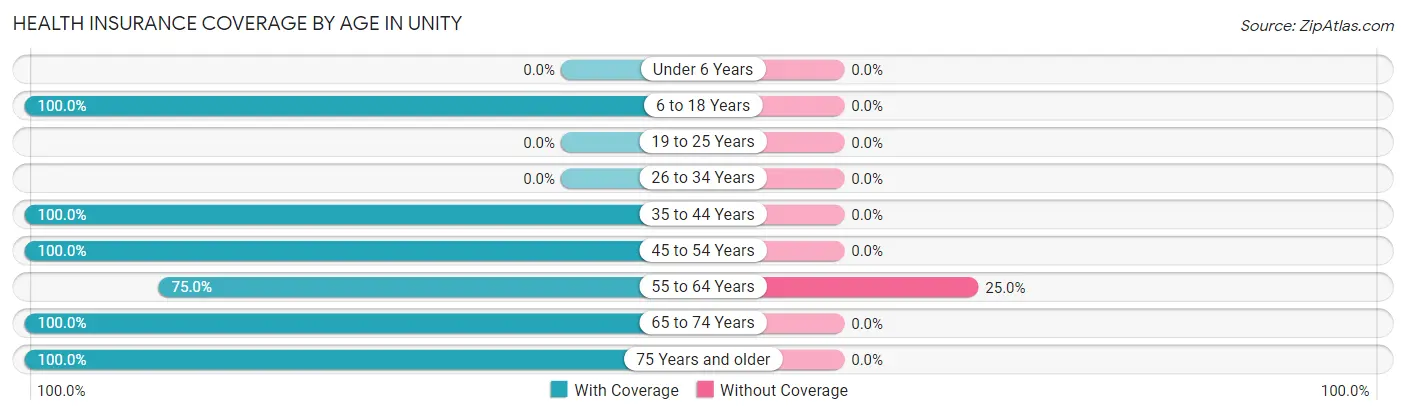
| Age Bracket | With Coverage | Without Coverage |
| Under 6 Years | 0 (0.0%) | 0 (0.0%) |
| 6 to 18 Years | 4 (100.0%) | 0 (0.0%) |
| 19 to 25 Years | 0 (0.0%) | 0 (0.0%) |
| 26 to 34 Years | 0 (0.0%) | 0 (0.0%) |
| 35 to 44 Years | 2 (100.0%) | 0 (0.0%) |
| 45 to 54 Years | 2 (100.0%) | 0 (0.0%) |
| 55 to 64 Years | 3 (75.0%) | 1 (25.0%) |
| 65 to 74 Years | 13 (100.0%) | 0 (0.0%) |
| 75 Years and older | 12 (100.0%) | 0 (0.0%) |
| Total | 36 (97.3%) | 1 (2.7%) |
Health Insurance Coverage by Citizenship Status in Unity
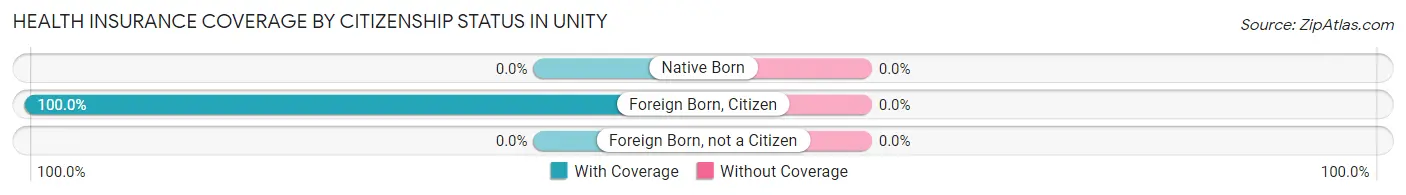
| Citizenship Status | With Coverage | Without Coverage |
| Native Born | 0 (0.0%) | 0 (0.0%) |
| Foreign Born, Citizen | 4 (100.0%) | 0 (0.0%) |
| Foreign Born, not a Citizen | 0 (0.0%) | 0 (0.0%) |
Health Insurance Coverage by Household Income in Unity
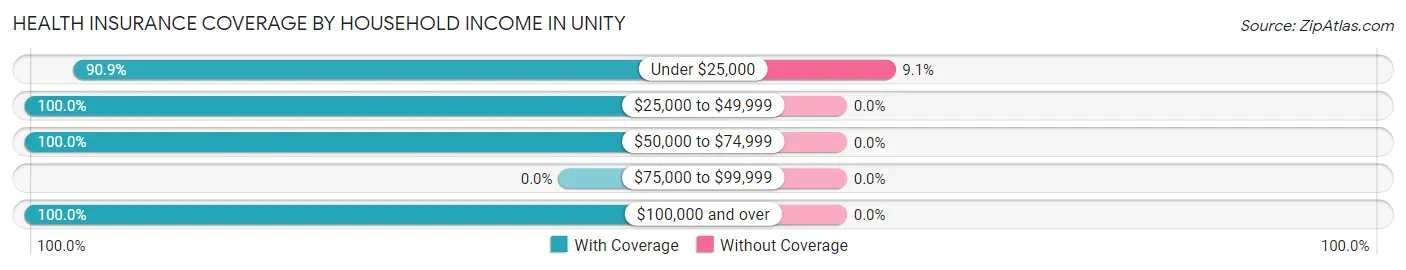
| Household Income | With Coverage | Without Coverage |
| Under $25,000 | 10 (90.9%) | 1 (9.1%) |
| $25,000 to $49,999 | 16 (100.0%) | 0 (0.0%) |
| $50,000 to $74,999 | 5 (100.0%) | 0 (0.0%) |
| $75,000 to $99,999 | 0 (0.0%) | 0 (0.0%) |
| $100,000 and over | 5 (100.0%) | 0 (0.0%) |
Public vs Private Health Insurance Coverage by Age in Unity
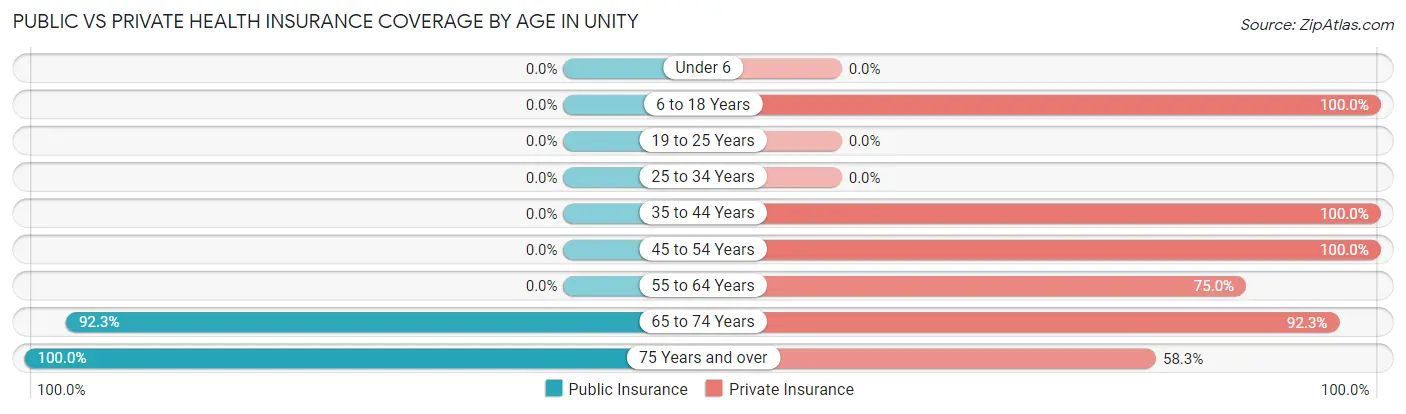
| Age Bracket | Public Insurance | Private Insurance |
| Under 6 | 0 (0.0%) | 0 (0.0%) |
| 6 to 18 Years | 0 (0.0%) | 4 (100.0%) |
| 19 to 25 Years | 0 (0.0%) | 0 (0.0%) |
| 25 to 34 Years | 0 (0.0%) | 0 (0.0%) |
| 35 to 44 Years | 0 (0.0%) | 2 (100.0%) |
| 45 to 54 Years | 0 (0.0%) | 2 (100.0%) |
| 55 to 64 Years | 0 (0.0%) | 3 (75.0%) |
| 65 to 74 Years | 12 (92.3%) | 12 (92.3%) |
| 75 Years and over | 12 (100.0%) | 7 (58.3%) |
| Total | 24 (64.9%) | 30 (81.1%) |
Disability Status by Sex by Age in Unity
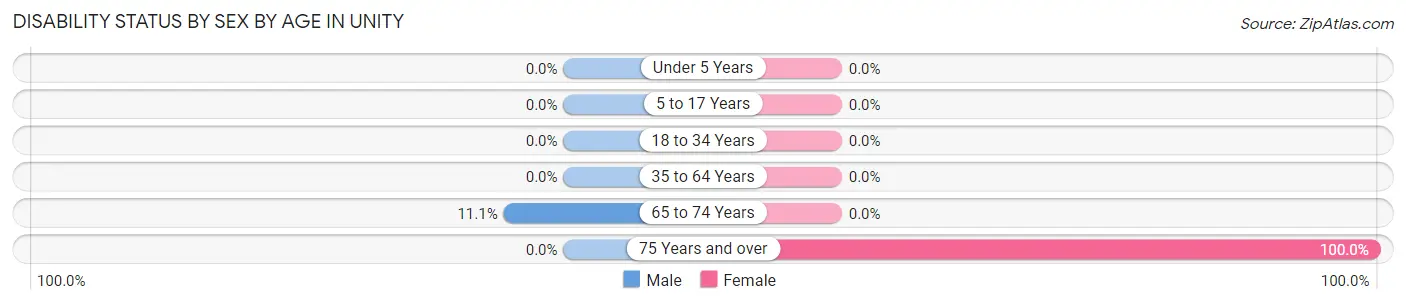
| Age Bracket | Male | Female |
| Under 5 Years | 0 (0.0%) | 0 (0.0%) |
| 5 to 17 Years | 0 (0.0%) | 0 (0.0%) |
| 18 to 34 Years | 0 (0.0%) | 0 (0.0%) |
| 35 to 64 Years | 0 (0.0%) | 0 (0.0%) |
| 65 to 74 Years | 1 (11.1%) | 0 (0.0%) |
| 75 Years and over | 0 (0.0%) | 1 (100.0%) |
Disability Class by Sex by Age in Unity
Disability Class: Hearing Difficulty
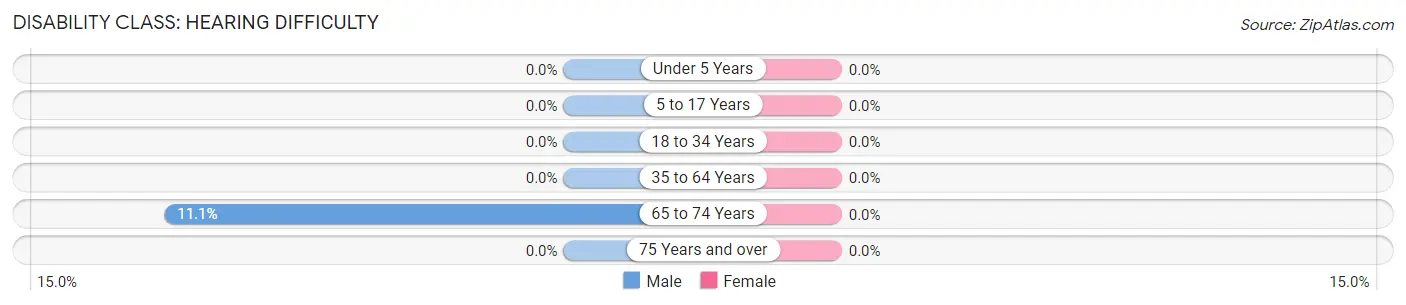
| Age Bracket | Male | Female |
| Under 5 Years | 0 (0.0%) | 0 (0.0%) |
| 5 to 17 Years | 0 (0.0%) | 0 (0.0%) |
| 18 to 34 Years | 0 (0.0%) | 0 (0.0%) |
| 35 to 64 Years | 0 (0.0%) | 0 (0.0%) |
| 65 to 74 Years | 1 (11.1%) | 0 (0.0%) |
| 75 Years and over | 0 (0.0%) | 0 (0.0%) |
Disability Class: Vision Difficulty
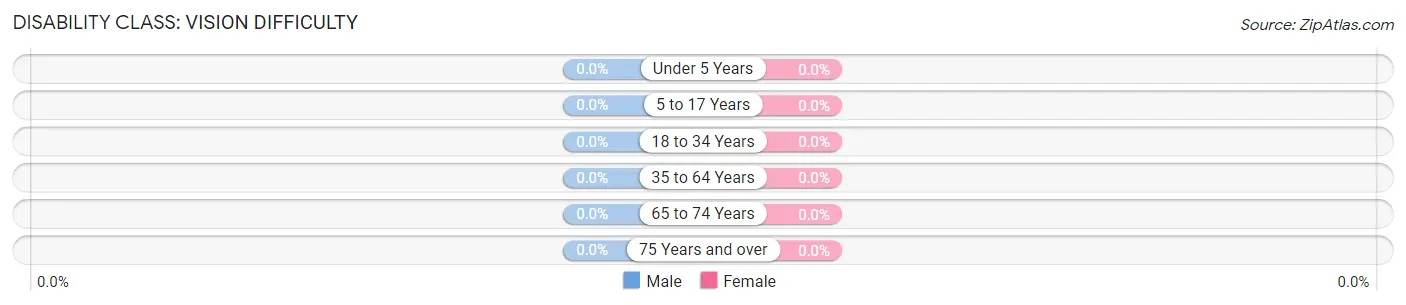
| Age Bracket | Male | Female |
| Under 5 Years | 0 (0.0%) | 0 (0.0%) |
| 5 to 17 Years | 0 (0.0%) | 0 (0.0%) |
| 18 to 34 Years | 0 (0.0%) | 0 (0.0%) |
| 35 to 64 Years | 0 (0.0%) | 0 (0.0%) |
| 65 to 74 Years | 0 (0.0%) | 0 (0.0%) |
| 75 Years and over | 0 (0.0%) | 0 (0.0%) |
Disability Class: Cognitive Difficulty

| Age Bracket | Male | Female |
| 5 to 17 Years | 0 (0.0%) | 0 (0.0%) |
| 18 to 34 Years | 0 (0.0%) | 0 (0.0%) |
| 35 to 64 Years | 0 (0.0%) | 0 (0.0%) |
| 65 to 74 Years | 0 (0.0%) | 0 (0.0%) |
| 75 Years and over | 0 (0.0%) | 0 (0.0%) |
Disability Class: Ambulatory Difficulty
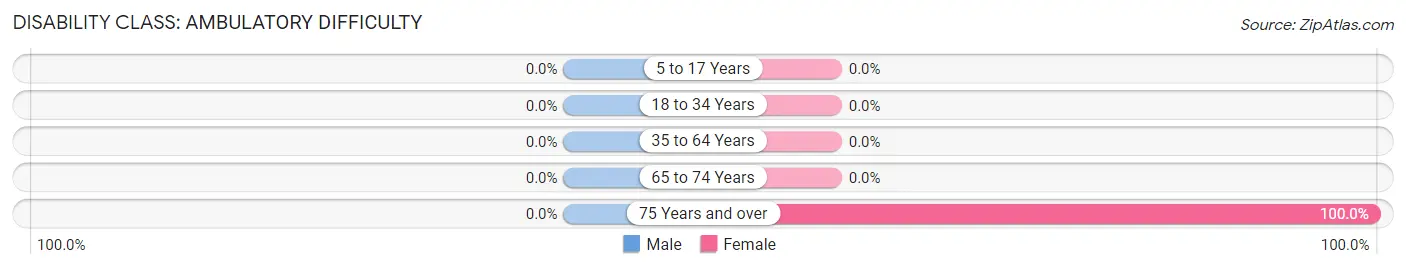
| Age Bracket | Male | Female |
| 5 to 17 Years | 0 (0.0%) | 0 (0.0%) |
| 18 to 34 Years | 0 (0.0%) | 0 (0.0%) |
| 35 to 64 Years | 0 (0.0%) | 0 (0.0%) |
| 65 to 74 Years | 0 (0.0%) | 0 (0.0%) |
| 75 Years and over | 0 (0.0%) | 1 (100.0%) |
Disability Class: Self-Care Difficulty
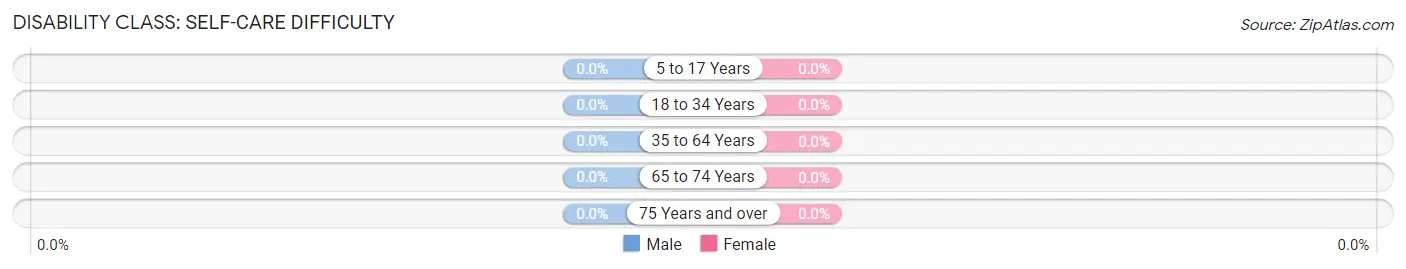
| Age Bracket | Male | Female |
| 5 to 17 Years | 0 (0.0%) | 0 (0.0%) |
| 18 to 34 Years | 0 (0.0%) | 0 (0.0%) |
| 35 to 64 Years | 0 (0.0%) | 0 (0.0%) |
| 65 to 74 Years | 0 (0.0%) | 0 (0.0%) |
| 75 Years and over | 0 (0.0%) | 0 (0.0%) |
Technology Access in Unity
Computing Device Access in Unity
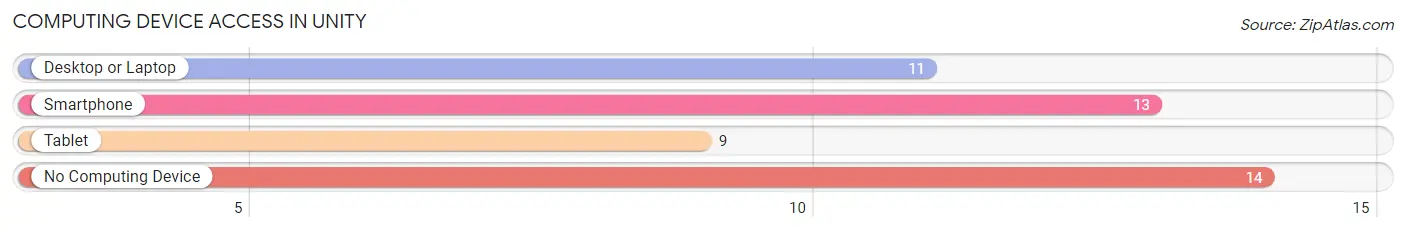
| Device Type | # Households | % Households |
| Desktop or Laptop | 11 | 39.3% |
| Smartphone | 13 | 46.4% |
| Tablet | 9 | 32.1% |
| No Computing Device | 14 | 50.0% |
| Total | 28 | 100.0% |
Internet Access in Unity
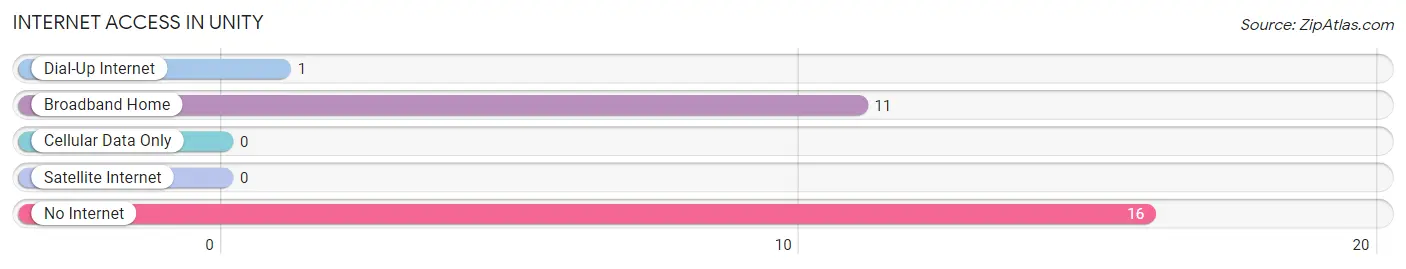
| Internet Type | # Households | % Households |
| Dial-Up Internet | 1 | 3.6% |
| Broadband Home | 11 | 39.3% |
| Cellular Data Only | 0 | 0.0% |
| Satellite Internet | 0 | 0.0% |
| No Internet | 16 | 57.1% |
| Total | 28 | 100.0% |
Unity Summary
Unity is a city located in the state of Oregon, in the United States of America. It is located in the western part of the state, in the foothills of the Cascade Mountains. The city is situated in the Willamette Valley, and is part of the Portland metropolitan area. As of the 2010 census, the population of Unity was 1,845.
History
The area that is now Unity was first inhabited by the Kalapuya Native American tribe. The first European settlers arrived in the area in the early 1800s, and the town of Unity was officially established in 1851. The town was named after the concept of unity among the settlers.
In the late 1800s, the town began to grow and prosper due to the abundance of natural resources in the area. The town was home to several sawmills, a flour mill, and a brickyard. The town also had a thriving agricultural industry, with many farmers growing wheat, oats, and other crops.
In the early 1900s, the town began to decline due to the decline of the timber industry. The town was also affected by the Great Depression, and many of the businesses in the town closed.
In the 1950s, the town began to experience a resurgence due to the growth of the nearby cities of Eugene and Springfield. The town also began to attract new businesses, such as a furniture factory and a cannery.
Geography
Unity is located in the western part of Oregon, in the foothills of the Cascade Mountains. The city is situated in the Willamette Valley, and is part of the Portland metropolitan area. The city is located at an elevation of 845 feet above sea level.
The city has a total area of 1.2 square miles, all of which is land. The city is located near the McKenzie River, and is surrounded by forests and rolling hills.
Economy
The economy of Unity is largely based on agriculture and tourism. The city is home to several farms, which produce a variety of crops, including wheat, oats, and hay. The city is also home to several wineries, which produce a variety of wines.
The city is also home to several businesses, including a furniture factory, a cannery, and a lumber mill. The city is also home to several restaurants, cafes, and shops.
Demographics
As of the 2010 census, the population of Unity was 1,845. The racial makeup of the city was 94.3% White, 0.7% African American, 0.3% Native American, 0.7% Asian, 0.1% Pacific Islander, 1.2% from other races, and 2.1% from two or more races. Hispanic or Latino of any race were 3.2% of the population.
The median income for a household in the city was $37,917, and the median income for a family was $45,625. The per capita income for the city was $19,945. About 11.2% of families and 14.2% of the population were below the poverty line, including 19.2% of those under age 18 and 8.3% of those age 65 or over.
Common Questions
What is Per Capita Income in Unity?
Per Capita income in Unity is $41,076.
What is the Median Household income in Unity?
Median Household Income in Unity is $41,250.
What is Inequality or Gini Index in Unity?
Inequality or Gini Index in Unity is 0.49.
What is the Total Population of Unity?
Total Population of Unity is 37.
What is the Total Male Population of Unity?
Total Male Population of Unity is 23.
What is the Total Female Population of Unity?
Total Female Population of Unity is 14.
What is the Ratio of Males per 100 Females in Unity?
There are 164.29 Males per 100 Females in Unity.
What is the Ratio of Females per 100 Males in Unity?
There are 60.87 Females per 100 Males in Unity.
What is the Median Population Age in Unity?
Median Population Age in Unity is 69.7 Years.
What is the Average Family Size in Unity
Average Family Size in Unity is 2.1 People.
What is the Average Household Size in Unity
Average Household Size in Unity is 1.3 People.
How Large is the Labor Force in Unity?
There are 9 People in the Labor Forcein in Unity.
What is the Percentage of People in the Labor Force in Unity?
27.3% of People are in the Labor Force in Unity.