Lakeside, OR Map & Demographics
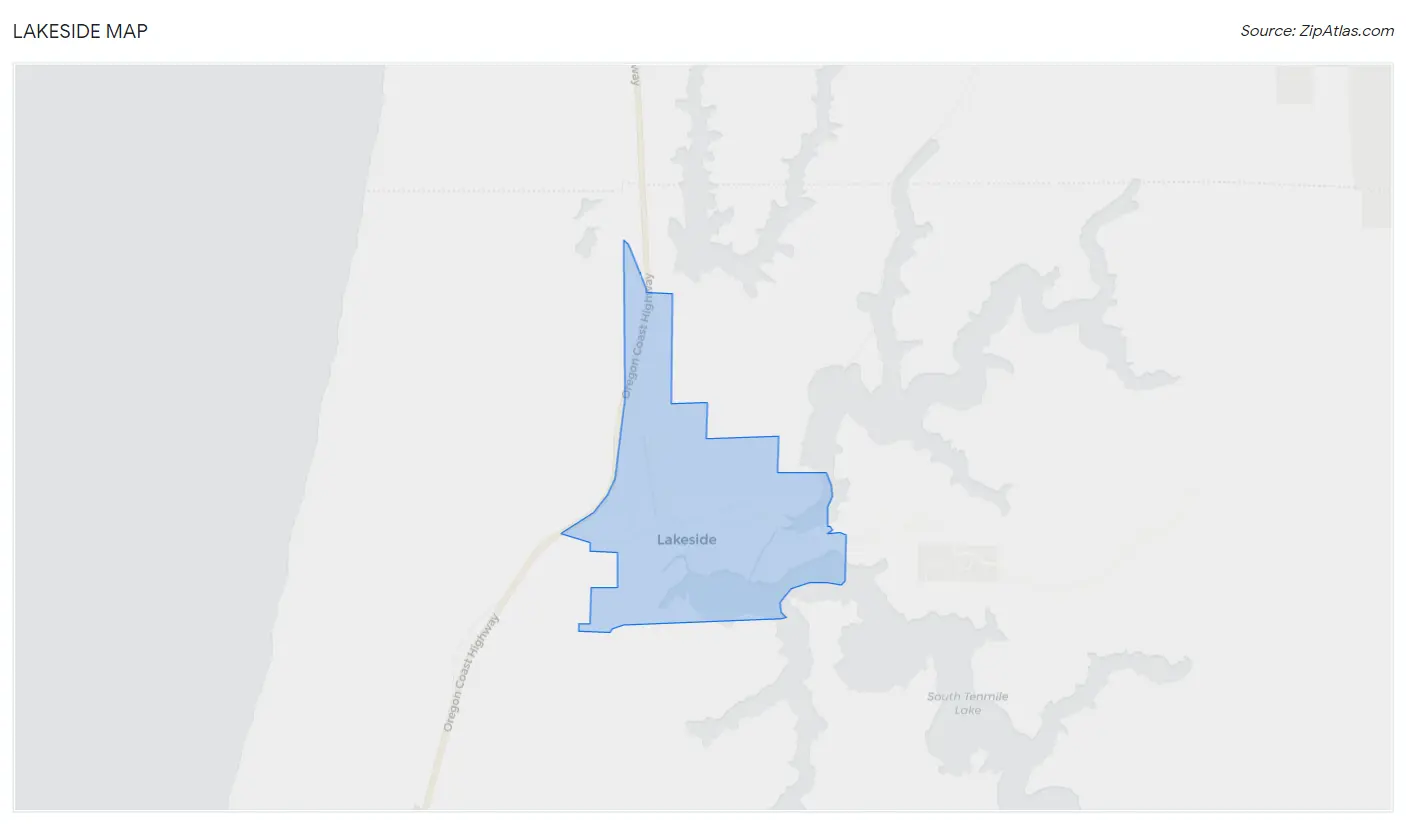
Lakeside Map
Lakeside Overview
$30,927
PER CAPITA INCOME
$70,962
AVG FAMILY INCOME
$60,903
AVG HOUSEHOLD INCOME
51.0%
WAGE / INCOME GAP [ % ]
49.0¢/ $1
WAGE / INCOME GAP [ $ ]
$8,768
FAMILY INCOME DEFICIT
0.33
INEQUALITY / GINI INDEX
1,838
TOTAL POPULATION
940
MALE POPULATION
898
FEMALE POPULATION
104.68
MALES / 100 FEMALES
95.53
FEMALES / 100 MALES
62.6
MEDIAN AGE
2.6
AVG FAMILY SIZE
2.2
AVG HOUSEHOLD SIZE
609
LABOR FORCE [ PEOPLE ]
37.2%
PERCENT IN LABOR FORCE
2.6%
UNEMPLOYMENT RATE
Lakeside Zip Codes
Lakeside Area Codes
Income in Lakeside
Income Overview in Lakeside
Per Capita Income in Lakeside is $30,927, while median incomes of families and households are $70,962 and $60,903 respectively.
| Characteristic | Number | Measure |
| Per Capita Income | 1,838 | $30,927 |
| Median Family Income | 542 | $70,962 |
| Mean Family Income | 542 | $75,680 |
| Median Household Income | 823 | $60,903 |
| Mean Household Income | 823 | $65,815 |
| Income Deficit | 542 | $8,768 |
| Wage / Income Gap (%) | 1,838 | 50.96% |
| Wage / Income Gap ($) | 1,838 | 49.04¢ per $1 |
| Gini / Inequality Index | 1,838 | 0.33 |
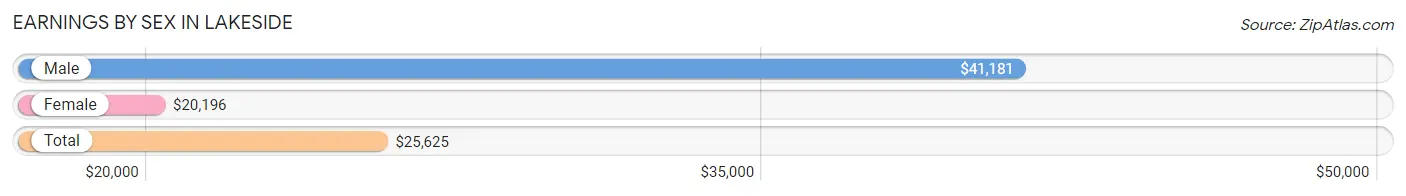
Earnings by Sex in Lakeside
Average Earnings in Lakeside are $25,625, $41,181 for men and $20,196 for women, a difference of 51.0%.
| Sex | Number | Average Earnings |
| Male | 291 (43.0%) | $41,181 |
| Female | 386 (57.0%) | $20,196 |
| Total | 677 (100.0%) | $25,625 |
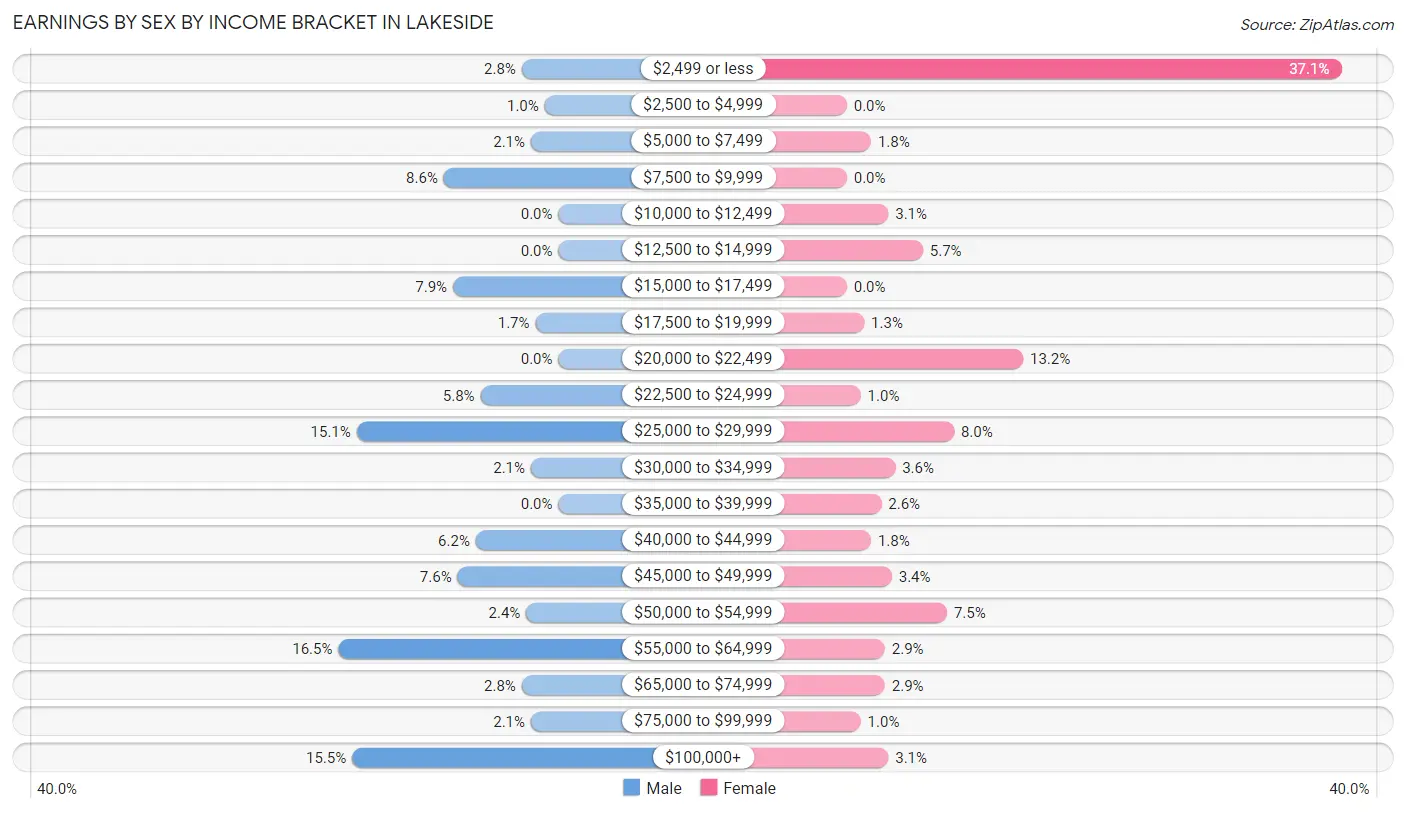
Earnings by Sex by Income Bracket in Lakeside
The most common earnings brackets in Lakeside are $55,000 to $64,999 for men (48 | 16.5%) and $2,499 or less for women (143 | 37.0%).
| Income | Male | Female |
| $2,499 or less | 8 (2.8%) | 143 (37.0%) |
| $2,500 to $4,999 | 3 (1.0%) | 0 (0.0%) |
| $5,000 to $7,499 | 6 (2.1%) | 7 (1.8%) |
| $7,500 to $9,999 | 25 (8.6%) | 0 (0.0%) |
| $10,000 to $12,499 | 0 (0.0%) | 12 (3.1%) |
| $12,500 to $14,999 | 0 (0.0%) | 22 (5.7%) |
| $15,000 to $17,499 | 23 (7.9%) | 0 (0.0%) |
| $17,500 to $19,999 | 5 (1.7%) | 5 (1.3%) |
| $20,000 to $22,499 | 0 (0.0%) | 51 (13.2%) |
| $22,500 to $24,999 | 17 (5.8%) | 4 (1.0%) |
| $25,000 to $29,999 | 44 (15.1%) | 31 (8.0%) |
| $30,000 to $34,999 | 6 (2.1%) | 14 (3.6%) |
| $35,000 to $39,999 | 0 (0.0%) | 10 (2.6%) |
| $40,000 to $44,999 | 18 (6.2%) | 7 (1.8%) |
| $45,000 to $49,999 | 22 (7.6%) | 13 (3.4%) |
| $50,000 to $54,999 | 7 (2.4%) | 29 (7.5%) |
| $55,000 to $64,999 | 48 (16.5%) | 11 (2.9%) |
| $65,000 to $74,999 | 8 (2.8%) | 11 (2.9%) |
| $75,000 to $99,999 | 6 (2.1%) | 4 (1.0%) |
| $100,000+ | 45 (15.5%) | 12 (3.1%) |
| Total | 291 (100.0%) | 386 (100.0%) |
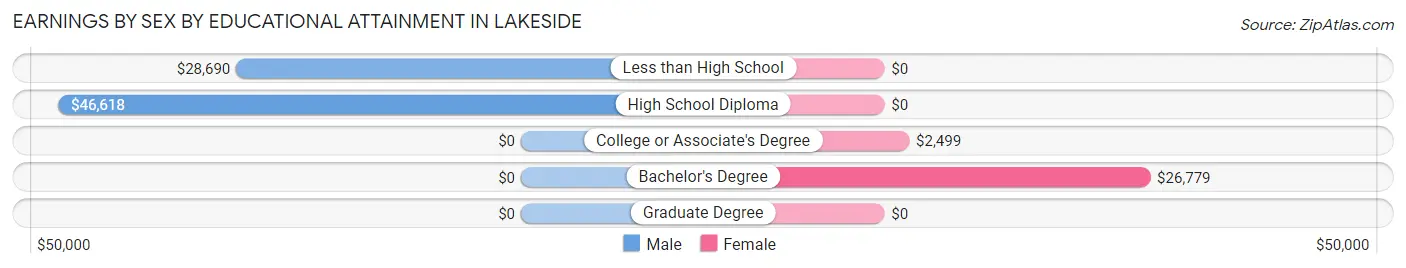
Earnings by Sex by Educational Attainment in Lakeside
Average earnings in Lakeside are $41,181 for men and $19,750 for women, a difference of 52.0%. Men with an educational attainment of high school diploma enjoy the highest average annual earnings of $46,618, while those with less than high school education earn the least with $28,690. Women with an educational attainment of bachelor's degree earn the most with the average annual earnings of $26,779, while those with college or associate's degree education have the smallest earnings of $2,499.
| Educational Attainment | Male Income | Female Income |
| Less than High School | $28,690 | $0 |
| High School Diploma | $46,618 | $0 |
| College or Associate's Degree | - | - |
| Bachelor's Degree | - | - |
| Graduate Degree | - | - |
| Total | $41,181 | $19,750 |
Family Income in Lakeside
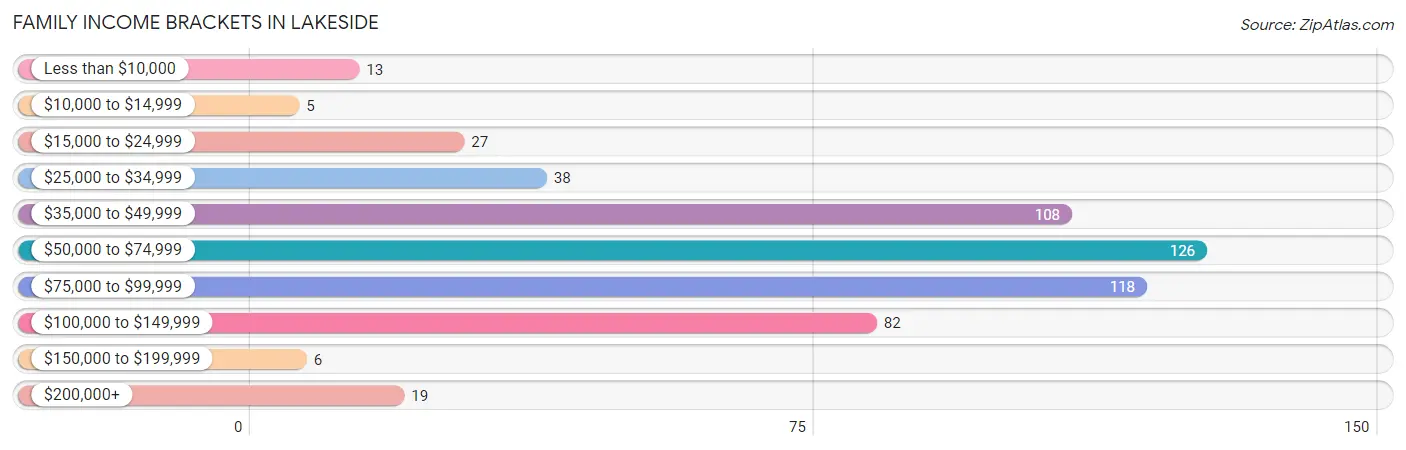
Family Income Brackets in Lakeside
According to the Lakeside family income data, there are 126 families falling into the $50,000 to $74,999 income range, which is the most common income bracket and makes up 23.3% of all families. Conversely, the $10,000 to $14,999 income bracket is the least frequent group with only 5 families (0.9%) belonging to this category.
| Income Bracket | # Families | % Families |
| Less than $10,000 | 13 | 2.4% |
| $10,000 to $14,999 | 5 | 0.9% |
| $15,000 to $24,999 | 27 | 5.0% |
| $25,000 to $34,999 | 38 | 7.0% |
| $35,000 to $49,999 | 108 | 19.9% |
| $50,000 to $74,999 | 126 | 23.2% |
| $75,000 to $99,999 | 118 | 21.8% |
| $100,000 to $149,999 | 82 | 15.1% |
| $150,000 to $199,999 | 6 | 1.1% |
| $200,000+ | 19 | 3.5% |
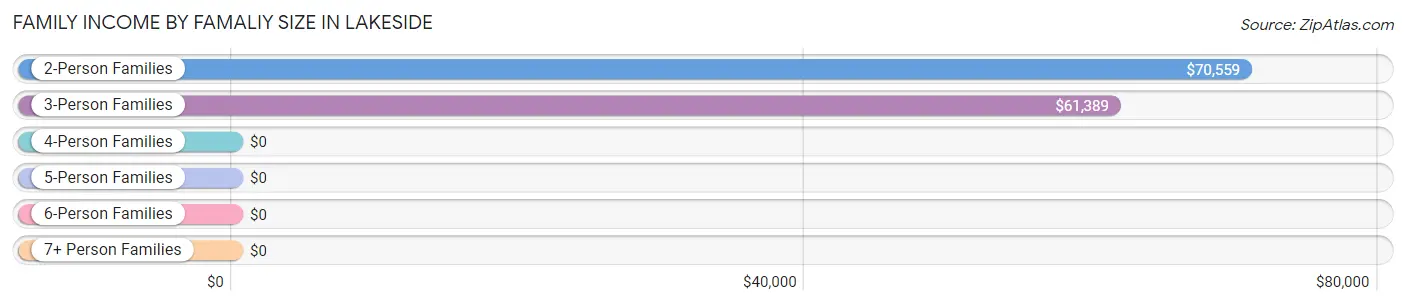
Family Income by Famaliy Size in Lakeside
2-person families (391 | 72.1%) account for the highest median family income in Lakeside with $70,559 per family, while 2-person families (391 | 72.1%) have the highest median income of $35,280 per family member.
| Income Bracket | # Families | Median Income |
| 2-Person Families | 391 (72.1%) | $70,559 |
| 3-Person Families | 98 (18.1%) | $61,389 |
| 4-Person Families | 18 (3.3%) | $0 |
| 5-Person Families | 26 (4.8%) | $0 |
| 6-Person Families | 9 (1.7%) | $0 |
| 7+ Person Families | 0 (0.0%) | $0 |
| Total | 542 (100.0%) | $70,962 |
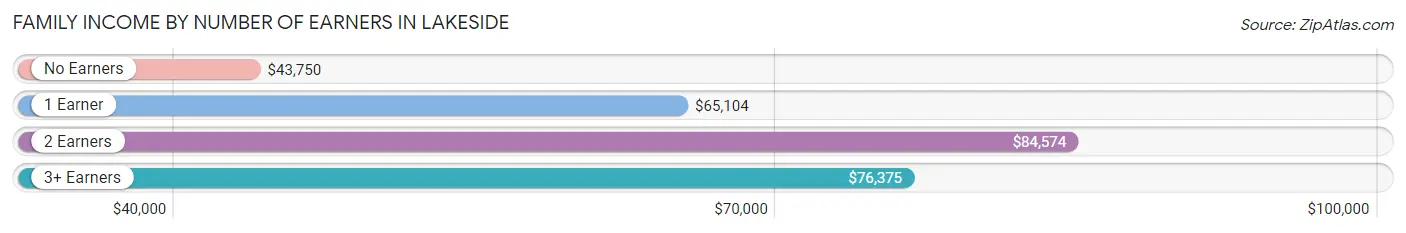
Family Income by Number of Earners in Lakeside
The median family income in Lakeside is $70,962, with families comprising 2 earners (142) having the highest median family income of $84,574, while families with no earners (240) have the lowest median family income of $43,750, accounting for 26.2% and 44.3% of families, respectively.
| Number of Earners | # Families | Median Income |
| No Earners | 240 (44.3%) | $43,750 |
| 1 Earner | 139 (25.7%) | $65,104 |
| 2 Earners | 142 (26.2%) | $84,574 |
| 3+ Earners | 21 (3.9%) | $76,375 |
| Total | 542 (100.0%) | $70,962 |
Household Income in Lakeside
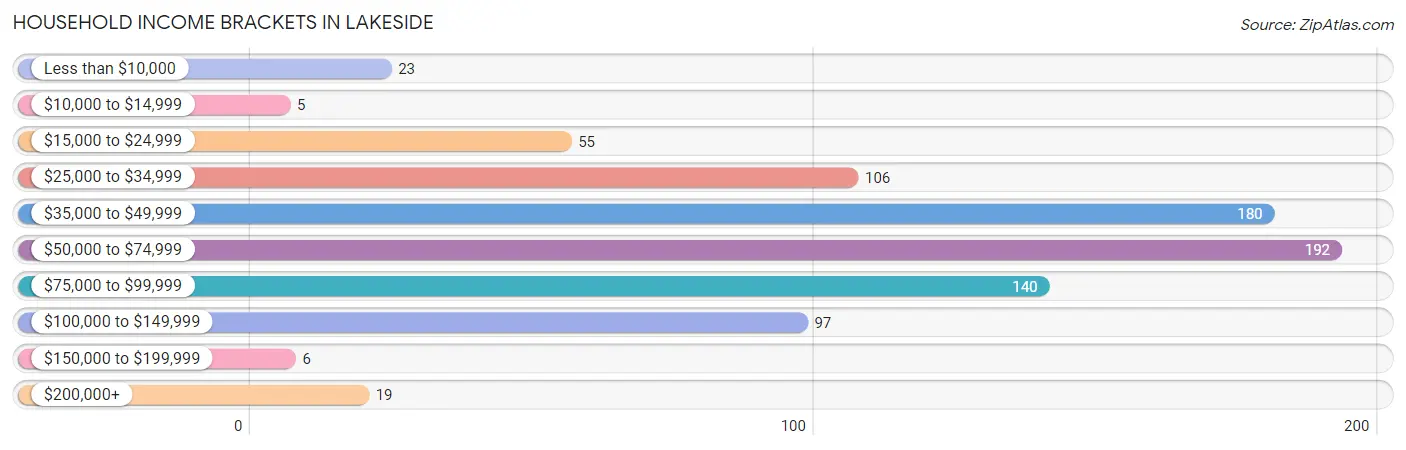
Household Income Brackets in Lakeside
With 192 households falling in the category, the $50,000 to $74,999 income range is the most frequent in Lakeside, accounting for 23.3% of all households. In contrast, only 5 households (0.6%) fall into the $10,000 to $14,999 income bracket, making it the least populous group.
| Income Bracket | # Households | % Households |
| Less than $10,000 | 23 | 2.8% |
| $10,000 to $14,999 | 5 | 0.6% |
| $15,000 to $24,999 | 55 | 6.7% |
| $25,000 to $34,999 | 106 | 12.9% |
| $35,000 to $49,999 | 180 | 21.9% |
| $50,000 to $74,999 | 192 | 23.3% |
| $75,000 to $99,999 | 140 | 17.0% |
| $100,000 to $149,999 | 97 | 11.8% |
| $150,000 to $199,999 | 6 | 0.7% |
| $200,000+ | 19 | 2.3% |
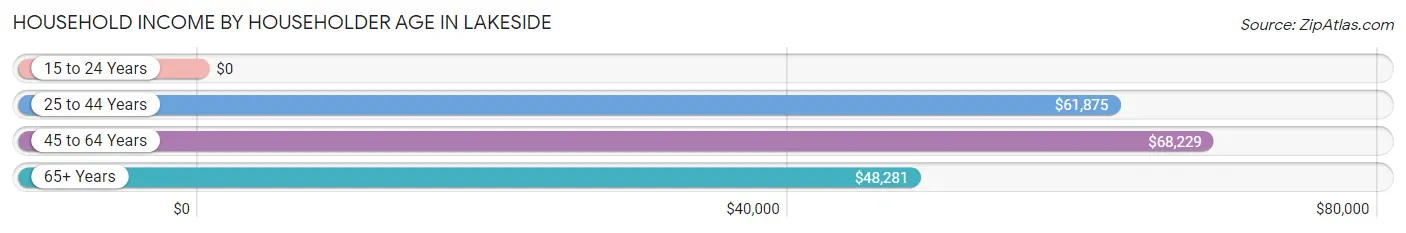
Household Income by Householder Age in Lakeside
The median household income in Lakeside is $60,903, with the highest median household income of $68,229 found in the 45 to 64 years age bracket for the primary householder. A total of 213 households (25.9%) fall into this category.
| Income Bracket | # Households | Median Income |
| 15 to 24 Years | 0 (0.0%) | $0 |
| 25 to 44 Years | 139 (16.9%) | $61,875 |
| 45 to 64 Years | 213 (25.9%) | $68,229 |
| 65+ Years | 471 (57.2%) | $48,281 |
| Total | 823 (100.0%) | $60,903 |
Poverty in Lakeside
Income Below Poverty by Sex and Age in Lakeside
With 9.6% poverty level for males and 16.0% for females among the residents of Lakeside, 18 to 24 year old males and 5 year old females are the most vulnerable to poverty, with 3 males (100.0%) and 5 females (100.0%) in their respective age groups living below the poverty level.
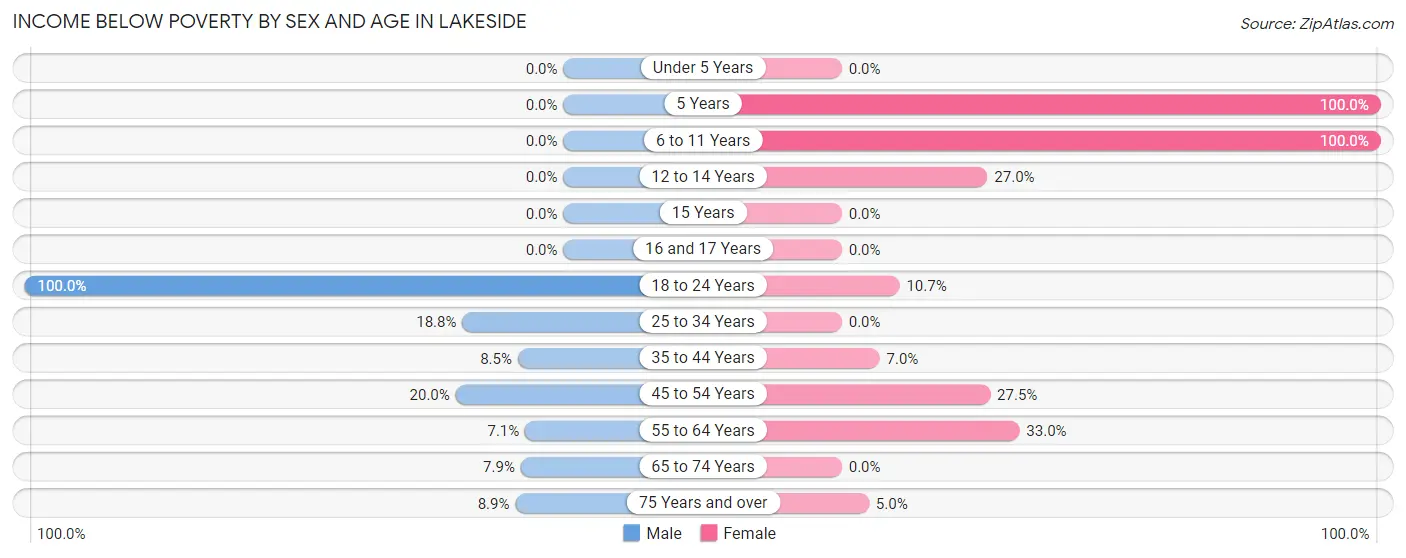
| Age Bracket | Male | Female |
| Under 5 Years | 0 (0.0%) | 0 (0.0%) |
| 5 Years | 0 (0.0%) | 5 (100.0%) |
| 6 to 11 Years | 0 (0.0%) | 5 (100.0%) |
| 12 to 14 Years | 0 (0.0%) | 10 (27.0%) |
| 15 Years | 0 (0.0%) | 0 (0.0%) |
| 16 and 17 Years | 0 (0.0%) | 0 (0.0%) |
| 18 to 24 Years | 3 (100.0%) | 3 (10.7%) |
| 25 to 34 Years | 18 (18.8%) | 0 (0.0%) |
| 35 to 44 Years | 6 (8.5%) | 4 (7.0%) |
| 45 to 54 Years | 18 (20.0%) | 19 (27.5%) |
| 55 to 64 Years | 11 (7.1%) | 90 (33.0%) |
| 65 to 74 Years | 20 (7.9%) | 0 (0.0%) |
| 75 Years and over | 14 (8.9%) | 8 (5.0%) |
| Total | 90 (9.6%) | 144 (16.0%) |
Income Above Poverty by Sex and Age in Lakeside
According to the poverty statistics in Lakeside, males aged under 5 years and females aged under 5 years are the age groups that are most secure financially, with 100.0% of males and 100.0% of females in these age groups living above the poverty line.
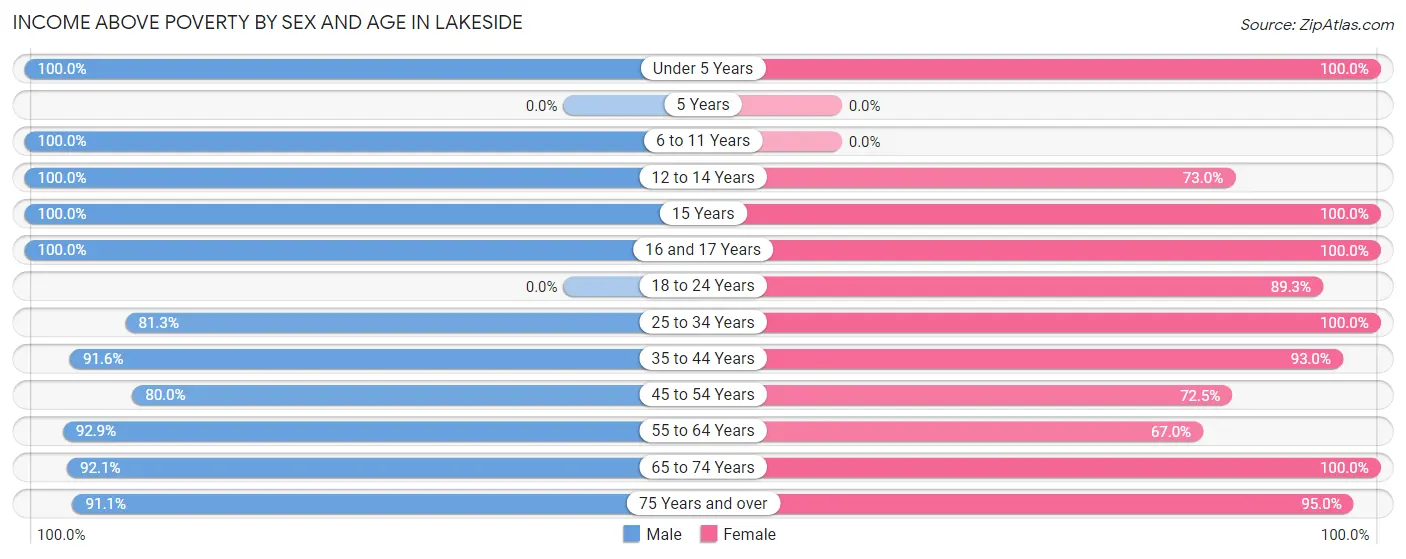
| Age Bracket | Male | Female |
| Under 5 Years | 37 (100.0%) | 22 (100.0%) |
| 5 Years | 0 (0.0%) | 0 (0.0%) |
| 6 to 11 Years | 46 (100.0%) | 0 (0.0%) |
| 12 to 14 Years | 20 (100.0%) | 27 (73.0%) |
| 15 Years | 9 (100.0%) | 21 (100.0%) |
| 16 and 17 Years | 3 (100.0%) | 13 (100.0%) |
| 18 to 24 Years | 0 (0.0%) | 25 (89.3%) |
| 25 to 34 Years | 78 (81.2%) | 49 (100.0%) |
| 35 to 44 Years | 65 (91.5%) | 53 (93.0%) |
| 45 to 54 Years | 72 (80.0%) | 50 (72.5%) |
| 55 to 64 Years | 144 (92.9%) | 183 (67.0%) |
| 65 to 74 Years | 233 (92.1%) | 160 (100.0%) |
| 75 Years and over | 143 (91.1%) | 151 (95.0%) |
| Total | 850 (90.4%) | 754 (84.0%) |
Income Below Poverty Among Married-Couple Families in Lakeside
The poverty statistics for married-couple families in Lakeside show that 8.2% or 41 of the total 498 families live below the poverty line. Families with 3 or 4 children have the highest poverty rate of 16.0%, comprising of 4 families. On the other hand, families with 1 or 2 children have the lowest poverty rate of 0.0%, which includes 0 families.
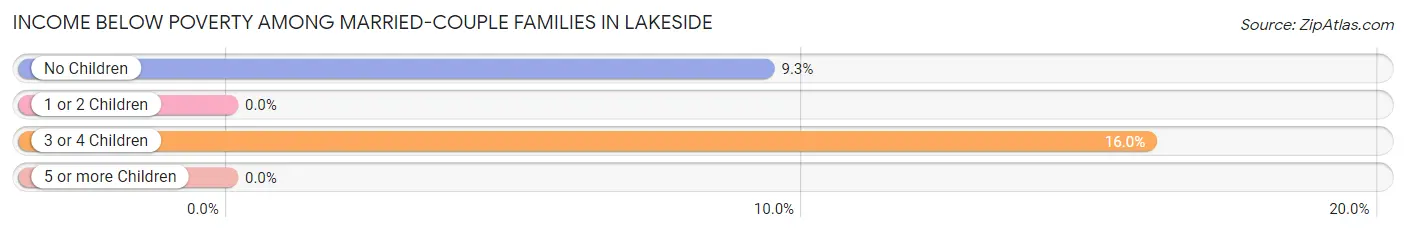
| Children | Above Poverty | Below Poverty |
| No Children | 359 (90.7%) | 37 (9.3%) |
| 1 or 2 Children | 77 (100.0%) | 0 (0.0%) |
| 3 or 4 Children | 21 (84.0%) | 4 (16.0%) |
| 5 or more Children | 0 (0.0%) | 0 (0.0%) |
| Total | 457 (91.8%) | 41 (8.2%) |
Income Below Poverty Among Single-Parent Households in Lakeside
| Children | Single Father | Single Mother |
| No Children | 0 (0.0%) | 0 (0.0%) |
| 1 or 2 Children | 0 (0.0%) | 0 (0.0%) |
| 3 or 4 Children | 0 (0.0%) | 0 (0.0%) |
| 5 or more Children | 0 (0.0%) | 0 (0.0%) |
| Total | 0 (0.0%) | 0 (0.0%) |
Income Below Poverty Among Married-Couple vs Single-Parent Households in Lakeside
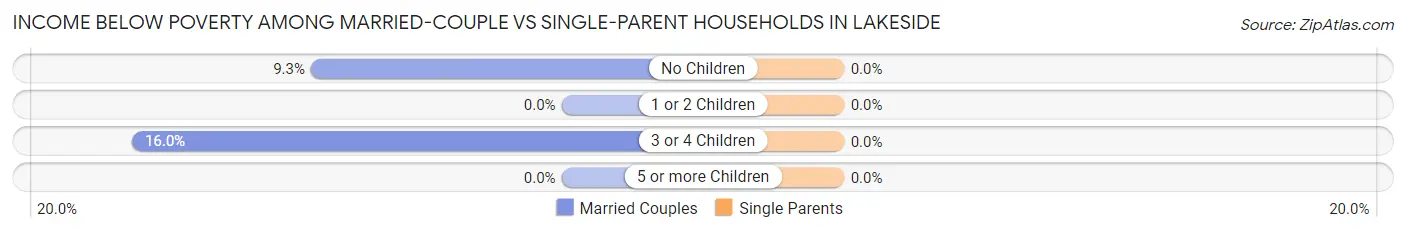
| Children | Married-Couple Families | Single-Parent Households |
| No Children | 37 (9.3%) | 0 (0.0%) |
| 1 or 2 Children | 0 (0.0%) | 0 (0.0%) |
| 3 or 4 Children | 4 (16.0%) | 0 (0.0%) |
| 5 or more Children | 0 (0.0%) | 0 (0.0%) |
| Total | 41 (8.2%) | 0 (0.0%) |
Race in Lakeside
The most populous races in Lakeside are White / Caucasian (1,632 | 88.8%), Two or more Races (144 | 7.8%), and Hispanic or Latino (51 | 2.8%).
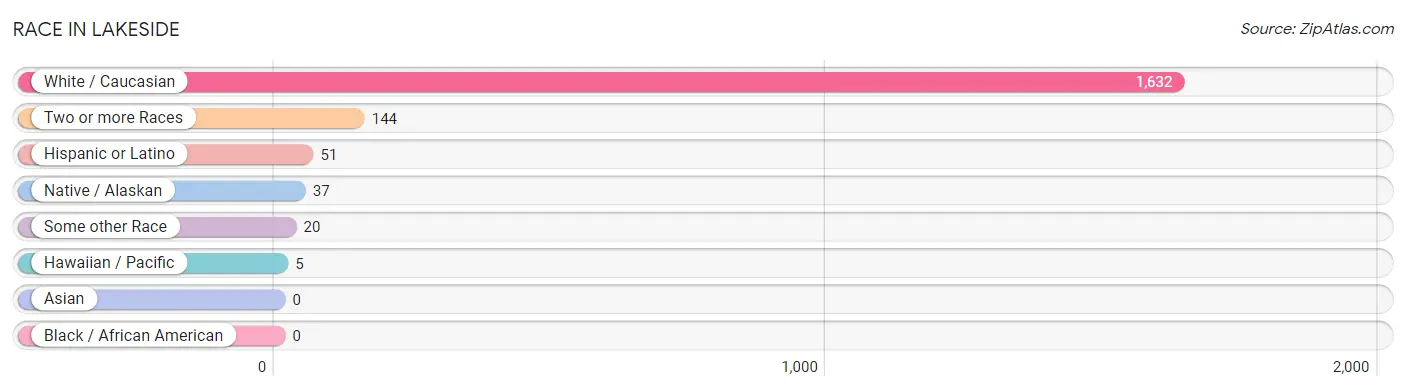
| Race | # Population | % Population |
| Asian | 0 | 0.0% |
| Black / African American | 0 | 0.0% |
| Hawaiian / Pacific | 5 | 0.3% |
| Hispanic or Latino | 51 | 2.8% |
| Native / Alaskan | 37 | 2.0% |
| White / Caucasian | 1,632 | 88.8% |
| Two or more Races | 144 | 7.8% |
| Some other Race | 20 | 1.1% |
| Total | 1,838 | 100.0% |
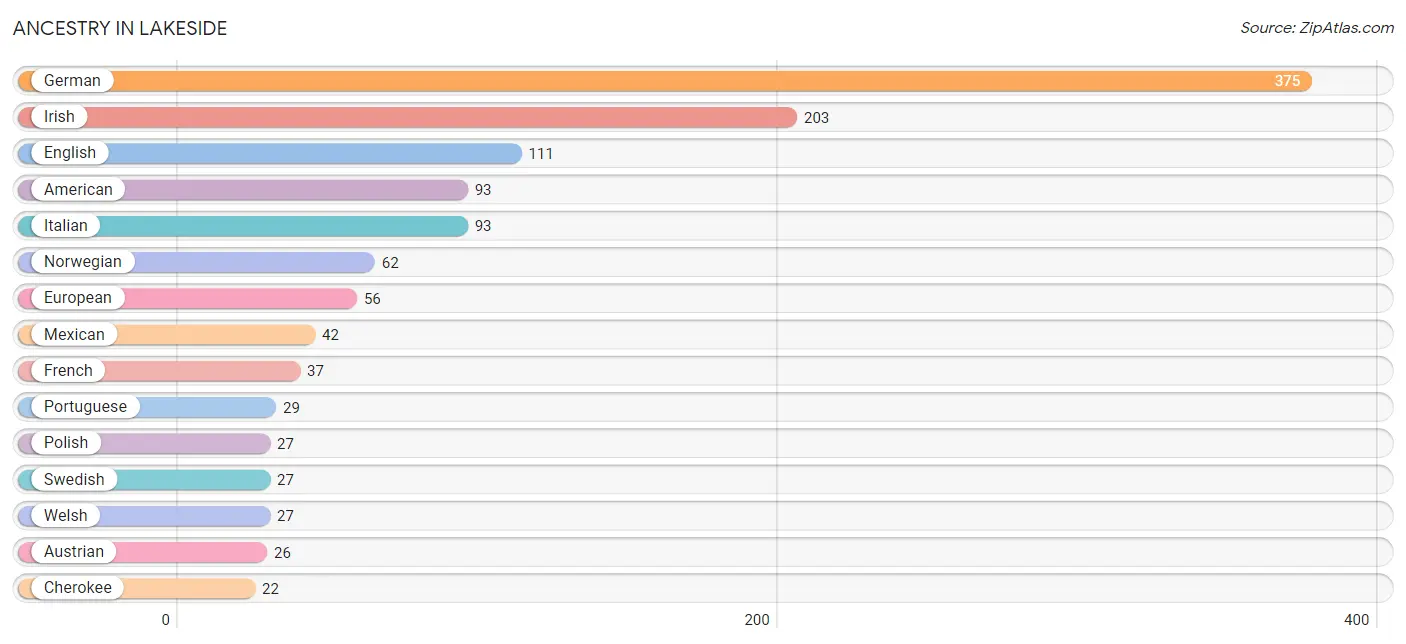
Ancestry in Lakeside
The most populous ancestries reported in Lakeside are German (375 | 20.4%), Irish (203 | 11.0%), English (111 | 6.0%), American (93 | 5.1%), and Italian (93 | 5.1%), together accounting for 47.6% of all Lakeside residents.
| Ancestry | # Population | % Population |
| Aleut | 8 | 0.4% |
| American | 93 | 5.1% |
| Austrian | 26 | 1.4% |
| Brazilian | 4 | 0.2% |
| British | 17 | 0.9% |
| Canadian | 4 | 0.2% |
| Cherokee | 22 | 1.2% |
| Chilean | 4 | 0.2% |
| Czech | 9 | 0.5% |
| Czechoslovakian | 5 | 0.3% |
| Danish | 22 | 1.2% |
| Dutch | 13 | 0.7% |
| Eastern European | 7 | 0.4% |
| English | 111 | 6.0% |
| European | 56 | 3.0% |
| Finnish | 4 | 0.2% |
| French | 37 | 2.0% |
| French Canadian | 18 | 1.0% |
| German | 375 | 20.4% |
| Greek | 2 | 0.1% |
| Guamanian / Chamorro | 5 | 0.3% |
| Hungarian | 4 | 0.2% |
| Indonesian | 9 | 0.5% |
| Irish | 203 | 11.0% |
| Italian | 93 | 5.1% |
| Korean | 3 | 0.2% |
| Mexican | 42 | 2.3% |
| New Zealander | 4 | 0.2% |
| Norwegian | 62 | 3.4% |
| Paiute | 2 | 0.1% |
| Polish | 27 | 1.5% |
| Portuguese | 29 | 1.6% |
| Russian | 14 | 0.8% |
| Scandinavian | 8 | 0.4% |
| Scotch-Irish | 13 | 0.7% |
| Scottish | 17 | 0.9% |
| South American | 4 | 0.2% |
| Swedish | 27 | 1.5% |
| Tlingit-Haida | 11 | 0.6% |
| Ute | 6 | 0.3% |
| Welsh | 27 | 1.5% | View All 41 Rows |
Immigrants in Lakeside
The most numerous immigrant groups reported in Lakeside came from Latin America (29 | 1.6%), South America (29 | 1.6%), Brazil (25 | 1.4%), Europe (9 | 0.5%), and Western Europe (9 | 0.5%), together accounting for 5.5% of all Lakeside residents.
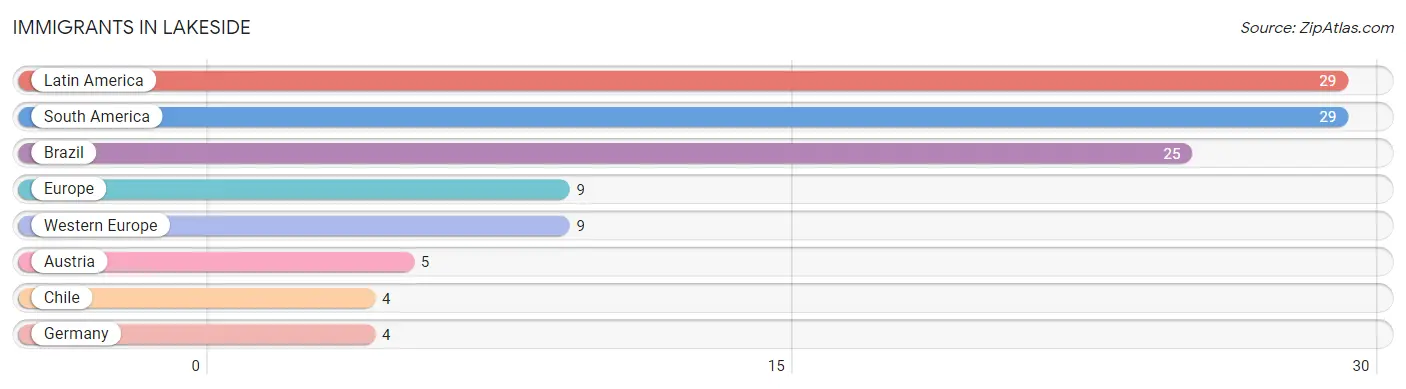
| Immigration Origin | # Population | % Population |
| Austria | 5 | 0.3% |
| Brazil | 25 | 1.4% |
| Chile | 4 | 0.2% |
| Europe | 9 | 0.5% |
| Germany | 4 | 0.2% |
| Latin America | 29 | 1.6% |
| South America | 29 | 1.6% |
| Western Europe | 9 | 0.5% | View All 8 Rows |
Sex and Age in Lakeside
Sex and Age in Lakeside
The most populous age groups in Lakeside are 70 to 74 Years (133 | 14.1%) for men and 55 to 59 Years (143 | 15.9%) for women.
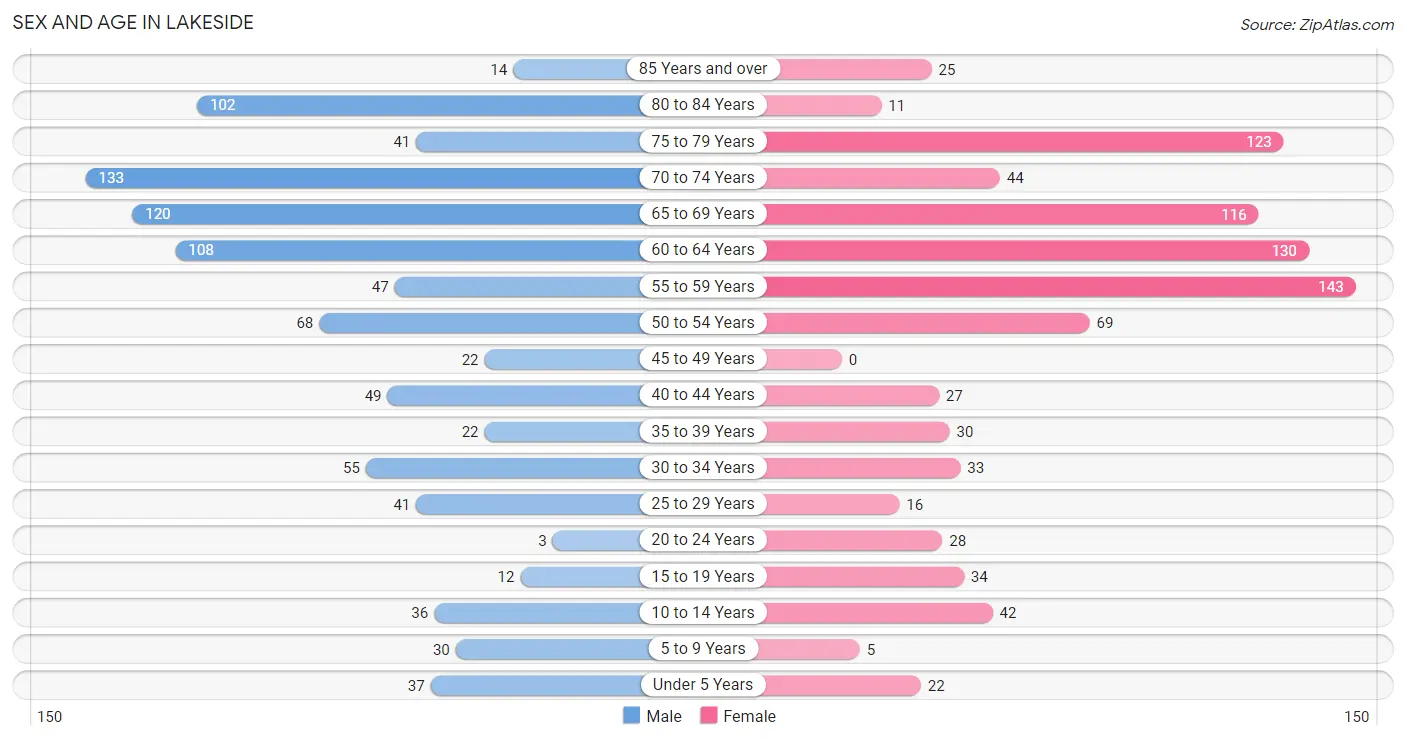
| Age Bracket | Male | Female |
| Under 5 Years | 37 (3.9%) | 22 (2.5%) |
| 5 to 9 Years | 30 (3.2%) | 5 (0.6%) |
| 10 to 14 Years | 36 (3.8%) | 42 (4.7%) |
| 15 to 19 Years | 12 (1.3%) | 34 (3.8%) |
| 20 to 24 Years | 3 (0.3%) | 28 (3.1%) |
| 25 to 29 Years | 41 (4.4%) | 16 (1.8%) |
| 30 to 34 Years | 55 (5.9%) | 33 (3.7%) |
| 35 to 39 Years | 22 (2.3%) | 30 (3.3%) |
| 40 to 44 Years | 49 (5.2%) | 27 (3.0%) |
| 45 to 49 Years | 22 (2.3%) | 0 (0.0%) |
| 50 to 54 Years | 68 (7.2%) | 69 (7.7%) |
| 55 to 59 Years | 47 (5.0%) | 143 (15.9%) |
| 60 to 64 Years | 108 (11.5%) | 130 (14.5%) |
| 65 to 69 Years | 120 (12.8%) | 116 (12.9%) |
| 70 to 74 Years | 133 (14.1%) | 44 (4.9%) |
| 75 to 79 Years | 41 (4.4%) | 123 (13.7%) |
| 80 to 84 Years | 102 (10.8%) | 11 (1.2%) |
| 85 Years and over | 14 (1.5%) | 25 (2.8%) |
| Total | 940 (100.0%) | 898 (100.0%) |
Families and Households in Lakeside
Median Family Size in Lakeside
The median family size in Lakeside is 2.58 persons per family, with single female/mother families (31 | 5.7%) accounting for the largest median family size of 2.81 persons per family. On the other hand, single male/father families (13 | 2.4%) represent the smallest median family size with 1.92 persons per family.
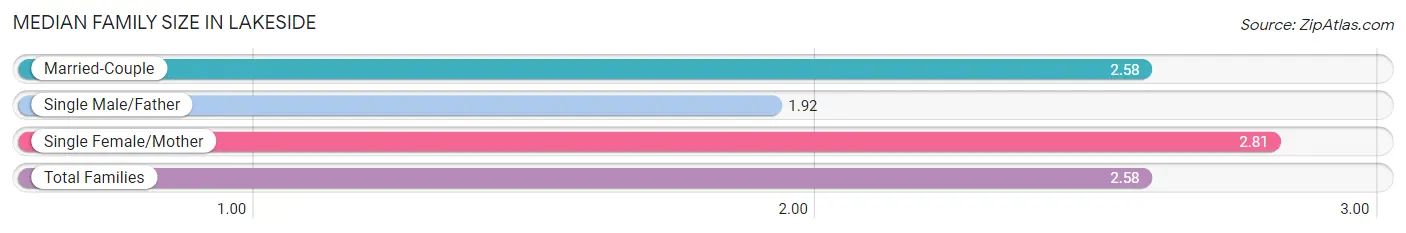
| Family Type | # Families | Family Size |
| Married-Couple | 498 (91.9%) | 2.58 |
| Single Male/Father | 13 (2.4%) | 1.92 |
| Single Female/Mother | 31 (5.7%) | 2.81 |
| Total Families | 542 (100.0%) | 2.58 |
Median Household Size in Lakeside
The median household size in Lakeside is 2.21 persons per household, with single female/mother households (31 | 3.8%) accounting for the largest median household size of 3.1 persons per household. non-family households (281 | 34.1%) represent the smallest median household size with 1.26 persons per household.
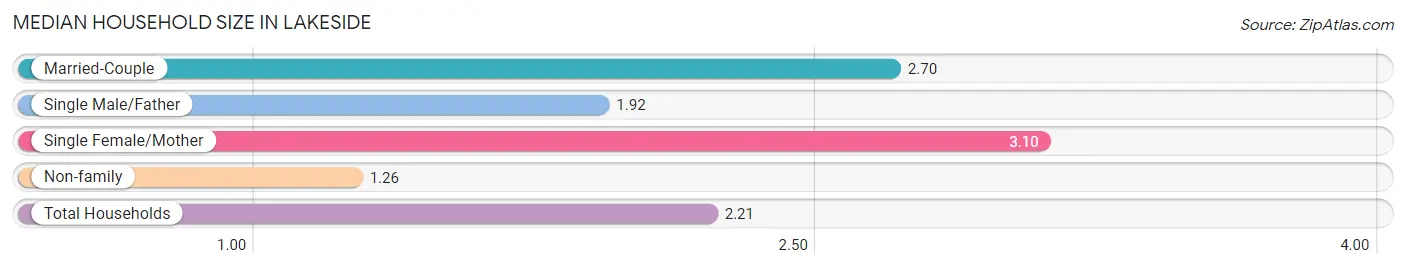
| Household Type | # Households | Household Size |
| Married-Couple | 498 (60.5%) | 2.70 |
| Single Male/Father | 13 (1.6%) | 1.92 |
| Single Female/Mother | 31 (3.8%) | 3.10 |
| Non-family | 281 (34.1%) | 1.26 |
| Total Households | 823 (100.0%) | 2.21 |
Household Size by Marriage Status in Lakeside
Out of a total of 823 households in Lakeside, 542 (65.9%) are family households, while 281 (34.1%) are nonfamily households. The most numerous type of family households are 2-person households, comprising 346, and the most common type of nonfamily households are 1-person households, comprising 218.
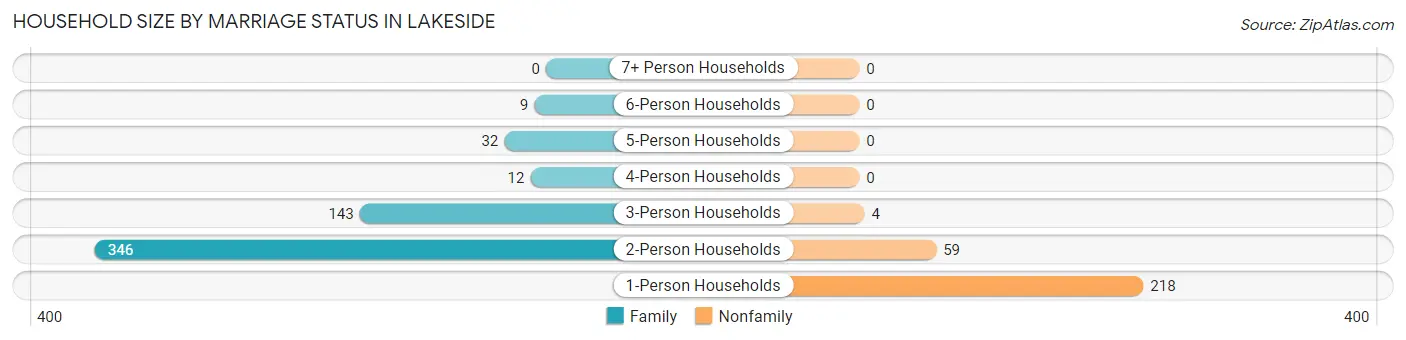
| Household Size | Family Households | Nonfamily Households |
| 1-Person Households | - | 218 (26.5%) |
| 2-Person Households | 346 (42.0%) | 59 (7.2%) |
| 3-Person Households | 143 (17.4%) | 4 (0.5%) |
| 4-Person Households | 12 (1.5%) | 0 (0.0%) |
| 5-Person Households | 32 (3.9%) | 0 (0.0%) |
| 6-Person Households | 9 (1.1%) | 0 (0.0%) |
| 7+ Person Households | 0 (0.0%) | 0 (0.0%) |
| Total | 542 (65.9%) | 281 (34.1%) |
Female Fertility in Lakeside
Fertility by Age in Lakeside
Average fertility rate in Lakeside is 163.0 births per 1,000 women. Women in the age bracket of 20 to 34 years have the highest fertility rate with 364.0 births per 1,000 women. Women in the age bracket of 20 to 34 years acount for 100.0% of all women with births.
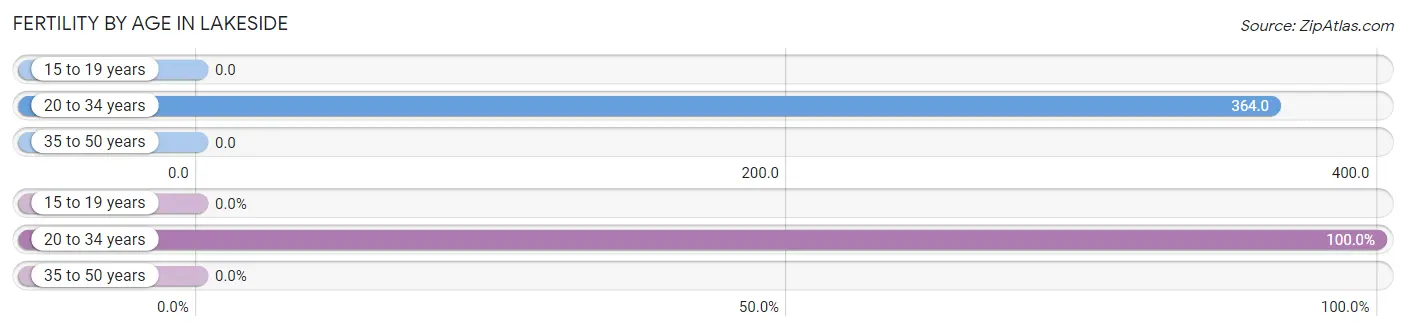
| Age Bracket | Women with Births | Births / 1,000 Women |
| 15 to 19 years | 0 (0.0%) | 0.0 |
| 20 to 34 years | 28 (100.0%) | 364.0 |
| 35 to 50 years | 0 (0.0%) | 0.0 |
| Total | 28 (100.0%) | 163.0 |
Fertility by Age by Marriage Status in Lakeside
89.3% of women with births (28) in Lakeside are married. The highest percentage of unmarried women with births falls into 20 to 34 years age bracket with 10.7% of them unmarried at the time of birth, while the lowest percentage of unmarried women with births belong to 20 to 34 years age bracket with 10.7% of them unmarried.
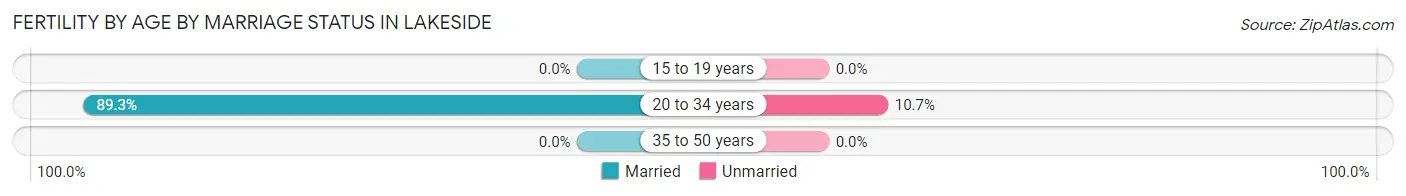
| Age Bracket | Married | Unmarried |
| 15 to 19 years | 0 (0.0%) | 0 (0.0%) |
| 20 to 34 years | 25 (89.3%) | 3 (10.7%) |
| 35 to 50 years | 0 (0.0%) | 0 (0.0%) |
| Total | 25 (89.3%) | 3 (10.7%) |
Fertility by Education in Lakeside
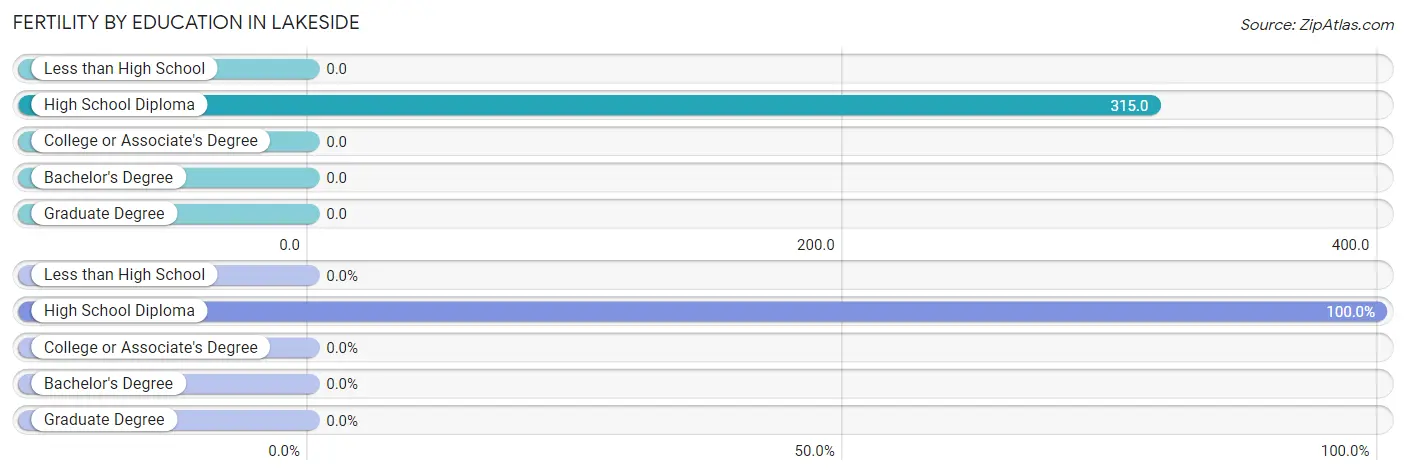
| Educational Attainment | Women with Births | Births / 1,000 Women |
| Less than High School | 0 (0.0%) | 0.0 |
| High School Diploma | 28 (100.0%) | 315.0 |
| College or Associate's Degree | 0 (0.0%) | 0.0 |
| Bachelor's Degree | 0 (0.0%) | 0.0 |
| Graduate Degree | 0 (0.0%) | 0.0 |
| Total | 28 (100.0%) | 163.0 |
Fertility by Education by Marriage Status in Lakeside
10.7% of women with births in Lakeside are unmarried. Women with the educational attainment of high school diploma are most likely to be married with 89.3% of them married at childbirth, while women with the educational attainment of high school diploma are least likely to be married with 10.7% of them unmarried at childbirth.
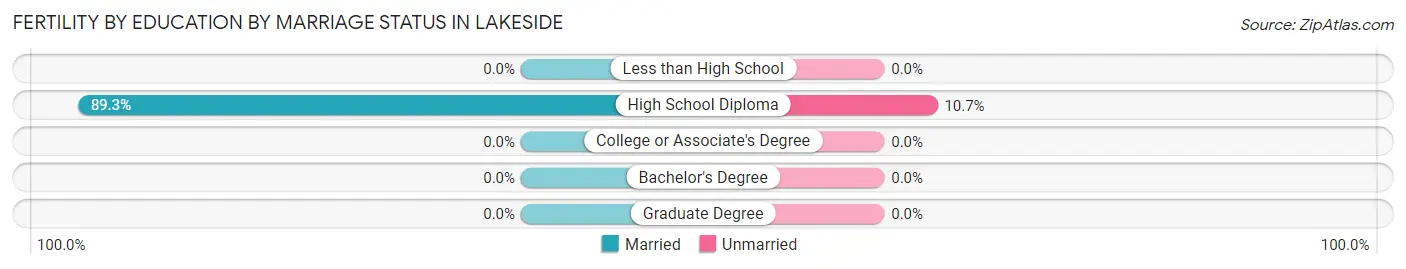
| Educational Attainment | Married | Unmarried |
| Less than High School | 0 (0.0%) | 0 (0.0%) |
| High School Diploma | 25 (89.3%) | 3 (10.7%) |
| College or Associate's Degree | 0 (0.0%) | 0 (0.0%) |
| Bachelor's Degree | 0 (0.0%) | 0 (0.0%) |
| Graduate Degree | 0 (0.0%) | 0 (0.0%) |
| Total | 25 (89.3%) | 3 (10.7%) |
Employment Characteristics in Lakeside
Employment by Class of Employer in Lakeside
Among the 568 employed individuals in Lakeside, private company employees (379 | 66.7%), self-employed (not incorporated) (77 | 13.6%), and local government employees (35 | 6.2%) make up the most common classes of employment.
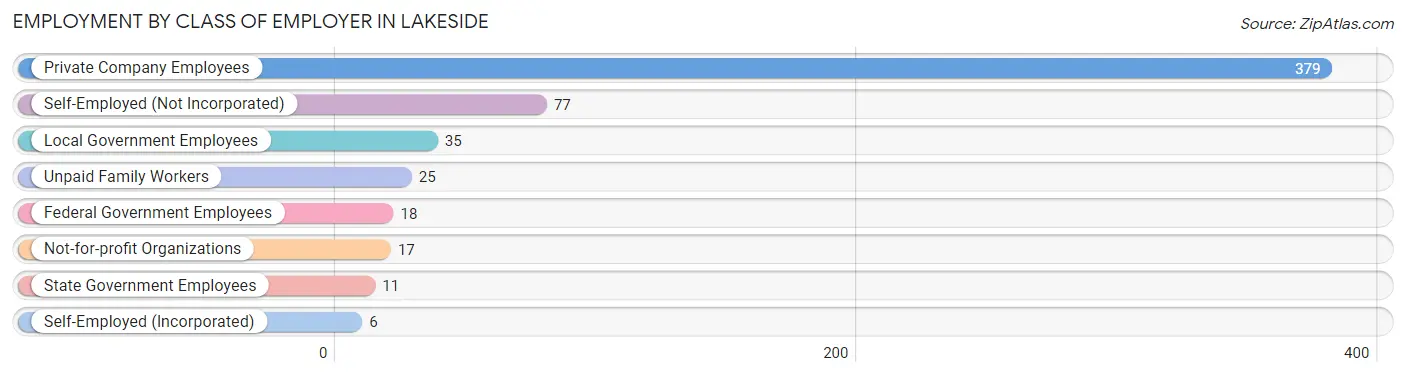
| Employer Class | # Employees | % Employees |
| Private Company Employees | 379 | 66.7% |
| Self-Employed (Incorporated) | 6 | 1.1% |
| Self-Employed (Not Incorporated) | 77 | 13.6% |
| Not-for-profit Organizations | 17 | 3.0% |
| Local Government Employees | 35 | 6.2% |
| State Government Employees | 11 | 1.9% |
| Federal Government Employees | 18 | 3.2% |
| Unpaid Family Workers | 25 | 4.4% |
| Total | 568 | 100.0% |
Employment Status by Age in Lakeside
According to the labor force statistics for Lakeside, out of the total population over 16 years of age (1,636), 37.2% or 609 individuals are in the labor force, with 2.6% or 16 of them unemployed. The age group with the highest labor force participation rate is 20 to 24 years, with 90.3% or 28 individuals in the labor force. Within the labor force, the 35 to 44 years age range has the highest percentage of unemployed individuals, with 14.7% or 16 of them being unemployed.
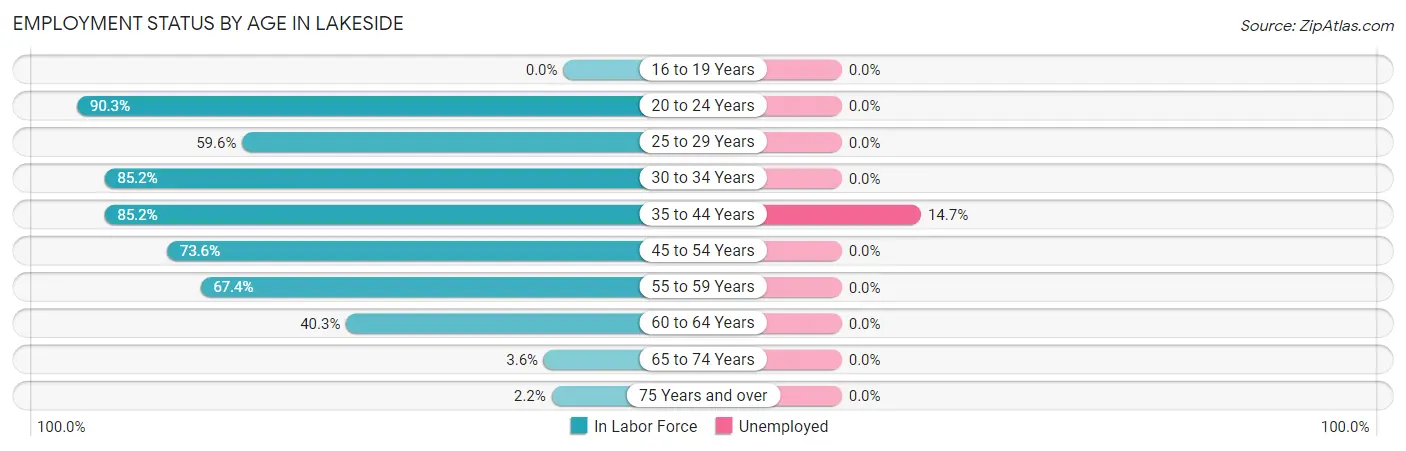
| Age Bracket | In Labor Force | Unemployed |
| 16 to 19 Years | 0 (0.0%) | 0 (0.0%) |
| 20 to 24 Years | 28 (90.3%) | 0 (0.0%) |
| 25 to 29 Years | 34 (59.6%) | 0 (0.0%) |
| 30 to 34 Years | 75 (85.2%) | 0 (0.0%) |
| 35 to 44 Years | 109 (85.2%) | 16 (14.7%) |
| 45 to 54 Years | 117 (73.6%) | 0 (0.0%) |
| 55 to 59 Years | 128 (67.4%) | 0 (0.0%) |
| 60 to 64 Years | 96 (40.3%) | 0 (0.0%) |
| 65 to 74 Years | 15 (3.6%) | 0 (0.0%) |
| 75 Years and over | 7 (2.2%) | 0 (0.0%) |
| Total | 609 (37.2%) | 16 (2.6%) |
Employment Status by Educational Attainment in Lakeside
According to labor force statistics for Lakeside, 65.0% of individuals (559) out of the total population between 25 and 64 years of age (860) are in the labor force, with 2.9% or 16 of them being unemployed. The group with the highest labor force participation rate are those with the educational attainment of bachelor's degree or higher, with 84.4% or 76 individuals in the labor force. Within the labor force, individuals with college / associate degree education have the highest percentage of unemployment, with 8.4% or 16 of them being unemployed.
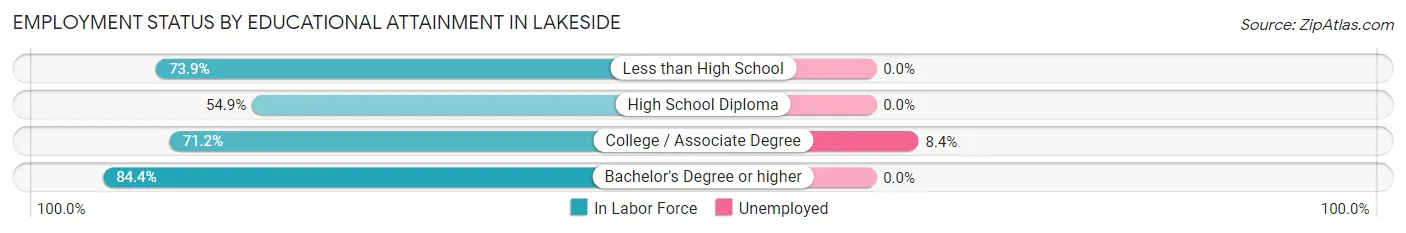
| Educational Attainment | In Labor Force | Unemployed |
| Less than High School | 65 (73.9%) | 0 (0.0%) |
| High School Diploma | 228 (54.9%) | 0 (0.0%) |
| College / Associate Degree | 190 (71.2%) | 22 (8.4%) |
| Bachelor's Degree or higher | 76 (84.4%) | 0 (0.0%) |
| Total | 559 (65.0%) | 25 (2.9%) |
Employment Occupations by Sex in Lakeside
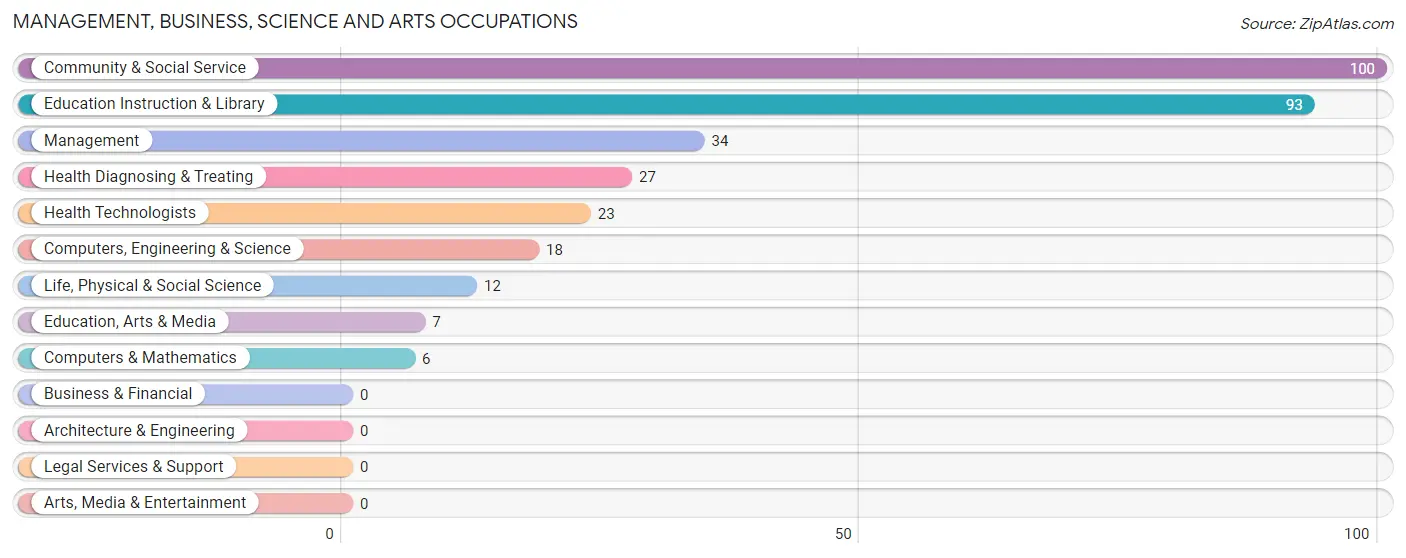
Management, Business, Science and Arts Occupations
The most common Management, Business, Science and Arts occupations in Lakeside are Community & Social Service (100 | 16.9%), Education Instruction & Library (93 | 15.7%), Management (34 | 5.7%), Health Diagnosing & Treating (27 | 4.5%), and Health Technologists (23 | 3.9%).
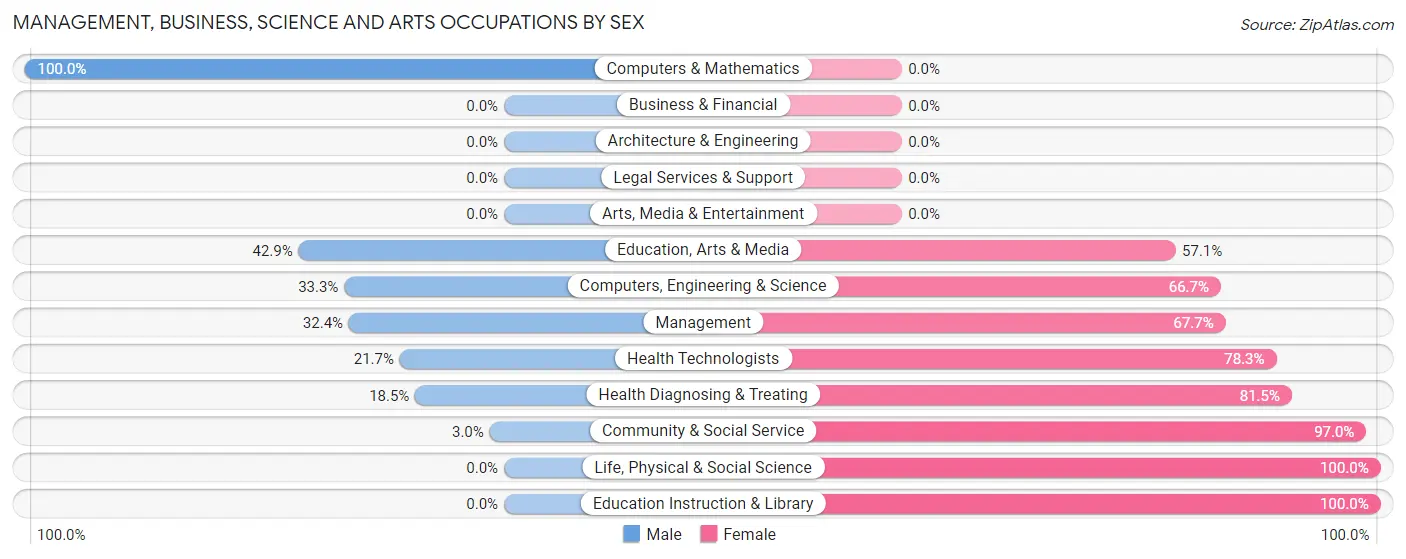
Management, Business, Science and Arts Occupations by Sex
Within the Management, Business, Science and Arts occupations in Lakeside, the most male-oriented occupations are Computers & Mathematics (100.0%), Education, Arts & Media (42.9%), and Computers, Engineering & Science (33.3%), while the most female-oriented occupations are Life, Physical & Social Science (100.0%), Education Instruction & Library (100.0%), and Community & Social Service (97.0%).
| Occupation | Male | Female |
| Management | 11 (32.4%) | 23 (67.6%) |
| Business & Financial | 0 (0.0%) | 0 (0.0%) |
| Computers, Engineering & Science | 6 (33.3%) | 12 (66.7%) |
| Computers & Mathematics | 6 (100.0%) | 0 (0.0%) |
| Architecture & Engineering | 0 (0.0%) | 0 (0.0%) |
| Life, Physical & Social Science | 0 (0.0%) | 12 (100.0%) |
| Community & Social Service | 3 (3.0%) | 97 (97.0%) |
| Education, Arts & Media | 3 (42.9%) | 4 (57.1%) |
| Legal Services & Support | 0 (0.0%) | 0 (0.0%) |
| Education Instruction & Library | 0 (0.0%) | 93 (100.0%) |
| Arts, Media & Entertainment | 0 (0.0%) | 0 (0.0%) |
| Health Diagnosing & Treating | 5 (18.5%) | 22 (81.5%) |
| Health Technologists | 5 (21.7%) | 18 (78.3%) |
| Total (Category) | 25 (14.0%) | 154 (86.0%) |
| Total (Overall) | 238 (40.1%) | 355 (59.9%) |
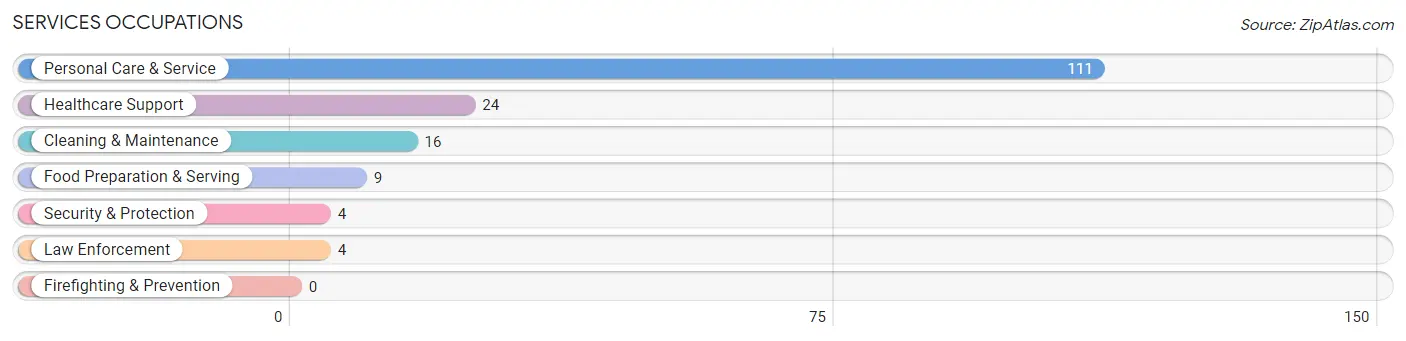
Services Occupations
The most common Services occupations in Lakeside are Personal Care & Service (111 | 18.7%), Healthcare Support (24 | 4.1%), Cleaning & Maintenance (16 | 2.7%), Food Preparation & Serving (9 | 1.5%), and Security & Protection (4 | 0.7%).
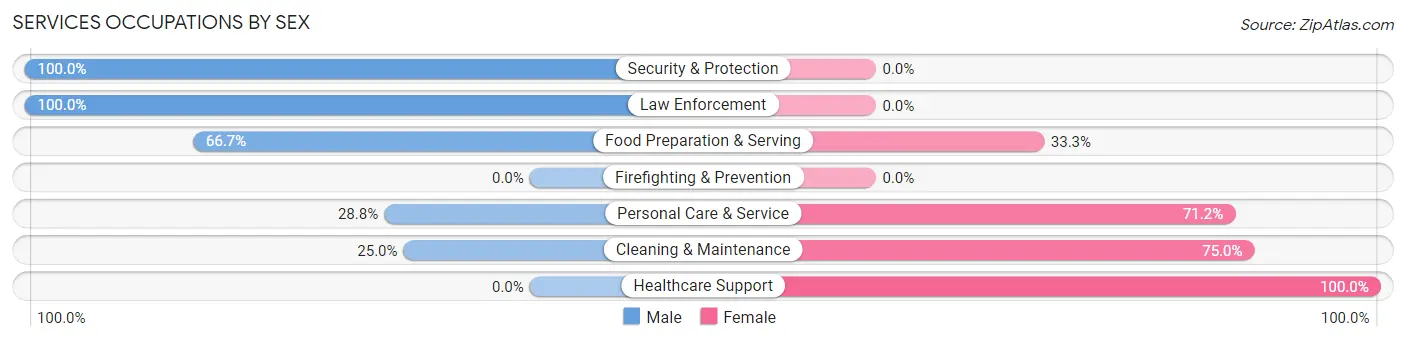
Services Occupations by Sex
Within the Services occupations in Lakeside, the most male-oriented occupations are Security & Protection (100.0%), Law Enforcement (100.0%), and Food Preparation & Serving (66.7%), while the most female-oriented occupations are Healthcare Support (100.0%), Cleaning & Maintenance (75.0%), and Personal Care & Service (71.2%).
| Occupation | Male | Female |
| Healthcare Support | 0 (0.0%) | 24 (100.0%) |
| Security & Protection | 4 (100.0%) | 0 (0.0%) |
| Firefighting & Prevention | 0 (0.0%) | 0 (0.0%) |
| Law Enforcement | 4 (100.0%) | 0 (0.0%) |
| Food Preparation & Serving | 6 (66.7%) | 3 (33.3%) |
| Cleaning & Maintenance | 4 (25.0%) | 12 (75.0%) |
| Personal Care & Service | 32 (28.8%) | 79 (71.2%) |
| Total (Category) | 46 (28.1%) | 118 (72.0%) |
| Total (Overall) | 238 (40.1%) | 355 (59.9%) |
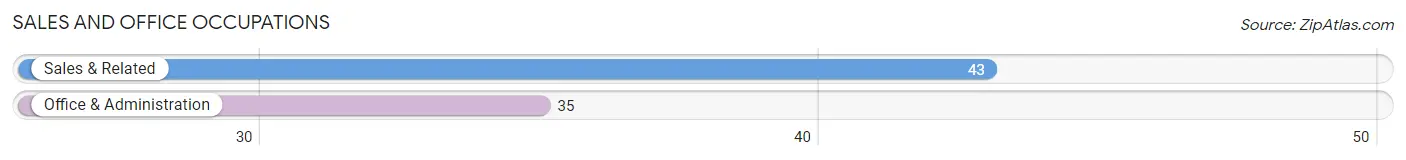
Sales and Office Occupations
The most common Sales and Office occupations in Lakeside are Sales & Related (43 | 7.2%), and Office & Administration (35 | 5.9%).
Sales and Office Occupations by Sex
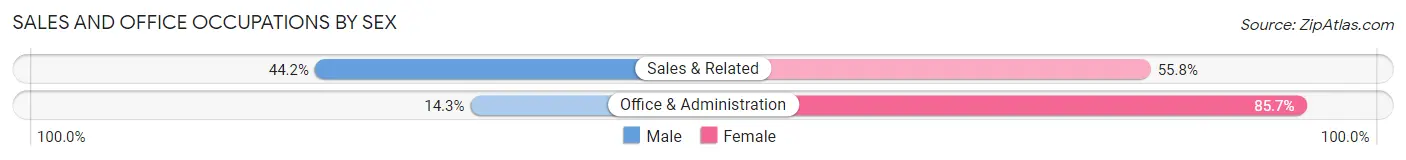
| Occupation | Male | Female |
| Sales & Related | 19 (44.2%) | 24 (55.8%) |
| Office & Administration | 5 (14.3%) | 30 (85.7%) |
| Total (Category) | 24 (30.8%) | 54 (69.2%) |
| Total (Overall) | 238 (40.1%) | 355 (59.9%) |
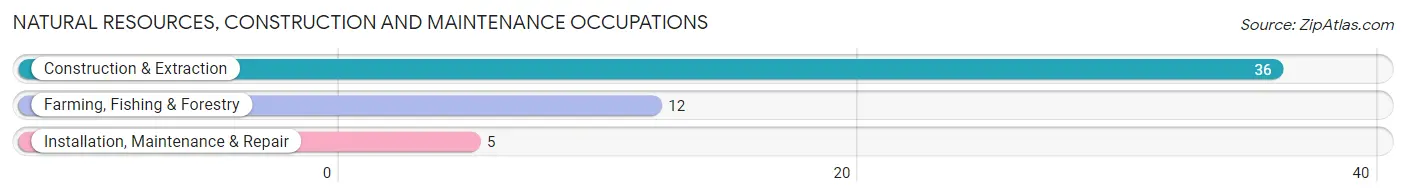
Natural Resources, Construction and Maintenance Occupations
The most common Natural Resources, Construction and Maintenance occupations in Lakeside are Construction & Extraction (36 | 6.1%), Farming, Fishing & Forestry (12 | 2.0%), and Installation, Maintenance & Repair (5 | 0.8%).
Natural Resources, Construction and Maintenance Occupations by Sex
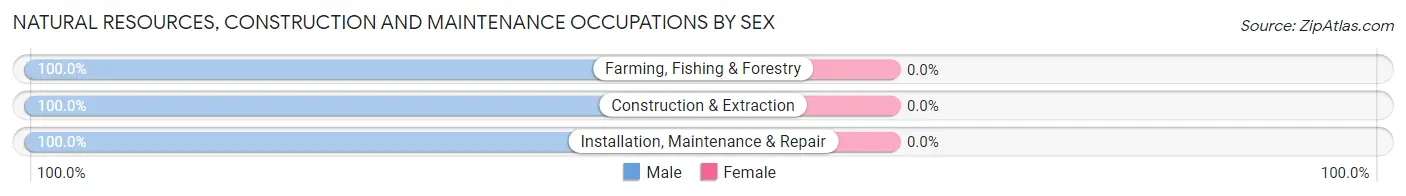
| Occupation | Male | Female |
| Farming, Fishing & Forestry | 12 (100.0%) | 0 (0.0%) |
| Construction & Extraction | 36 (100.0%) | 0 (0.0%) |
| Installation, Maintenance & Repair | 5 (100.0%) | 0 (0.0%) |
| Total (Category) | 53 (100.0%) | 0 (0.0%) |
| Total (Overall) | 238 (40.1%) | 355 (59.9%) |
Production, Transportation and Moving Occupations
The most common Production, Transportation and Moving occupations in Lakeside are Transportation (51 | 8.6%), Production (48 | 8.1%), and Material Moving (20 | 3.4%).
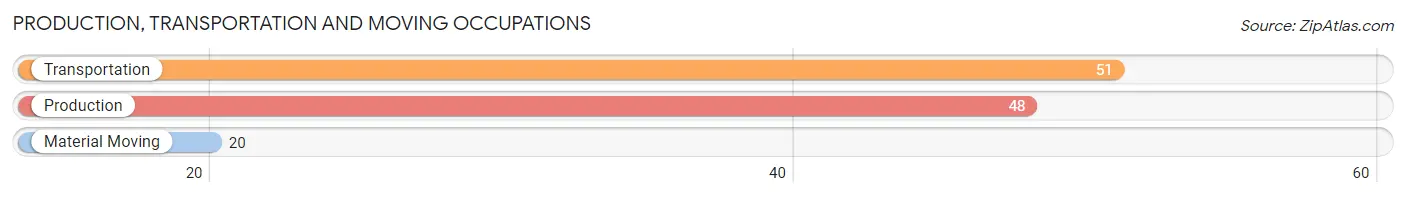
Production, Transportation and Moving Occupations by Sex
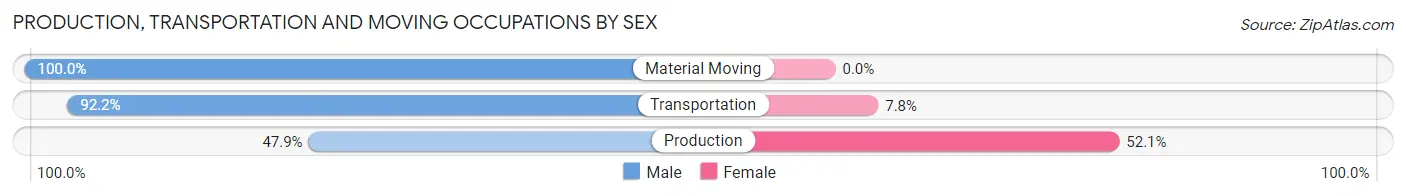
| Occupation | Male | Female |
| Production | 23 (47.9%) | 25 (52.1%) |
| Transportation | 47 (92.2%) | 4 (7.8%) |
| Material Moving | 20 (100.0%) | 0 (0.0%) |
| Total (Category) | 90 (75.6%) | 29 (24.4%) |
| Total (Overall) | 238 (40.1%) | 355 (59.9%) |
Employment Industries by Sex in Lakeside
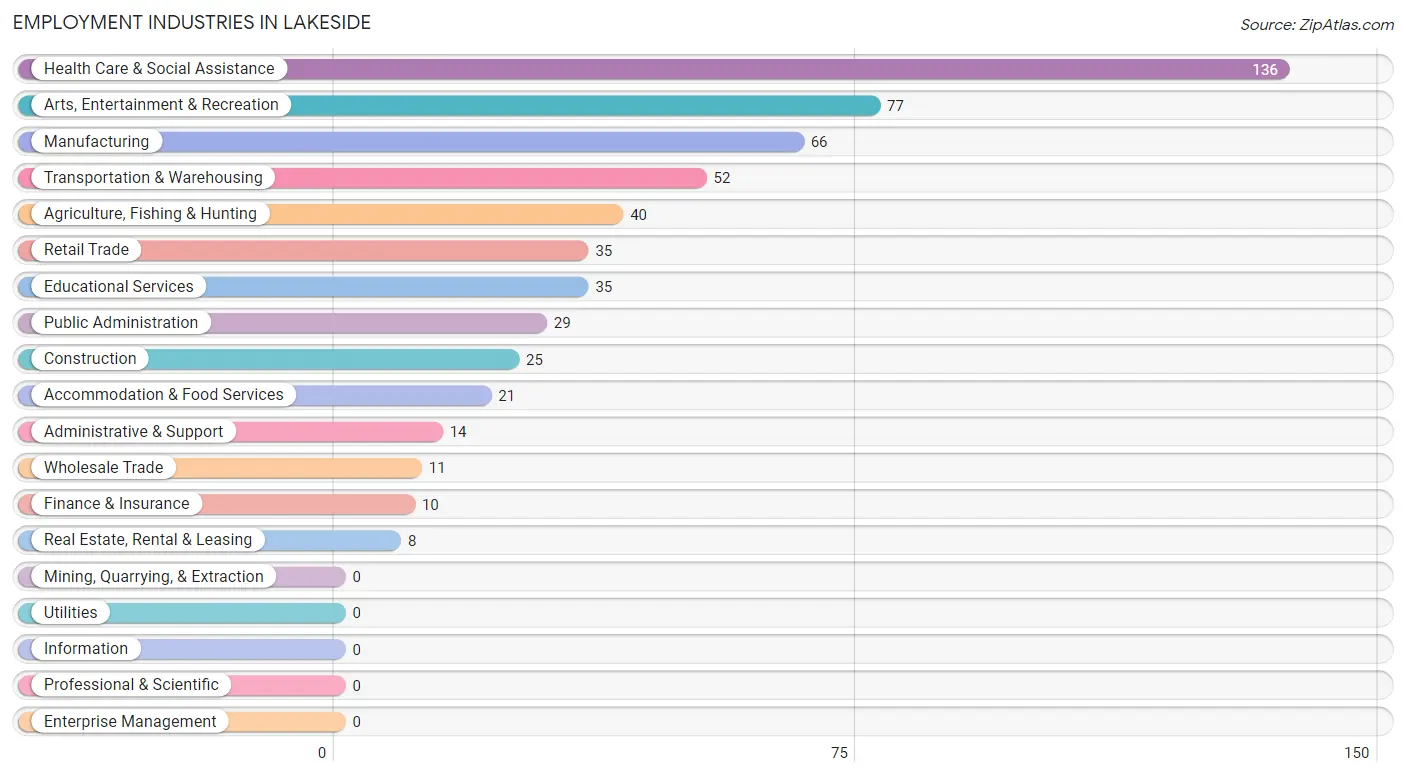
Employment Industries in Lakeside
The major employment industries in Lakeside include Health Care & Social Assistance (136 | 22.9%), Arts, Entertainment & Recreation (77 | 13.0%), Manufacturing (66 | 11.1%), Transportation & Warehousing (52 | 8.8%), and Agriculture, Fishing & Hunting (40 | 6.8%).
Employment Industries by Sex in Lakeside
The Lakeside industries that see more men than women are Agriculture, Fishing & Hunting (100.0%), Transportation & Warehousing (100.0%), and Construction (80.0%), whereas the industries that tend to have a higher number of women are Wholesale Trade (100.0%), Real Estate, Rental & Leasing (100.0%), and Educational Services (100.0%).
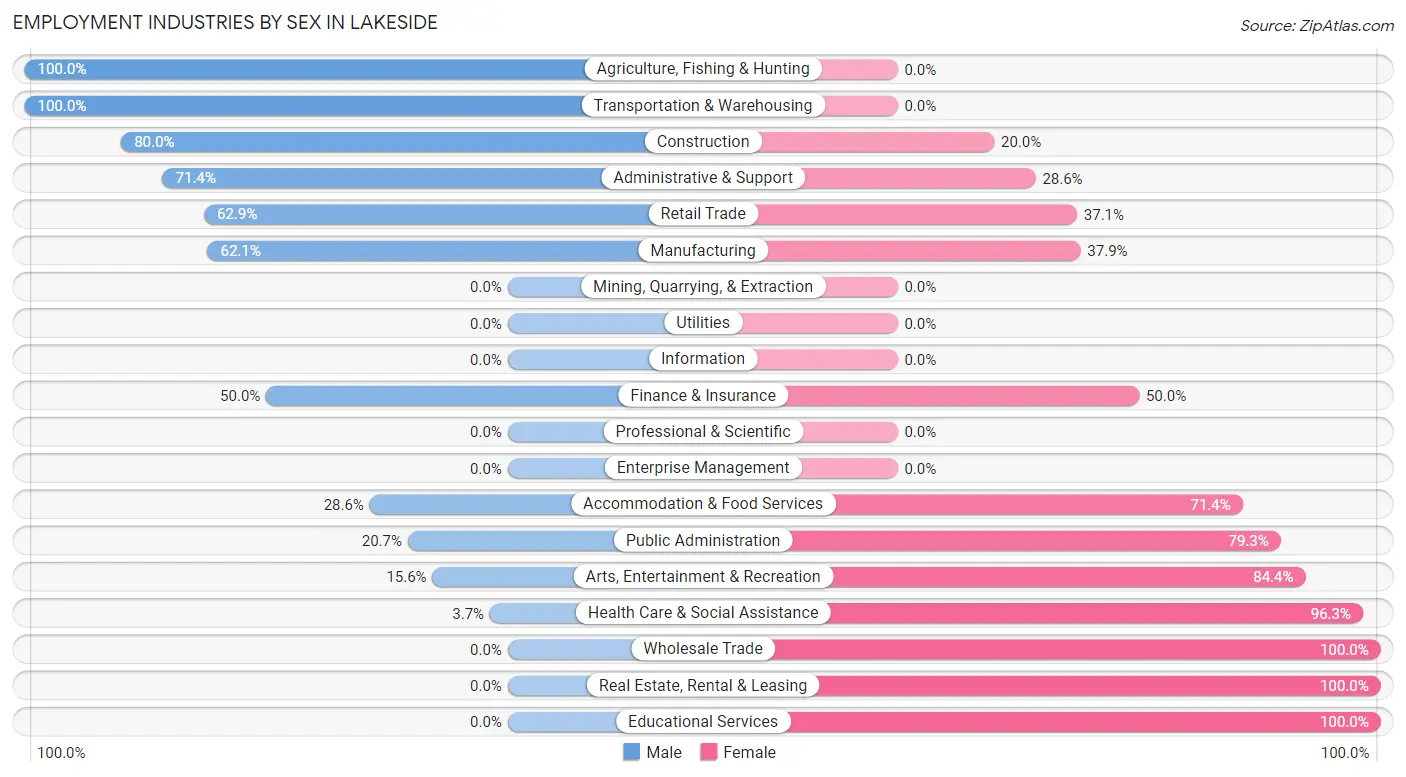
| Industry | Male | Female |
| Agriculture, Fishing & Hunting | 40 (100.0%) | 0 (0.0%) |
| Mining, Quarrying, & Extraction | 0 (0.0%) | 0 (0.0%) |
| Construction | 20 (80.0%) | 5 (20.0%) |
| Manufacturing | 41 (62.1%) | 25 (37.9%) |
| Wholesale Trade | 0 (0.0%) | 11 (100.0%) |
| Retail Trade | 22 (62.9%) | 13 (37.1%) |
| Transportation & Warehousing | 52 (100.0%) | 0 (0.0%) |
| Utilities | 0 (0.0%) | 0 (0.0%) |
| Information | 0 (0.0%) | 0 (0.0%) |
| Finance & Insurance | 5 (50.0%) | 5 (50.0%) |
| Real Estate, Rental & Leasing | 0 (0.0%) | 8 (100.0%) |
| Professional & Scientific | 0 (0.0%) | 0 (0.0%) |
| Enterprise Management | 0 (0.0%) | 0 (0.0%) |
| Administrative & Support | 10 (71.4%) | 4 (28.6%) |
| Educational Services | 0 (0.0%) | 35 (100.0%) |
| Health Care & Social Assistance | 5 (3.7%) | 131 (96.3%) |
| Arts, Entertainment & Recreation | 12 (15.6%) | 65 (84.4%) |
| Accommodation & Food Services | 6 (28.6%) | 15 (71.4%) |
| Public Administration | 6 (20.7%) | 23 (79.3%) |
| Total | 238 (40.1%) | 355 (59.9%) |
Education in Lakeside
School Enrollment in Lakeside
The most common levels of schooling among the 191 students in Lakeside are high school (57 | 29.8%), elementary school (51 | 26.7%), and middle school (46 | 24.1%).
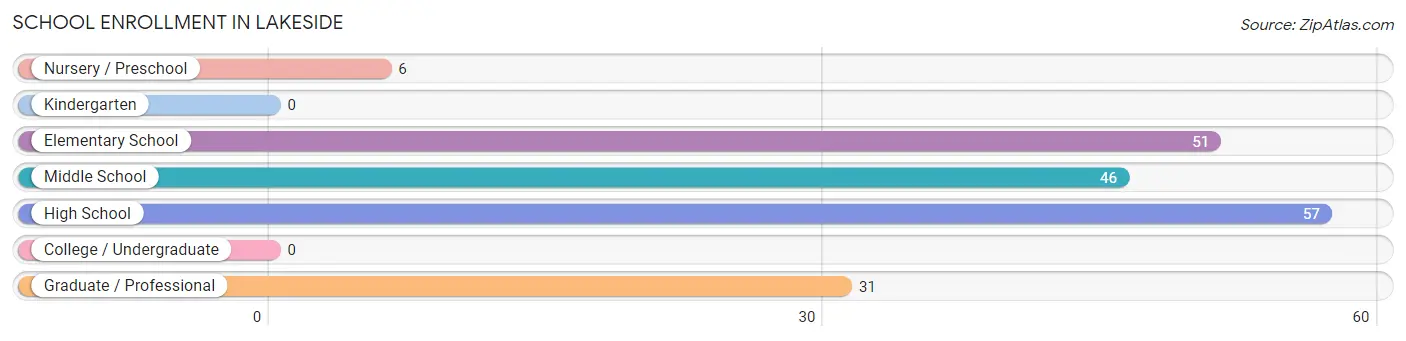
| School Level | # Students | % Students |
| Nursery / Preschool | 6 | 3.1% |
| Kindergarten | 0 | 0.0% |
| Elementary School | 51 | 26.7% |
| Middle School | 46 | 24.1% |
| High School | 57 | 29.8% |
| College / Undergraduate | 0 | 0.0% |
| Graduate / Professional | 31 | 16.2% |
| Total | 191 | 100.0% |
School Enrollment by Age by Funding Source in Lakeside
Out of a total of 191 students who are enrolled in schools in Lakeside, 46 (24.1%) attend a private institution, while the remaining 145 (75.9%) are enrolled in public schools. The age group of 35 years and over has the highest likelihood of being enrolled in private schools, with 31 (100.0% in the age bracket) enrolled. Conversely, the age group of 3 to 4 year olds has the lowest likelihood of being enrolled in a private school, with 6 (100.0% in the age bracket) attending a public institution.
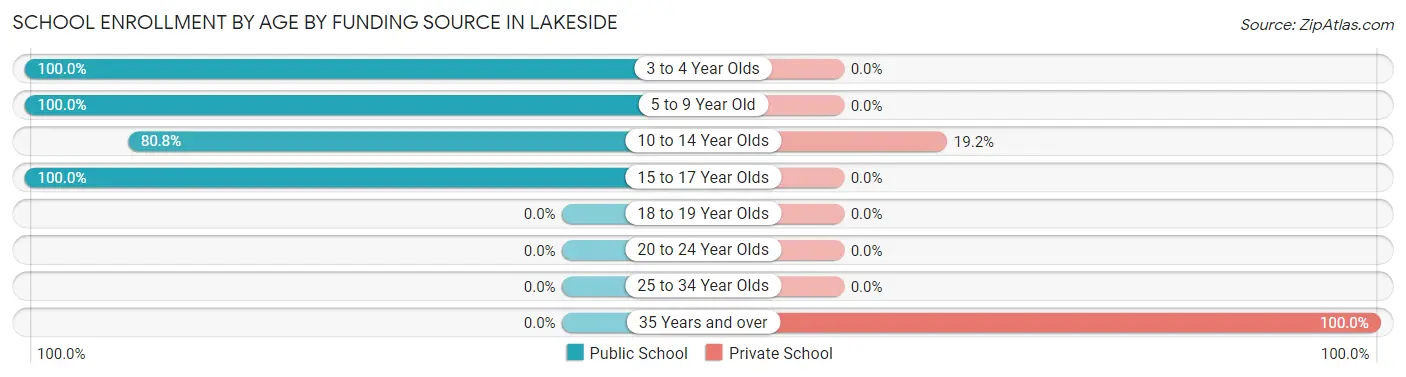
| Age Bracket | Public School | Private School |
| 3 to 4 Year Olds | 6 (100.0%) | 0 (0.0%) |
| 5 to 9 Year Old | 30 (100.0%) | 0 (0.0%) |
| 10 to 14 Year Olds | 63 (80.8%) | 15 (19.2%) |
| 15 to 17 Year Olds | 46 (100.0%) | 0 (0.0%) |
| 18 to 19 Year Olds | 0 (0.0%) | 0 (0.0%) |
| 20 to 24 Year Olds | 0 (0.0%) | 0 (0.0%) |
| 25 to 34 Year Olds | 0 (0.0%) | 0 (0.0%) |
| 35 Years and over | 0 (0.0%) | 31 (100.0%) |
| Total | 145 (75.9%) | 46 (24.1%) |
Educational Attainment by Field of Study in Lakeside
Business (56 | 27.7%), bio, nature & agricultural (36 | 17.8%), liberal arts & history (36 | 17.8%), education (17 | 8.4%), and science & technology (16 | 7.9%) are the most common fields of study among 202 individuals in Lakeside who have obtained a bachelor's degree or higher.
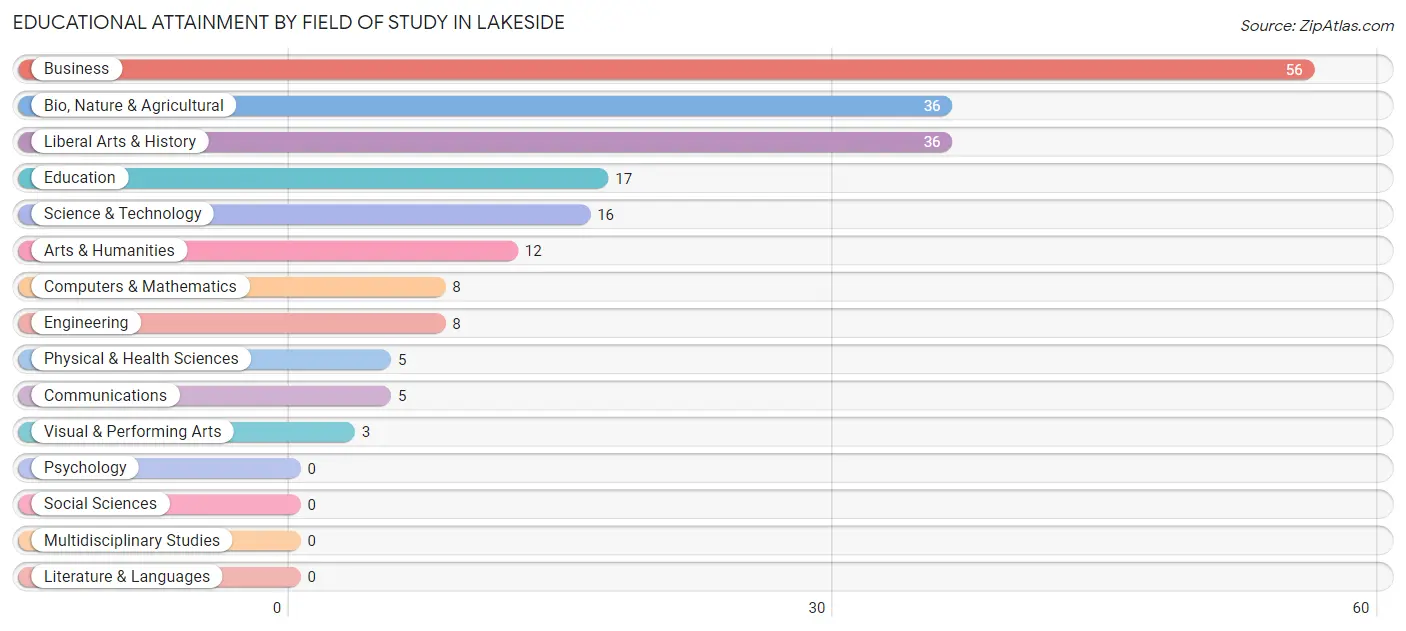
| Field of Study | # Graduates | % Graduates |
| Computers & Mathematics | 8 | 4.0% |
| Bio, Nature & Agricultural | 36 | 17.8% |
| Physical & Health Sciences | 5 | 2.5% |
| Psychology | 0 | 0.0% |
| Social Sciences | 0 | 0.0% |
| Engineering | 8 | 4.0% |
| Multidisciplinary Studies | 0 | 0.0% |
| Science & Technology | 16 | 7.9% |
| Business | 56 | 27.7% |
| Education | 17 | 8.4% |
| Literature & Languages | 0 | 0.0% |
| Liberal Arts & History | 36 | 17.8% |
| Visual & Performing Arts | 3 | 1.5% |
| Communications | 5 | 2.5% |
| Arts & Humanities | 12 | 5.9% |
| Total | 202 | 100.0% |
Transportation & Commute in Lakeside
Vehicle Availability by Sex in Lakeside
The most prevalent vehicle ownership categories in Lakeside are males with 2 vehicles (108, accounting for 45.4%) and females with 2 vehicles (143, making up 32.7%).
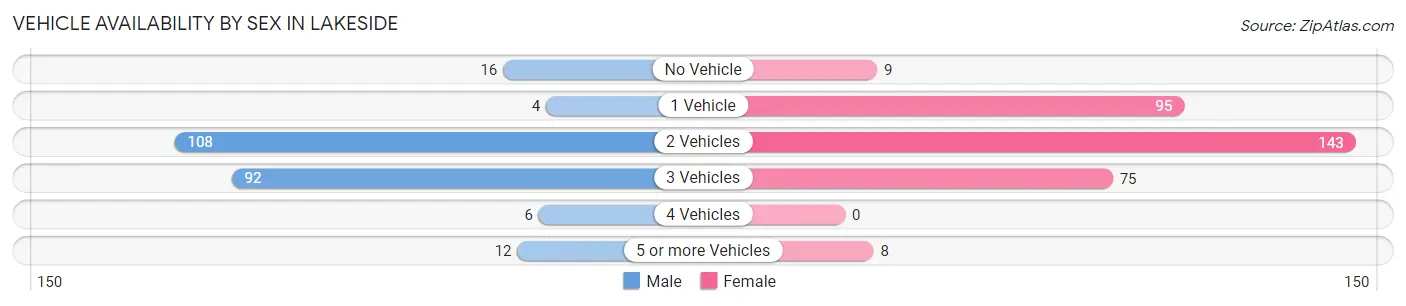
| Vehicles Available | Male | Female |
| No Vehicle | 16 (6.7%) | 9 (2.7%) |
| 1 Vehicle | 4 (1.7%) | 95 (28.8%) |
| 2 Vehicles | 108 (45.4%) | 143 (43.3%) |
| 3 Vehicles | 92 (38.7%) | 75 (22.7%) |
| 4 Vehicles | 6 (2.5%) | 0 (0.0%) |
| 5 or more Vehicles | 12 (5.0%) | 8 (2.4%) |
| Total | 238 (100.0%) | 330 (100.0%) |
Commute Time in Lakeside
The most frequently occuring commute durations in Lakeside are 30 to 34 minutes (174 commuters, 31.6%), 20 to 24 minutes (100 commuters, 18.1%), and 5 to 9 minutes (83 commuters, 15.1%).
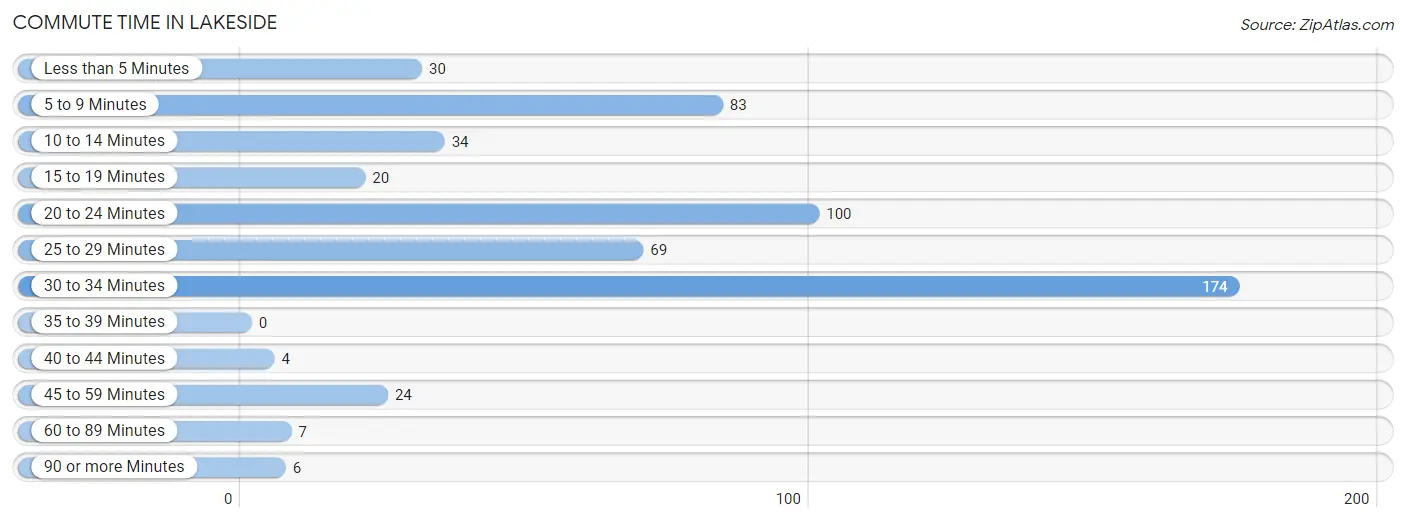
| Commute Time | # Commuters | % Commuters |
| Less than 5 Minutes | 30 | 5.4% |
| 5 to 9 Minutes | 83 | 15.1% |
| 10 to 14 Minutes | 34 | 6.2% |
| 15 to 19 Minutes | 20 | 3.6% |
| 20 to 24 Minutes | 100 | 18.1% |
| 25 to 29 Minutes | 69 | 12.5% |
| 30 to 34 Minutes | 174 | 31.6% |
| 35 to 39 Minutes | 0 | 0.0% |
| 40 to 44 Minutes | 4 | 0.7% |
| 45 to 59 Minutes | 24 | 4.4% |
| 60 to 89 Minutes | 7 | 1.3% |
| 90 or more Minutes | 6 | 1.1% |
Commute Time by Sex in Lakeside
The most common commute times in Lakeside are 30 to 34 minutes (68 commuters, 29.2%) for males and 30 to 34 minutes (106 commuters, 33.3%) for females.
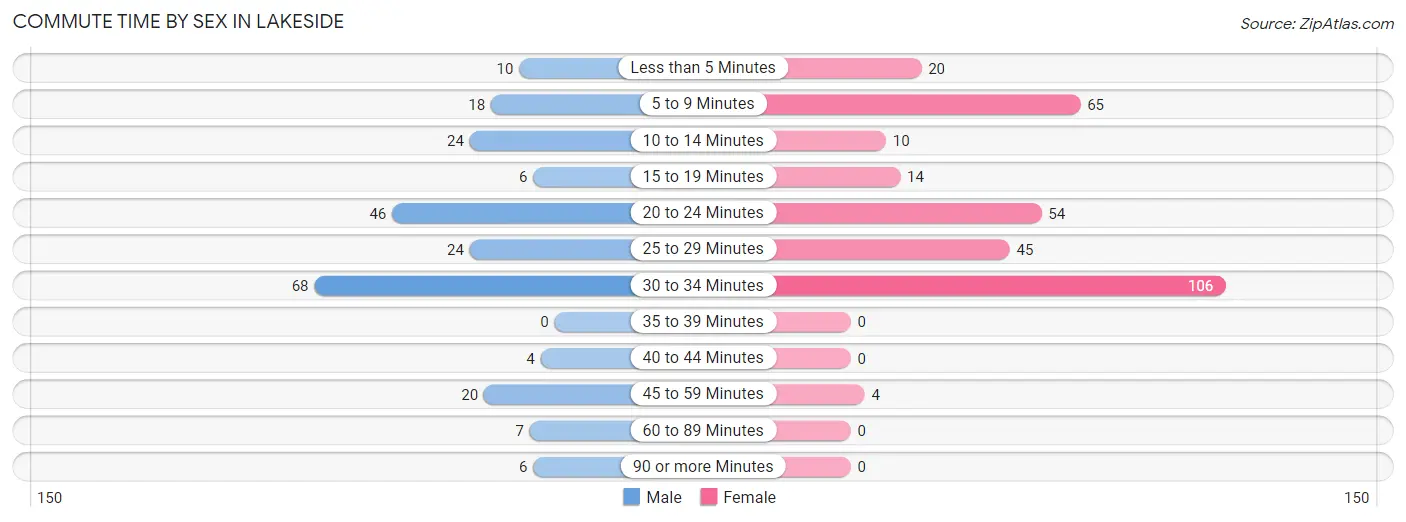
| Commute Time | Male | Female |
| Less than 5 Minutes | 10 (4.3%) | 20 (6.3%) |
| 5 to 9 Minutes | 18 (7.7%) | 65 (20.4%) |
| 10 to 14 Minutes | 24 (10.3%) | 10 (3.1%) |
| 15 to 19 Minutes | 6 (2.6%) | 14 (4.4%) |
| 20 to 24 Minutes | 46 (19.7%) | 54 (17.0%) |
| 25 to 29 Minutes | 24 (10.3%) | 45 (14.1%) |
| 30 to 34 Minutes | 68 (29.2%) | 106 (33.3%) |
| 35 to 39 Minutes | 0 (0.0%) | 0 (0.0%) |
| 40 to 44 Minutes | 4 (1.7%) | 0 (0.0%) |
| 45 to 59 Minutes | 20 (8.6%) | 4 (1.3%) |
| 60 to 89 Minutes | 7 (3.0%) | 0 (0.0%) |
| 90 or more Minutes | 6 (2.6%) | 0 (0.0%) |
Time of Departure to Work by Sex in Lakeside
The most frequent times of departure to work in Lakeside are 7:00 AM to 7:29 AM (91, 39.1%) for males and 9:00 AM to 9:59 AM (97, 30.5%) for females.
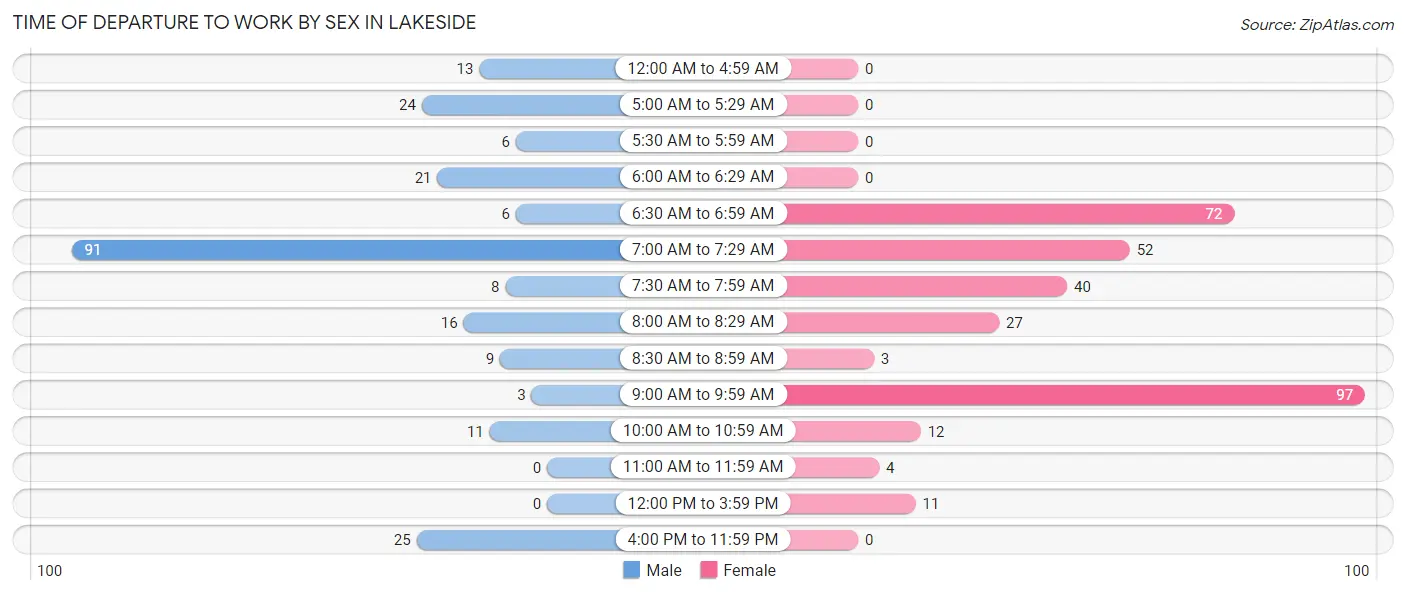
| Time of Departure | Male | Female |
| 12:00 AM to 4:59 AM | 13 (5.6%) | 0 (0.0%) |
| 5:00 AM to 5:29 AM | 24 (10.3%) | 0 (0.0%) |
| 5:30 AM to 5:59 AM | 6 (2.6%) | 0 (0.0%) |
| 6:00 AM to 6:29 AM | 21 (9.0%) | 0 (0.0%) |
| 6:30 AM to 6:59 AM | 6 (2.6%) | 72 (22.6%) |
| 7:00 AM to 7:29 AM | 91 (39.1%) | 52 (16.4%) |
| 7:30 AM to 7:59 AM | 8 (3.4%) | 40 (12.6%) |
| 8:00 AM to 8:29 AM | 16 (6.9%) | 27 (8.5%) |
| 8:30 AM to 8:59 AM | 9 (3.9%) | 3 (0.9%) |
| 9:00 AM to 9:59 AM | 3 (1.3%) | 97 (30.5%) |
| 10:00 AM to 10:59 AM | 11 (4.7%) | 12 (3.8%) |
| 11:00 AM to 11:59 AM | 0 (0.0%) | 4 (1.3%) |
| 12:00 PM to 3:59 PM | 0 (0.0%) | 11 (3.5%) |
| 4:00 PM to 11:59 PM | 25 (10.7%) | 0 (0.0%) |
| Total | 233 (100.0%) | 318 (100.0%) |
Housing Occupancy in Lakeside
Occupancy by Ownership in Lakeside
Of the total 823 dwellings in Lakeside, owner-occupied units account for 668 (81.2%), while renter-occupied units make up 155 (18.8%).
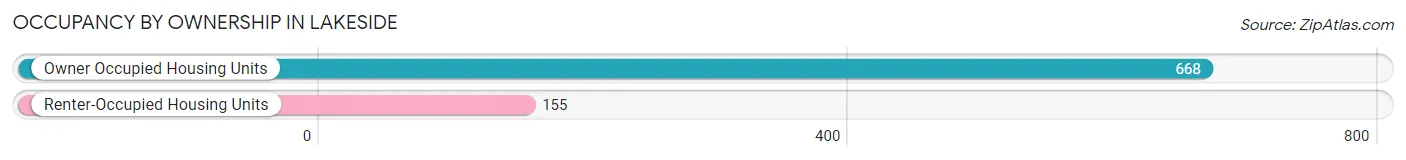
| Occupancy | # Housing Units | % Housing Units |
| Owner Occupied Housing Units | 668 | 81.2% |
| Renter-Occupied Housing Units | 155 | 18.8% |
| Total Occupied Housing Units | 823 | 100.0% |
Occupancy by Household Size in Lakeside
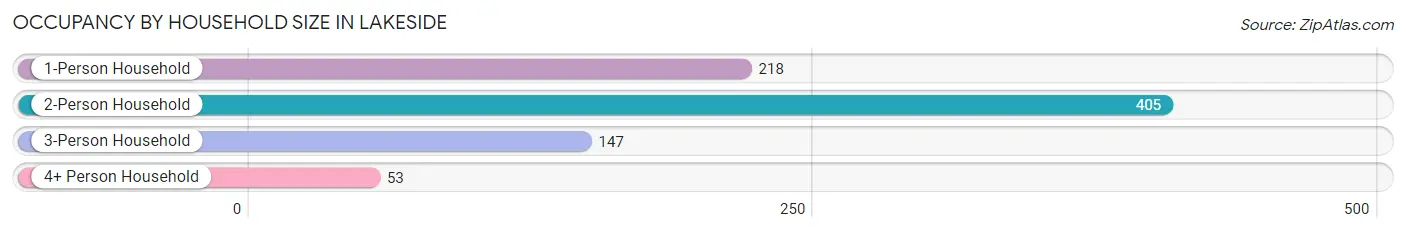
| Household Size | # Housing Units | % Housing Units |
| 1-Person Household | 218 | 26.5% |
| 2-Person Household | 405 | 49.2% |
| 3-Person Household | 147 | 17.9% |
| 4+ Person Household | 53 | 6.4% |
| Total Housing Units | 823 | 100.0% |
Occupancy by Ownership by Household Size in Lakeside
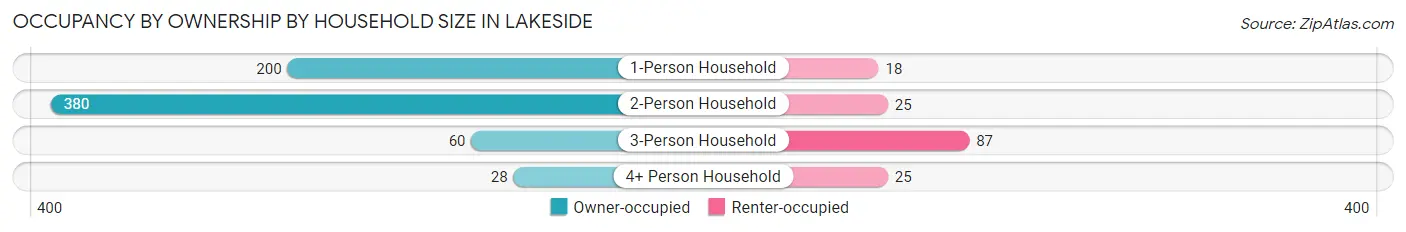
| Household Size | Owner-occupied | Renter-occupied |
| 1-Person Household | 200 (91.7%) | 18 (8.3%) |
| 2-Person Household | 380 (93.8%) | 25 (6.2%) |
| 3-Person Household | 60 (40.8%) | 87 (59.2%) |
| 4+ Person Household | 28 (52.8%) | 25 (47.2%) |
| Total Housing Units | 668 (81.2%) | 155 (18.8%) |
Occupancy by Educational Attainment in Lakeside
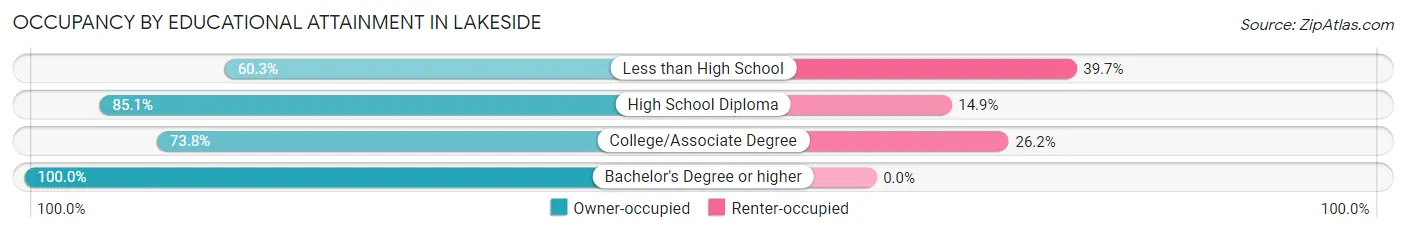
| Household Size | Owner-occupied | Renter-occupied |
| Less than High School | 38 (60.3%) | 25 (39.7%) |
| High School Diploma | 200 (85.1%) | 35 (14.9%) |
| College/Associate Degree | 267 (73.8%) | 95 (26.2%) |
| Bachelor's Degree or higher | 163 (100.0%) | 0 (0.0%) |
Occupancy by Age of Householder in Lakeside
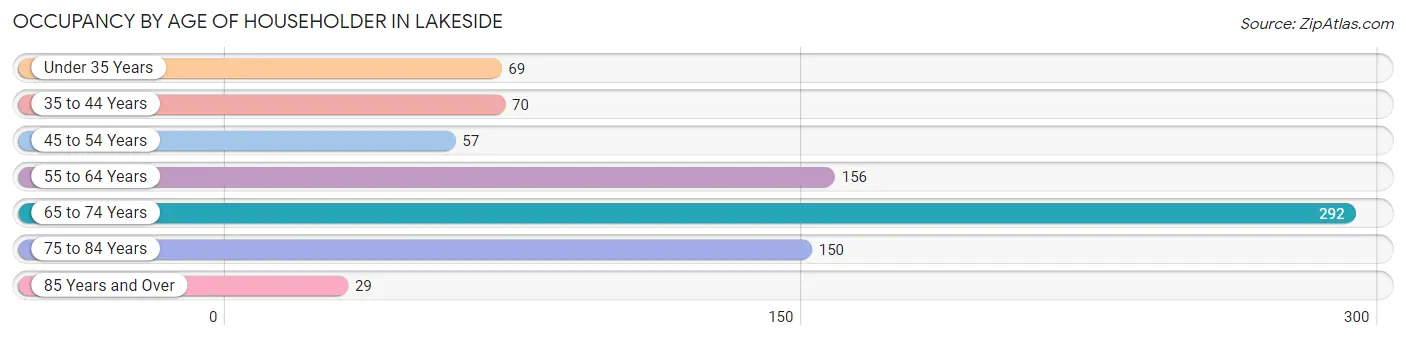
| Age Bracket | # Households | % Households |
| Under 35 Years | 69 | 8.4% |
| 35 to 44 Years | 70 | 8.5% |
| 45 to 54 Years | 57 | 6.9% |
| 55 to 64 Years | 156 | 19.0% |
| 65 to 74 Years | 292 | 35.5% |
| 75 to 84 Years | 150 | 18.2% |
| 85 Years and Over | 29 | 3.5% |
| Total | 823 | 100.0% |
Housing Finances in Lakeside
Median Income by Occupancy in Lakeside
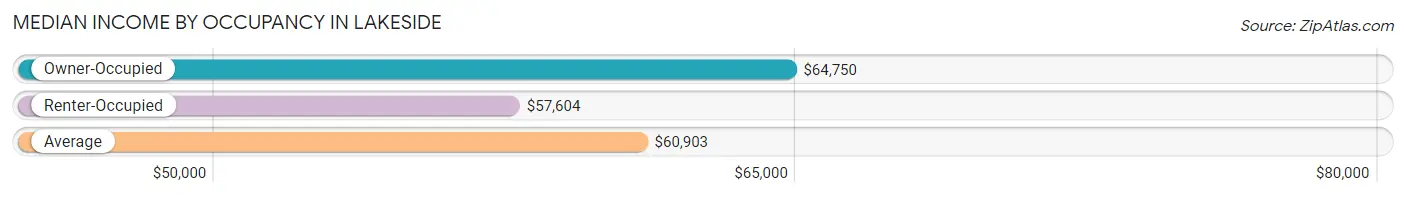
| Occupancy Type | # Households | Median Income |
| Owner-Occupied | 668 (81.2%) | $64,750 |
| Renter-Occupied | 155 (18.8%) | $57,604 |
| Average | 823 (100.0%) | $60,903 |
Occupancy by Householder Income Bracket in Lakeside
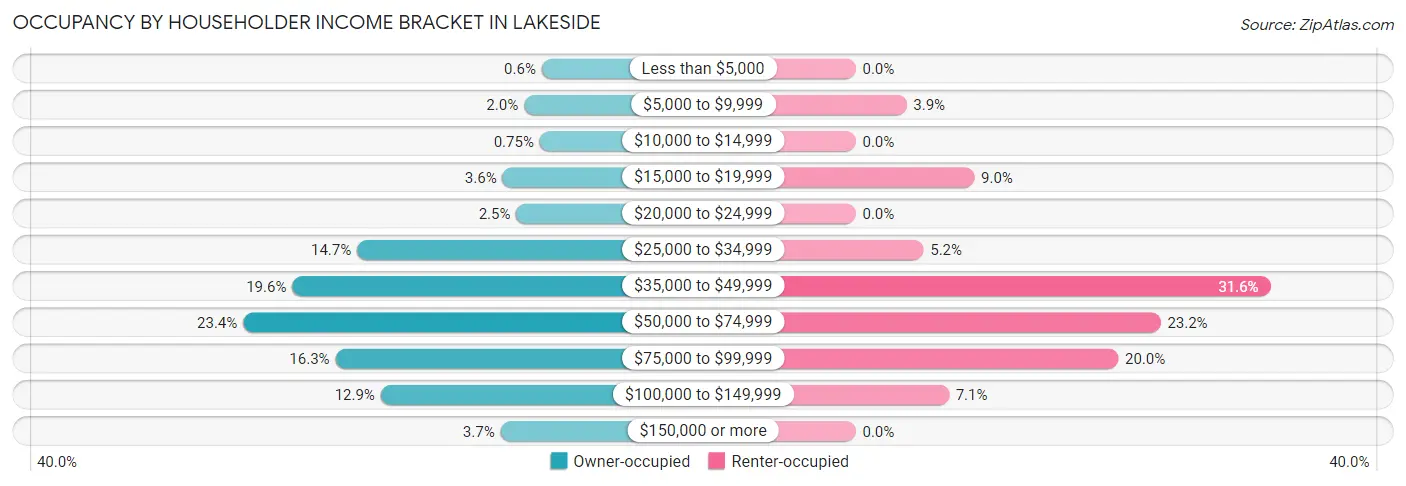
| Income Bracket | Owner-occupied | Renter-occupied |
| Less than $5,000 | 4 (0.6%) | 0 (0.0%) |
| $5,000 to $9,999 | 13 (1.9%) | 6 (3.9%) |
| $10,000 to $14,999 | 5 (0.7%) | 0 (0.0%) |
| $15,000 to $19,999 | 24 (3.6%) | 14 (9.0%) |
| $20,000 to $24,999 | 17 (2.5%) | 0 (0.0%) |
| $25,000 to $34,999 | 98 (14.7%) | 8 (5.2%) |
| $35,000 to $49,999 | 131 (19.6%) | 49 (31.6%) |
| $50,000 to $74,999 | 156 (23.4%) | 36 (23.2%) |
| $75,000 to $99,999 | 109 (16.3%) | 31 (20.0%) |
| $100,000 to $149,999 | 86 (12.9%) | 11 (7.1%) |
| $150,000 or more | 25 (3.7%) | 0 (0.0%) |
| Total | 668 (100.0%) | 155 (100.0%) |
Monthly Housing Cost Tiers in Lakeside
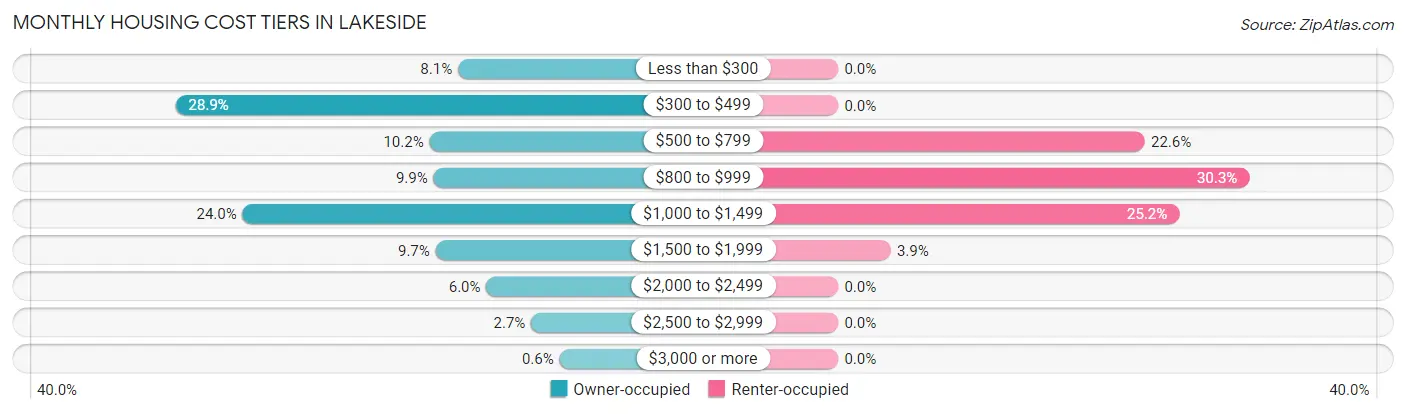
| Monthly Cost | Owner-occupied | Renter-occupied |
| Less than $300 | 54 (8.1%) | 0 (0.0%) |
| $300 to $499 | 193 (28.9%) | 0 (0.0%) |
| $500 to $799 | 68 (10.2%) | 35 (22.6%) |
| $800 to $999 | 66 (9.9%) | 47 (30.3%) |
| $1,000 to $1,499 | 160 (23.9%) | 39 (25.2%) |
| $1,500 to $1,999 | 65 (9.7%) | 6 (3.9%) |
| $2,000 to $2,499 | 40 (6.0%) | 0 (0.0%) |
| $2,500 to $2,999 | 18 (2.7%) | 0 (0.0%) |
| $3,000 or more | 4 (0.6%) | 0 (0.0%) |
| Total | 668 (100.0%) | 155 (100.0%) |
Physical Housing Characteristics in Lakeside
Housing Structures in Lakeside
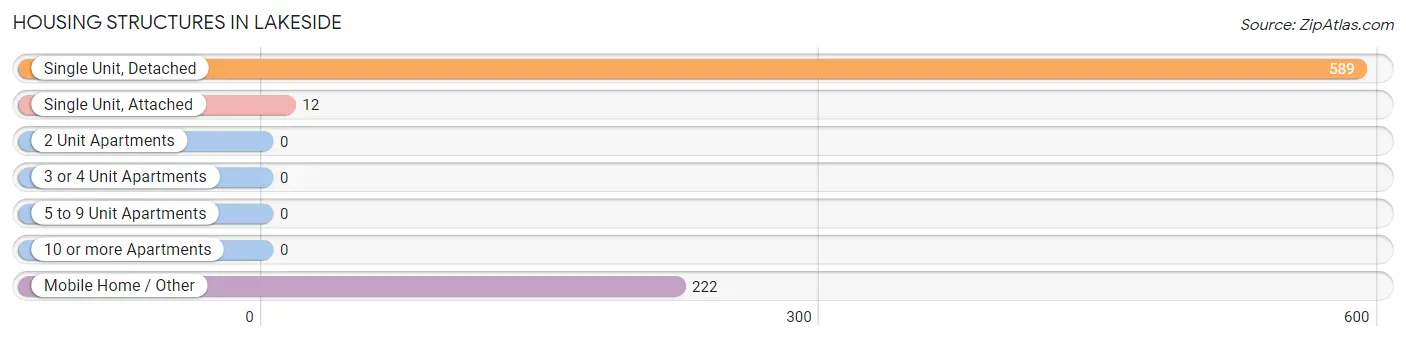
| Structure Type | # Housing Units | % Housing Units |
| Single Unit, Detached | 589 | 71.6% |
| Single Unit, Attached | 12 | 1.5% |
| 2 Unit Apartments | 0 | 0.0% |
| 3 or 4 Unit Apartments | 0 | 0.0% |
| 5 to 9 Unit Apartments | 0 | 0.0% |
| 10 or more Apartments | 0 | 0.0% |
| Mobile Home / Other | 222 | 27.0% |
| Total | 823 | 100.0% |
Housing Structures by Occupancy in Lakeside
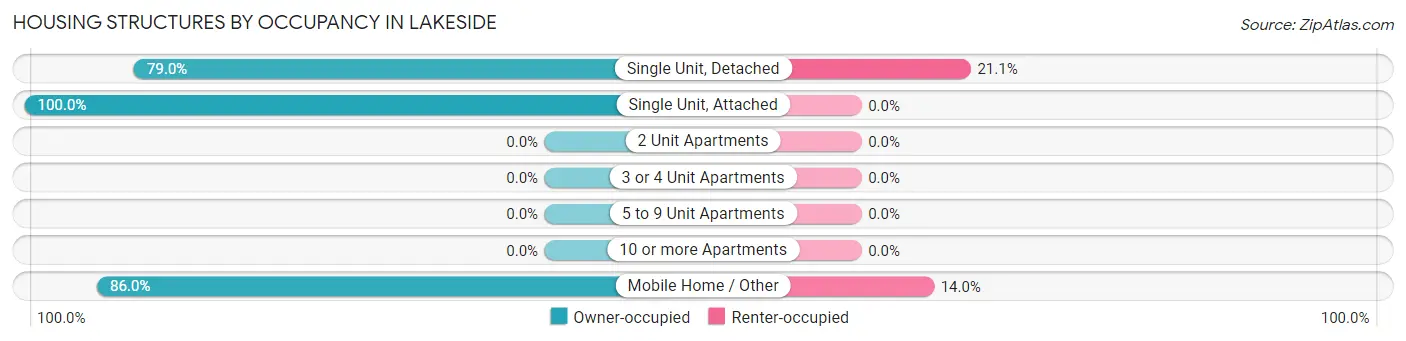
| Structure Type | Owner-occupied | Renter-occupied |
| Single Unit, Detached | 465 (78.9%) | 124 (21.0%) |
| Single Unit, Attached | 12 (100.0%) | 0 (0.0%) |
| 2 Unit Apartments | 0 (0.0%) | 0 (0.0%) |
| 3 or 4 Unit Apartments | 0 (0.0%) | 0 (0.0%) |
| 5 to 9 Unit Apartments | 0 (0.0%) | 0 (0.0%) |
| 10 or more Apartments | 0 (0.0%) | 0 (0.0%) |
| Mobile Home / Other | 191 (86.0%) | 31 (14.0%) |
| Total | 668 (81.2%) | 155 (18.8%) |
Housing Structures by Number of Rooms in Lakeside
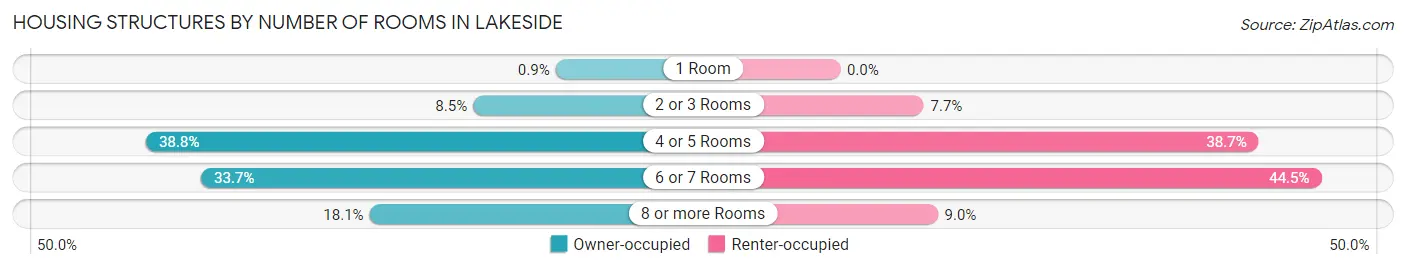
| Number of Rooms | Owner-occupied | Renter-occupied |
| 1 Room | 6 (0.9%) | 0 (0.0%) |
| 2 or 3 Rooms | 57 (8.5%) | 12 (7.7%) |
| 4 or 5 Rooms | 259 (38.8%) | 60 (38.7%) |
| 6 or 7 Rooms | 225 (33.7%) | 69 (44.5%) |
| 8 or more Rooms | 121 (18.1%) | 14 (9.0%) |
| Total | 668 (100.0%) | 155 (100.0%) |
Housing Structure by Heating Type in Lakeside
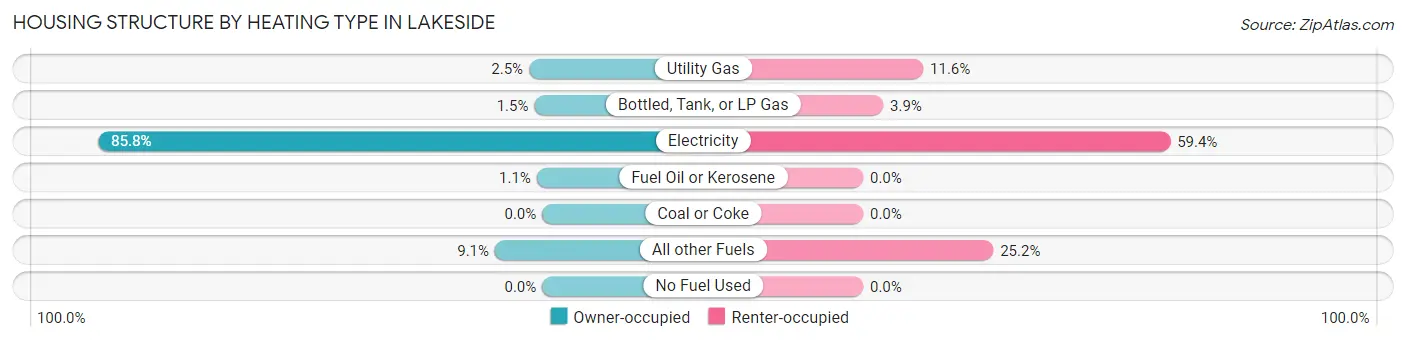
| Heating Type | Owner-occupied | Renter-occupied |
| Utility Gas | 17 (2.5%) | 18 (11.6%) |
| Bottled, Tank, or LP Gas | 10 (1.5%) | 6 (3.9%) |
| Electricity | 573 (85.8%) | 92 (59.4%) |
| Fuel Oil or Kerosene | 7 (1.1%) | 0 (0.0%) |
| Coal or Coke | 0 (0.0%) | 0 (0.0%) |
| All other Fuels | 61 (9.1%) | 39 (25.2%) |
| No Fuel Used | 0 (0.0%) | 0 (0.0%) |
| Total | 668 (100.0%) | 155 (100.0%) |
Household Vehicle Usage in Lakeside
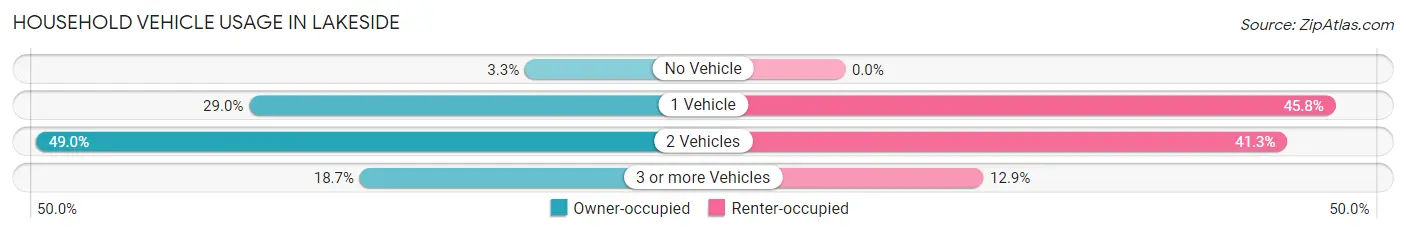
| Vehicles per Household | Owner-occupied | Renter-occupied |
| No Vehicle | 22 (3.3%) | 0 (0.0%) |
| 1 Vehicle | 194 (29.0%) | 71 (45.8%) |
| 2 Vehicles | 327 (48.9%) | 64 (41.3%) |
| 3 or more Vehicles | 125 (18.7%) | 20 (12.9%) |
| Total | 668 (100.0%) | 155 (100.0%) |
Real Estate & Mortgages in Lakeside
Real Estate and Mortgage Overview in Lakeside
| Characteristic | Without Mortgage | With Mortgage |
| Housing Units | 300 | 368 |
| Median Property Value | $214,800 | $268,500 |
| Median Household Income | $56,346 | $23 |
| Monthly Housing Costs | $380 | $4 |
| Real Estate Taxes | $1,492 | $4 |
Property Value by Mortgage Status in Lakeside
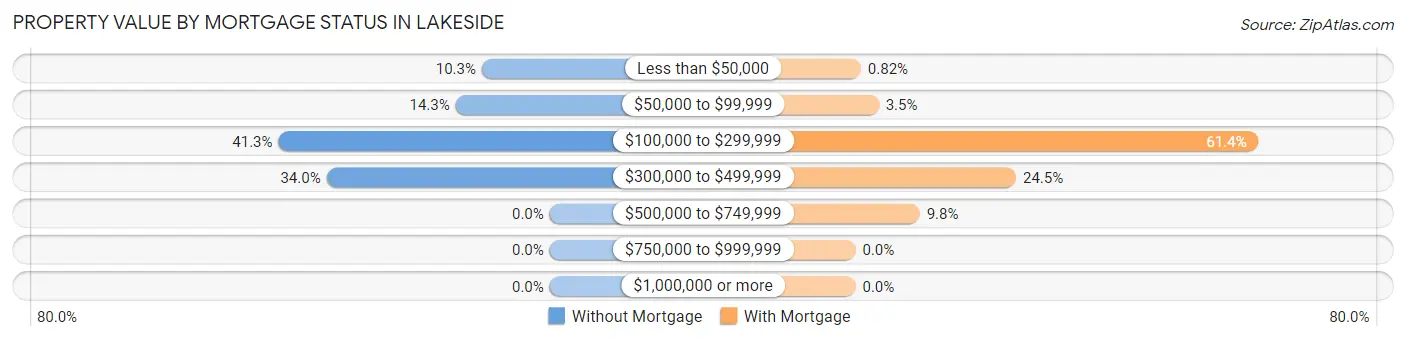
| Property Value | Without Mortgage | With Mortgage |
| Less than $50,000 | 31 (10.3%) | 3 (0.8%) |
| $50,000 to $99,999 | 43 (14.3%) | 13 (3.5%) |
| $100,000 to $299,999 | 124 (41.3%) | 226 (61.4%) |
| $300,000 to $499,999 | 102 (34.0%) | 90 (24.5%) |
| $500,000 to $749,999 | 0 (0.0%) | 36 (9.8%) |
| $750,000 to $999,999 | 0 (0.0%) | 0 (0.0%) |
| $1,000,000 or more | 0 (0.0%) | 0 (0.0%) |
| Total | 300 (100.0%) | 368 (100.0%) |
Household Income by Mortgage Status in Lakeside
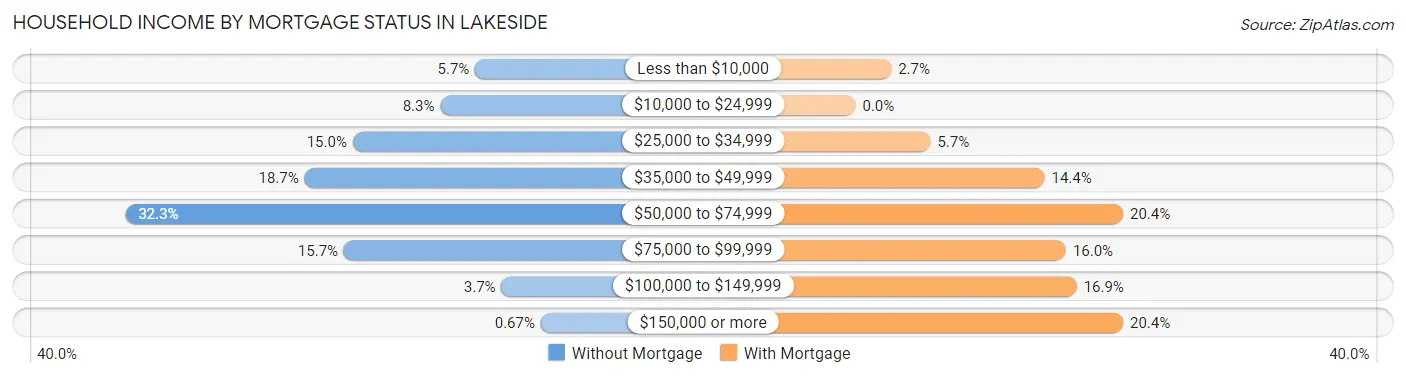
| Household Income | Without Mortgage | With Mortgage |
| Less than $10,000 | 17 (5.7%) | 10 (2.7%) |
| $10,000 to $24,999 | 25 (8.3%) | 0 (0.0%) |
| $25,000 to $34,999 | 45 (15.0%) | 21 (5.7%) |
| $35,000 to $49,999 | 56 (18.7%) | 53 (14.4%) |
| $50,000 to $74,999 | 97 (32.3%) | 75 (20.4%) |
| $75,000 to $99,999 | 47 (15.7%) | 59 (16.0%) |
| $100,000 to $149,999 | 11 (3.7%) | 62 (16.9%) |
| $150,000 or more | 2 (0.7%) | 75 (20.4%) |
| Total | 300 (100.0%) | 368 (100.0%) |
Property Value to Household Income Ratio in Lakeside
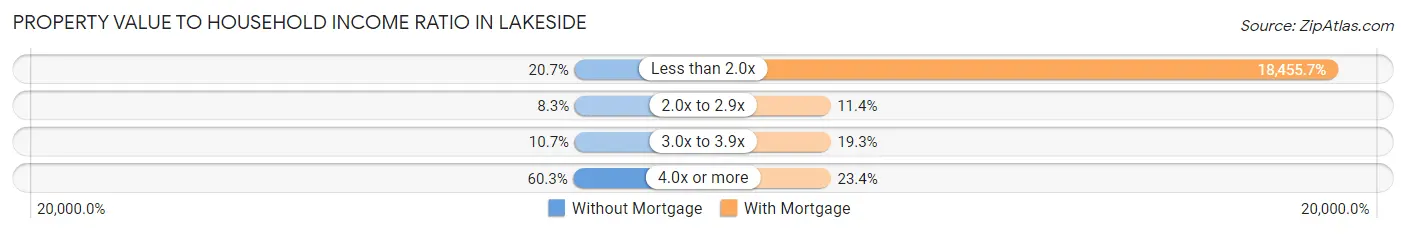
| Value-to-Income Ratio | Without Mortgage | With Mortgage |
| Less than 2.0x | 62 (20.7%) | 67,917 (18,455.7%) |
| 2.0x to 2.9x | 25 (8.3%) | 42 (11.4%) |
| 3.0x to 3.9x | 32 (10.7%) | 71 (19.3%) |
| 4.0x or more | 181 (60.3%) | 86 (23.4%) |
| Total | 300 (100.0%) | 368 (100.0%) |
Real Estate Taxes by Mortgage Status in Lakeside
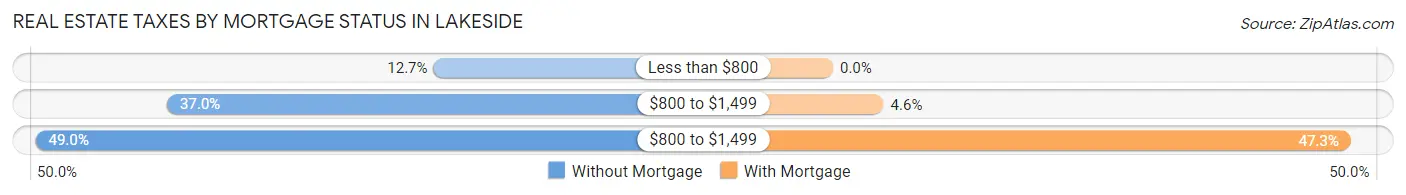
| Property Taxes | Without Mortgage | With Mortgage |
| Less than $800 | 38 (12.7%) | 0 (0.0%) |
| $800 to $1,499 | 111 (37.0%) | 17 (4.6%) |
| $800 to $1,499 | 147 (49.0%) | 174 (47.3%) |
| Total | 300 (100.0%) | 368 (100.0%) |
Health & Disability in Lakeside
Health Insurance Coverage by Age in Lakeside
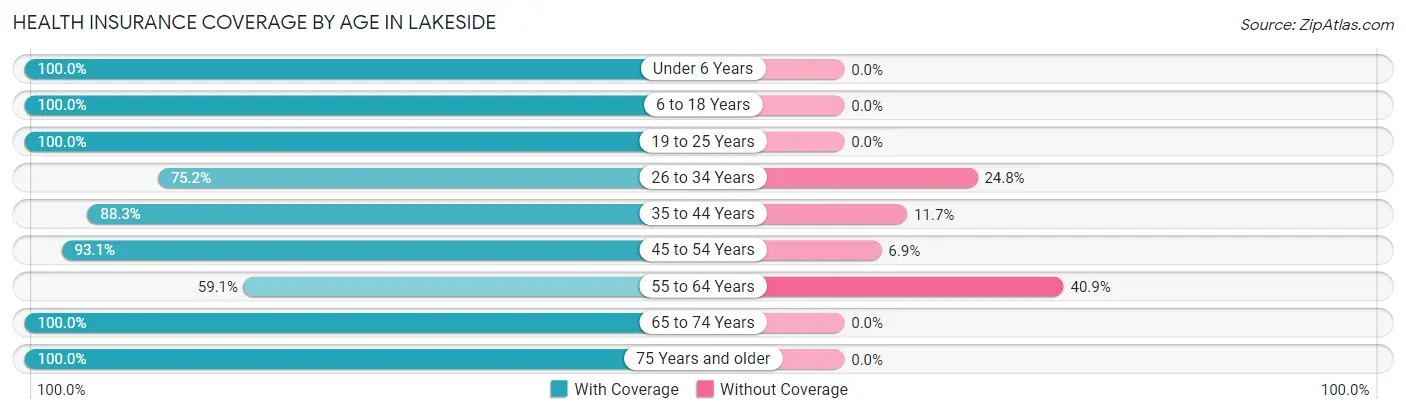
| Age Bracket | With Coverage | Without Coverage |
| Under 6 Years | 64 (100.0%) | 0 (0.0%) |
| 6 to 18 Years | 154 (100.0%) | 0 (0.0%) |
| 19 to 25 Years | 31 (100.0%) | 0 (0.0%) |
| 26 to 34 Years | 109 (75.2%) | 36 (24.8%) |
| 35 to 44 Years | 113 (88.3%) | 15 (11.7%) |
| 45 to 54 Years | 148 (93.1%) | 11 (6.9%) |
| 55 to 64 Years | 253 (59.1%) | 175 (40.9%) |
| 65 to 74 Years | 413 (100.0%) | 0 (0.0%) |
| 75 Years and older | 316 (100.0%) | 0 (0.0%) |
| Total | 1,601 (87.1%) | 237 (12.9%) |
Health Insurance Coverage by Citizenship Status in Lakeside
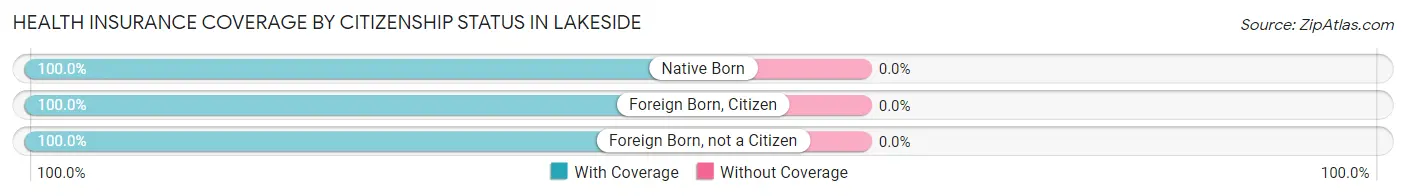
| Citizenship Status | With Coverage | Without Coverage |
| Native Born | 64 (100.0%) | 0 (0.0%) |
| Foreign Born, Citizen | 154 (100.0%) | 0 (0.0%) |
| Foreign Born, not a Citizen | 31 (100.0%) | 0 (0.0%) |
Health Insurance Coverage by Household Income in Lakeside
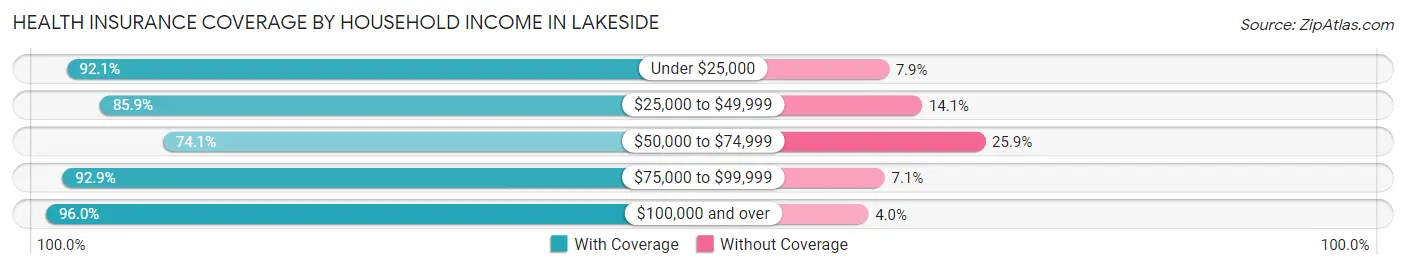
| Household Income | With Coverage | Without Coverage |
| Under $25,000 | 129 (92.1%) | 11 (7.9%) |
| $25,000 to $49,999 | 543 (85.9%) | 89 (14.1%) |
| $50,000 to $74,999 | 286 (74.1%) | 100 (25.9%) |
| $75,000 to $99,999 | 315 (92.9%) | 24 (7.1%) |
| $100,000 and over | 311 (96.0%) | 13 (4.0%) |
Public vs Private Health Insurance Coverage by Age in Lakeside
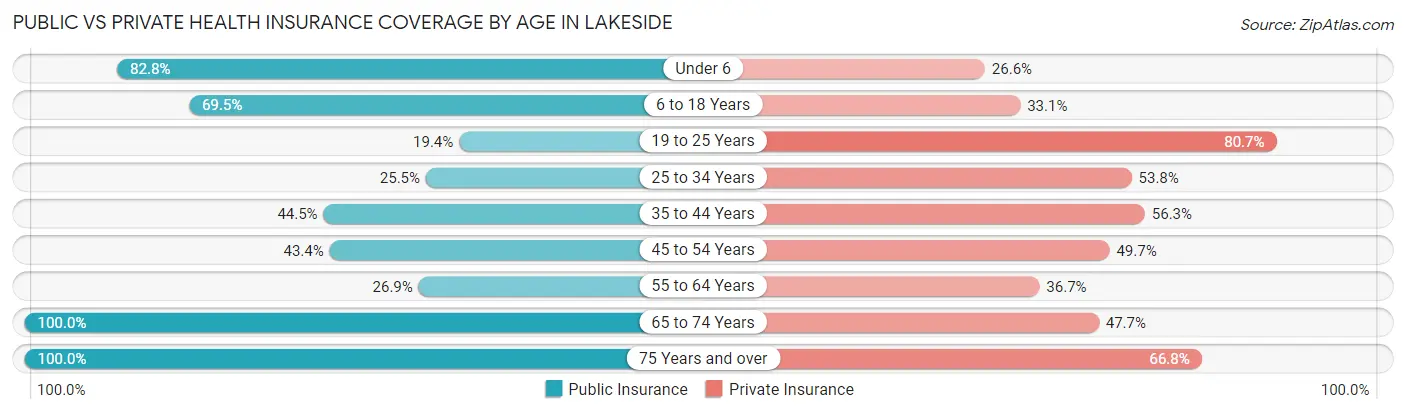
| Age Bracket | Public Insurance | Private Insurance |
| Under 6 | 53 (82.8%) | 17 (26.6%) |
| 6 to 18 Years | 107 (69.5%) | 51 (33.1%) |
| 19 to 25 Years | 6 (19.4%) | 25 (80.6%) |
| 25 to 34 Years | 37 (25.5%) | 78 (53.8%) |
| 35 to 44 Years | 57 (44.5%) | 72 (56.2%) |
| 45 to 54 Years | 69 (43.4%) | 79 (49.7%) |
| 55 to 64 Years | 115 (26.9%) | 157 (36.7%) |
| 65 to 74 Years | 413 (100.0%) | 197 (47.7%) |
| 75 Years and over | 316 (100.0%) | 211 (66.8%) |
| Total | 1,173 (63.8%) | 887 (48.3%) |
Disability Status by Sex by Age in Lakeside
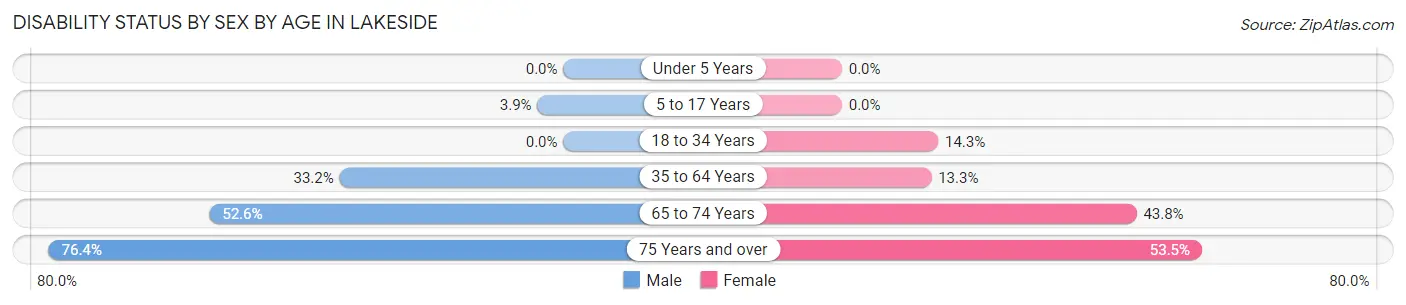
| Age Bracket | Male | Female |
| Under 5 Years | 0 (0.0%) | 0 (0.0%) |
| 5 to 17 Years | 3 (3.8%) | 0 (0.0%) |
| 18 to 34 Years | 0 (0.0%) | 11 (14.3%) |
| 35 to 64 Years | 105 (33.2%) | 53 (13.3%) |
| 65 to 74 Years | 133 (52.6%) | 70 (43.8%) |
| 75 Years and over | 120 (76.4%) | 85 (53.5%) |
Disability Class by Sex by Age in Lakeside
Disability Class: Hearing Difficulty
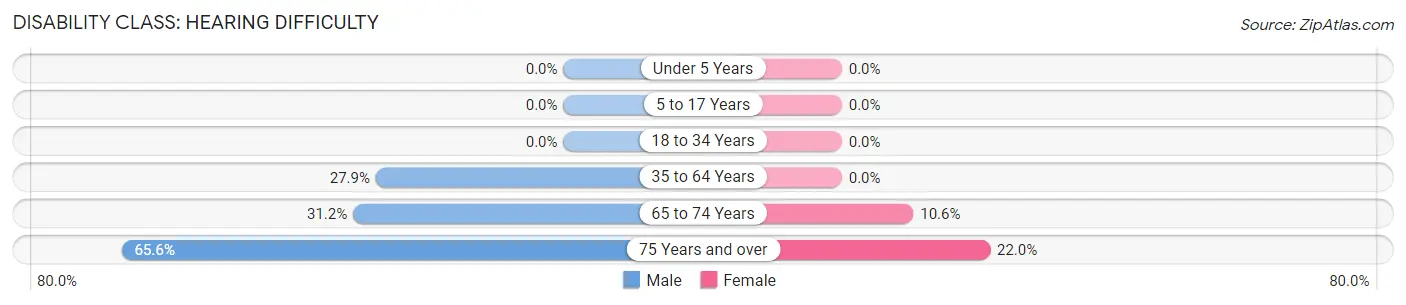
| Age Bracket | Male | Female |
| Under 5 Years | 0 (0.0%) | 0 (0.0%) |
| 5 to 17 Years | 0 (0.0%) | 0 (0.0%) |
| 18 to 34 Years | 0 (0.0%) | 0 (0.0%) |
| 35 to 64 Years | 88 (27.9%) | 0 (0.0%) |
| 65 to 74 Years | 79 (31.2%) | 17 (10.6%) |
| 75 Years and over | 103 (65.6%) | 35 (22.0%) |
Disability Class: Vision Difficulty
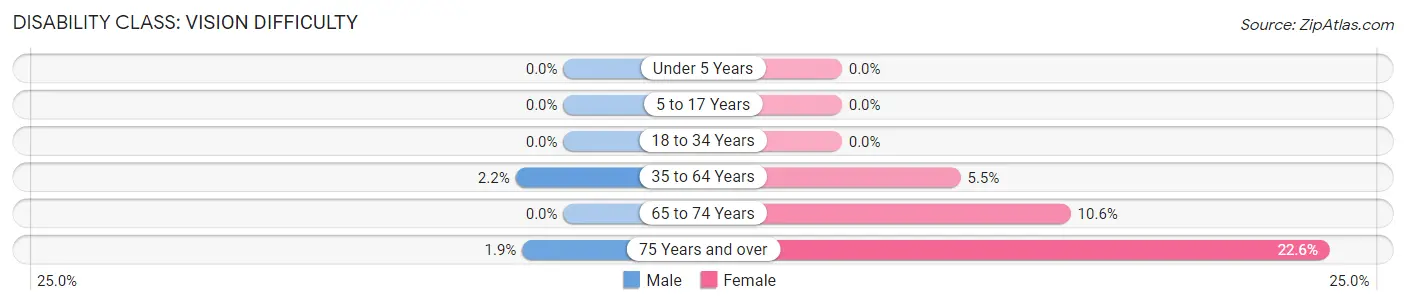
| Age Bracket | Male | Female |
| Under 5 Years | 0 (0.0%) | 0 (0.0%) |
| 5 to 17 Years | 0 (0.0%) | 0 (0.0%) |
| 18 to 34 Years | 0 (0.0%) | 0 (0.0%) |
| 35 to 64 Years | 7 (2.2%) | 22 (5.5%) |
| 65 to 74 Years | 0 (0.0%) | 17 (10.6%) |
| 75 Years and over | 3 (1.9%) | 36 (22.6%) |
Disability Class: Cognitive Difficulty
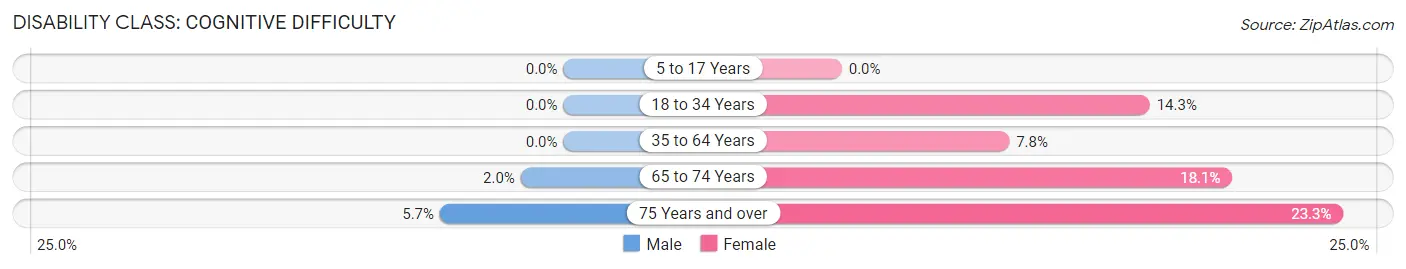
| Age Bracket | Male | Female |
| 5 to 17 Years | 0 (0.0%) | 0 (0.0%) |
| 18 to 34 Years | 0 (0.0%) | 11 (14.3%) |
| 35 to 64 Years | 0 (0.0%) | 31 (7.8%) |
| 65 to 74 Years | 5 (2.0%) | 29 (18.1%) |
| 75 Years and over | 9 (5.7%) | 37 (23.3%) |
Disability Class: Ambulatory Difficulty
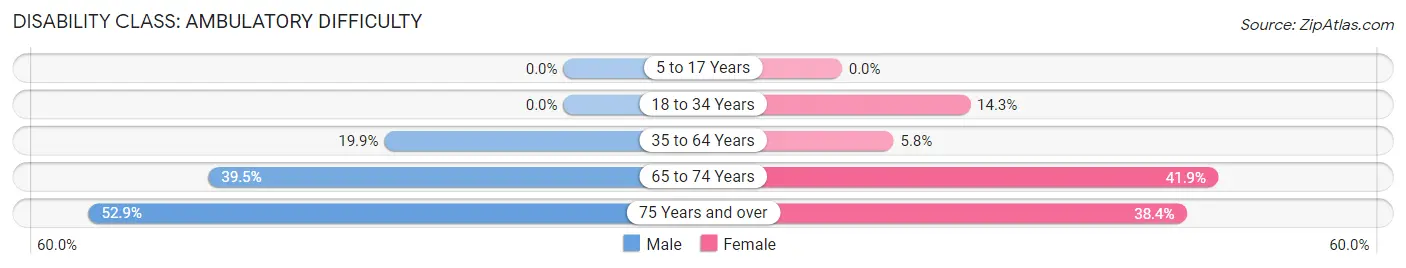
| Age Bracket | Male | Female |
| 5 to 17 Years | 0 (0.0%) | 0 (0.0%) |
| 18 to 34 Years | 0 (0.0%) | 11 (14.3%) |
| 35 to 64 Years | 63 (19.9%) | 23 (5.8%) |
| 65 to 74 Years | 100 (39.5%) | 67 (41.9%) |
| 75 Years and over | 83 (52.9%) | 61 (38.4%) |
Disability Class: Self-Care Difficulty
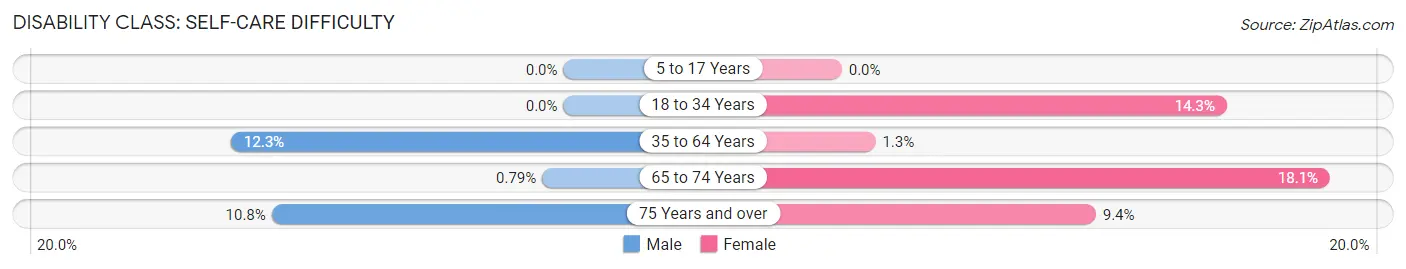
| Age Bracket | Male | Female |
| 5 to 17 Years | 0 (0.0%) | 0 (0.0%) |
| 18 to 34 Years | 0 (0.0%) | 11 (14.3%) |
| 35 to 64 Years | 39 (12.3%) | 5 (1.3%) |
| 65 to 74 Years | 2 (0.8%) | 29 (18.1%) |
| 75 Years and over | 17 (10.8%) | 15 (9.4%) |
Technology Access in Lakeside
Computing Device Access in Lakeside
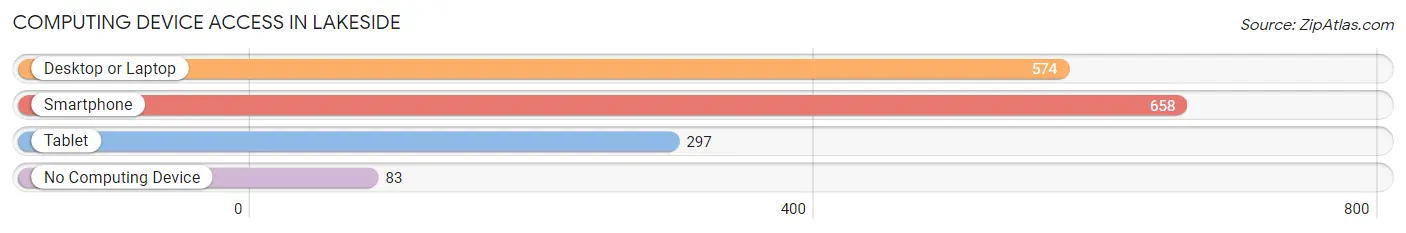
| Device Type | # Households | % Households |
| Desktop or Laptop | 574 | 69.7% |
| Smartphone | 658 | 79.9% |
| Tablet | 297 | 36.1% |
| No Computing Device | 83 | 10.1% |
| Total | 823 | 100.0% |
Internet Access in Lakeside
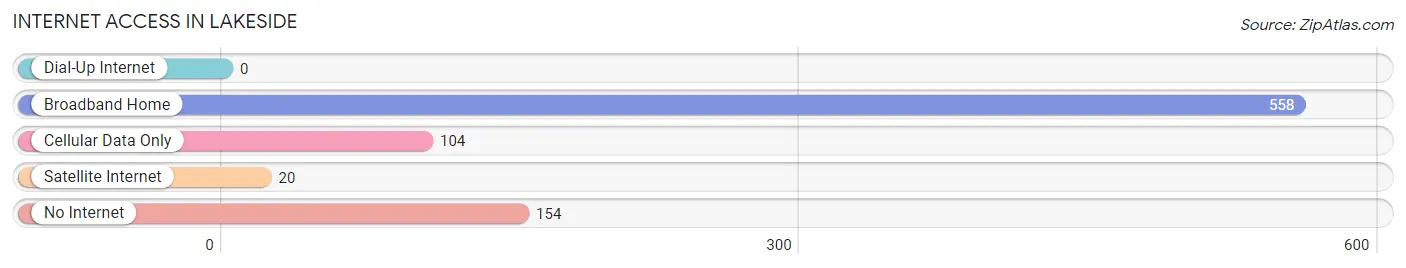
| Internet Type | # Households | % Households |
| Dial-Up Internet | 0 | 0.0% |
| Broadband Home | 558 | 67.8% |
| Cellular Data Only | 104 | 12.6% |
| Satellite Internet | 20 | 2.4% |
| No Internet | 154 | 18.7% |
| Total | 823 | 100.0% |
Lakeside Summary
Lakeside is a small city located in Coos County, Oregon, United States. It is situated on the south shore of Tenmile Lake, approximately 10 miles (16 km) east of Coos Bay. The population was 1,845 at the 2010 census.
History
The area around Lakeside was first inhabited by the Coos Indians, who lived in the area for thousands of years before the arrival of European settlers. The first European settlers arrived in the area in the late 1800s, and the town of Lakeside was officially incorporated in 1909.
The town was named for its location on the shores of Tenmile Lake, which was originally known as Lake Side. The lake was later renamed Tenmile Lake in honor of the Tenmile Creek, which flows into the lake.
The town of Lakeside was originally a logging and fishing community, and the local economy was largely based on these industries. In the early 1900s, the town was also home to a number of sawmills and shingle mills.
In the 1950s, the town began to transition away from its reliance on logging and fishing, and began to focus more on tourism. The town was home to a number of resorts and vacation homes, and the local economy began to shift towards tourism and recreation.
Geography
Lakeside is located at the southern end of Tenmile Lake, approximately 10 miles (16 km) east of Coos Bay. The city is situated on the south shore of the lake, and is surrounded by the Siuslaw National Forest.
The city has a total area of 1.3 square miles (3.4 km2), all of which is land. The city is located at an elevation of approximately 20 feet (6 m) above sea level.
Economy
The economy of Lakeside is largely based on tourism and recreation. The city is home to a number of resorts and vacation homes, and the local economy is heavily reliant on these industries.
The city is also home to a number of small businesses, including restaurants, retail stores, and other services. The city is also home to a number of marinas, which provide access to Tenmile Lake for fishing and other recreational activities.
Demographics
As of the 2010 census, there were 1,845 people, 745 households, and 486 families residing in the city. The population density was 1,417.3 people per square mile (546.2/km2). There were 817 housing units at an average density of 622.3 per square mile (239.9/km2).
The racial makeup of the city was 94.2% White, 0.3% African American, 1.2% Native American, 0.7% Asian, 0.1% Pacific Islander, 0.7% from other races, and 2.9% from two or more races. Hispanic or Latino of any race were 3.2% of the population.
There were 745 households, out of which 28.2% had children under the age of 18 living with them, 48.2% were married couples living together, 11.2% had a female householder with no husband present, and 35.2% were non-families. 28.7% of all households were made up of individuals, and 11.2% had someone living alone who was 65 years of age or older. The average household size was 2.45 and the average family size was 2.97.
In the city, the population was spread out, with 24.2% under the age of 18, 7.2% from 18 to 24, 24.2% from 25 to 44, 28.2% from 45 to 64, and 16.2% who were 65 years of age or older. The median age was 41 years. For every 100 females, there were 97.2 males. For every 100 females age 18 and over, there were 94.2 males.
The median income for a household in the city was $35,938, and the median income for a family was $41,250. Males had a median income of $31,250 versus $22,500 for females. The per capita income for the city was $17,945. About 10.2% of families and 13.2% of the population were below the poverty line, including 17.2% of those under age 18 and 8.2% of those age 65 or over.
Common Questions
What is Per Capita Income in Lakeside?
Per Capita income in Lakeside is $30,927.
What is the Median Family Income in Lakeside?
Median Family Income in Lakeside is $70,962.
What is the Median Household income in Lakeside?
Median Household Income in Lakeside is $60,903.
What is Income or Wage Gap in Lakeside?
Income or Wage Gap in Lakeside is 51.0%.
Women in Lakeside earn 49.0 cents for every dollar earned by a man.
What is Family Income Deficit in Lakeside?
Family Income Deficit in Lakeside is $8,768.
Families that are below poverty line in Lakeside earn $8,768 less on average than the poverty threshold level.
What is Inequality or Gini Index in Lakeside?
Inequality or Gini Index in Lakeside is 0.33.
What is the Total Population of Lakeside?
Total Population of Lakeside is 1,838.
What is the Total Male Population of Lakeside?
Total Male Population of Lakeside is 940.
What is the Total Female Population of Lakeside?
Total Female Population of Lakeside is 898.
What is the Ratio of Males per 100 Females in Lakeside?
There are 104.68 Males per 100 Females in Lakeside.
What is the Ratio of Females per 100 Males in Lakeside?
There are 95.53 Females per 100 Males in Lakeside.
What is the Median Population Age in Lakeside?
Median Population Age in Lakeside is 62.6 Years.
What is the Average Family Size in Lakeside
Average Family Size in Lakeside is 2.6 People.
What is the Average Household Size in Lakeside
Average Household Size in Lakeside is 2.2 People.
How Large is the Labor Force in Lakeside?
There are 609 People in the Labor Forcein in Lakeside.
What is the Percentage of People in the Labor Force in Lakeside?
37.2% of People are in the Labor Force in Lakeside.
What is the Unemployment Rate in Lakeside?
Unemployment Rate in Lakeside is 2.6%.