Oakland, OR Map & Demographics
Oakland Map
Oakland Overview
$26,288
PER CAPITA INCOME
$84,219
AVG FAMILY INCOME
$60,909
AVG HOUSEHOLD INCOME
37.6%
WAGE / INCOME GAP [ % ]
62.4¢/ $1
WAGE / INCOME GAP [ $ ]
0.38
INEQUALITY / GINI INDEX
1,288
TOTAL POPULATION
669
MALE POPULATION
619
FEMALE POPULATION
108.08
MALES / 100 FEMALES
92.53
FEMALES / 100 MALES
40.3
MEDIAN AGE
3.6
AVG FAMILY SIZE
2.6
AVG HOUSEHOLD SIZE
548
LABOR FORCE [ PEOPLE ]
56.4%
PERCENT IN LABOR FORCE
15.1%
UNEMPLOYMENT RATE
Oakland Zip Codes
Oakland Area Codes
Income in Oakland
Income Overview in Oakland
Per Capita Income in Oakland is $26,288, while median incomes of families and households are $84,219 and $60,909 respectively.
| Characteristic | Number | Measure |
| Per Capita Income | 1,288 | $26,288 |
| Median Family Income | 281 | $84,219 |
| Mean Family Income | 281 | $82,373 |
| Median Household Income | 504 | $60,909 |
| Mean Household Income | 504 | $68,836 |
| Income Deficit | 281 | $0 |
| Wage / Income Gap (%) | 1,288 | 37.64% |
| Wage / Income Gap ($) | 1,288 | 62.36¢ per $1 |
| Gini / Inequality Index | 1,288 | 0.38 |
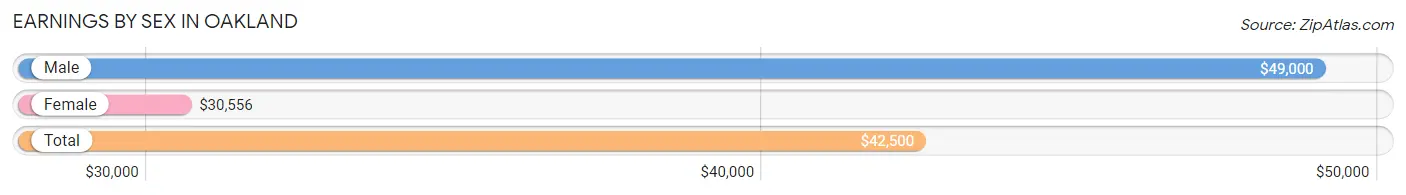
Earnings by Sex in Oakland
Average Earnings in Oakland are $42,500, $49,000 for men and $30,556 for women, a difference of 37.6%.
| Sex | Number | Average Earnings |
| Male | 290 (52.2%) | $49,000 |
| Female | 266 (47.8%) | $30,556 |
| Total | 556 (100.0%) | $42,500 |
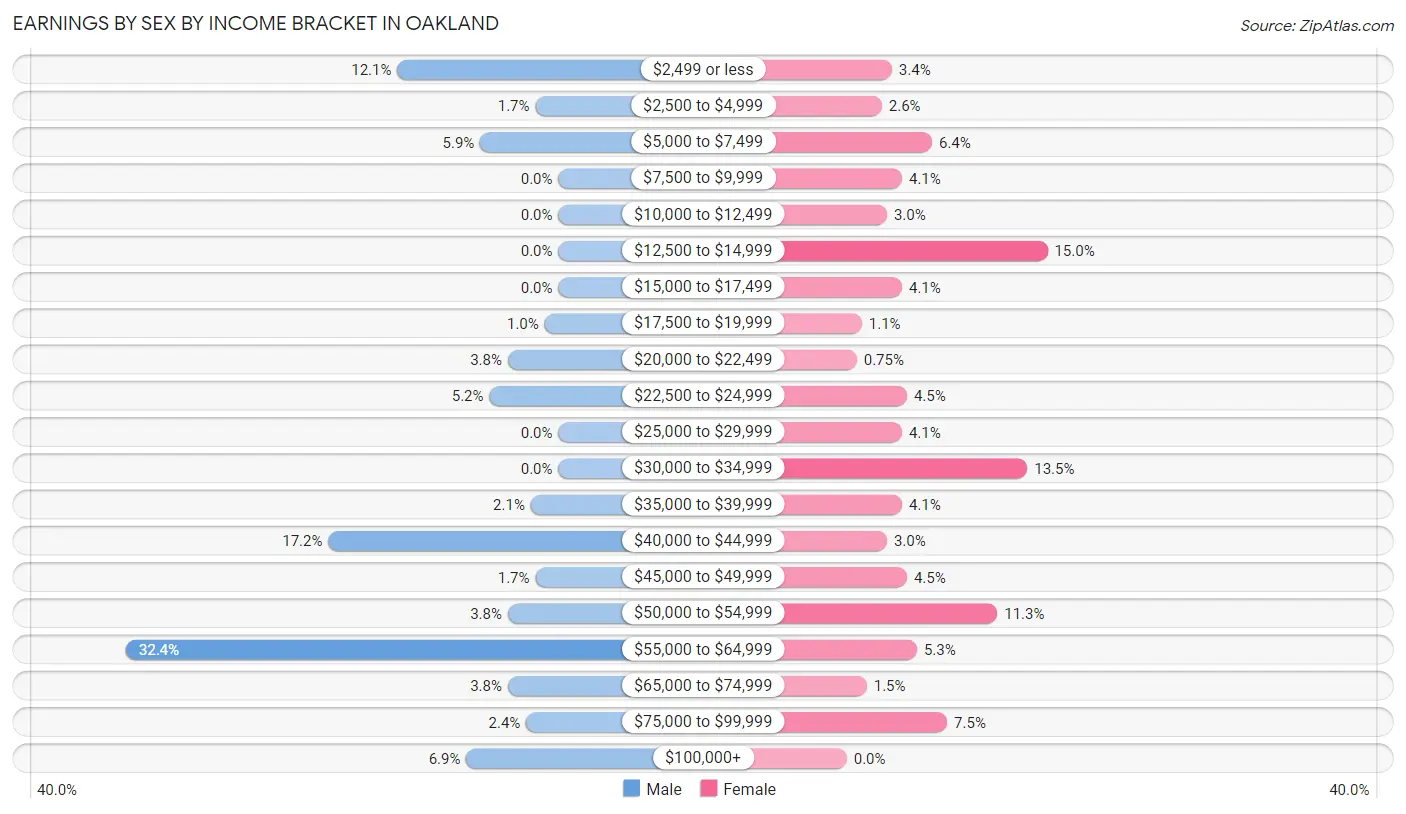
Earnings by Sex by Income Bracket in Oakland
The most common earnings brackets in Oakland are $55,000 to $64,999 for men (94 | 32.4%) and $12,500 to $14,999 for women (40 | 15.0%).
| Income | Male | Female |
| $2,499 or less | 35 (12.1%) | 9 (3.4%) |
| $2,500 to $4,999 | 5 (1.7%) | 7 (2.6%) |
| $5,000 to $7,499 | 17 (5.9%) | 17 (6.4%) |
| $7,500 to $9,999 | 0 (0.0%) | 11 (4.1%) |
| $10,000 to $12,499 | 0 (0.0%) | 8 (3.0%) |
| $12,500 to $14,999 | 0 (0.0%) | 40 (15.0%) |
| $15,000 to $17,499 | 0 (0.0%) | 11 (4.1%) |
| $17,500 to $19,999 | 3 (1.0%) | 3 (1.1%) |
| $20,000 to $22,499 | 11 (3.8%) | 2 (0.7%) |
| $22,500 to $24,999 | 15 (5.2%) | 12 (4.5%) |
| $25,000 to $29,999 | 0 (0.0%) | 11 (4.1%) |
| $30,000 to $34,999 | 0 (0.0%) | 36 (13.5%) |
| $35,000 to $39,999 | 6 (2.1%) | 11 (4.1%) |
| $40,000 to $44,999 | 50 (17.2%) | 8 (3.0%) |
| $45,000 to $49,999 | 5 (1.7%) | 12 (4.5%) |
| $50,000 to $54,999 | 11 (3.8%) | 30 (11.3%) |
| $55,000 to $64,999 | 94 (32.4%) | 14 (5.3%) |
| $65,000 to $74,999 | 11 (3.8%) | 4 (1.5%) |
| $75,000 to $99,999 | 7 (2.4%) | 20 (7.5%) |
| $100,000+ | 20 (6.9%) | 0 (0.0%) |
| Total | 290 (100.0%) | 266 (100.0%) |
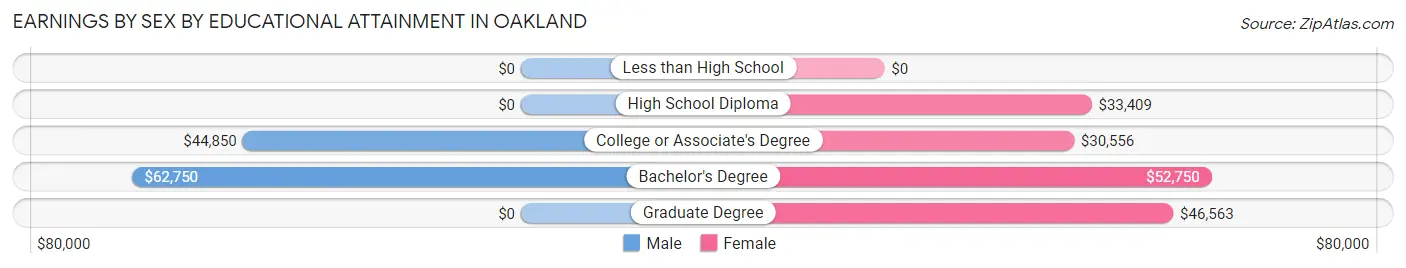
Earnings by Sex by Educational Attainment in Oakland
Average earnings in Oakland are $55,333 for men and $33,241 for women, a difference of 39.9%. Men with an educational attainment of bachelor's degree enjoy the highest average annual earnings of $62,750, while those with college or associate's degree education earn the least with $44,850. Women with an educational attainment of bachelor's degree earn the most with the average annual earnings of $52,750, while those with college or associate's degree education have the smallest earnings of $30,556.
| Educational Attainment | Male Income | Female Income |
| Less than High School | - | - |
| High School Diploma | - | - |
| College or Associate's Degree | $44,850 | $30,556 |
| Bachelor's Degree | $62,750 | $52,750 |
| Graduate Degree | - | - |
| Total | $55,333 | $33,241 |
Family Income in Oakland
Family Income Brackets in Oakland
According to the Oakland family income data, there are 72 families falling into the $100,000 to $149,999 income range, which is the most common income bracket and makes up 25.6% of all families. Conversely, the $10,000 to $14,999 income bracket is the least frequent group with only 2 families (0.7%) belonging to this category.
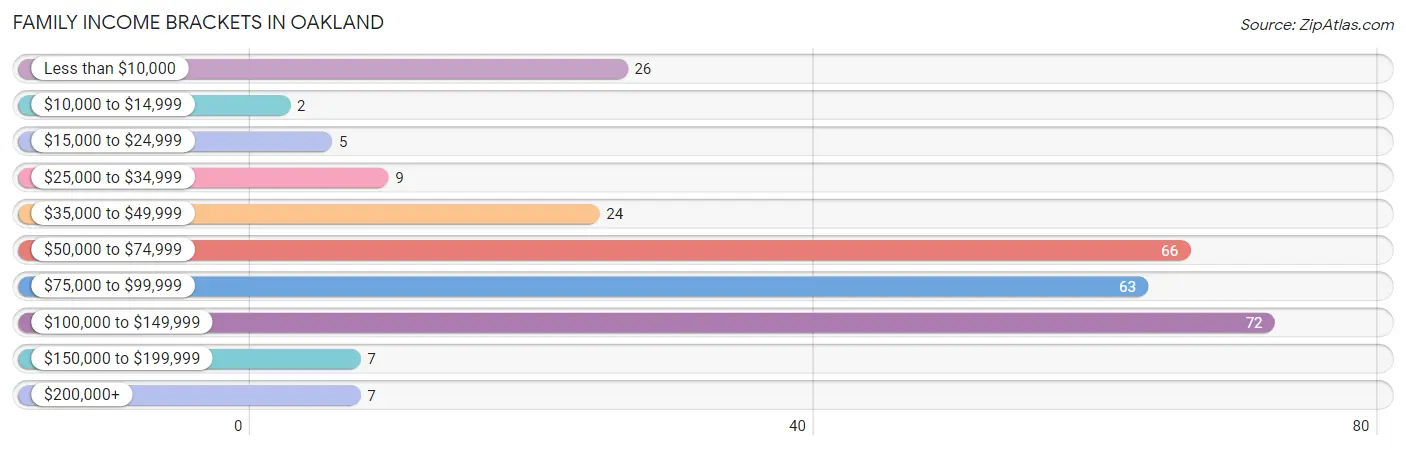
| Income Bracket | # Families | % Families |
| Less than $10,000 | 26 | 9.3% |
| $10,000 to $14,999 | 2 | 0.7% |
| $15,000 to $24,999 | 5 | 1.8% |
| $25,000 to $34,999 | 9 | 3.2% |
| $35,000 to $49,999 | 24 | 8.5% |
| $50,000 to $74,999 | 66 | 23.5% |
| $75,000 to $99,999 | 63 | 22.4% |
| $100,000 to $149,999 | 72 | 25.6% |
| $150,000 to $199,999 | 7 | 2.5% |
| $200,000+ | 7 | 2.5% |
Family Income by Famaliy Size in Oakland
5-person families (31 | 11.0%) account for the highest median family income in Oakland with $136,563 per family, while 2-person families (131 | 46.6%) have the highest median income of $30,688 per family member.
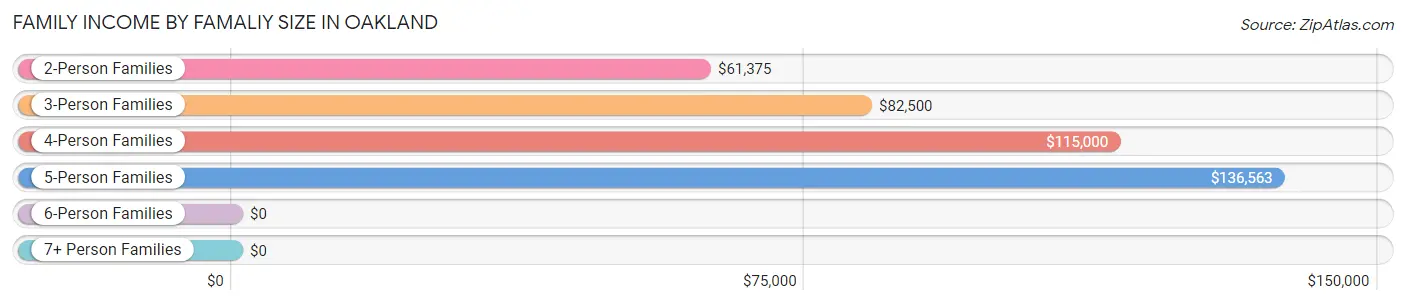
| Income Bracket | # Families | Median Income |
| 2-Person Families | 131 (46.6%) | $61,375 |
| 3-Person Families | 52 (18.5%) | $82,500 |
| 4-Person Families | 32 (11.4%) | $115,000 |
| 5-Person Families | 31 (11.0%) | $136,563 |
| 6-Person Families | 24 (8.5%) | $0 |
| 7+ Person Families | 11 (3.9%) | $0 |
| Total | 281 (100.0%) | $84,219 |
Family Income by Number of Earners in Oakland
The median family income in Oakland is $84,219, with families comprising 3+ earners (22) having the highest median family income of $133,333, while families with no earners (70) have the lowest median family income of $53,214, accounting for 7.8% and 24.9% of families, respectively.
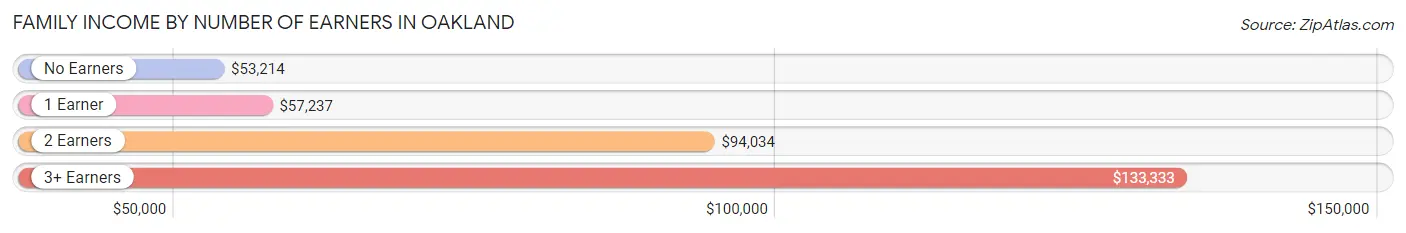
| Number of Earners | # Families | Median Income |
| No Earners | 70 (24.9%) | $53,214 |
| 1 Earner | 66 (23.5%) | $57,237 |
| 2 Earners | 123 (43.8%) | $94,034 |
| 3+ Earners | 22 (7.8%) | $133,333 |
| Total | 281 (100.0%) | $84,219 |
Household Income in Oakland
Household Income Brackets in Oakland
With 110 households falling in the category, the $50,000 to $74,999 income range is the most frequent in Oakland, accounting for 21.8% of all households. In contrast, only 7 households (1.4%) fall into the $200,000+ income bracket, making it the least populous group.
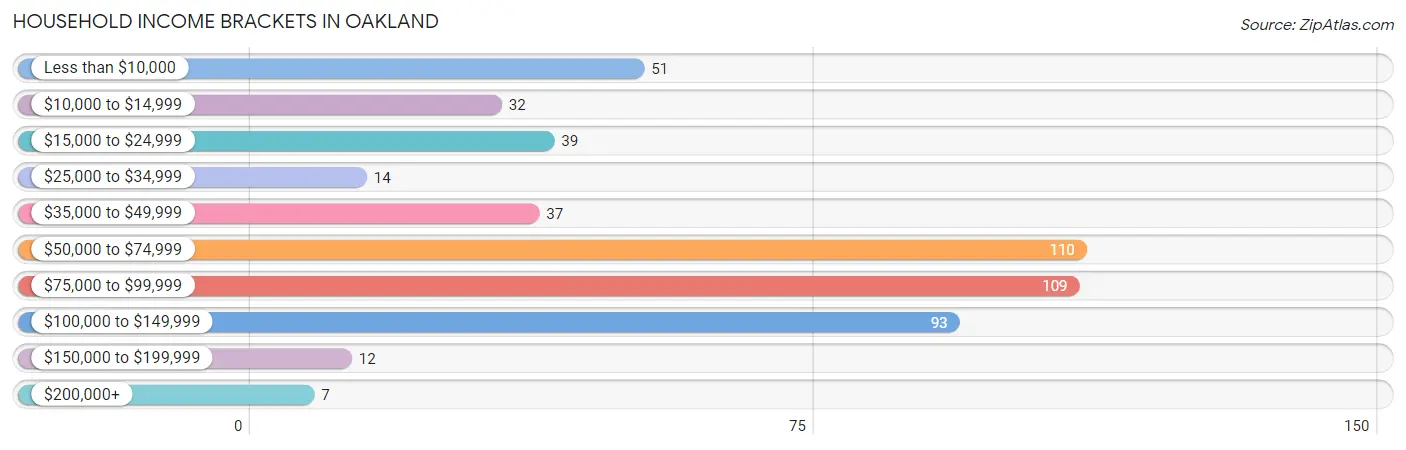
| Income Bracket | # Households | % Households |
| Less than $10,000 | 51 | 10.1% |
| $10,000 to $14,999 | 32 | 6.3% |
| $15,000 to $24,999 | 39 | 7.7% |
| $25,000 to $34,999 | 14 | 2.8% |
| $35,000 to $49,999 | 37 | 7.3% |
| $50,000 to $74,999 | 110 | 21.8% |
| $75,000 to $99,999 | 109 | 21.6% |
| $100,000 to $149,999 | 93 | 18.5% |
| $150,000 to $199,999 | 12 | 2.4% |
| $200,000+ | 7 | 1.4% |
Household Income by Householder Age in Oakland
The median household income in Oakland is $60,909, with the highest median household income of $90,357 found in the 25 to 44 years age bracket for the primary householder. A total of 130 households (25.8%) fall into this category. Meanwhile, the 15 to 24 years age bracket for the primary householder has the lowest median household income of $0, with 8 households (1.6%) in this group.
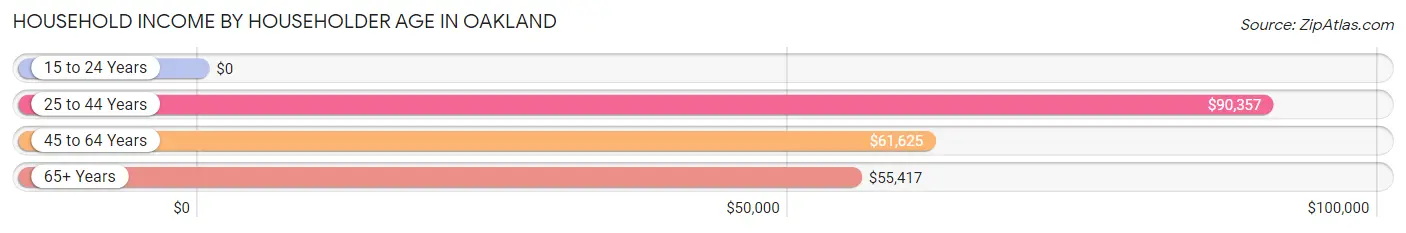
| Income Bracket | # Households | Median Income |
| 15 to 24 Years | 8 (1.6%) | $0 |
| 25 to 44 Years | 130 (25.8%) | $90,357 |
| 45 to 64 Years | 151 (30.0%) | $61,625 |
| 65+ Years | 215 (42.7%) | $55,417 |
| Total | 504 (100.0%) | $60,909 |
Poverty in Oakland
Income Below Poverty by Sex and Age in Oakland
With 14.8% poverty level for males and 17.1% for females among the residents of Oakland, 15 year old males and under 5 year old females are the most vulnerable to poverty, with 6 males (100.0%) and 31 females (60.8%) in their respective age groups living below the poverty level.
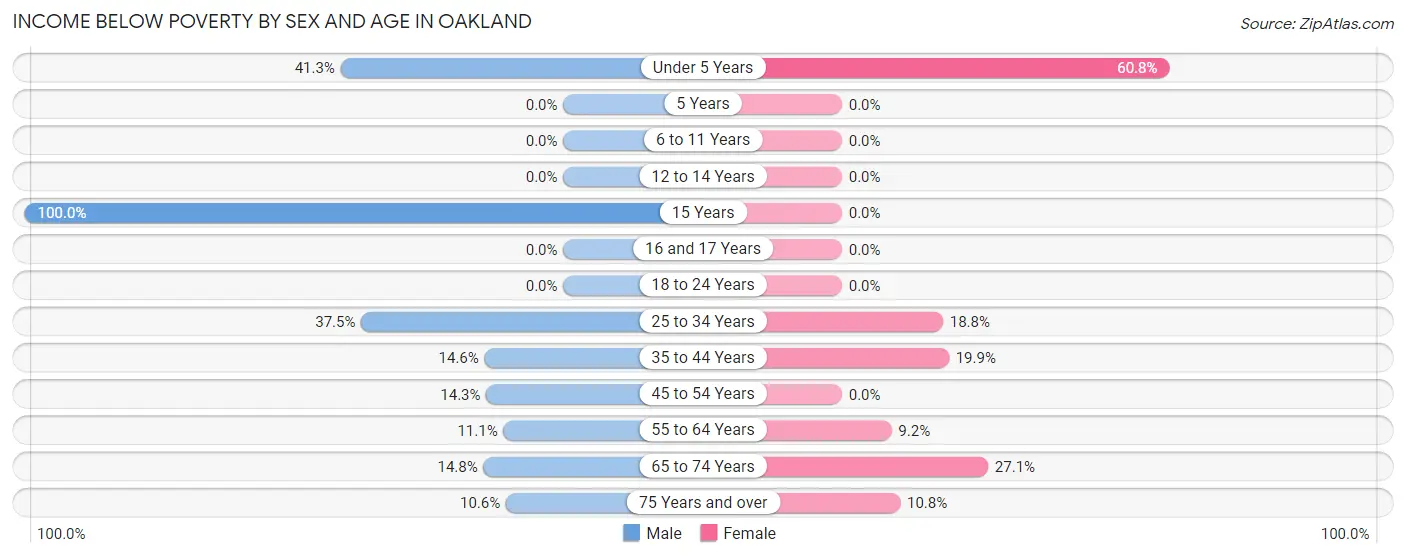
| Age Bracket | Male | Female |
| Under 5 Years | 31 (41.3%) | 31 (60.8%) |
| 5 Years | 0 (0.0%) | 0 (0.0%) |
| 6 to 11 Years | 0 (0.0%) | 0 (0.0%) |
| 12 to 14 Years | 0 (0.0%) | 0 (0.0%) |
| 15 Years | 6 (100.0%) | 0 (0.0%) |
| 16 and 17 Years | 0 (0.0%) | 0 (0.0%) |
| 18 to 24 Years | 0 (0.0%) | 0 (0.0%) |
| 25 to 34 Years | 12 (37.5%) | 6 (18.8%) |
| 35 to 44 Years | 13 (14.6%) | 26 (19.9%) |
| 45 to 54 Years | 5 (14.3%) | 0 (0.0%) |
| 55 to 64 Years | 11 (11.1%) | 7 (9.2%) |
| 65 to 74 Years | 16 (14.8%) | 32 (27.1%) |
| 75 Years and over | 5 (10.6%) | 4 (10.8%) |
| Total | 99 (14.8%) | 106 (17.1%) |
Income Above Poverty by Sex and Age in Oakland
According to the poverty statistics in Oakland, males aged 6 to 11 years and females aged 5 years are the age groups that are most secure financially, with 100.0% of males and 100.0% of females in these age groups living above the poverty line.
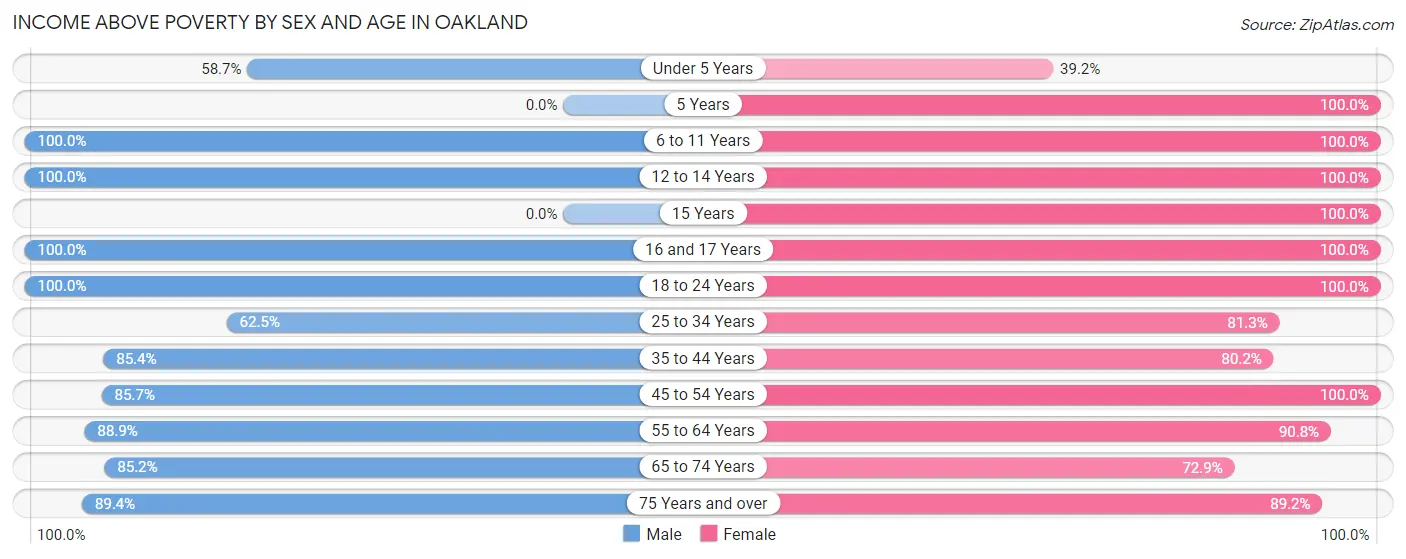
| Age Bracket | Male | Female |
| Under 5 Years | 44 (58.7%) | 20 (39.2%) |
| 5 Years | 0 (0.0%) | 7 (100.0%) |
| 6 to 11 Years | 95 (100.0%) | 5 (100.0%) |
| 12 to 14 Years | 36 (100.0%) | 27 (100.0%) |
| 15 Years | 0 (0.0%) | 14 (100.0%) |
| 16 and 17 Years | 28 (100.0%) | 48 (100.0%) |
| 18 to 24 Years | 19 (100.0%) | 38 (100.0%) |
| 25 to 34 Years | 20 (62.5%) | 26 (81.2%) |
| 35 to 44 Years | 76 (85.4%) | 105 (80.1%) |
| 45 to 54 Years | 30 (85.7%) | 35 (100.0%) |
| 55 to 64 Years | 88 (88.9%) | 69 (90.8%) |
| 65 to 74 Years | 92 (85.2%) | 86 (72.9%) |
| 75 Years and over | 42 (89.4%) | 33 (89.2%) |
| Total | 570 (85.2%) | 513 (82.9%) |
Income Below Poverty Among Married-Couple Families in Oakland
The poverty statistics for married-couple families in Oakland show that 6.5% or 15 of the total 232 families live below the poverty line. Families with 3 or 4 children have the highest poverty rate of 27.7%, comprising of 13 families. On the other hand, families with 1 or 2 children have the lowest poverty rate of 0.0%, which includes 0 families.
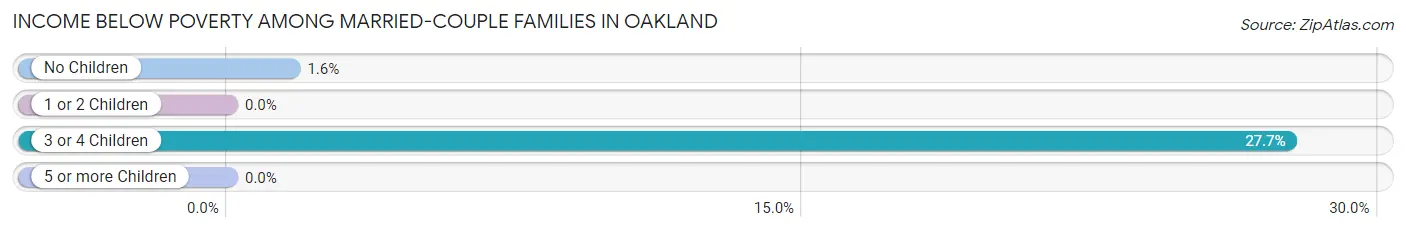
| Children | Above Poverty | Below Poverty |
| No Children | 121 (98.4%) | 2 (1.6%) |
| 1 or 2 Children | 59 (100.0%) | 0 (0.0%) |
| 3 or 4 Children | 34 (72.3%) | 13 (27.7%) |
| 5 or more Children | 3 (100.0%) | 0 (0.0%) |
| Total | 217 (93.5%) | 15 (6.5%) |
Income Below Poverty Among Single-Parent Households in Oakland
According to the poverty data in Oakland, 47.1% or 8 single-father households and 31.2% or 10 single-mother households are living below the poverty line. Among single-father households, those with no children have the highest poverty rate, with 8 households (100.0%) experiencing poverty. Likewise, among single-mother households, those with no children have the highest poverty rate, with 5 households (50.0%) falling below the poverty line.
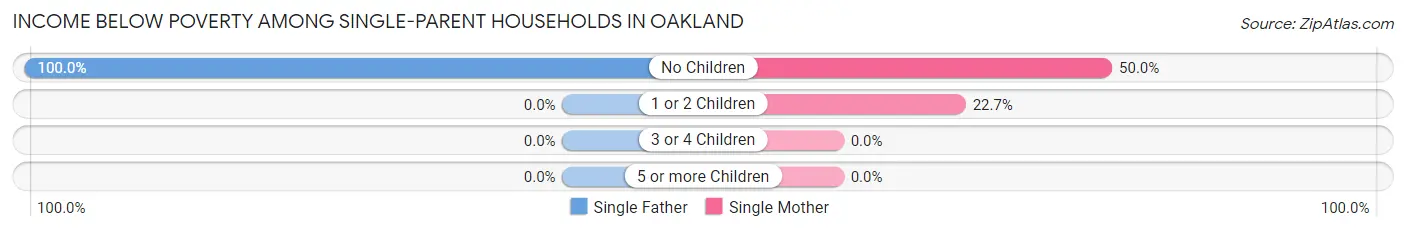
| Children | Single Father | Single Mother |
| No Children | 8 (100.0%) | 5 (50.0%) |
| 1 or 2 Children | 0 (0.0%) | 5 (22.7%) |
| 3 or 4 Children | 0 (0.0%) | 0 (0.0%) |
| 5 or more Children | 0 (0.0%) | 0 (0.0%) |
| Total | 8 (47.1%) | 10 (31.2%) |
Income Below Poverty Among Married-Couple vs Single-Parent Households in Oakland
The poverty data for Oakland shows that 15 of the married-couple family households (6.5%) and 18 of the single-parent households (36.7%) are living below the poverty level. Within the married-couple family households, those with 3 or 4 children have the highest poverty rate, with 13 households (27.7%) falling below the poverty line. Among the single-parent households, those with no children have the highest poverty rate, with 13 household (72.2%) living below poverty.
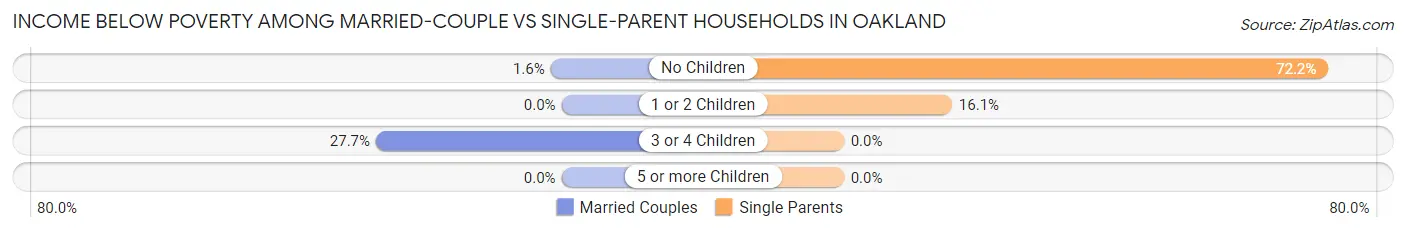
| Children | Married-Couple Families | Single-Parent Households |
| No Children | 2 (1.6%) | 13 (72.2%) |
| 1 or 2 Children | 0 (0.0%) | 5 (16.1%) |
| 3 or 4 Children | 13 (27.7%) | 0 (0.0%) |
| 5 or more Children | 0 (0.0%) | 0 (0.0%) |
| Total | 15 (6.5%) | 18 (36.7%) |
Race in Oakland
The most populous races in Oakland are White / Caucasian (1,168 | 90.7%), Hispanic or Latino (96 | 7.4%), and Two or more Races (78 | 6.1%).
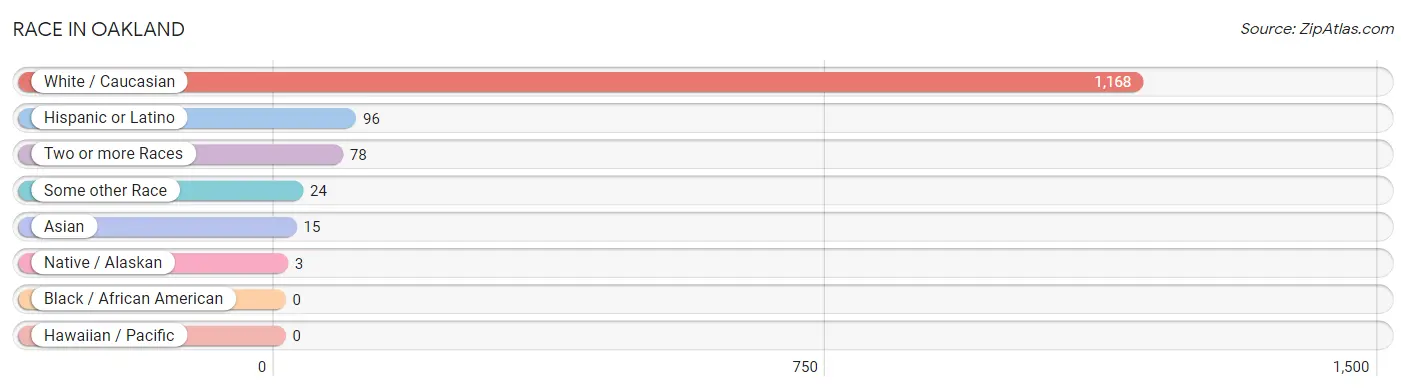
| Race | # Population | % Population |
| Asian | 15 | 1.2% |
| Black / African American | 0 | 0.0% |
| Hawaiian / Pacific | 0 | 0.0% |
| Hispanic or Latino | 96 | 7.4% |
| Native / Alaskan | 3 | 0.2% |
| White / Caucasian | 1,168 | 90.7% |
| Two or more Races | 78 | 6.1% |
| Some other Race | 24 | 1.9% |
| Total | 1,288 | 100.0% |
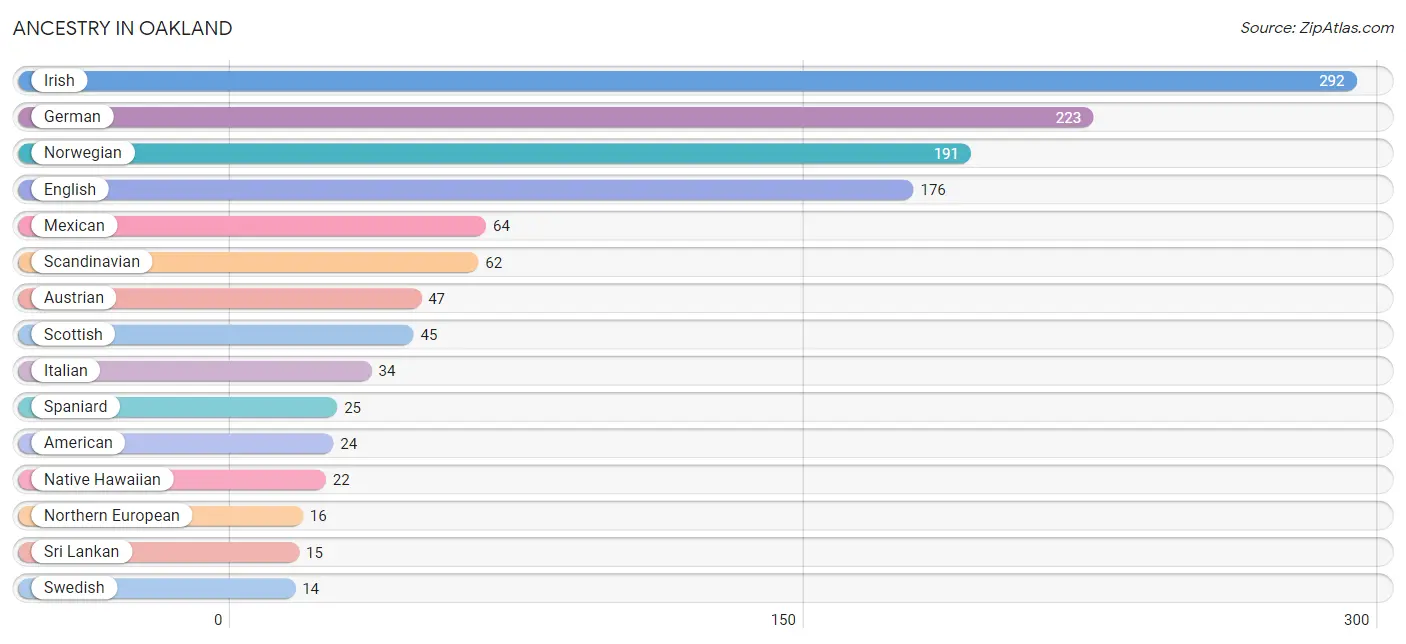
Ancestry in Oakland
The most populous ancestries reported in Oakland are Irish (292 | 22.7%), German (223 | 17.3%), Norwegian (191 | 14.8%), English (176 | 13.7%), and Mexican (64 | 5.0%), together accounting for 73.4% of all Oakland residents.
| Ancestry | # Population | % Population |
| American | 24 | 1.9% |
| Austrian | 47 | 3.6% |
| Blackfeet | 2 | 0.2% |
| Burmese | 9 | 0.7% |
| Cherokee | 6 | 0.5% |
| Danish | 8 | 0.6% |
| Dutch | 7 | 0.5% |
| English | 176 | 13.7% |
| European | 6 | 0.5% |
| Finnish | 8 | 0.6% |
| French | 3 | 0.2% |
| German | 223 | 17.3% |
| Guamanian / Chamorro | 1 | 0.1% |
| Hungarian | 10 | 0.8% |
| Irish | 292 | 22.7% |
| Italian | 34 | 2.6% |
| Mexican | 64 | 5.0% |
| Native Hawaiian | 22 | 1.7% |
| Northern European | 16 | 1.2% |
| Norwegian | 191 | 14.8% |
| Polish | 3 | 0.2% |
| Scandinavian | 62 | 4.8% |
| Scotch-Irish | 10 | 0.8% |
| Scottish | 45 | 3.5% |
| Spaniard | 25 | 1.9% |
| Sri Lankan | 15 | 1.2% |
| Swedish | 14 | 1.1% |
| Swiss | 11 | 0.9% | View All 28 Rows |
Immigrants in Oakland
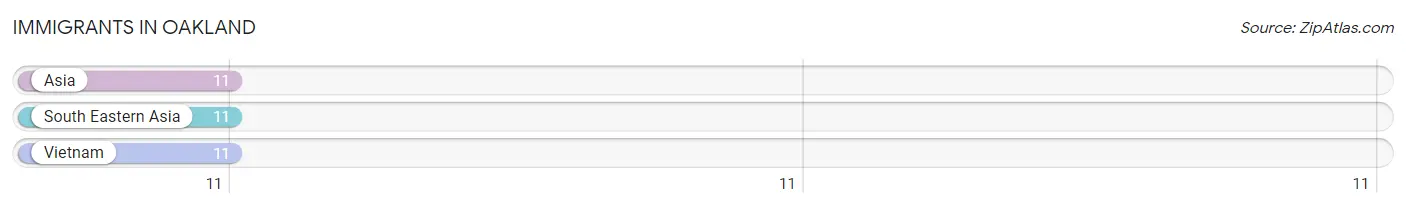
The most numerous immigrant groups reported in Oakland came from Asia (11 | 0.9%), South Eastern Asia (11 | 0.9%), and Vietnam (11 | 0.9%), together accounting for 2.6% of all Oakland residents.
| Immigration Origin | # Population | % Population |
| Asia | 11 | 0.9% |
| South Eastern Asia | 11 | 0.9% |
| Vietnam | 11 | 0.9% | View All 3 Rows |
Sex and Age in Oakland
Sex and Age in Oakland
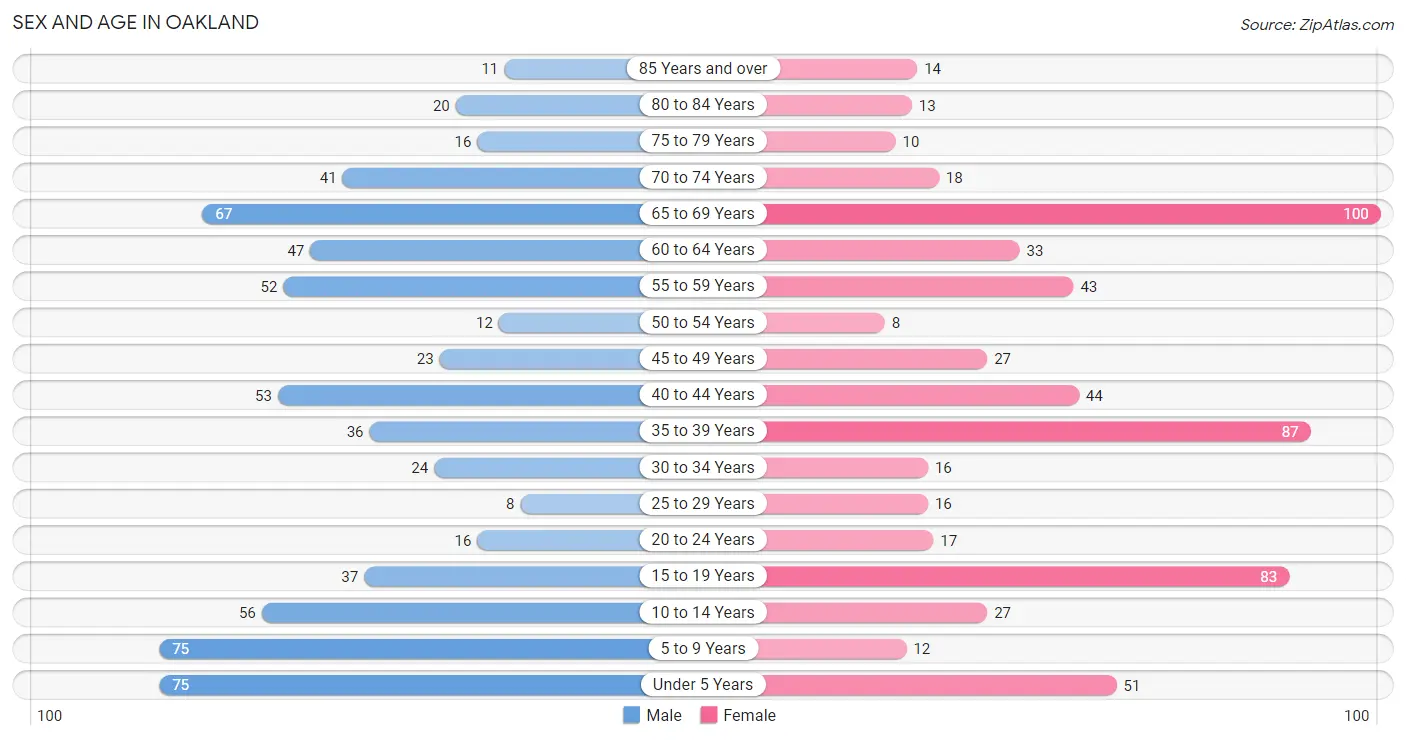
The most populous age groups in Oakland are Under 5 Years (75 | 11.2%) for men and 65 to 69 Years (100 | 16.2%) for women.
| Age Bracket | Male | Female |
| Under 5 Years | 75 (11.2%) | 51 (8.2%) |
| 5 to 9 Years | 75 (11.2%) | 12 (1.9%) |
| 10 to 14 Years | 56 (8.4%) | 27 (4.4%) |
| 15 to 19 Years | 37 (5.5%) | 83 (13.4%) |
| 20 to 24 Years | 16 (2.4%) | 17 (2.8%) |
| 25 to 29 Years | 8 (1.2%) | 16 (2.6%) |
| 30 to 34 Years | 24 (3.6%) | 16 (2.6%) |
| 35 to 39 Years | 36 (5.4%) | 87 (14.1%) |
| 40 to 44 Years | 53 (7.9%) | 44 (7.1%) |
| 45 to 49 Years | 23 (3.4%) | 27 (4.4%) |
| 50 to 54 Years | 12 (1.8%) | 8 (1.3%) |
| 55 to 59 Years | 52 (7.8%) | 43 (7.0%) |
| 60 to 64 Years | 47 (7.0%) | 33 (5.3%) |
| 65 to 69 Years | 67 (10.0%) | 100 (16.2%) |
| 70 to 74 Years | 41 (6.1%) | 18 (2.9%) |
| 75 to 79 Years | 16 (2.4%) | 10 (1.6%) |
| 80 to 84 Years | 20 (3.0%) | 13 (2.1%) |
| 85 Years and over | 11 (1.6%) | 14 (2.3%) |
| Total | 669 (100.0%) | 619 (100.0%) |
Families and Households in Oakland
Median Family Size in Oakland
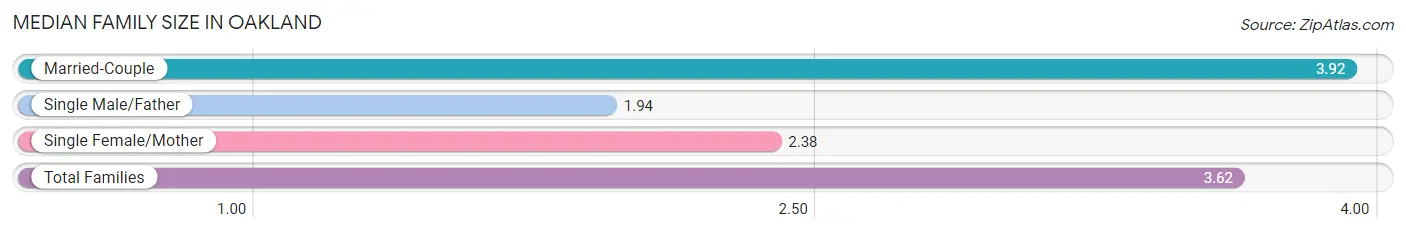
The median family size in Oakland is 3.62 persons per family, with married-couple families (232 | 82.6%) accounting for the largest median family size of 3.92 persons per family. On the other hand, single male/father families (17 | 6.0%) represent the smallest median family size with 1.94 persons per family.
| Family Type | # Families | Family Size |
| Married-Couple | 232 (82.6%) | 3.92 |
| Single Male/Father | 17 (6.0%) | 1.94 |
| Single Female/Mother | 32 (11.4%) | 2.38 |
| Total Families | 281 (100.0%) | 3.62 |
Median Household Size in Oakland
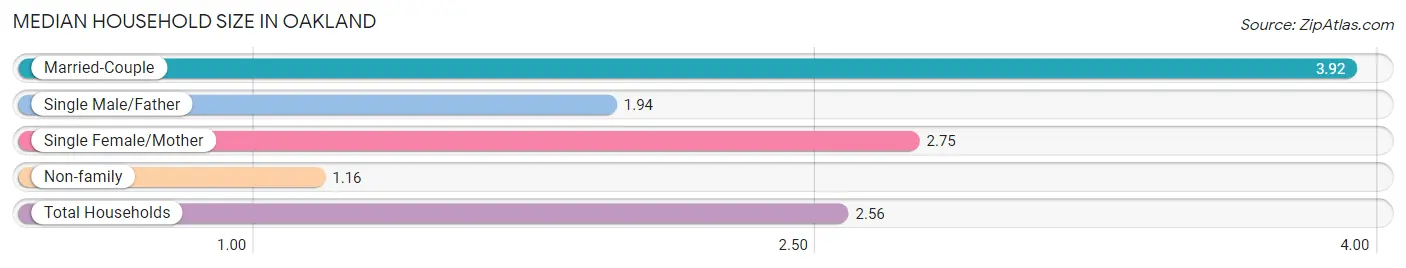
The median household size in Oakland is 2.56 persons per household, with married-couple households (232 | 46.0%) accounting for the largest median household size of 3.92 persons per household. non-family households (223 | 44.3%) represent the smallest median household size with 1.16 persons per household.
| Household Type | # Households | Household Size |
| Married-Couple | 232 (46.0%) | 3.92 |
| Single Male/Father | 17 (3.4%) | 1.94 |
| Single Female/Mother | 32 (6.4%) | 2.75 |
| Non-family | 223 (44.3%) | 1.16 |
| Total Households | 504 (100.0%) | 2.56 |
Household Size by Marriage Status in Oakland
Out of a total of 504 households in Oakland, 281 (55.7%) are family households, while 223 (44.3%) are nonfamily households. The most numerous type of family households are 2-person households, comprising 119, and the most common type of nonfamily households are 1-person households, comprising 146.
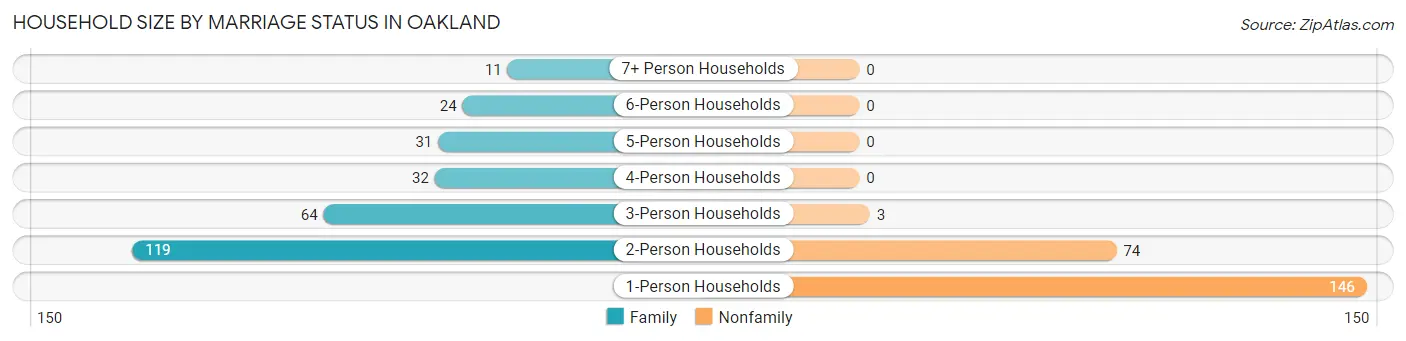
| Household Size | Family Households | Nonfamily Households |
| 1-Person Households | - | 146 (29.0%) |
| 2-Person Households | 119 (23.6%) | 74 (14.7%) |
| 3-Person Households | 64 (12.7%) | 3 (0.6%) |
| 4-Person Households | 32 (6.4%) | 0 (0.0%) |
| 5-Person Households | 31 (6.1%) | 0 (0.0%) |
| 6-Person Households | 24 (4.8%) | 0 (0.0%) |
| 7+ Person Households | 11 (2.2%) | 0 (0.0%) |
| Total | 281 (55.7%) | 223 (44.3%) |
Female Fertility in Oakland
Fertility by Age in Oakland
Average fertility rate in Oakland is 107.0 births per 1,000 women. Women in the age bracket of 20 to 34 years have the highest fertility rate with 224.0 births per 1,000 women. Women in the age bracket of 35 to 50 years acount for 65.6% of all women with births.
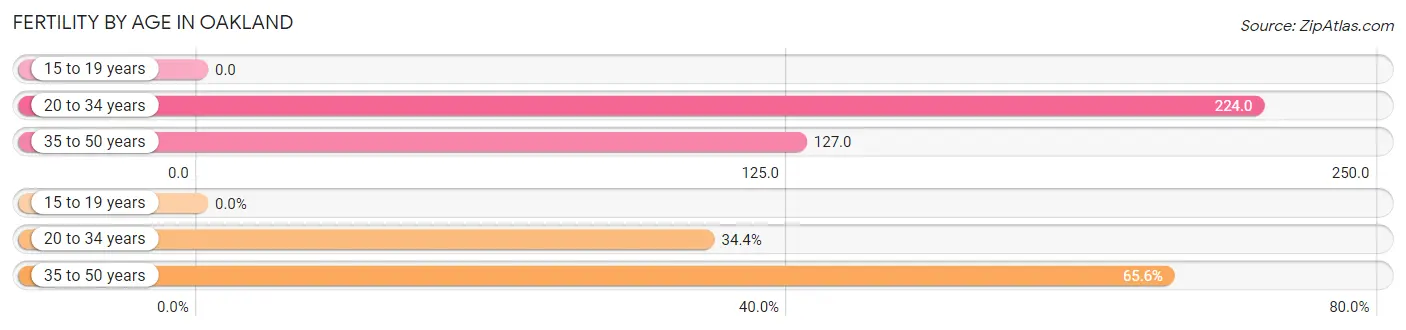
| Age Bracket | Women with Births | Births / 1,000 Women |
| 15 to 19 years | 0 (0.0%) | 0.0 |
| 20 to 34 years | 11 (34.4%) | 224.0 |
| 35 to 50 years | 21 (65.6%) | 127.0 |
| Total | 32 (100.0%) | 107.0 |
Fertility by Age by Marriage Status in Oakland
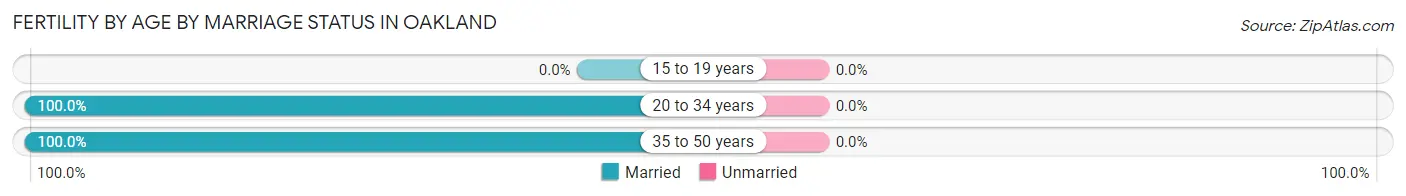
| Age Bracket | Married | Unmarried |
| 15 to 19 years | 0 (0.0%) | 0 (0.0%) |
| 20 to 34 years | 11 (100.0%) | 0 (0.0%) |
| 35 to 50 years | 21 (100.0%) | 0 (0.0%) |
| Total | 32 (100.0%) | 0 (0.0%) |
Fertility by Education in Oakland
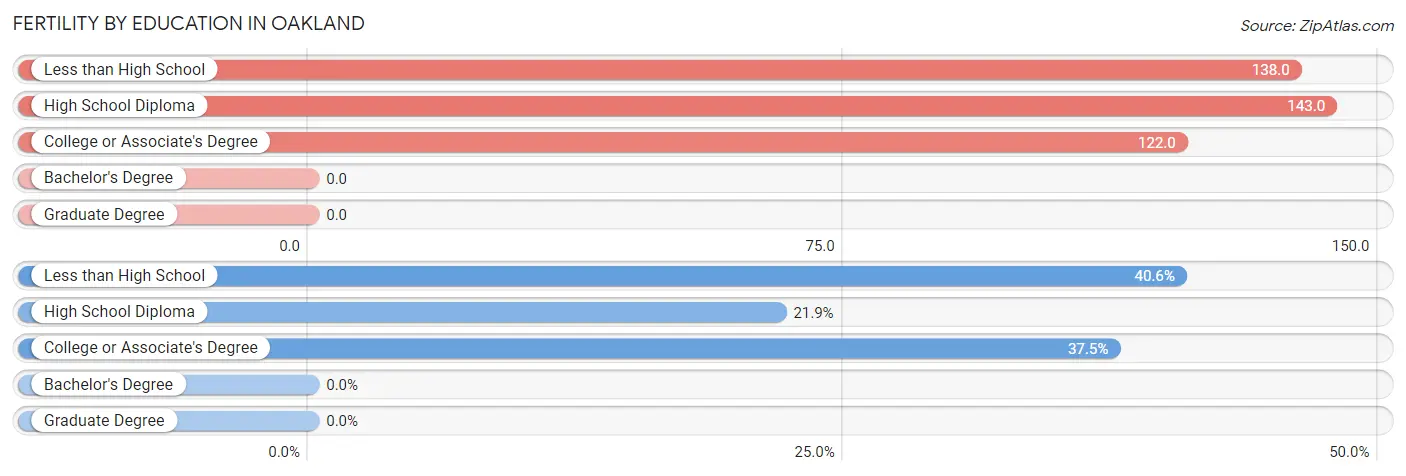
| Educational Attainment | Women with Births | Births / 1,000 Women |
| Less than High School | 13 (40.6%) | 138.0 |
| High School Diploma | 7 (21.9%) | 143.0 |
| College or Associate's Degree | 12 (37.5%) | 122.0 |
| Bachelor's Degree | 0 (0.0%) | 0.0 |
| Graduate Degree | 0 (0.0%) | 0.0 |
| Total | 32 (100.0%) | 107.0 |
Fertility by Education by Marriage Status in Oakland
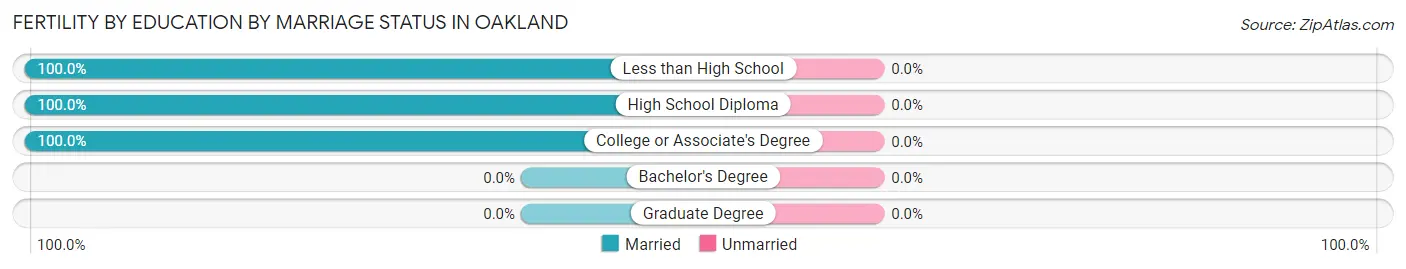
| Educational Attainment | Married | Unmarried |
| Less than High School | 13 (100.0%) | 0 (0.0%) |
| High School Diploma | 7 (100.0%) | 0 (0.0%) |
| College or Associate's Degree | 12 (100.0%) | 0 (0.0%) |
| Bachelor's Degree | 0 (0.0%) | 0 (0.0%) |
| Graduate Degree | 0 (0.0%) | 0 (0.0%) |
| Total | 32 (100.0%) | 0 (0.0%) |
Employment Characteristics in Oakland
Employment by Class of Employer in Oakland
Among the 453 employed individuals in Oakland, private company employees (224 | 49.4%), local government employees (84 | 18.5%), and self-employed (not incorporated) (61 | 13.5%) make up the most common classes of employment.
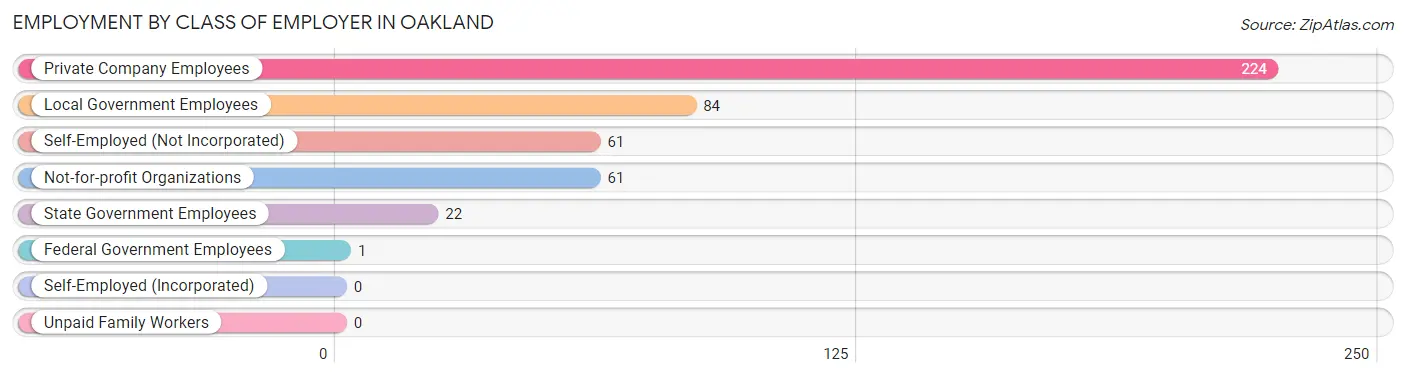
| Employer Class | # Employees | % Employees |
| Private Company Employees | 224 | 49.4% |
| Self-Employed (Incorporated) | 0 | 0.0% |
| Self-Employed (Not Incorporated) | 61 | 13.5% |
| Not-for-profit Organizations | 61 | 13.5% |
| Local Government Employees | 84 | 18.5% |
| State Government Employees | 22 | 4.9% |
| Federal Government Employees | 1 | 0.2% |
| Unpaid Family Workers | 0 | 0.0% |
| Total | 453 | 100.0% |
Employment Status by Age in Oakland
According to the labor force statistics for Oakland, out of the total population over 16 years of age (972), 56.4% or 548 individuals are in the labor force, with 15.1% or 83 of them unemployed. The age group with the highest labor force participation rate is 45 to 54 years, with 97.1% or 68 individuals in the labor force. Within the labor force, the 16 to 19 years age range has the highest percentage of unemployed individuals, with 56.3% or 18 of them being unemployed.
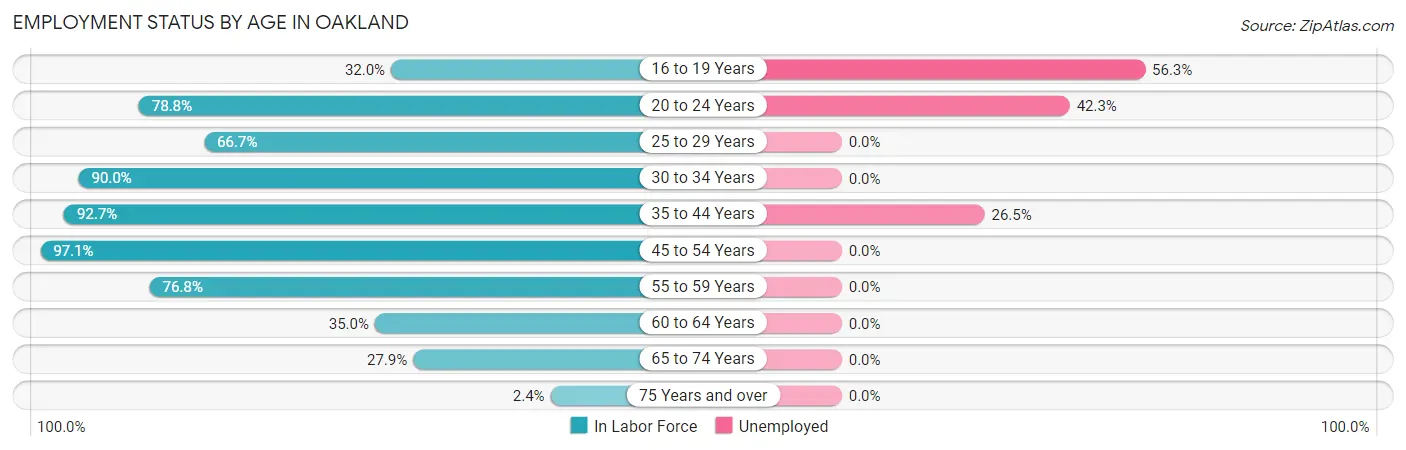
| Age Bracket | In Labor Force | Unemployed |
| 16 to 19 Years | 32 (32.0%) | 18 (56.3%) |
| 20 to 24 Years | 26 (78.8%) | 11 (42.3%) |
| 25 to 29 Years | 16 (66.7%) | 0 (0.0%) |
| 30 to 34 Years | 36 (90.0%) | 0 (0.0%) |
| 35 to 44 Years | 204 (92.7%) | 54 (26.5%) |
| 45 to 54 Years | 68 (97.1%) | 0 (0.0%) |
| 55 to 59 Years | 73 (76.8%) | 0 (0.0%) |
| 60 to 64 Years | 28 (35.0%) | 0 (0.0%) |
| 65 to 74 Years | 63 (27.9%) | 0 (0.0%) |
| 75 Years and over | 2 (2.4%) | 0 (0.0%) |
| Total | 548 (56.4%) | 83 (15.1%) |
Employment Status by Educational Attainment in Oakland
According to labor force statistics for Oakland, 80.3% of individuals (425) out of the total population between 25 and 64 years of age (529) are in the labor force, with 12.7% or 54 of them being unemployed. The group with the highest labor force participation rate are those with the educational attainment of bachelor's degree or higher, with 93.2% or 96 individuals in the labor force. Within the labor force, individuals with high school diploma education have the highest percentage of unemployment, with 27.8% or 20 of them being unemployed.
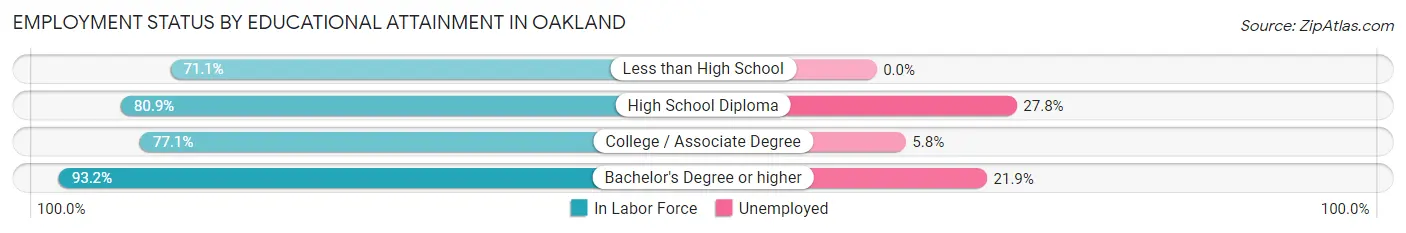
| Educational Attainment | In Labor Force | Unemployed |
| Less than High School | 32 (71.1%) | 0 (0.0%) |
| High School Diploma | 72 (80.9%) | 25 (27.8%) |
| College / Associate Degree | 225 (77.1%) | 17 (5.8%) |
| Bachelor's Degree or higher | 96 (93.2%) | 23 (21.9%) |
| Total | 425 (80.3%) | 67 (12.7%) |
Employment Occupations by Sex in Oakland
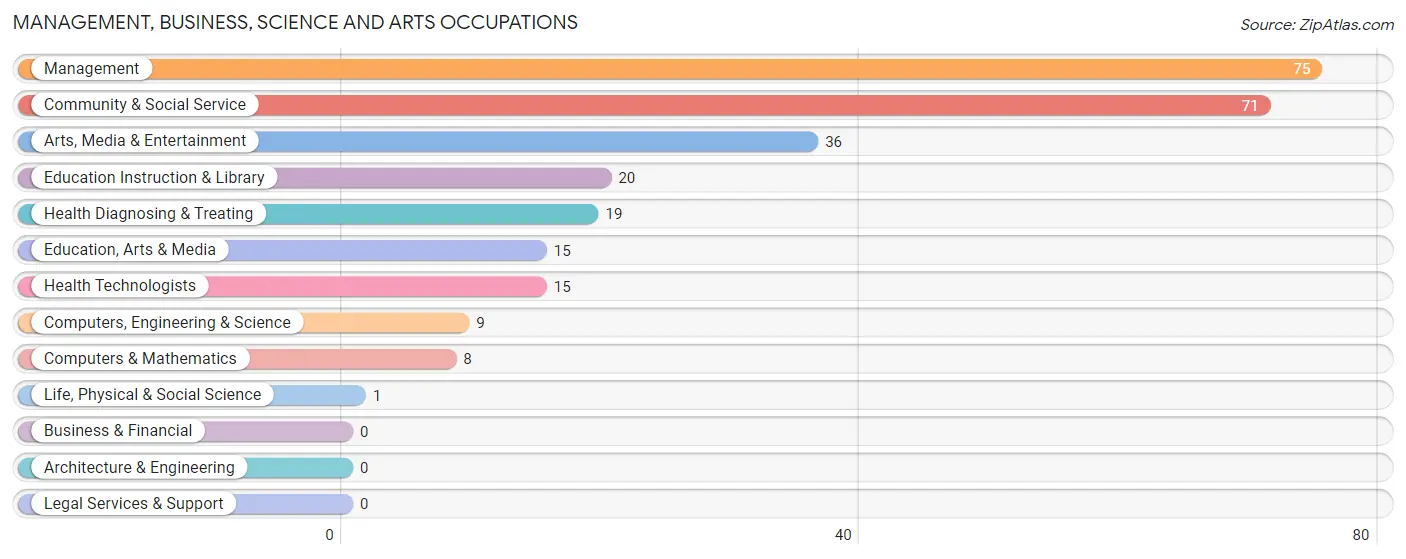
Management, Business, Science and Arts Occupations
The most common Management, Business, Science and Arts occupations in Oakland are Management (75 | 16.1%), Community & Social Service (71 | 15.3%), Arts, Media & Entertainment (36 | 7.7%), Education Instruction & Library (20 | 4.3%), and Health Diagnosing & Treating (19 | 4.1%).
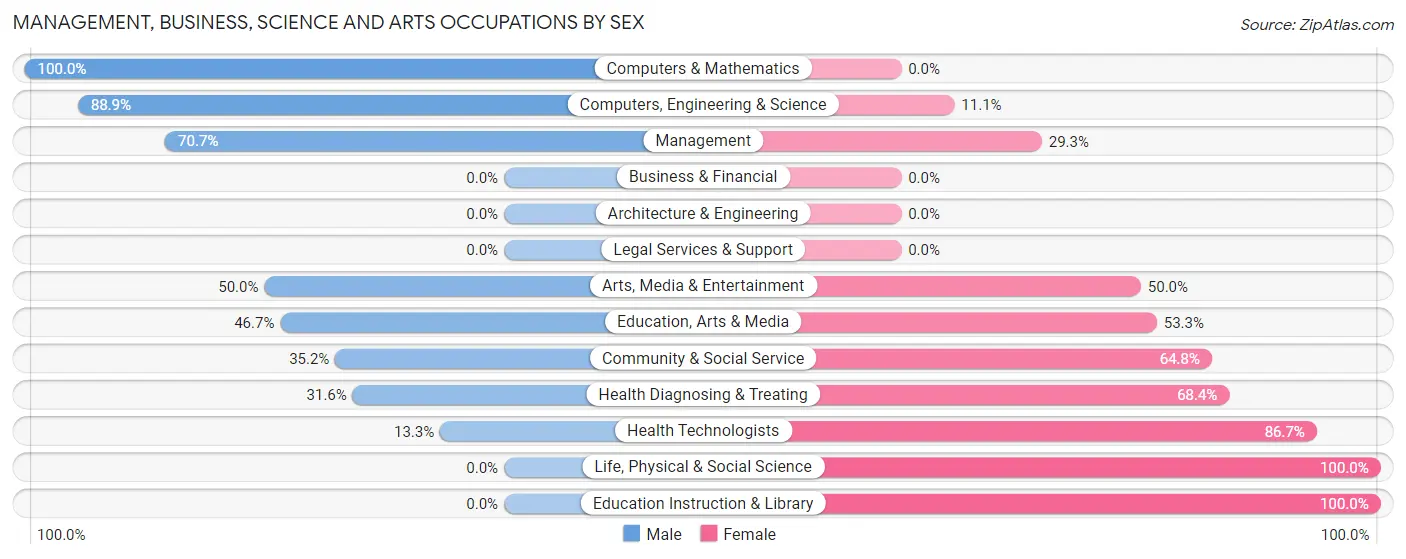
Management, Business, Science and Arts Occupations by Sex
Within the Management, Business, Science and Arts occupations in Oakland, the most male-oriented occupations are Computers & Mathematics (100.0%), Computers, Engineering & Science (88.9%), and Management (70.7%), while the most female-oriented occupations are Life, Physical & Social Science (100.0%), Education Instruction & Library (100.0%), and Health Technologists (86.7%).
| Occupation | Male | Female |
| Management | 53 (70.7%) | 22 (29.3%) |
| Business & Financial | 0 (0.0%) | 0 (0.0%) |
| Computers, Engineering & Science | 8 (88.9%) | 1 (11.1%) |
| Computers & Mathematics | 8 (100.0%) | 0 (0.0%) |
| Architecture & Engineering | 0 (0.0%) | 0 (0.0%) |
| Life, Physical & Social Science | 0 (0.0%) | 1 (100.0%) |
| Community & Social Service | 25 (35.2%) | 46 (64.8%) |
| Education, Arts & Media | 7 (46.7%) | 8 (53.3%) |
| Legal Services & Support | 0 (0.0%) | 0 (0.0%) |
| Education Instruction & Library | 0 (0.0%) | 20 (100.0%) |
| Arts, Media & Entertainment | 18 (50.0%) | 18 (50.0%) |
| Health Diagnosing & Treating | 6 (31.6%) | 13 (68.4%) |
| Health Technologists | 2 (13.3%) | 13 (86.7%) |
| Total (Category) | 92 (52.9%) | 82 (47.1%) |
| Total (Overall) | 255 (54.8%) | 210 (45.2%) |
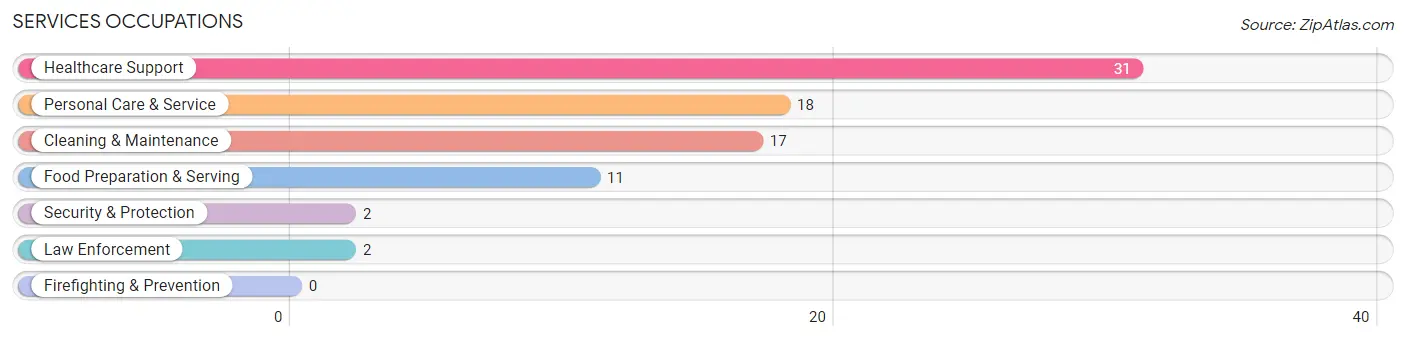
Services Occupations
The most common Services occupations in Oakland are Healthcare Support (31 | 6.7%), Personal Care & Service (18 | 3.9%), Cleaning & Maintenance (17 | 3.7%), Food Preparation & Serving (11 | 2.4%), and Security & Protection (2 | 0.4%).
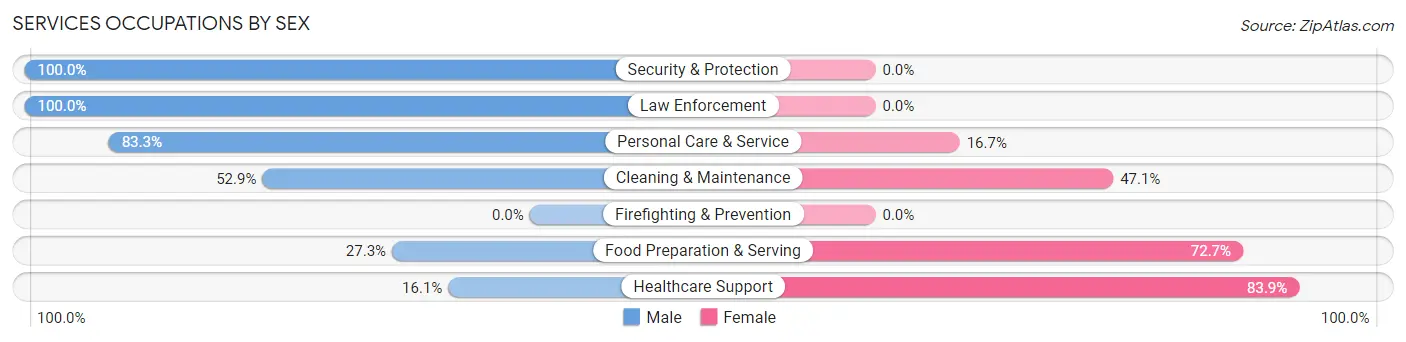
Services Occupations by Sex
Within the Services occupations in Oakland, the most male-oriented occupations are Security & Protection (100.0%), Law Enforcement (100.0%), and Personal Care & Service (83.3%), while the most female-oriented occupations are Healthcare Support (83.9%), Food Preparation & Serving (72.7%), and Cleaning & Maintenance (47.1%).
| Occupation | Male | Female |
| Healthcare Support | 5 (16.1%) | 26 (83.9%) |
| Security & Protection | 2 (100.0%) | 0 (0.0%) |
| Firefighting & Prevention | 0 (0.0%) | 0 (0.0%) |
| Law Enforcement | 2 (100.0%) | 0 (0.0%) |
| Food Preparation & Serving | 3 (27.3%) | 8 (72.7%) |
| Cleaning & Maintenance | 9 (52.9%) | 8 (47.1%) |
| Personal Care & Service | 15 (83.3%) | 3 (16.7%) |
| Total (Category) | 34 (43.0%) | 45 (57.0%) |
| Total (Overall) | 255 (54.8%) | 210 (45.2%) |
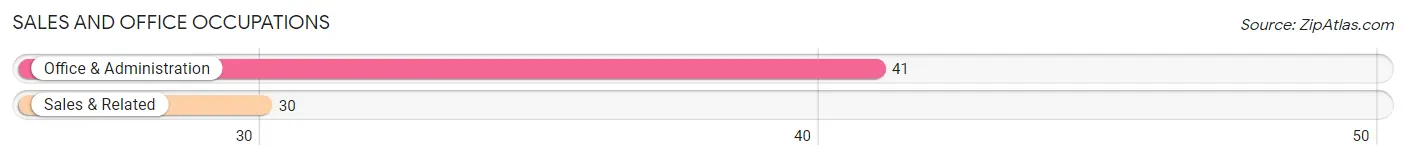
Sales and Office Occupations
The most common Sales and Office occupations in Oakland are Office & Administration (41 | 8.8%), and Sales & Related (30 | 6.5%).
Sales and Office Occupations by Sex
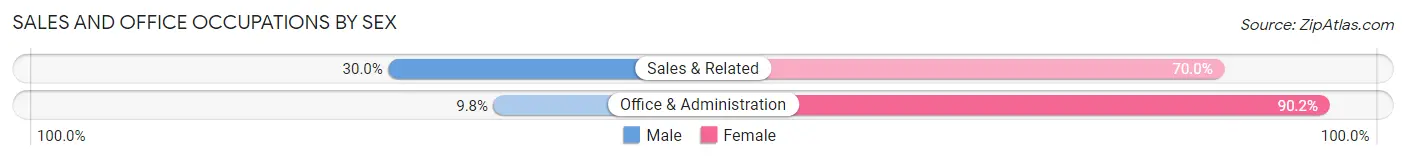
| Occupation | Male | Female |
| Sales & Related | 9 (30.0%) | 21 (70.0%) |
| Office & Administration | 4 (9.8%) | 37 (90.2%) |
| Total (Category) | 13 (18.3%) | 58 (81.7%) |
| Total (Overall) | 255 (54.8%) | 210 (45.2%) |
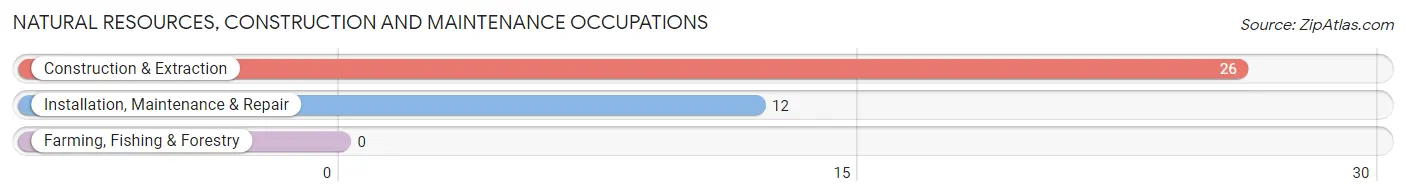
Natural Resources, Construction and Maintenance Occupations
The most common Natural Resources, Construction and Maintenance occupations in Oakland are Construction & Extraction (26 | 5.6%), and Installation, Maintenance & Repair (12 | 2.6%).
Natural Resources, Construction and Maintenance Occupations by Sex
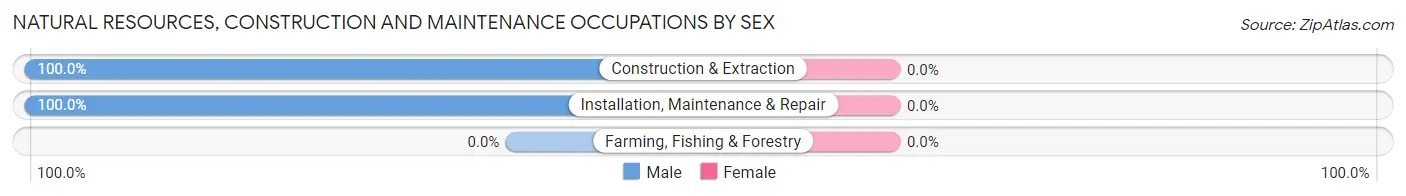
| Occupation | Male | Female |
| Farming, Fishing & Forestry | 0 (0.0%) | 0 (0.0%) |
| Construction & Extraction | 26 (100.0%) | 0 (0.0%) |
| Installation, Maintenance & Repair | 12 (100.0%) | 0 (0.0%) |
| Total (Category) | 38 (100.0%) | 0 (0.0%) |
| Total (Overall) | 255 (54.8%) | 210 (45.2%) |
Production, Transportation and Moving Occupations
The most common Production, Transportation and Moving occupations in Oakland are Transportation (63 | 13.6%), Production (26 | 5.6%), and Material Moving (14 | 3.0%).
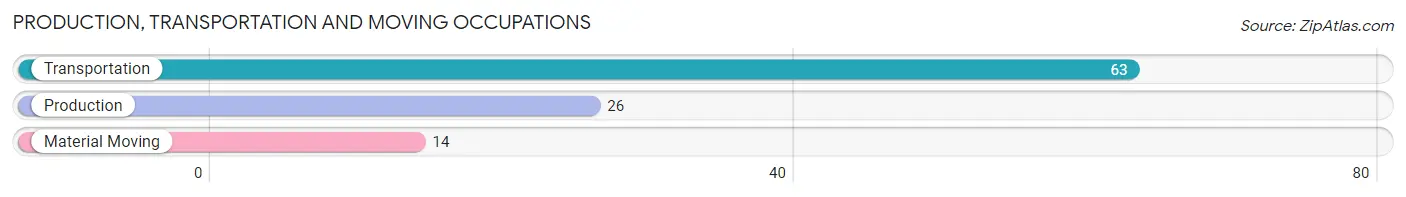
Production, Transportation and Moving Occupations by Sex
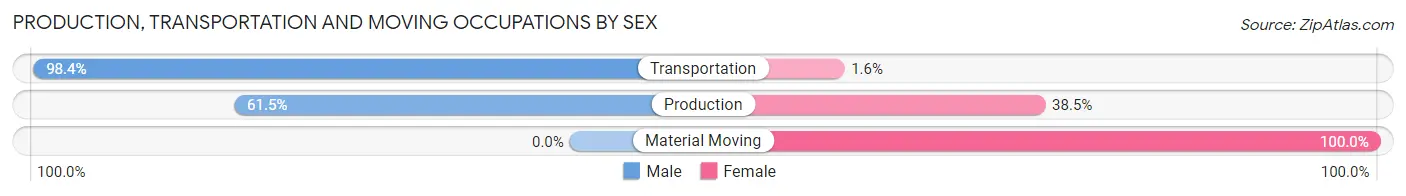
| Occupation | Male | Female |
| Production | 16 (61.5%) | 10 (38.5%) |
| Transportation | 62 (98.4%) | 1 (1.6%) |
| Material Moving | 0 (0.0%) | 14 (100.0%) |
| Total (Category) | 78 (75.7%) | 25 (24.3%) |
| Total (Overall) | 255 (54.8%) | 210 (45.2%) |
Employment Industries by Sex in Oakland
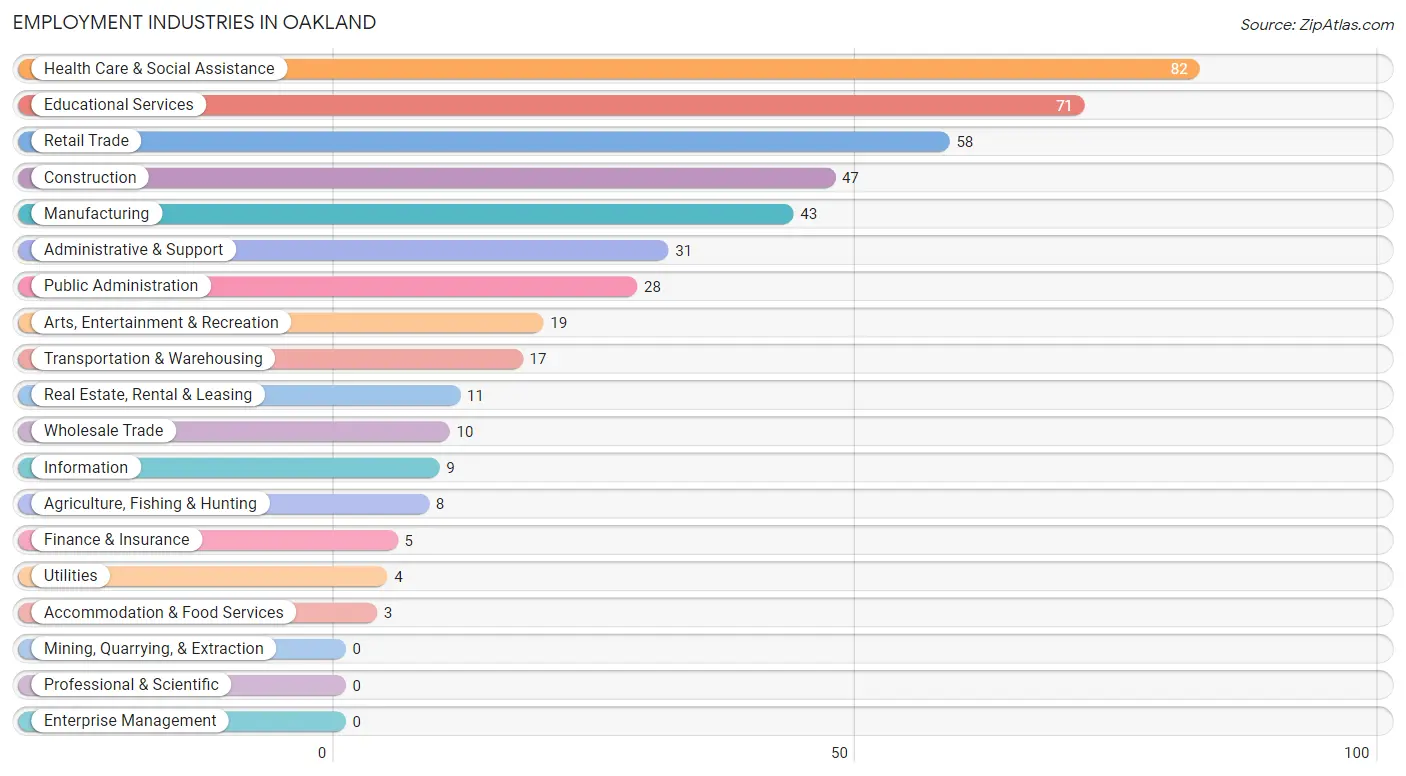
Employment Industries in Oakland
The major employment industries in Oakland include Health Care & Social Assistance (82 | 17.6%), Educational Services (71 | 15.3%), Retail Trade (58 | 12.5%), Construction (47 | 10.1%), and Manufacturing (43 | 9.2%).
Employment Industries by Sex in Oakland
The Oakland industries that see more men than women are Agriculture, Fishing & Hunting (100.0%), Construction (100.0%), and Wholesale Trade (100.0%), whereas the industries that tend to have a higher number of women are Finance & Insurance (100.0%), Retail Trade (94.8%), and Health Care & Social Assistance (82.9%).
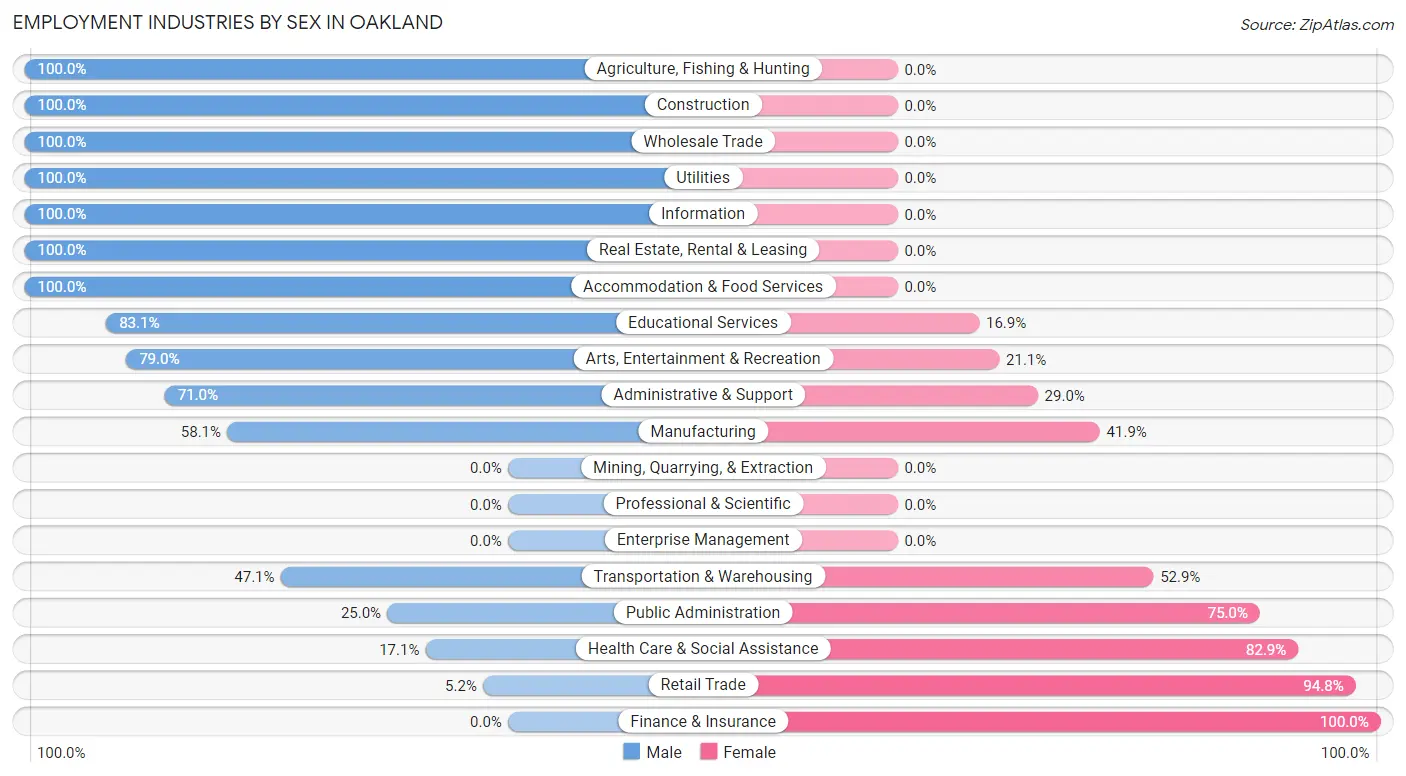
| Industry | Male | Female |
| Agriculture, Fishing & Hunting | 8 (100.0%) | 0 (0.0%) |
| Mining, Quarrying, & Extraction | 0 (0.0%) | 0 (0.0%) |
| Construction | 47 (100.0%) | 0 (0.0%) |
| Manufacturing | 25 (58.1%) | 18 (41.9%) |
| Wholesale Trade | 10 (100.0%) | 0 (0.0%) |
| Retail Trade | 3 (5.2%) | 55 (94.8%) |
| Transportation & Warehousing | 8 (47.1%) | 9 (52.9%) |
| Utilities | 4 (100.0%) | 0 (0.0%) |
| Information | 9 (100.0%) | 0 (0.0%) |
| Finance & Insurance | 0 (0.0%) | 5 (100.0%) |
| Real Estate, Rental & Leasing | 11 (100.0%) | 0 (0.0%) |
| Professional & Scientific | 0 (0.0%) | 0 (0.0%) |
| Enterprise Management | 0 (0.0%) | 0 (0.0%) |
| Administrative & Support | 22 (71.0%) | 9 (29.0%) |
| Educational Services | 59 (83.1%) | 12 (16.9%) |
| Health Care & Social Assistance | 14 (17.1%) | 68 (82.9%) |
| Arts, Entertainment & Recreation | 15 (78.9%) | 4 (21.0%) |
| Accommodation & Food Services | 3 (100.0%) | 0 (0.0%) |
| Public Administration | 7 (25.0%) | 21 (75.0%) |
| Total | 255 (54.8%) | 210 (45.2%) |
Education in Oakland
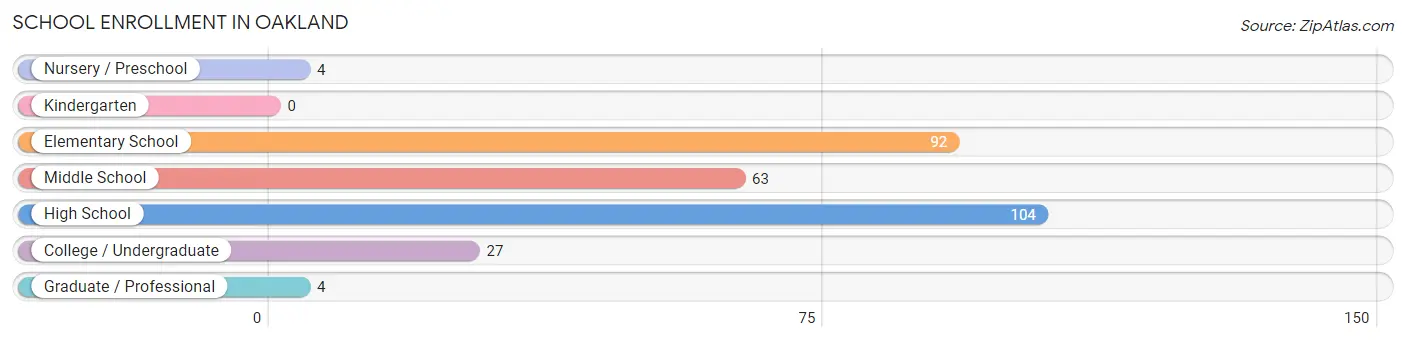
School Enrollment in Oakland
The most common levels of schooling among the 294 students in Oakland are high school (104 | 35.4%), elementary school (92 | 31.3%), and middle school (63 | 21.4%).
| School Level | # Students | % Students |
| Nursery / Preschool | 4 | 1.4% |
| Kindergarten | 0 | 0.0% |
| Elementary School | 92 | 31.3% |
| Middle School | 63 | 21.4% |
| High School | 104 | 35.4% |
| College / Undergraduate | 27 | 9.2% |
| Graduate / Professional | 4 | 1.4% |
| Total | 294 | 100.0% |
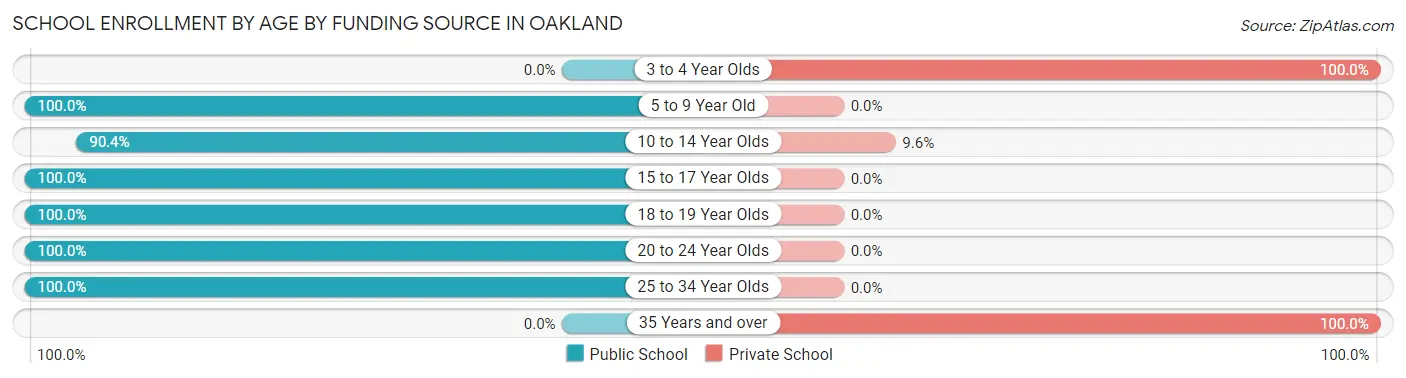
School Enrollment by Age by Funding Source in Oakland
Out of a total of 294 students who are enrolled in schools in Oakland, 15 (5.1%) attend a private institution, while the remaining 279 (94.9%) are enrolled in public schools. The age group of 3 to 4 year olds has the highest likelihood of being enrolled in private schools, with 4 (100.0% in the age bracket) enrolled. Conversely, the age group of 5 to 9 year old has the lowest likelihood of being enrolled in a private school, with 80 (100.0% in the age bracket) attending a public institution.
| Age Bracket | Public School | Private School |
| 3 to 4 Year Olds | 0 (0.0%) | 4 (100.0%) |
| 5 to 9 Year Old | 80 (100.0%) | 0 (0.0%) |
| 10 to 14 Year Olds | 75 (90.4%) | 8 (9.6%) |
| 15 to 17 Year Olds | 96 (100.0%) | 0 (0.0%) |
| 18 to 19 Year Olds | 18 (100.0%) | 0 (0.0%) |
| 20 to 24 Year Olds | 6 (100.0%) | 0 (0.0%) |
| 25 to 34 Year Olds | 4 (100.0%) | 0 (0.0%) |
| 35 Years and over | 0 (0.0%) | 3 (100.0%) |
| Total | 279 (94.9%) | 15 (5.1%) |
Educational Attainment by Field of Study in Oakland
Arts & humanities (35 | 19.9%), education (33 | 18.8%), physical & health sciences (24 | 13.6%), liberal arts & history (21 | 11.9%), and science & technology (12 | 6.8%) are the most common fields of study among 176 individuals in Oakland who have obtained a bachelor's degree or higher.
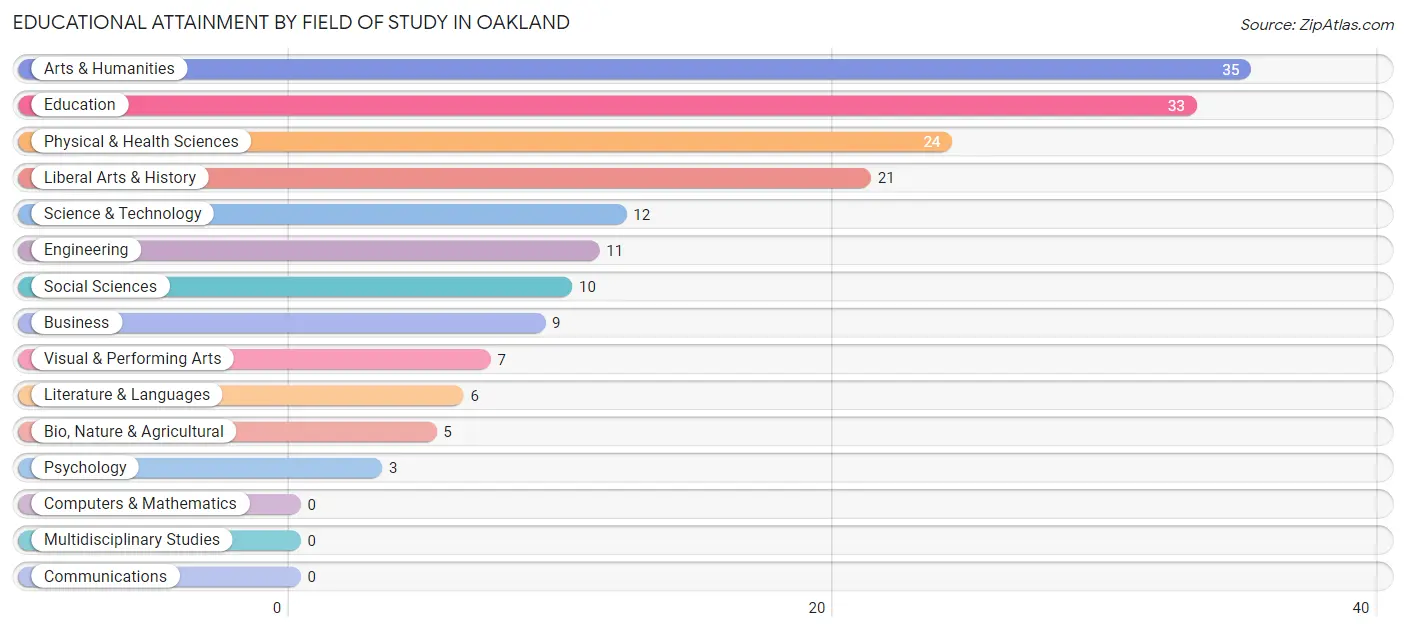
| Field of Study | # Graduates | % Graduates |
| Computers & Mathematics | 0 | 0.0% |
| Bio, Nature & Agricultural | 5 | 2.8% |
| Physical & Health Sciences | 24 | 13.6% |
| Psychology | 3 | 1.7% |
| Social Sciences | 10 | 5.7% |
| Engineering | 11 | 6.2% |
| Multidisciplinary Studies | 0 | 0.0% |
| Science & Technology | 12 | 6.8% |
| Business | 9 | 5.1% |
| Education | 33 | 18.8% |
| Literature & Languages | 6 | 3.4% |
| Liberal Arts & History | 21 | 11.9% |
| Visual & Performing Arts | 7 | 4.0% |
| Communications | 0 | 0.0% |
| Arts & Humanities | 35 | 19.9% |
| Total | 176 | 100.0% |
Transportation & Commute in Oakland
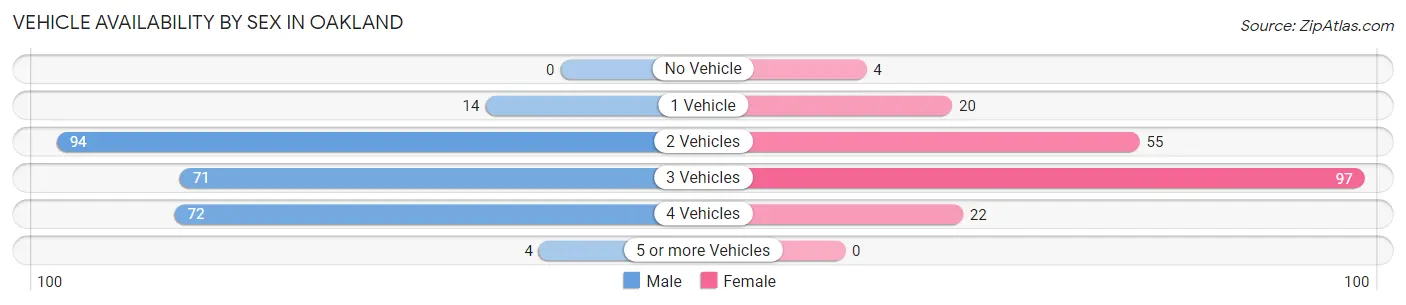
Vehicle Availability by Sex in Oakland
The most prevalent vehicle ownership categories in Oakland are males with 2 vehicles (94, accounting for 36.9%) and females with 2 vehicles (55, making up 47.5%).
| Vehicles Available | Male | Female |
| No Vehicle | 0 (0.0%) | 4 (2.0%) |
| 1 Vehicle | 14 (5.5%) | 20 (10.1%) |
| 2 Vehicles | 94 (36.9%) | 55 (27.8%) |
| 3 Vehicles | 71 (27.8%) | 97 (49.0%) |
| 4 Vehicles | 72 (28.2%) | 22 (11.1%) |
| 5 or more Vehicles | 4 (1.6%) | 0 (0.0%) |
| Total | 255 (100.0%) | 198 (100.0%) |
Commute Time in Oakland
The most frequently occuring commute durations in Oakland are 20 to 24 minutes (84 commuters, 21.5%), 5 to 9 minutes (83 commuters, 21.2%), and 10 to 14 minutes (62 commuters, 15.9%).
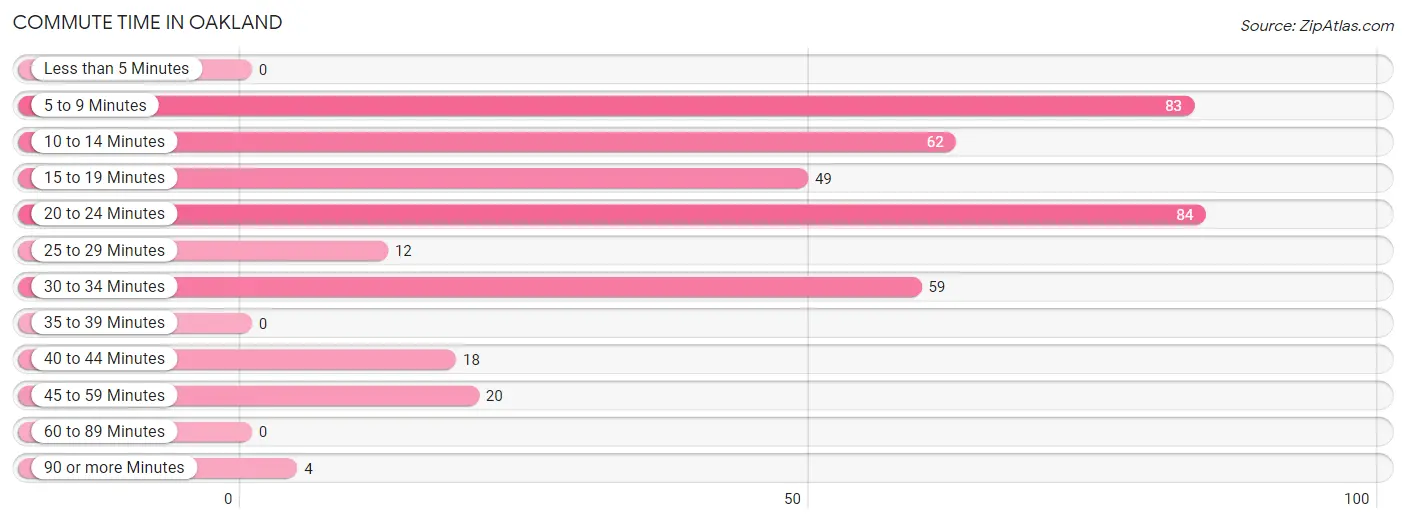
| Commute Time | # Commuters | % Commuters |
| Less than 5 Minutes | 0 | 0.0% |
| 5 to 9 Minutes | 83 | 21.2% |
| 10 to 14 Minutes | 62 | 15.9% |
| 15 to 19 Minutes | 49 | 12.5% |
| 20 to 24 Minutes | 84 | 21.5% |
| 25 to 29 Minutes | 12 | 3.1% |
| 30 to 34 Minutes | 59 | 15.1% |
| 35 to 39 Minutes | 0 | 0.0% |
| 40 to 44 Minutes | 18 | 4.6% |
| 45 to 59 Minutes | 20 | 5.1% |
| 60 to 89 Minutes | 0 | 0.0% |
| 90 or more Minutes | 4 | 1.0% |
Commute Time by Sex in Oakland
The most common commute times in Oakland are 5 to 9 minutes (65 commuters, 29.5%) for males and 20 to 24 minutes (54 commuters, 31.6%) for females.
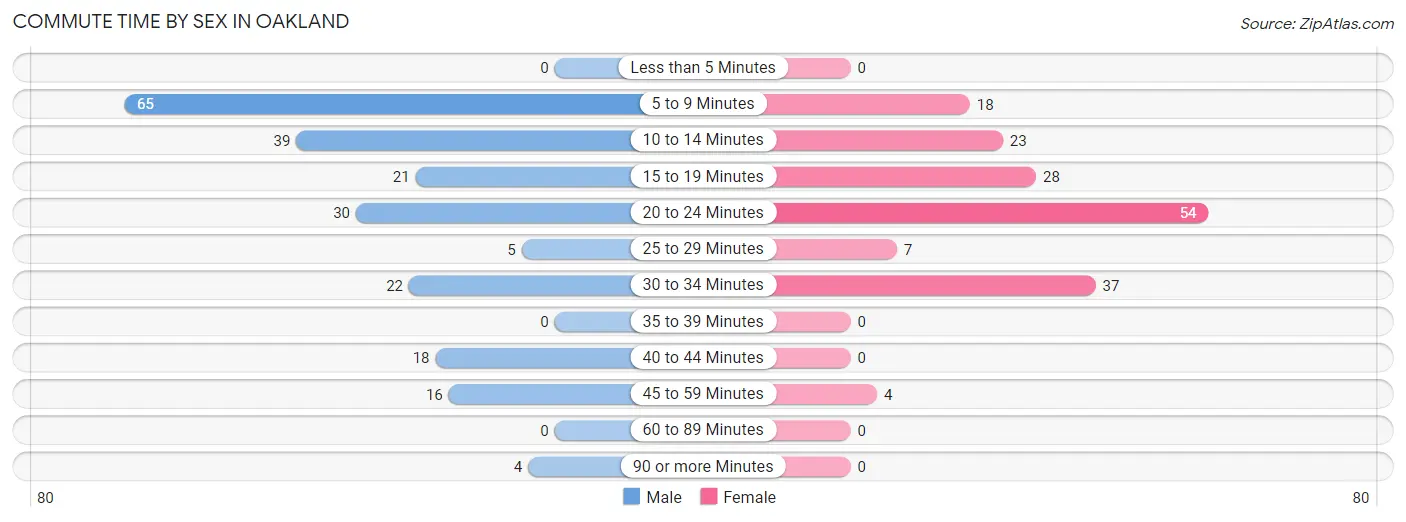
| Commute Time | Male | Female |
| Less than 5 Minutes | 0 (0.0%) | 0 (0.0%) |
| 5 to 9 Minutes | 65 (29.5%) | 18 (10.5%) |
| 10 to 14 Minutes | 39 (17.7%) | 23 (13.5%) |
| 15 to 19 Minutes | 21 (9.6%) | 28 (16.4%) |
| 20 to 24 Minutes | 30 (13.6%) | 54 (31.6%) |
| 25 to 29 Minutes | 5 (2.3%) | 7 (4.1%) |
| 30 to 34 Minutes | 22 (10.0%) | 37 (21.6%) |
| 35 to 39 Minutes | 0 (0.0%) | 0 (0.0%) |
| 40 to 44 Minutes | 18 (8.2%) | 0 (0.0%) |
| 45 to 59 Minutes | 16 (7.3%) | 4 (2.3%) |
| 60 to 89 Minutes | 0 (0.0%) | 0 (0.0%) |
| 90 or more Minutes | 4 (1.8%) | 0 (0.0%) |
Time of Departure to Work by Sex in Oakland
The most frequent times of departure to work in Oakland are 9:00 AM to 9:59 AM (65, 29.5%) for males and 8:00 AM to 8:29 AM (36, 21.0%) for females.
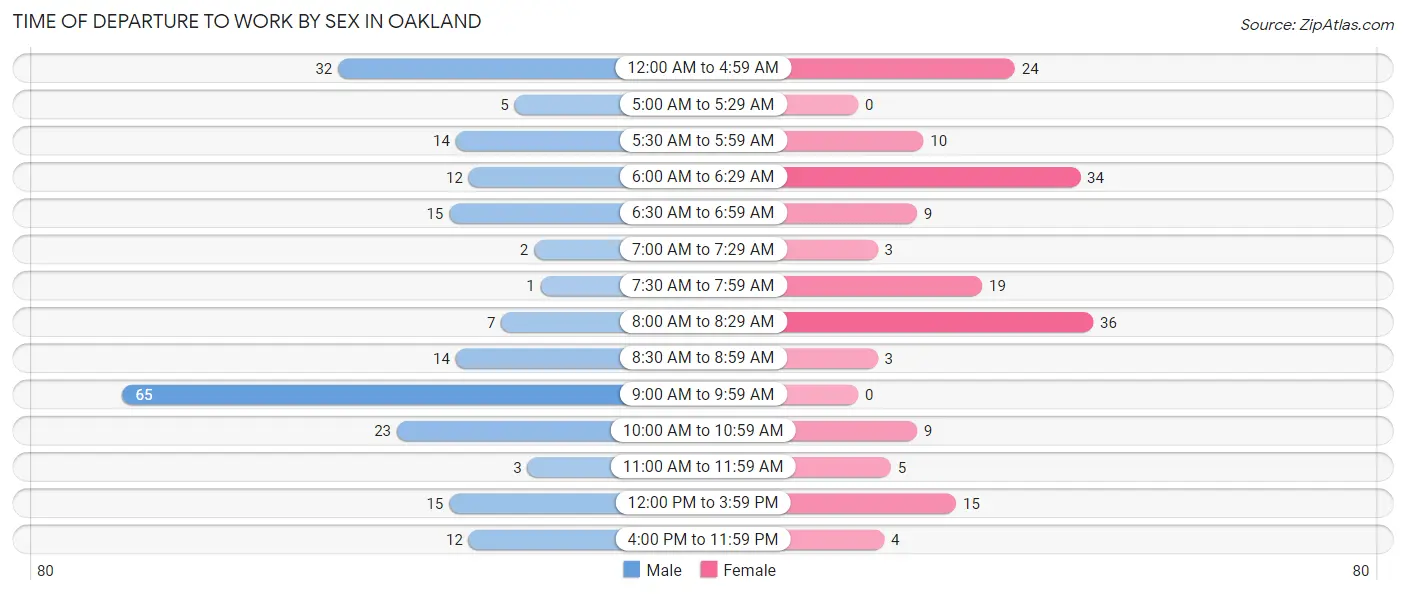
| Time of Departure | Male | Female |
| 12:00 AM to 4:59 AM | 32 (14.5%) | 24 (14.0%) |
| 5:00 AM to 5:29 AM | 5 (2.3%) | 0 (0.0%) |
| 5:30 AM to 5:59 AM | 14 (6.4%) | 10 (5.9%) |
| 6:00 AM to 6:29 AM | 12 (5.4%) | 34 (19.9%) |
| 6:30 AM to 6:59 AM | 15 (6.8%) | 9 (5.3%) |
| 7:00 AM to 7:29 AM | 2 (0.9%) | 3 (1.8%) |
| 7:30 AM to 7:59 AM | 1 (0.4%) | 19 (11.1%) |
| 8:00 AM to 8:29 AM | 7 (3.2%) | 36 (21.0%) |
| 8:30 AM to 8:59 AM | 14 (6.4%) | 3 (1.8%) |
| 9:00 AM to 9:59 AM | 65 (29.5%) | 0 (0.0%) |
| 10:00 AM to 10:59 AM | 23 (10.4%) | 9 (5.3%) |
| 11:00 AM to 11:59 AM | 3 (1.4%) | 5 (2.9%) |
| 12:00 PM to 3:59 PM | 15 (6.8%) | 15 (8.8%) |
| 4:00 PM to 11:59 PM | 12 (5.4%) | 4 (2.3%) |
| Total | 220 (100.0%) | 171 (100.0%) |
Housing Occupancy in Oakland
Occupancy by Ownership in Oakland
Of the total 504 dwellings in Oakland, owner-occupied units account for 400 (79.4%), while renter-occupied units make up 104 (20.6%).
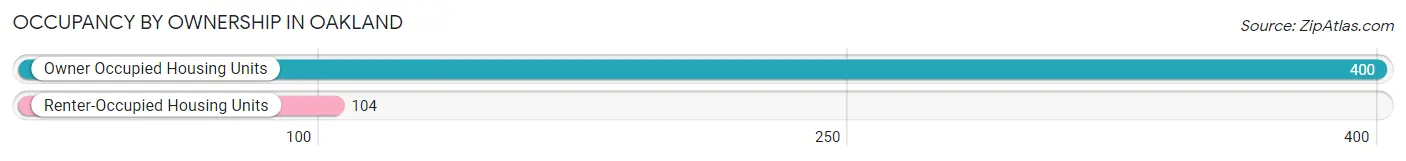
| Occupancy | # Housing Units | % Housing Units |
| Owner Occupied Housing Units | 400 | 79.4% |
| Renter-Occupied Housing Units | 104 | 20.6% |
| Total Occupied Housing Units | 504 | 100.0% |
Occupancy by Household Size in Oakland
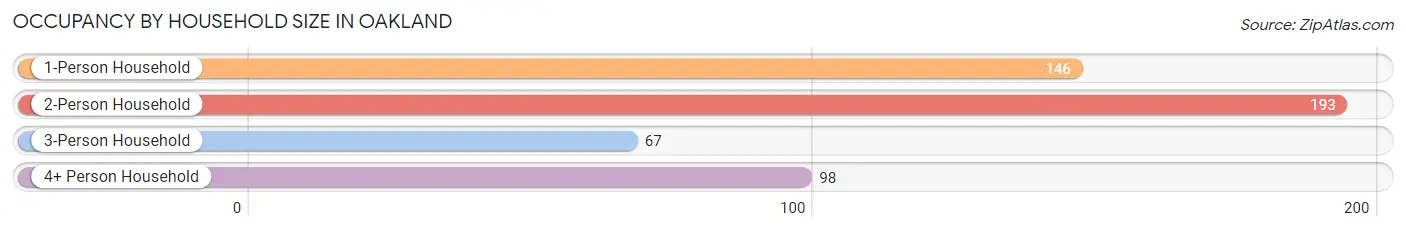
| Household Size | # Housing Units | % Housing Units |
| 1-Person Household | 146 | 29.0% |
| 2-Person Household | 193 | 38.3% |
| 3-Person Household | 67 | 13.3% |
| 4+ Person Household | 98 | 19.4% |
| Total Housing Units | 504 | 100.0% |
Occupancy by Ownership by Household Size in Oakland
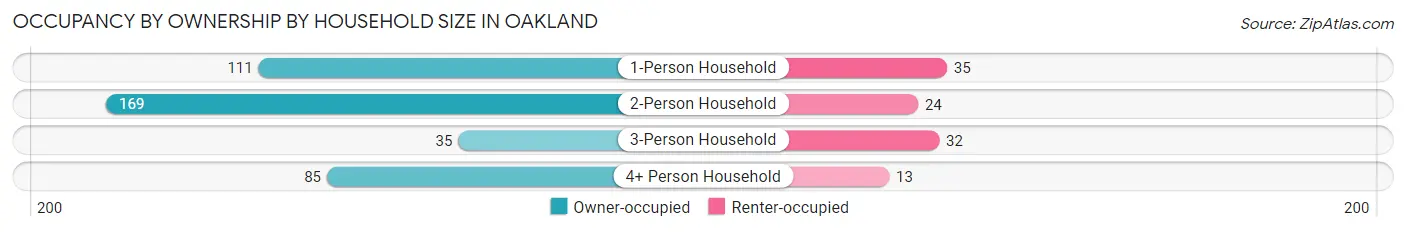
| Household Size | Owner-occupied | Renter-occupied |
| 1-Person Household | 111 (76.0%) | 35 (24.0%) |
| 2-Person Household | 169 (87.6%) | 24 (12.4%) |
| 3-Person Household | 35 (52.2%) | 32 (47.8%) |
| 4+ Person Household | 85 (86.7%) | 13 (13.3%) |
| Total Housing Units | 400 (79.4%) | 104 (20.6%) |
Occupancy by Educational Attainment in Oakland
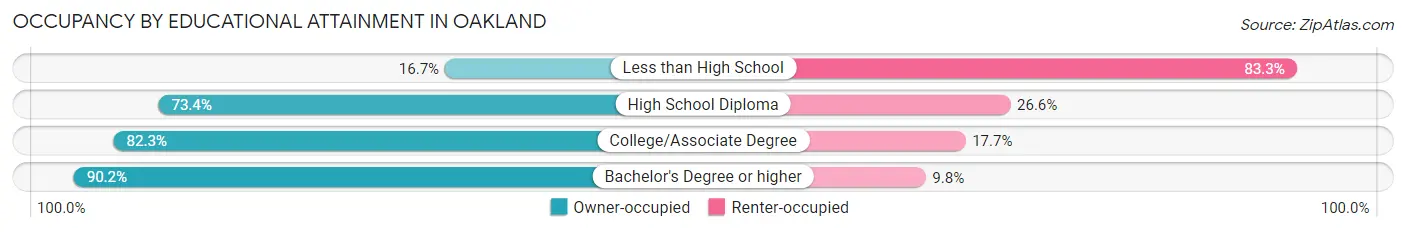
| Household Size | Owner-occupied | Renter-occupied |
| Less than High School | 4 (16.7%) | 20 (83.3%) |
| High School Diploma | 47 (73.4%) | 17 (26.6%) |
| College/Associate Degree | 275 (82.3%) | 59 (17.7%) |
| Bachelor's Degree or higher | 74 (90.2%) | 8 (9.8%) |
Occupancy by Age of Householder in Oakland
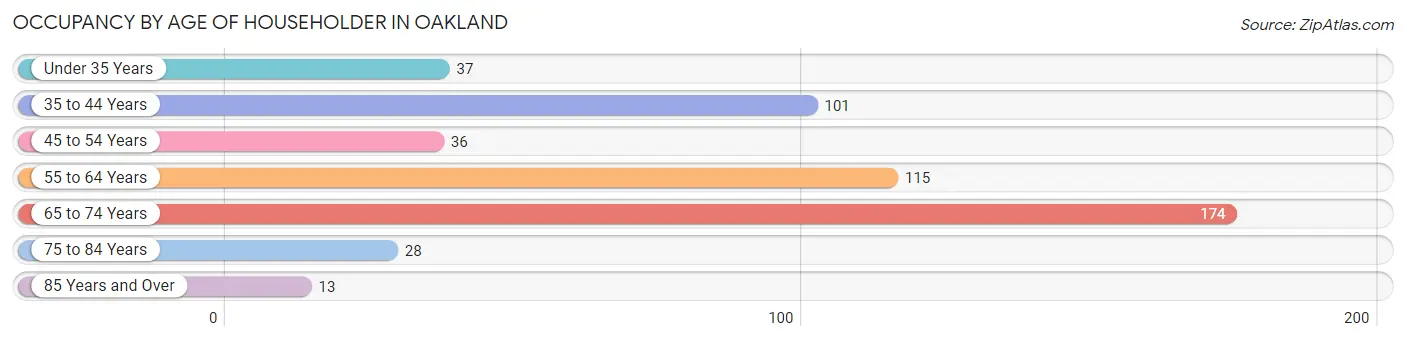
| Age Bracket | # Households | % Households |
| Under 35 Years | 37 | 7.3% |
| 35 to 44 Years | 101 | 20.0% |
| 45 to 54 Years | 36 | 7.1% |
| 55 to 64 Years | 115 | 22.8% |
| 65 to 74 Years | 174 | 34.5% |
| 75 to 84 Years | 28 | 5.6% |
| 85 Years and Over | 13 | 2.6% |
| Total | 504 | 100.0% |
Housing Finances in Oakland
Median Income by Occupancy in Oakland
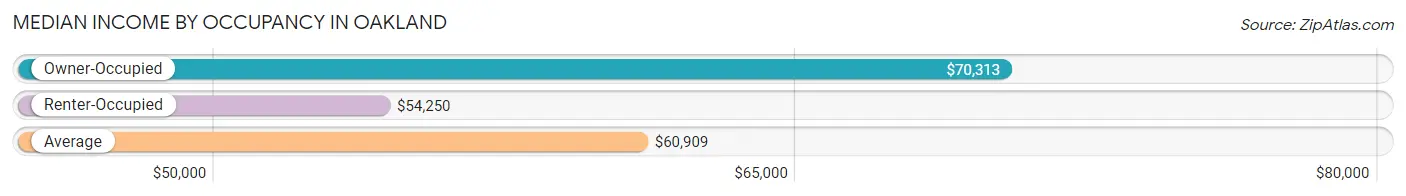
| Occupancy Type | # Households | Median Income |
| Owner-Occupied | 400 (79.4%) | $70,313 |
| Renter-Occupied | 104 (20.6%) | $54,250 |
| Average | 504 (100.0%) | $60,909 |
Occupancy by Householder Income Bracket in Oakland
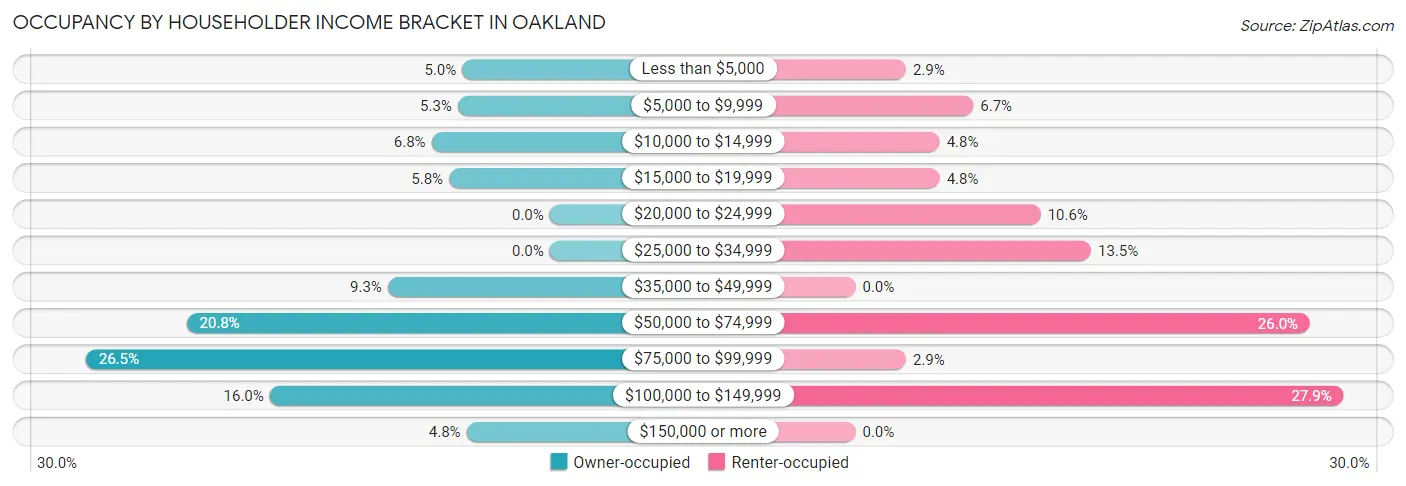
| Income Bracket | Owner-occupied | Renter-occupied |
| Less than $5,000 | 20 (5.0%) | 3 (2.9%) |
| $5,000 to $9,999 | 21 (5.2%) | 7 (6.7%) |
| $10,000 to $14,999 | 27 (6.8%) | 5 (4.8%) |
| $15,000 to $19,999 | 23 (5.8%) | 5 (4.8%) |
| $20,000 to $24,999 | 0 (0.0%) | 11 (10.6%) |
| $25,000 to $34,999 | 0 (0.0%) | 14 (13.5%) |
| $35,000 to $49,999 | 37 (9.2%) | 0 (0.0%) |
| $50,000 to $74,999 | 83 (20.7%) | 27 (26.0%) |
| $75,000 to $99,999 | 106 (26.5%) | 3 (2.9%) |
| $100,000 to $149,999 | 64 (16.0%) | 29 (27.9%) |
| $150,000 or more | 19 (4.8%) | 0 (0.0%) |
| Total | 400 (100.0%) | 104 (100.0%) |
Monthly Housing Cost Tiers in Oakland
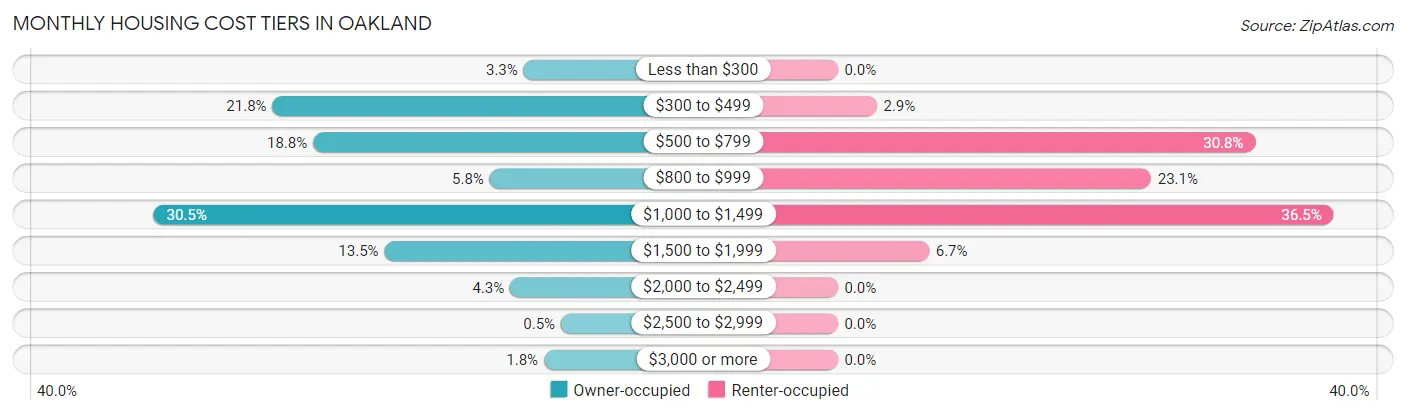
| Monthly Cost | Owner-occupied | Renter-occupied |
| Less than $300 | 13 (3.3%) | 0 (0.0%) |
| $300 to $499 | 87 (21.7%) | 3 (2.9%) |
| $500 to $799 | 75 (18.8%) | 32 (30.8%) |
| $800 to $999 | 23 (5.8%) | 24 (23.1%) |
| $1,000 to $1,499 | 122 (30.5%) | 38 (36.5%) |
| $1,500 to $1,999 | 54 (13.5%) | 7 (6.7%) |
| $2,000 to $2,499 | 17 (4.3%) | 0 (0.0%) |
| $2,500 to $2,999 | 2 (0.5%) | 0 (0.0%) |
| $3,000 or more | 7 (1.8%) | 0 (0.0%) |
| Total | 400 (100.0%) | 104 (100.0%) |
Physical Housing Characteristics in Oakland
Housing Structures in Oakland
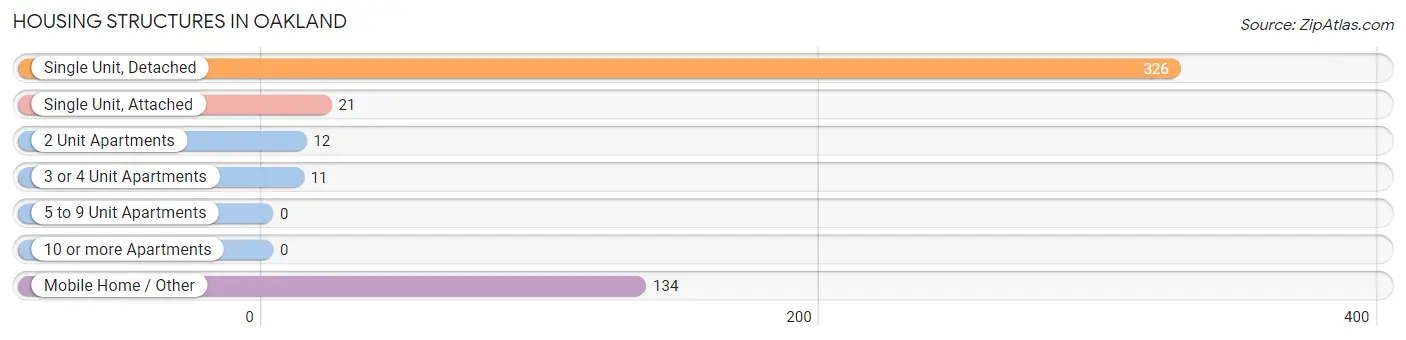
| Structure Type | # Housing Units | % Housing Units |
| Single Unit, Detached | 326 | 64.7% |
| Single Unit, Attached | 21 | 4.2% |
| 2 Unit Apartments | 12 | 2.4% |
| 3 or 4 Unit Apartments | 11 | 2.2% |
| 5 to 9 Unit Apartments | 0 | 0.0% |
| 10 or more Apartments | 0 | 0.0% |
| Mobile Home / Other | 134 | 26.6% |
| Total | 504 | 100.0% |
Housing Structures by Occupancy in Oakland
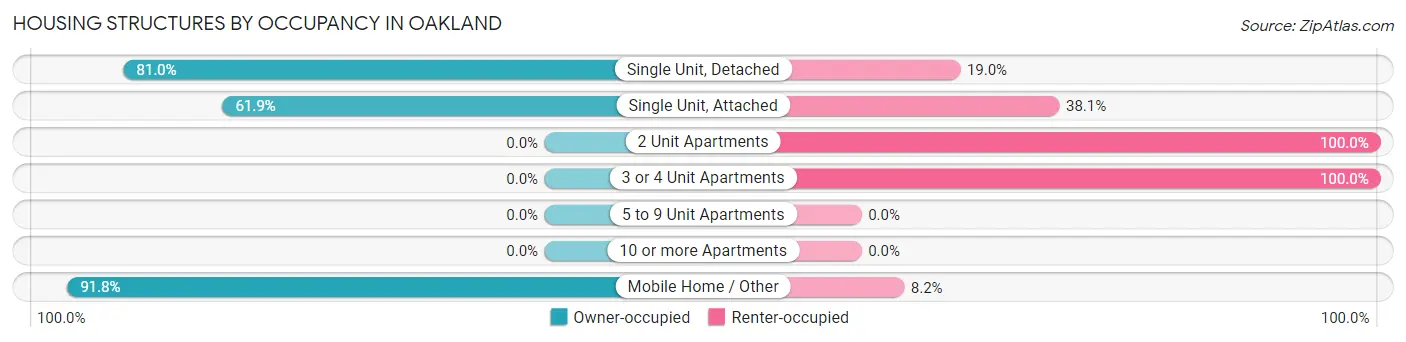
| Structure Type | Owner-occupied | Renter-occupied |
| Single Unit, Detached | 264 (81.0%) | 62 (19.0%) |
| Single Unit, Attached | 13 (61.9%) | 8 (38.1%) |
| 2 Unit Apartments | 0 (0.0%) | 12 (100.0%) |
| 3 or 4 Unit Apartments | 0 (0.0%) | 11 (100.0%) |
| 5 to 9 Unit Apartments | 0 (0.0%) | 0 (0.0%) |
| 10 or more Apartments | 0 (0.0%) | 0 (0.0%) |
| Mobile Home / Other | 123 (91.8%) | 11 (8.2%) |
| Total | 400 (79.4%) | 104 (20.6%) |
Housing Structures by Number of Rooms in Oakland
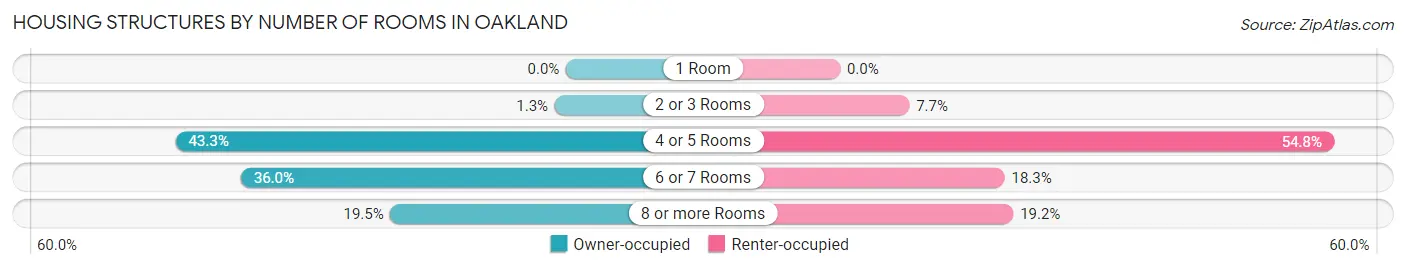
| Number of Rooms | Owner-occupied | Renter-occupied |
| 1 Room | 0 (0.0%) | 0 (0.0%) |
| 2 or 3 Rooms | 5 (1.3%) | 8 (7.7%) |
| 4 or 5 Rooms | 173 (43.2%) | 57 (54.8%) |
| 6 or 7 Rooms | 144 (36.0%) | 19 (18.3%) |
| 8 or more Rooms | 78 (19.5%) | 20 (19.2%) |
| Total | 400 (100.0%) | 104 (100.0%) |
Housing Structure by Heating Type in Oakland
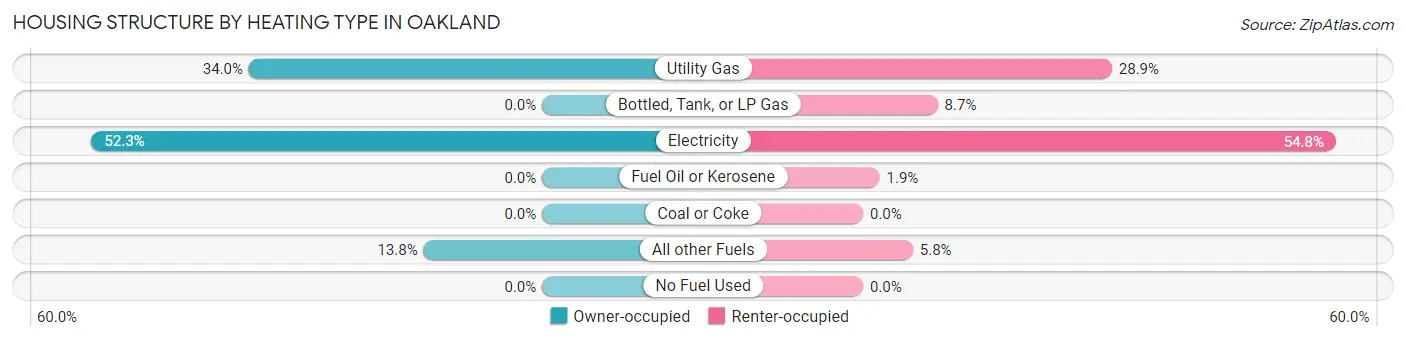
| Heating Type | Owner-occupied | Renter-occupied |
| Utility Gas | 136 (34.0%) | 30 (28.8%) |
| Bottled, Tank, or LP Gas | 0 (0.0%) | 9 (8.6%) |
| Electricity | 209 (52.2%) | 57 (54.8%) |
| Fuel Oil or Kerosene | 0 (0.0%) | 2 (1.9%) |
| Coal or Coke | 0 (0.0%) | 0 (0.0%) |
| All other Fuels | 55 (13.8%) | 6 (5.8%) |
| No Fuel Used | 0 (0.0%) | 0 (0.0%) |
| Total | 400 (100.0%) | 104 (100.0%) |
Household Vehicle Usage in Oakland
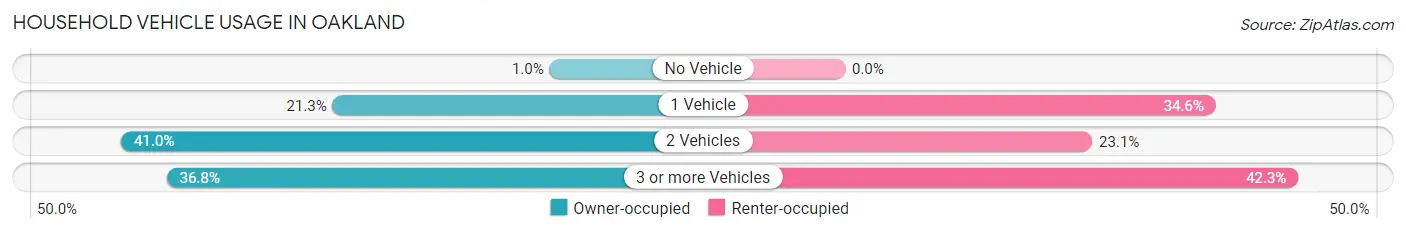
| Vehicles per Household | Owner-occupied | Renter-occupied |
| No Vehicle | 4 (1.0%) | 0 (0.0%) |
| 1 Vehicle | 85 (21.2%) | 36 (34.6%) |
| 2 Vehicles | 164 (41.0%) | 24 (23.1%) |
| 3 or more Vehicles | 147 (36.7%) | 44 (42.3%) |
| Total | 400 (100.0%) | 104 (100.0%) |
Real Estate & Mortgages in Oakland
Real Estate and Mortgage Overview in Oakland
| Characteristic | Without Mortgage | With Mortgage |
| Housing Units | 168 | 232 |
| Median Property Value | $222,700 | $327,400 |
| Median Household Income | $48,393 | $19 |
| Monthly Housing Costs | $464 | $7 |
| Real Estate Taxes | $1,888 | $0 |
Property Value by Mortgage Status in Oakland
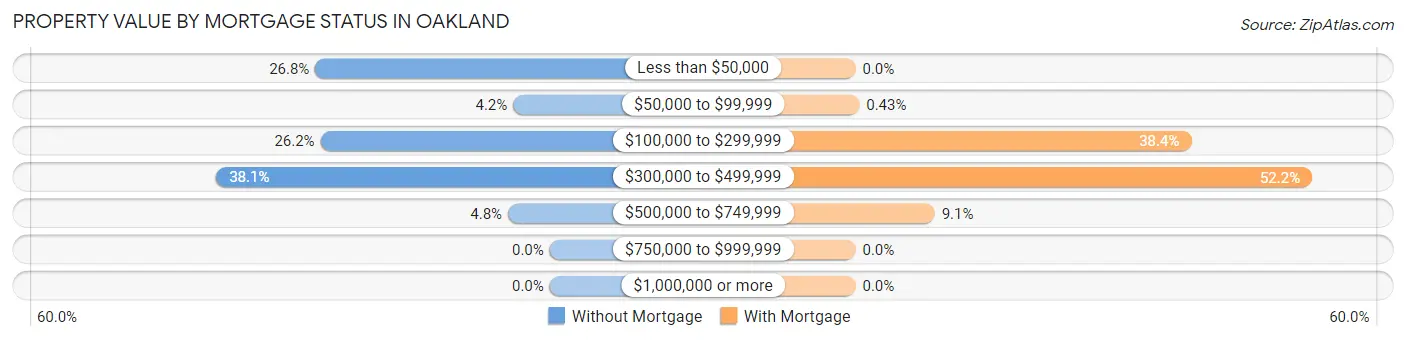
| Property Value | Without Mortgage | With Mortgage |
| Less than $50,000 | 45 (26.8%) | 0 (0.0%) |
| $50,000 to $99,999 | 7 (4.2%) | 1 (0.4%) |
| $100,000 to $299,999 | 44 (26.2%) | 89 (38.4%) |
| $300,000 to $499,999 | 64 (38.1%) | 121 (52.2%) |
| $500,000 to $749,999 | 8 (4.8%) | 21 (9.0%) |
| $750,000 to $999,999 | 0 (0.0%) | 0 (0.0%) |
| $1,000,000 or more | 0 (0.0%) | 0 (0.0%) |
| Total | 168 (100.0%) | 232 (100.0%) |
Household Income by Mortgage Status in Oakland
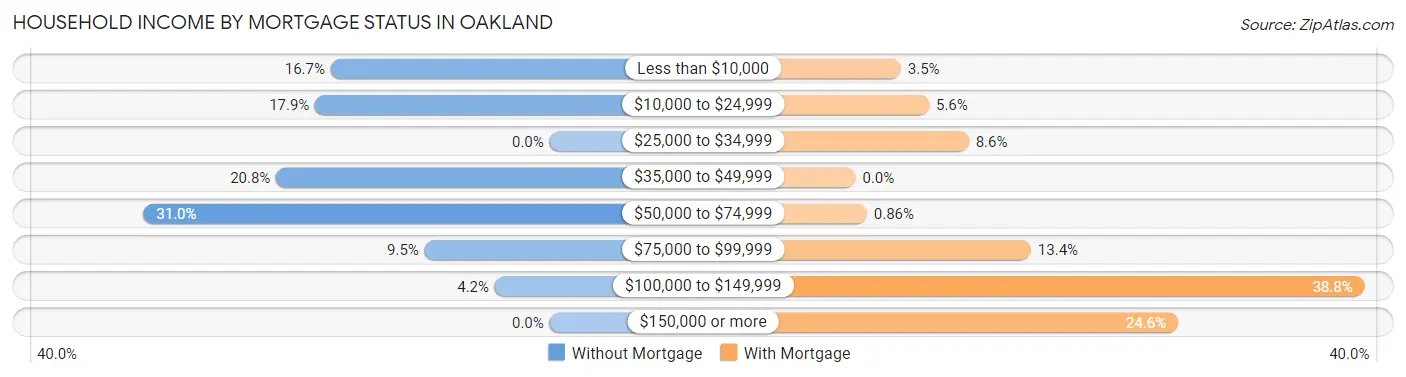
| Household Income | Without Mortgage | With Mortgage |
| Less than $10,000 | 28 (16.7%) | 8 (3.5%) |
| $10,000 to $24,999 | 30 (17.9%) | 13 (5.6%) |
| $25,000 to $34,999 | 0 (0.0%) | 20 (8.6%) |
| $35,000 to $49,999 | 35 (20.8%) | 0 (0.0%) |
| $50,000 to $74,999 | 52 (30.9%) | 2 (0.9%) |
| $75,000 to $99,999 | 16 (9.5%) | 31 (13.4%) |
| $100,000 to $149,999 | 7 (4.2%) | 90 (38.8%) |
| $150,000 or more | 0 (0.0%) | 57 (24.6%) |
| Total | 168 (100.0%) | 232 (100.0%) |
Property Value to Household Income Ratio in Oakland
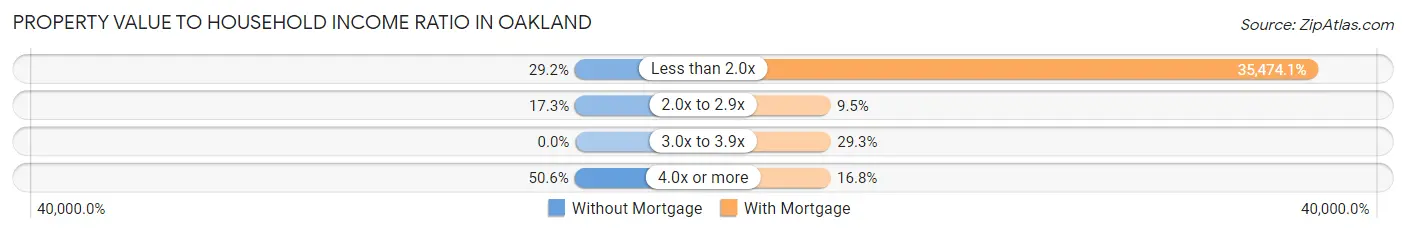
| Value-to-Income Ratio | Without Mortgage | With Mortgage |
| Less than 2.0x | 49 (29.2%) | 82,300 (35,474.1%) |
| 2.0x to 2.9x | 29 (17.3%) | 22 (9.5%) |
| 3.0x to 3.9x | 0 (0.0%) | 68 (29.3%) |
| 4.0x or more | 85 (50.6%) | 39 (16.8%) |
| Total | 168 (100.0%) | 232 (100.0%) |
Real Estate Taxes by Mortgage Status in Oakland
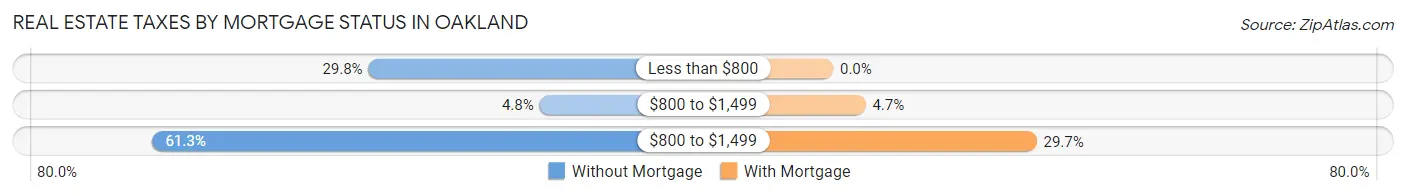
| Property Taxes | Without Mortgage | With Mortgage |
| Less than $800 | 50 (29.8%) | 0 (0.0%) |
| $800 to $1,499 | 8 (4.8%) | 11 (4.7%) |
| $800 to $1,499 | 103 (61.3%) | 69 (29.7%) |
| Total | 168 (100.0%) | 232 (100.0%) |
Health & Disability in Oakland
Health Insurance Coverage by Age in Oakland
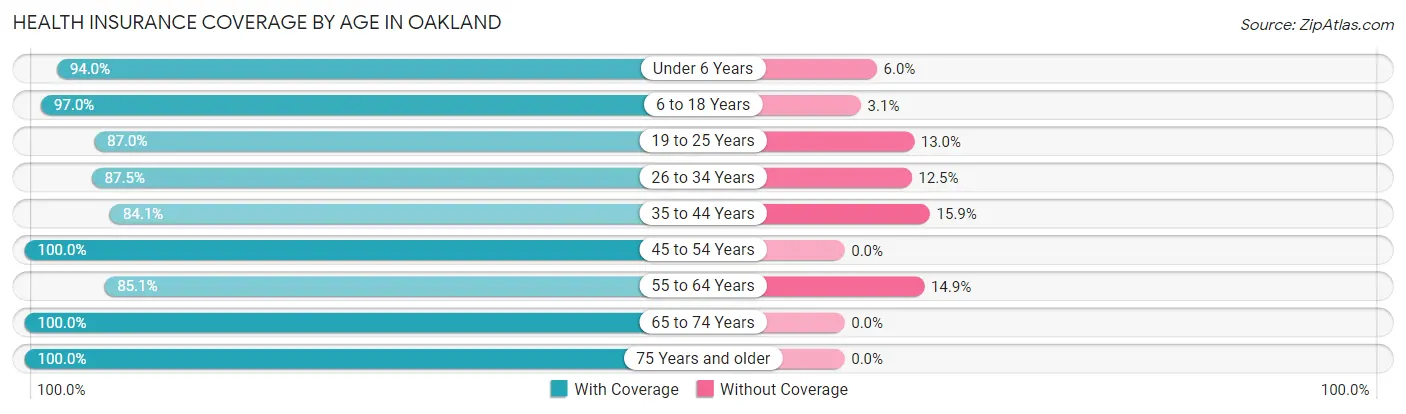
| Age Bracket | With Coverage | Without Coverage |
| Under 6 Years | 125 (94.0%) | 8 (6.0%) |
| 6 to 18 Years | 254 (97.0%) | 8 (3.0%) |
| 19 to 25 Years | 47 (87.0%) | 7 (13.0%) |
| 26 to 34 Years | 56 (87.5%) | 8 (12.5%) |
| 35 to 44 Years | 185 (84.1%) | 35 (15.9%) |
| 45 to 54 Years | 70 (100.0%) | 0 (0.0%) |
| 55 to 64 Years | 149 (85.1%) | 26 (14.9%) |
| 65 to 74 Years | 226 (100.0%) | 0 (0.0%) |
| 75 Years and older | 84 (100.0%) | 0 (0.0%) |
| Total | 1,196 (92.9%) | 92 (7.1%) |
Health Insurance Coverage by Citizenship Status in Oakland
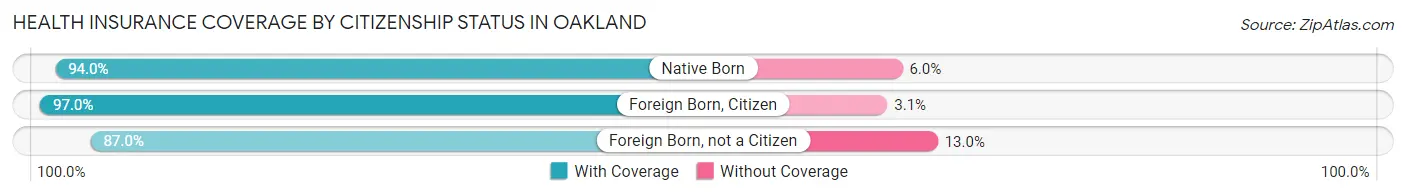
| Citizenship Status | With Coverage | Without Coverage |
| Native Born | 125 (94.0%) | 8 (6.0%) |
| Foreign Born, Citizen | 254 (97.0%) | 8 (3.0%) |
| Foreign Born, not a Citizen | 47 (87.0%) | 7 (13.0%) |
Health Insurance Coverage by Household Income in Oakland
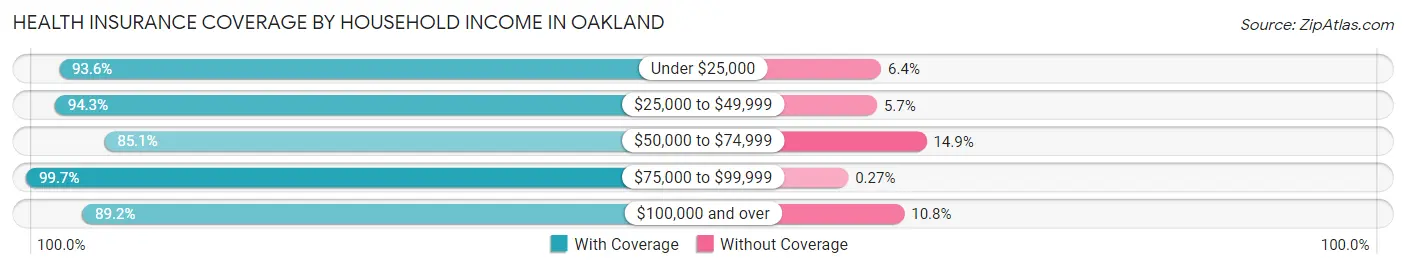
| Household Income | With Coverage | Without Coverage |
| Under $25,000 | 218 (93.6%) | 15 (6.4%) |
| $25,000 to $49,999 | 100 (94.3%) | 6 (5.7%) |
| $50,000 to $74,999 | 171 (85.1%) | 30 (14.9%) |
| $75,000 to $99,999 | 376 (99.7%) | 1 (0.3%) |
| $100,000 and over | 331 (89.2%) | 40 (10.8%) |
Public vs Private Health Insurance Coverage by Age in Oakland
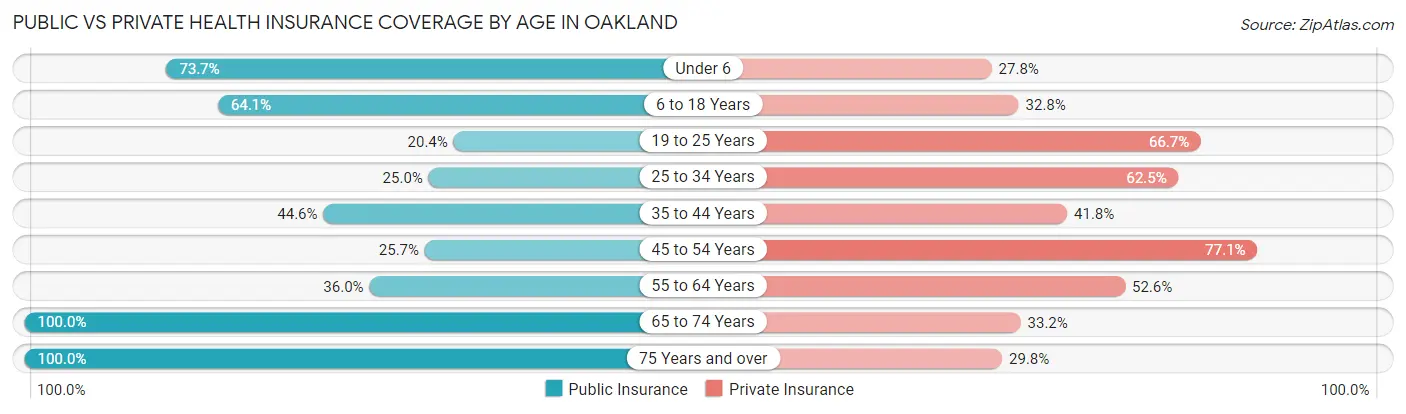
| Age Bracket | Public Insurance | Private Insurance |
| Under 6 | 98 (73.7%) | 37 (27.8%) |
| 6 to 18 Years | 168 (64.1%) | 86 (32.8%) |
| 19 to 25 Years | 11 (20.4%) | 36 (66.7%) |
| 25 to 34 Years | 16 (25.0%) | 40 (62.5%) |
| 35 to 44 Years | 98 (44.6%) | 92 (41.8%) |
| 45 to 54 Years | 18 (25.7%) | 54 (77.1%) |
| 55 to 64 Years | 63 (36.0%) | 92 (52.6%) |
| 65 to 74 Years | 226 (100.0%) | 75 (33.2%) |
| 75 Years and over | 84 (100.0%) | 25 (29.8%) |
| Total | 782 (60.7%) | 537 (41.7%) |
Disability Status by Sex by Age in Oakland
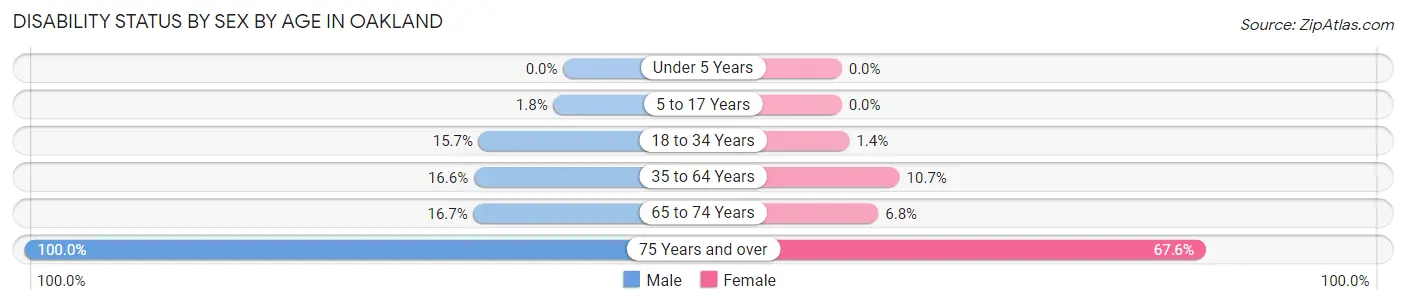
| Age Bracket | Male | Female |
| Under 5 Years | 0 (0.0%) | 0 (0.0%) |
| 5 to 17 Years | 3 (1.8%) | 0 (0.0%) |
| 18 to 34 Years | 8 (15.7%) | 1 (1.4%) |
| 35 to 64 Years | 37 (16.6%) | 26 (10.7%) |
| 65 to 74 Years | 18 (16.7%) | 8 (6.8%) |
| 75 Years and over | 47 (100.0%) | 25 (67.6%) |
Disability Class by Sex by Age in Oakland
Disability Class: Hearing Difficulty
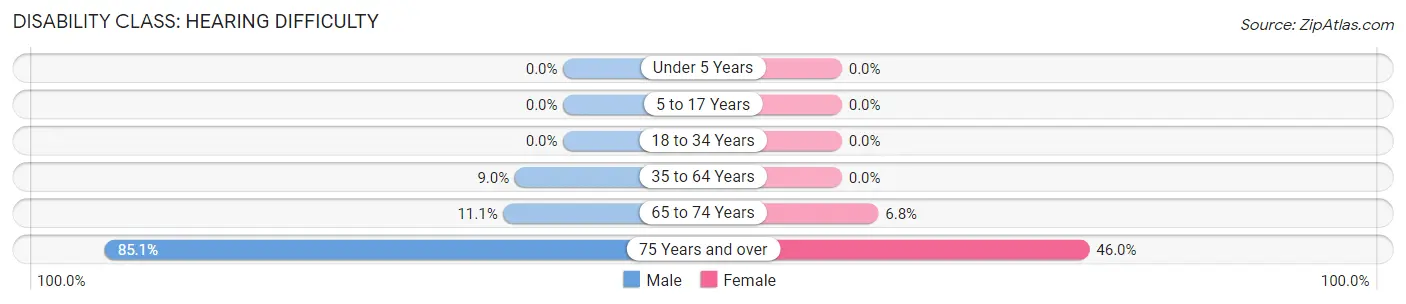
| Age Bracket | Male | Female |
| Under 5 Years | 0 (0.0%) | 0 (0.0%) |
| 5 to 17 Years | 0 (0.0%) | 0 (0.0%) |
| 18 to 34 Years | 0 (0.0%) | 0 (0.0%) |
| 35 to 64 Years | 20 (9.0%) | 0 (0.0%) |
| 65 to 74 Years | 12 (11.1%) | 8 (6.8%) |
| 75 Years and over | 40 (85.1%) | 17 (46.0%) |
Disability Class: Vision Difficulty
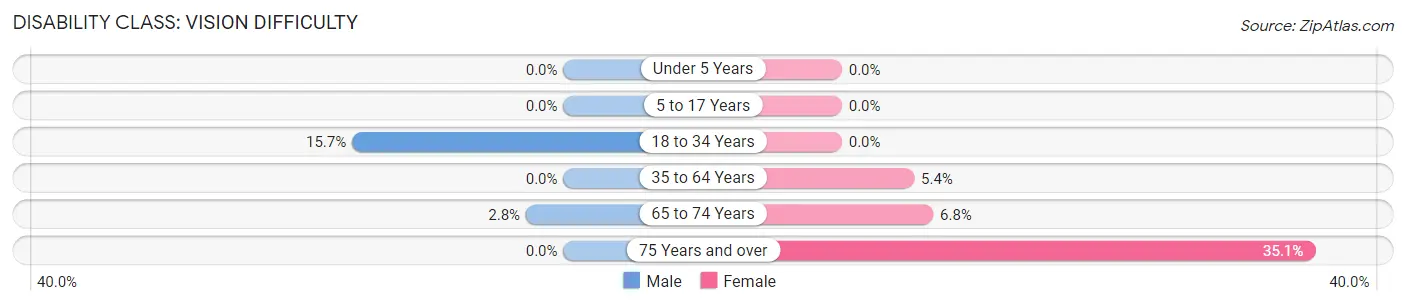
| Age Bracket | Male | Female |
| Under 5 Years | 0 (0.0%) | 0 (0.0%) |
| 5 to 17 Years | 0 (0.0%) | 0 (0.0%) |
| 18 to 34 Years | 8 (15.7%) | 0 (0.0%) |
| 35 to 64 Years | 0 (0.0%) | 13 (5.4%) |
| 65 to 74 Years | 3 (2.8%) | 8 (6.8%) |
| 75 Years and over | 0 (0.0%) | 13 (35.1%) |
Disability Class: Cognitive Difficulty
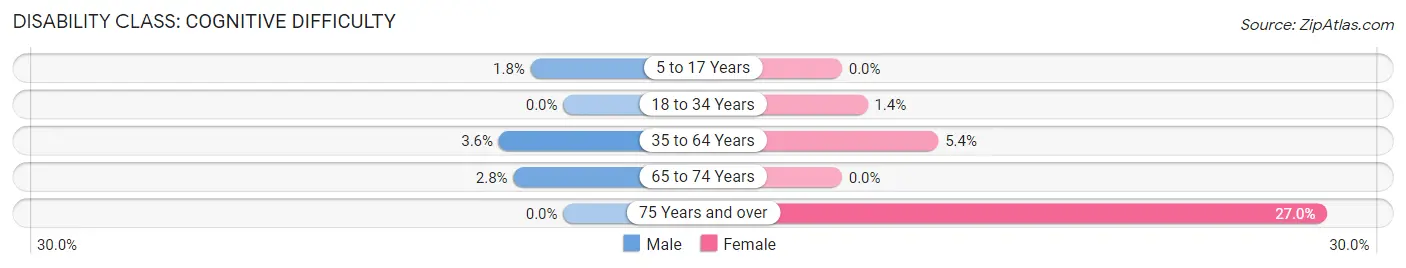
| Age Bracket | Male | Female |
| 5 to 17 Years | 3 (1.8%) | 0 (0.0%) |
| 18 to 34 Years | 0 (0.0%) | 1 (1.4%) |
| 35 to 64 Years | 8 (3.6%) | 13 (5.4%) |
| 65 to 74 Years | 3 (2.8%) | 0 (0.0%) |
| 75 Years and over | 0 (0.0%) | 10 (27.0%) |
Disability Class: Ambulatory Difficulty
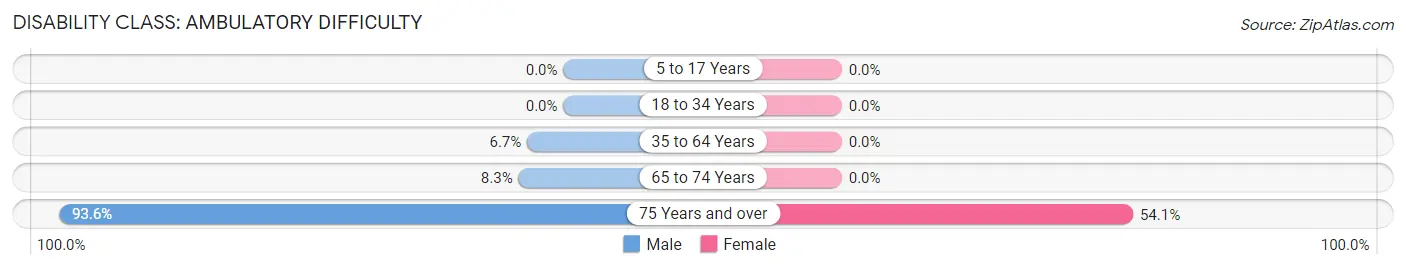
| Age Bracket | Male | Female |
| 5 to 17 Years | 0 (0.0%) | 0 (0.0%) |
| 18 to 34 Years | 0 (0.0%) | 0 (0.0%) |
| 35 to 64 Years | 15 (6.7%) | 0 (0.0%) |
| 65 to 74 Years | 9 (8.3%) | 0 (0.0%) |
| 75 Years and over | 44 (93.6%) | 20 (54.0%) |
Disability Class: Self-Care Difficulty
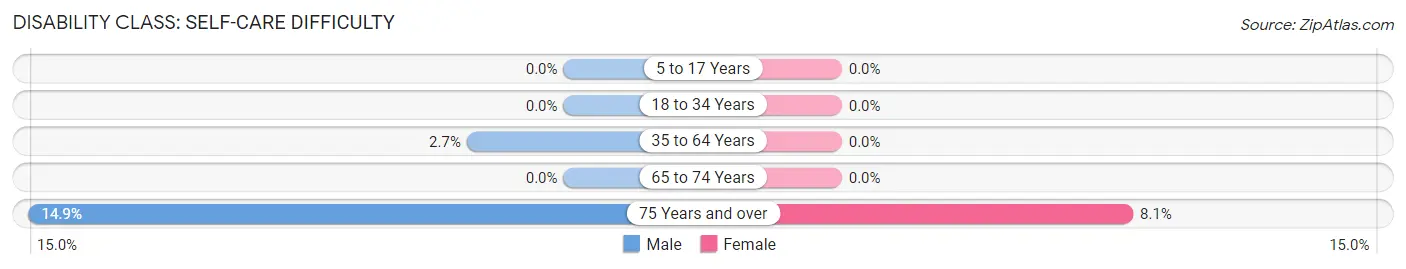
| Age Bracket | Male | Female |
| 5 to 17 Years | 0 (0.0%) | 0 (0.0%) |
| 18 to 34 Years | 0 (0.0%) | 0 (0.0%) |
| 35 to 64 Years | 6 (2.7%) | 0 (0.0%) |
| 65 to 74 Years | 0 (0.0%) | 0 (0.0%) |
| 75 Years and over | 7 (14.9%) | 3 (8.1%) |
Technology Access in Oakland
Computing Device Access in Oakland
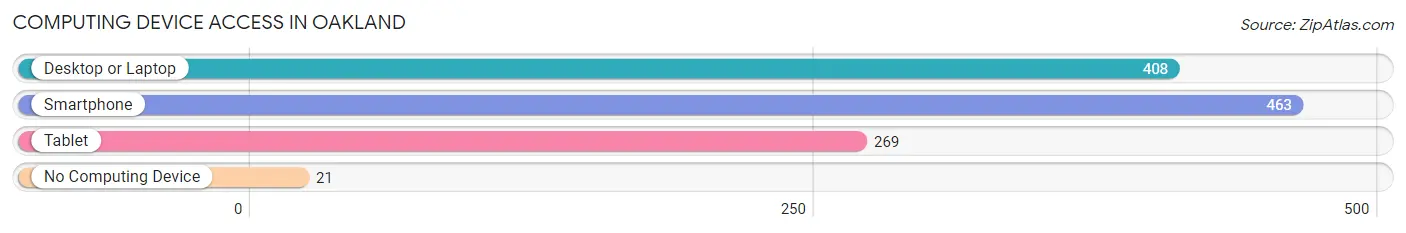
| Device Type | # Households | % Households |
| Desktop or Laptop | 408 | 80.9% |
| Smartphone | 463 | 91.9% |
| Tablet | 269 | 53.4% |
| No Computing Device | 21 | 4.2% |
| Total | 504 | 100.0% |
Internet Access in Oakland
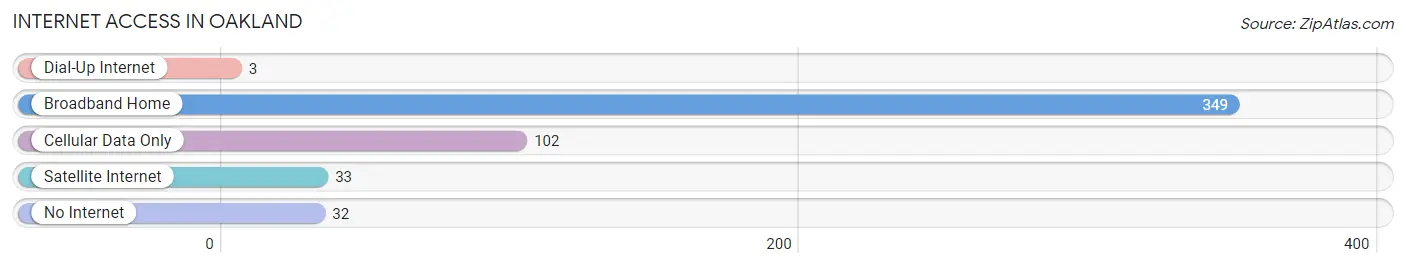
| Internet Type | # Households | % Households |
| Dial-Up Internet | 3 | 0.6% |
| Broadband Home | 349 | 69.3% |
| Cellular Data Only | 102 | 20.2% |
| Satellite Internet | 33 | 6.6% |
| No Internet | 32 | 6.4% |
| Total | 504 | 100.0% |
Oakland Summary
Oakland, Oregon is a small city located in Douglas County, Oregon, United States. It is situated on the banks of the Umpqua River, approximately 25 miles south of Roseburg. The city has a population of 1,845 as of the 2010 census, making it the second-largest city in Douglas County.
History
The area that is now Oakland was first inhabited by the Umpqua Indians, who lived in the area for thousands of years before the arrival of European settlers. The first European settlers arrived in the area in the early 1850s, and the town of Oakland was officially founded in 1853. The town was named after Oakland, California, which was the hometown of one of the first settlers.
In the late 1800s, Oakland was a bustling logging town, with several sawmills and lumber companies operating in the area. The town also had a thriving agricultural industry, with several farms and orchards in the area.
In the early 1900s, Oakland experienced a period of growth and prosperity. The town was home to several businesses, including a bank, a hotel, a movie theater, and several stores. The town also had a thriving school system, with several elementary and high schools.
Geography
Oakland is located in the Umpqua Valley, a region of rolling hills and valleys located in the foothills of the Cascade Mountains. The city is situated on the banks of the Umpqua River, approximately 25 miles south of Roseburg. The city has a total area of 1.3 square miles, all of which is land.
The climate in Oakland is mild and temperate, with warm summers and cool winters. The average annual temperature is around 50 degrees Fahrenheit, with an average high of around 75 degrees in the summer and an average low of around 35 degrees in the winter.
Economy
Oakland’s economy is largely based on agriculture and timber. The city is home to several farms and orchards, as well as several lumber companies. The city also has a thriving tourism industry, with several wineries, breweries, and other attractions in the area.
Demographics
As of the 2010 census, Oakland had a population of 1,845. The racial makeup of the city was 94.3% White, 0.7% African American, 0.7% Native American, 0.7% Asian, 0.2% Pacific Islander, 0.7% from other races, and 2.5% from two or more races. Hispanic or Latino of any race were 3.2% of the population.
The median income for a household in Oakland was $37,500, and the median income for a family was $45,000. The per capita income for the city was $19,000. About 11.3% of families and 14.2% of the population were below the poverty line, including 18.2% of those under age 18 and 8.3% of those age 65 or over.
Common Questions
What is Per Capita Income in Oakland?
Per Capita income in Oakland is $26,288.
What is the Median Family Income in Oakland?
Median Family Income in Oakland is $84,219.
What is the Median Household income in Oakland?
Median Household Income in Oakland is $60,909.
What is Income or Wage Gap in Oakland?
Income or Wage Gap in Oakland is 37.6%.
Women in Oakland earn 62.4 cents for every dollar earned by a man.
What is Inequality or Gini Index in Oakland?
Inequality or Gini Index in Oakland is 0.38.
What is the Total Population of Oakland?
Total Population of Oakland is 1,288.
What is the Total Male Population of Oakland?
Total Male Population of Oakland is 669.
What is the Total Female Population of Oakland?
Total Female Population of Oakland is 619.
What is the Ratio of Males per 100 Females in Oakland?
There are 108.08 Males per 100 Females in Oakland.
What is the Ratio of Females per 100 Males in Oakland?
There are 92.53 Females per 100 Males in Oakland.
What is the Median Population Age in Oakland?
Median Population Age in Oakland is 40.3 Years.
What is the Average Family Size in Oakland
Average Family Size in Oakland is 3.6 People.
What is the Average Household Size in Oakland
Average Household Size in Oakland is 2.6 People.
How Large is the Labor Force in Oakland?
There are 548 People in the Labor Forcein in Oakland.
What is the Percentage of People in the Labor Force in Oakland?
56.4% of People are in the Labor Force in Oakland.
What is the Unemployment Rate in Oakland?
Unemployment Rate in Oakland is 15.1%.