Dallas, OR Map & Demographics
Dallas Map
Dallas Overview
$36,897
PER CAPITA INCOME
$86,364
AVG FAMILY INCOME
$67,935
AVG HOUSEHOLD INCOME
31.0%
WAGE / INCOME GAP [ % ]
69.0¢/ $1
WAGE / INCOME GAP [ $ ]
$11,155
FAMILY INCOME DEFICIT
0.48
INEQUALITY / GINI INDEX
16,945
TOTAL POPULATION
7,965
MALE POPULATION
8,980
FEMALE POPULATION
88.70
MALES / 100 FEMALES
112.74
FEMALES / 100 MALES
41.2
MEDIAN AGE
3.0
AVG FAMILY SIZE
2.5
AVG HOUSEHOLD SIZE
7,553
LABOR FORCE [ PEOPLE ]
54.5%
PERCENT IN LABOR FORCE
5.2%
UNEMPLOYMENT RATE
Dallas Zip Codes
Dallas Area Codes
Income in Dallas
Income Overview in Dallas
Per Capita Income in Dallas is $36,897, while median incomes of families and households are $86,364 and $67,935 respectively.
| Characteristic | Number | Measure |
| Per Capita Income | 16,945 | $36,897 |
| Median Family Income | 4,320 | $86,364 |
| Mean Family Income | 4,320 | $105,268 |
| Median Household Income | 6,608 | $67,935 |
| Mean Household Income | 6,608 | $91,967 |
| Income Deficit | 4,320 | $11,155 |
| Wage / Income Gap (%) | 16,945 | 30.99% |
| Wage / Income Gap ($) | 16,945 | 69.01¢ per $1 |
| Gini / Inequality Index | 16,945 | 0.48 |
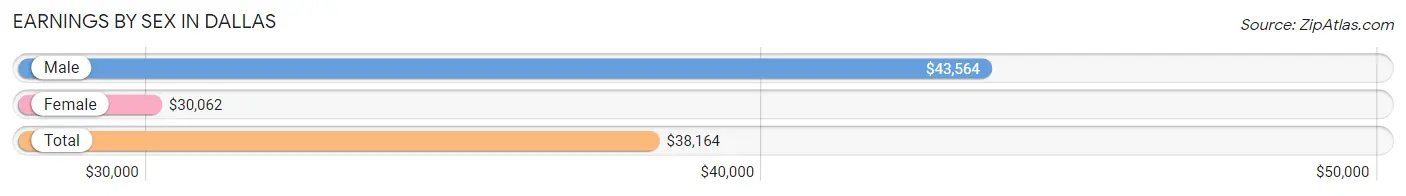
Earnings by Sex in Dallas
Average Earnings in Dallas are $38,164, $43,564 for men and $30,062 for women, a difference of 31.0%.
| Sex | Number | Average Earnings |
| Male | 4,246 (52.8%) | $43,564 |
| Female | 3,792 (47.2%) | $30,062 |
| Total | 8,038 (100.0%) | $38,164 |
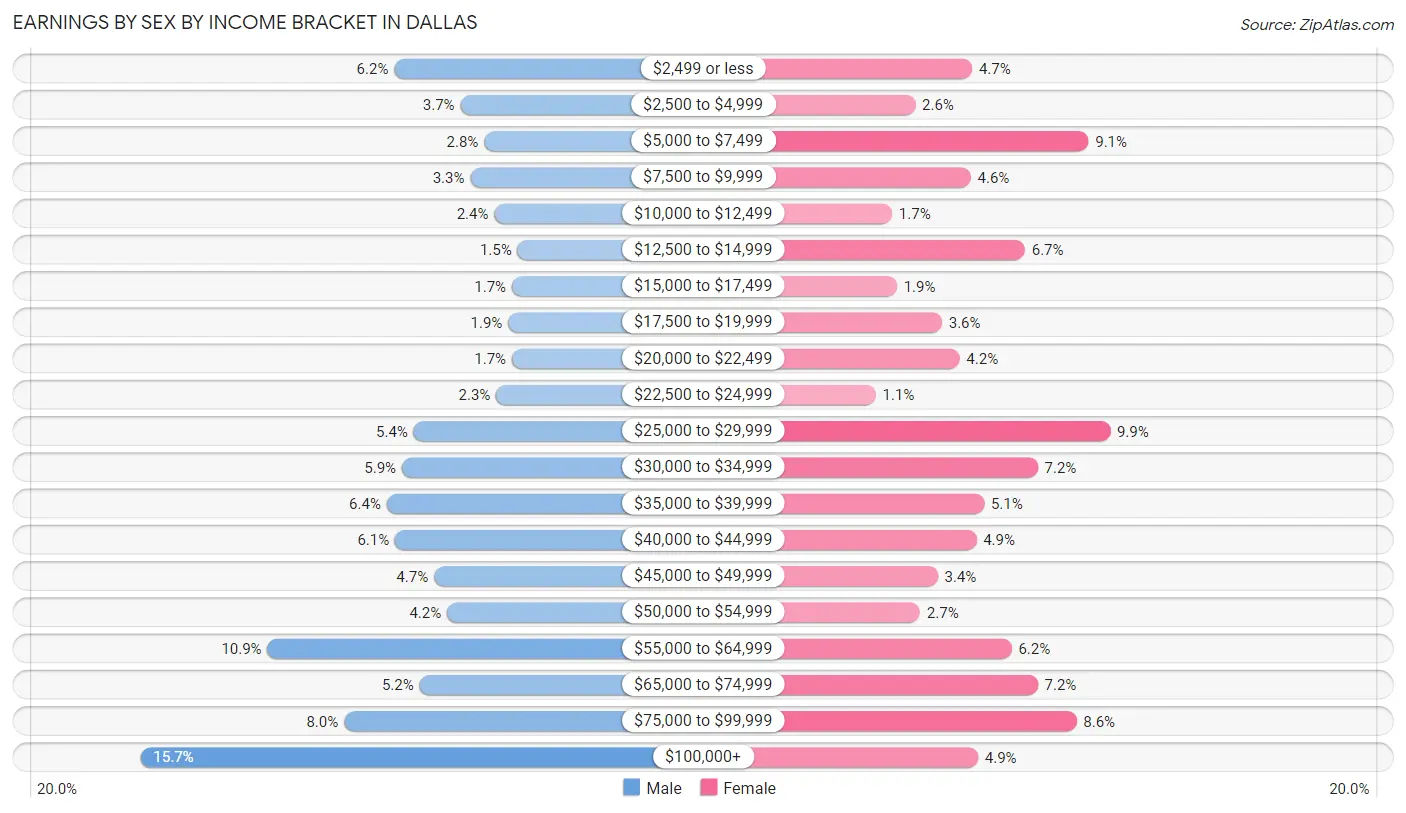
Earnings by Sex by Income Bracket in Dallas
The most common earnings brackets in Dallas are $100,000+ for men (665 | 15.7%) and $25,000 to $29,999 for women (374 | 9.9%).
| Income | Male | Female |
| $2,499 or less | 261 (6.1%) | 178 (4.7%) |
| $2,500 to $4,999 | 156 (3.7%) | 97 (2.6%) |
| $5,000 to $7,499 | 118 (2.8%) | 343 (9.0%) |
| $7,500 to $9,999 | 140 (3.3%) | 176 (4.6%) |
| $10,000 to $12,499 | 102 (2.4%) | 64 (1.7%) |
| $12,500 to $14,999 | 65 (1.5%) | 253 (6.7%) |
| $15,000 to $17,499 | 74 (1.7%) | 71 (1.9%) |
| $17,500 to $19,999 | 80 (1.9%) | 135 (3.6%) |
| $20,000 to $22,499 | 74 (1.7%) | 160 (4.2%) |
| $22,500 to $24,999 | 99 (2.3%) | 41 (1.1%) |
| $25,000 to $29,999 | 230 (5.4%) | 374 (9.9%) |
| $30,000 to $34,999 | 249 (5.9%) | 271 (7.1%) |
| $35,000 to $39,999 | 273 (6.4%) | 195 (5.1%) |
| $40,000 to $44,999 | 260 (6.1%) | 184 (4.9%) |
| $45,000 to $49,999 | 198 (4.7%) | 129 (3.4%) |
| $50,000 to $54,999 | 177 (4.2%) | 104 (2.7%) |
| $55,000 to $64,999 | 463 (10.9%) | 234 (6.2%) |
| $65,000 to $74,999 | 221 (5.2%) | 271 (7.1%) |
| $75,000 to $99,999 | 341 (8.0%) | 326 (8.6%) |
| $100,000+ | 665 (15.7%) | 186 (4.9%) |
| Total | 4,246 (100.0%) | 3,792 (100.0%) |
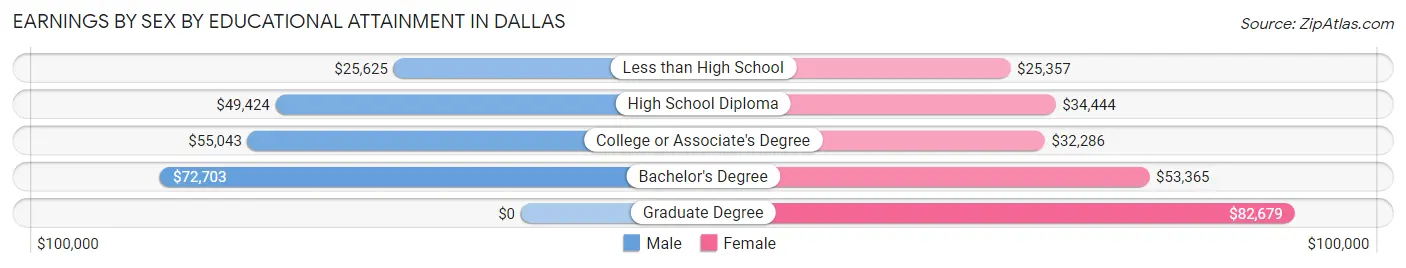
Earnings by Sex by Educational Attainment in Dallas
Average earnings in Dallas are $53,344 for men and $38,452 for women, a difference of 27.9%. Men with an educational attainment of bachelor's degree enjoy the highest average annual earnings of $72,703, while those with less than high school education earn the least with $25,625. Women with an educational attainment of graduate degree earn the most with the average annual earnings of $82,679, while those with less than high school education have the smallest earnings of $25,357.
| Educational Attainment | Male Income | Female Income |
| Less than High School | $25,625 | $25,357 |
| High School Diploma | $49,424 | $34,444 |
| College or Associate's Degree | $55,043 | $32,286 |
| Bachelor's Degree | $72,703 | $53,365 |
| Graduate Degree | - | - |
| Total | $53,344 | $38,452 |
Family Income in Dallas
Family Income Brackets in Dallas
According to the Dallas family income data, there are 998 families falling into the $100,000 to $149,999 income range, which is the most common income bracket and makes up 23.1% of all families. Conversely, the $10,000 to $14,999 income bracket is the least frequent group with only 147 families (3.4%) belonging to this category.
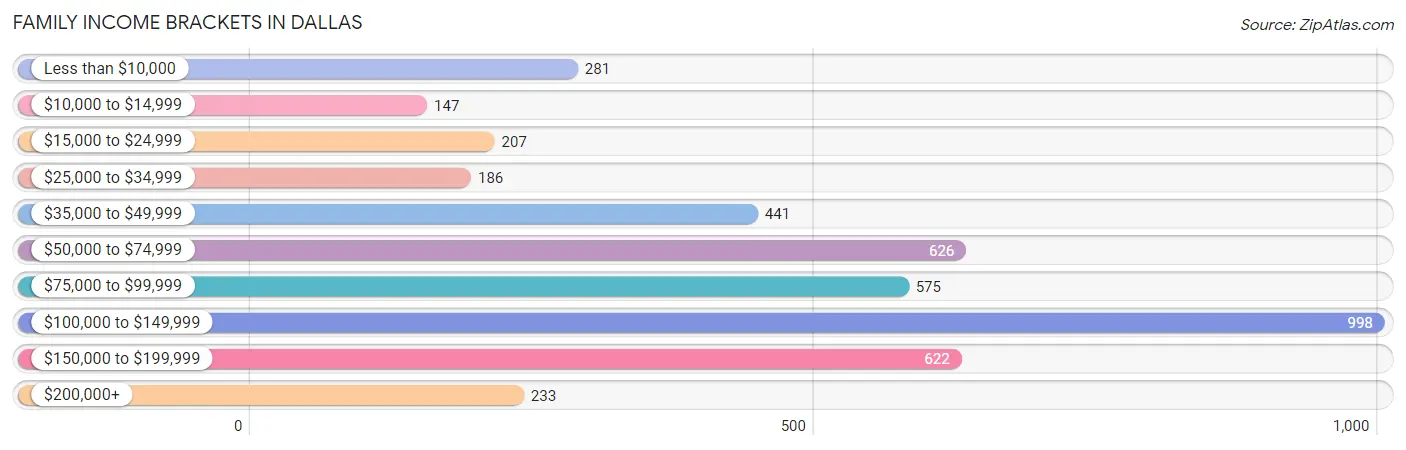
| Income Bracket | # Families | % Families |
| Less than $10,000 | 281 | 6.5% |
| $10,000 to $14,999 | 147 | 3.4% |
| $15,000 to $24,999 | 207 | 4.8% |
| $25,000 to $34,999 | 186 | 4.3% |
| $35,000 to $49,999 | 441 | 10.2% |
| $50,000 to $74,999 | 626 | 14.5% |
| $75,000 to $99,999 | 575 | 13.3% |
| $100,000 to $149,999 | 998 | 23.1% |
| $150,000 to $199,999 | 622 | 14.4% |
| $200,000+ | 233 | 5.4% |
Family Income by Famaliy Size in Dallas
4-person families (513 | 11.9%) account for the highest median family income in Dallas with $109,702 per family, while 3-person families (744 | 17.2%) have the highest median income of $36,029 per family member.
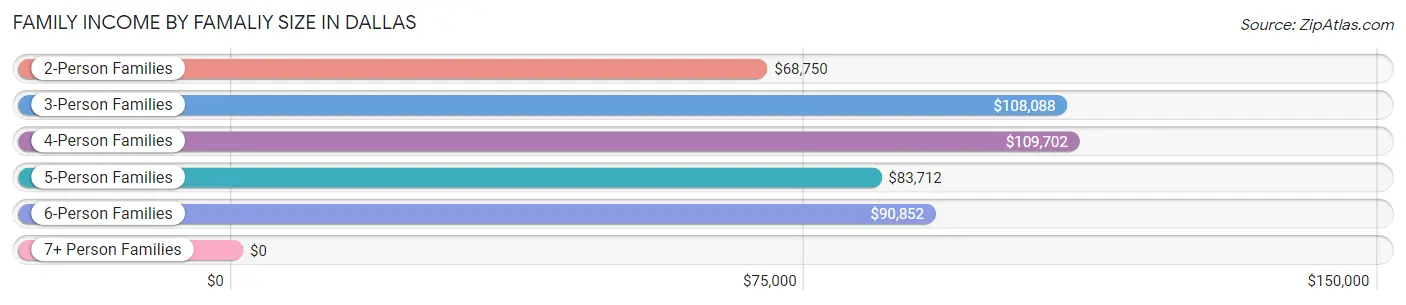
| Income Bracket | # Families | Median Income |
| 2-Person Families | 2,481 (57.4%) | $68,750 |
| 3-Person Families | 744 (17.2%) | $108,088 |
| 4-Person Families | 513 (11.9%) | $109,702 |
| 5-Person Families | 388 (9.0%) | $83,712 |
| 6-Person Families | 79 (1.8%) | $90,852 |
| 7+ Person Families | 115 (2.7%) | $0 |
| Total | 4,320 (100.0%) | $86,364 |
Family Income by Number of Earners in Dallas
The median family income in Dallas is $86,364, with families comprising 2 earners (1,481) having the highest median family income of $125,727, while families with no earners (1,383) have the lowest median family income of $40,685, accounting for 34.3% and 32.0% of families, respectively.
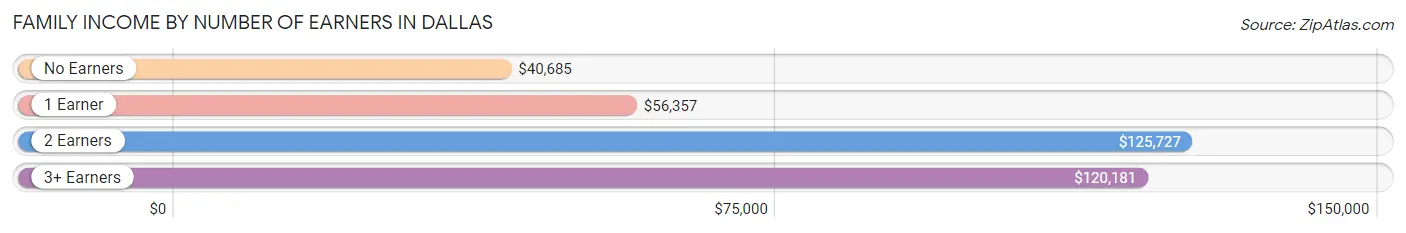
| Number of Earners | # Families | Median Income |
| No Earners | 1,383 (32.0%) | $40,685 |
| 1 Earner | 922 (21.3%) | $56,357 |
| 2 Earners | 1,481 (34.3%) | $125,727 |
| 3+ Earners | 534 (12.4%) | $120,181 |
| Total | 4,320 (100.0%) | $86,364 |
Household Income in Dallas
Household Income Brackets in Dallas
With 1,209 households falling in the category, the $100,000 to $149,999 income range is the most frequent in Dallas, accounting for 18.3% of all households. In contrast, only 350 households (5.3%) fall into the $10,000 to $14,999 income bracket, making it the least populous group.
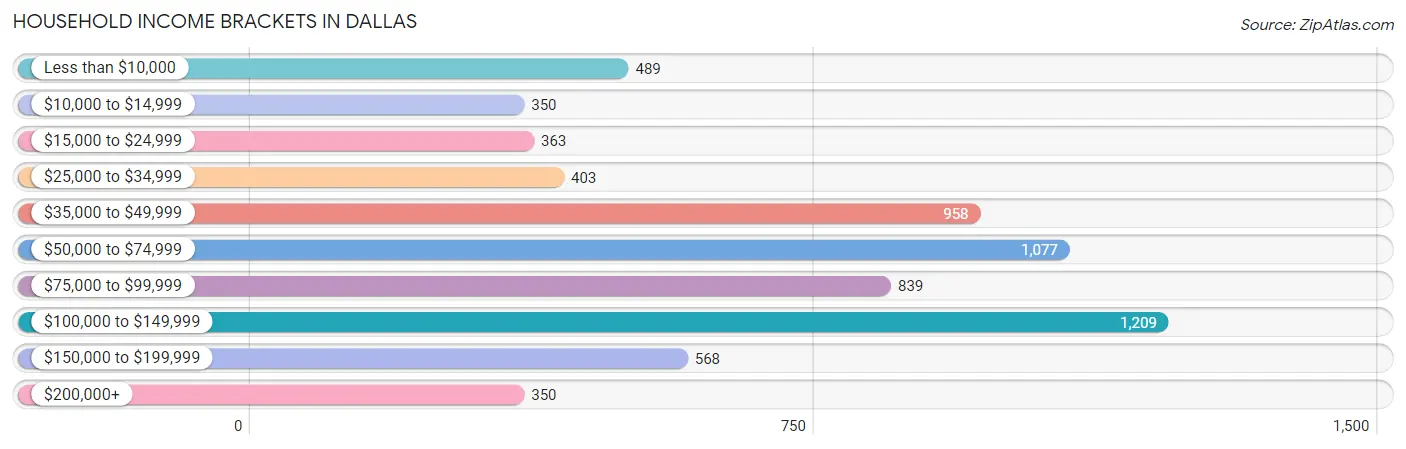
| Income Bracket | # Households | % Households |
| Less than $10,000 | 489 | 7.4% |
| $10,000 to $14,999 | 350 | 5.3% |
| $15,000 to $24,999 | 363 | 5.5% |
| $25,000 to $34,999 | 403 | 6.1% |
| $35,000 to $49,999 | 958 | 14.5% |
| $50,000 to $74,999 | 1,077 | 16.3% |
| $75,000 to $99,999 | 839 | 12.7% |
| $100,000 to $149,999 | 1,209 | 18.3% |
| $150,000 to $199,999 | 568 | 8.6% |
| $200,000+ | 350 | 5.3% |
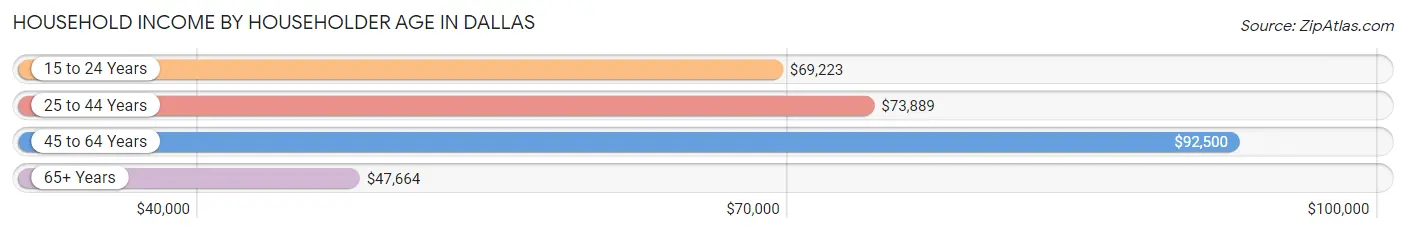
Household Income by Householder Age in Dallas
The median household income in Dallas is $67,935, with the highest median household income of $92,500 found in the 45 to 64 years age bracket for the primary householder. A total of 2,054 households (31.1%) fall into this category. Meanwhile, the 65+ years age bracket for the primary householder has the lowest median household income of $47,664, with 2,346 households (35.5%) in this group.
| Income Bracket | # Households | Median Income |
| 15 to 24 Years | 446 (6.8%) | $69,223 |
| 25 to 44 Years | 1,762 (26.7%) | $73,889 |
| 45 to 64 Years | 2,054 (31.1%) | $92,500 |
| 65+ Years | 2,346 (35.5%) | $47,664 |
| Total | 6,608 (100.0%) | $67,935 |
Poverty in Dallas
Income Below Poverty by Sex and Age in Dallas
With 12.6% poverty level for males and 17.9% for females among the residents of Dallas, 15 year old males and 5 year old females are the most vulnerable to poverty, with 54 males (36.2%) and 83 females (57.2%) in their respective age groups living below the poverty level.
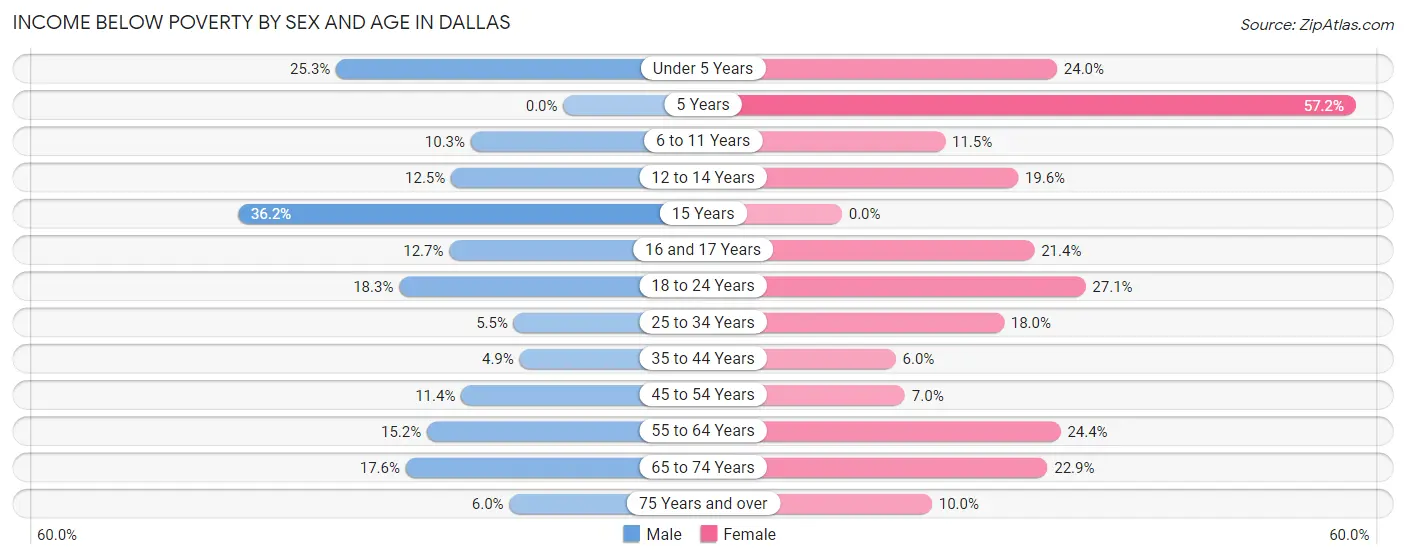
| Age Bracket | Male | Female |
| Under 5 Years | 146 (25.3%) | 108 (23.9%) |
| 5 Years | 0 (0.0%) | 83 (57.2%) |
| 6 to 11 Years | 44 (10.3%) | 62 (11.5%) |
| 12 to 14 Years | 35 (12.5%) | 62 (19.6%) |
| 15 Years | 54 (36.2%) | 0 (0.0%) |
| 16 and 17 Years | 32 (12.7%) | 27 (21.4%) |
| 18 to 24 Years | 164 (18.3%) | 283 (27.1%) |
| 25 to 34 Years | 61 (5.5%) | 177 (18.0%) |
| 35 to 44 Years | 40 (4.9%) | 47 (6.0%) |
| 45 to 54 Years | 107 (11.4%) | 70 (7.0%) |
| 55 to 64 Years | 133 (15.2%) | 233 (24.3%) |
| 65 to 74 Years | 126 (17.5%) | 326 (22.9%) |
| 75 Years and over | 41 (6.0%) | 92 (10.0%) |
| Total | 983 (12.6%) | 1,570 (17.9%) |
Income Above Poverty by Sex and Age in Dallas
According to the poverty statistics in Dallas, males aged 5 years and females aged 15 years are the age groups that are most secure financially, with 100.0% of males and 100.0% of females in these age groups living above the poverty line.
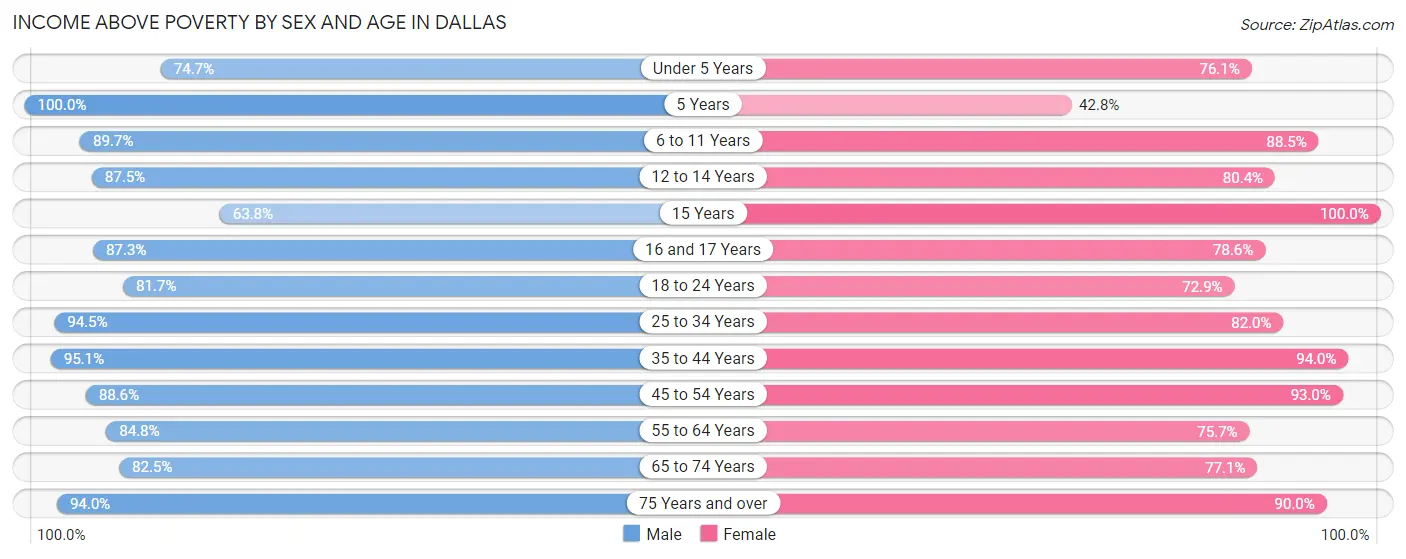
| Age Bracket | Male | Female |
| Under 5 Years | 431 (74.7%) | 343 (76.0%) |
| 5 Years | 69 (100.0%) | 62 (42.8%) |
| 6 to 11 Years | 383 (89.7%) | 477 (88.5%) |
| 12 to 14 Years | 245 (87.5%) | 254 (80.4%) |
| 15 Years | 95 (63.8%) | 87 (100.0%) |
| 16 and 17 Years | 220 (87.3%) | 99 (78.6%) |
| 18 to 24 Years | 733 (81.7%) | 760 (72.9%) |
| 25 to 34 Years | 1,044 (94.5%) | 804 (82.0%) |
| 35 to 44 Years | 782 (95.1%) | 737 (94.0%) |
| 45 to 54 Years | 834 (88.6%) | 926 (93.0%) |
| 55 to 64 Years | 743 (84.8%) | 724 (75.6%) |
| 65 to 74 Years | 592 (82.5%) | 1,098 (77.1%) |
| 75 Years and over | 641 (94.0%) | 826 (90.0%) |
| Total | 6,812 (87.4%) | 7,197 (82.1%) |
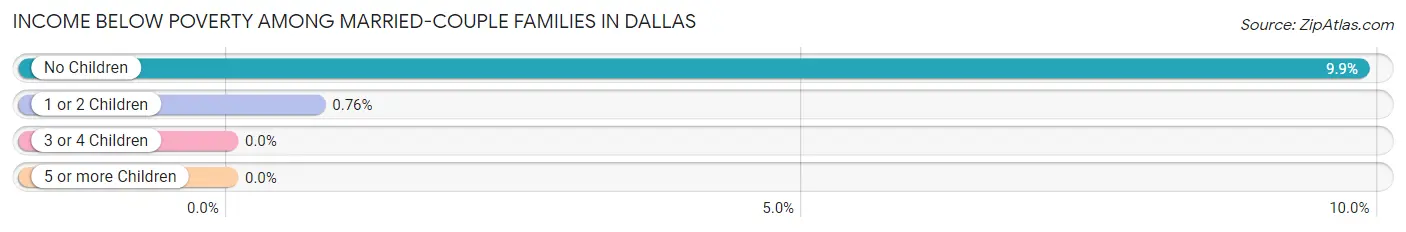
Income Below Poverty Among Married-Couple Families in Dallas
The poverty statistics for married-couple families in Dallas show that 6.2% or 207 of the total 3,356 families live below the poverty line. Families with no children have the highest poverty rate of 9.9%, comprising of 199 families. On the other hand, families with 3 or 4 children have the lowest poverty rate of 0.0%, which includes 0 families.
| Children | Above Poverty | Below Poverty |
| No Children | 1,822 (90.1%) | 199 (9.9%) |
| 1 or 2 Children | 1,040 (99.2%) | 8 (0.8%) |
| 3 or 4 Children | 233 (100.0%) | 0 (0.0%) |
| 5 or more Children | 54 (100.0%) | 0 (0.0%) |
| Total | 3,149 (93.8%) | 207 (6.2%) |
Income Below Poverty Among Single-Parent Households in Dallas
According to the poverty data in Dallas, 38.7% or 106 single-father households and 32.3% or 223 single-mother households are living below the poverty line. Among single-father households, those with 5 or more children have the highest poverty rate, with 30 households (100.0%) experiencing poverty. Likewise, among single-mother households, those with 3 or 4 children have the highest poverty rate, with 44 households (83.0%) falling below the poverty line.
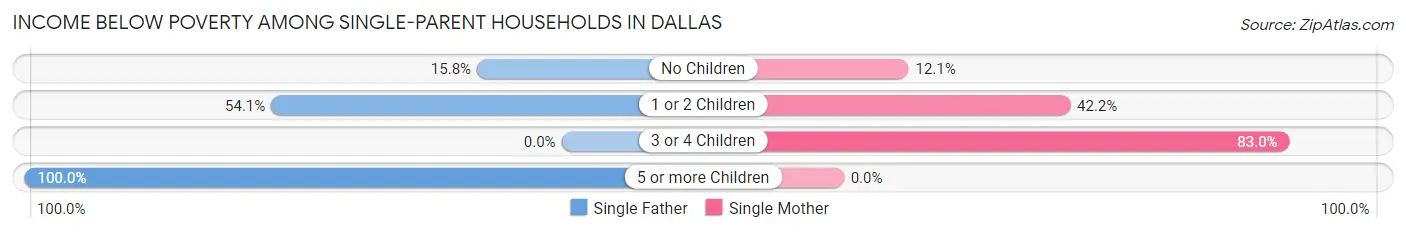
| Children | Single Father | Single Mother |
| No Children | 23 (15.8%) | 36 (12.1%) |
| 1 or 2 Children | 53 (54.1%) | 143 (42.2%) |
| 3 or 4 Children | 0 (0.0%) | 44 (83.0%) |
| 5 or more Children | 30 (100.0%) | 0 (0.0%) |
| Total | 106 (38.7%) | 223 (32.3%) |
Income Below Poverty Among Married-Couple vs Single-Parent Households in Dallas
The poverty data for Dallas shows that 207 of the married-couple family households (6.2%) and 329 of the single-parent households (34.1%) are living below the poverty level. Within the married-couple family households, those with no children have the highest poverty rate, with 199 households (9.9%) falling below the poverty line. Among the single-parent households, those with 5 or more children have the highest poverty rate, with 30 household (100.0%) living below poverty.
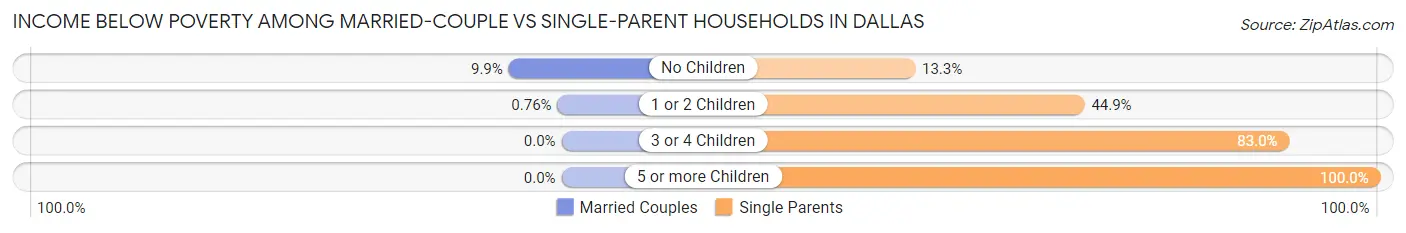
| Children | Married-Couple Families | Single-Parent Households |
| No Children | 199 (9.9%) | 59 (13.3%) |
| 1 or 2 Children | 8 (0.8%) | 196 (44.9%) |
| 3 or 4 Children | 0 (0.0%) | 44 (83.0%) |
| 5 or more Children | 0 (0.0%) | 30 (100.0%) |
| Total | 207 (6.2%) | 329 (34.1%) |
Race in Dallas
The most populous races in Dallas are White / Caucasian (14,318 | 84.5%), Hispanic or Latino (1,460 | 8.6%), and Two or more Races (1,302 | 7.7%).
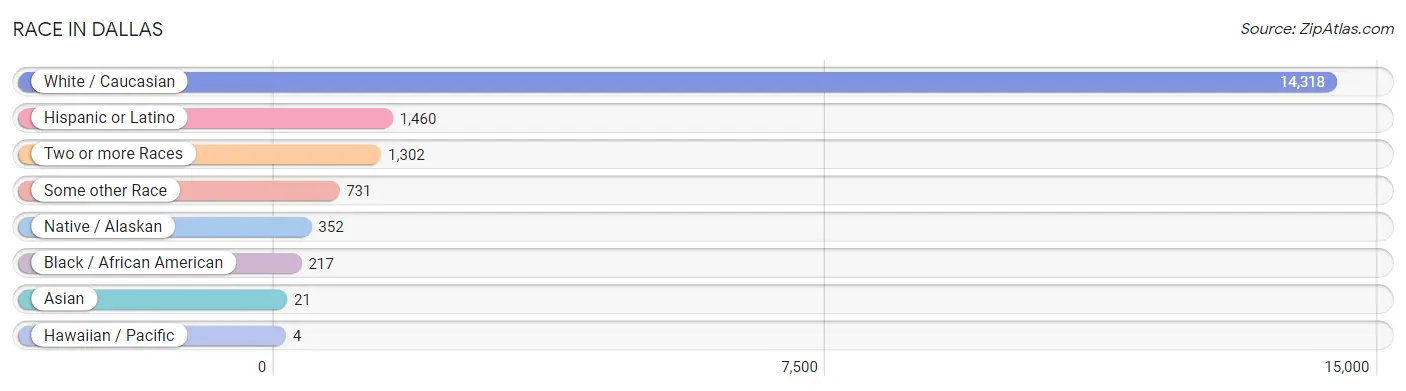
| Race | # Population | % Population |
| Asian | 21 | 0.1% |
| Black / African American | 217 | 1.3% |
| Hawaiian / Pacific | 4 | 0.0% |
| Hispanic or Latino | 1,460 | 8.6% |
| Native / Alaskan | 352 | 2.1% |
| White / Caucasian | 14,318 | 84.5% |
| Two or more Races | 1,302 | 7.7% |
| Some other Race | 731 | 4.3% |
| Total | 16,945 | 100.0% |
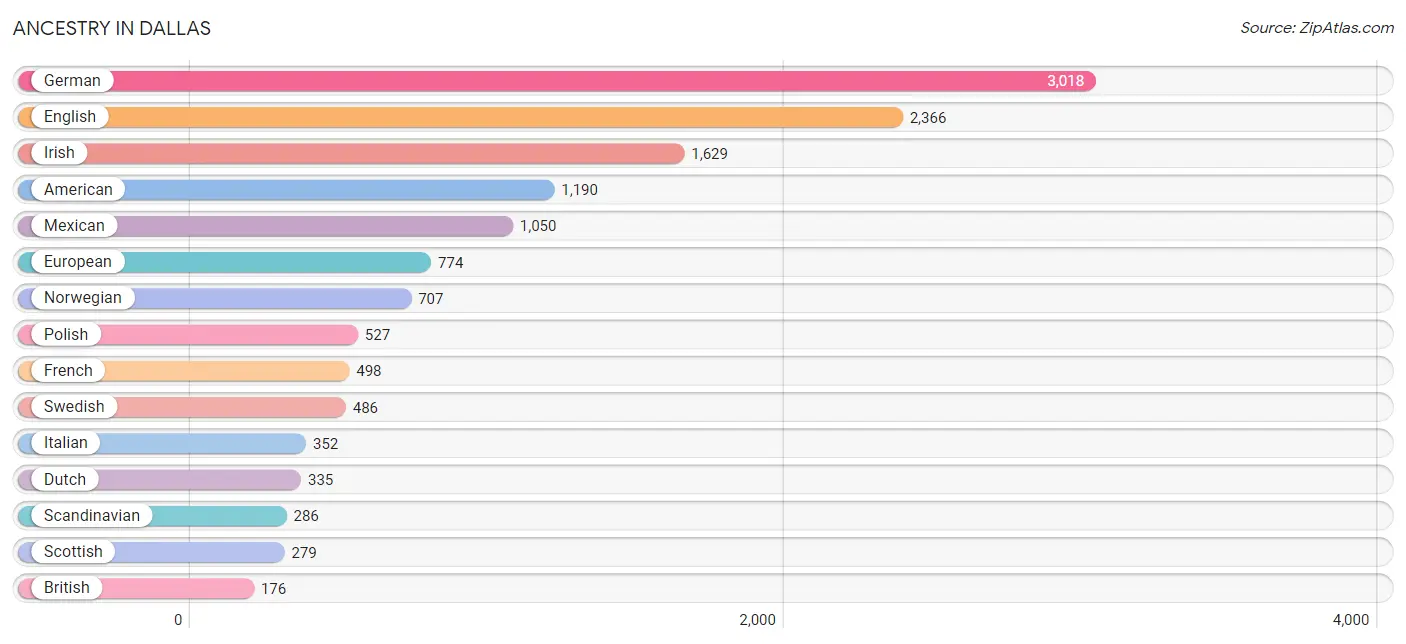
Ancestry in Dallas
The most populous ancestries reported in Dallas are German (3,018 | 17.8%), English (2,366 | 14.0%), Irish (1,629 | 9.6%), American (1,190 | 7.0%), and Mexican (1,050 | 6.2%), together accounting for 54.6% of all Dallas residents.
| Ancestry | # Population | % Population |
| African | 7 | 0.0% |
| American | 1,190 | 7.0% |
| Armenian | 24 | 0.1% |
| Austrian | 23 | 0.1% |
| Belgian | 63 | 0.4% |
| Bhutanese | 84 | 0.5% |
| Blackfeet | 95 | 0.6% |
| British | 176 | 1.0% |
| Burmese | 14 | 0.1% |
| Canadian | 116 | 0.7% |
| Celtic | 42 | 0.3% |
| Central American | 145 | 0.9% |
| Central American Indian | 143 | 0.8% |
| Cherokee | 158 | 0.9% |
| Chickasaw | 30 | 0.2% |
| Chippewa | 15 | 0.1% |
| Choctaw | 11 | 0.1% |
| Costa Rican | 16 | 0.1% |
| Creek | 3 | 0.0% |
| Cuban | 91 | 0.5% |
| Czech | 101 | 0.6% |
| Czechoslovakian | 15 | 0.1% |
| Danish | 142 | 0.8% |
| Dutch | 335 | 2.0% |
| Eastern European | 15 | 0.1% |
| English | 2,366 | 14.0% |
| European | 774 | 4.6% |
| Finnish | 29 | 0.2% |
| French | 498 | 2.9% |
| French Canadian | 129 | 0.8% |
| German | 3,018 | 17.8% |
| Guamanian / Chamorro | 17 | 0.1% |
| Guatemalan | 129 | 0.8% |
| Hungarian | 46 | 0.3% |
| Indian (Asian) | 126 | 0.7% |
| Irish | 1,629 | 9.6% |
| Italian | 352 | 2.1% |
| Lithuanian | 46 | 0.3% |
| Luxembourger | 15 | 0.1% |
| Mexican | 1,050 | 6.2% |
| Mexican American Indian | 6 | 0.0% |
| Native Hawaiian | 4 | 0.0% |
| Navajo | 19 | 0.1% |
| Northern European | 44 | 0.3% |
| Norwegian | 707 | 4.2% |
| Pennsylvania German | 51 | 0.3% |
| Peruvian | 153 | 0.9% |
| Polish | 527 | 3.1% |
| Portuguese | 64 | 0.4% |
| Puerto Rican | 21 | 0.1% |
| Russian | 50 | 0.3% |
| Scandinavian | 286 | 1.7% |
| Scotch-Irish | 45 | 0.3% |
| Scottish | 279 | 1.7% |
| Serbian | 26 | 0.2% |
| Sioux | 17 | 0.1% |
| Slavic | 21 | 0.1% |
| South American | 153 | 0.9% |
| Subsaharan African | 7 | 0.0% |
| Swedish | 486 | 2.9% |
| Swiss | 61 | 0.4% |
| Thai | 99 | 0.6% |
| Ukrainian | 32 | 0.2% |
| Welsh | 144 | 0.9% |
| Yugoslavian | 16 | 0.1% | View All 65 Rows |
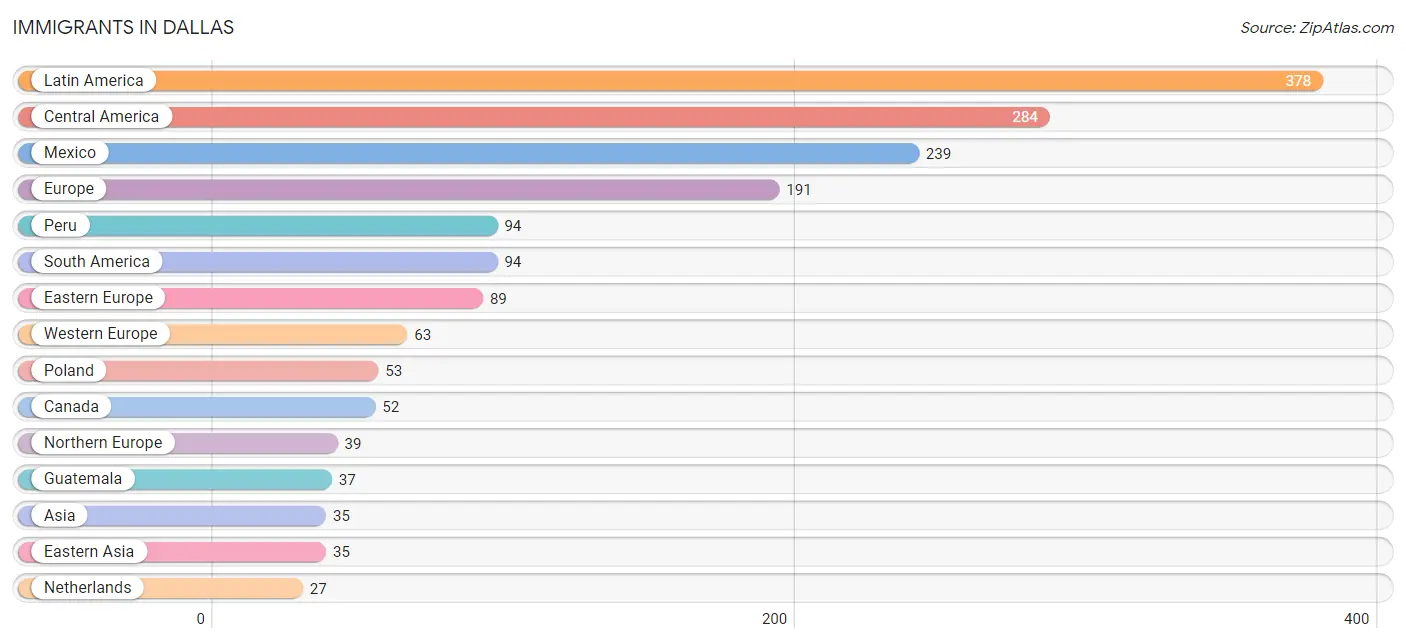
Immigrants in Dallas
The most numerous immigrant groups reported in Dallas came from Latin America (378 | 2.2%), Central America (284 | 1.7%), Mexico (239 | 1.4%), Europe (191 | 1.1%), and Peru (94 | 0.5%), together accounting for 7.0% of all Dallas residents.
| Immigration Origin | # Population | % Population |
| Asia | 35 | 0.2% |
| Austria | 17 | 0.1% |
| Canada | 52 | 0.3% |
| Central America | 284 | 1.7% |
| China | 10 | 0.1% |
| Costa Rica | 8 | 0.1% |
| Eastern Asia | 35 | 0.2% |
| Eastern Europe | 89 | 0.5% |
| England | 21 | 0.1% |
| Europe | 191 | 1.1% |
| Germany | 19 | 0.1% |
| Guatemala | 37 | 0.2% |
| Hong Kong | 10 | 0.1% |
| Japan | 11 | 0.1% |
| Korea | 14 | 0.1% |
| Latin America | 378 | 2.2% |
| Mexico | 239 | 1.4% |
| Netherlands | 27 | 0.2% |
| Northern Europe | 39 | 0.2% |
| Peru | 94 | 0.5% |
| Poland | 53 | 0.3% |
| South America | 94 | 0.5% |
| Ukraine | 4 | 0.0% |
| Western Europe | 63 | 0.4% | View All 24 Rows |
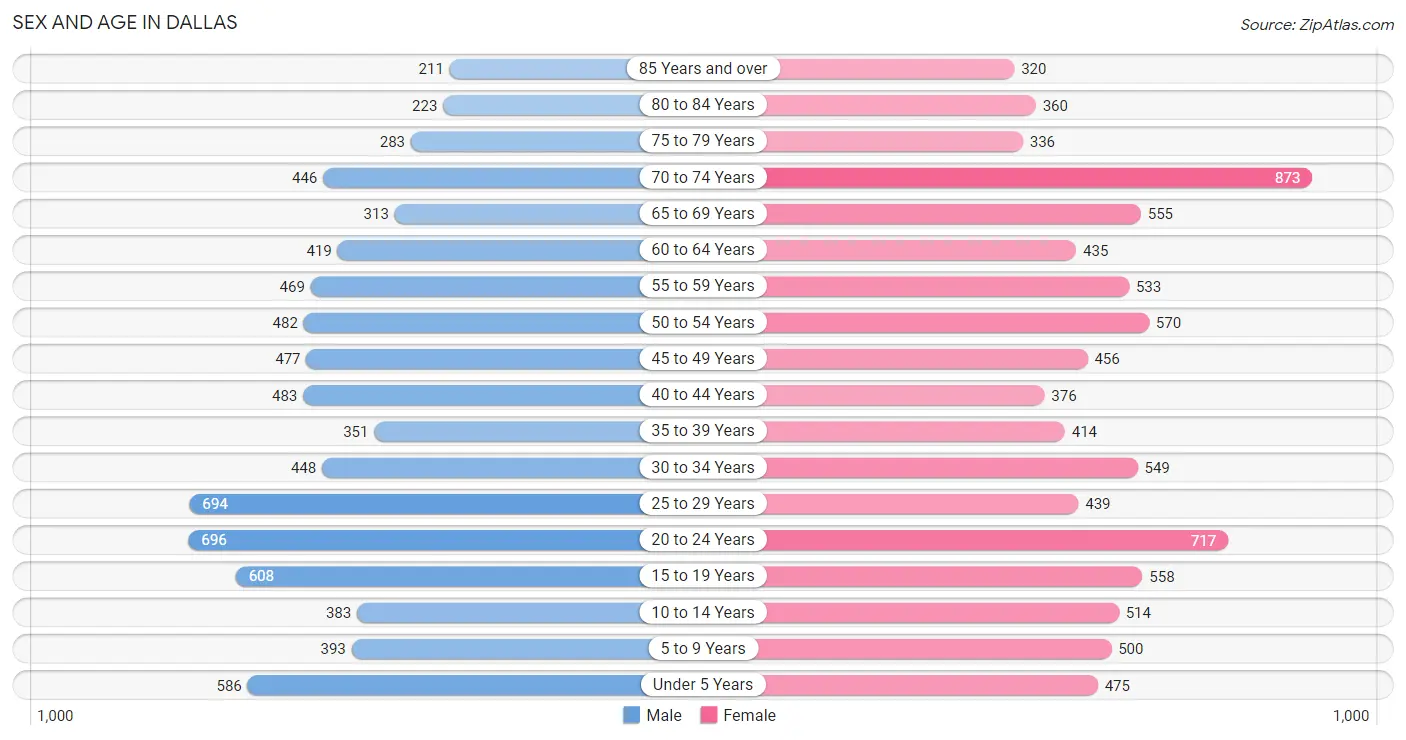
Sex and Age in Dallas
Sex and Age in Dallas
The most populous age groups in Dallas are 20 to 24 Years (696 | 8.7%) for men and 70 to 74 Years (873 | 9.7%) for women.
| Age Bracket | Male | Female |
| Under 5 Years | 586 (7.4%) | 475 (5.3%) |
| 5 to 9 Years | 393 (4.9%) | 500 (5.6%) |
| 10 to 14 Years | 383 (4.8%) | 514 (5.7%) |
| 15 to 19 Years | 608 (7.6%) | 558 (6.2%) |
| 20 to 24 Years | 696 (8.7%) | 717 (8.0%) |
| 25 to 29 Years | 694 (8.7%) | 439 (4.9%) |
| 30 to 34 Years | 448 (5.6%) | 549 (6.1%) |
| 35 to 39 Years | 351 (4.4%) | 414 (4.6%) |
| 40 to 44 Years | 483 (6.1%) | 376 (4.2%) |
| 45 to 49 Years | 477 (6.0%) | 456 (5.1%) |
| 50 to 54 Years | 482 (6.0%) | 570 (6.4%) |
| 55 to 59 Years | 469 (5.9%) | 533 (5.9%) |
| 60 to 64 Years | 419 (5.3%) | 435 (4.8%) |
| 65 to 69 Years | 313 (3.9%) | 555 (6.2%) |
| 70 to 74 Years | 446 (5.6%) | 873 (9.7%) |
| 75 to 79 Years | 283 (3.5%) | 336 (3.7%) |
| 80 to 84 Years | 223 (2.8%) | 360 (4.0%) |
| 85 Years and over | 211 (2.6%) | 320 (3.6%) |
| Total | 7,965 (100.0%) | 8,980 (100.0%) |
Families and Households in Dallas
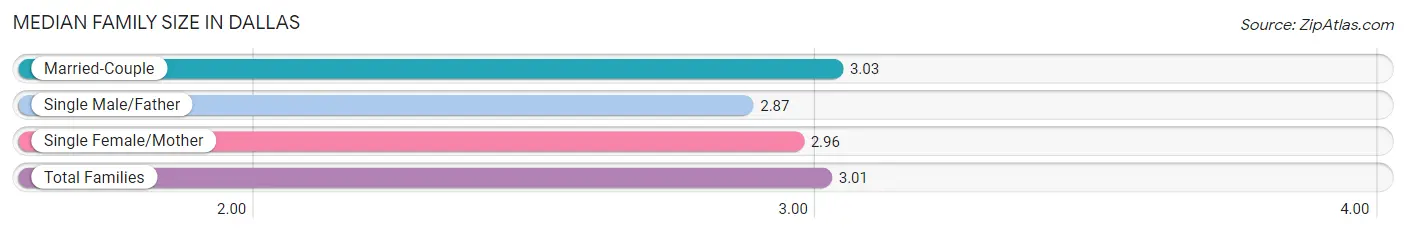
Median Family Size in Dallas
The median family size in Dallas is 3.01 persons per family, with married-couple families (3,356 | 77.7%) accounting for the largest median family size of 3.03 persons per family. On the other hand, single male/father families (274 | 6.3%) represent the smallest median family size with 2.87 persons per family.
| Family Type | # Families | Family Size |
| Married-Couple | 3,356 (77.7%) | 3.03 |
| Single Male/Father | 274 (6.3%) | 2.87 |
| Single Female/Mother | 690 (16.0%) | 2.96 |
| Total Families | 4,320 (100.0%) | 3.01 |
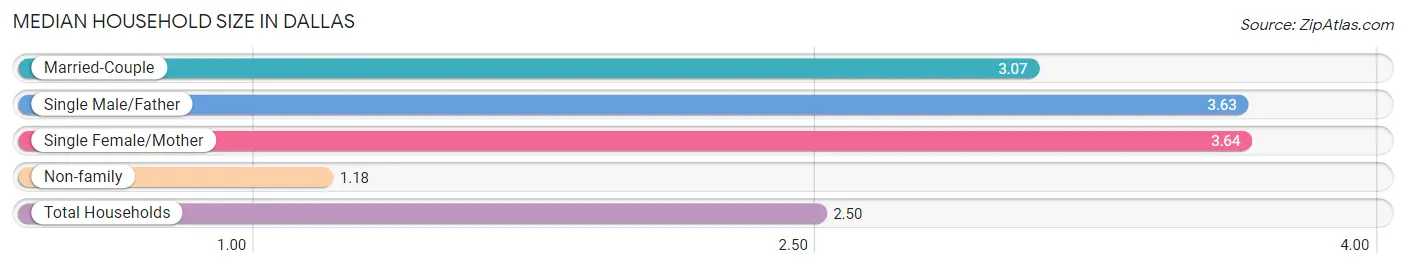
Median Household Size in Dallas
The median household size in Dallas is 2.50 persons per household, with single female/mother households (690 | 10.4%) accounting for the largest median household size of 3.64 persons per household. non-family households (2,288 | 34.6%) represent the smallest median household size with 1.18 persons per household.
| Household Type | # Households | Household Size |
| Married-Couple | 3,356 (50.8%) | 3.07 |
| Single Male/Father | 274 (4.2%) | 3.63 |
| Single Female/Mother | 690 (10.4%) | 3.64 |
| Non-family | 2,288 (34.6%) | 1.18 |
| Total Households | 6,608 (100.0%) | 2.50 |
Household Size by Marriage Status in Dallas
Out of a total of 6,608 households in Dallas, 4,320 (65.4%) are family households, while 2,288 (34.6%) are nonfamily households. The most numerous type of family households are 2-person households, comprising 2,118, and the most common type of nonfamily households are 1-person households, comprising 1,896.
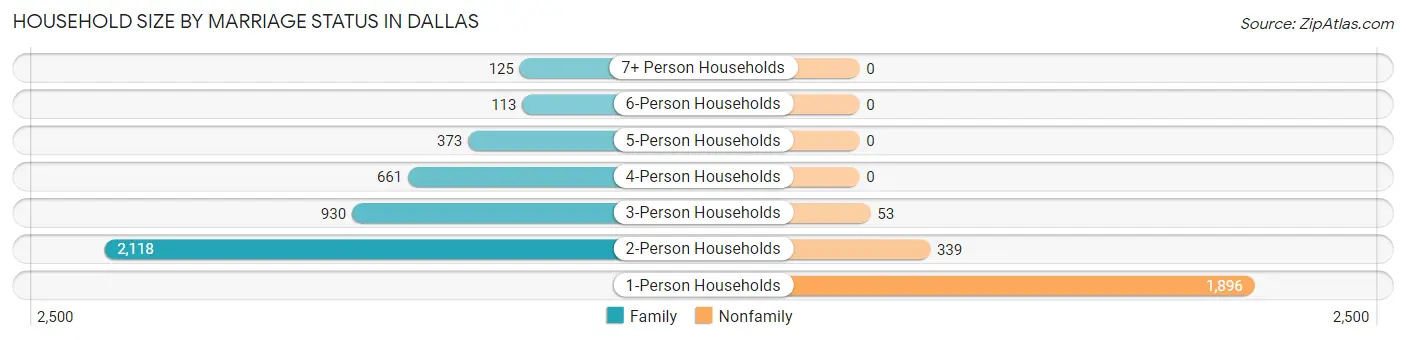
| Household Size | Family Households | Nonfamily Households |
| 1-Person Households | - | 1,896 (28.7%) |
| 2-Person Households | 2,118 (32.1%) | 339 (5.1%) |
| 3-Person Households | 930 (14.1%) | 53 (0.8%) |
| 4-Person Households | 661 (10.0%) | 0 (0.0%) |
| 5-Person Households | 373 (5.6%) | 0 (0.0%) |
| 6-Person Households | 113 (1.7%) | 0 (0.0%) |
| 7+ Person Households | 125 (1.9%) | 0 (0.0%) |
| Total | 4,320 (65.4%) | 2,288 (34.6%) |
Female Fertility in Dallas
Fertility by Age in Dallas
Average fertility rate in Dallas is 59.0 births per 1,000 women. Women in the age bracket of 20 to 34 years have the highest fertility rate with 116.0 births per 1,000 women. Women in the age bracket of 20 to 34 years acount for 91.6% of all women with births.
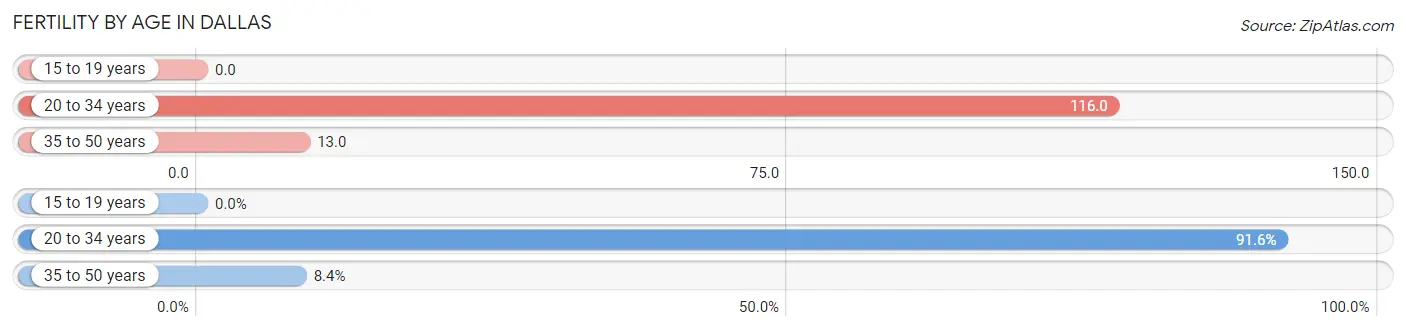
| Age Bracket | Women with Births | Births / 1,000 Women |
| 15 to 19 years | 0 (0.0%) | 0.0 |
| 20 to 34 years | 197 (91.6%) | 116.0 |
| 35 to 50 years | 18 (8.4%) | 13.0 |
| Total | 215 (100.0%) | 59.0 |
Fertility by Age by Marriage Status in Dallas
67.4% of women with births (215) in Dallas are married. The highest percentage of unmarried women with births falls into 20 to 34 years age bracket with 35.5% of them unmarried at the time of birth, while the lowest percentage of unmarried women with births belong to 35 to 50 years age bracket with 0.0% of them unmarried.
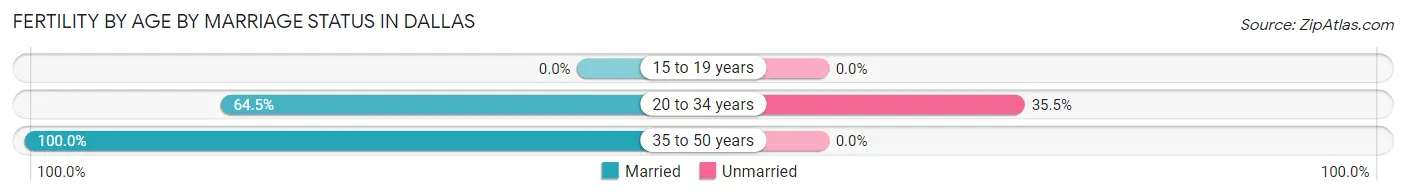
| Age Bracket | Married | Unmarried |
| 15 to 19 years | 0 (0.0%) | 0 (0.0%) |
| 20 to 34 years | 127 (64.5%) | 70 (35.5%) |
| 35 to 50 years | 18 (100.0%) | 0 (0.0%) |
| Total | 145 (67.4%) | 70 (32.6%) |
Fertility by Education in Dallas
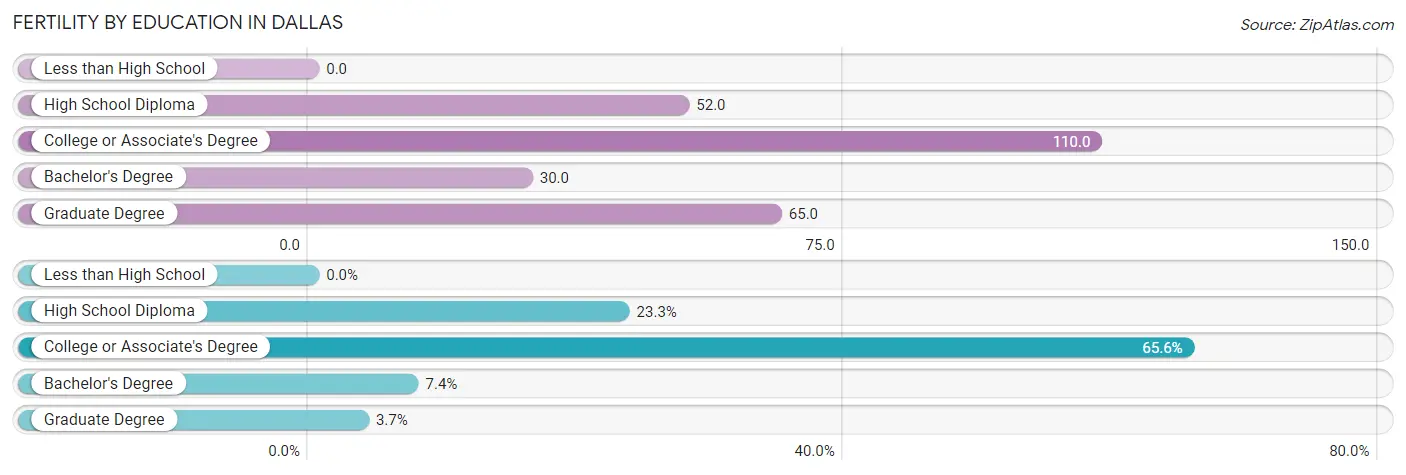
| Educational Attainment | Women with Births | Births / 1,000 Women |
| Less than High School | 0 (0.0%) | 0.0 |
| High School Diploma | 50 (23.3%) | 52.0 |
| College or Associate's Degree | 141 (65.6%) | 110.0 |
| Bachelor's Degree | 16 (7.4%) | 30.0 |
| Graduate Degree | 8 (3.7%) | 65.0 |
| Total | 215 (100.0%) | 59.0 |
Fertility by Education by Marriage Status in Dallas
32.6% of women with births in Dallas are unmarried. Women with the educational attainment of bachelor's degree are most likely to be married with 100.0% of them married at childbirth, while women with the educational attainment of high school diploma are least likely to be married with 62.0% of them unmarried at childbirth.
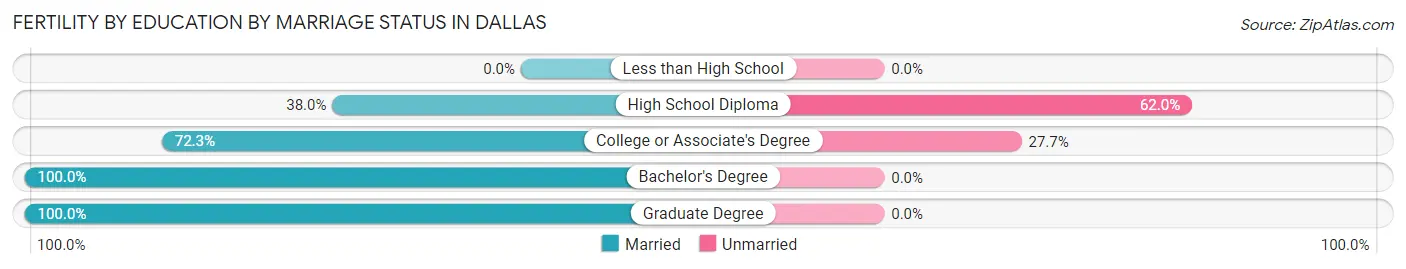
| Educational Attainment | Married | Unmarried |
| Less than High School | 0 (0.0%) | 0 (0.0%) |
| High School Diploma | 19 (38.0%) | 31 (62.0%) |
| College or Associate's Degree | 102 (72.3%) | 39 (27.7%) |
| Bachelor's Degree | 16 (100.0%) | 0 (0.0%) |
| Graduate Degree | 8 (100.0%) | 0 (0.0%) |
| Total | 145 (67.4%) | 70 (32.6%) |
Employment Characteristics in Dallas
Employment by Class of Employer in Dallas
Among the 7,080 employed individuals in Dallas, private company employees (4,223 | 59.7%), not-for-profit organizations (799 | 11.3%), and state government employees (791 | 11.2%) make up the most common classes of employment.
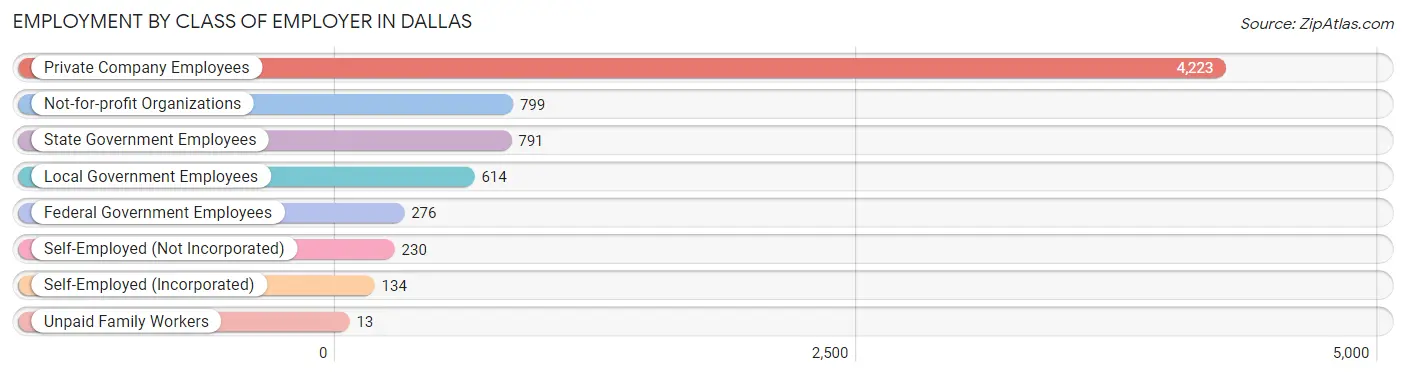
| Employer Class | # Employees | % Employees |
| Private Company Employees | 4,223 | 59.7% |
| Self-Employed (Incorporated) | 134 | 1.9% |
| Self-Employed (Not Incorporated) | 230 | 3.3% |
| Not-for-profit Organizations | 799 | 11.3% |
| Local Government Employees | 614 | 8.7% |
| State Government Employees | 791 | 11.2% |
| Federal Government Employees | 276 | 3.9% |
| Unpaid Family Workers | 13 | 0.2% |
| Total | 7,080 | 100.0% |
Employment Status by Age in Dallas
According to the labor force statistics for Dallas, out of the total population over 16 years of age (13,858), 54.5% or 7,553 individuals are in the labor force, with 5.2% or 393 of them unemployed. The age group with the highest labor force participation rate is 20 to 24 years, with 89.8% or 1,269 individuals in the labor force. Within the labor force, the 16 to 19 years age range has the highest percentage of unemployed individuals, with 31.0% or 175 of them being unemployed.
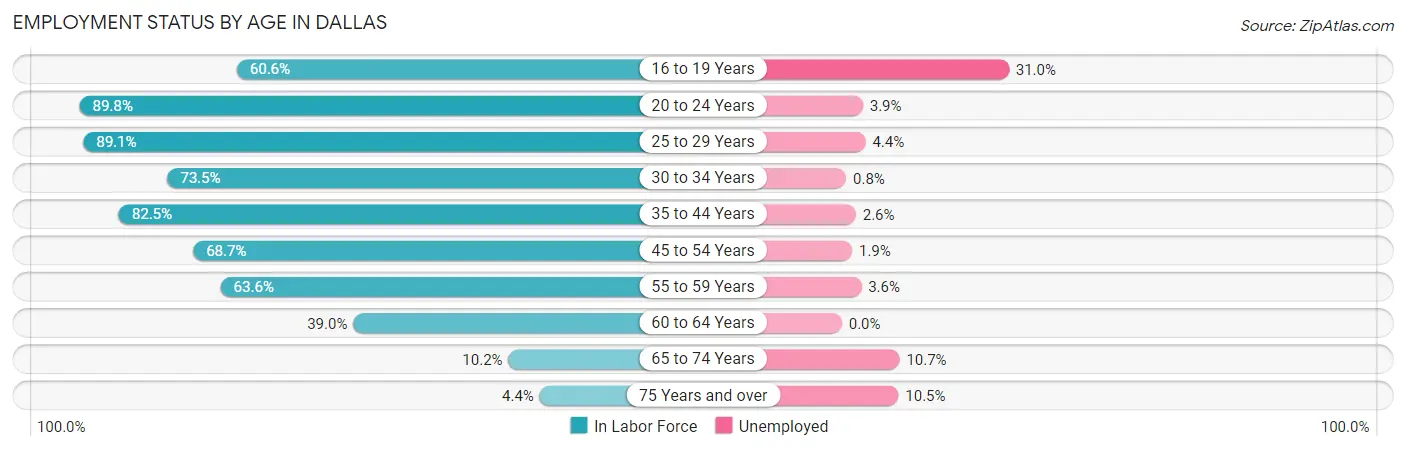
| Age Bracket | In Labor Force | Unemployed |
| 16 to 19 Years | 564 (60.6%) | 175 (31.0%) |
| 20 to 24 Years | 1,269 (89.8%) | 49 (3.9%) |
| 25 to 29 Years | 1,010 (89.1%) | 44 (4.4%) |
| 30 to 34 Years | 733 (73.5%) | 6 (0.8%) |
| 35 to 44 Years | 1,340 (82.5%) | 35 (2.6%) |
| 45 to 54 Years | 1,364 (68.7%) | 26 (1.9%) |
| 55 to 59 Years | 637 (63.6%) | 23 (3.6%) |
| 60 to 64 Years | 333 (39.0%) | 0 (0.0%) |
| 65 to 74 Years | 223 (10.2%) | 24 (10.7%) |
| 75 Years and over | 76 (4.4%) | 8 (10.5%) |
| Total | 7,553 (54.5%) | 393 (5.2%) |
Employment Status by Educational Attainment in Dallas
According to labor force statistics for Dallas, 71.3% of individuals (5,415) out of the total population between 25 and 64 years of age (7,595) are in the labor force, with 2.5% or 135 of them being unemployed. The group with the highest labor force participation rate are those with the educational attainment of college / associate degree, with 75.4% or 2,421 individuals in the labor force. Within the labor force, individuals with college / associate degree education have the highest percentage of unemployment, with 3.2% or 77 of them being unemployed.
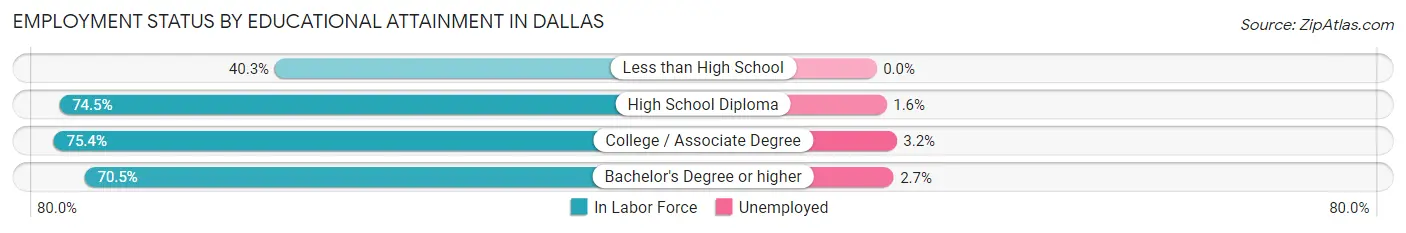
| Educational Attainment | In Labor Force | Unemployed |
| Less than High School | 235 (40.3%) | 0 (0.0%) |
| High School Diploma | 1,475 (74.5%) | 32 (1.6%) |
| College / Associate Degree | 2,421 (75.4%) | 103 (3.2%) |
| Bachelor's Degree or higher | 1,284 (70.5%) | 49 (2.7%) |
| Total | 5,415 (71.3%) | 190 (2.5%) |
Employment Occupations by Sex in Dallas
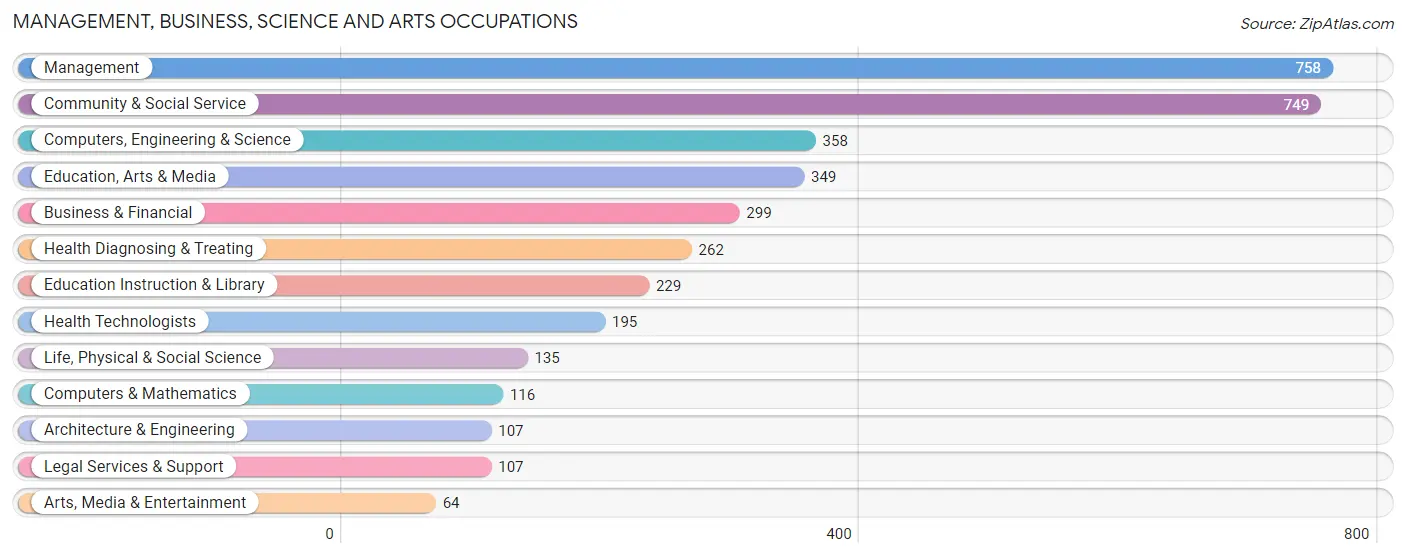
Management, Business, Science and Arts Occupations
The most common Management, Business, Science and Arts occupations in Dallas are Management (758 | 10.6%), Community & Social Service (749 | 10.5%), Computers, Engineering & Science (358 | 5.0%), Education, Arts & Media (349 | 4.9%), and Business & Financial (299 | 4.2%).
Management, Business, Science and Arts Occupations by Sex
Within the Management, Business, Science and Arts occupations in Dallas, the most male-oriented occupations are Architecture & Engineering (92.5%), Computers & Mathematics (92.2%), and Management (65.0%), while the most female-oriented occupations are Legal Services & Support (100.0%), Education Instruction & Library (91.7%), and Arts, Media & Entertainment (89.1%).

| Occupation | Male | Female |
| Management | 493 (65.0%) | 265 (35.0%) |
| Business & Financial | 59 (19.7%) | 240 (80.3%) |
| Computers, Engineering & Science | 229 (64.0%) | 129 (36.0%) |
| Computers & Mathematics | 107 (92.2%) | 9 (7.8%) |
| Architecture & Engineering | 99 (92.5%) | 8 (7.5%) |
| Life, Physical & Social Science | 23 (17.0%) | 112 (83.0%) |
| Community & Social Service | 197 (26.3%) | 552 (73.7%) |
| Education, Arts & Media | 171 (49.0%) | 178 (51.0%) |
| Legal Services & Support | 0 (0.0%) | 107 (100.0%) |
| Education Instruction & Library | 19 (8.3%) | 210 (91.7%) |
| Arts, Media & Entertainment | 7 (10.9%) | 57 (89.1%) |
| Health Diagnosing & Treating | 52 (19.9%) | 210 (80.1%) |
| Health Technologists | 52 (26.7%) | 143 (73.3%) |
| Total (Category) | 1,030 (42.5%) | 1,396 (57.5%) |
| Total (Overall) | 3,831 (53.7%) | 3,299 (46.3%) |
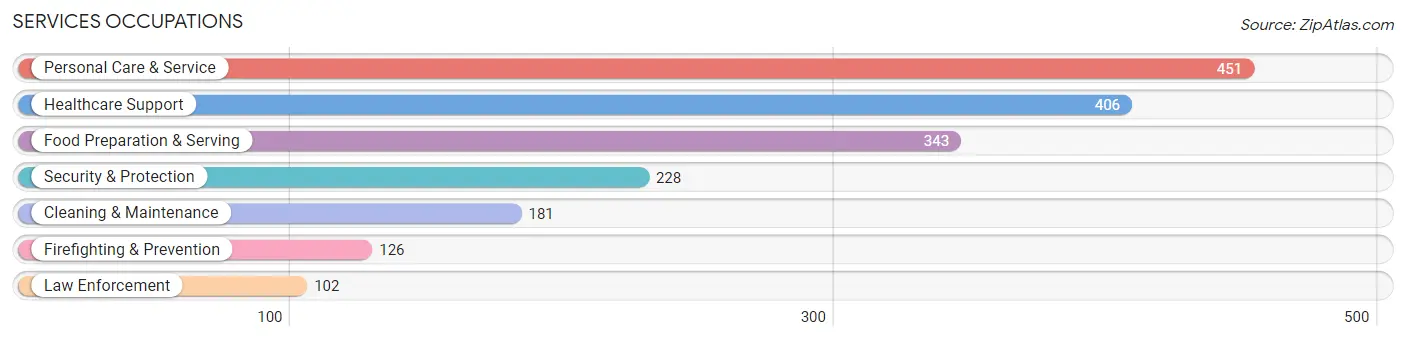
Services Occupations
The most common Services occupations in Dallas are Personal Care & Service (451 | 6.3%), Healthcare Support (406 | 5.7%), Food Preparation & Serving (343 | 4.8%), Security & Protection (228 | 3.2%), and Cleaning & Maintenance (181 | 2.5%).
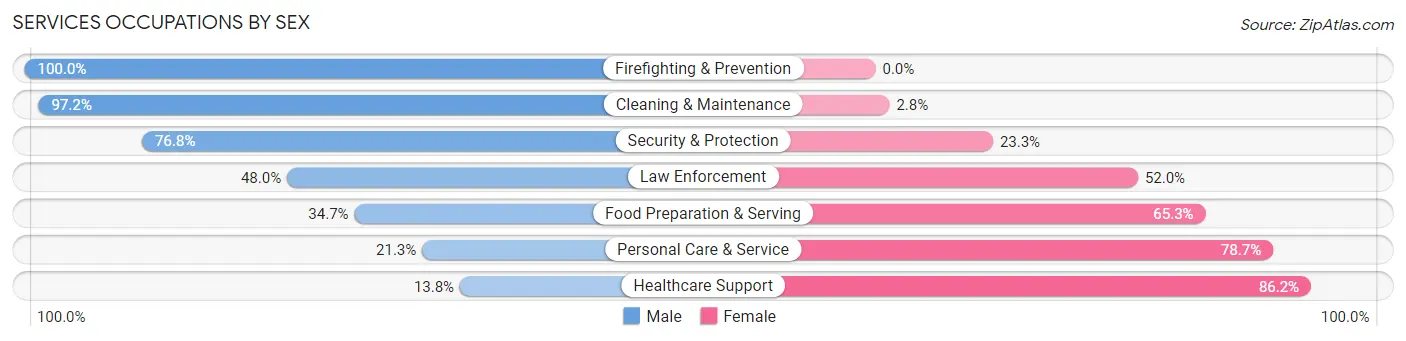
Services Occupations by Sex
Within the Services occupations in Dallas, the most male-oriented occupations are Firefighting & Prevention (100.0%), Cleaning & Maintenance (97.2%), and Security & Protection (76.7%), while the most female-oriented occupations are Healthcare Support (86.2%), Personal Care & Service (78.7%), and Food Preparation & Serving (65.3%).
| Occupation | Male | Female |
| Healthcare Support | 56 (13.8%) | 350 (86.2%) |
| Security & Protection | 175 (76.7%) | 53 (23.3%) |
| Firefighting & Prevention | 126 (100.0%) | 0 (0.0%) |
| Law Enforcement | 49 (48.0%) | 53 (52.0%) |
| Food Preparation & Serving | 119 (34.7%) | 224 (65.3%) |
| Cleaning & Maintenance | 176 (97.2%) | 5 (2.8%) |
| Personal Care & Service | 96 (21.3%) | 355 (78.7%) |
| Total (Category) | 622 (38.7%) | 987 (61.3%) |
| Total (Overall) | 3,831 (53.7%) | 3,299 (46.3%) |
Sales and Office Occupations
The most common Sales and Office occupations in Dallas are Sales & Related (612 | 8.6%), and Office & Administration (512 | 7.2%).

Sales and Office Occupations by Sex

| Occupation | Male | Female |
| Sales & Related | 324 (52.9%) | 288 (47.1%) |
| Office & Administration | 57 (11.1%) | 455 (88.9%) |
| Total (Category) | 381 (33.9%) | 743 (66.1%) |
| Total (Overall) | 3,831 (53.7%) | 3,299 (46.3%) |
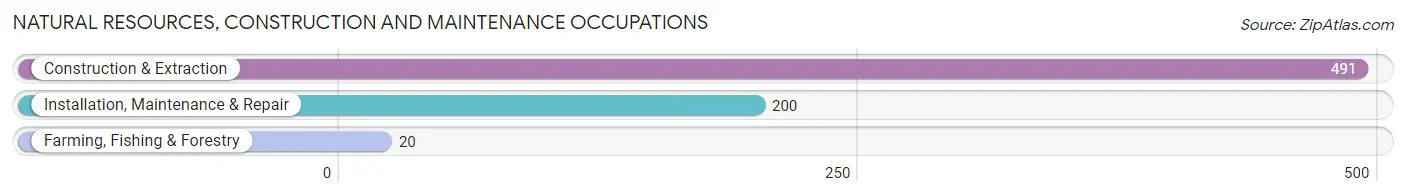
Natural Resources, Construction and Maintenance Occupations
The most common Natural Resources, Construction and Maintenance occupations in Dallas are Construction & Extraction (491 | 6.9%), Installation, Maintenance & Repair (200 | 2.8%), and Farming, Fishing & Forestry (20 | 0.3%).
Natural Resources, Construction and Maintenance Occupations by Sex
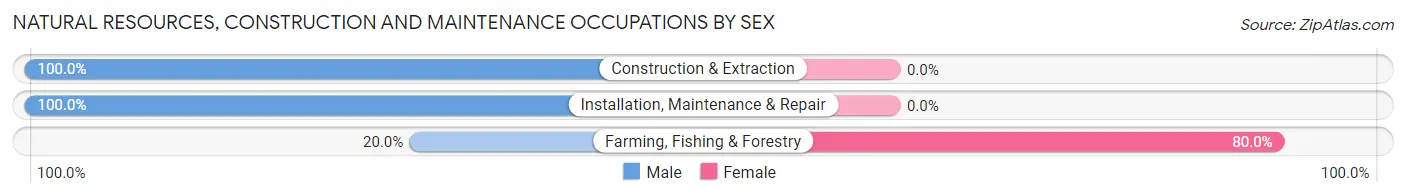
| Occupation | Male | Female |
| Farming, Fishing & Forestry | 4 (20.0%) | 16 (80.0%) |
| Construction & Extraction | 491 (100.0%) | 0 (0.0%) |
| Installation, Maintenance & Repair | 200 (100.0%) | 0 (0.0%) |
| Total (Category) | 695 (97.8%) | 16 (2.2%) |
| Total (Overall) | 3,831 (53.7%) | 3,299 (46.3%) |
Production, Transportation and Moving Occupations
The most common Production, Transportation and Moving occupations in Dallas are Production (639 | 9.0%), Transportation (383 | 5.4%), and Material Moving (238 | 3.3%).
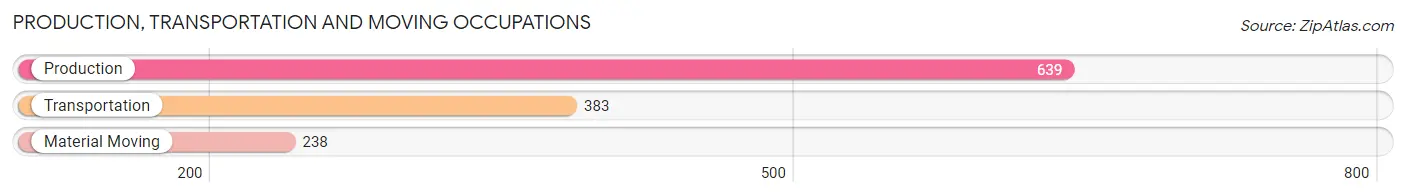
Production, Transportation and Moving Occupations by Sex

| Occupation | Male | Female |
| Production | 633 (99.1%) | 6 (0.9%) |
| Transportation | 321 (83.8%) | 62 (16.2%) |
| Material Moving | 149 (62.6%) | 89 (37.4%) |
| Total (Category) | 1,103 (87.5%) | 157 (12.5%) |
| Total (Overall) | 3,831 (53.7%) | 3,299 (46.3%) |
Employment Industries by Sex in Dallas
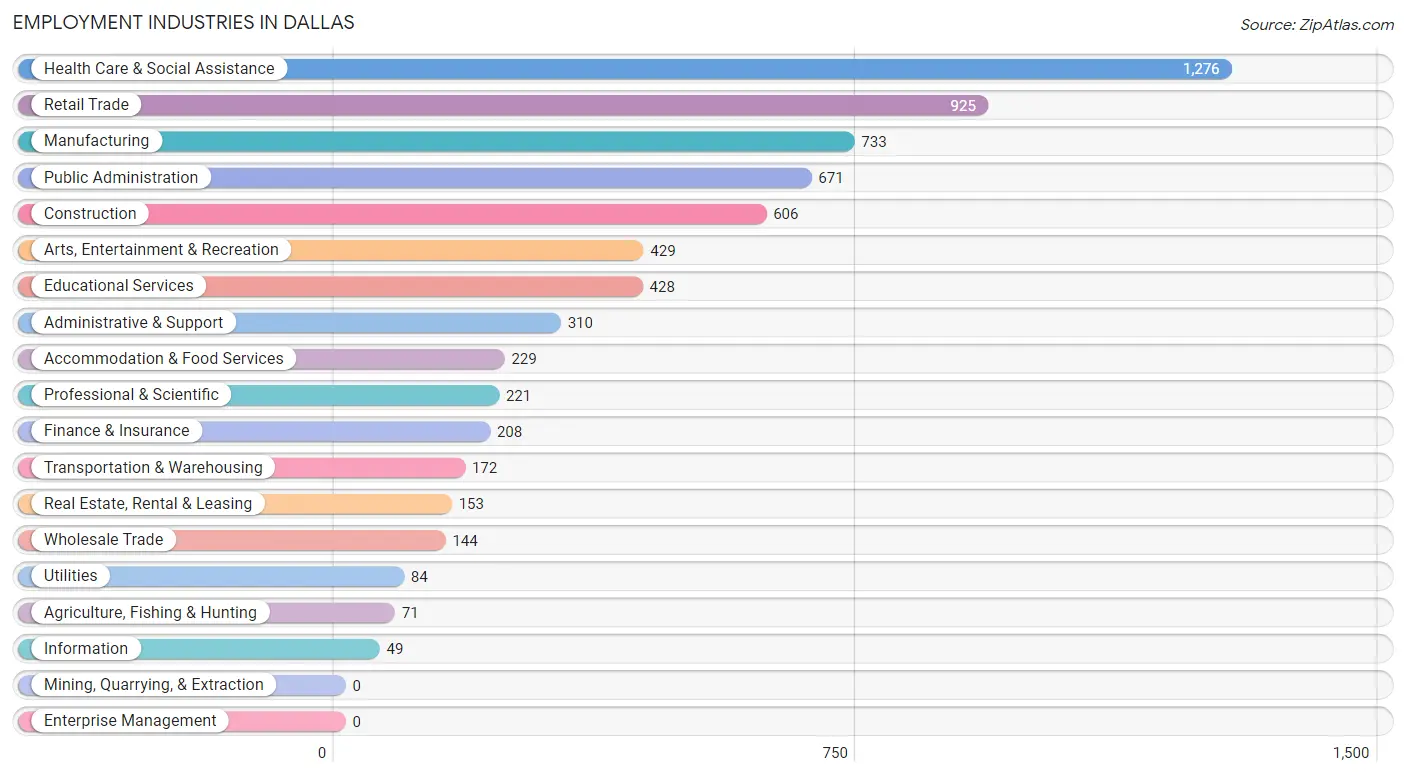
Employment Industries in Dallas
The major employment industries in Dallas include Health Care & Social Assistance (1,276 | 17.9%), Retail Trade (925 | 13.0%), Manufacturing (733 | 10.3%), Public Administration (671 | 9.4%), and Construction (606 | 8.5%).
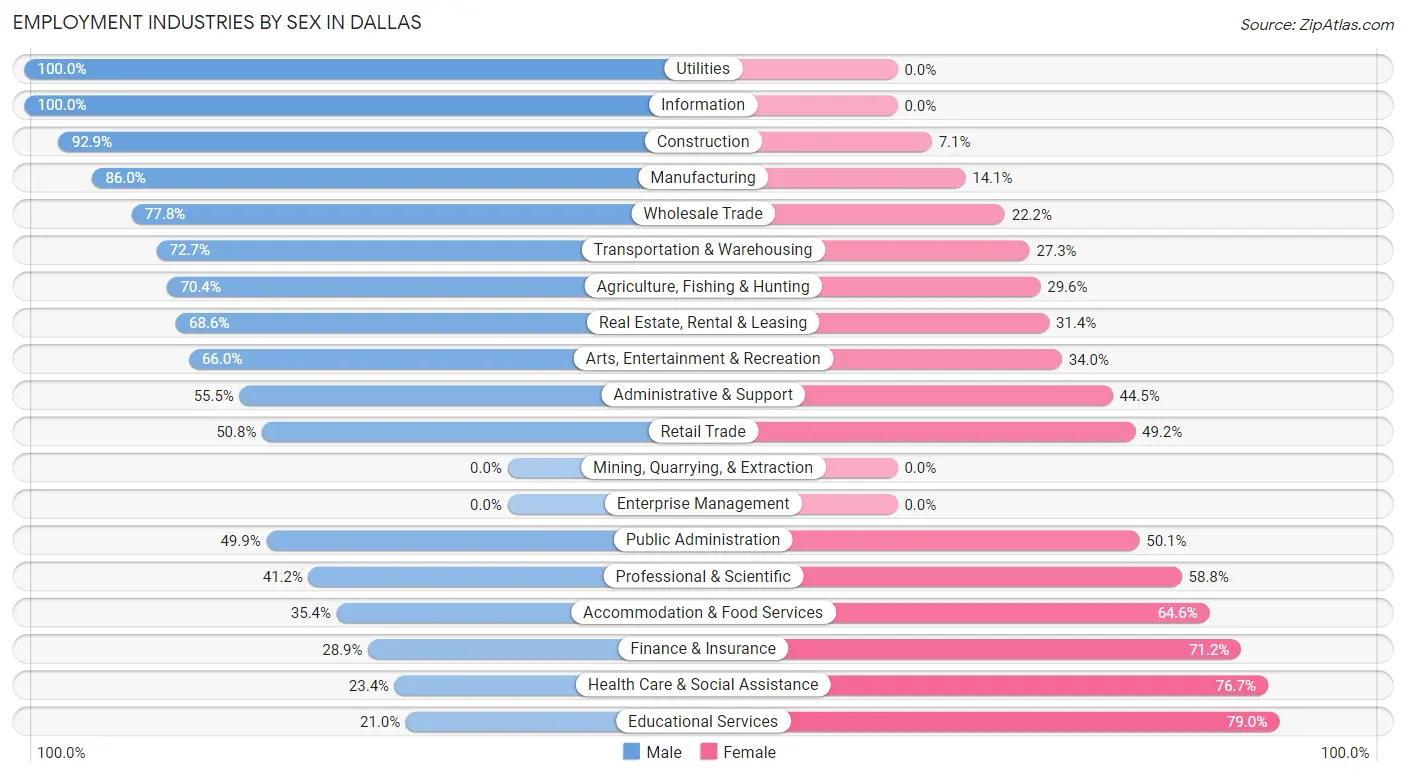
Employment Industries by Sex in Dallas
The Dallas industries that see more men than women are Utilities (100.0%), Information (100.0%), and Construction (92.9%), whereas the industries that tend to have a higher number of women are Educational Services (79.0%), Health Care & Social Assistance (76.6%), and Finance & Insurance (71.2%).
| Industry | Male | Female |
| Agriculture, Fishing & Hunting | 50 (70.4%) | 21 (29.6%) |
| Mining, Quarrying, & Extraction | 0 (0.0%) | 0 (0.0%) |
| Construction | 563 (92.9%) | 43 (7.1%) |
| Manufacturing | 630 (86.0%) | 103 (14.1%) |
| Wholesale Trade | 112 (77.8%) | 32 (22.2%) |
| Retail Trade | 470 (50.8%) | 455 (49.2%) |
| Transportation & Warehousing | 125 (72.7%) | 47 (27.3%) |
| Utilities | 84 (100.0%) | 0 (0.0%) |
| Information | 49 (100.0%) | 0 (0.0%) |
| Finance & Insurance | 60 (28.8%) | 148 (71.2%) |
| Real Estate, Rental & Leasing | 105 (68.6%) | 48 (31.4%) |
| Professional & Scientific | 91 (41.2%) | 130 (58.8%) |
| Enterprise Management | 0 (0.0%) | 0 (0.0%) |
| Administrative & Support | 172 (55.5%) | 138 (44.5%) |
| Educational Services | 90 (21.0%) | 338 (79.0%) |
| Health Care & Social Assistance | 298 (23.4%) | 978 (76.6%) |
| Arts, Entertainment & Recreation | 283 (66.0%) | 146 (34.0%) |
| Accommodation & Food Services | 81 (35.4%) | 148 (64.6%) |
| Public Administration | 335 (49.9%) | 336 (50.1%) |
| Total | 3,831 (53.7%) | 3,299 (46.3%) |
Education in Dallas
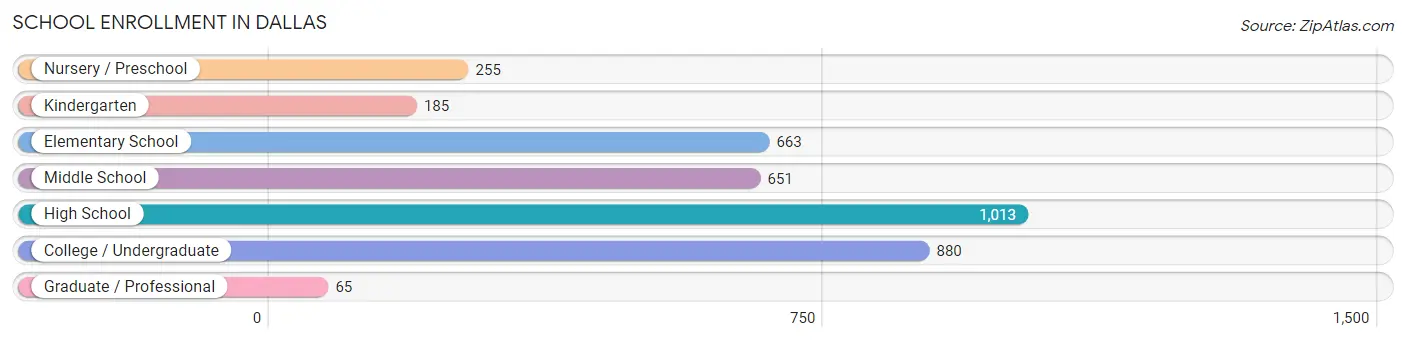
School Enrollment in Dallas
The most common levels of schooling among the 3,712 students in Dallas are high school (1,013 | 27.3%), college / undergraduate (880 | 23.7%), and elementary school (663 | 17.9%).
| School Level | # Students | % Students |
| Nursery / Preschool | 255 | 6.9% |
| Kindergarten | 185 | 5.0% |
| Elementary School | 663 | 17.9% |
| Middle School | 651 | 17.5% |
| High School | 1,013 | 27.3% |
| College / Undergraduate | 880 | 23.7% |
| Graduate / Professional | 65 | 1.8% |
| Total | 3,712 | 100.0% |
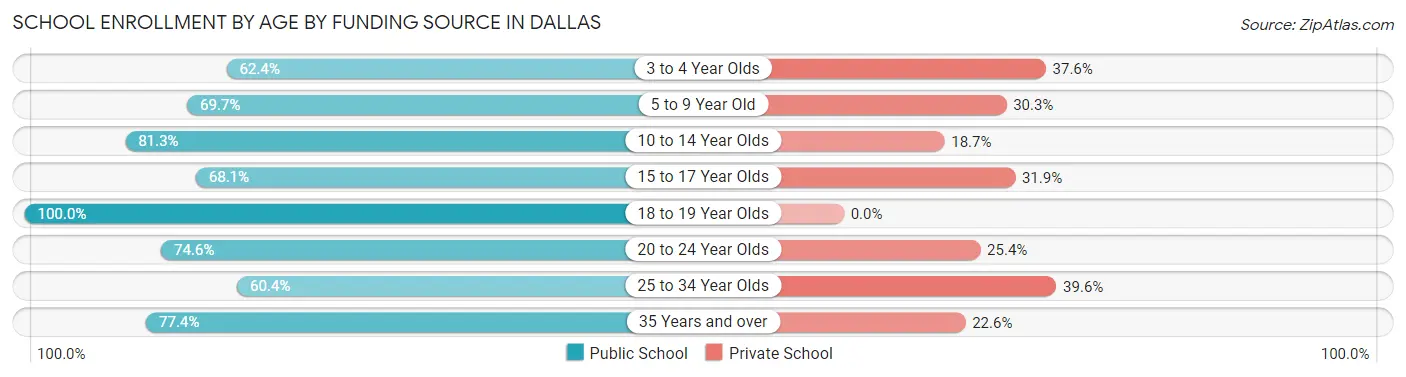
School Enrollment by Age by Funding Source in Dallas
Out of a total of 3,712 students who are enrolled in schools in Dallas, 902 (24.3%) attend a private institution, while the remaining 2,810 (75.7%) are enrolled in public schools. The age group of 25 to 34 year olds has the highest likelihood of being enrolled in private schools, with 57 (39.6% in the age bracket) enrolled. Conversely, the age group of 18 to 19 year olds has the lowest likelihood of being enrolled in a private school, with 404 (100.0% in the age bracket) attending a public institution.
| Age Bracket | Public School | Private School |
| 3 to 4 Year Olds | 141 (62.4%) | 85 (37.6%) |
| 5 to 9 Year Old | 576 (69.7%) | 250 (30.3%) |
| 10 to 14 Year Olds | 724 (81.3%) | 167 (18.7%) |
| 15 to 17 Year Olds | 399 (68.1%) | 187 (31.9%) |
| 18 to 19 Year Olds | 404 (100.0%) | 0 (0.0%) |
| 20 to 24 Year Olds | 355 (74.6%) | 121 (25.4%) |
| 25 to 34 Year Olds | 87 (60.4%) | 57 (39.6%) |
| 35 Years and over | 123 (77.4%) | 36 (22.6%) |
| Total | 2,810 (75.7%) | 902 (24.3%) |
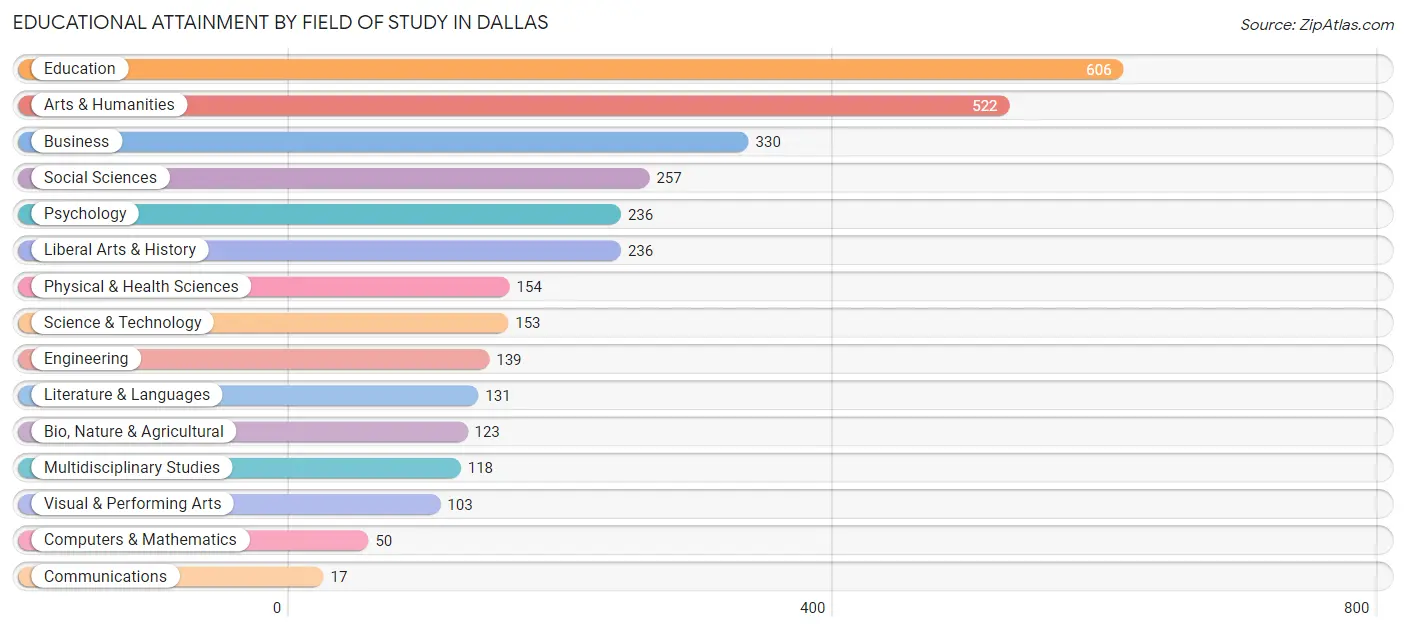
Educational Attainment by Field of Study in Dallas
Education (606 | 19.1%), arts & humanities (522 | 16.4%), business (330 | 10.4%), social sciences (257 | 8.1%), and psychology (236 | 7.4%) are the most common fields of study among 3,175 individuals in Dallas who have obtained a bachelor's degree or higher.
| Field of Study | # Graduates | % Graduates |
| Computers & Mathematics | 50 | 1.6% |
| Bio, Nature & Agricultural | 123 | 3.9% |
| Physical & Health Sciences | 154 | 4.9% |
| Psychology | 236 | 7.4% |
| Social Sciences | 257 | 8.1% |
| Engineering | 139 | 4.4% |
| Multidisciplinary Studies | 118 | 3.7% |
| Science & Technology | 153 | 4.8% |
| Business | 330 | 10.4% |
| Education | 606 | 19.1% |
| Literature & Languages | 131 | 4.1% |
| Liberal Arts & History | 236 | 7.4% |
| Visual & Performing Arts | 103 | 3.2% |
| Communications | 17 | 0.5% |
| Arts & Humanities | 522 | 16.4% |
| Total | 3,175 | 100.0% |
Transportation & Commute in Dallas
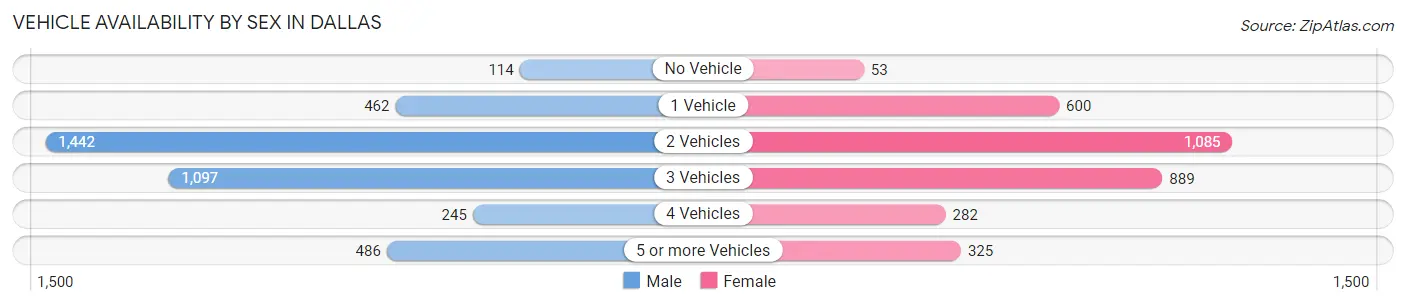
Vehicle Availability by Sex in Dallas
The most prevalent vehicle ownership categories in Dallas are males with 2 vehicles (1,442, accounting for 37.5%) and females with 2 vehicles (1,085, making up 44.6%).
| Vehicles Available | Male | Female |
| No Vehicle | 114 (3.0%) | 53 (1.6%) |
| 1 Vehicle | 462 (12.0%) | 600 (18.5%) |
| 2 Vehicles | 1,442 (37.5%) | 1,085 (33.6%) |
| 3 Vehicles | 1,097 (28.5%) | 889 (27.5%) |
| 4 Vehicles | 245 (6.4%) | 282 (8.7%) |
| 5 or more Vehicles | 486 (12.6%) | 325 (10.1%) |
| Total | 3,846 (100.0%) | 3,234 (100.0%) |
Commute Time in Dallas
The most frequently occuring commute durations in Dallas are 30 to 34 minutes (1,104 commuters, 17.3%), 5 to 9 minutes (799 commuters, 12.5%), and 20 to 24 minutes (648 commuters, 10.2%).
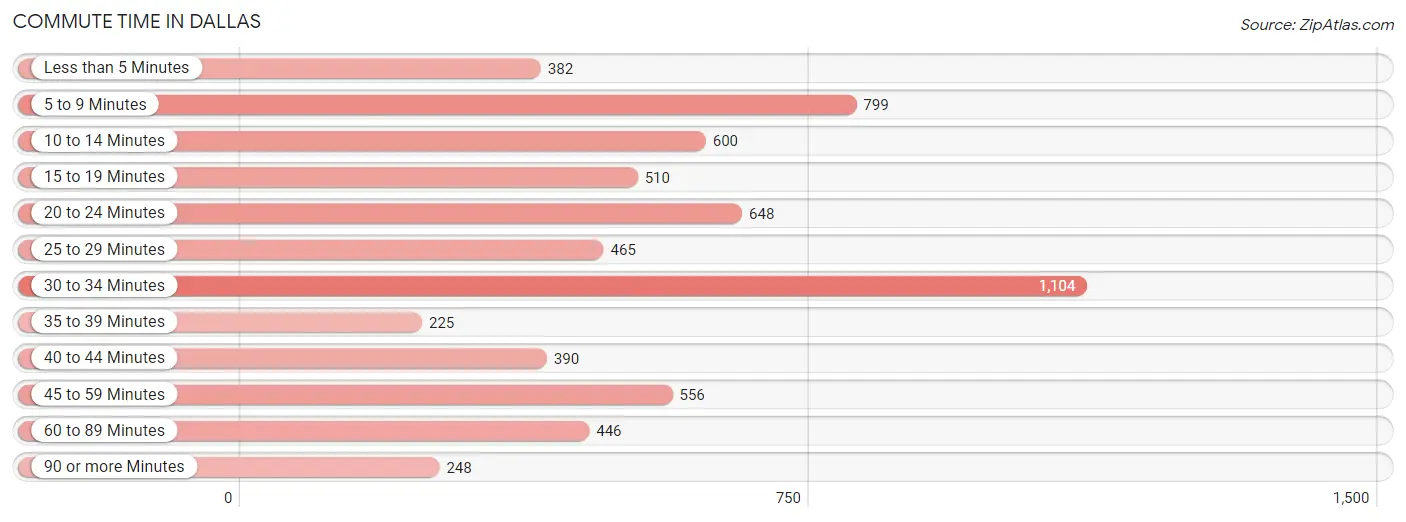
| Commute Time | # Commuters | % Commuters |
| Less than 5 Minutes | 382 | 6.0% |
| 5 to 9 Minutes | 799 | 12.5% |
| 10 to 14 Minutes | 600 | 9.4% |
| 15 to 19 Minutes | 510 | 8.0% |
| 20 to 24 Minutes | 648 | 10.2% |
| 25 to 29 Minutes | 465 | 7.3% |
| 30 to 34 Minutes | 1,104 | 17.3% |
| 35 to 39 Minutes | 225 | 3.5% |
| 40 to 44 Minutes | 390 | 6.1% |
| 45 to 59 Minutes | 556 | 8.7% |
| 60 to 89 Minutes | 446 | 7.0% |
| 90 or more Minutes | 248 | 3.9% |
Commute Time by Sex in Dallas
The most common commute times in Dallas are 30 to 34 minutes (598 commuters, 17.2%) for males and 30 to 34 minutes (506 commuters, 17.5%) for females.
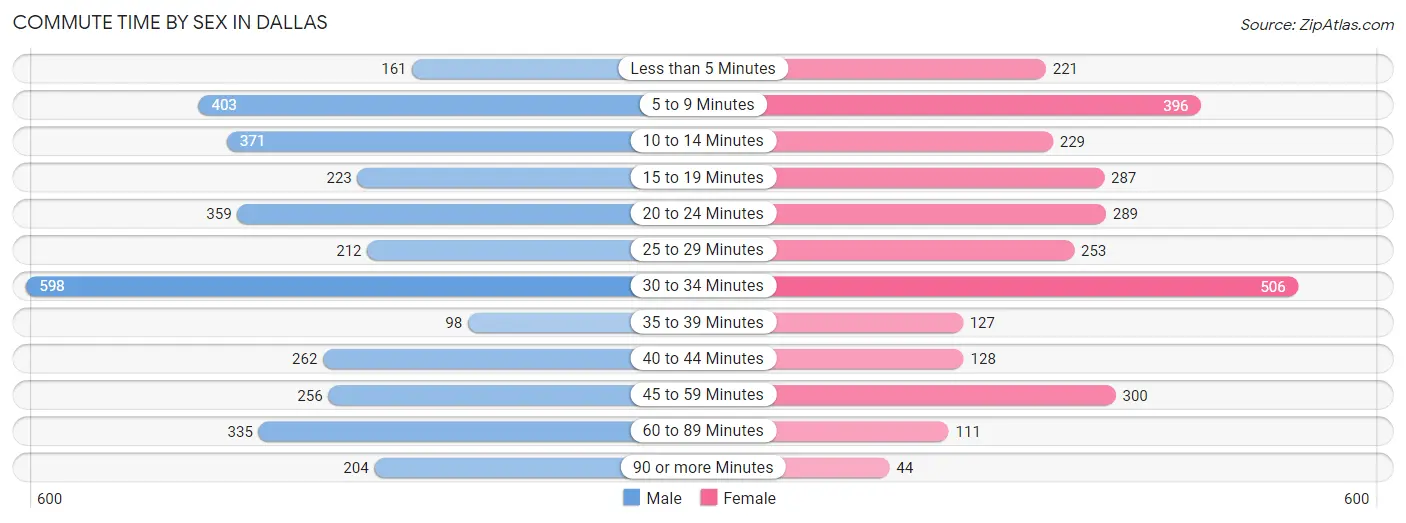
| Commute Time | Male | Female |
| Less than 5 Minutes | 161 (4.6%) | 221 (7.6%) |
| 5 to 9 Minutes | 403 (11.6%) | 396 (13.7%) |
| 10 to 14 Minutes | 371 (10.6%) | 229 (7.9%) |
| 15 to 19 Minutes | 223 (6.4%) | 287 (9.9%) |
| 20 to 24 Minutes | 359 (10.3%) | 289 (10.0%) |
| 25 to 29 Minutes | 212 (6.1%) | 253 (8.7%) |
| 30 to 34 Minutes | 598 (17.2%) | 506 (17.5%) |
| 35 to 39 Minutes | 98 (2.8%) | 127 (4.4%) |
| 40 to 44 Minutes | 262 (7.5%) | 128 (4.4%) |
| 45 to 59 Minutes | 256 (7.3%) | 300 (10.4%) |
| 60 to 89 Minutes | 335 (9.6%) | 111 (3.8%) |
| 90 or more Minutes | 204 (5.9%) | 44 (1.5%) |
Time of Departure to Work by Sex in Dallas
The most frequent times of departure to work in Dallas are 12:00 AM to 4:59 AM (690, 19.8%) for males and 7:30 AM to 7:59 AM (445, 15.4%) for females.
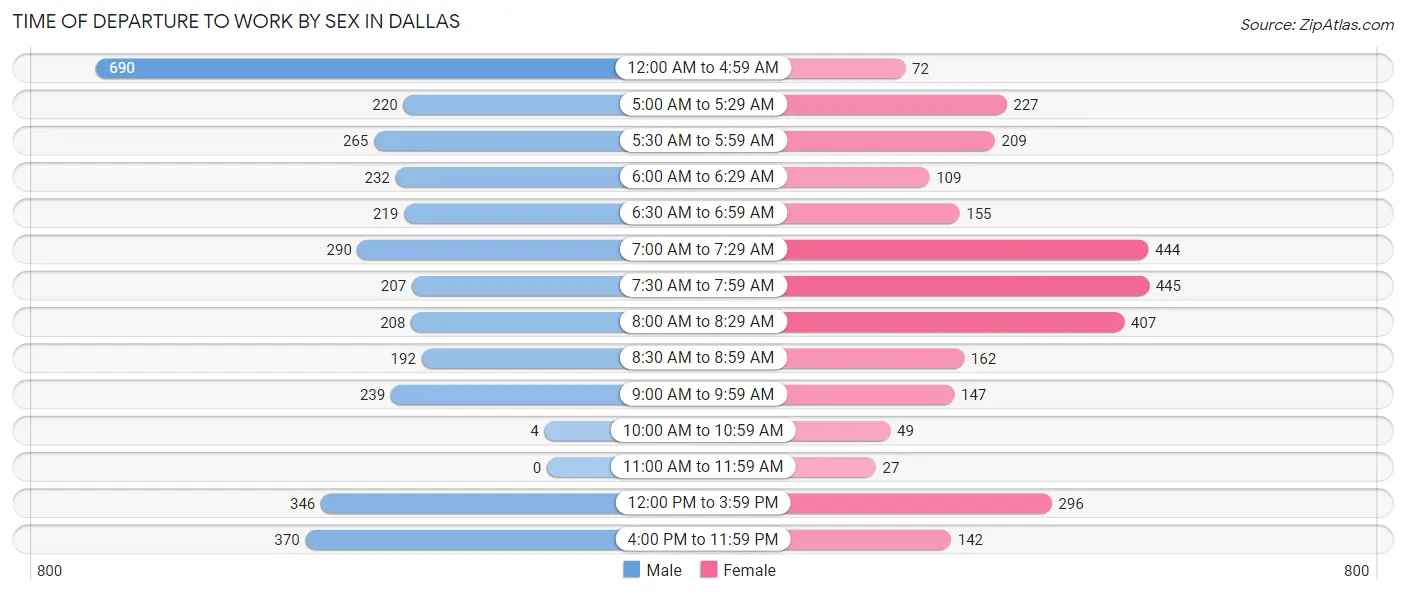
| Time of Departure | Male | Female |
| 12:00 AM to 4:59 AM | 690 (19.8%) | 72 (2.5%) |
| 5:00 AM to 5:29 AM | 220 (6.3%) | 227 (7.9%) |
| 5:30 AM to 5:59 AM | 265 (7.6%) | 209 (7.2%) |
| 6:00 AM to 6:29 AM | 232 (6.7%) | 109 (3.8%) |
| 6:30 AM to 6:59 AM | 219 (6.3%) | 155 (5.4%) |
| 7:00 AM to 7:29 AM | 290 (8.3%) | 444 (15.4%) |
| 7:30 AM to 7:59 AM | 207 (5.9%) | 445 (15.4%) |
| 8:00 AM to 8:29 AM | 208 (6.0%) | 407 (14.1%) |
| 8:30 AM to 8:59 AM | 192 (5.5%) | 162 (5.6%) |
| 9:00 AM to 9:59 AM | 239 (6.9%) | 147 (5.1%) |
| 10:00 AM to 10:59 AM | 4 (0.1%) | 49 (1.7%) |
| 11:00 AM to 11:59 AM | 0 (0.0%) | 27 (0.9%) |
| 12:00 PM to 3:59 PM | 346 (9.9%) | 296 (10.2%) |
| 4:00 PM to 11:59 PM | 370 (10.6%) | 142 (4.9%) |
| Total | 3,482 (100.0%) | 2,891 (100.0%) |
Housing Occupancy in Dallas
Occupancy by Ownership in Dallas
Of the total 6,608 dwellings in Dallas, owner-occupied units account for 4,560 (69.0%), while renter-occupied units make up 2,048 (31.0%).
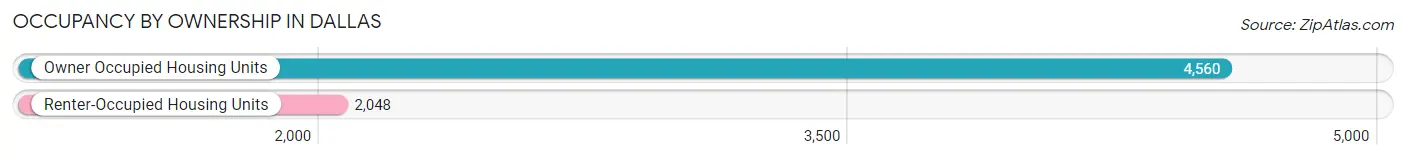
| Occupancy | # Housing Units | % Housing Units |
| Owner Occupied Housing Units | 4,560 | 69.0% |
| Renter-Occupied Housing Units | 2,048 | 31.0% |
| Total Occupied Housing Units | 6,608 | 100.0% |
Occupancy by Household Size in Dallas
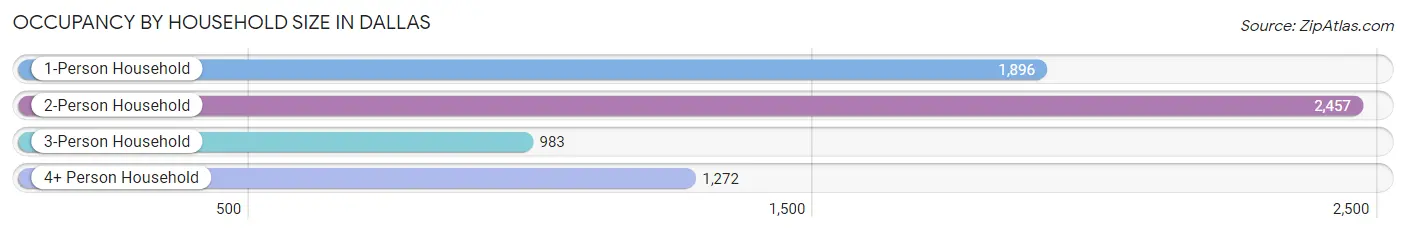
| Household Size | # Housing Units | % Housing Units |
| 1-Person Household | 1,896 | 28.7% |
| 2-Person Household | 2,457 | 37.2% |
| 3-Person Household | 983 | 14.9% |
| 4+ Person Household | 1,272 | 19.3% |
| Total Housing Units | 6,608 | 100.0% |
Occupancy by Ownership by Household Size in Dallas
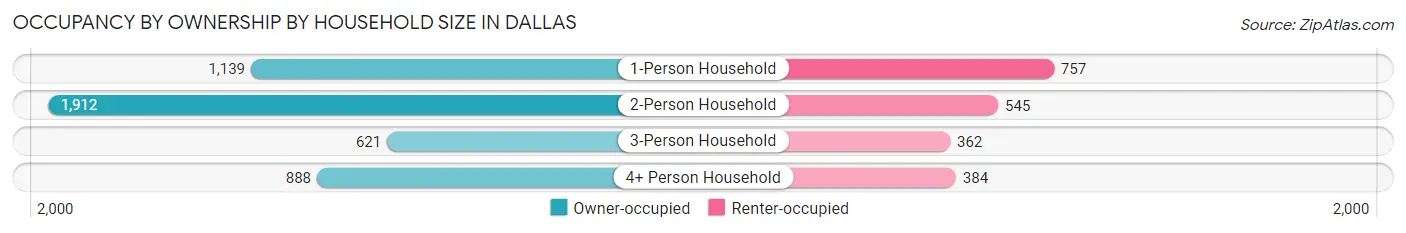
| Household Size | Owner-occupied | Renter-occupied |
| 1-Person Household | 1,139 (60.1%) | 757 (39.9%) |
| 2-Person Household | 1,912 (77.8%) | 545 (22.2%) |
| 3-Person Household | 621 (63.2%) | 362 (36.8%) |
| 4+ Person Household | 888 (69.8%) | 384 (30.2%) |
| Total Housing Units | 4,560 (69.0%) | 2,048 (31.0%) |
Occupancy by Educational Attainment in Dallas
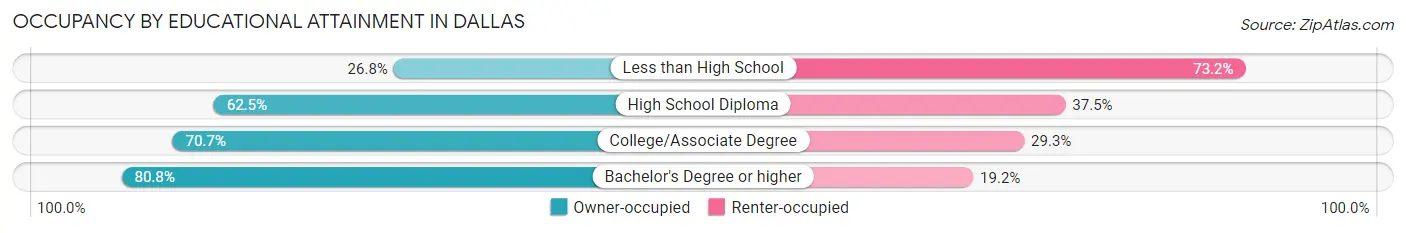
| Household Size | Owner-occupied | Renter-occupied |
| Less than High School | 110 (26.8%) | 300 (73.2%) |
| High School Diploma | 939 (62.5%) | 564 (37.5%) |
| College/Associate Degree | 1,965 (70.7%) | 816 (29.3%) |
| Bachelor's Degree or higher | 1,546 (80.8%) | 368 (19.2%) |
Occupancy by Age of Householder in Dallas
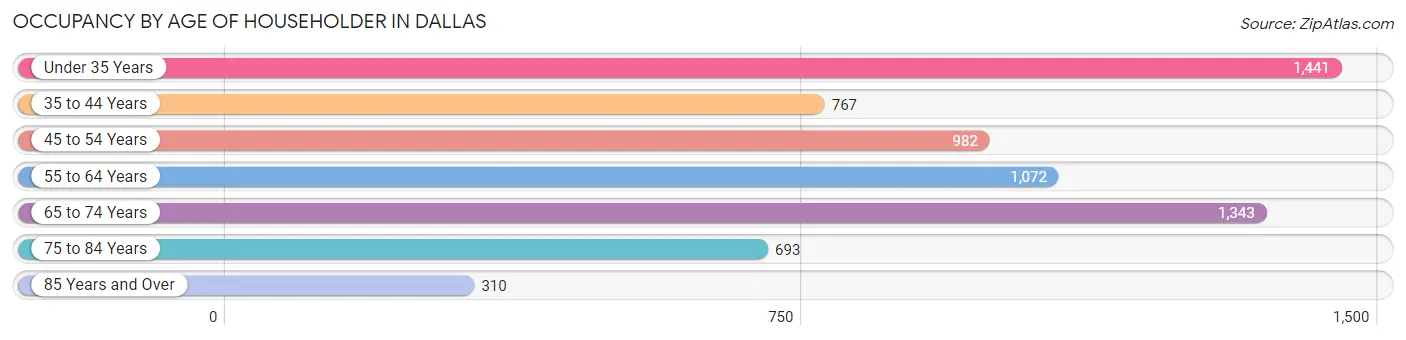
| Age Bracket | # Households | % Households |
| Under 35 Years | 1,441 | 21.8% |
| 35 to 44 Years | 767 | 11.6% |
| 45 to 54 Years | 982 | 14.9% |
| 55 to 64 Years | 1,072 | 16.2% |
| 65 to 74 Years | 1,343 | 20.3% |
| 75 to 84 Years | 693 | 10.5% |
| 85 Years and Over | 310 | 4.7% |
| Total | 6,608 | 100.0% |
Housing Finances in Dallas
Median Income by Occupancy in Dallas
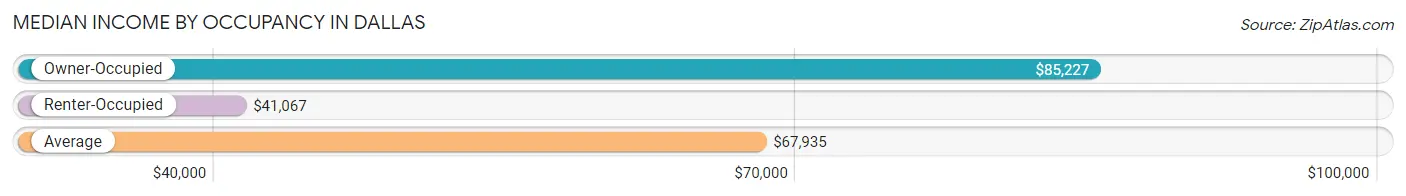
| Occupancy Type | # Households | Median Income |
| Owner-Occupied | 4,560 (69.0%) | $85,227 |
| Renter-Occupied | 2,048 (31.0%) | $41,067 |
| Average | 6,608 (100.0%) | $67,935 |
Occupancy by Householder Income Bracket in Dallas
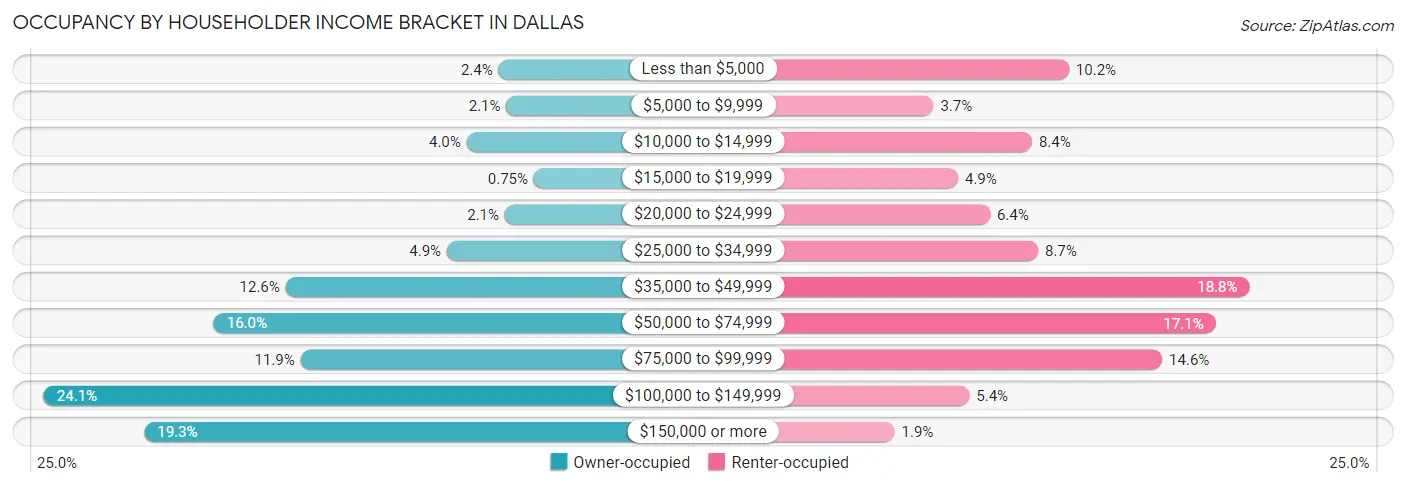
| Income Bracket | Owner-occupied | Renter-occupied |
| Less than $5,000 | 111 (2.4%) | 208 (10.2%) |
| $5,000 to $9,999 | 94 (2.1%) | 76 (3.7%) |
| $10,000 to $14,999 | 180 (4.0%) | 172 (8.4%) |
| $15,000 to $19,999 | 34 (0.7%) | 100 (4.9%) |
| $20,000 to $24,999 | 97 (2.1%) | 131 (6.4%) |
| $25,000 to $34,999 | 223 (4.9%) | 178 (8.7%) |
| $35,000 to $49,999 | 573 (12.6%) | 384 (18.8%) |
| $50,000 to $74,999 | 729 (16.0%) | 351 (17.1%) |
| $75,000 to $99,999 | 541 (11.9%) | 299 (14.6%) |
| $100,000 to $149,999 | 1,098 (24.1%) | 111 (5.4%) |
| $150,000 or more | 880 (19.3%) | 38 (1.9%) |
| Total | 4,560 (100.0%) | 2,048 (100.0%) |
Monthly Housing Cost Tiers in Dallas
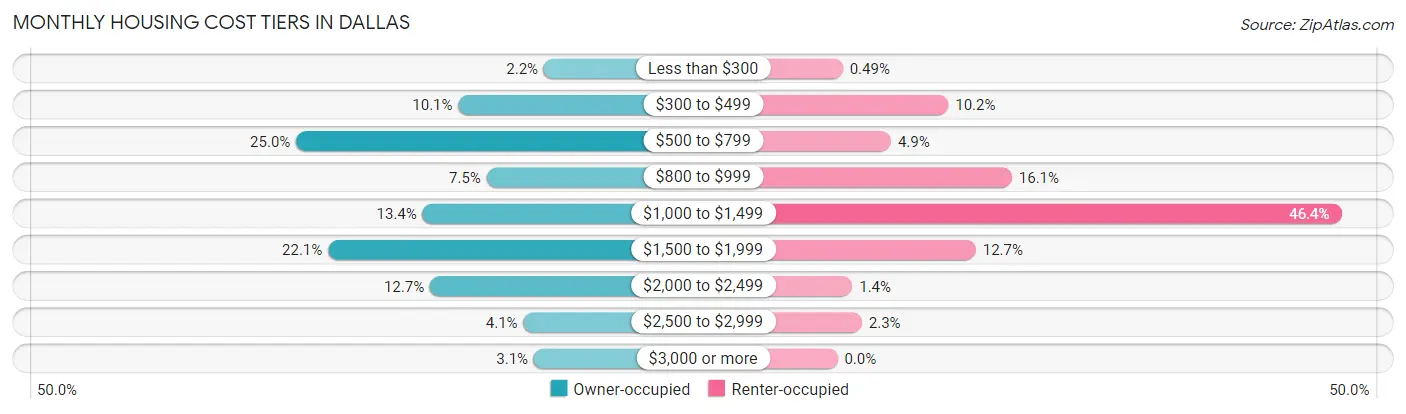
| Monthly Cost | Owner-occupied | Renter-occupied |
| Less than $300 | 100 (2.2%) | 10 (0.5%) |
| $300 to $499 | 459 (10.1%) | 209 (10.2%) |
| $500 to $799 | 1,140 (25.0%) | 101 (4.9%) |
| $800 to $999 | 340 (7.5%) | 329 (16.1%) |
| $1,000 to $1,499 | 609 (13.4%) | 950 (46.4%) |
| $1,500 to $1,999 | 1,006 (22.1%) | 261 (12.7%) |
| $2,000 to $2,499 | 578 (12.7%) | 28 (1.4%) |
| $2,500 to $2,999 | 186 (4.1%) | 46 (2.2%) |
| $3,000 or more | 142 (3.1%) | 0 (0.0%) |
| Total | 4,560 (100.0%) | 2,048 (100.0%) |
Physical Housing Characteristics in Dallas
Housing Structures in Dallas
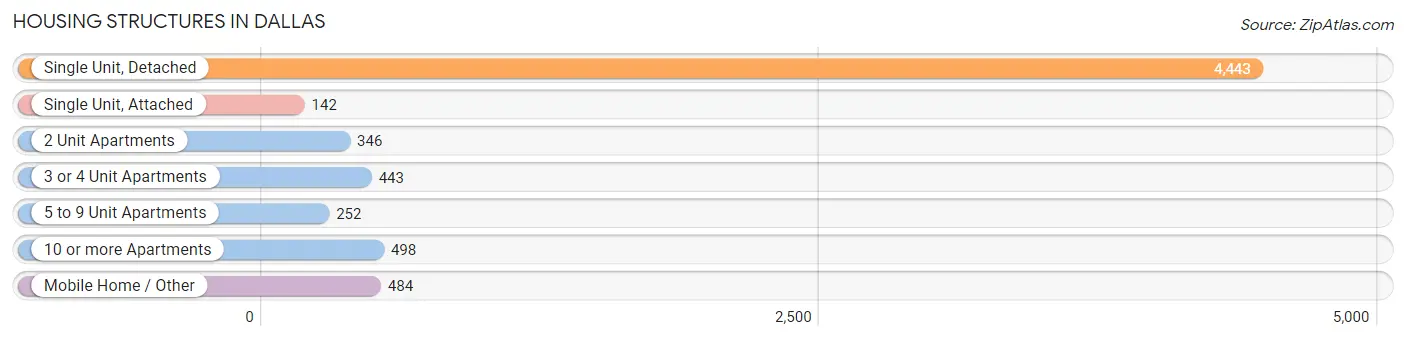
| Structure Type | # Housing Units | % Housing Units |
| Single Unit, Detached | 4,443 | 67.2% |
| Single Unit, Attached | 142 | 2.1% |
| 2 Unit Apartments | 346 | 5.2% |
| 3 or 4 Unit Apartments | 443 | 6.7% |
| 5 to 9 Unit Apartments | 252 | 3.8% |
| 10 or more Apartments | 498 | 7.5% |
| Mobile Home / Other | 484 | 7.3% |
| Total | 6,608 | 100.0% |
Housing Structures by Occupancy in Dallas
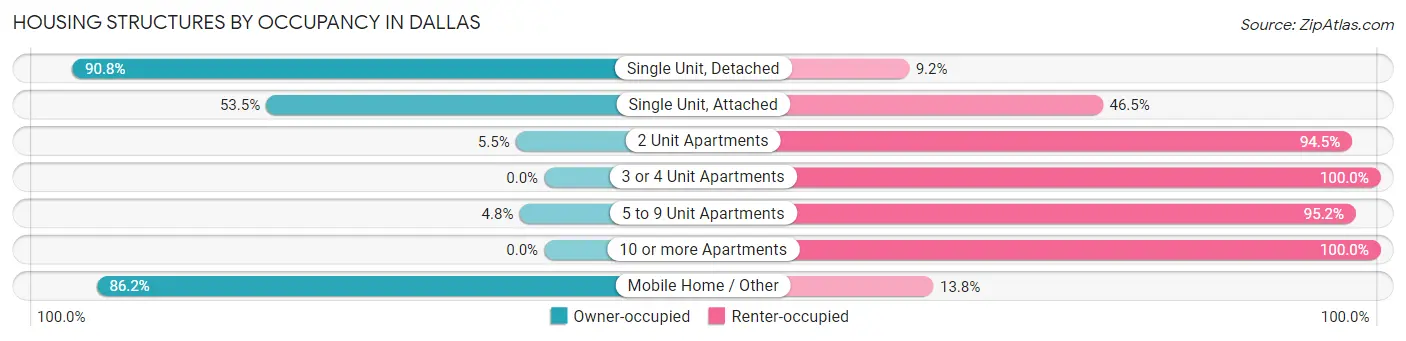
| Structure Type | Owner-occupied | Renter-occupied |
| Single Unit, Detached | 4,036 (90.8%) | 407 (9.2%) |
| Single Unit, Attached | 76 (53.5%) | 66 (46.5%) |
| 2 Unit Apartments | 19 (5.5%) | 327 (94.5%) |
| 3 or 4 Unit Apartments | 0 (0.0%) | 443 (100.0%) |
| 5 to 9 Unit Apartments | 12 (4.8%) | 240 (95.2%) |
| 10 or more Apartments | 0 (0.0%) | 498 (100.0%) |
| Mobile Home / Other | 417 (86.2%) | 67 (13.8%) |
| Total | 4,560 (69.0%) | 2,048 (31.0%) |
Housing Structures by Number of Rooms in Dallas
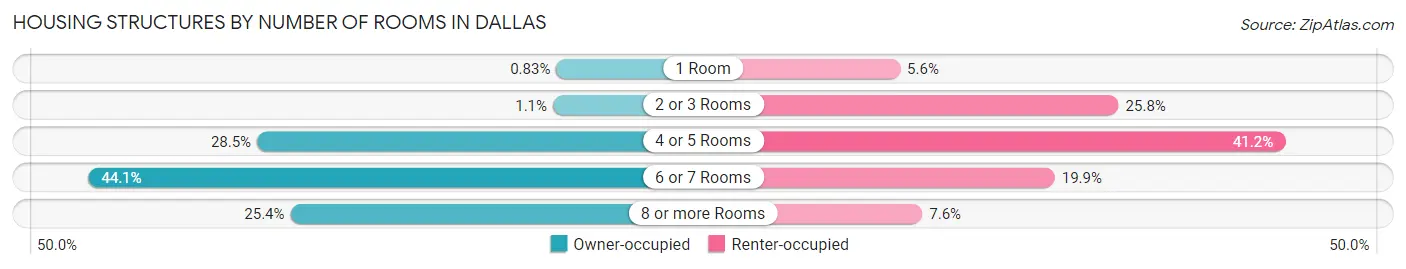
| Number of Rooms | Owner-occupied | Renter-occupied |
| 1 Room | 38 (0.8%) | 114 (5.6%) |
| 2 or 3 Rooms | 52 (1.1%) | 528 (25.8%) |
| 4 or 5 Rooms | 1,300 (28.5%) | 843 (41.2%) |
| 6 or 7 Rooms | 2,011 (44.1%) | 407 (19.9%) |
| 8 or more Rooms | 1,159 (25.4%) | 156 (7.6%) |
| Total | 4,560 (100.0%) | 2,048 (100.0%) |
Housing Structure by Heating Type in Dallas
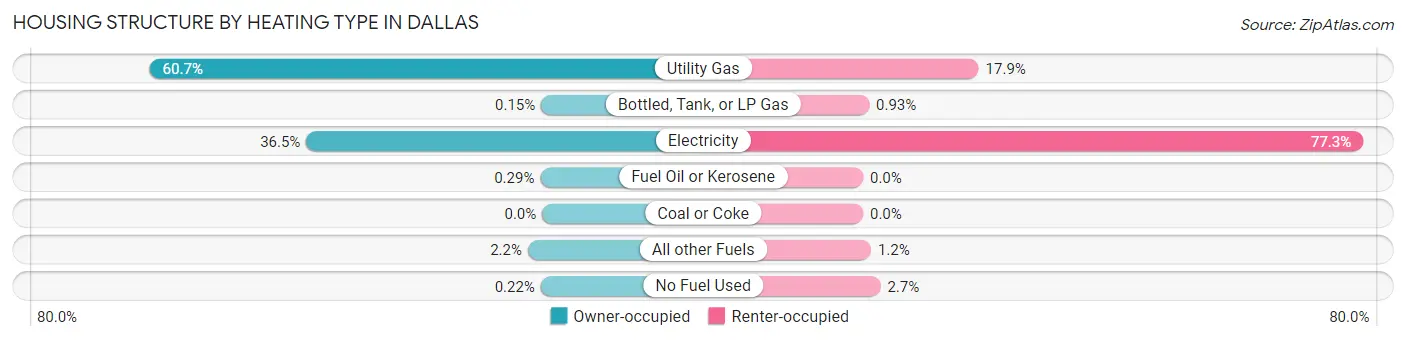
| Heating Type | Owner-occupied | Renter-occupied |
| Utility Gas | 2,766 (60.7%) | 366 (17.9%) |
| Bottled, Tank, or LP Gas | 7 (0.2%) | 19 (0.9%) |
| Electricity | 1,663 (36.5%) | 1,583 (77.3%) |
| Fuel Oil or Kerosene | 13 (0.3%) | 0 (0.0%) |
| Coal or Coke | 0 (0.0%) | 0 (0.0%) |
| All other Fuels | 101 (2.2%) | 25 (1.2%) |
| No Fuel Used | 10 (0.2%) | 55 (2.7%) |
| Total | 4,560 (100.0%) | 2,048 (100.0%) |
Household Vehicle Usage in Dallas
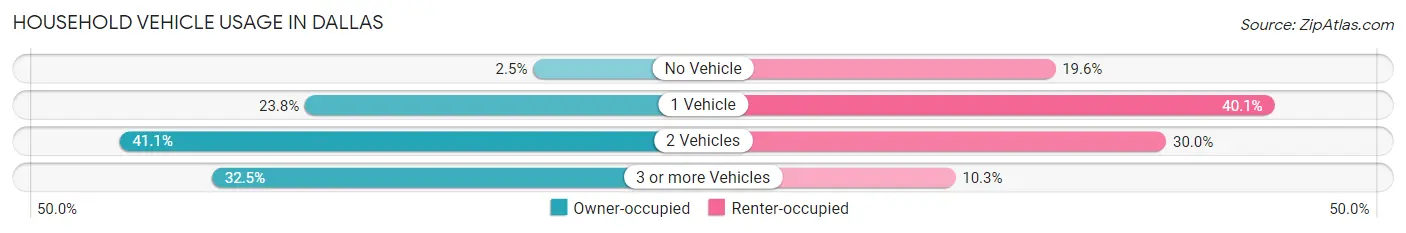
| Vehicles per Household | Owner-occupied | Renter-occupied |
| No Vehicle | 115 (2.5%) | 402 (19.6%) |
| 1 Vehicle | 1,086 (23.8%) | 821 (40.1%) |
| 2 Vehicles | 1,876 (41.1%) | 614 (30.0%) |
| 3 or more Vehicles | 1,483 (32.5%) | 211 (10.3%) |
| Total | 4,560 (100.0%) | 2,048 (100.0%) |
Real Estate & Mortgages in Dallas
Real Estate and Mortgage Overview in Dallas
| Characteristic | Without Mortgage | With Mortgage |
| Housing Units | 1,519 | 3,041 |
| Median Property Value | $292,500 | $340,700 |
| Median Household Income | $53,450 | $675 |
| Monthly Housing Costs | $584 | $142 |
| Real Estate Taxes | $2,742 | $63 |
Property Value by Mortgage Status in Dallas
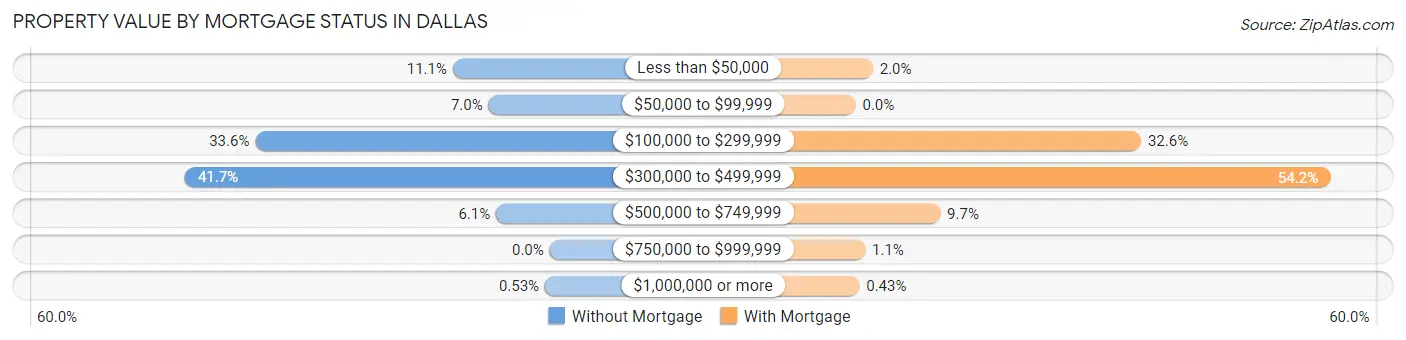
| Property Value | Without Mortgage | With Mortgage |
| Less than $50,000 | 168 (11.1%) | 60 (2.0%) |
| $50,000 to $99,999 | 106 (7.0%) | 0 (0.0%) |
| $100,000 to $299,999 | 511 (33.6%) | 992 (32.6%) |
| $300,000 to $499,999 | 633 (41.7%) | 1,649 (54.2%) |
| $500,000 to $749,999 | 93 (6.1%) | 294 (9.7%) |
| $750,000 to $999,999 | 0 (0.0%) | 33 (1.1%) |
| $1,000,000 or more | 8 (0.5%) | 13 (0.4%) |
| Total | 1,519 (100.0%) | 3,041 (100.0%) |
Household Income by Mortgage Status in Dallas
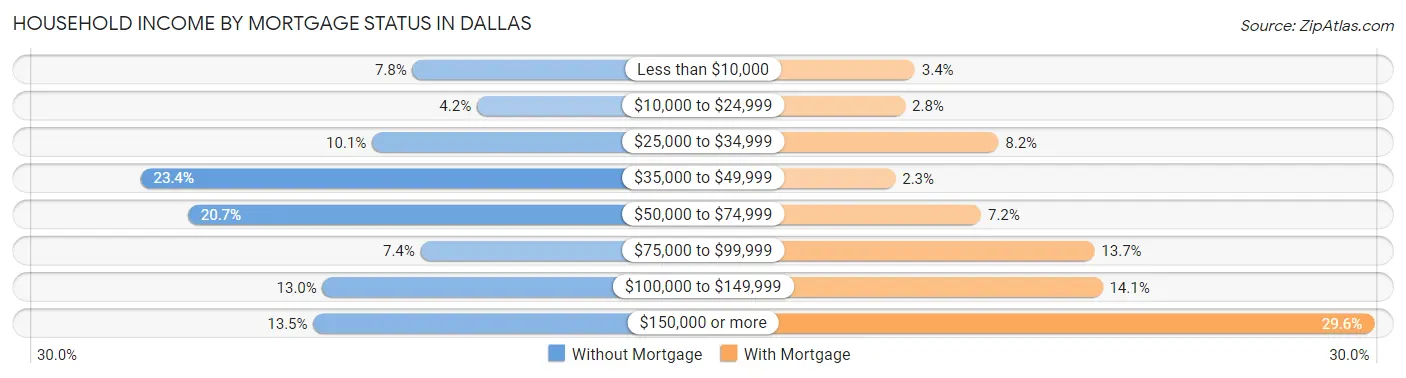
| Household Income | Without Mortgage | With Mortgage |
| Less than $10,000 | 119 (7.8%) | 103 (3.4%) |
| $10,000 to $24,999 | 63 (4.2%) | 86 (2.8%) |
| $25,000 to $34,999 | 154 (10.1%) | 248 (8.2%) |
| $35,000 to $49,999 | 355 (23.4%) | 69 (2.3%) |
| $50,000 to $74,999 | 314 (20.7%) | 218 (7.2%) |
| $75,000 to $99,999 | 112 (7.4%) | 415 (13.7%) |
| $100,000 to $149,999 | 197 (13.0%) | 429 (14.1%) |
| $150,000 or more | 205 (13.5%) | 901 (29.6%) |
| Total | 1,519 (100.0%) | 3,041 (100.0%) |
Property Value to Household Income Ratio in Dallas
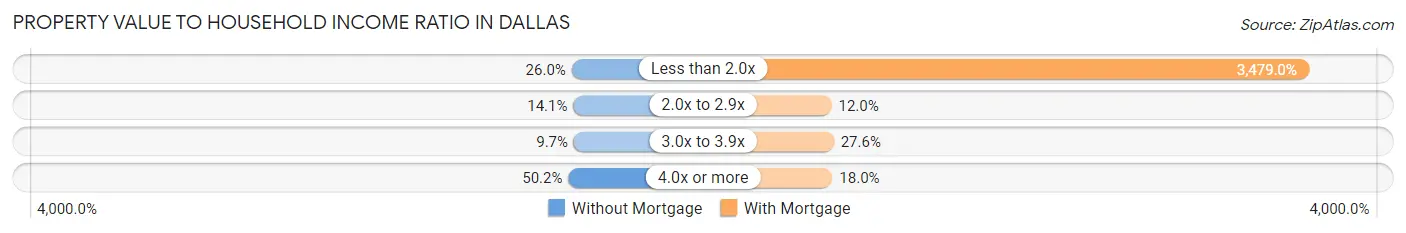
| Value-to-Income Ratio | Without Mortgage | With Mortgage |
| Less than 2.0x | 395 (26.0%) | 105,795 (3,478.9%) |
| 2.0x to 2.9x | 214 (14.1%) | 365 (12.0%) |
| 3.0x to 3.9x | 147 (9.7%) | 838 (27.6%) |
| 4.0x or more | 763 (50.2%) | 547 (18.0%) |
| Total | 1,519 (100.0%) | 3,041 (100.0%) |
Real Estate Taxes by Mortgage Status in Dallas
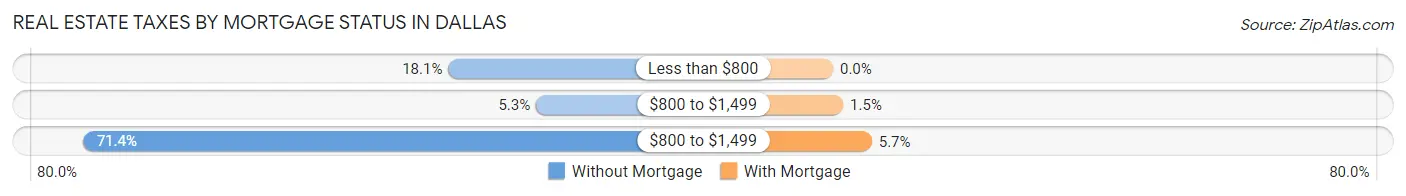
| Property Taxes | Without Mortgage | With Mortgage |
| Less than $800 | 275 (18.1%) | 0 (0.0%) |
| $800 to $1,499 | 80 (5.3%) | 45 (1.5%) |
| $800 to $1,499 | 1,084 (71.4%) | 172 (5.7%) |
| Total | 1,519 (100.0%) | 3,041 (100.0%) |
Health & Disability in Dallas
Health Insurance Coverage by Age in Dallas
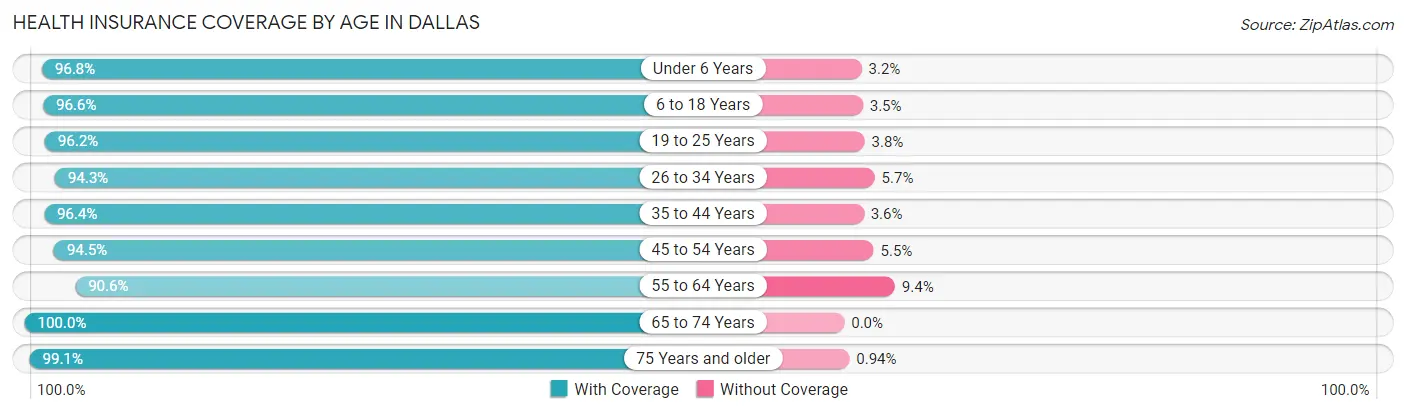
| Age Bracket | With Coverage | Without Coverage |
| Under 6 Years | 1,234 (96.8%) | 41 (3.2%) |
| 6 to 18 Years | 2,520 (96.6%) | 90 (3.5%) |
| 19 to 25 Years | 1,752 (96.2%) | 69 (3.8%) |
| 26 to 34 Years | 1,684 (94.3%) | 101 (5.7%) |
| 35 to 44 Years | 1,519 (96.4%) | 57 (3.6%) |
| 45 to 54 Years | 1,831 (94.5%) | 106 (5.5%) |
| 55 to 64 Years | 1,660 (90.6%) | 173 (9.4%) |
| 65 to 74 Years | 2,142 (100.0%) | 0 (0.0%) |
| 75 Years and older | 1,585 (99.1%) | 15 (0.9%) |
| Total | 15,927 (96.1%) | 652 (3.9%) |
Health Insurance Coverage by Citizenship Status in Dallas

| Citizenship Status | With Coverage | Without Coverage |
| Native Born | 1,234 (96.8%) | 41 (3.2%) |
| Foreign Born, Citizen | 2,520 (96.6%) | 90 (3.5%) |
| Foreign Born, not a Citizen | 1,752 (96.2%) | 69 (3.8%) |
Health Insurance Coverage by Household Income in Dallas
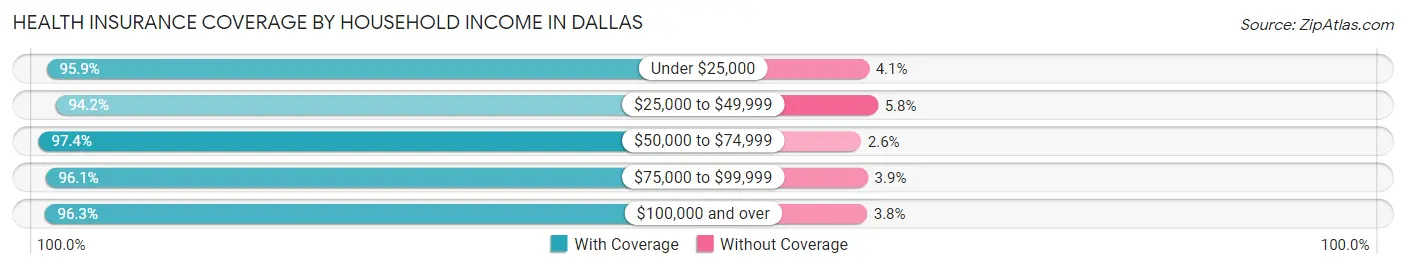
| Household Income | With Coverage | Without Coverage |
| Under $25,000 | 2,178 (95.9%) | 93 (4.1%) |
| $25,000 to $49,999 | 2,391 (94.2%) | 147 (5.8%) |
| $50,000 to $74,999 | 2,593 (97.4%) | 70 (2.6%) |
| $75,000 to $99,999 | 2,583 (96.1%) | 105 (3.9%) |
| $100,000 and over | 6,080 (96.3%) | 237 (3.7%) |
Public vs Private Health Insurance Coverage by Age in Dallas
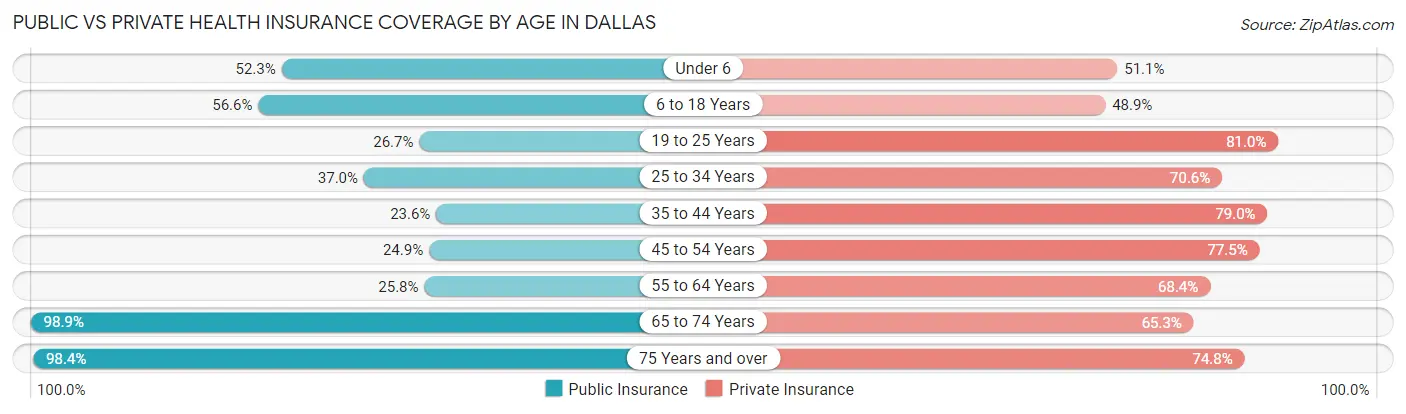
| Age Bracket | Public Insurance | Private Insurance |
| Under 6 | 667 (52.3%) | 652 (51.1%) |
| 6 to 18 Years | 1,478 (56.6%) | 1,276 (48.9%) |
| 19 to 25 Years | 487 (26.7%) | 1,475 (81.0%) |
| 25 to 34 Years | 661 (37.0%) | 1,260 (70.6%) |
| 35 to 44 Years | 372 (23.6%) | 1,245 (79.0%) |
| 45 to 54 Years | 483 (24.9%) | 1,502 (77.5%) |
| 55 to 64 Years | 473 (25.8%) | 1,253 (68.4%) |
| 65 to 74 Years | 2,118 (98.9%) | 1,399 (65.3%) |
| 75 Years and over | 1,575 (98.4%) | 1,196 (74.8%) |
| Total | 8,314 (50.1%) | 11,258 (67.9%) |
Disability Status by Sex by Age in Dallas
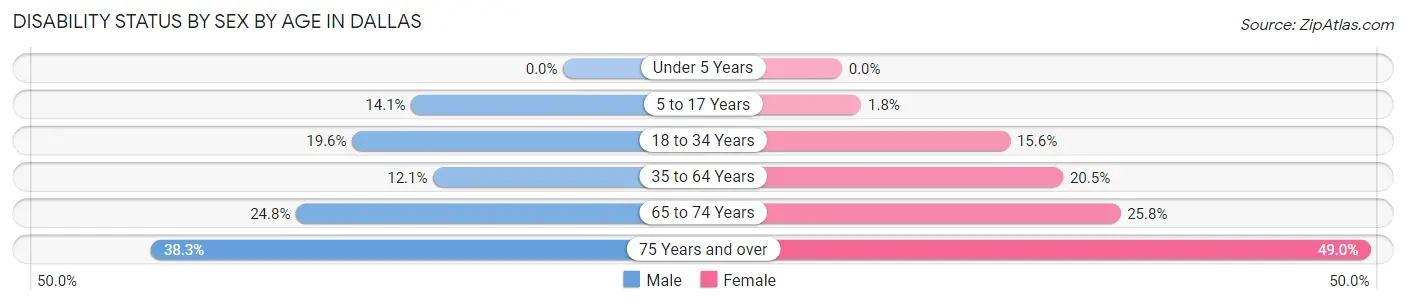
| Age Bracket | Male | Female |
| Under 5 Years | 0 (0.0%) | 0 (0.0%) |
| 5 to 17 Years | 166 (14.1%) | 22 (1.8%) |
| 18 to 34 Years | 392 (19.6%) | 316 (15.6%) |
| 35 to 64 Years | 315 (12.1%) | 562 (20.5%) |
| 65 to 74 Years | 178 (24.8%) | 368 (25.8%) |
| 75 Years and over | 261 (38.3%) | 450 (49.0%) |
Disability Class by Sex by Age in Dallas
Disability Class: Hearing Difficulty
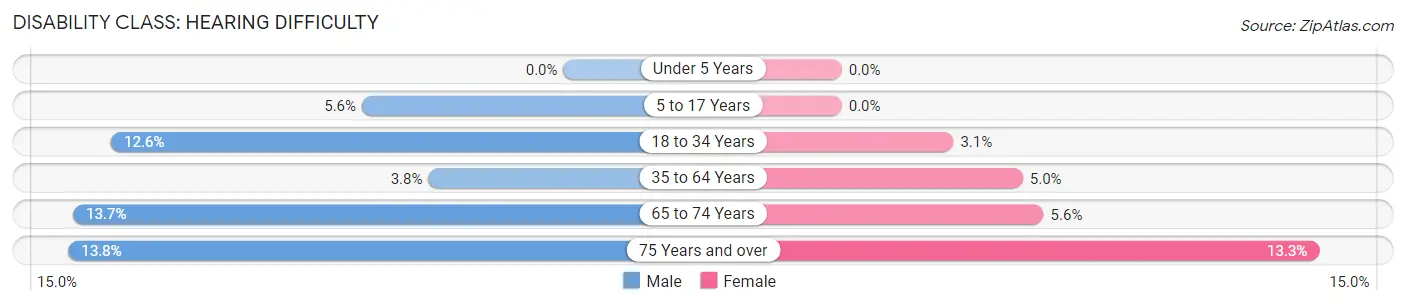
| Age Bracket | Male | Female |
| Under 5 Years | 0 (0.0%) | 0 (0.0%) |
| 5 to 17 Years | 66 (5.6%) | 0 (0.0%) |
| 18 to 34 Years | 252 (12.6%) | 63 (3.1%) |
| 35 to 64 Years | 98 (3.8%) | 138 (5.0%) |
| 65 to 74 Years | 98 (13.7%) | 80 (5.6%) |
| 75 Years and over | 94 (13.8%) | 122 (13.3%) |
Disability Class: Vision Difficulty
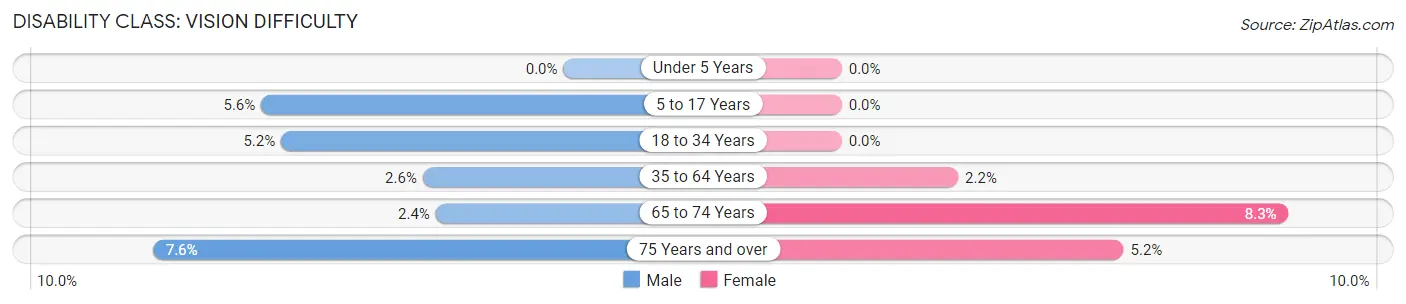
| Age Bracket | Male | Female |
| Under 5 Years | 0 (0.0%) | 0 (0.0%) |
| 5 to 17 Years | 66 (5.6%) | 0 (0.0%) |
| 18 to 34 Years | 105 (5.2%) | 0 (0.0%) |
| 35 to 64 Years | 68 (2.6%) | 59 (2.2%) |
| 65 to 74 Years | 17 (2.4%) | 118 (8.3%) |
| 75 Years and over | 52 (7.6%) | 48 (5.2%) |
Disability Class: Cognitive Difficulty
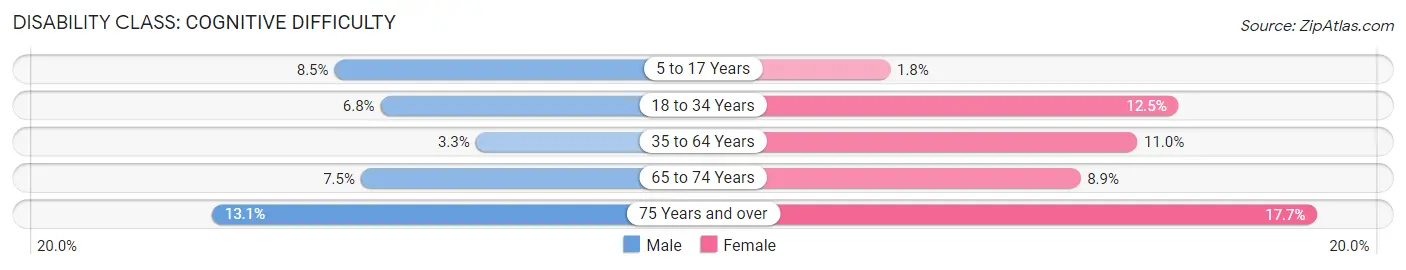
| Age Bracket | Male | Female |
| 5 to 17 Years | 100 (8.5%) | 22 (1.8%) |
| 18 to 34 Years | 136 (6.8%) | 253 (12.5%) |
| 35 to 64 Years | 85 (3.3%) | 300 (11.0%) |
| 65 to 74 Years | 54 (7.5%) | 126 (8.8%) |
| 75 Years and over | 89 (13.1%) | 162 (17.6%) |
Disability Class: Ambulatory Difficulty
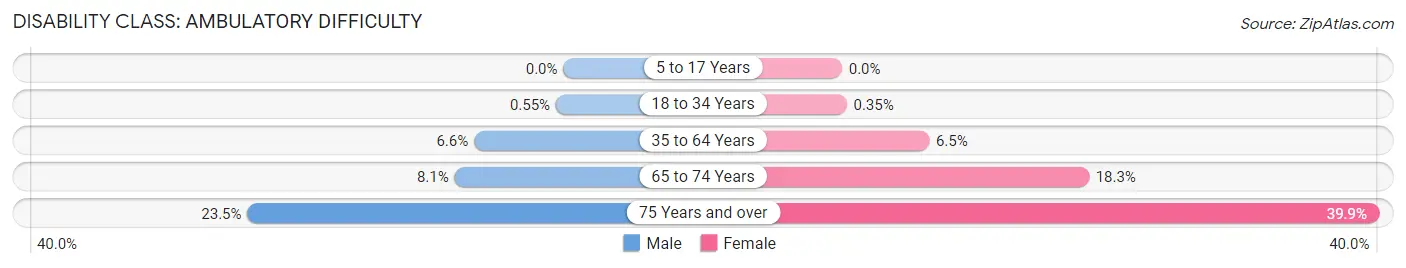
| Age Bracket | Male | Female |
| 5 to 17 Years | 0 (0.0%) | 0 (0.0%) |
| 18 to 34 Years | 11 (0.5%) | 7 (0.4%) |
| 35 to 64 Years | 173 (6.6%) | 177 (6.5%) |
| 65 to 74 Years | 58 (8.1%) | 261 (18.3%) |
| 75 Years and over | 160 (23.5%) | 366 (39.9%) |
Disability Class: Self-Care Difficulty
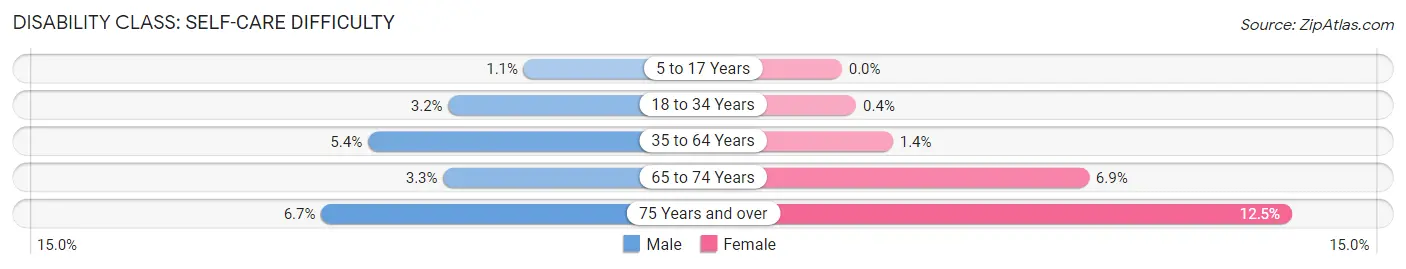
| Age Bracket | Male | Female |
| 5 to 17 Years | 13 (1.1%) | 0 (0.0%) |
| 18 to 34 Years | 64 (3.2%) | 8 (0.4%) |
| 35 to 64 Years | 142 (5.4%) | 39 (1.4%) |
| 65 to 74 Years | 24 (3.3%) | 98 (6.9%) |
| 75 Years and over | 46 (6.7%) | 115 (12.5%) |
Technology Access in Dallas
Computing Device Access in Dallas
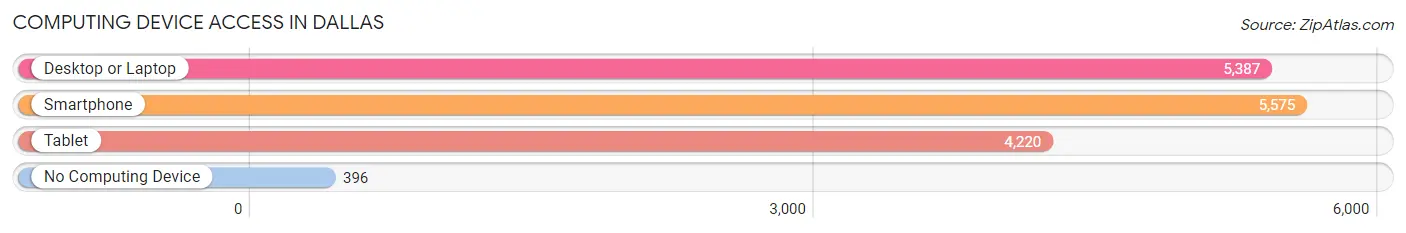
| Device Type | # Households | % Households |
| Desktop or Laptop | 5,387 | 81.5% |
| Smartphone | 5,575 | 84.4% |
| Tablet | 4,220 | 63.9% |
| No Computing Device | 396 | 6.0% |
| Total | 6,608 | 100.0% |
Internet Access in Dallas
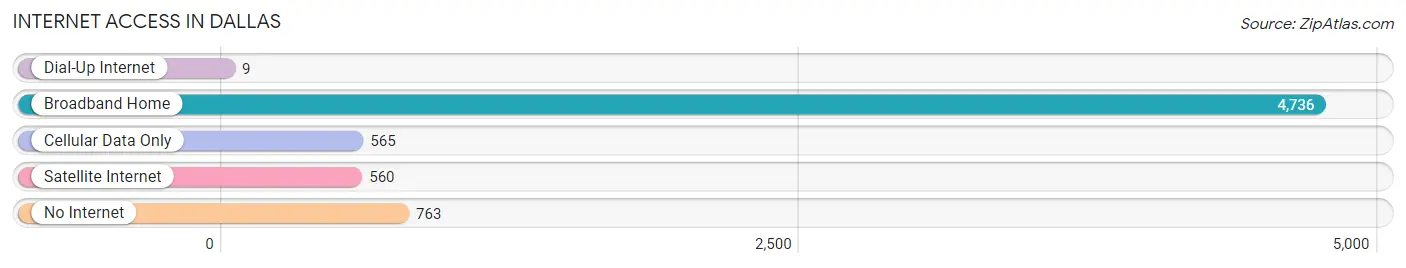
| Internet Type | # Households | % Households |
| Dial-Up Internet | 9 | 0.1% |
| Broadband Home | 4,736 | 71.7% |
| Cellular Data Only | 565 | 8.6% |
| Satellite Internet | 560 | 8.5% |
| No Internet | 763 | 11.6% |
| Total | 6,608 | 100.0% |
Dallas Summary
Dallas, Oregon is a small city located in Polk County, Oregon, United States. It is situated in the Willamette Valley, about 12 miles west of Salem, the state capital. The city is part of the Salem Metropolitan Statistical Area and is home to a population of approximately 14,000 people.
Geography
Dallas is located in the Willamette Valley, a fertile agricultural region in the northwestern part of the state. The city is situated on the banks of the Luckiamute River, which flows through the city and is a tributary of the Willamette River. The city is surrounded by rolling hills and is located at an elevation of approximately 200 feet above sea level. The climate in Dallas is mild and temperate, with warm summers and cool winters.
Economy
Dallas is a small city with a diverse economy. The city is home to a variety of businesses, including manufacturing, retail, and service industries. The city is also home to several large employers, including Dallas School District, Dallas-based grocery store chain, and Dallas-based health care provider, Salem Health. The city is also home to several small businesses, including restaurants, shops, and other services.
Demographics
As of the 2010 census, the population of Dallas was 13,944. The racial makeup of the city was 87.3% White, 0.7% African American, 0.7% Native American, 0.9% Asian, 0.1% Pacific Islander, 8.2% from other races, and 2.2% from two or more races. Hispanic or Latino of any race were 16.2% of the population.
The median income for a household in the city was $41,945, and the median income for a family was $50,945. The per capita income for the city was $20,945. About 11.2% of families and 14.2% of the population were below the poverty line, including 19.2% of those under age 18 and 8.2% of those age 65 or over.
History
Dallas was founded in 1846 by William and Mary Dallas, who were among the first settlers in the area. The city was named after William Dallas, who was a prominent local politician and businessman. The city was incorporated in 1874 and has since grown to become a thriving community.
Dallas has a rich history and is home to several historic sites, including the Polk County Courthouse, the Dallas City Hall, and the Dallas Public Library. The city is also home to several museums, including the Dallas Museum of History and the Dallas Museum of Art.
Conclusion
Dallas, Oregon is a small city located in Polk County, Oregon, United States. It is situated in the Willamette Valley, about 12 miles west of Salem, the state capital. The city is part of the Salem Metropolitan Statistical Area and is home to a population of approximately 14,000 people. Dallas has a diverse economy and is home to several large employers, including Dallas School District, Dallas-based grocery store chain, and Dallas-based health care provider, Salem Health. The city is also home to several small businesses, including restaurants, shops, and other services. The racial makeup of the city was 87.3% White, 0.7% African American, 0.7% Native American, 0.9% Asian, 0.1% Pacific Islander, 8.2% from other races, and 2.2% from two or more races. Dallas has a rich history and is home to several historic sites, museums, and other attractions.
Common Questions
What is Per Capita Income in Dallas?
Per Capita income in Dallas is $36,897.
What is the Median Family Income in Dallas?
Median Family Income in Dallas is $86,364.
What is the Median Household income in Dallas?
Median Household Income in Dallas is $67,935.
What is Income or Wage Gap in Dallas?
Income or Wage Gap in Dallas is 31.0%.
Women in Dallas earn 69.0 cents for every dollar earned by a man.
What is Family Income Deficit in Dallas?
Family Income Deficit in Dallas is $11,155.
Families that are below poverty line in Dallas earn $11,155 less on average than the poverty threshold level.
What is Inequality or Gini Index in Dallas?
Inequality or Gini Index in Dallas is 0.48.
What is the Total Population of Dallas?
Total Population of Dallas is 16,945.
What is the Total Male Population of Dallas?
Total Male Population of Dallas is 7,965.
What is the Total Female Population of Dallas?
Total Female Population of Dallas is 8,980.
What is the Ratio of Males per 100 Females in Dallas?
There are 88.70 Males per 100 Females in Dallas.
What is the Ratio of Females per 100 Males in Dallas?
There are 112.74 Females per 100 Males in Dallas.
What is the Median Population Age in Dallas?
Median Population Age in Dallas is 41.2 Years.
What is the Average Family Size in Dallas
Average Family Size in Dallas is 3.0 People.
What is the Average Household Size in Dallas
Average Household Size in Dallas is 2.5 People.
How Large is the Labor Force in Dallas?
There are 7,553 People in the Labor Forcein in Dallas.
What is the Percentage of People in the Labor Force in Dallas?
54.5% of People are in the Labor Force in Dallas.
What is the Unemployment Rate in Dallas?
Unemployment Rate in Dallas is 5.2%.