Ontario, OR Map & Demographics
Ontario Map
Ontario Overview
$23,075
PER CAPITA INCOME
$56,795
AVG FAMILY INCOME
$39,750
AVG HOUSEHOLD INCOME
0.5%
WAGE / INCOME GAP [ % ]
99.5¢/ $1
WAGE / INCOME GAP [ $ ]
0.46
INEQUALITY / GINI INDEX
11,610
TOTAL POPULATION
5,559
MALE POPULATION
6,051
FEMALE POPULATION
91.87
MALES / 100 FEMALES
108.85
FEMALES / 100 MALES
34.9
MEDIAN AGE
3.5
AVG FAMILY SIZE
2.5
AVG HOUSEHOLD SIZE
5,003
LABOR FORCE [ PEOPLE ]
56.3%
PERCENT IN LABOR FORCE
7.0%
UNEMPLOYMENT RATE
Ontario Zip Codes
Ontario Area Codes
Income in Ontario
Income Overview in Ontario
Per Capita Income in Ontario is $23,075, while median incomes of families and households are $56,795 and $39,750 respectively.
| Characteristic | Number | Measure |
| Per Capita Income | 11,610 | $23,075 |
| Median Family Income | 2,435 | $56,795 |
| Mean Family Income | 2,435 | $72,047 |
| Median Household Income | 4,416 | $39,750 |
| Mean Household Income | 4,416 | $55,802 |
| Income Deficit | 2,435 | $0 |
| Wage / Income Gap (%) | 11,610 | 0.55% |
| Wage / Income Gap ($) | 11,610 | 99.45¢ per $1 |
| Gini / Inequality Index | 11,610 | 0.46 |
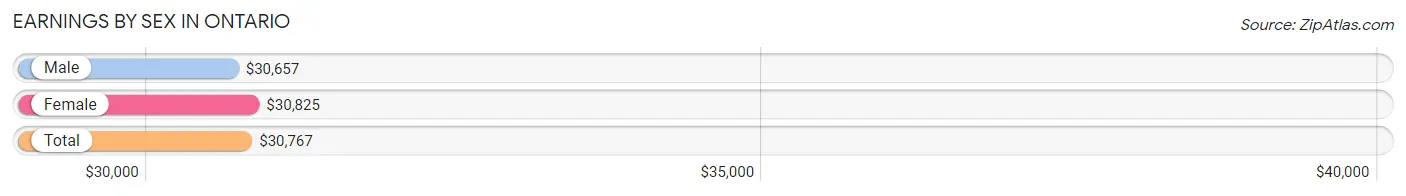
Earnings by Sex in Ontario
Average Earnings in Ontario are $30,767, $30,657 for men and $30,825 for women, a difference of 0.5%.
| Sex | Number | Average Earnings |
| Male | 2,680 (52.5%) | $30,657 |
| Female | 2,425 (47.5%) | $30,825 |
| Total | 5,105 (100.0%) | $30,767 |
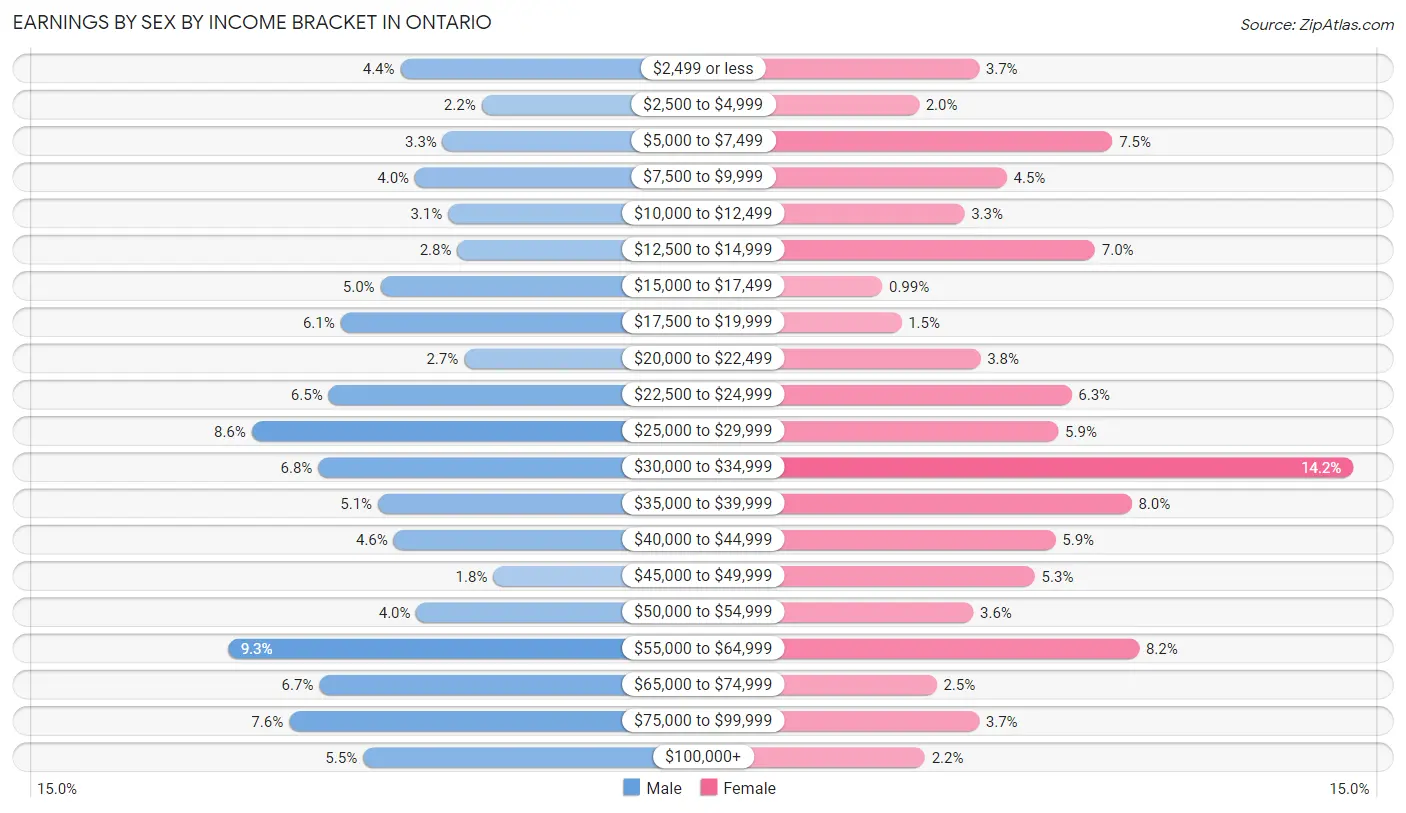
Earnings by Sex by Income Bracket in Ontario
The most common earnings brackets in Ontario are $55,000 to $64,999 for men (249 | 9.3%) and $30,000 to $34,999 for women (345 | 14.2%).
| Income | Male | Female |
| $2,499 or less | 119 (4.4%) | 90 (3.7%) |
| $2,500 to $4,999 | 58 (2.2%) | 49 (2.0%) |
| $5,000 to $7,499 | 87 (3.3%) | 181 (7.5%) |
| $7,500 to $9,999 | 108 (4.0%) | 109 (4.5%) |
| $10,000 to $12,499 | 83 (3.1%) | 80 (3.3%) |
| $12,500 to $14,999 | 76 (2.8%) | 169 (7.0%) |
| $15,000 to $17,499 | 134 (5.0%) | 24 (1.0%) |
| $17,500 to $19,999 | 164 (6.1%) | 37 (1.5%) |
| $20,000 to $22,499 | 71 (2.6%) | 91 (3.7%) |
| $22,500 to $24,999 | 173 (6.5%) | 153 (6.3%) |
| $25,000 to $29,999 | 231 (8.6%) | 144 (5.9%) |
| $30,000 to $34,999 | 181 (6.8%) | 345 (14.2%) |
| $35,000 to $39,999 | 136 (5.1%) | 194 (8.0%) |
| $40,000 to $44,999 | 124 (4.6%) | 142 (5.9%) |
| $45,000 to $49,999 | 49 (1.8%) | 128 (5.3%) |
| $50,000 to $54,999 | 107 (4.0%) | 86 (3.5%) |
| $55,000 to $64,999 | 249 (9.3%) | 199 (8.2%) |
| $65,000 to $74,999 | 180 (6.7%) | 61 (2.5%) |
| $75,000 to $99,999 | 203 (7.6%) | 90 (3.7%) |
| $100,000+ | 147 (5.5%) | 53 (2.2%) |
| Total | 2,680 (100.0%) | 2,425 (100.0%) |
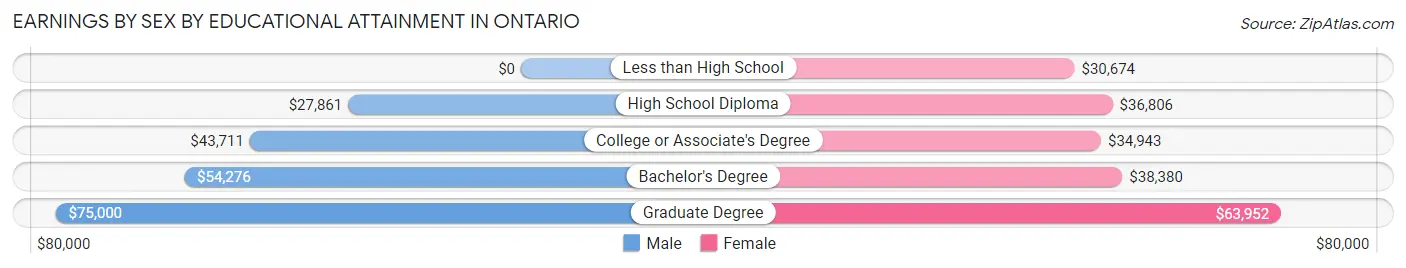
Earnings by Sex by Educational Attainment in Ontario
Average earnings in Ontario are $36,884 for men and $32,863 for women, a difference of 10.9%. Men with an educational attainment of graduate degree enjoy the highest average annual earnings of $75,000, while those with high school diploma education earn the least with $27,861. Women with an educational attainment of graduate degree earn the most with the average annual earnings of $63,952, while those with less than high school education have the smallest earnings of $30,674.
| Educational Attainment | Male Income | Female Income |
| Less than High School | - | - |
| High School Diploma | $27,861 | $36,806 |
| College or Associate's Degree | $43,711 | $34,943 |
| Bachelor's Degree | $54,276 | $38,380 |
| Graduate Degree | $75,000 | $63,952 |
| Total | $36,884 | $32,863 |
Family Income in Ontario
Family Income Brackets in Ontario
According to the Ontario family income data, there are 575 families falling into the $50,000 to $74,999 income range, which is the most common income bracket and makes up 23.6% of all families. Conversely, the $150,000 to $199,999 income bracket is the least frequent group with only 58 families (2.4%) belonging to this category.
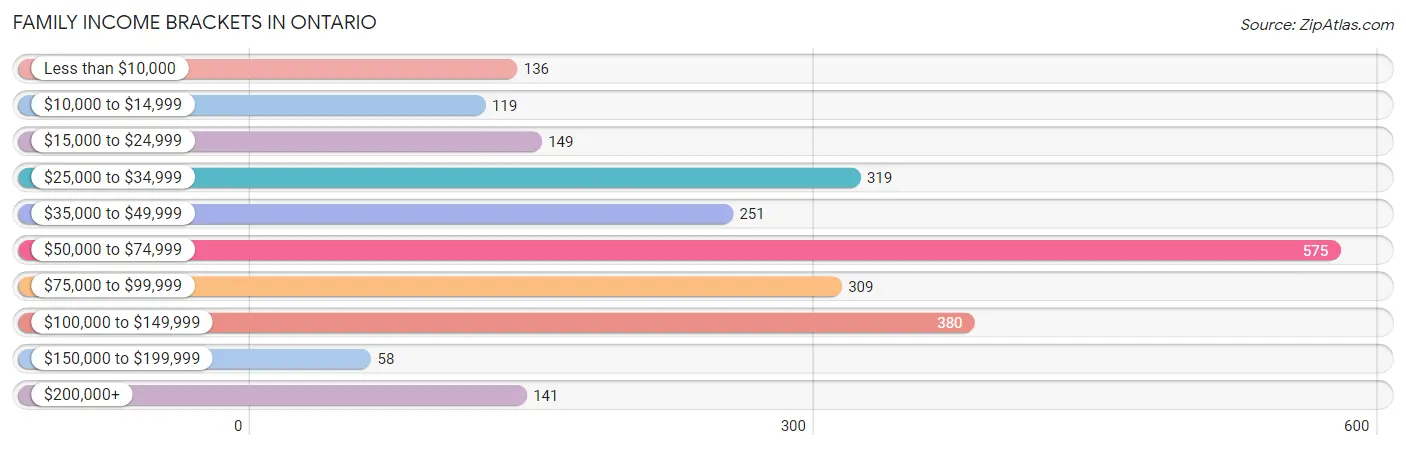
| Income Bracket | # Families | % Families |
| Less than $10,000 | 136 | 5.6% |
| $10,000 to $14,999 | 119 | 4.9% |
| $15,000 to $24,999 | 149 | 6.1% |
| $25,000 to $34,999 | 319 | 13.1% |
| $35,000 to $49,999 | 251 | 10.3% |
| $50,000 to $74,999 | 575 | 23.6% |
| $75,000 to $99,999 | 309 | 12.7% |
| $100,000 to $149,999 | 380 | 15.6% |
| $150,000 to $199,999 | 58 | 2.4% |
| $200,000+ | 141 | 5.8% |
Family Income by Famaliy Size in Ontario
6-person families (58 | 2.4%) account for the highest median family income in Ontario with $77,727 per family, while 2-person families (1,093 | 44.9%) have the highest median income of $28,056 per family member.
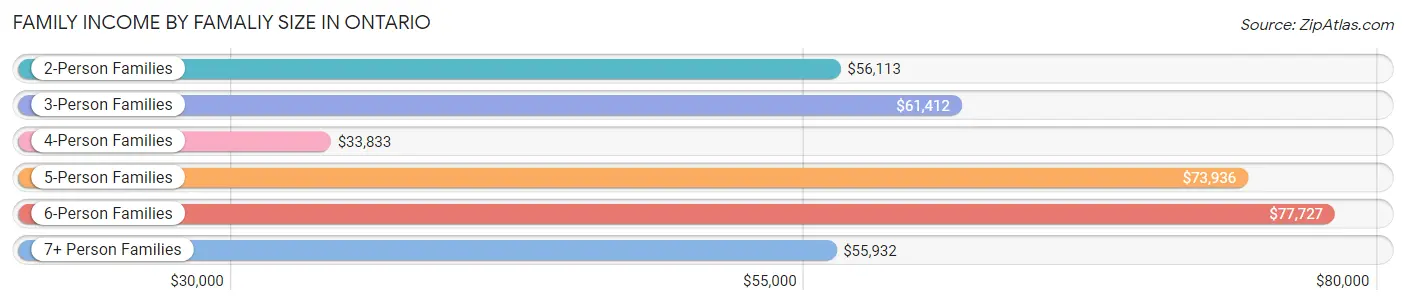
| Income Bracket | # Families | Median Income |
| 2-Person Families | 1,093 (44.9%) | $56,113 |
| 3-Person Families | 581 (23.9%) | $61,412 |
| 4-Person Families | 368 (15.1%) | $33,833 |
| 5-Person Families | 266 (10.9%) | $73,936 |
| 6-Person Families | 58 (2.4%) | $77,727 |
| 7+ Person Families | 69 (2.8%) | $55,932 |
| Total | 2,435 (100.0%) | $56,795 |
Family Income by Number of Earners in Ontario
The median family income in Ontario is $56,795, with families comprising 2 earners (831) having the highest median family income of $89,005, while families with no earners (443) have the lowest median family income of $26,103, accounting for 34.1% and 18.2% of families, respectively.
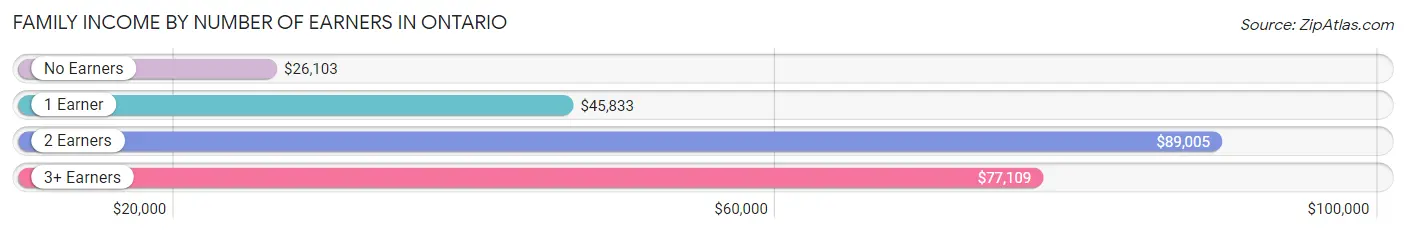
| Number of Earners | # Families | Median Income |
| No Earners | 443 (18.2%) | $26,103 |
| 1 Earner | 970 (39.8%) | $45,833 |
| 2 Earners | 831 (34.1%) | $89,005 |
| 3+ Earners | 191 (7.8%) | $77,109 |
| Total | 2,435 (100.0%) | $56,795 |
Household Income in Ontario
Household Income Brackets in Ontario
With 888 households falling in the category, the $50,000 to $74,999 income range is the most frequent in Ontario, accounting for 20.1% of all households. In contrast, only 93 households (2.1%) fall into the $150,000 to $199,999 income bracket, making it the least populous group.
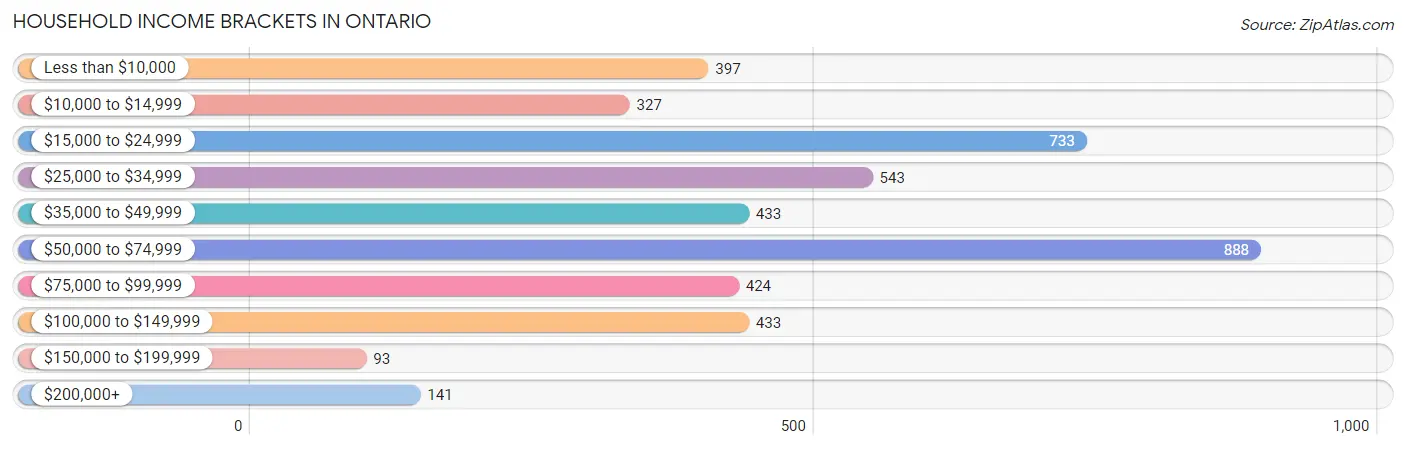
| Income Bracket | # Households | % Households |
| Less than $10,000 | 397 | 9.0% |
| $10,000 to $14,999 | 327 | 7.4% |
| $15,000 to $24,999 | 733 | 16.6% |
| $25,000 to $34,999 | 543 | 12.3% |
| $35,000 to $49,999 | 433 | 9.8% |
| $50,000 to $74,999 | 888 | 20.1% |
| $75,000 to $99,999 | 424 | 9.6% |
| $100,000 to $149,999 | 433 | 9.8% |
| $150,000 to $199,999 | 93 | 2.1% |
| $200,000+ | 141 | 3.2% |
Household Income by Householder Age in Ontario
The median household income in Ontario is $39,750, with the highest median household income of $56,611 found in the 45 to 64 years age bracket for the primary householder. A total of 1,362 households (30.8%) fall into this category. Meanwhile, the 65+ years age bracket for the primary householder has the lowest median household income of $26,504, with 1,387 households (31.4%) in this group.
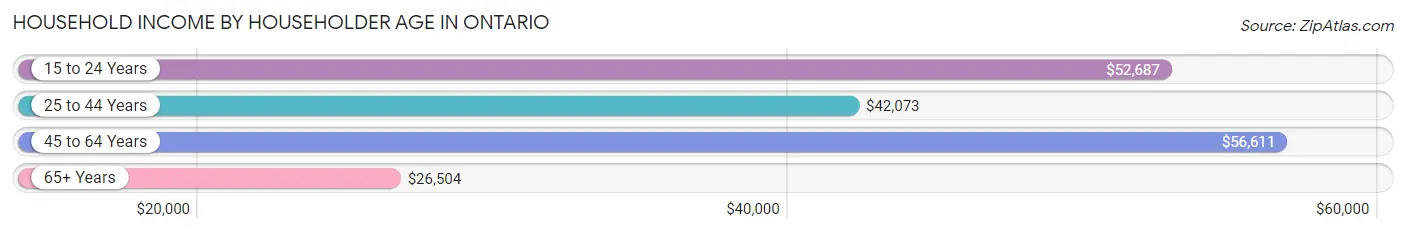
| Income Bracket | # Households | Median Income |
| 15 to 24 Years | 245 (5.6%) | $52,687 |
| 25 to 44 Years | 1,422 (32.2%) | $42,073 |
| 45 to 64 Years | 1,362 (30.8%) | $56,611 |
| 65+ Years | 1,387 (31.4%) | $26,504 |
| Total | 4,416 (100.0%) | $39,750 |
Poverty in Ontario
Income Below Poverty by Sex and Age in Ontario
With 19.2% poverty level for males and 23.4% for females among the residents of Ontario, 16 and 17 year old males and 15 year old females are the most vulnerable to poverty, with 104 males (63.4%) and 25 females (83.3%) in their respective age groups living below the poverty level.
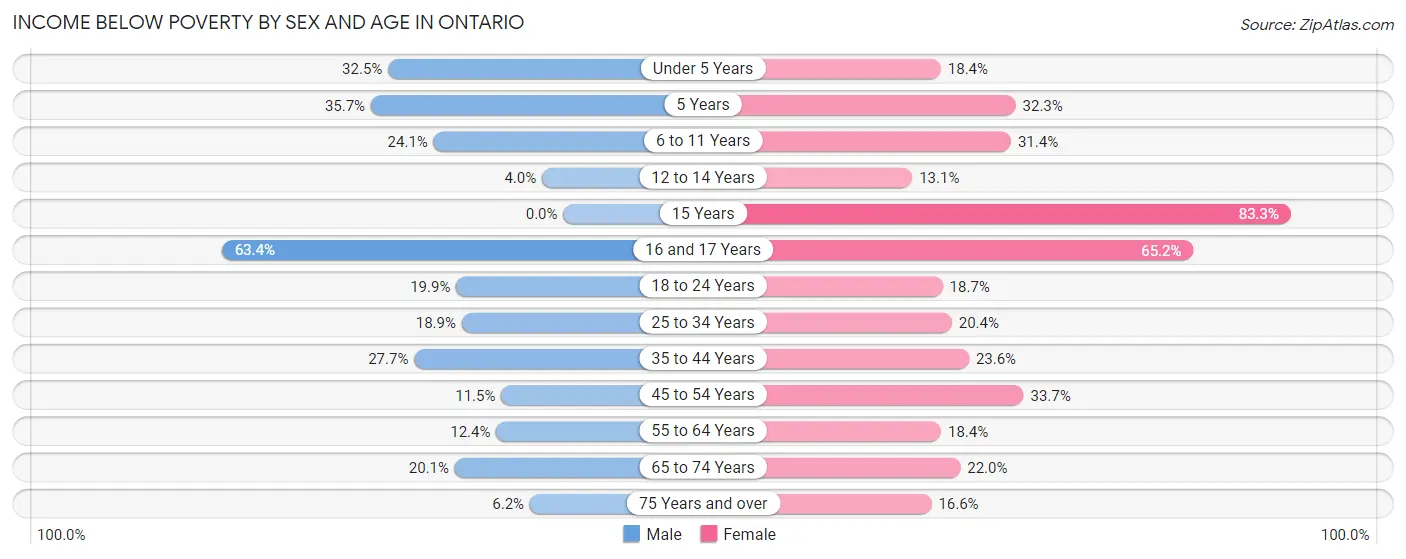
| Age Bracket | Male | Female |
| Under 5 Years | 106 (32.5%) | 80 (18.4%) |
| 5 Years | 20 (35.7%) | 30 (32.3%) |
| 6 to 11 Years | 117 (24.1%) | 157 (31.4%) |
| 12 to 14 Years | 15 (4.0%) | 37 (13.1%) |
| 15 Years | 0 (0.0%) | 25 (83.3%) |
| 16 and 17 Years | 104 (63.4%) | 107 (65.2%) |
| 18 to 24 Years | 97 (19.9%) | 85 (18.7%) |
| 25 to 34 Years | 167 (18.9%) | 165 (20.4%) |
| 35 to 44 Years | 168 (27.7%) | 135 (23.6%) |
| 45 to 54 Years | 57 (11.5%) | 171 (33.7%) |
| 55 to 64 Years | 72 (12.4%) | 149 (18.4%) |
| 65 to 74 Years | 88 (20.1%) | 135 (22.0%) |
| 75 Years and over | 29 (6.2%) | 106 (16.6%) |
| Total | 1,040 (19.2%) | 1,382 (23.4%) |
Income Above Poverty by Sex and Age in Ontario
According to the poverty statistics in Ontario, males aged 15 years and females aged 12 to 14 years are the age groups that are most secure financially, with 100.0% of males and 86.9% of females in these age groups living above the poverty line.
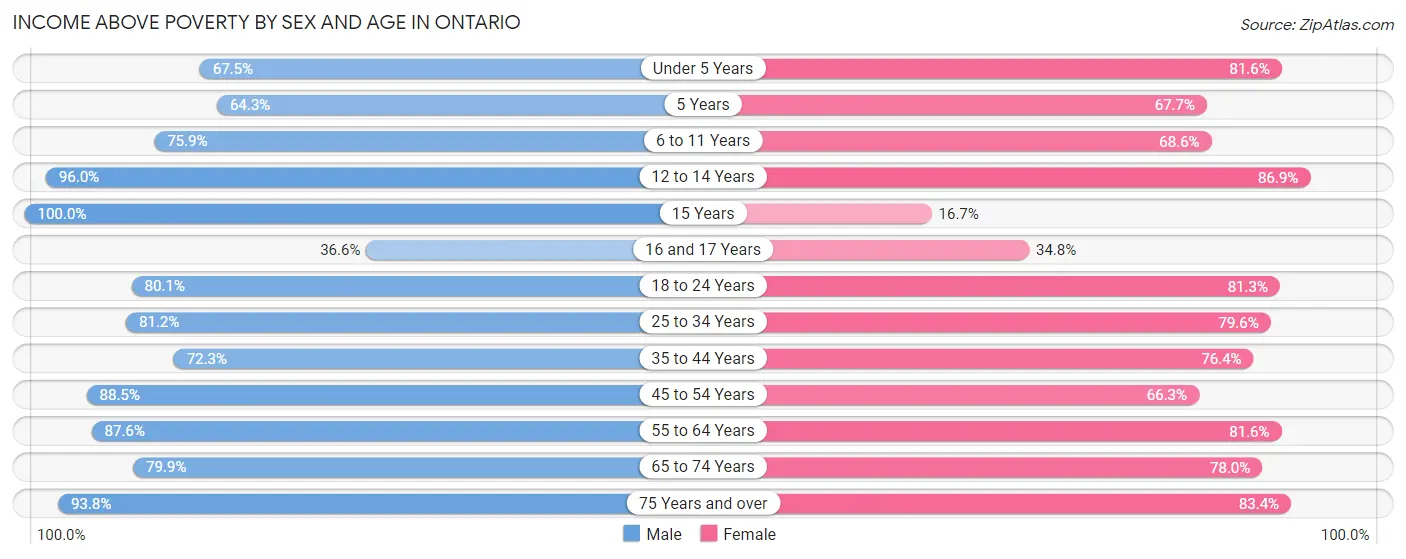
| Age Bracket | Male | Female |
| Under 5 Years | 220 (67.5%) | 355 (81.6%) |
| 5 Years | 36 (64.3%) | 63 (67.7%) |
| 6 to 11 Years | 369 (75.9%) | 343 (68.6%) |
| 12 to 14 Years | 364 (96.0%) | 246 (86.9%) |
| 15 Years | 46 (100.0%) | 5 (16.7%) |
| 16 and 17 Years | 60 (36.6%) | 57 (34.8%) |
| 18 to 24 Years | 391 (80.1%) | 369 (81.3%) |
| 25 to 34 Years | 719 (81.1%) | 643 (79.6%) |
| 35 to 44 Years | 439 (72.3%) | 437 (76.4%) |
| 45 to 54 Years | 438 (88.5%) | 336 (66.3%) |
| 55 to 64 Years | 507 (87.6%) | 660 (81.6%) |
| 65 to 74 Years | 349 (79.9%) | 479 (78.0%) |
| 75 Years and over | 439 (93.8%) | 531 (83.4%) |
| Total | 4,377 (80.8%) | 4,524 (76.6%) |
Income Below Poverty Among Married-Couple Families in Ontario
The poverty statistics for married-couple families in Ontario show that 12.4% or 191 of the total 1,535 families live below the poverty line. Families with 1 or 2 children have the highest poverty rate of 16.7%, comprising of 73 families. On the other hand, families with 5 or more children have the lowest poverty rate of 9.8%, which includes 6 families.
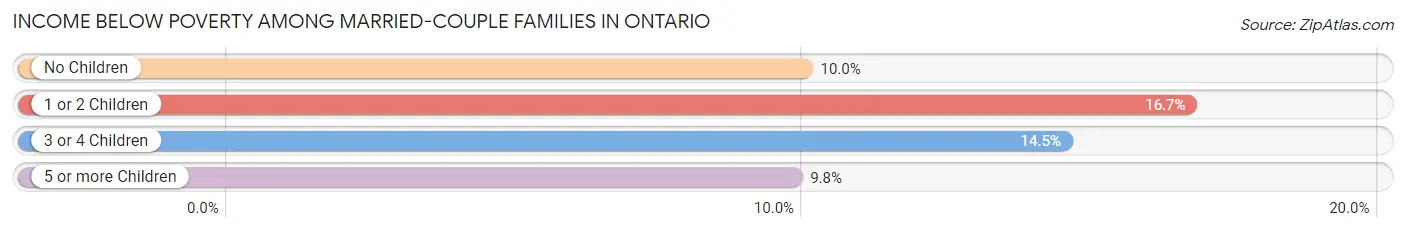
| Children | Above Poverty | Below Poverty |
| No Children | 772 (90.0%) | 86 (10.0%) |
| 1 or 2 Children | 364 (83.3%) | 73 (16.7%) |
| 3 or 4 Children | 153 (85.5%) | 26 (14.5%) |
| 5 or more Children | 55 (90.2%) | 6 (9.8%) |
| Total | 1,344 (87.6%) | 191 (12.4%) |
Income Below Poverty Among Single-Parent Households in Ontario
According to the poverty data in Ontario, 11.5% or 28 single-father households and 22.4% or 147 single-mother households are living below the poverty line. Among single-father households, those with 3 or 4 children have the highest poverty rate, with 14 households (46.7%) experiencing poverty. Likewise, among single-mother households, those with 3 or 4 children have the highest poverty rate, with 70 households (35.9%) falling below the poverty line.
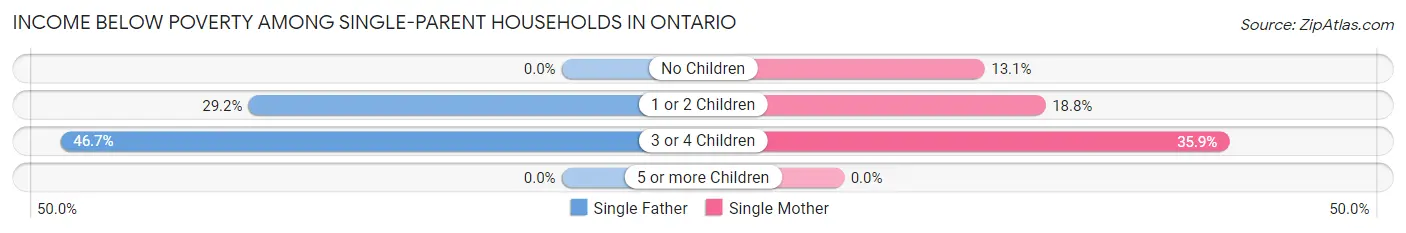
| Children | Single Father | Single Mother |
| No Children | 0 (0.0%) | 22 (13.1%) |
| 1 or 2 Children | 14 (29.2%) | 55 (18.8%) |
| 3 or 4 Children | 14 (46.7%) | 70 (35.9%) |
| 5 or more Children | 0 (0.0%) | 0 (0.0%) |
| Total | 28 (11.5%) | 147 (22.4%) |
Income Below Poverty Among Married-Couple vs Single-Parent Households in Ontario
The poverty data for Ontario shows that 191 of the married-couple family households (12.4%) and 175 of the single-parent households (19.4%) are living below the poverty level. Within the married-couple family households, those with 1 or 2 children have the highest poverty rate, with 73 households (16.7%) falling below the poverty line. Among the single-parent households, those with 3 or 4 children have the highest poverty rate, with 84 household (37.3%) living below poverty.
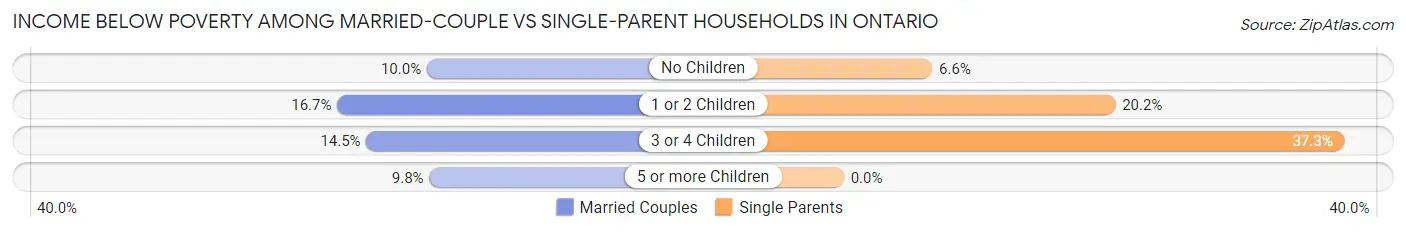
| Children | Married-Couple Families | Single-Parent Households |
| No Children | 86 (10.0%) | 22 (6.6%) |
| 1 or 2 Children | 73 (16.7%) | 69 (20.2%) |
| 3 or 4 Children | 26 (14.5%) | 84 (37.3%) |
| 5 or more Children | 6 (9.8%) | 0 (0.0%) |
| Total | 191 (12.4%) | 175 (19.4%) |
Race in Ontario
The most populous races in Ontario are White / Caucasian (8,567 | 73.8%), Hispanic or Latino (5,444 | 46.9%), and Two or more Races (1,922 | 16.6%).
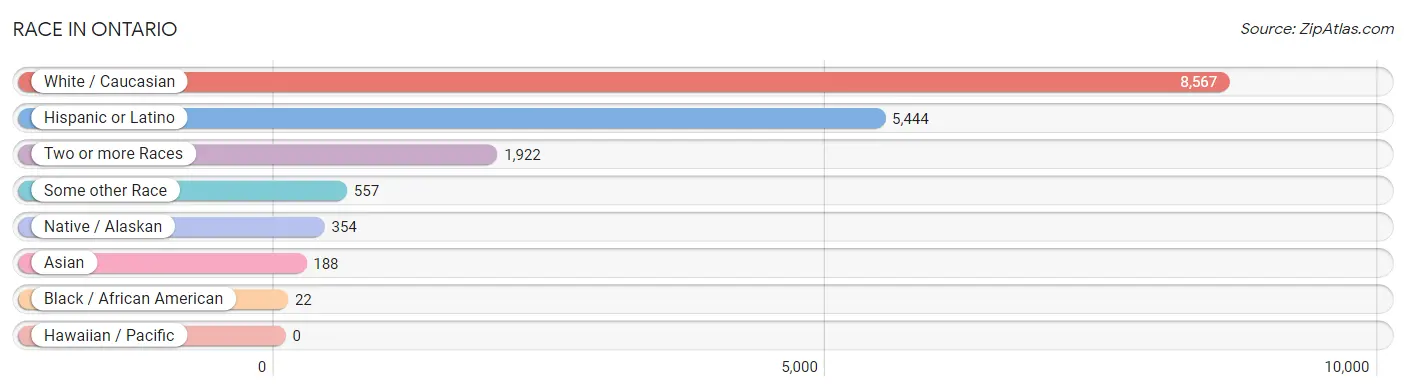
| Race | # Population | % Population |
| Asian | 188 | 1.6% |
| Black / African American | 22 | 0.2% |
| Hawaiian / Pacific | 0 | 0.0% |
| Hispanic or Latino | 5,444 | 46.9% |
| Native / Alaskan | 354 | 3.0% |
| White / Caucasian | 8,567 | 73.8% |
| Two or more Races | 1,922 | 16.6% |
| Some other Race | 557 | 4.8% |
| Total | 11,610 | 100.0% |
Ancestry in Ontario
The most populous ancestries reported in Ontario are Mexican (5,146 | 44.3%), German (1,167 | 10.1%), English (1,103 | 9.5%), Irish (626 | 5.4%), and American (338 | 2.9%), together accounting for 72.2% of all Ontario residents.
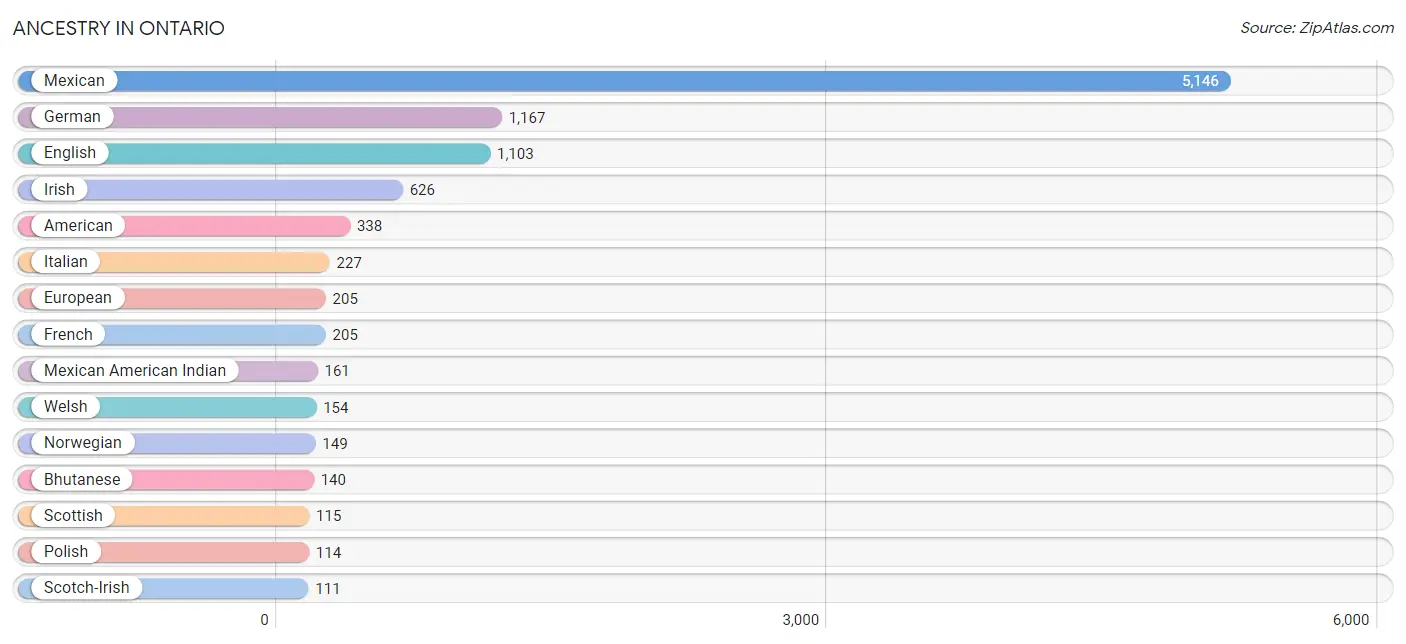
| Ancestry | # Population | % Population |
| American | 338 | 2.9% |
| Arab | 38 | 0.3% |
| Austrian | 9 | 0.1% |
| Belgian | 11 | 0.1% |
| Belizean | 15 | 0.1% |
| Bhutanese | 140 | 1.2% |
| Blackfeet | 22 | 0.2% |
| British | 39 | 0.3% |
| Central American | 1 | 0.0% |
| Cherokee | 71 | 0.6% |
| Chippewa | 33 | 0.3% |
| Croatian | 8 | 0.1% |
| Cuban | 8 | 0.1% |
| Czech | 9 | 0.1% |
| Czechoslovakian | 21 | 0.2% |
| Danish | 22 | 0.2% |
| Dutch | 102 | 0.9% |
| Eastern European | 48 | 0.4% |
| English | 1,103 | 9.5% |
| European | 205 | 1.8% |
| Filipino | 10 | 0.1% |
| French | 205 | 1.8% |
| French Canadian | 12 | 0.1% |
| German | 1,167 | 10.1% |
| Greek | 56 | 0.5% |
| Indian (Asian) | 6 | 0.1% |
| Irish | 626 | 5.4% |
| Italian | 227 | 2.0% |
| Korean | 56 | 0.5% |
| Lebanese | 9 | 0.1% |
| Mexican | 5,146 | 44.3% |
| Mexican American Indian | 161 | 1.4% |
| Native Hawaiian | 6 | 0.1% |
| Nigerian | 15 | 0.1% |
| Northern European | 18 | 0.2% |
| Norwegian | 149 | 1.3% |
| Pakistani | 8 | 0.1% |
| Palestinian | 8 | 0.1% |
| Polish | 114 | 1.0% |
| Portuguese | 15 | 0.1% |
| Romanian | 10 | 0.1% |
| Russian | 7 | 0.1% |
| Salvadoran | 1 | 0.0% |
| Scotch-Irish | 111 | 1.0% |
| Scottish | 115 | 1.0% |
| Slavic | 8 | 0.1% |
| Spaniard | 18 | 0.2% |
| Spanish | 40 | 0.3% |
| Sri Lankan | 1 | 0.0% |
| Subsaharan African | 15 | 0.1% |
| Swedish | 93 | 0.8% |
| Swiss | 8 | 0.1% |
| Thai | 44 | 0.4% |
| Welsh | 154 | 1.3% | View All 54 Rows |
Immigrants in Ontario
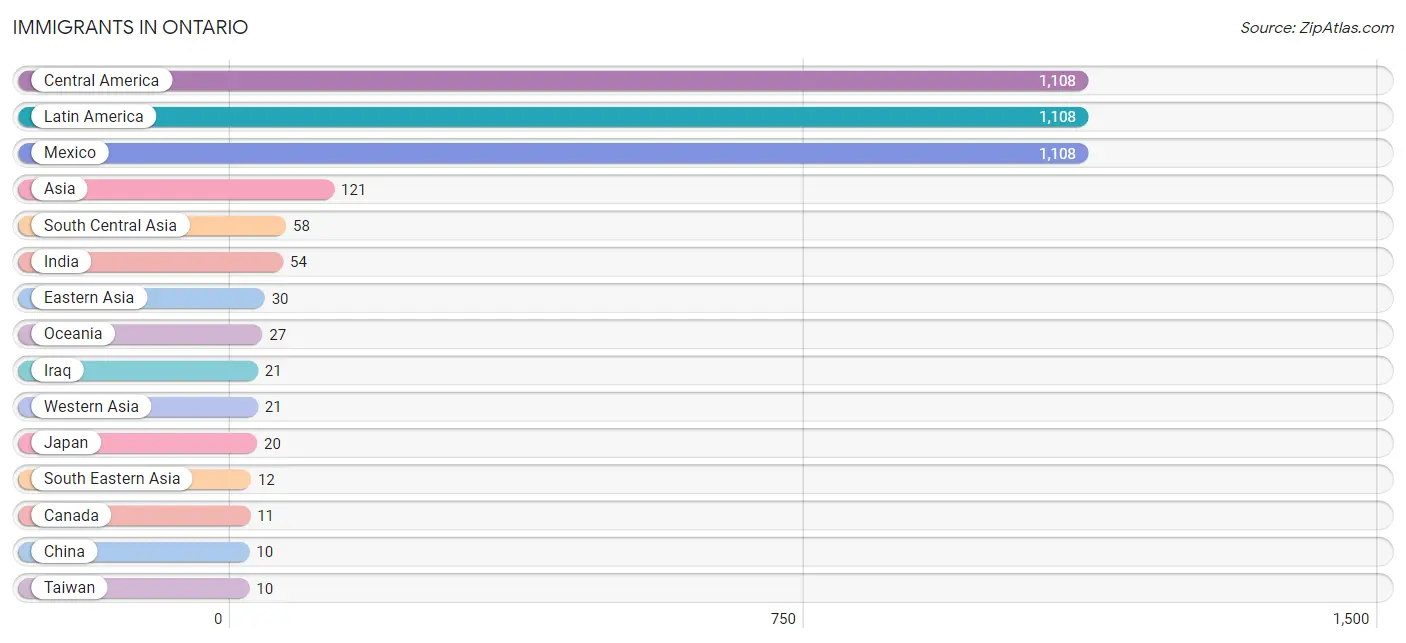
The most numerous immigrant groups reported in Ontario came from Central America (1,108 | 9.5%), Latin America (1,108 | 9.5%), Mexico (1,108 | 9.5%), Asia (121 | 1.0%), and South Central Asia (58 | 0.5%), together accounting for 30.2% of all Ontario residents.
| Immigration Origin | # Population | % Population |
| Asia | 121 | 1.0% |
| Canada | 11 | 0.1% |
| Central America | 1,108 | 9.5% |
| China | 10 | 0.1% |
| Eastern Asia | 30 | 0.3% |
| India | 54 | 0.5% |
| Iraq | 21 | 0.2% |
| Japan | 20 | 0.2% |
| Latin America | 1,108 | 9.5% |
| Mexico | 1,108 | 9.5% |
| Oceania | 27 | 0.2% |
| Philippines | 3 | 0.0% |
| South Central Asia | 58 | 0.5% |
| South Eastern Asia | 12 | 0.1% |
| Sri Lanka | 4 | 0.0% |
| Taiwan | 10 | 0.1% |
| Thailand | 8 | 0.1% |
| Vietnam | 1 | 0.0% |
| Western Asia | 21 | 0.2% | View All 19 Rows |
Sex and Age in Ontario
Sex and Age in Ontario
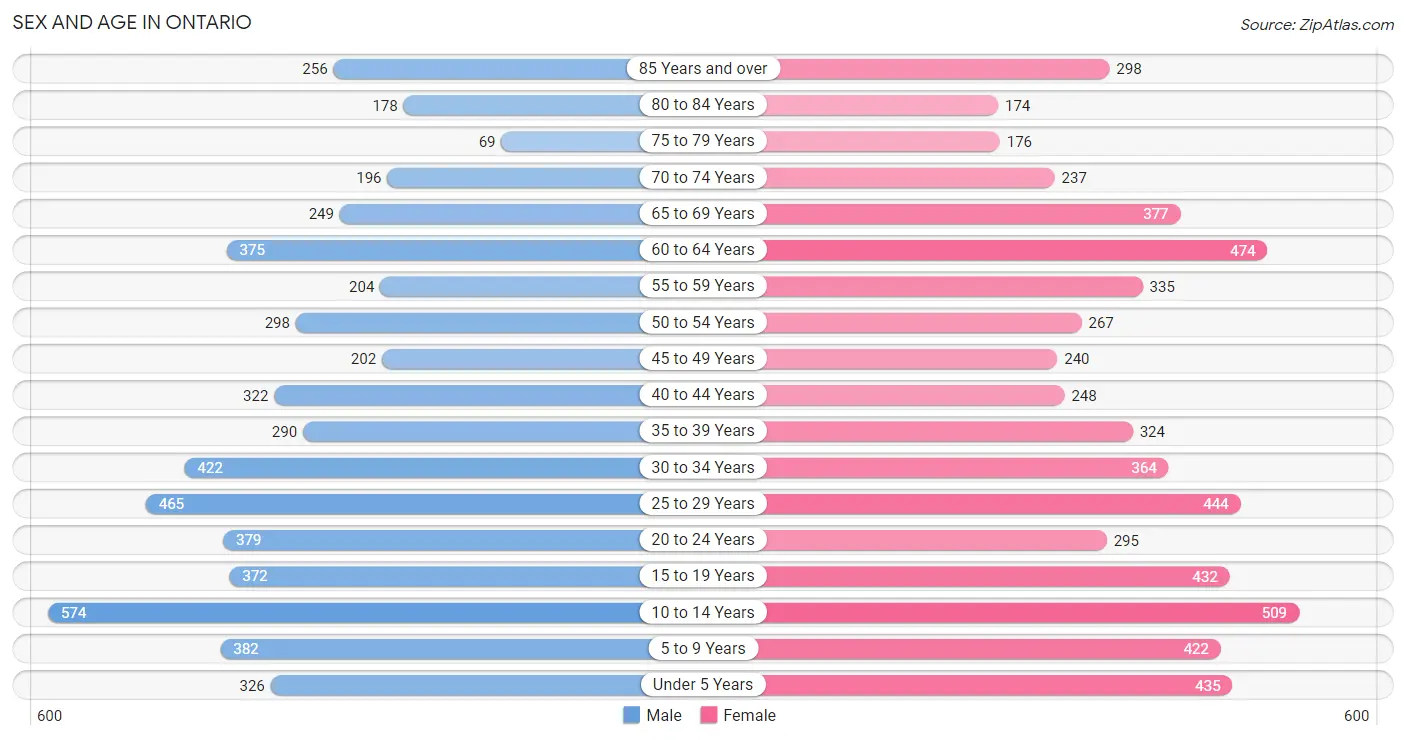
The most populous age groups in Ontario are 10 to 14 Years (574 | 10.3%) for men and 10 to 14 Years (509 | 8.4%) for women.
| Age Bracket | Male | Female |
| Under 5 Years | 326 (5.9%) | 435 (7.2%) |
| 5 to 9 Years | 382 (6.9%) | 422 (7.0%) |
| 10 to 14 Years | 574 (10.3%) | 509 (8.4%) |
| 15 to 19 Years | 372 (6.7%) | 432 (7.1%) |
| 20 to 24 Years | 379 (6.8%) | 295 (4.9%) |
| 25 to 29 Years | 465 (8.4%) | 444 (7.3%) |
| 30 to 34 Years | 422 (7.6%) | 364 (6.0%) |
| 35 to 39 Years | 290 (5.2%) | 324 (5.3%) |
| 40 to 44 Years | 322 (5.8%) | 248 (4.1%) |
| 45 to 49 Years | 202 (3.6%) | 240 (4.0%) |
| 50 to 54 Years | 298 (5.4%) | 267 (4.4%) |
| 55 to 59 Years | 204 (3.7%) | 335 (5.5%) |
| 60 to 64 Years | 375 (6.8%) | 474 (7.8%) |
| 65 to 69 Years | 249 (4.5%) | 377 (6.2%) |
| 70 to 74 Years | 196 (3.5%) | 237 (3.9%) |
| 75 to 79 Years | 69 (1.2%) | 176 (2.9%) |
| 80 to 84 Years | 178 (3.2%) | 174 (2.9%) |
| 85 Years and over | 256 (4.6%) | 298 (4.9%) |
| Total | 5,559 (100.0%) | 6,051 (100.0%) |
Families and Households in Ontario
Median Family Size in Ontario
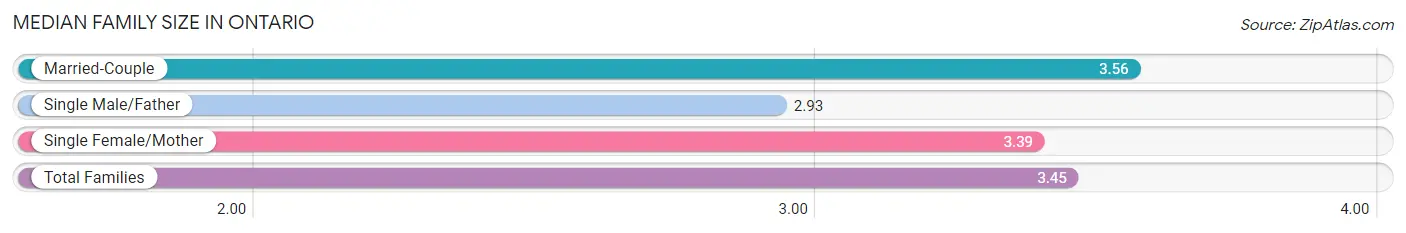
The median family size in Ontario is 3.45 persons per family, with married-couple families (1,535 | 63.0%) accounting for the largest median family size of 3.56 persons per family. On the other hand, single male/father families (244 | 10.0%) represent the smallest median family size with 2.93 persons per family.
| Family Type | # Families | Family Size |
| Married-Couple | 1,535 (63.0%) | 3.56 |
| Single Male/Father | 244 (10.0%) | 2.93 |
| Single Female/Mother | 656 (26.9%) | 3.39 |
| Total Families | 2,435 (100.0%) | 3.45 |
Median Household Size in Ontario
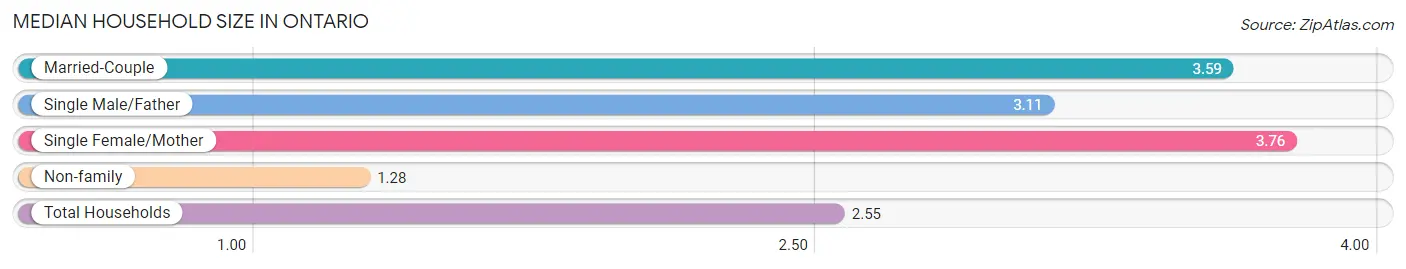
The median household size in Ontario is 2.55 persons per household, with single female/mother households (656 | 14.9%) accounting for the largest median household size of 3.76 persons per household. non-family households (1,981 | 44.9%) represent the smallest median household size with 1.28 persons per household.
| Household Type | # Households | Household Size |
| Married-Couple | 1,535 (34.8%) | 3.59 |
| Single Male/Father | 244 (5.5%) | 3.11 |
| Single Female/Mother | 656 (14.9%) | 3.76 |
| Non-family | 1,981 (44.9%) | 1.28 |
| Total Households | 4,416 (100.0%) | 2.55 |
Household Size by Marriage Status in Ontario
Out of a total of 4,416 households in Ontario, 2,435 (55.1%) are family households, while 1,981 (44.9%) are nonfamily households. The most numerous type of family households are 2-person households, comprising 1,039, and the most common type of nonfamily households are 1-person households, comprising 1,649.
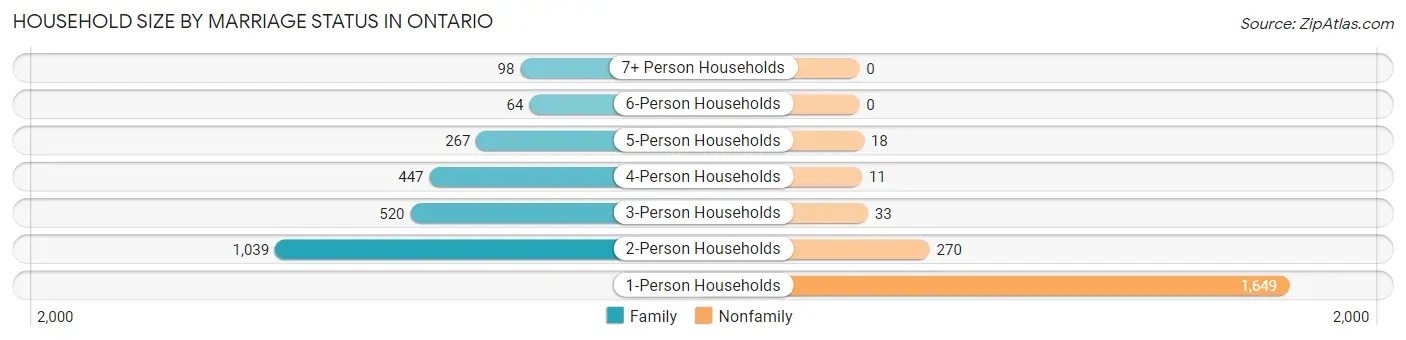
| Household Size | Family Households | Nonfamily Households |
| 1-Person Households | - | 1,649 (37.3%) |
| 2-Person Households | 1,039 (23.5%) | 270 (6.1%) |
| 3-Person Households | 520 (11.8%) | 33 (0.7%) |
| 4-Person Households | 447 (10.1%) | 11 (0.3%) |
| 5-Person Households | 267 (6.0%) | 18 (0.4%) |
| 6-Person Households | 64 (1.5%) | 0 (0.0%) |
| 7+ Person Households | 98 (2.2%) | 0 (0.0%) |
| Total | 2,435 (55.1%) | 1,981 (44.9%) |
Female Fertility in Ontario
Fertility by Age in Ontario
Average fertility rate in Ontario is 82.0 births per 1,000 women. Women in the age bracket of 20 to 34 years have the highest fertility rate with 171.0 births per 1,000 women. Women in the age bracket of 20 to 34 years acount for 95.9% of all women with births.
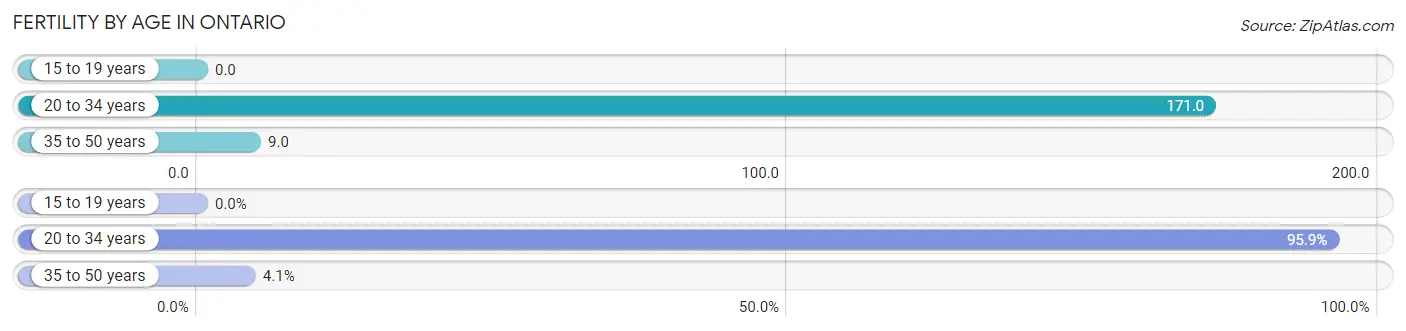
| Age Bracket | Women with Births | Births / 1,000 Women |
| 15 to 19 years | 0 (0.0%) | 0.0 |
| 20 to 34 years | 189 (95.9%) | 171.0 |
| 35 to 50 years | 8 (4.1%) | 9.0 |
| Total | 197 (100.0%) | 82.0 |
Fertility by Age by Marriage Status in Ontario
95.9% of women with births (197) in Ontario are married. The highest percentage of unmarried women with births falls into 35 to 50 years age bracket with 100.0% of them unmarried at the time of birth, while the lowest percentage of unmarried women with births belong to 20 to 34 years age bracket with 0.0% of them unmarried.
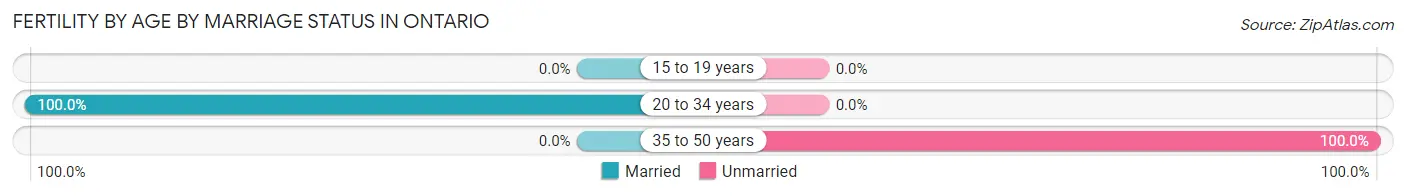
| Age Bracket | Married | Unmarried |
| 15 to 19 years | 0 (0.0%) | 0 (0.0%) |
| 20 to 34 years | 189 (100.0%) | 0 (0.0%) |
| 35 to 50 years | 0 (0.0%) | 8 (100.0%) |
| Total | 189 (95.9%) | 8 (4.1%) |
Fertility by Education in Ontario
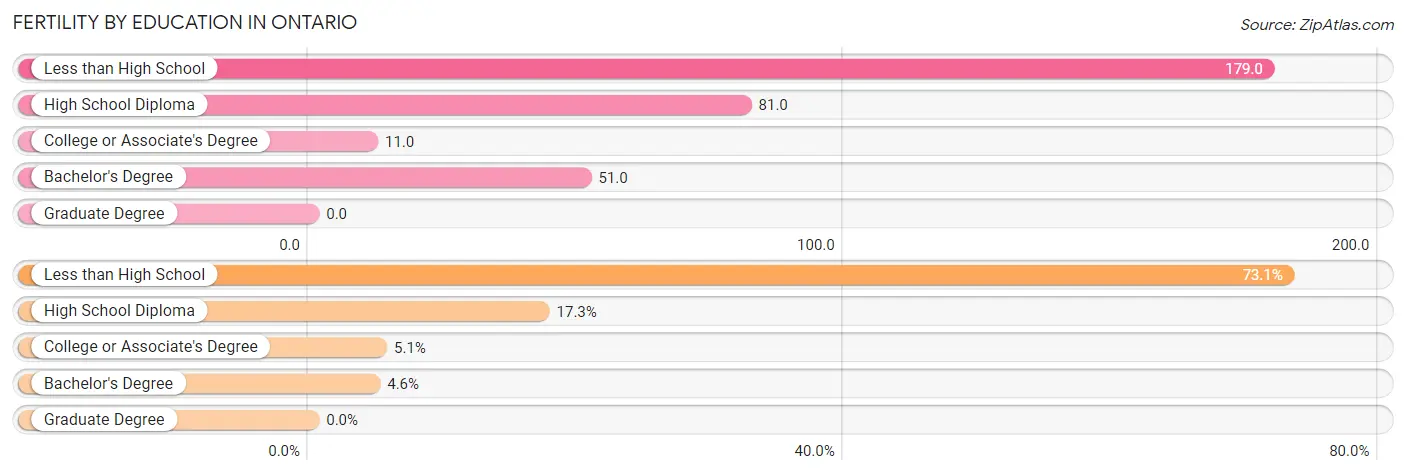
| Educational Attainment | Women with Births | Births / 1,000 Women |
| Less than High School | 144 (73.1%) | 179.0 |
| High School Diploma | 34 (17.3%) | 81.0 |
| College or Associate's Degree | 10 (5.1%) | 11.0 |
| Bachelor's Degree | 9 (4.6%) | 51.0 |
| Graduate Degree | 0 (0.0%) | 0.0 |
| Total | 197 (100.0%) | 82.0 |
Fertility by Education by Marriage Status in Ontario
4.1% of women with births in Ontario are unmarried. Women with the educational attainment of high school diploma are most likely to be married with 100.0% of them married at childbirth, while women with the educational attainment of less than high school are least likely to be married with 5.6% of them unmarried at childbirth.
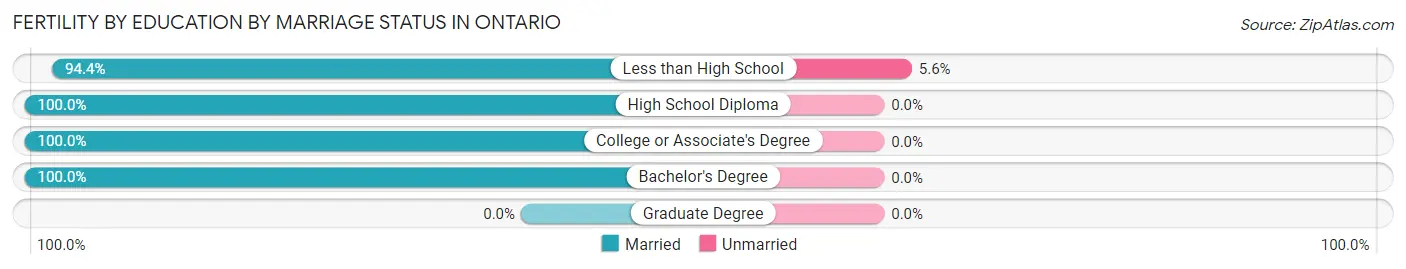
| Educational Attainment | Married | Unmarried |
| Less than High School | 136 (94.4%) | 8 (5.6%) |
| High School Diploma | 34 (100.0%) | 0 (0.0%) |
| College or Associate's Degree | 10 (100.0%) | 0 (0.0%) |
| Bachelor's Degree | 9 (100.0%) | 0 (0.0%) |
| Graduate Degree | 0 (0.0%) | 0 (0.0%) |
| Total | 189 (95.9%) | 8 (4.1%) |
Employment Characteristics in Ontario
Employment by Class of Employer in Ontario
Among the 4,609 employed individuals in Ontario, private company employees (3,396 | 73.7%), not-for-profit organizations (307 | 6.7%), and local government employees (302 | 6.6%) make up the most common classes of employment.
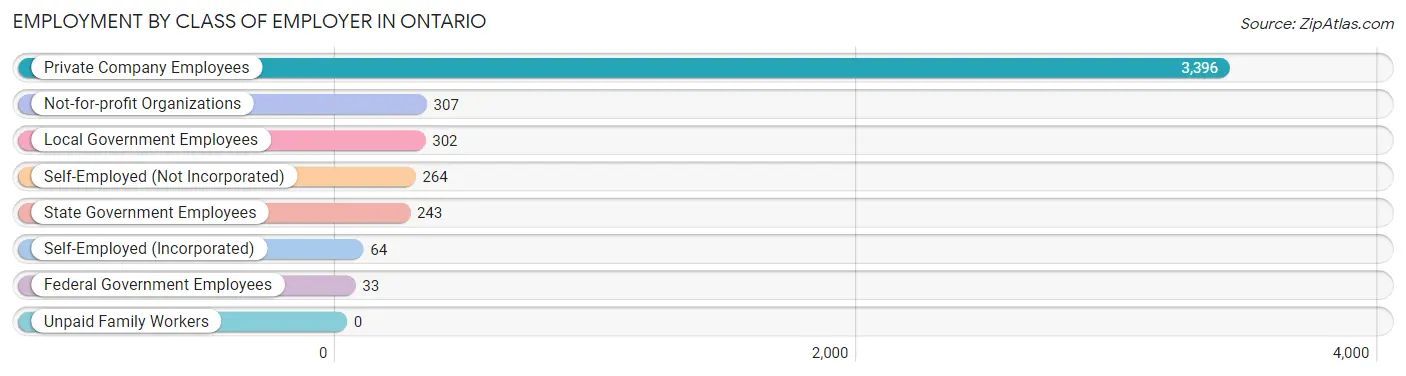
| Employer Class | # Employees | % Employees |
| Private Company Employees | 3,396 | 73.7% |
| Self-Employed (Incorporated) | 64 | 1.4% |
| Self-Employed (Not Incorporated) | 264 | 5.7% |
| Not-for-profit Organizations | 307 | 6.7% |
| Local Government Employees | 302 | 6.6% |
| State Government Employees | 243 | 5.3% |
| Federal Government Employees | 33 | 0.7% |
| Unpaid Family Workers | 0 | 0.0% |
| Total | 4,609 | 100.0% |
Employment Status by Age in Ontario
According to the labor force statistics for Ontario, out of the total population over 16 years of age (8,886), 56.3% or 5,003 individuals are in the labor force, with 7.0% or 350 of them unemployed. The age group with the highest labor force participation rate is 25 to 29 years, with 87.8% or 798 individuals in the labor force. Within the labor force, the 16 to 19 years age range has the highest percentage of unemployed individuals, with 38.1% or 179 of them being unemployed.
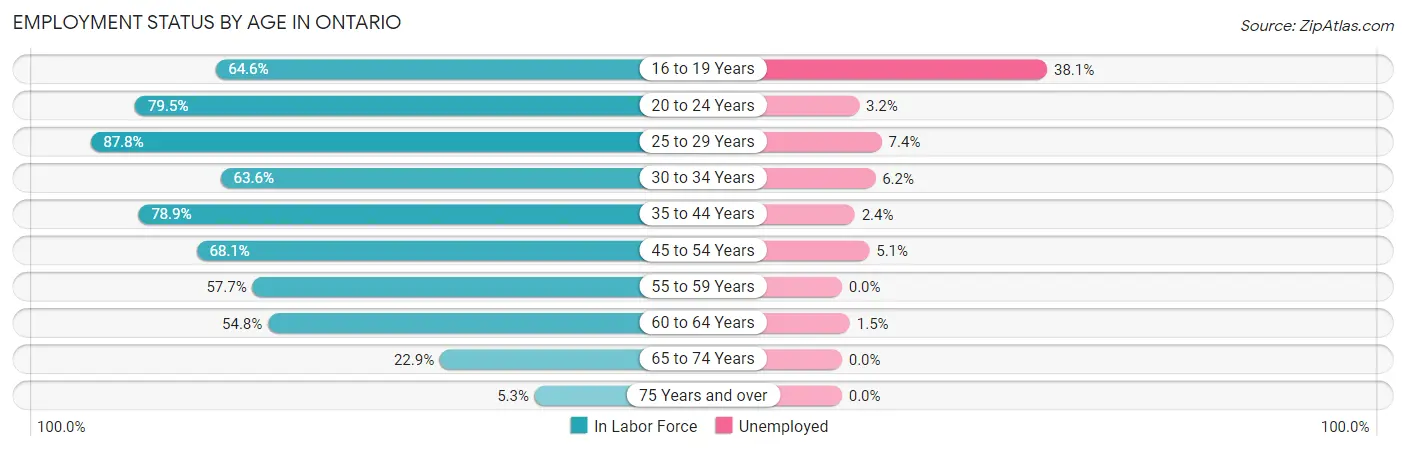
| Age Bracket | In Labor Force | Unemployed |
| 16 to 19 Years | 470 (64.6%) | 179 (38.1%) |
| 20 to 24 Years | 536 (79.5%) | 17 (3.2%) |
| 25 to 29 Years | 798 (87.8%) | 59 (7.4%) |
| 30 to 34 Years | 500 (63.6%) | 31 (6.2%) |
| 35 to 44 Years | 934 (78.9%) | 22 (2.4%) |
| 45 to 54 Years | 686 (68.1%) | 35 (5.1%) |
| 55 to 59 Years | 311 (57.7%) | 0 (0.0%) |
| 60 to 64 Years | 465 (54.8%) | 7 (1.5%) |
| 65 to 74 Years | 243 (22.9%) | 0 (0.0%) |
| 75 Years and over | 61 (5.3%) | 0 (0.0%) |
| Total | 5,003 (56.3%) | 350 (7.0%) |
Employment Status by Educational Attainment in Ontario
According to labor force statistics for Ontario, 70.0% of individuals (3,692) out of the total population between 25 and 64 years of age (5,274) are in the labor force, with 4.2% or 155 of them being unemployed. The group with the highest labor force participation rate are those with the educational attainment of bachelor's degree or higher, with 79.5% or 587 individuals in the labor force. Within the labor force, individuals with bachelor's degree or higher education have the highest percentage of unemployment, with 6.3% or 37 of them being unemployed.
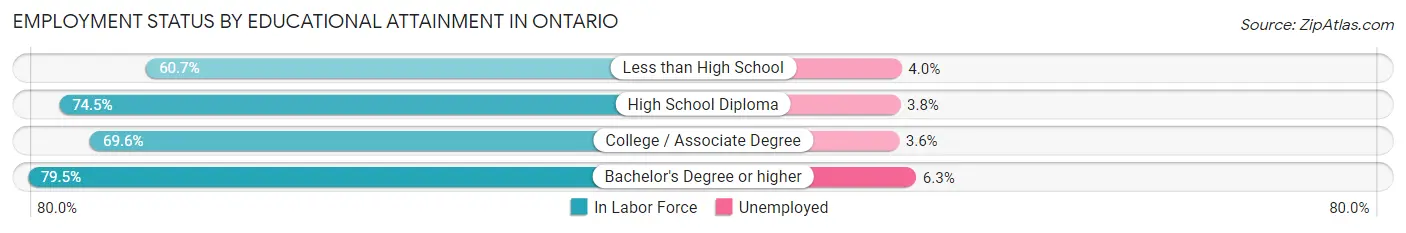
| Educational Attainment | In Labor Force | Unemployed |
| Less than High School | 776 (60.7%) | 51 (4.0%) |
| High School Diploma | 960 (74.5%) | 49 (3.8%) |
| College / Associate Degree | 1,370 (69.6%) | 71 (3.6%) |
| Bachelor's Degree or higher | 587 (79.5%) | 46 (6.3%) |
| Total | 3,692 (70.0%) | 222 (4.2%) |
Employment Occupations by Sex in Ontario
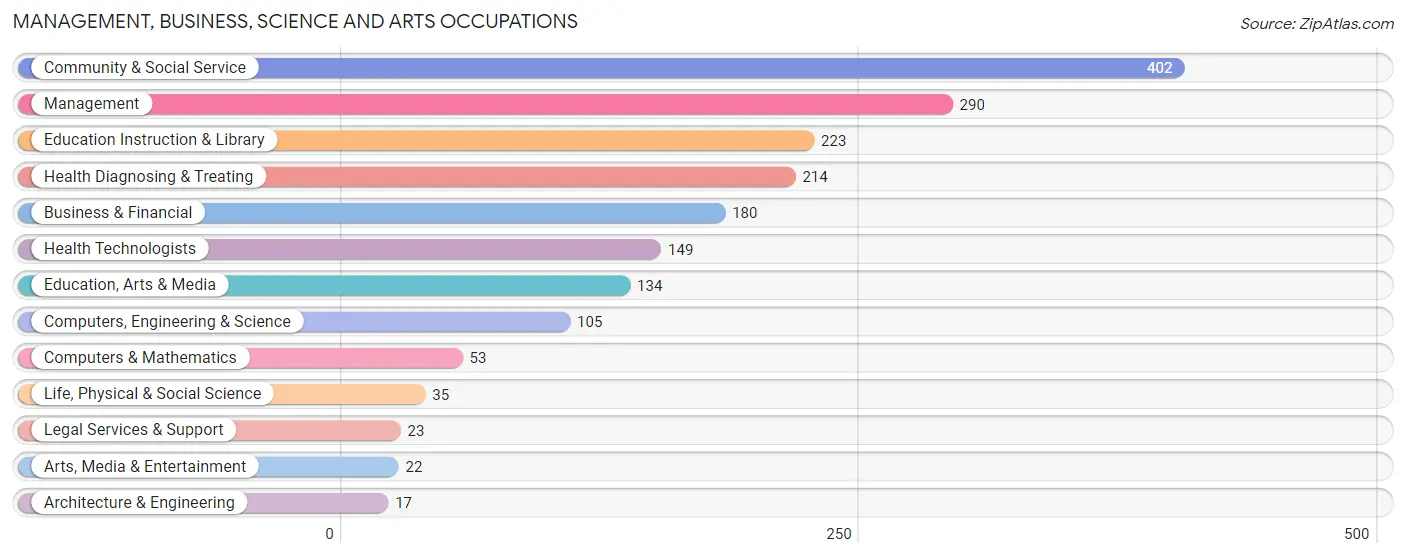
Management, Business, Science and Arts Occupations
The most common Management, Business, Science and Arts occupations in Ontario are Community & Social Service (402 | 8.7%), Management (290 | 6.3%), Education Instruction & Library (223 | 4.8%), Health Diagnosing & Treating (214 | 4.6%), and Business & Financial (180 | 3.9%).
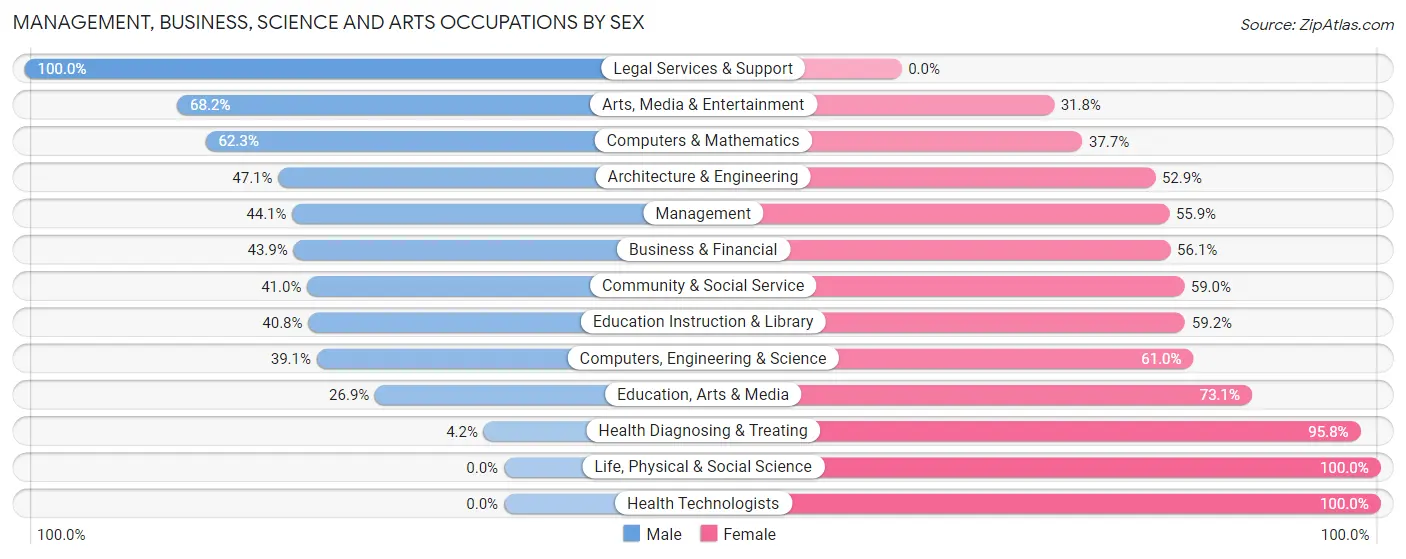
Management, Business, Science and Arts Occupations by Sex
Within the Management, Business, Science and Arts occupations in Ontario, the most male-oriented occupations are Legal Services & Support (100.0%), Arts, Media & Entertainment (68.2%), and Computers & Mathematics (62.3%), while the most female-oriented occupations are Life, Physical & Social Science (100.0%), Health Technologists (100.0%), and Health Diagnosing & Treating (95.8%).
| Occupation | Male | Female |
| Management | 128 (44.1%) | 162 (55.9%) |
| Business & Financial | 79 (43.9%) | 101 (56.1%) |
| Computers, Engineering & Science | 41 (39.1%) | 64 (61.0%) |
| Computers & Mathematics | 33 (62.3%) | 20 (37.7%) |
| Architecture & Engineering | 8 (47.1%) | 9 (52.9%) |
| Life, Physical & Social Science | 0 (0.0%) | 35 (100.0%) |
| Community & Social Service | 165 (41.0%) | 237 (59.0%) |
| Education, Arts & Media | 36 (26.9%) | 98 (73.1%) |
| Legal Services & Support | 23 (100.0%) | 0 (0.0%) |
| Education Instruction & Library | 91 (40.8%) | 132 (59.2%) |
| Arts, Media & Entertainment | 15 (68.2%) | 7 (31.8%) |
| Health Diagnosing & Treating | 9 (4.2%) | 205 (95.8%) |
| Health Technologists | 0 (0.0%) | 149 (100.0%) |
| Total (Category) | 422 (35.4%) | 769 (64.6%) |
| Total (Overall) | 2,389 (51.5%) | 2,247 (48.5%) |
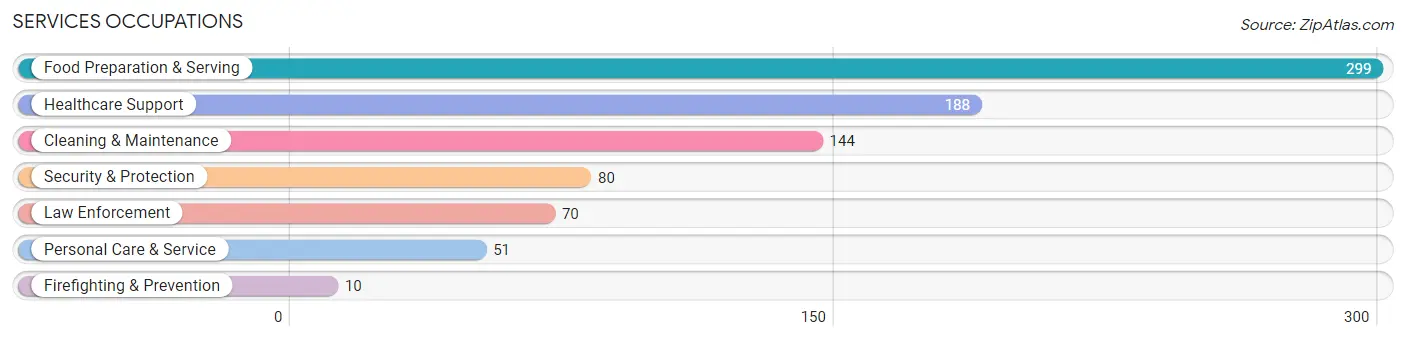
Services Occupations
The most common Services occupations in Ontario are Food Preparation & Serving (299 | 6.5%), Healthcare Support (188 | 4.1%), Cleaning & Maintenance (144 | 3.1%), Security & Protection (80 | 1.7%), and Law Enforcement (70 | 1.5%).
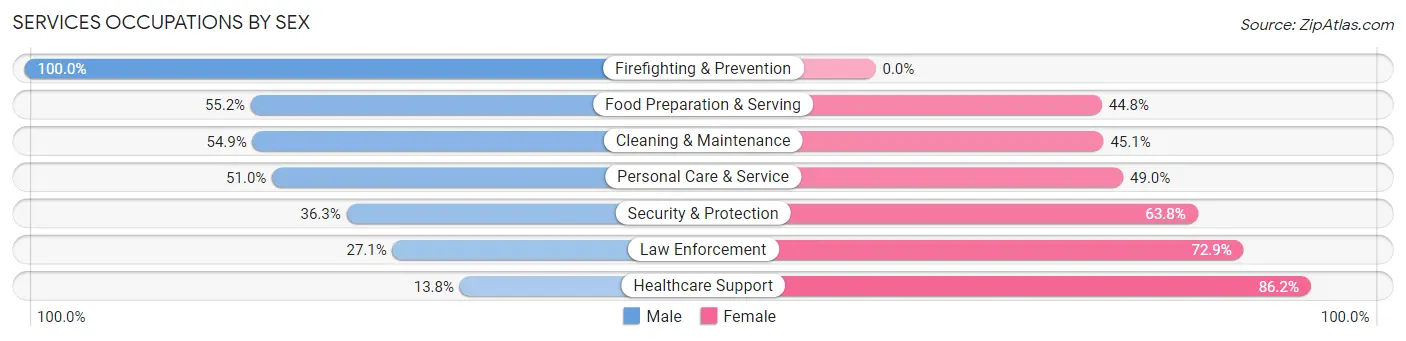
Services Occupations by Sex
Within the Services occupations in Ontario, the most male-oriented occupations are Firefighting & Prevention (100.0%), Food Preparation & Serving (55.2%), and Cleaning & Maintenance (54.9%), while the most female-oriented occupations are Healthcare Support (86.2%), Law Enforcement (72.9%), and Security & Protection (63.7%).
| Occupation | Male | Female |
| Healthcare Support | 26 (13.8%) | 162 (86.2%) |
| Security & Protection | 29 (36.2%) | 51 (63.7%) |
| Firefighting & Prevention | 10 (100.0%) | 0 (0.0%) |
| Law Enforcement | 19 (27.1%) | 51 (72.9%) |
| Food Preparation & Serving | 165 (55.2%) | 134 (44.8%) |
| Cleaning & Maintenance | 79 (54.9%) | 65 (45.1%) |
| Personal Care & Service | 26 (51.0%) | 25 (49.0%) |
| Total (Category) | 325 (42.6%) | 437 (57.4%) |
| Total (Overall) | 2,389 (51.5%) | 2,247 (48.5%) |
Sales and Office Occupations
The most common Sales and Office occupations in Ontario are Sales & Related (447 | 9.6%), and Office & Administration (241 | 5.2%).

Sales and Office Occupations by Sex

| Occupation | Male | Female |
| Sales & Related | 161 (36.0%) | 286 (64.0%) |
| Office & Administration | 33 (13.7%) | 208 (86.3%) |
| Total (Category) | 194 (28.2%) | 494 (71.8%) |
| Total (Overall) | 2,389 (51.5%) | 2,247 (48.5%) |
Natural Resources, Construction and Maintenance Occupations
The most common Natural Resources, Construction and Maintenance occupations in Ontario are Farming, Fishing & Forestry (336 | 7.2%), Installation, Maintenance & Repair (212 | 4.6%), and Construction & Extraction (200 | 4.3%).
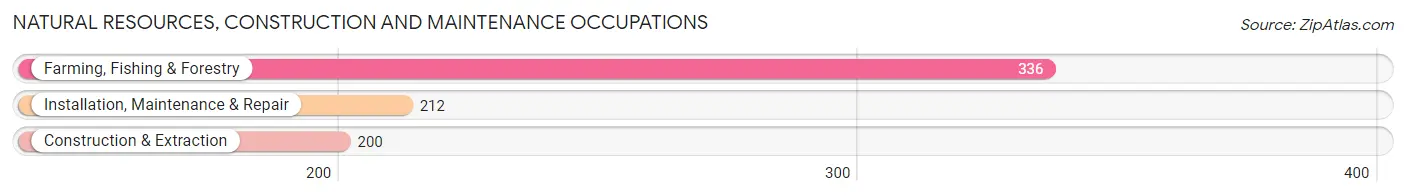
Natural Resources, Construction and Maintenance Occupations by Sex
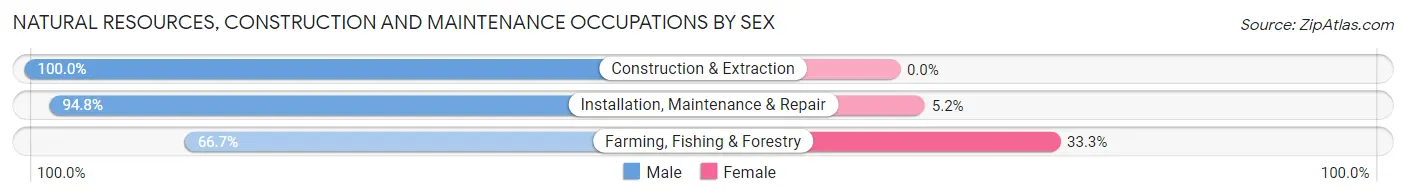
| Occupation | Male | Female |
| Farming, Fishing & Forestry | 224 (66.7%) | 112 (33.3%) |
| Construction & Extraction | 200 (100.0%) | 0 (0.0%) |
| Installation, Maintenance & Repair | 201 (94.8%) | 11 (5.2%) |
| Total (Category) | 625 (83.6%) | 123 (16.4%) |
| Total (Overall) | 2,389 (51.5%) | 2,247 (48.5%) |
Production, Transportation and Moving Occupations
The most common Production, Transportation and Moving occupations in Ontario are Production (899 | 19.4%), Material Moving (299 | 6.5%), and Transportation (49 | 1.1%).
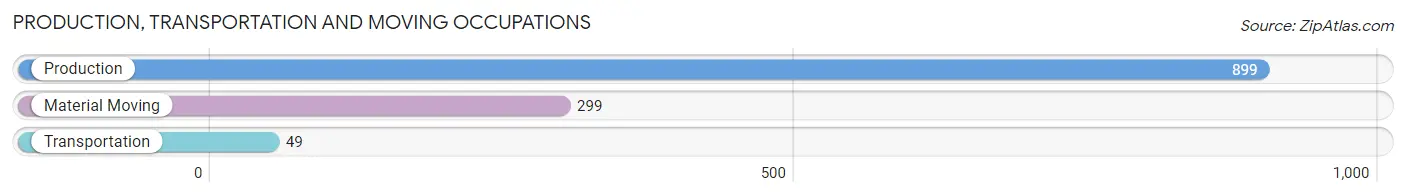
Production, Transportation and Moving Occupations by Sex
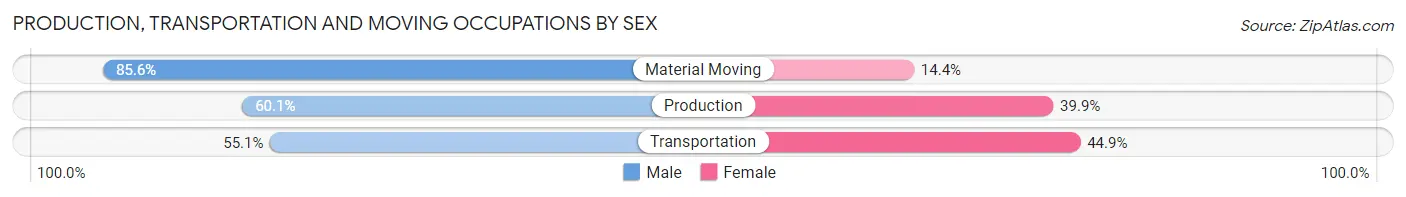
| Occupation | Male | Female |
| Production | 540 (60.1%) | 359 (39.9%) |
| Transportation | 27 (55.1%) | 22 (44.9%) |
| Material Moving | 256 (85.6%) | 43 (14.4%) |
| Total (Category) | 823 (66.0%) | 424 (34.0%) |
| Total (Overall) | 2,389 (51.5%) | 2,247 (48.5%) |
Employment Industries by Sex in Ontario
Employment Industries in Ontario
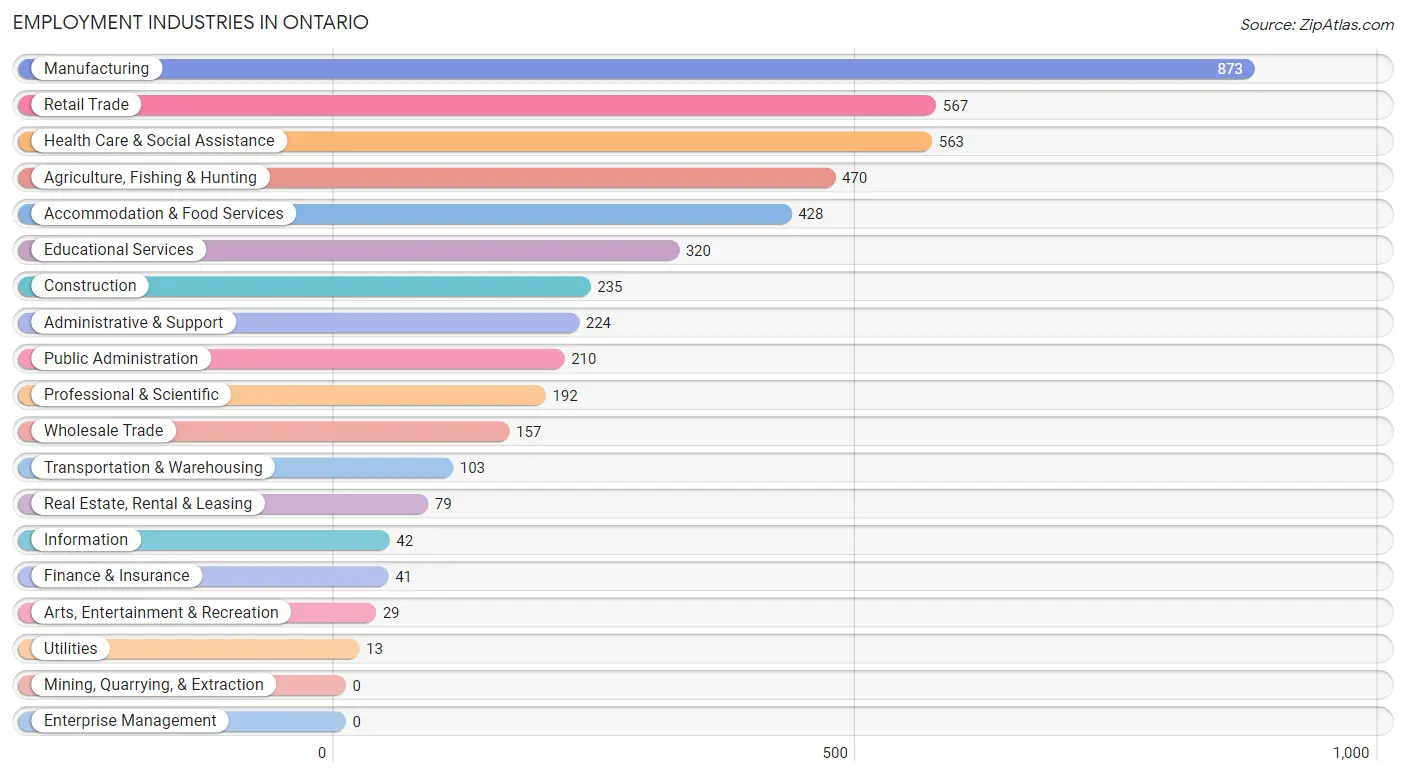
The major employment industries in Ontario include Manufacturing (873 | 18.8%), Retail Trade (567 | 12.2%), Health Care & Social Assistance (563 | 12.1%), Agriculture, Fishing & Hunting (470 | 10.1%), and Accommodation & Food Services (428 | 9.2%).
Employment Industries by Sex in Ontario
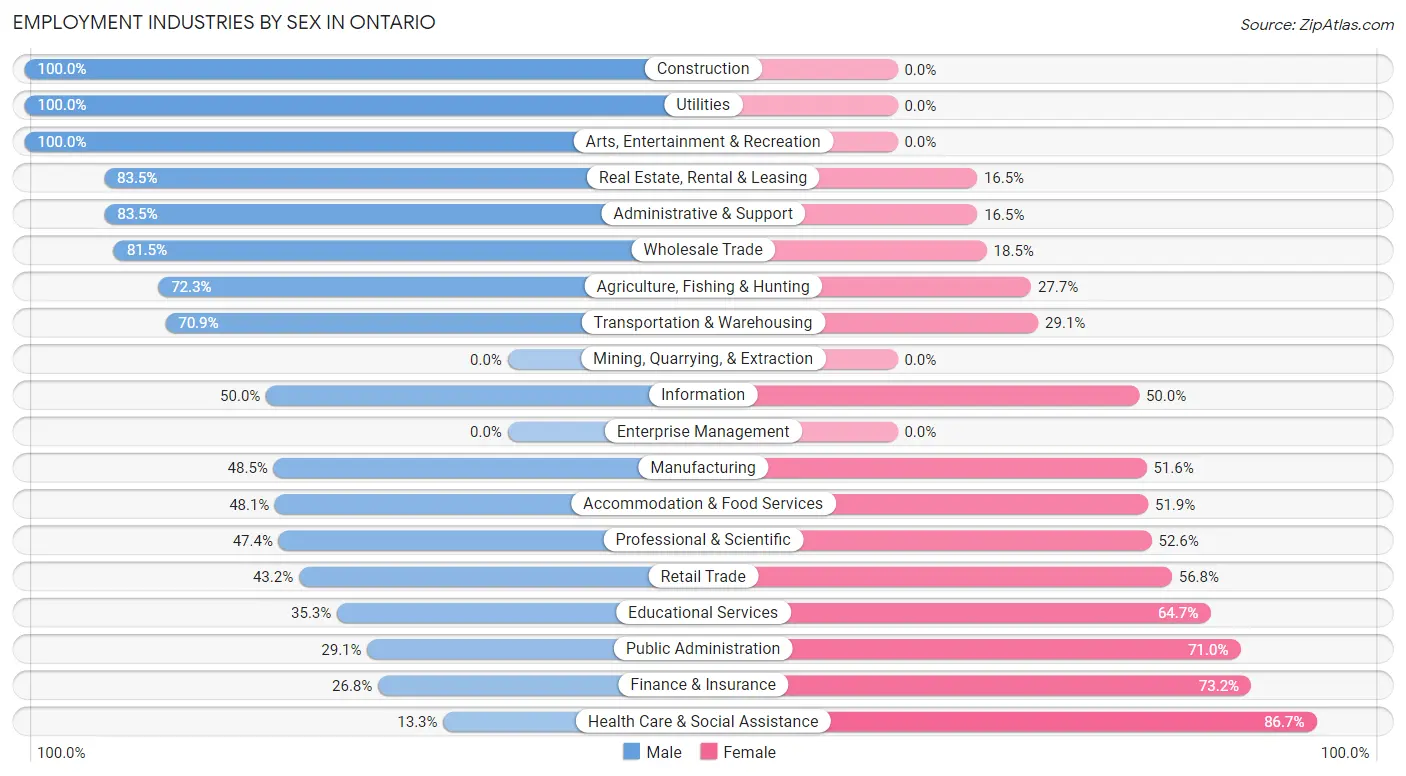
The Ontario industries that see more men than women are Construction (100.0%), Utilities (100.0%), and Arts, Entertainment & Recreation (100.0%), whereas the industries that tend to have a higher number of women are Health Care & Social Assistance (86.7%), Finance & Insurance (73.2%), and Public Administration (71.0%).
| Industry | Male | Female |
| Agriculture, Fishing & Hunting | 340 (72.3%) | 130 (27.7%) |
| Mining, Quarrying, & Extraction | 0 (0.0%) | 0 (0.0%) |
| Construction | 235 (100.0%) | 0 (0.0%) |
| Manufacturing | 423 (48.4%) | 450 (51.5%) |
| Wholesale Trade | 128 (81.5%) | 29 (18.5%) |
| Retail Trade | 245 (43.2%) | 322 (56.8%) |
| Transportation & Warehousing | 73 (70.9%) | 30 (29.1%) |
| Utilities | 13 (100.0%) | 0 (0.0%) |
| Information | 21 (50.0%) | 21 (50.0%) |
| Finance & Insurance | 11 (26.8%) | 30 (73.2%) |
| Real Estate, Rental & Leasing | 66 (83.5%) | 13 (16.5%) |
| Professional & Scientific | 91 (47.4%) | 101 (52.6%) |
| Enterprise Management | 0 (0.0%) | 0 (0.0%) |
| Administrative & Support | 187 (83.5%) | 37 (16.5%) |
| Educational Services | 113 (35.3%) | 207 (64.7%) |
| Health Care & Social Assistance | 75 (13.3%) | 488 (86.7%) |
| Arts, Entertainment & Recreation | 29 (100.0%) | 0 (0.0%) |
| Accommodation & Food Services | 206 (48.1%) | 222 (51.9%) |
| Public Administration | 61 (29.0%) | 149 (71.0%) |
| Total | 2,389 (51.5%) | 2,247 (48.5%) |
Education in Ontario
School Enrollment in Ontario
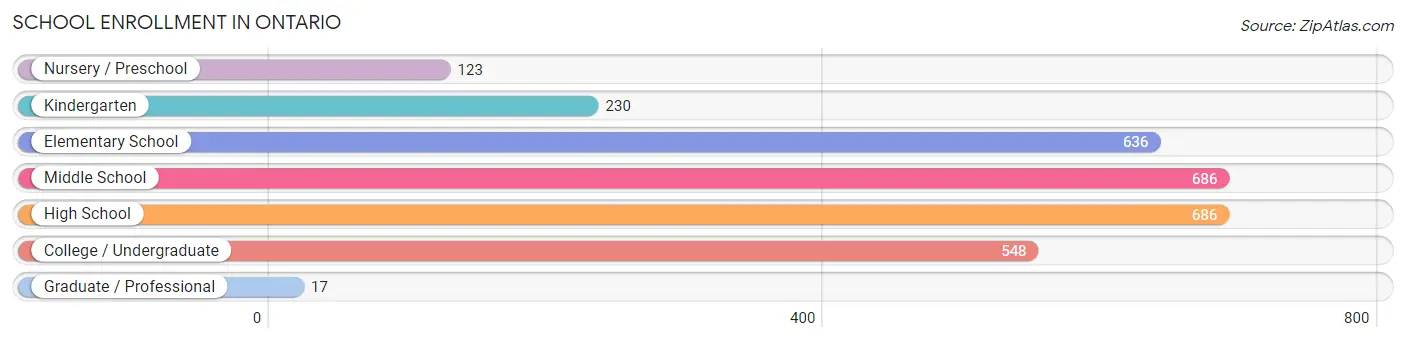
The most common levels of schooling among the 2,926 students in Ontario are middle school (686 | 23.4%), high school (686 | 23.4%), and elementary school (636 | 21.7%).
| School Level | # Students | % Students |
| Nursery / Preschool | 123 | 4.2% |
| Kindergarten | 230 | 7.9% |
| Elementary School | 636 | 21.7% |
| Middle School | 686 | 23.4% |
| High School | 686 | 23.4% |
| College / Undergraduate | 548 | 18.7% |
| Graduate / Professional | 17 | 0.6% |
| Total | 2,926 | 100.0% |
School Enrollment by Age by Funding Source in Ontario
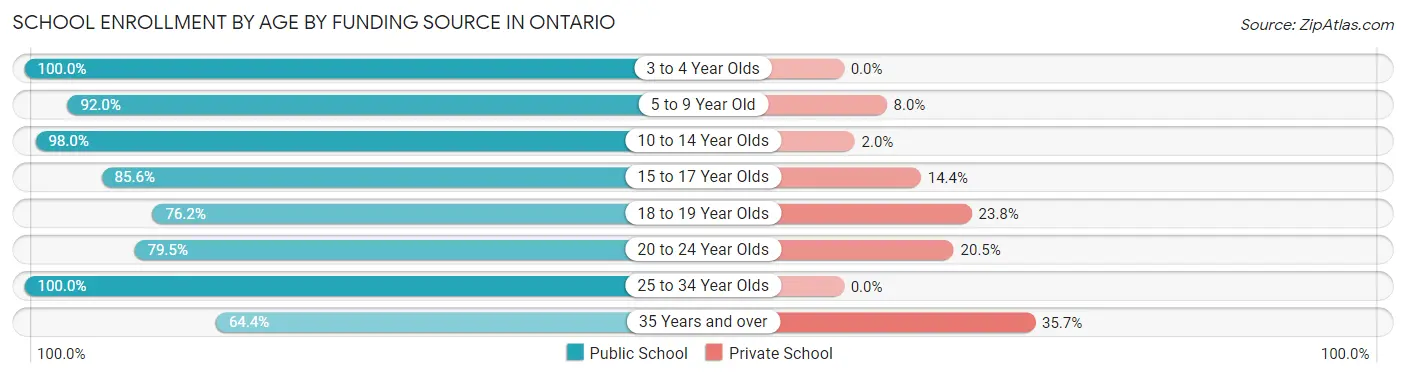
Out of a total of 2,926 students who are enrolled in schools in Ontario, 243 (8.3%) attend a private institution, while the remaining 2,683 (91.7%) are enrolled in public schools. The age group of 35 years and over has the highest likelihood of being enrolled in private schools, with 41 (35.6% in the age bracket) enrolled. Conversely, the age group of 3 to 4 year olds has the lowest likelihood of being enrolled in a private school, with 123 (100.0% in the age bracket) attending a public institution.
| Age Bracket | Public School | Private School |
| 3 to 4 Year Olds | 123 (100.0%) | 0 (0.0%) |
| 5 to 9 Year Old | 679 (92.0%) | 59 (8.0%) |
| 10 to 14 Year Olds | 1,061 (98.0%) | 22 (2.0%) |
| 15 to 17 Year Olds | 346 (85.6%) | 58 (14.4%) |
| 18 to 19 Year Olds | 147 (76.2%) | 46 (23.8%) |
| 20 to 24 Year Olds | 66 (79.5%) | 17 (20.5%) |
| 25 to 34 Year Olds | 187 (100.0%) | 0 (0.0%) |
| 35 Years and over | 74 (64.3%) | 41 (35.6%) |
| Total | 2,683 (91.7%) | 243 (8.3%) |
Educational Attainment by Field of Study in Ontario
Education (288 | 22.6%), business (252 | 19.8%), arts & humanities (172 | 13.5%), bio, nature & agricultural (104 | 8.2%), and social sciences (99 | 7.8%) are the most common fields of study among 1,274 individuals in Ontario who have obtained a bachelor's degree or higher.
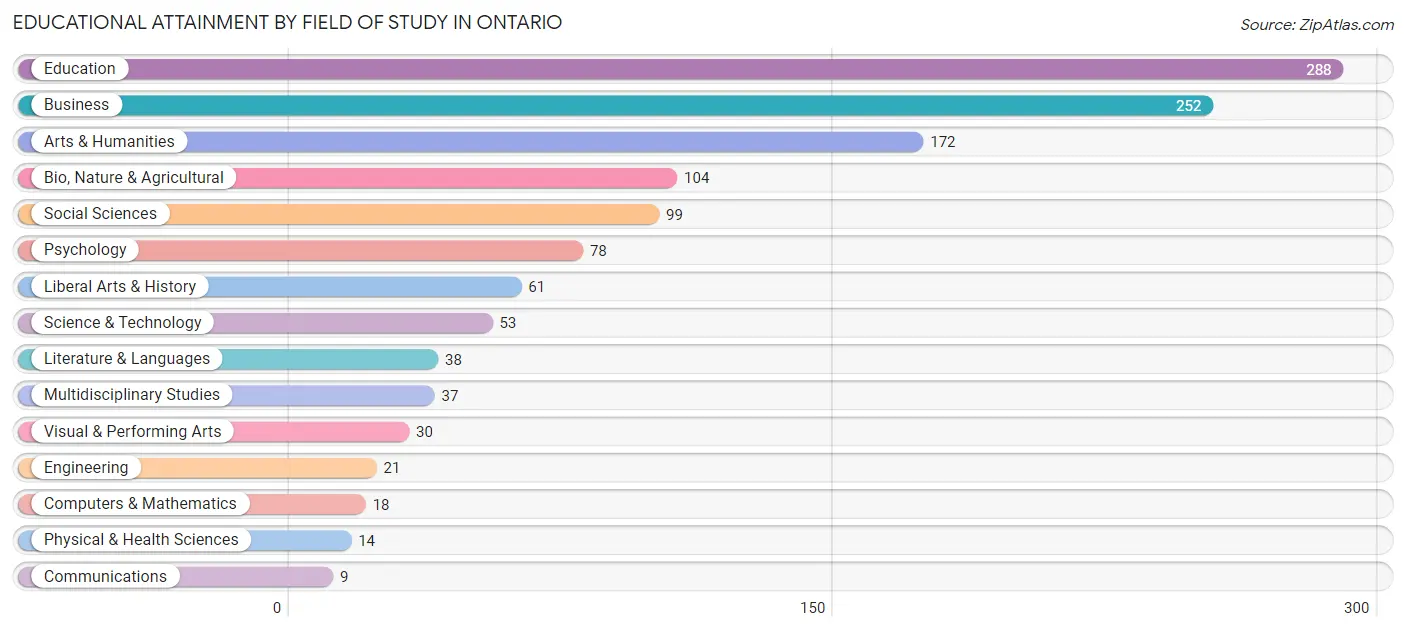
| Field of Study | # Graduates | % Graduates |
| Computers & Mathematics | 18 | 1.4% |
| Bio, Nature & Agricultural | 104 | 8.2% |
| Physical & Health Sciences | 14 | 1.1% |
| Psychology | 78 | 6.1% |
| Social Sciences | 99 | 7.8% |
| Engineering | 21 | 1.7% |
| Multidisciplinary Studies | 37 | 2.9% |
| Science & Technology | 53 | 4.2% |
| Business | 252 | 19.8% |
| Education | 288 | 22.6% |
| Literature & Languages | 38 | 3.0% |
| Liberal Arts & History | 61 | 4.8% |
| Visual & Performing Arts | 30 | 2.4% |
| Communications | 9 | 0.7% |
| Arts & Humanities | 172 | 13.5% |
| Total | 1,274 | 100.0% |
Transportation & Commute in Ontario
Vehicle Availability by Sex in Ontario
The most prevalent vehicle ownership categories in Ontario are males with 2 vehicles (801, accounting for 33.5%) and females with 2 vehicles (793, making up 37.1%).
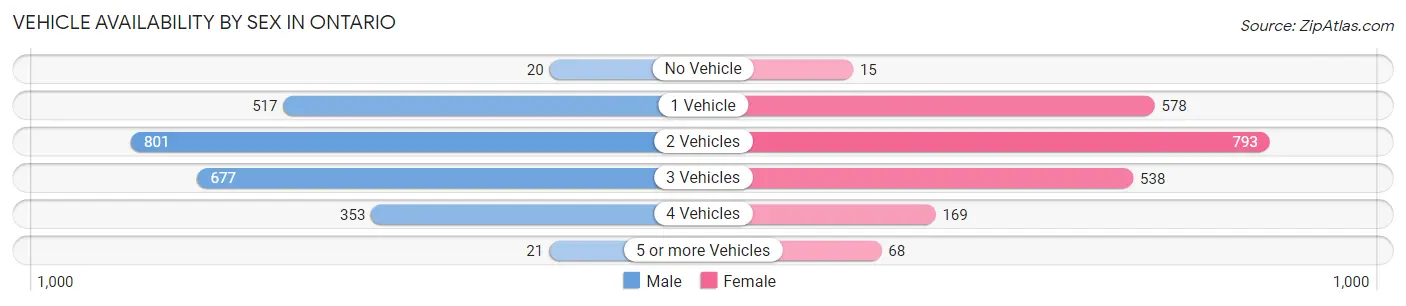
| Vehicles Available | Male | Female |
| No Vehicle | 20 (0.8%) | 15 (0.7%) |
| 1 Vehicle | 517 (21.6%) | 578 (26.8%) |
| 2 Vehicles | 801 (33.5%) | 793 (36.7%) |
| 3 Vehicles | 677 (28.3%) | 538 (24.9%) |
| 4 Vehicles | 353 (14.8%) | 169 (7.8%) |
| 5 or more Vehicles | 21 (0.9%) | 68 (3.2%) |
| Total | 2,389 (100.0%) | 2,161 (100.0%) |
Commute Time in Ontario
The most frequently occuring commute durations in Ontario are 5 to 9 minutes (1,599 commuters, 37.5%), 10 to 14 minutes (833 commuters, 19.5%), and 20 to 24 minutes (440 commuters, 10.3%).
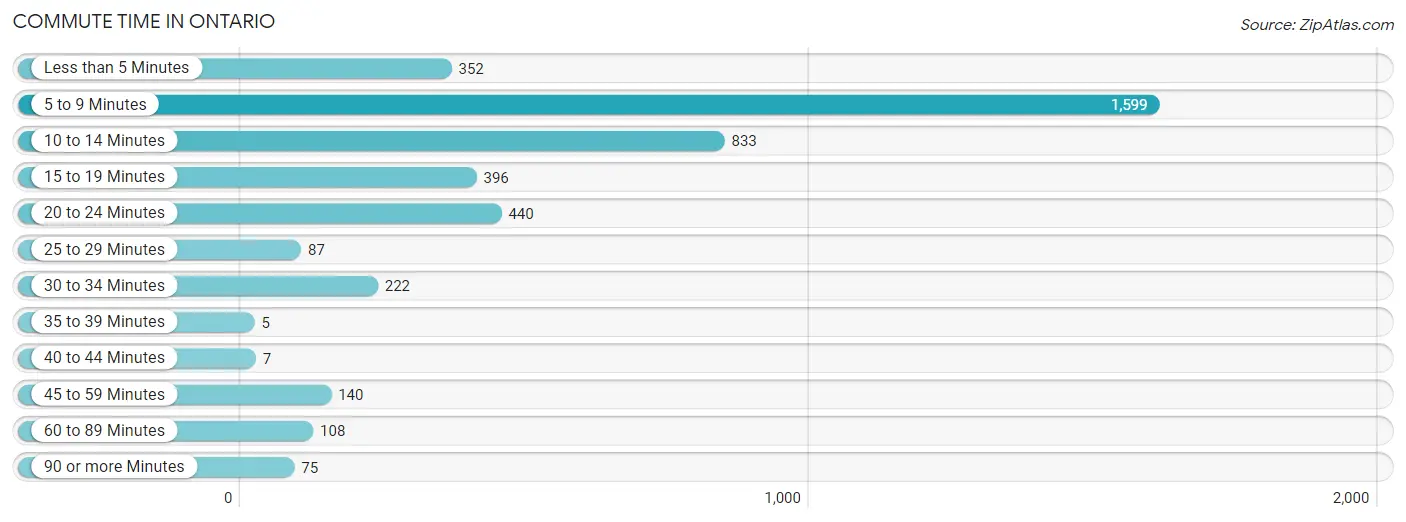
| Commute Time | # Commuters | % Commuters |
| Less than 5 Minutes | 352 | 8.3% |
| 5 to 9 Minutes | 1,599 | 37.5% |
| 10 to 14 Minutes | 833 | 19.5% |
| 15 to 19 Minutes | 396 | 9.3% |
| 20 to 24 Minutes | 440 | 10.3% |
| 25 to 29 Minutes | 87 | 2.0% |
| 30 to 34 Minutes | 222 | 5.2% |
| 35 to 39 Minutes | 5 | 0.1% |
| 40 to 44 Minutes | 7 | 0.2% |
| 45 to 59 Minutes | 140 | 3.3% |
| 60 to 89 Minutes | 108 | 2.5% |
| 90 or more Minutes | 75 | 1.8% |
Commute Time by Sex in Ontario
The most common commute times in Ontario are 5 to 9 minutes (705 commuters, 31.8%) for males and 5 to 9 minutes (894 commuters, 43.7%) for females.
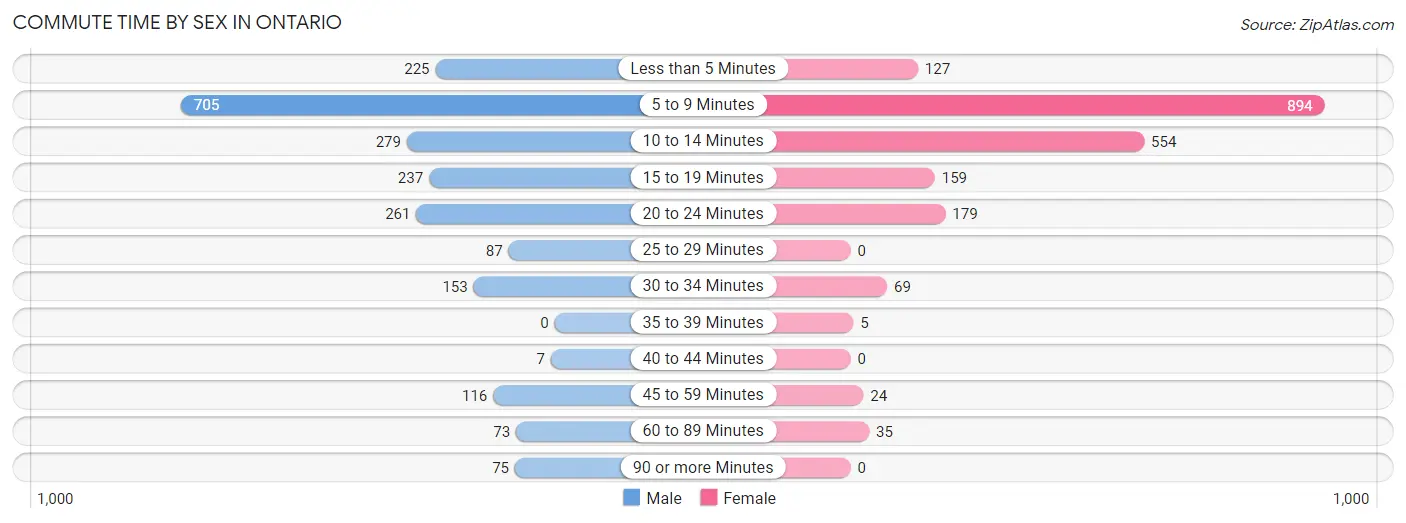
| Commute Time | Male | Female |
| Less than 5 Minutes | 225 (10.1%) | 127 (6.2%) |
| 5 to 9 Minutes | 705 (31.8%) | 894 (43.7%) |
| 10 to 14 Minutes | 279 (12.6%) | 554 (27.1%) |
| 15 to 19 Minutes | 237 (10.7%) | 159 (7.8%) |
| 20 to 24 Minutes | 261 (11.8%) | 179 (8.7%) |
| 25 to 29 Minutes | 87 (3.9%) | 0 (0.0%) |
| 30 to 34 Minutes | 153 (6.9%) | 69 (3.4%) |
| 35 to 39 Minutes | 0 (0.0%) | 5 (0.2%) |
| 40 to 44 Minutes | 7 (0.3%) | 0 (0.0%) |
| 45 to 59 Minutes | 116 (5.2%) | 24 (1.2%) |
| 60 to 89 Minutes | 73 (3.3%) | 35 (1.7%) |
| 90 or more Minutes | 75 (3.4%) | 0 (0.0%) |
Time of Departure to Work by Sex in Ontario
The most frequent times of departure to work in Ontario are 8:00 AM to 8:29 AM (387, 17.4%) for males and 7:00 AM to 7:29 AM (394, 19.3%) for females.
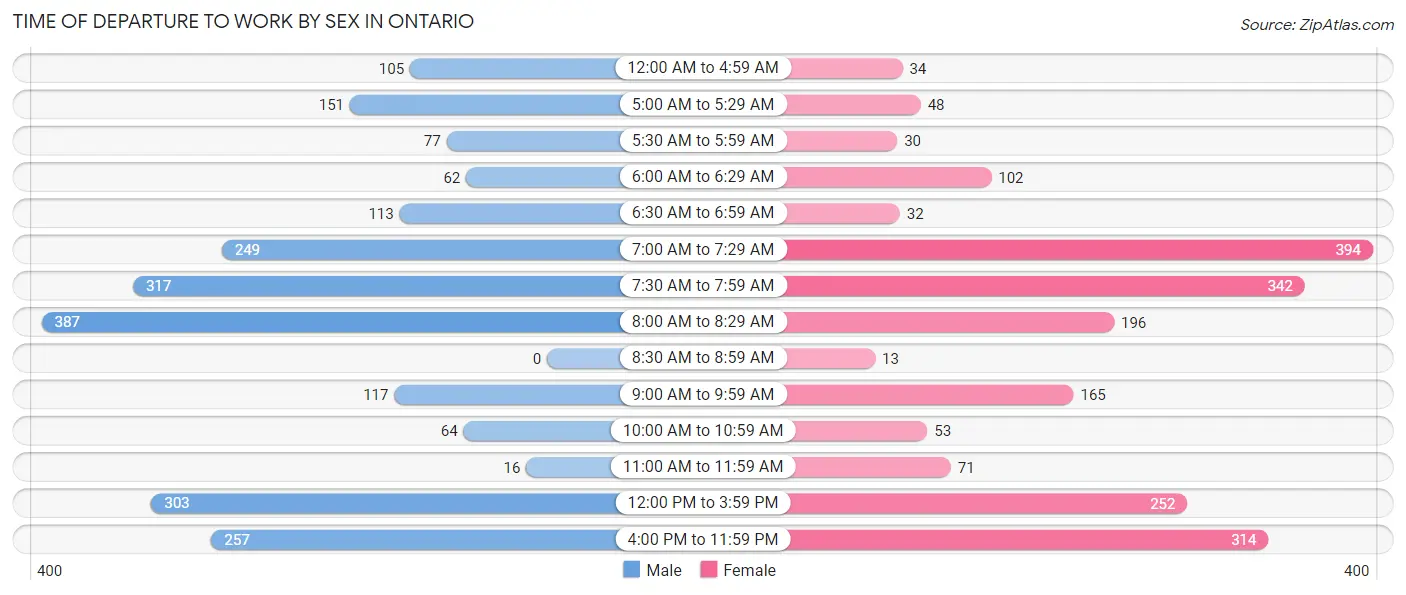
| Time of Departure | Male | Female |
| 12:00 AM to 4:59 AM | 105 (4.7%) | 34 (1.7%) |
| 5:00 AM to 5:29 AM | 151 (6.8%) | 48 (2.4%) |
| 5:30 AM to 5:59 AM | 77 (3.5%) | 30 (1.5%) |
| 6:00 AM to 6:29 AM | 62 (2.8%) | 102 (5.0%) |
| 6:30 AM to 6:59 AM | 113 (5.1%) | 32 (1.6%) |
| 7:00 AM to 7:29 AM | 249 (11.2%) | 394 (19.3%) |
| 7:30 AM to 7:59 AM | 317 (14.3%) | 342 (16.7%) |
| 8:00 AM to 8:29 AM | 387 (17.4%) | 196 (9.6%) |
| 8:30 AM to 8:59 AM | 0 (0.0%) | 13 (0.6%) |
| 9:00 AM to 9:59 AM | 117 (5.3%) | 165 (8.1%) |
| 10:00 AM to 10:59 AM | 64 (2.9%) | 53 (2.6%) |
| 11:00 AM to 11:59 AM | 16 (0.7%) | 71 (3.5%) |
| 12:00 PM to 3:59 PM | 303 (13.7%) | 252 (12.3%) |
| 4:00 PM to 11:59 PM | 257 (11.6%) | 314 (15.3%) |
| Total | 2,218 (100.0%) | 2,046 (100.0%) |
Housing Occupancy in Ontario
Occupancy by Ownership in Ontario
Of the total 4,416 dwellings in Ontario, owner-occupied units account for 2,320 (52.5%), while renter-occupied units make up 2,096 (47.5%).
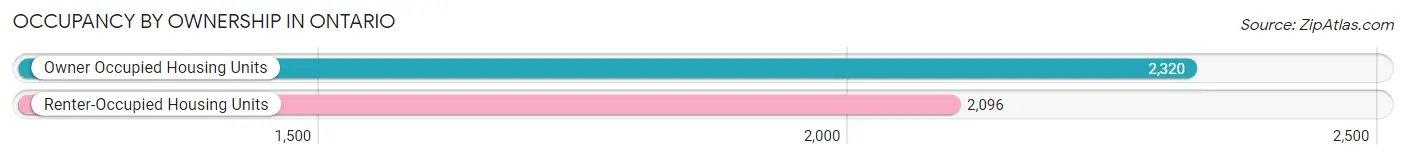
| Occupancy | # Housing Units | % Housing Units |
| Owner Occupied Housing Units | 2,320 | 52.5% |
| Renter-Occupied Housing Units | 2,096 | 47.5% |
| Total Occupied Housing Units | 4,416 | 100.0% |
Occupancy by Household Size in Ontario
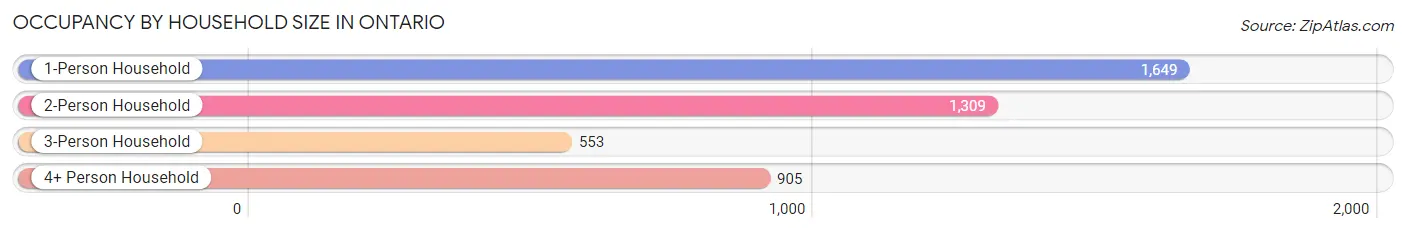
| Household Size | # Housing Units | % Housing Units |
| 1-Person Household | 1,649 | 37.3% |
| 2-Person Household | 1,309 | 29.6% |
| 3-Person Household | 553 | 12.5% |
| 4+ Person Household | 905 | 20.5% |
| Total Housing Units | 4,416 | 100.0% |
Occupancy by Ownership by Household Size in Ontario
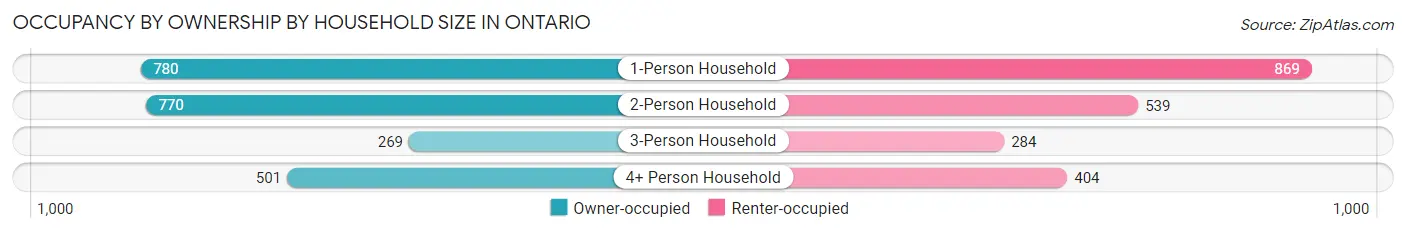
| Household Size | Owner-occupied | Renter-occupied |
| 1-Person Household | 780 (47.3%) | 869 (52.7%) |
| 2-Person Household | 770 (58.8%) | 539 (41.2%) |
| 3-Person Household | 269 (48.6%) | 284 (51.4%) |
| 4+ Person Household | 501 (55.4%) | 404 (44.6%) |
| Total Housing Units | 2,320 (52.5%) | 2,096 (47.5%) |
Occupancy by Educational Attainment in Ontario
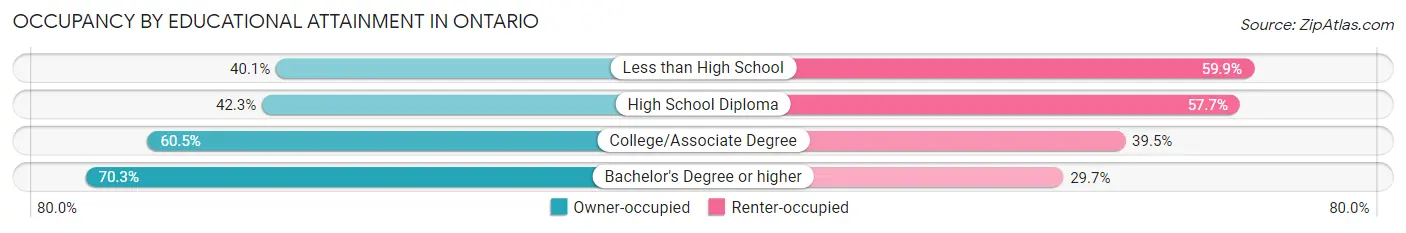
| Household Size | Owner-occupied | Renter-occupied |
| Less than High School | 367 (40.1%) | 548 (59.9%) |
| High School Diploma | 550 (42.3%) | 749 (57.7%) |
| College/Associate Degree | 898 (60.5%) | 586 (39.5%) |
| Bachelor's Degree or higher | 505 (70.3%) | 213 (29.7%) |
Occupancy by Age of Householder in Ontario
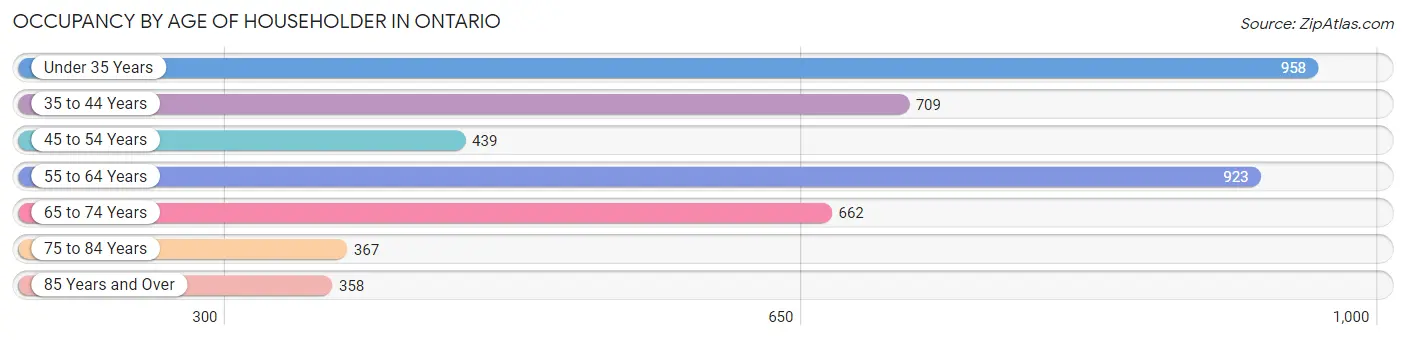
| Age Bracket | # Households | % Households |
| Under 35 Years | 958 | 21.7% |
| 35 to 44 Years | 709 | 16.1% |
| 45 to 54 Years | 439 | 9.9% |
| 55 to 64 Years | 923 | 20.9% |
| 65 to 74 Years | 662 | 15.0% |
| 75 to 84 Years | 367 | 8.3% |
| 85 Years and Over | 358 | 8.1% |
| Total | 4,416 | 100.0% |
Housing Finances in Ontario
Median Income by Occupancy in Ontario
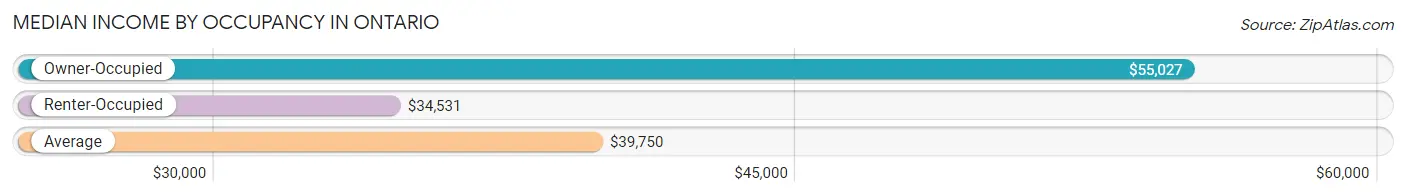
| Occupancy Type | # Households | Median Income |
| Owner-Occupied | 2,320 (52.5%) | $55,027 |
| Renter-Occupied | 2,096 (47.5%) | $34,531 |
| Average | 4,416 (100.0%) | $39,750 |
Occupancy by Householder Income Bracket in Ontario
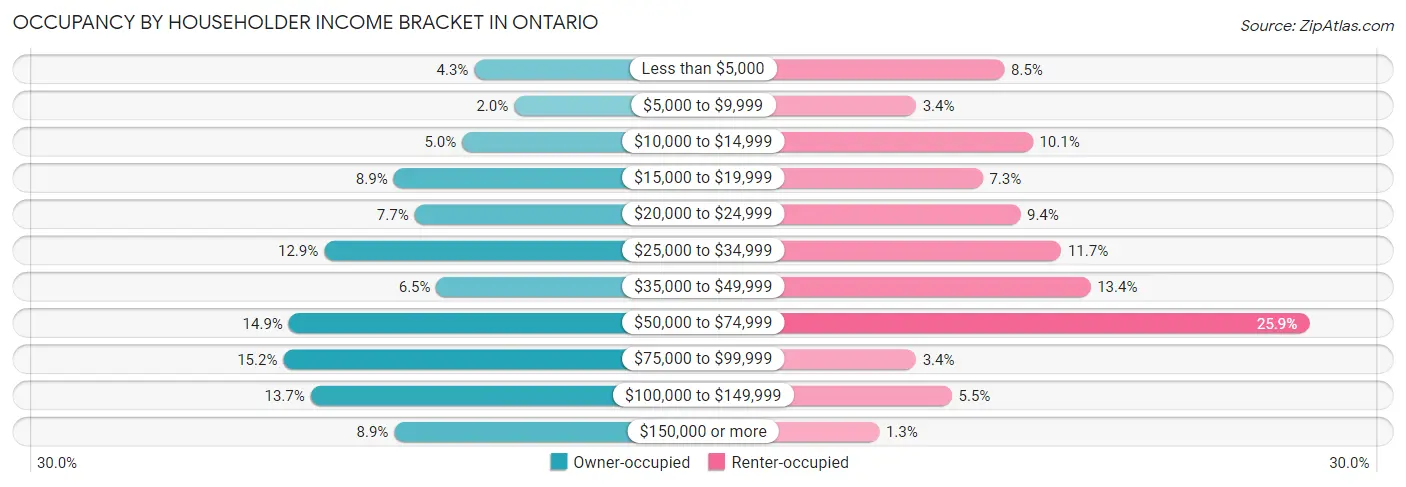
| Income Bracket | Owner-occupied | Renter-occupied |
| Less than $5,000 | 100 (4.3%) | 178 (8.5%) |
| $5,000 to $9,999 | 47 (2.0%) | 72 (3.4%) |
| $10,000 to $14,999 | 116 (5.0%) | 212 (10.1%) |
| $15,000 to $19,999 | 207 (8.9%) | 152 (7.2%) |
| $20,000 to $24,999 | 179 (7.7%) | 197 (9.4%) |
| $25,000 to $34,999 | 299 (12.9%) | 246 (11.7%) |
| $35,000 to $49,999 | 150 (6.5%) | 281 (13.4%) |
| $50,000 to $74,999 | 346 (14.9%) | 543 (25.9%) |
| $75,000 to $99,999 | 353 (15.2%) | 72 (3.4%) |
| $100,000 to $149,999 | 317 (13.7%) | 115 (5.5%) |
| $150,000 or more | 206 (8.9%) | 28 (1.3%) |
| Total | 2,320 (100.0%) | 2,096 (100.0%) |
Monthly Housing Cost Tiers in Ontario
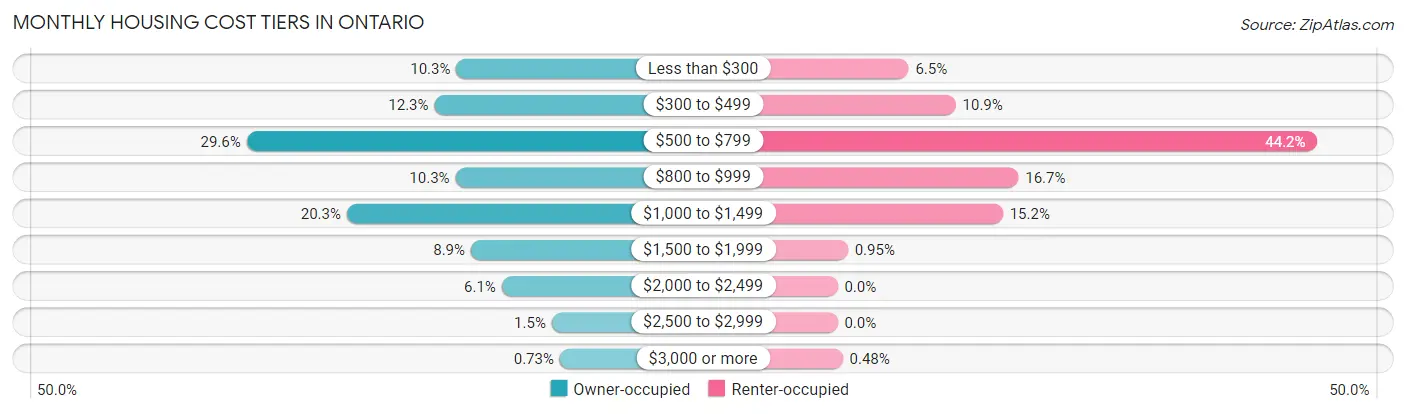
| Monthly Cost | Owner-occupied | Renter-occupied |
| Less than $300 | 238 (10.3%) | 137 (6.5%) |
| $300 to $499 | 285 (12.3%) | 228 (10.9%) |
| $500 to $799 | 686 (29.6%) | 926 (44.2%) |
| $800 to $999 | 240 (10.3%) | 349 (16.7%) |
| $1,000 to $1,499 | 472 (20.3%) | 319 (15.2%) |
| $1,500 to $1,999 | 207 (8.9%) | 20 (0.9%) |
| $2,000 to $2,499 | 141 (6.1%) | 0 (0.0%) |
| $2,500 to $2,999 | 34 (1.5%) | 0 (0.0%) |
| $3,000 or more | 17 (0.7%) | 10 (0.5%) |
| Total | 2,320 (100.0%) | 2,096 (100.0%) |
Physical Housing Characteristics in Ontario
Housing Structures in Ontario
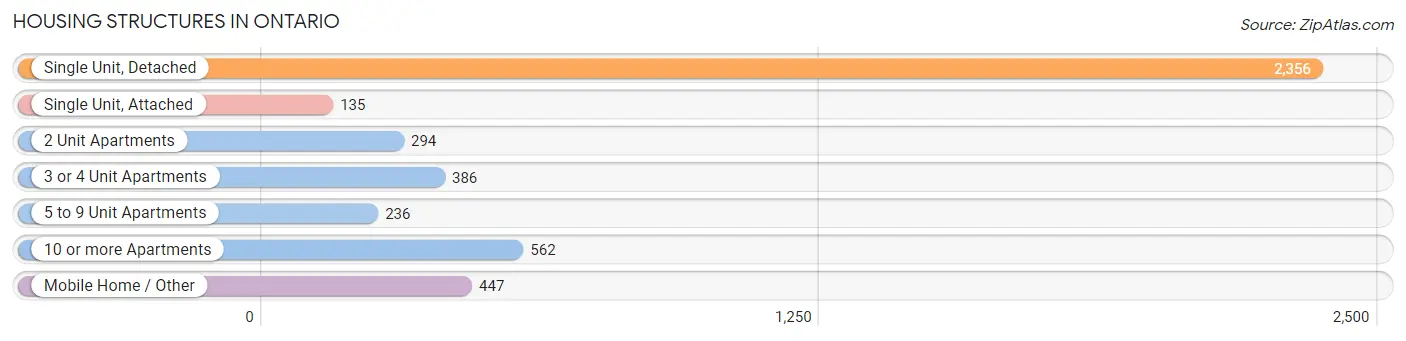
| Structure Type | # Housing Units | % Housing Units |
| Single Unit, Detached | 2,356 | 53.3% |
| Single Unit, Attached | 135 | 3.1% |
| 2 Unit Apartments | 294 | 6.7% |
| 3 or 4 Unit Apartments | 386 | 8.7% |
| 5 to 9 Unit Apartments | 236 | 5.3% |
| 10 or more Apartments | 562 | 12.7% |
| Mobile Home / Other | 447 | 10.1% |
| Total | 4,416 | 100.0% |
Housing Structures by Occupancy in Ontario
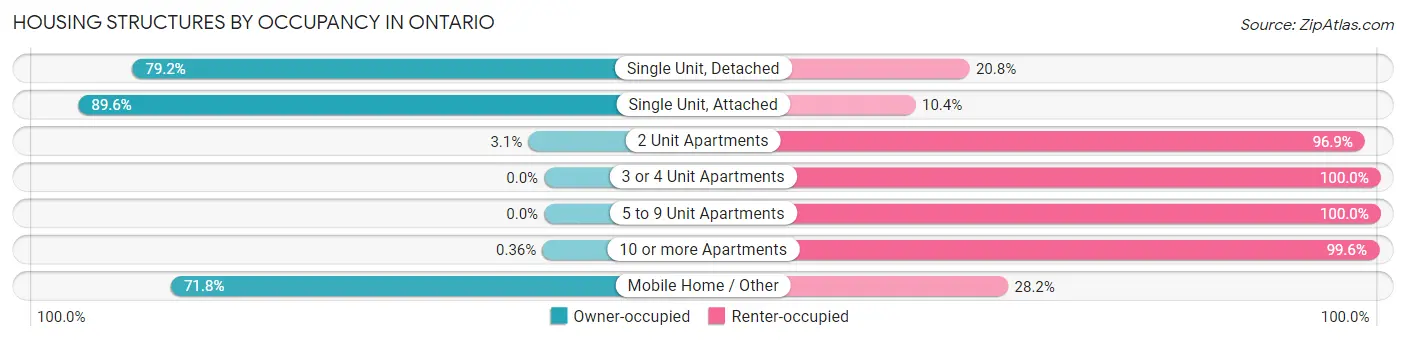
| Structure Type | Owner-occupied | Renter-occupied |
| Single Unit, Detached | 1,867 (79.2%) | 489 (20.8%) |
| Single Unit, Attached | 121 (89.6%) | 14 (10.4%) |
| 2 Unit Apartments | 9 (3.1%) | 285 (96.9%) |
| 3 or 4 Unit Apartments | 0 (0.0%) | 386 (100.0%) |
| 5 to 9 Unit Apartments | 0 (0.0%) | 236 (100.0%) |
| 10 or more Apartments | 2 (0.4%) | 560 (99.6%) |
| Mobile Home / Other | 321 (71.8%) | 126 (28.2%) |
| Total | 2,320 (52.5%) | 2,096 (47.5%) |
Housing Structures by Number of Rooms in Ontario
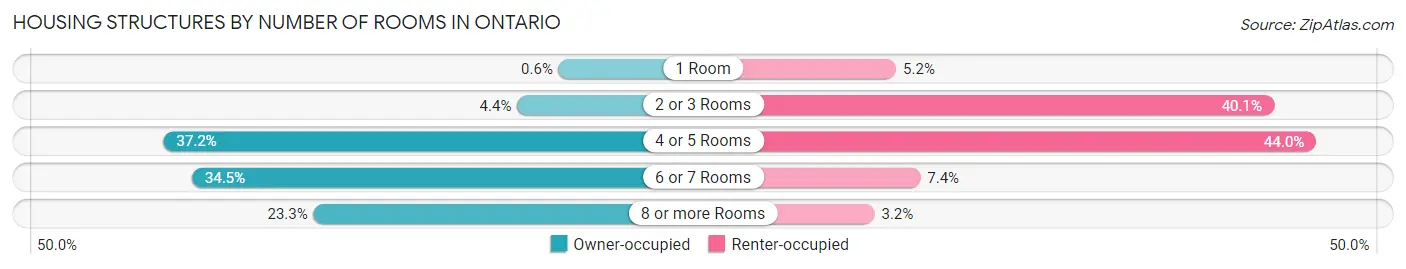
| Number of Rooms | Owner-occupied | Renter-occupied |
| 1 Room | 14 (0.6%) | 109 (5.2%) |
| 2 or 3 Rooms | 103 (4.4%) | 841 (40.1%) |
| 4 or 5 Rooms | 862 (37.2%) | 923 (44.0%) |
| 6 or 7 Rooms | 801 (34.5%) | 156 (7.4%) |
| 8 or more Rooms | 540 (23.3%) | 67 (3.2%) |
| Total | 2,320 (100.0%) | 2,096 (100.0%) |
Housing Structure by Heating Type in Ontario
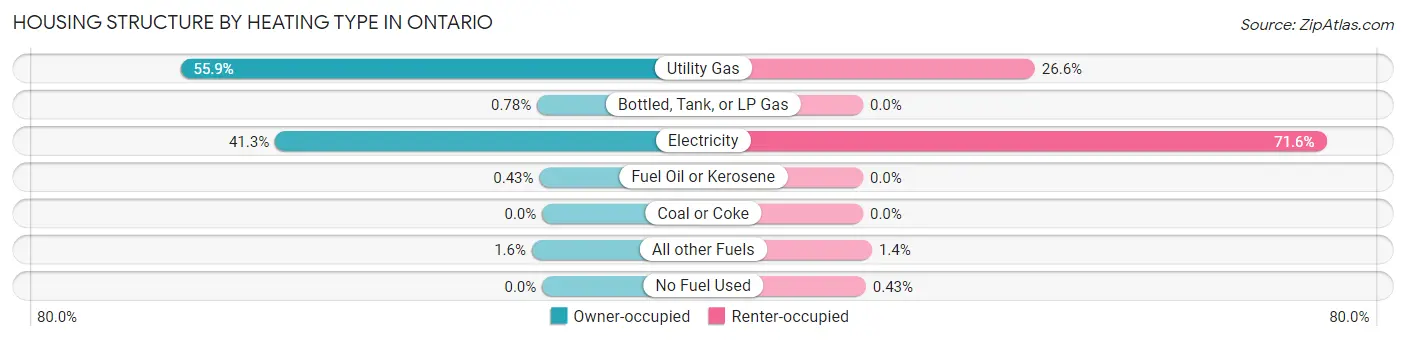
| Heating Type | Owner-occupied | Renter-occupied |
| Utility Gas | 1,297 (55.9%) | 557 (26.6%) |
| Bottled, Tank, or LP Gas | 18 (0.8%) | 0 (0.0%) |
| Electricity | 958 (41.3%) | 1,501 (71.6%) |
| Fuel Oil or Kerosene | 10 (0.4%) | 0 (0.0%) |
| Coal or Coke | 0 (0.0%) | 0 (0.0%) |
| All other Fuels | 37 (1.6%) | 29 (1.4%) |
| No Fuel Used | 0 (0.0%) | 9 (0.4%) |
| Total | 2,320 (100.0%) | 2,096 (100.0%) |
Household Vehicle Usage in Ontario
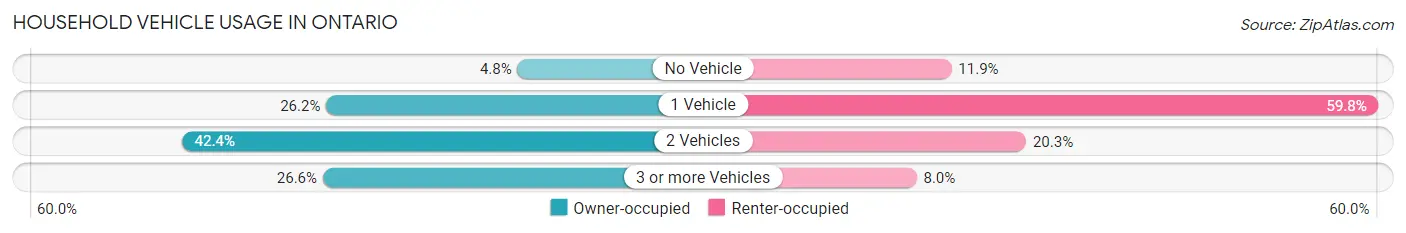
| Vehicles per Household | Owner-occupied | Renter-occupied |
| No Vehicle | 111 (4.8%) | 250 (11.9%) |
| 1 Vehicle | 608 (26.2%) | 1,253 (59.8%) |
| 2 Vehicles | 984 (42.4%) | 425 (20.3%) |
| 3 or more Vehicles | 617 (26.6%) | 168 (8.0%) |
| Total | 2,320 (100.0%) | 2,096 (100.0%) |
Real Estate & Mortgages in Ontario
Real Estate and Mortgage Overview in Ontario
| Characteristic | Without Mortgage | With Mortgage |
| Housing Units | 1,082 | 1,238 |
| Median Property Value | $182,700 | $169,600 |
| Median Household Income | $35,417 | $110 |
| Monthly Housing Costs | $505 | $17 |
| Real Estate Taxes | $1,432 | $11 |
Property Value by Mortgage Status in Ontario
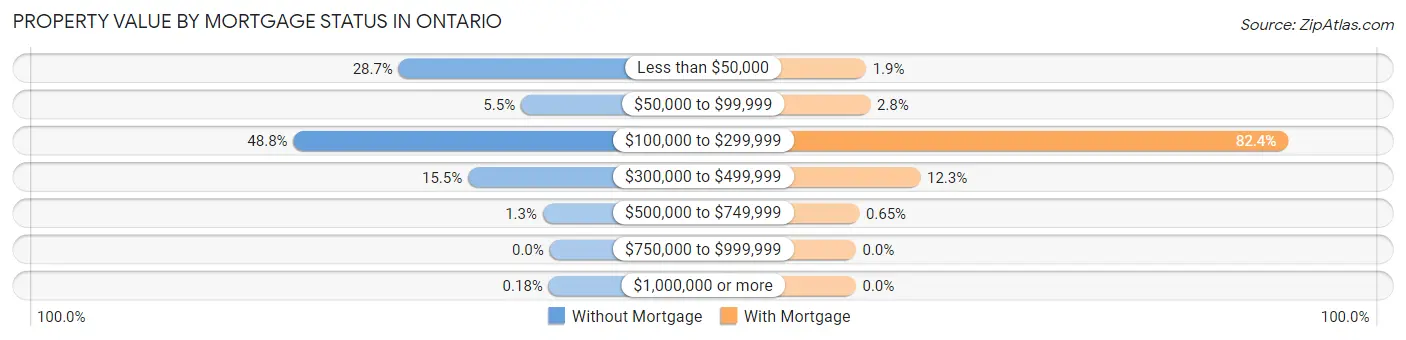
| Property Value | Without Mortgage | With Mortgage |
| Less than $50,000 | 311 (28.7%) | 24 (1.9%) |
| $50,000 to $99,999 | 59 (5.4%) | 34 (2.8%) |
| $100,000 to $299,999 | 528 (48.8%) | 1,020 (82.4%) |
| $300,000 to $499,999 | 168 (15.5%) | 152 (12.3%) |
| $500,000 to $749,999 | 14 (1.3%) | 8 (0.6%) |
| $750,000 to $999,999 | 0 (0.0%) | 0 (0.0%) |
| $1,000,000 or more | 2 (0.2%) | 0 (0.0%) |
| Total | 1,082 (100.0%) | 1,238 (100.0%) |
Household Income by Mortgage Status in Ontario
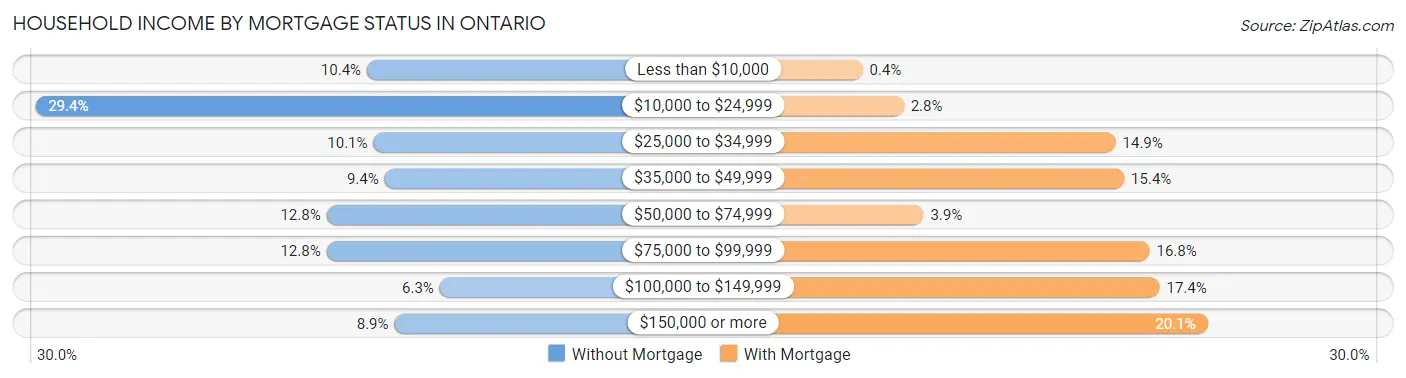
| Household Income | Without Mortgage | With Mortgage |
| Less than $10,000 | 113 (10.4%) | 5 (0.4%) |
| $10,000 to $24,999 | 318 (29.4%) | 34 (2.8%) |
| $25,000 to $34,999 | 109 (10.1%) | 184 (14.9%) |
| $35,000 to $49,999 | 102 (9.4%) | 190 (15.3%) |
| $50,000 to $74,999 | 138 (12.8%) | 48 (3.9%) |
| $75,000 to $99,999 | 138 (12.8%) | 208 (16.8%) |
| $100,000 to $149,999 | 68 (6.3%) | 215 (17.4%) |
| $150,000 or more | 96 (8.9%) | 249 (20.1%) |
| Total | 1,082 (100.0%) | 1,238 (100.0%) |
Property Value to Household Income Ratio in Ontario
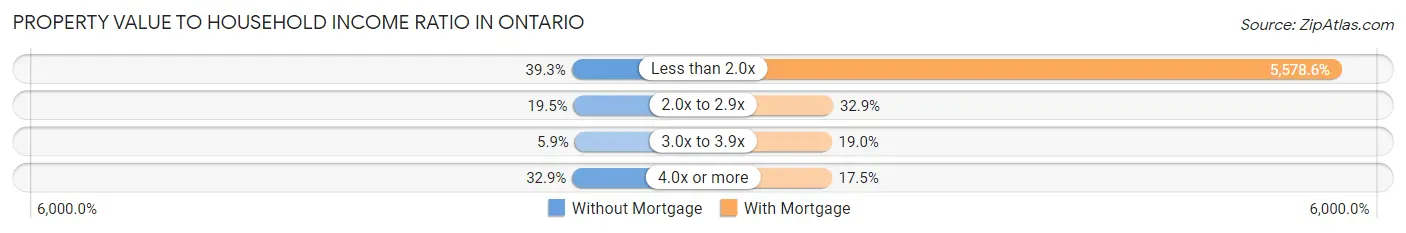
| Value-to-Income Ratio | Without Mortgage | With Mortgage |
| Less than 2.0x | 425 (39.3%) | 69,063 (5,578.6%) |
| 2.0x to 2.9x | 211 (19.5%) | 407 (32.9%) |
| 3.0x to 3.9x | 64 (5.9%) | 235 (19.0%) |
| 4.0x or more | 356 (32.9%) | 217 (17.5%) |
| Total | 1,082 (100.0%) | 1,238 (100.0%) |
Real Estate Taxes by Mortgage Status in Ontario
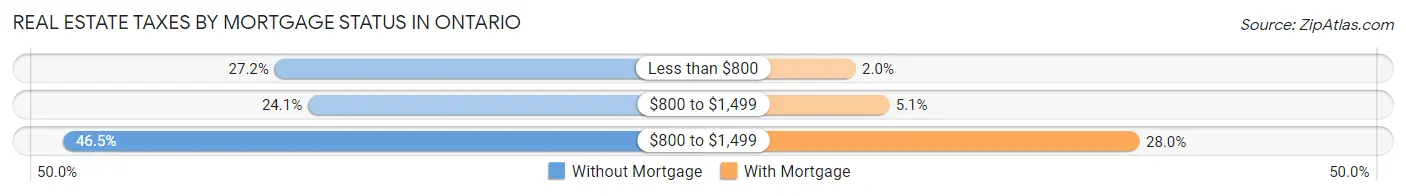
| Property Taxes | Without Mortgage | With Mortgage |
| Less than $800 | 294 (27.2%) | 25 (2.0%) |
| $800 to $1,499 | 261 (24.1%) | 63 (5.1%) |
| $800 to $1,499 | 503 (46.5%) | 346 (28.0%) |
| Total | 1,082 (100.0%) | 1,238 (100.0%) |
Health & Disability in Ontario
Health Insurance Coverage by Age in Ontario
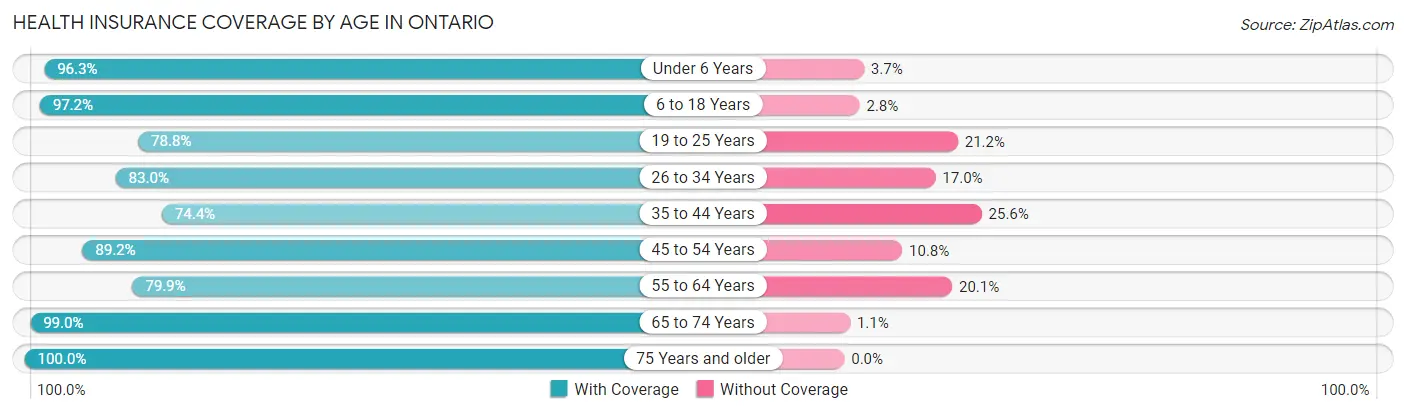
| Age Bracket | With Coverage | Without Coverage |
| Under 6 Years | 894 (96.3%) | 34 (3.7%) |
| 6 to 18 Years | 2,187 (97.2%) | 64 (2.8%) |
| 19 to 25 Years | 950 (78.8%) | 255 (21.2%) |
| 26 to 34 Years | 1,192 (83.0%) | 244 (17.0%) |
| 35 to 44 Years | 877 (74.4%) | 302 (25.6%) |
| 45 to 54 Years | 877 (89.2%) | 106 (10.8%) |
| 55 to 64 Years | 1,109 (79.9%) | 279 (20.1%) |
| 65 to 74 Years | 1,040 (99.0%) | 11 (1.1%) |
| 75 Years and older | 1,105 (100.0%) | 0 (0.0%) |
| Total | 10,231 (88.8%) | 1,295 (11.2%) |
Health Insurance Coverage by Citizenship Status in Ontario
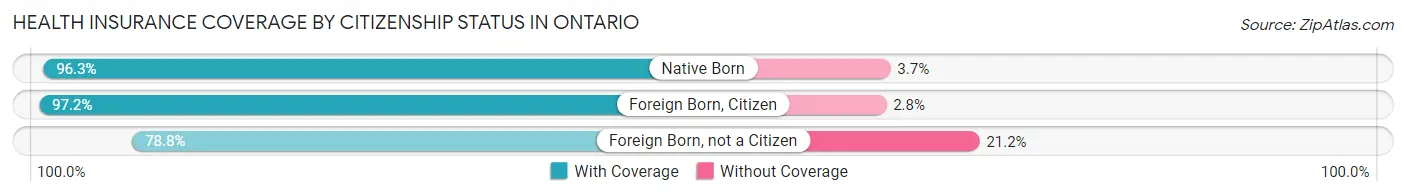
| Citizenship Status | With Coverage | Without Coverage |
| Native Born | 894 (96.3%) | 34 (3.7%) |
| Foreign Born, Citizen | 2,187 (97.2%) | 64 (2.8%) |
| Foreign Born, not a Citizen | 950 (78.8%) | 255 (21.2%) |
Health Insurance Coverage by Household Income in Ontario
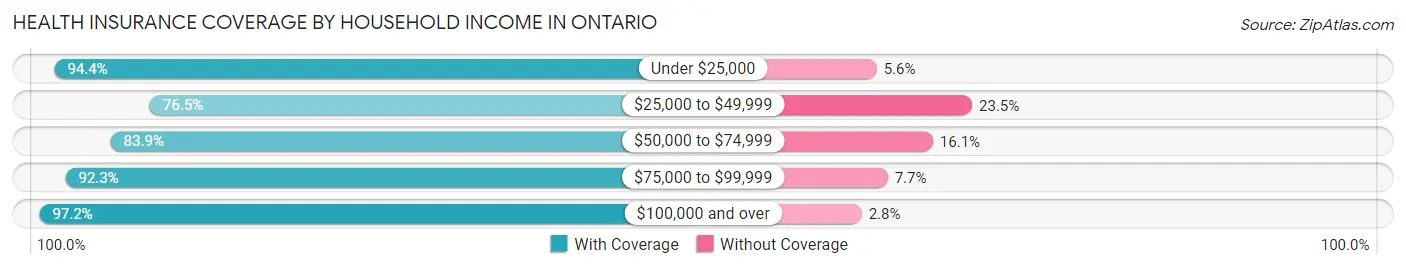
| Household Income | With Coverage | Without Coverage |
| Under $25,000 | 2,325 (94.4%) | 138 (5.6%) |
| $25,000 to $49,999 | 1,623 (76.5%) | 498 (23.5%) |
| $50,000 to $74,999 | 2,584 (83.9%) | 497 (16.1%) |
| $75,000 to $99,999 | 1,170 (92.3%) | 97 (7.7%) |
| $100,000 and over | 2,264 (97.2%) | 65 (2.8%) |
Public vs Private Health Insurance Coverage by Age in Ontario
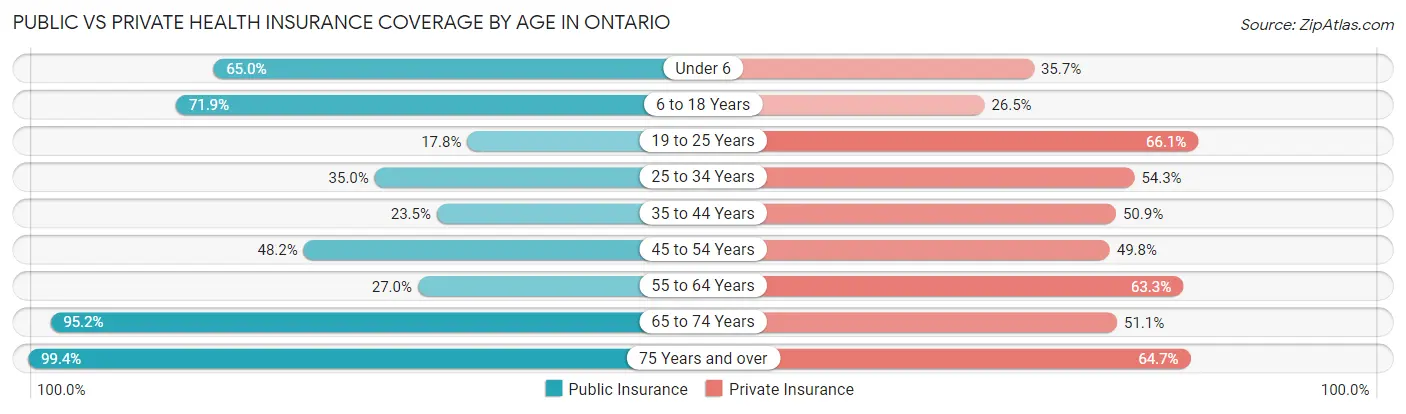
| Age Bracket | Public Insurance | Private Insurance |
| Under 6 | 603 (65.0%) | 331 (35.7%) |
| 6 to 18 Years | 1,619 (71.9%) | 596 (26.5%) |
| 19 to 25 Years | 215 (17.8%) | 797 (66.1%) |
| 25 to 34 Years | 503 (35.0%) | 780 (54.3%) |
| 35 to 44 Years | 277 (23.5%) | 600 (50.9%) |
| 45 to 54 Years | 474 (48.2%) | 489 (49.7%) |
| 55 to 64 Years | 375 (27.0%) | 879 (63.3%) |
| 65 to 74 Years | 1,001 (95.2%) | 537 (51.1%) |
| 75 Years and over | 1,098 (99.4%) | 715 (64.7%) |
| Total | 6,165 (53.5%) | 5,724 (49.7%) |
Disability Status by Sex by Age in Ontario
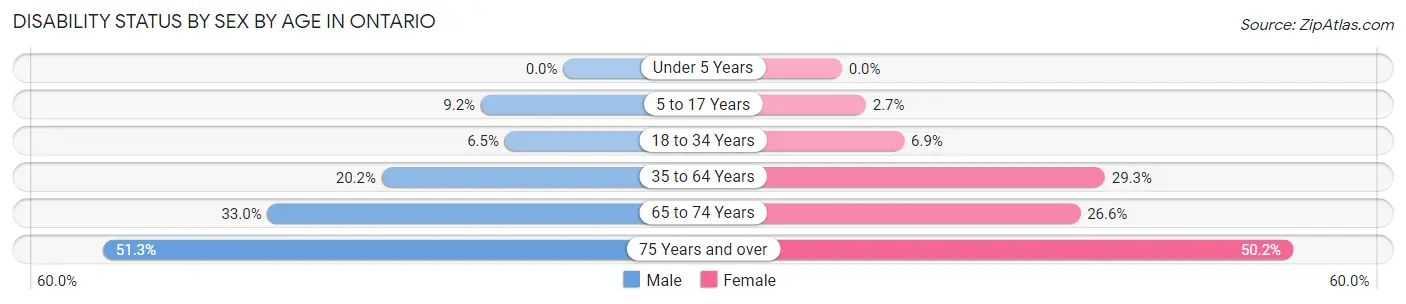
| Age Bracket | Male | Female |
| Under 5 Years | 0 (0.0%) | 0 (0.0%) |
| 5 to 17 Years | 107 (9.2%) | 30 (2.7%) |
| 18 to 34 Years | 93 (6.5%) | 93 (6.9%) |
| 35 to 64 Years | 336 (20.2%) | 553 (29.3%) |
| 65 to 74 Years | 144 (33.0%) | 163 (26.6%) |
| 75 Years and over | 240 (51.3%) | 320 (50.2%) |
Disability Class by Sex by Age in Ontario
Disability Class: Hearing Difficulty
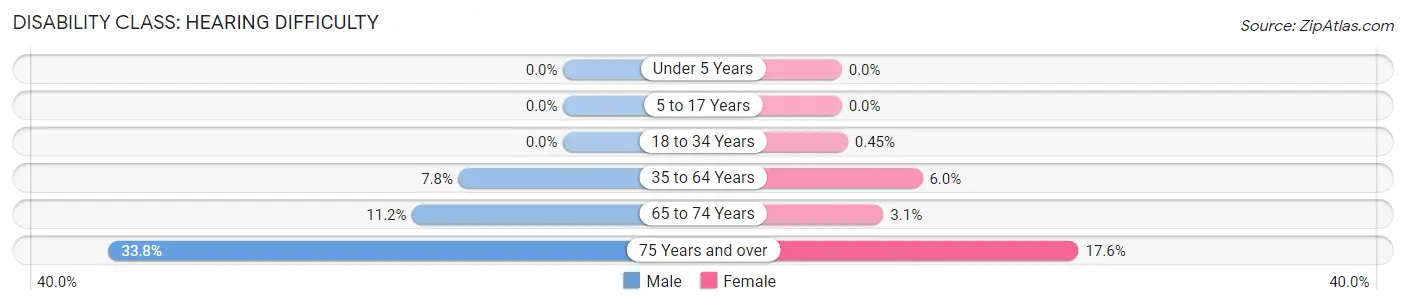
| Age Bracket | Male | Female |
| Under 5 Years | 0 (0.0%) | 0 (0.0%) |
| 5 to 17 Years | 0 (0.0%) | 0 (0.0%) |
| 18 to 34 Years | 0 (0.0%) | 6 (0.4%) |
| 35 to 64 Years | 129 (7.8%) | 113 (6.0%) |
| 65 to 74 Years | 49 (11.2%) | 19 (3.1%) |
| 75 Years and over | 158 (33.8%) | 112 (17.6%) |
Disability Class: Vision Difficulty
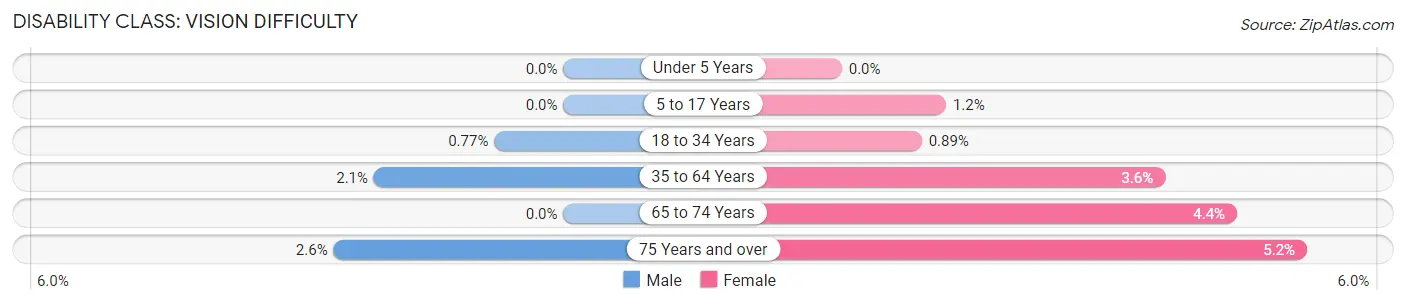
| Age Bracket | Male | Female |
| Under 5 Years | 0 (0.0%) | 0 (0.0%) |
| 5 to 17 Years | 0 (0.0%) | 13 (1.2%) |
| 18 to 34 Years | 11 (0.8%) | 12 (0.9%) |
| 35 to 64 Years | 35 (2.1%) | 68 (3.6%) |
| 65 to 74 Years | 0 (0.0%) | 27 (4.4%) |
| 75 Years and over | 12 (2.6%) | 33 (5.2%) |
Disability Class: Cognitive Difficulty
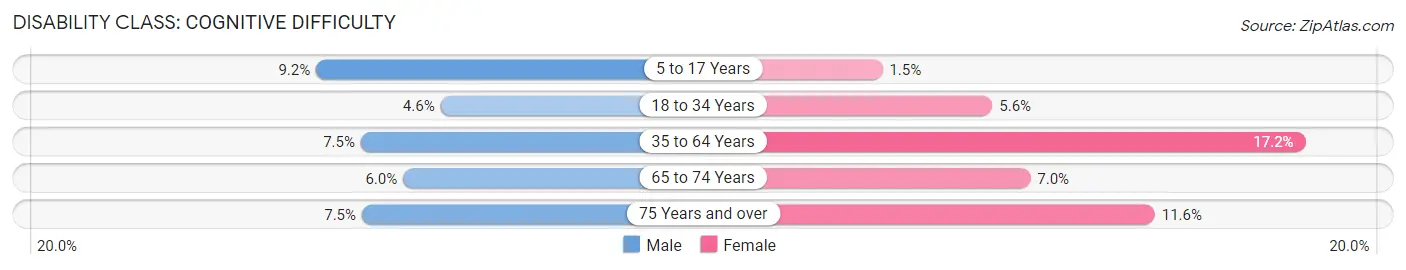
| Age Bracket | Male | Female |
| 5 to 17 Years | 107 (9.2%) | 17 (1.5%) |
| 18 to 34 Years | 65 (4.6%) | 75 (5.6%) |
| 35 to 64 Years | 125 (7.5%) | 325 (17.2%) |
| 65 to 74 Years | 26 (5.9%) | 43 (7.0%) |
| 75 Years and over | 35 (7.5%) | 74 (11.6%) |
Disability Class: Ambulatory Difficulty
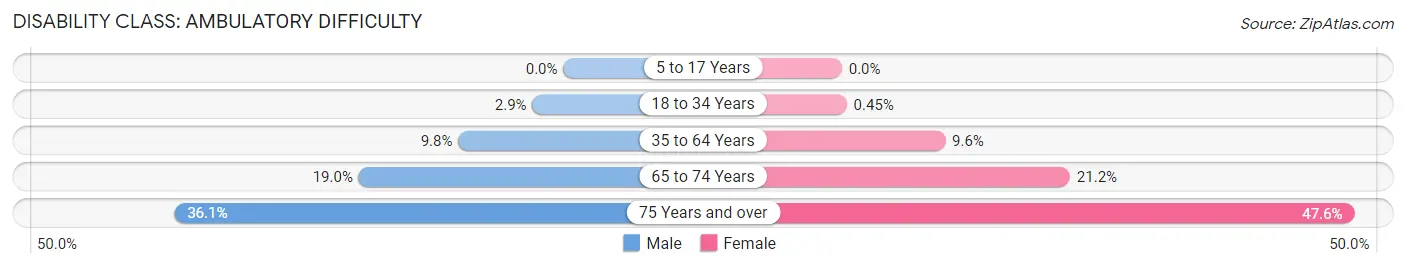
| Age Bracket | Male | Female |
| 5 to 17 Years | 0 (0.0%) | 0 (0.0%) |
| 18 to 34 Years | 41 (2.9%) | 6 (0.4%) |
| 35 to 64 Years | 162 (9.8%) | 181 (9.6%) |
| 65 to 74 Years | 83 (19.0%) | 130 (21.2%) |
| 75 Years and over | 169 (36.1%) | 303 (47.6%) |
Disability Class: Self-Care Difficulty
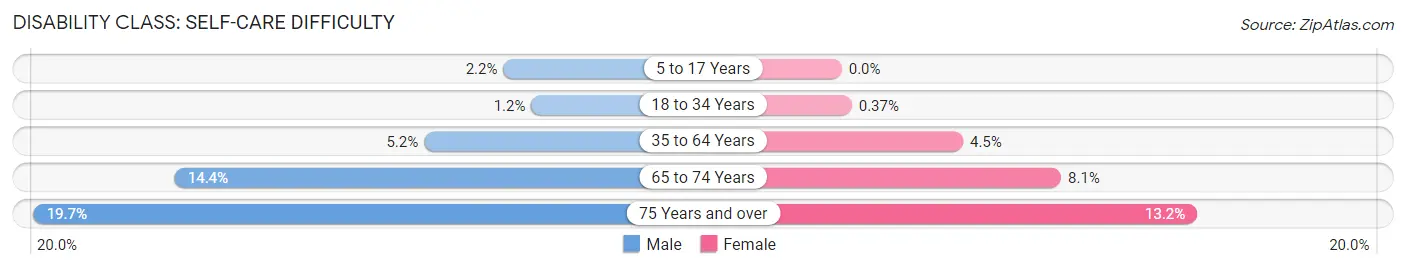
| Age Bracket | Male | Female |
| 5 to 17 Years | 26 (2.2%) | 0 (0.0%) |
| 18 to 34 Years | 17 (1.2%) | 5 (0.4%) |
| 35 to 64 Years | 86 (5.2%) | 85 (4.5%) |
| 65 to 74 Years | 63 (14.4%) | 50 (8.1%) |
| 75 Years and over | 92 (19.7%) | 84 (13.2%) |
Technology Access in Ontario
Computing Device Access in Ontario
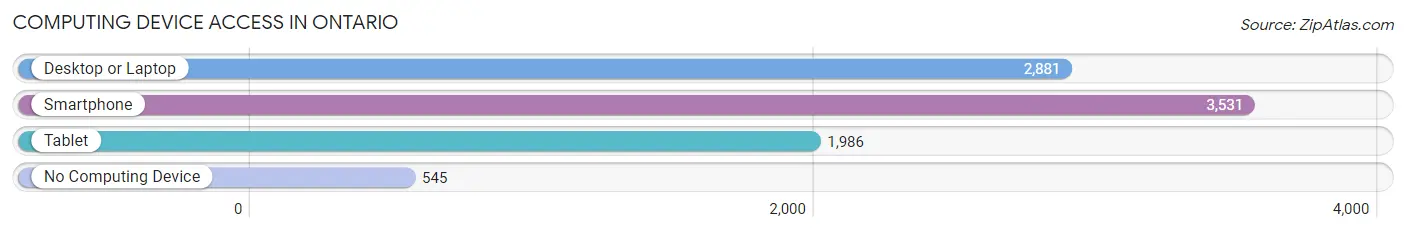
| Device Type | # Households | % Households |
| Desktop or Laptop | 2,881 | 65.2% |
| Smartphone | 3,531 | 80.0% |
| Tablet | 1,986 | 45.0% |
| No Computing Device | 545 | 12.3% |
| Total | 4,416 | 100.0% |
Internet Access in Ontario
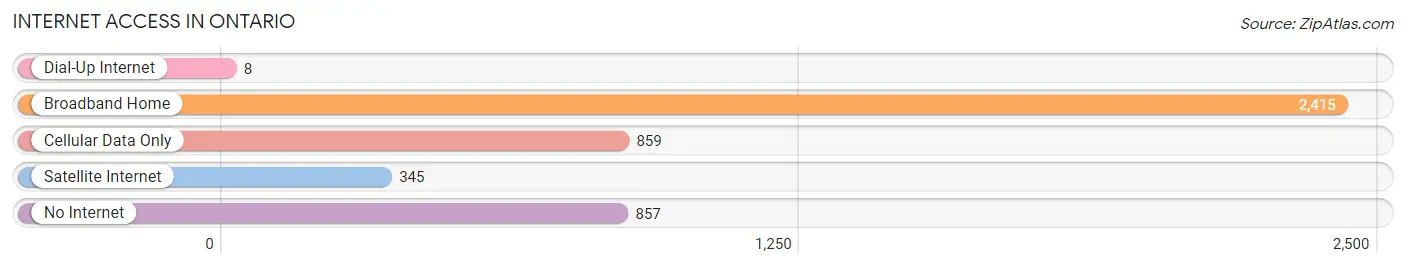
| Internet Type | # Households | % Households |
| Dial-Up Internet | 8 | 0.2% |
| Broadband Home | 2,415 | 54.7% |
| Cellular Data Only | 859 | 19.5% |
| Satellite Internet | 345 | 7.8% |
| No Internet | 857 | 19.4% |
| Total | 4,416 | 100.0% |
Ontario Summary
Ontario is a city located in Malheur County, Oregon, United States. It is the largest city in Malheur County and the county seat. The population was 11,366 at the 2010 census. The city is situated along the Snake River at the Idaho border.
History
The area around Ontario was first inhabited by the Northern Paiute and Bannock tribes. The first white settlers arrived in the area in the late 1860s. The city was founded in 1883 by developers from the Oregon Railway and Navigation Company. The city was named after the Canadian province of Ontario.
In the early 1900s, Ontario was a major railroad hub and a center for agriculture. The city was also home to a large number of Chinese immigrants who worked in the local railroad and agricultural industries.
Geography
Ontario is located in the Snake River Valley at the Idaho border. The city is situated at an elevation of 2,073 feet (631 m). The city covers an area of 8.3 square miles (21.5 km2).
The city is located in a semi-arid climate zone, with hot summers and cold winters. The average annual precipitation is 8.5 inches (216 mm).
Economy
Ontario’s economy is largely based on agriculture and manufacturing. The city is home to several large food processing plants, including the J.R. Simplot Company, which produces potato products. The city is also home to several large agricultural operations, including the Idaho-Oregon Land Company, which grows potatoes, onions, and other crops.
The city is also home to several large retail stores, including Walmart, Lowe’s, and Home Depot. The city is also home to several large medical facilities, including St. Alphonsus Regional Medical Center and the Ontario Medical Center.
Demographics
As of the 2010 census, the population of Ontario was 11,366. The racial makeup of the city was 79.2% White, 0.7% African American, 0.7% Native American, 0.7% Asian, 0.2% Pacific Islander, 16.2% from other races, and 2.4% from two or more races. Hispanic or Latino of any race were 28.2% of the population.
The median income for a household in the city was $31,944, and the median income for a family was $37,944. The per capita income for the city was $17,845. About 17.2% of families and 21.3% of the population were below the poverty line, including 28.3% of those under age 18 and 11.2% of those age 65 or over.
Common Questions
What is Per Capita Income in Ontario?
Per Capita income in Ontario is $23,075.
What is the Median Family Income in Ontario?
Median Family Income in Ontario is $56,795.
What is the Median Household income in Ontario?
Median Household Income in Ontario is $39,750.
What is Income or Wage Gap in Ontario?
Income or Wage Gap in Ontario is 0.5%.
Women in Ontario earn 99.5 cents for every dollar earned by a man.
What is Inequality or Gini Index in Ontario?
Inequality or Gini Index in Ontario is 0.46.
What is the Total Population of Ontario?
Total Population of Ontario is 11,610.
What is the Total Male Population of Ontario?
Total Male Population of Ontario is 5,559.
What is the Total Female Population of Ontario?
Total Female Population of Ontario is 6,051.
What is the Ratio of Males per 100 Females in Ontario?
There are 91.87 Males per 100 Females in Ontario.
What is the Ratio of Females per 100 Males in Ontario?
There are 108.85 Females per 100 Males in Ontario.
What is the Median Population Age in Ontario?
Median Population Age in Ontario is 34.9 Years.
What is the Average Family Size in Ontario
Average Family Size in Ontario is 3.5 People.
What is the Average Household Size in Ontario
Average Household Size in Ontario is 2.5 People.
How Large is the Labor Force in Ontario?
There are 5,003 People in the Labor Forcein in Ontario.
What is the Percentage of People in the Labor Force in Ontario?
56.3% of People are in the Labor Force in Ontario.
What is the Unemployment Rate in Ontario?
Unemployment Rate in Ontario is 7.0%.