Stanfield, OR Map & Demographics
Stanfield Map
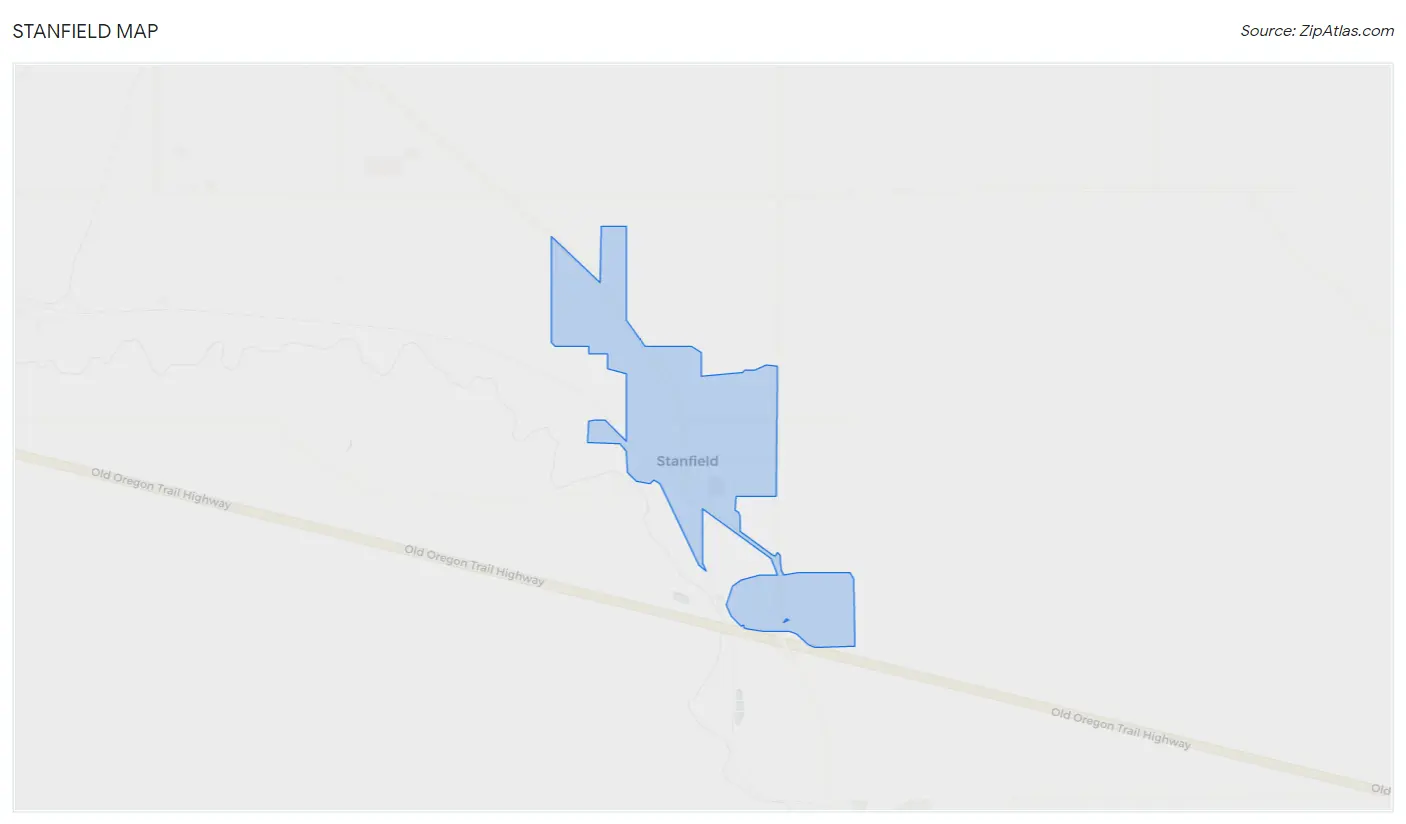
Stanfield Overview
$29,077
PER CAPITA INCOME
$74,167
AVG FAMILY INCOME
$68,750
AVG HOUSEHOLD INCOME
45.1%
WAGE / INCOME GAP [ % ]
54.9¢/ $1
WAGE / INCOME GAP [ $ ]
$17,390
FAMILY INCOME DEFICIT
0.33
INEQUALITY / GINI INDEX
2,128
TOTAL POPULATION
924
MALE POPULATION
1,204
FEMALE POPULATION
76.74
MALES / 100 FEMALES
130.30
FEMALES / 100 MALES
40.9
MEDIAN AGE
2.7
AVG FAMILY SIZE
2.5
AVG HOUSEHOLD SIZE
1,083
LABOR FORCE [ PEOPLE ]
60.9%
PERCENT IN LABOR FORCE
6.7%
UNEMPLOYMENT RATE
Stanfield Zip Codes
Stanfield Area Codes
Income in Stanfield
Income Overview in Stanfield
Per Capita Income in Stanfield is $29,077, while median incomes of families and households are $74,167 and $68,750 respectively.
| Characteristic | Number | Measure |
| Per Capita Income | 2,128 | $29,077 |
| Median Family Income | 666 | $74,167 |
| Mean Family Income | 666 | $79,320 |
| Median Household Income | 863 | $68,750 |
| Mean Household Income | 863 | $74,926 |
| Income Deficit | 666 | $17,390 |
| Wage / Income Gap (%) | 2,128 | 45.07% |
| Wage / Income Gap ($) | 2,128 | 54.93¢ per $1 |
| Gini / Inequality Index | 2,128 | 0.33 |
Earnings by Sex in Stanfield
Average Earnings in Stanfield are $38,221, $53,858 for men and $29,583 for women, a difference of 45.1%.
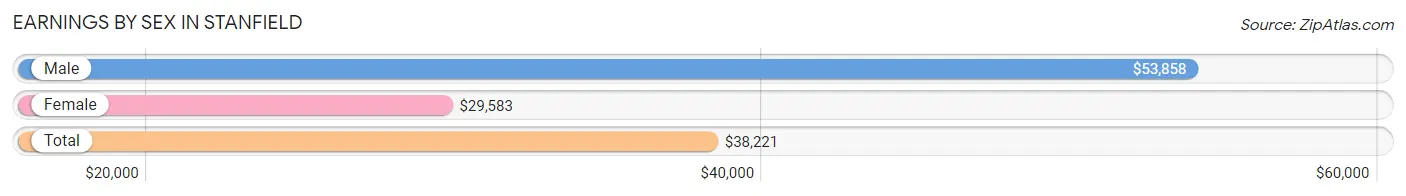
| Sex | Number | Average Earnings |
| Male | 577 (48.7%) | $53,858 |
| Female | 608 (51.3%) | $29,583 |
| Total | 1,185 (100.0%) | $38,221 |
Earnings by Sex by Income Bracket in Stanfield
The most common earnings brackets in Stanfield are $75,000 to $99,999 for men (105 | 18.2%) and $25,000 to $29,999 for women (102 | 16.8%).
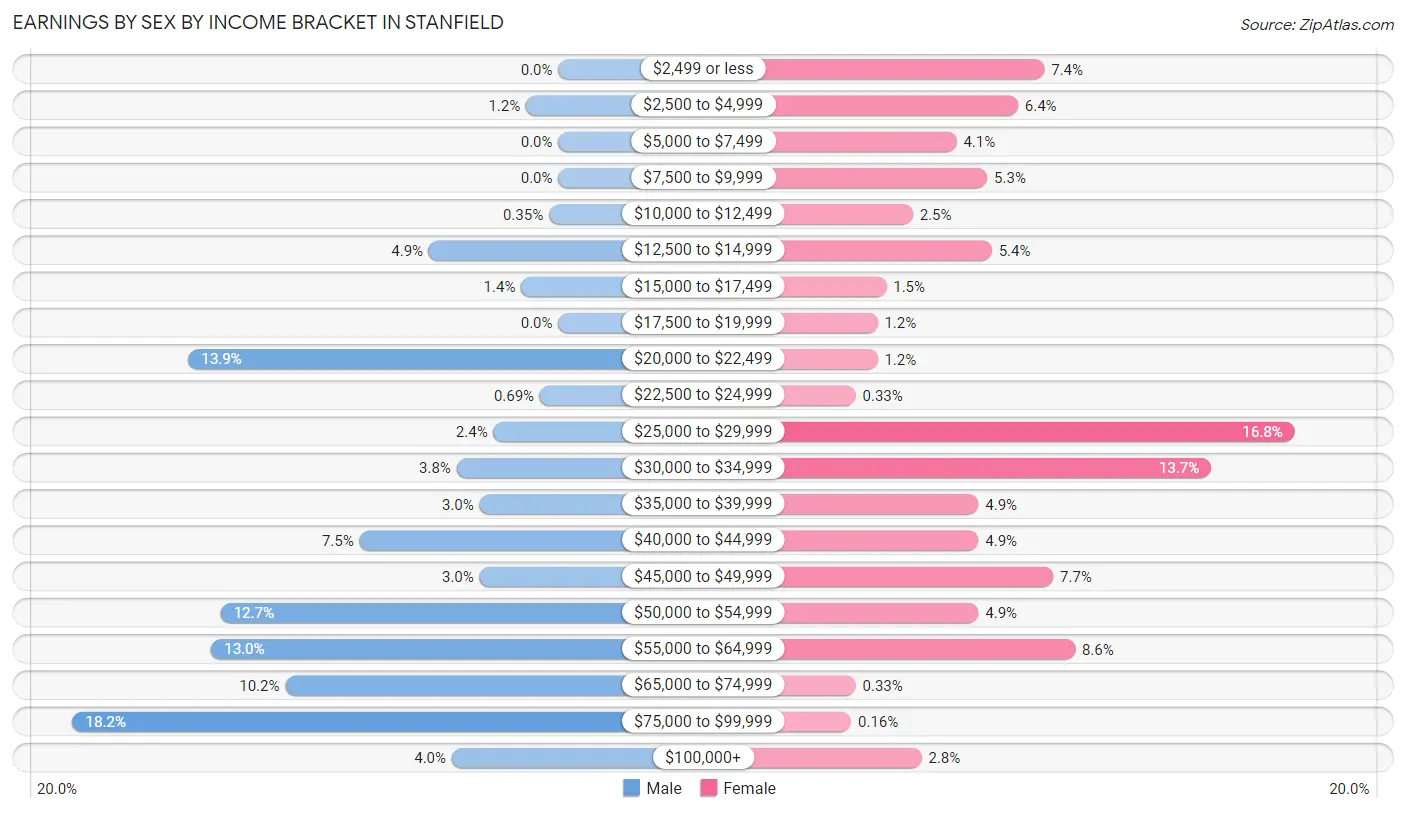
| Income | Male | Female |
| $2,499 or less | 0 (0.0%) | 45 (7.4%) |
| $2,500 to $4,999 | 7 (1.2%) | 39 (6.4%) |
| $5,000 to $7,499 | 0 (0.0%) | 25 (4.1%) |
| $7,500 to $9,999 | 0 (0.0%) | 32 (5.3%) |
| $10,000 to $12,499 | 2 (0.4%) | 15 (2.5%) |
| $12,500 to $14,999 | 28 (4.9%) | 33 (5.4%) |
| $15,000 to $17,499 | 8 (1.4%) | 9 (1.5%) |
| $17,500 to $19,999 | 0 (0.0%) | 7 (1.1%) |
| $20,000 to $22,499 | 80 (13.9%) | 7 (1.1%) |
| $22,500 to $24,999 | 4 (0.7%) | 2 (0.3%) |
| $25,000 to $29,999 | 14 (2.4%) | 102 (16.8%) |
| $30,000 to $34,999 | 22 (3.8%) | 83 (13.7%) |
| $35,000 to $39,999 | 17 (2.9%) | 30 (4.9%) |
| $40,000 to $44,999 | 43 (7.4%) | 30 (4.9%) |
| $45,000 to $49,999 | 17 (2.9%) | 47 (7.7%) |
| $50,000 to $54,999 | 73 (12.7%) | 30 (4.9%) |
| $55,000 to $64,999 | 75 (13.0%) | 52 (8.6%) |
| $65,000 to $74,999 | 59 (10.2%) | 2 (0.3%) |
| $75,000 to $99,999 | 105 (18.2%) | 1 (0.2%) |
| $100,000+ | 23 (4.0%) | 17 (2.8%) |
| Total | 577 (100.0%) | 608 (100.0%) |
Earnings by Sex by Educational Attainment in Stanfield
Average earnings in Stanfield are $54,720 for men and $31,156 for women, a difference of 43.1%. Men with an educational attainment of graduate degree enjoy the highest average annual earnings of $72,500, while those with less than high school education earn the least with $41,172. Women with an educational attainment of bachelor's degree earn the most with the average annual earnings of $49,667, while those with less than high school education have the smallest earnings of $27,208.
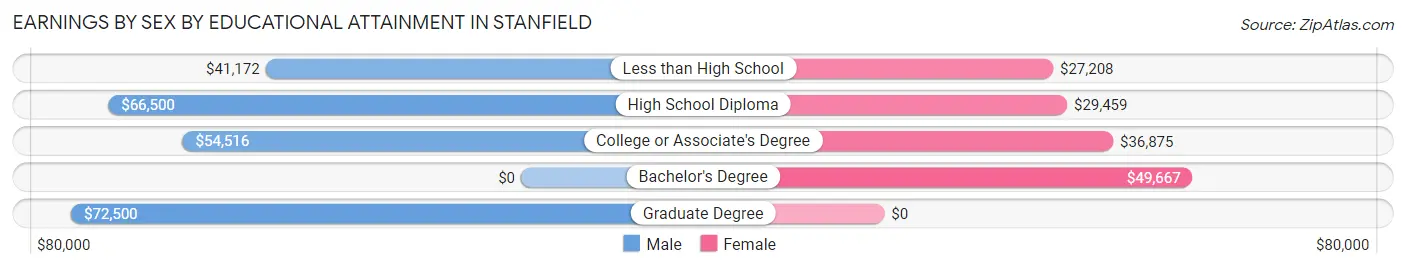
| Educational Attainment | Male Income | Female Income |
| Less than High School | $41,172 | $27,208 |
| High School Diploma | $66,500 | $29,459 |
| College or Associate's Degree | $54,516 | $36,875 |
| Bachelor's Degree | - | - |
| Graduate Degree | $72,500 | $0 |
| Total | $54,720 | $31,156 |
Family Income in Stanfield
Family Income Brackets in Stanfield
According to the Stanfield family income data, there are 169 families falling into the $50,000 to $74,999 income range, which is the most common income bracket and makes up 25.4% of all families.
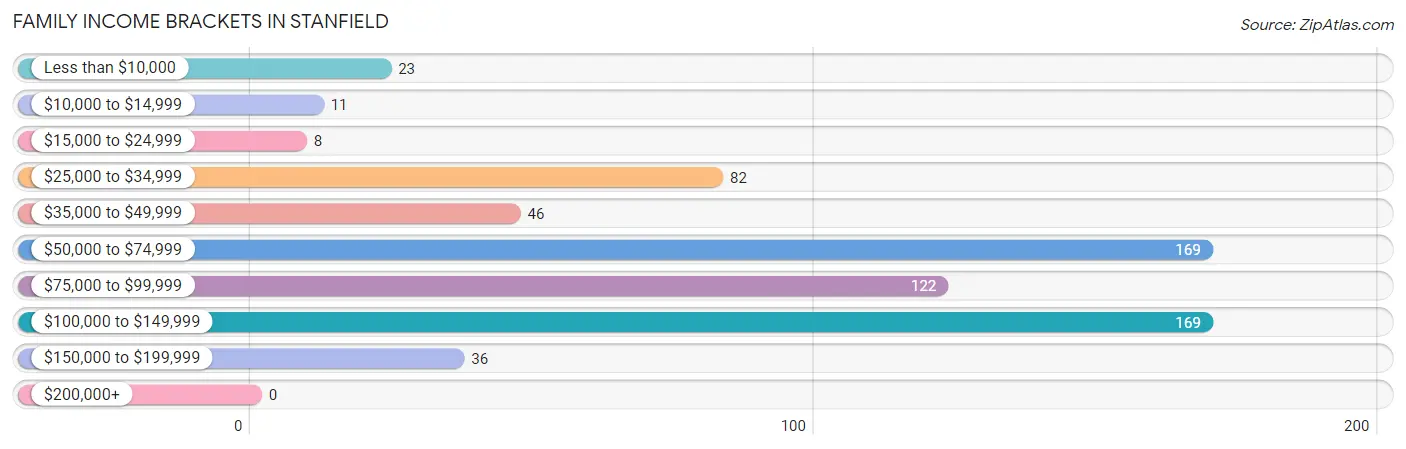
| Income Bracket | # Families | % Families |
| Less than $10,000 | 23 | 3.5% |
| $10,000 to $14,999 | 11 | 1.7% |
| $15,000 to $24,999 | 8 | 1.2% |
| $25,000 to $34,999 | 82 | 12.3% |
| $35,000 to $49,999 | 46 | 6.9% |
| $50,000 to $74,999 | 169 | 25.4% |
| $75,000 to $99,999 | 122 | 18.3% |
| $100,000 to $149,999 | 169 | 25.4% |
| $150,000 to $199,999 | 36 | 5.4% |
| $200,000+ | 0 | 0.0% |
Family Income by Famaliy Size in Stanfield
3-person families (98 | 14.7%) account for the highest median family income in Stanfield with $78,750 per family, while 2-person families (422 | 63.4%) have the highest median income of $37,857 per family member.
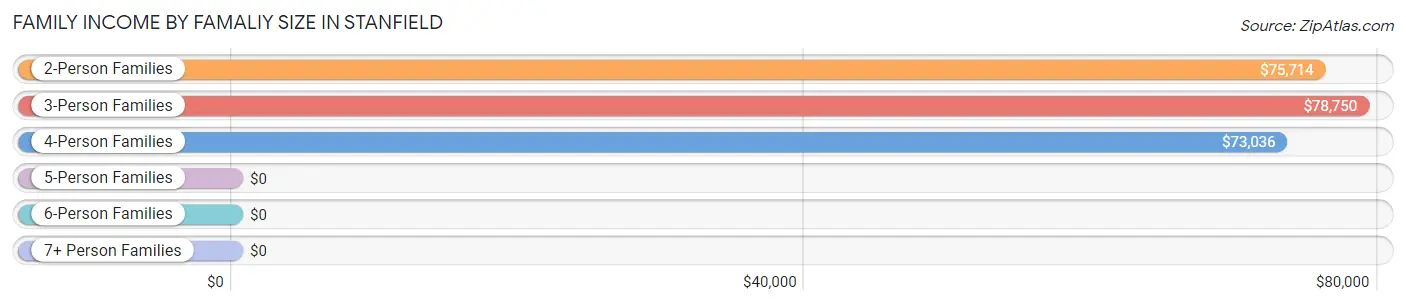
| Income Bracket | # Families | Median Income |
| 2-Person Families | 422 (63.4%) | $75,714 |
| 3-Person Families | 98 (14.7%) | $78,750 |
| 4-Person Families | 96 (14.4%) | $73,036 |
| 5-Person Families | 44 (6.6%) | $0 |
| 6-Person Families | 6 (0.9%) | $0 |
| 7+ Person Families | 0 (0.0%) | $0 |
| Total | 666 (100.0%) | $74,167 |
Family Income by Number of Earners in Stanfield
The median family income in Stanfield is $74,167, with families comprising 3+ earners (47) having the highest median family income of $130,972, while families with 1 earner (300) have the lowest median family income of $54,516, accounting for 7.1% and 45.1% of families, respectively.
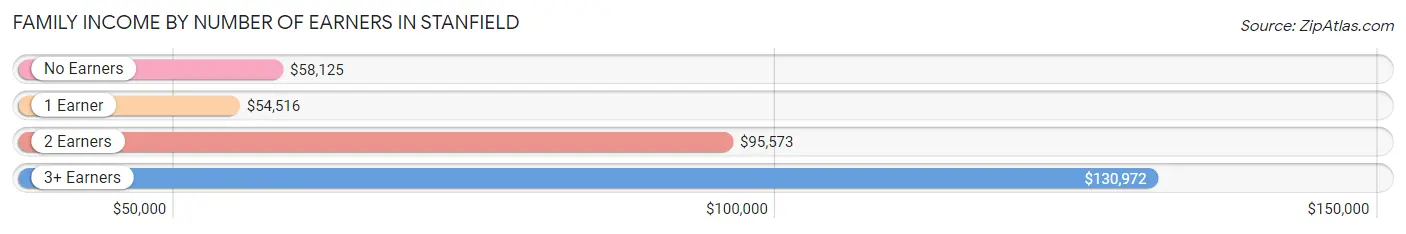
| Number of Earners | # Families | Median Income |
| No Earners | 82 (12.3%) | $58,125 |
| 1 Earner | 300 (45.1%) | $54,516 |
| 2 Earners | 237 (35.6%) | $95,573 |
| 3+ Earners | 47 (7.1%) | $130,972 |
| Total | 666 (100.0%) | $74,167 |
Household Income in Stanfield
Household Income Brackets in Stanfield
With 201 households falling in the category, the $50,000 to $74,999 income range is the most frequent in Stanfield, accounting for 23.3% of all households. In contrast, only 2 households (0.2%) fall into the $200,000+ income bracket, making it the least populous group.
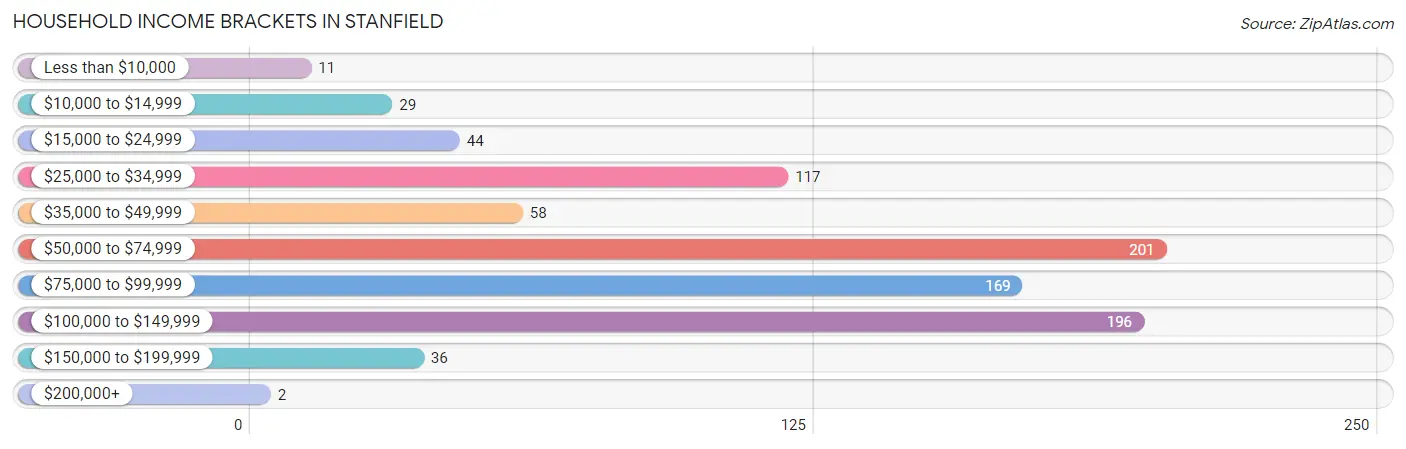
| Income Bracket | # Households | % Households |
| Less than $10,000 | 11 | 1.3% |
| $10,000 to $14,999 | 29 | 3.4% |
| $15,000 to $24,999 | 44 | 5.1% |
| $25,000 to $34,999 | 117 | 13.6% |
| $35,000 to $49,999 | 58 | 6.7% |
| $50,000 to $74,999 | 201 | 23.3% |
| $75,000 to $99,999 | 169 | 19.6% |
| $100,000 to $149,999 | 196 | 22.7% |
| $150,000 to $199,999 | 36 | 4.2% |
| $200,000+ | 2 | 0.2% |
Household Income by Householder Age in Stanfield
The median household income in Stanfield is $68,750, with the highest median household income of $89,118 found in the 45 to 64 years age bracket for the primary householder. A total of 390 households (45.2%) fall into this category. Meanwhile, the 15 to 24 years age bracket for the primary householder has the lowest median household income of $0, with 15 households (1.7%) in this group.
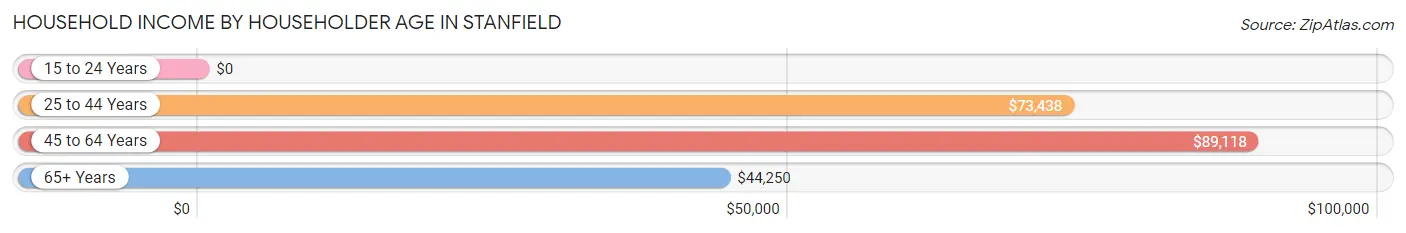
| Income Bracket | # Households | Median Income |
| 15 to 24 Years | 15 (1.7%) | $0 |
| 25 to 44 Years | 264 (30.6%) | $73,438 |
| 45 to 64 Years | 390 (45.2%) | $89,118 |
| 65+ Years | 194 (22.5%) | $44,250 |
| Total | 863 (100.0%) | $68,750 |
Poverty in Stanfield
Income Below Poverty by Sex and Age in Stanfield
With 7.4% poverty level for males and 13.0% for females among the residents of Stanfield, under 5 year old males and 15 year old females are the most vulnerable to poverty, with 61 males (57.0%) and 5 females (83.3%) in their respective age groups living below the poverty level.
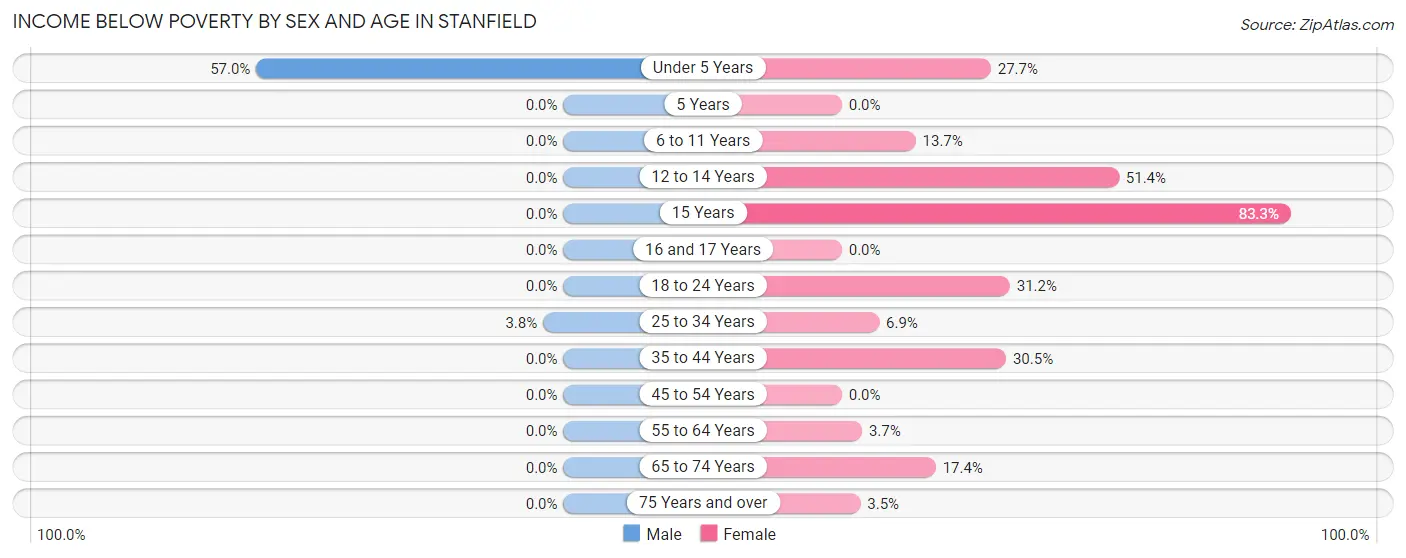
| Age Bracket | Male | Female |
| Under 5 Years | 61 (57.0%) | 13 (27.7%) |
| 5 Years | 0 (0.0%) | 0 (0.0%) |
| 6 to 11 Years | 0 (0.0%) | 10 (13.7%) |
| 12 to 14 Years | 0 (0.0%) | 18 (51.4%) |
| 15 Years | 0 (0.0%) | 5 (83.3%) |
| 16 and 17 Years | 0 (0.0%) | 0 (0.0%) |
| 18 to 24 Years | 0 (0.0%) | 34 (31.2%) |
| 25 to 34 Years | 7 (3.8%) | 16 (6.9%) |
| 35 to 44 Years | 0 (0.0%) | 32 (30.5%) |
| 45 to 54 Years | 0 (0.0%) | 0 (0.0%) |
| 55 to 64 Years | 0 (0.0%) | 7 (3.7%) |
| 65 to 74 Years | 0 (0.0%) | 19 (17.4%) |
| 75 Years and over | 0 (0.0%) | 3 (3.5%) |
| Total | 68 (7.4%) | 157 (13.0%) |
Income Above Poverty by Sex and Age in Stanfield
According to the poverty statistics in Stanfield, males aged 6 to 11 years and females aged 5 years are the age groups that are most secure financially, with 100.0% of males and 100.0% of females in these age groups living above the poverty line.
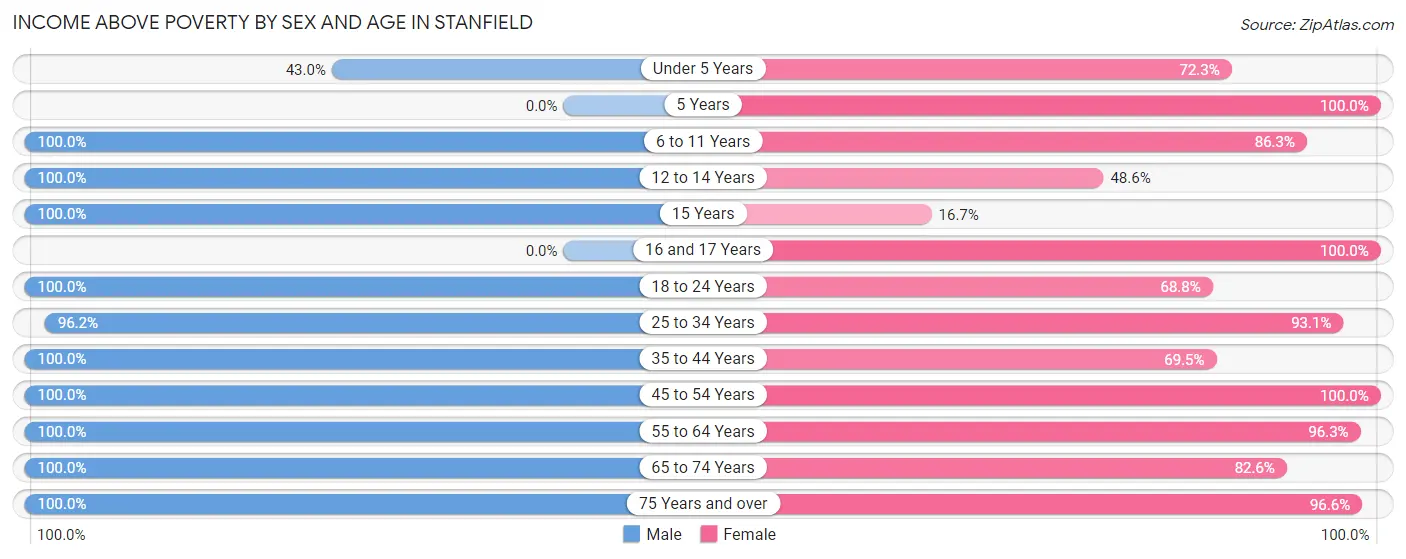
| Age Bracket | Male | Female |
| Under 5 Years | 46 (43.0%) | 34 (72.3%) |
| 5 Years | 0 (0.0%) | 23 (100.0%) |
| 6 to 11 Years | 42 (100.0%) | 63 (86.3%) |
| 12 to 14 Years | 13 (100.0%) | 17 (48.6%) |
| 15 Years | 3 (100.0%) | 1 (16.7%) |
| 16 and 17 Years | 0 (0.0%) | 18 (100.0%) |
| 18 to 24 Years | 78 (100.0%) | 75 (68.8%) |
| 25 to 34 Years | 179 (96.2%) | 215 (93.1%) |
| 35 to 44 Years | 80 (100.0%) | 73 (69.5%) |
| 45 to 54 Years | 106 (100.0%) | 174 (100.0%) |
| 55 to 64 Years | 192 (100.0%) | 180 (96.3%) |
| 65 to 74 Years | 62 (100.0%) | 90 (82.6%) |
| 75 Years and over | 55 (100.0%) | 84 (96.6%) |
| Total | 856 (92.6%) | 1,047 (87.0%) |
Income Below Poverty Among Married-Couple Families in Stanfield
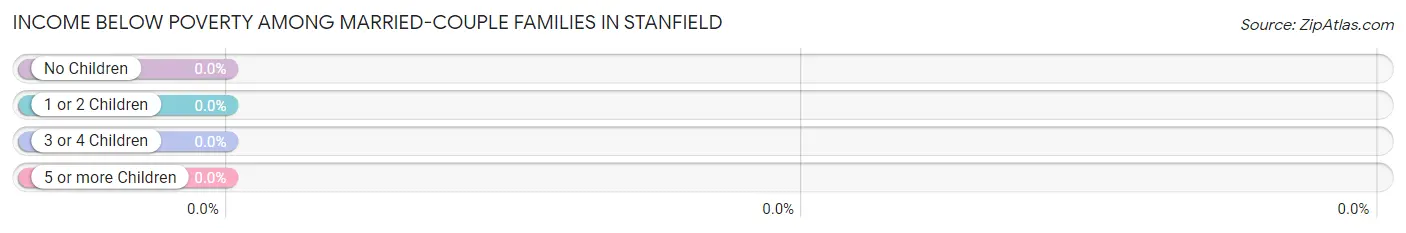
| Children | Above Poverty | Below Poverty |
| No Children | 357 (100.0%) | 0 (0.0%) |
| 1 or 2 Children | 114 (100.0%) | 0 (0.0%) |
| 3 or 4 Children | 6 (100.0%) | 0 (0.0%) |
| 5 or more Children | 0 (0.0%) | 0 (0.0%) |
| Total | 477 (100.0%) | 0 (0.0%) |
Income Below Poverty Among Single-Parent Households in Stanfield
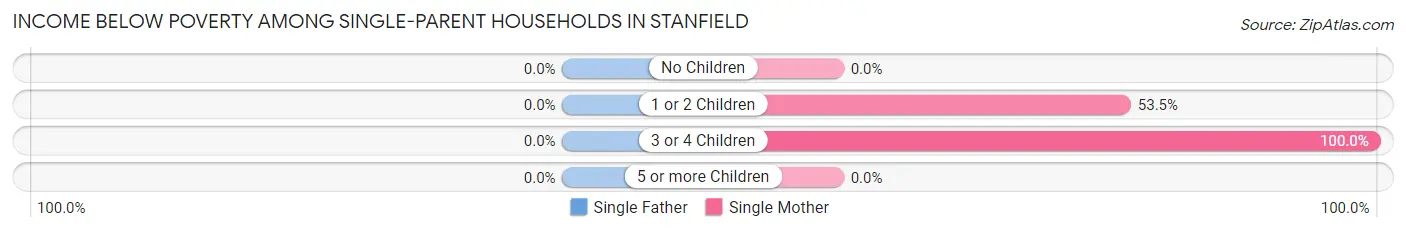
| Children | Single Father | Single Mother |
| No Children | 0 (0.0%) | 0 (0.0%) |
| 1 or 2 Children | 0 (0.0%) | 23 (53.5%) |
| 3 or 4 Children | 0 (0.0%) | 19 (100.0%) |
| 5 or more Children | 0 (0.0%) | 0 (0.0%) |
| Total | 0 (0.0%) | 42 (31.6%) |
Income Below Poverty Among Married-Couple vs Single-Parent Households in Stanfield
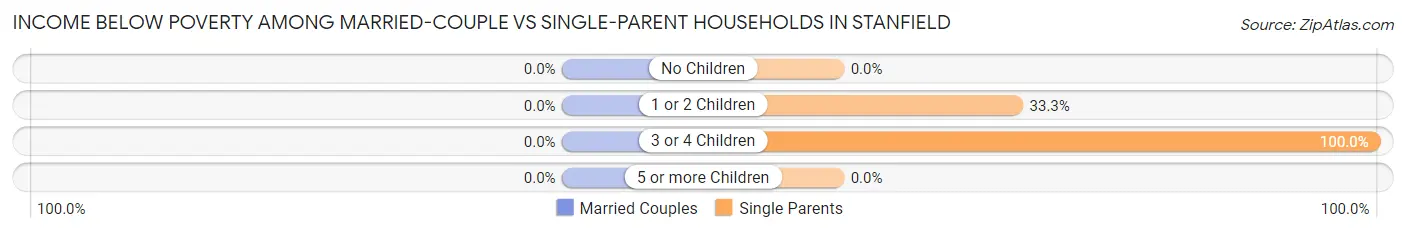
| Children | Married-Couple Families | Single-Parent Households |
| No Children | 0 (0.0%) | 0 (0.0%) |
| 1 or 2 Children | 0 (0.0%) | 23 (33.3%) |
| 3 or 4 Children | 0 (0.0%) | 19 (100.0%) |
| 5 or more Children | 0 (0.0%) | 0 (0.0%) |
| Total | 0 (0.0%) | 42 (22.2%) |
Race in Stanfield
The most populous races in Stanfield are White / Caucasian (1,490 | 70.0%), Hispanic or Latino (936 | 44.0%), and Two or more Races (427 | 20.1%).
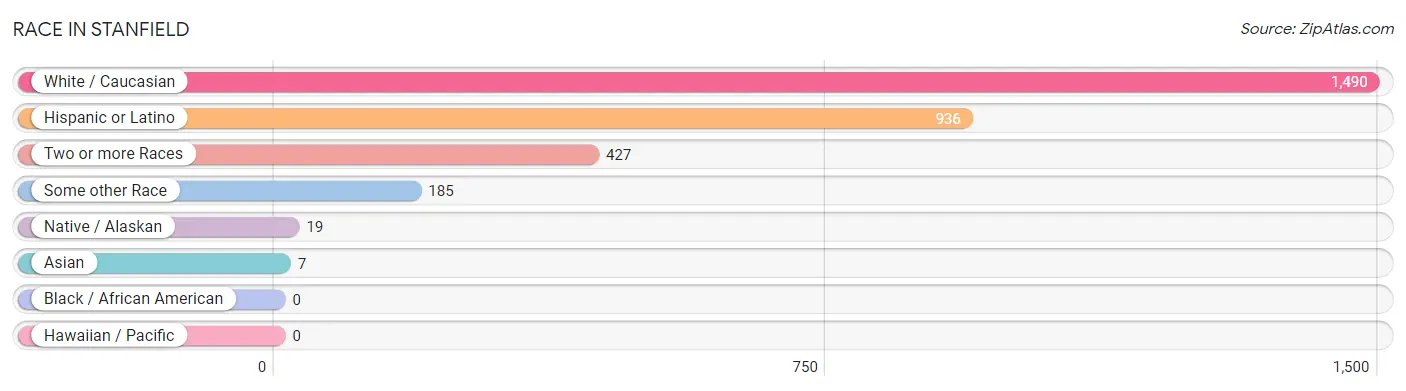
| Race | # Population | % Population |
| Asian | 7 | 0.3% |
| Black / African American | 0 | 0.0% |
| Hawaiian / Pacific | 0 | 0.0% |
| Hispanic or Latino | 936 | 44.0% |
| Native / Alaskan | 19 | 0.9% |
| White / Caucasian | 1,490 | 70.0% |
| Two or more Races | 427 | 20.1% |
| Some other Race | 185 | 8.7% |
| Total | 2,128 | 100.0% |
Ancestry in Stanfield
The most populous ancestries reported in Stanfield are Mexican (903 | 42.4%), Irish (183 | 8.6%), American (156 | 7.3%), German (97 | 4.6%), and English (79 | 3.7%), together accounting for 66.6% of all Stanfield residents.
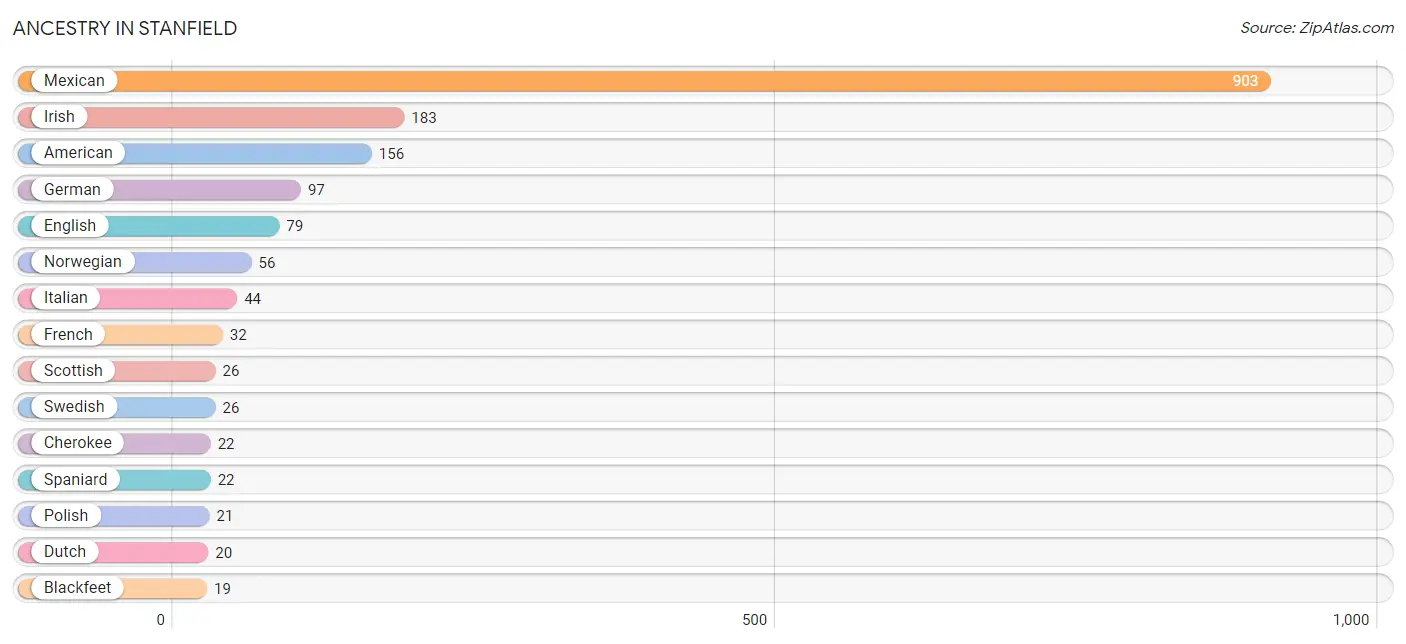
| Ancestry | # Population | % Population |
| Alaska Native | 6 | 0.3% |
| American | 156 | 7.3% |
| Apache | 17 | 0.8% |
| Austrian | 13 | 0.6% |
| Blackfeet | 19 | 0.9% |
| Burmese | 5 | 0.2% |
| Cherokee | 22 | 1.0% |
| Chilean | 11 | 0.5% |
| Choctaw | 7 | 0.3% |
| Dutch | 20 | 0.9% |
| Eastern European | 8 | 0.4% |
| English | 79 | 3.7% |
| European | 3 | 0.1% |
| French | 32 | 1.5% |
| German | 97 | 4.6% |
| Hungarian | 8 | 0.4% |
| Irish | 183 | 8.6% |
| Italian | 44 | 2.1% |
| Korean | 1 | 0.1% |
| Malaysian | 1 | 0.1% |
| Mexican | 903 | 42.4% |
| Northern European | 1 | 0.1% |
| Norwegian | 56 | 2.6% |
| Polish | 21 | 1.0% |
| Scandinavian | 3 | 0.1% |
| Scotch-Irish | 12 | 0.6% |
| Scottish | 26 | 1.2% |
| South American | 11 | 0.5% |
| Spaniard | 22 | 1.0% |
| Swedish | 26 | 1.2% |
| Swiss | 4 | 0.2% |
| Welsh | 8 | 0.4% | View All 32 Rows |
Immigrants in Stanfield
The most numerous immigrant groups reported in Stanfield came from Latin America (353 | 16.6%), Central America (342 | 16.1%), Mexico (342 | 16.1%), Chile (11 | 0.5%), and South America (11 | 0.5%), together accounting for 49.8% of all Stanfield residents.
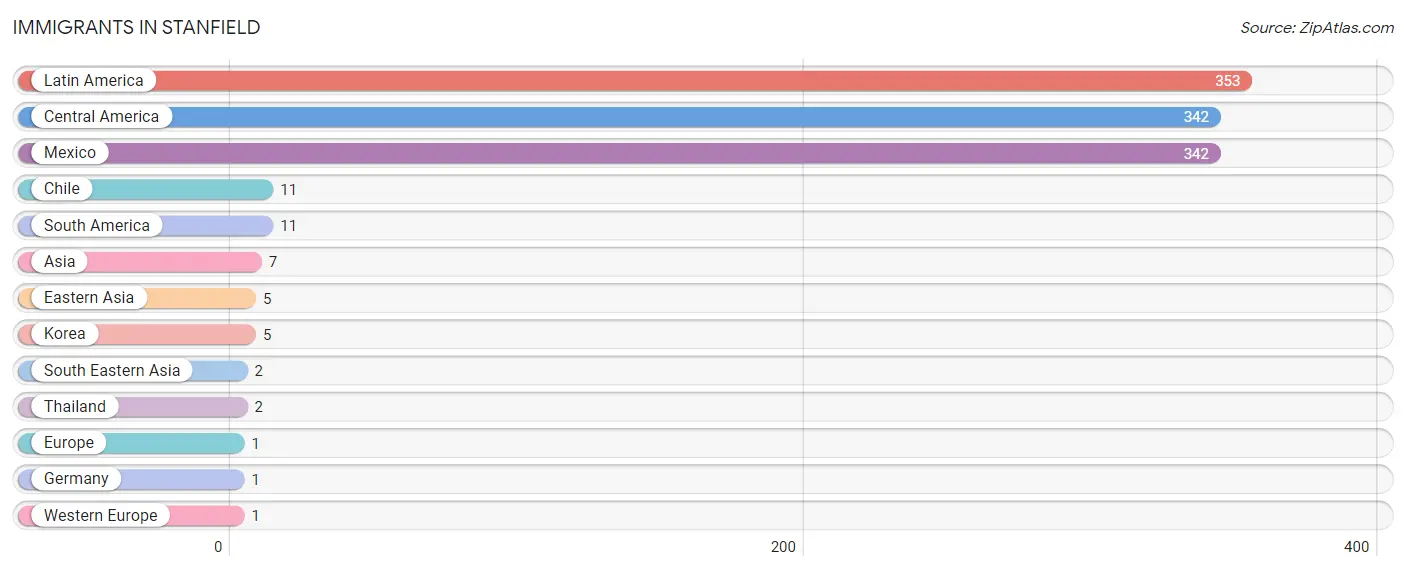
| Immigration Origin | # Population | % Population |
| Asia | 7 | 0.3% |
| Central America | 342 | 16.1% |
| Chile | 11 | 0.5% |
| Eastern Asia | 5 | 0.2% |
| Europe | 1 | 0.1% |
| Germany | 1 | 0.1% |
| Korea | 5 | 0.2% |
| Latin America | 353 | 16.6% |
| Mexico | 342 | 16.1% |
| South America | 11 | 0.5% |
| South Eastern Asia | 2 | 0.1% |
| Thailand | 2 | 0.1% |
| Western Europe | 1 | 0.1% | View All 13 Rows |
Sex and Age in Stanfield
Sex and Age in Stanfield
The most populous age groups in Stanfield are 25 to 29 Years (122 | 13.2%) for men and 25 to 29 Years (165 | 13.7%) for women.
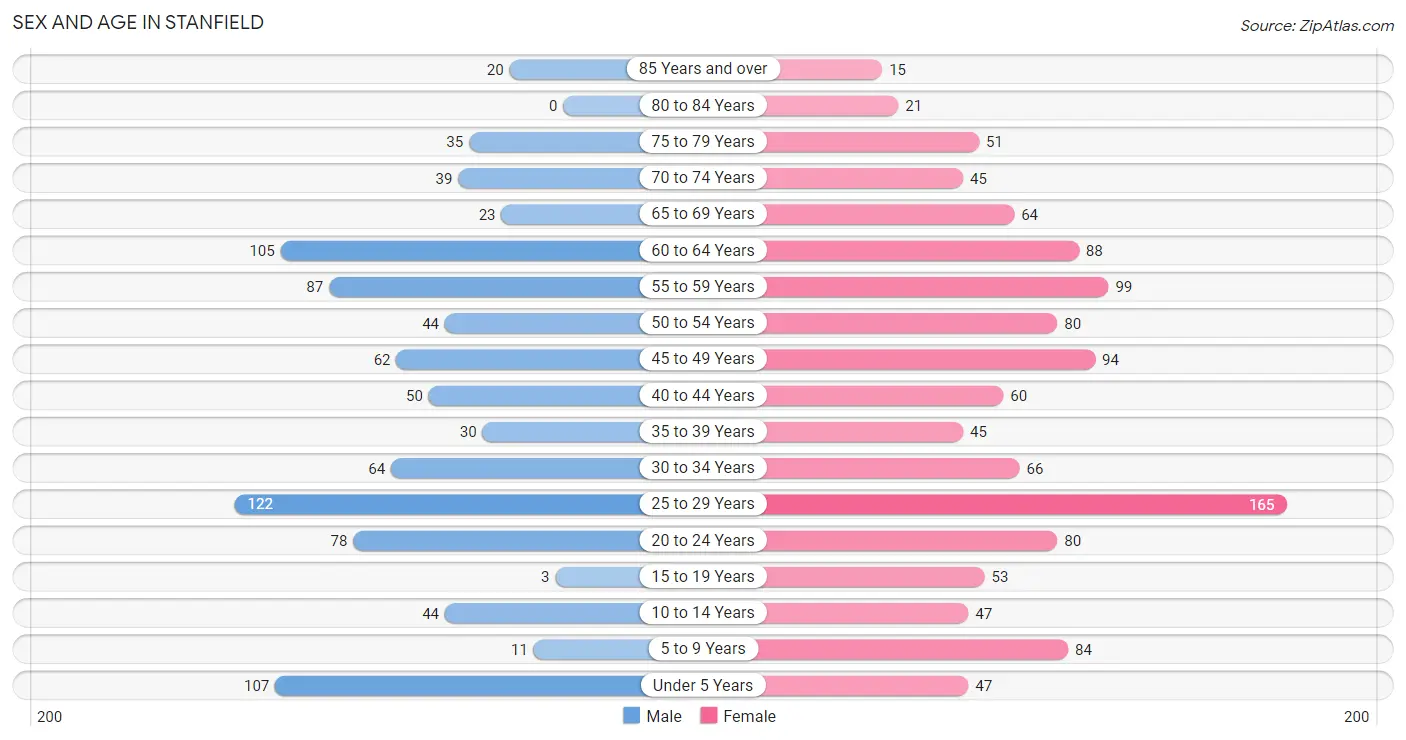
| Age Bracket | Male | Female |
| Under 5 Years | 107 (11.6%) | 47 (3.9%) |
| 5 to 9 Years | 11 (1.2%) | 84 (7.0%) |
| 10 to 14 Years | 44 (4.8%) | 47 (3.9%) |
| 15 to 19 Years | 3 (0.3%) | 53 (4.4%) |
| 20 to 24 Years | 78 (8.4%) | 80 (6.6%) |
| 25 to 29 Years | 122 (13.2%) | 165 (13.7%) |
| 30 to 34 Years | 64 (6.9%) | 66 (5.5%) |
| 35 to 39 Years | 30 (3.3%) | 45 (3.7%) |
| 40 to 44 Years | 50 (5.4%) | 60 (5.0%) |
| 45 to 49 Years | 62 (6.7%) | 94 (7.8%) |
| 50 to 54 Years | 44 (4.8%) | 80 (6.6%) |
| 55 to 59 Years | 87 (9.4%) | 99 (8.2%) |
| 60 to 64 Years | 105 (11.4%) | 88 (7.3%) |
| 65 to 69 Years | 23 (2.5%) | 64 (5.3%) |
| 70 to 74 Years | 39 (4.2%) | 45 (3.7%) |
| 75 to 79 Years | 35 (3.8%) | 51 (4.2%) |
| 80 to 84 Years | 0 (0.0%) | 21 (1.7%) |
| 85 Years and over | 20 (2.2%) | 15 (1.3%) |
| Total | 924 (100.0%) | 1,204 (100.0%) |
Families and Households in Stanfield
Median Family Size in Stanfield
The median family size in Stanfield is 2.71 persons per family, with single female/mother families (133 | 20.0%) accounting for the largest median family size of 3.02 persons per family. On the other hand, single male/father families (56 | 8.4%) represent the smallest median family size with 2.29 persons per family.
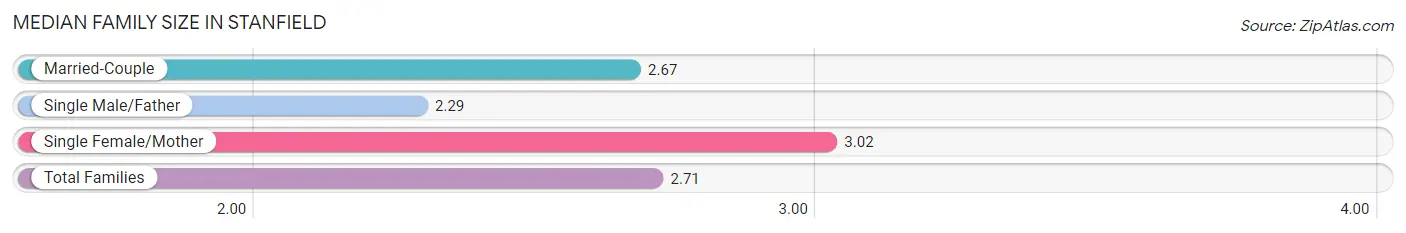
| Family Type | # Families | Family Size |
| Married-Couple | 477 (71.6%) | 2.67 |
| Single Male/Father | 56 (8.4%) | 2.29 |
| Single Female/Mother | 133 (20.0%) | 3.02 |
| Total Families | 666 (100.0%) | 2.71 |
Median Household Size in Stanfield
The median household size in Stanfield is 2.47 persons per household, with single female/mother households (133 | 15.4%) accounting for the largest median household size of 3.3 persons per household. non-family households (197 | 22.8%) represent the smallest median household size with 1.25 persons per household.
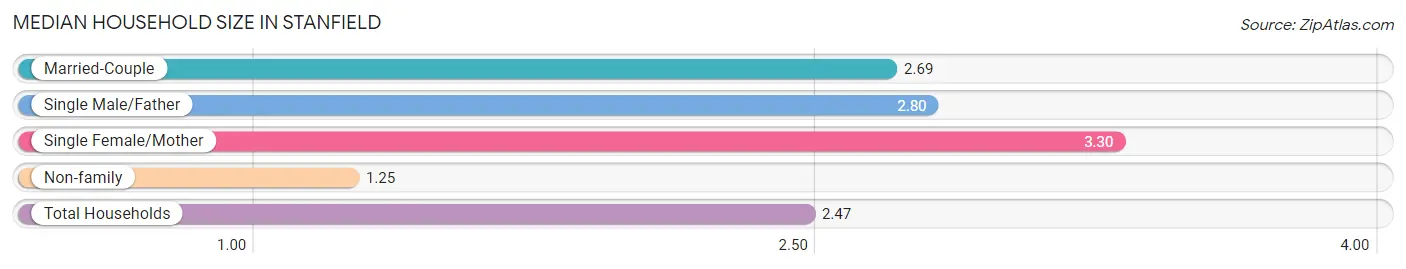
| Household Type | # Households | Household Size |
| Married-Couple | 477 (55.3%) | 2.69 |
| Single Male/Father | 56 (6.5%) | 2.80 |
| Single Female/Mother | 133 (15.4%) | 3.30 |
| Non-family | 197 (22.8%) | 1.25 |
| Total Households | 863 (100.0%) | 2.47 |
Household Size by Marriage Status in Stanfield
Out of a total of 863 households in Stanfield, 666 (77.2%) are family households, while 197 (22.8%) are nonfamily households. The most numerous type of family households are 2-person households, comprising 385, and the most common type of nonfamily households are 1-person households, comprising 136.
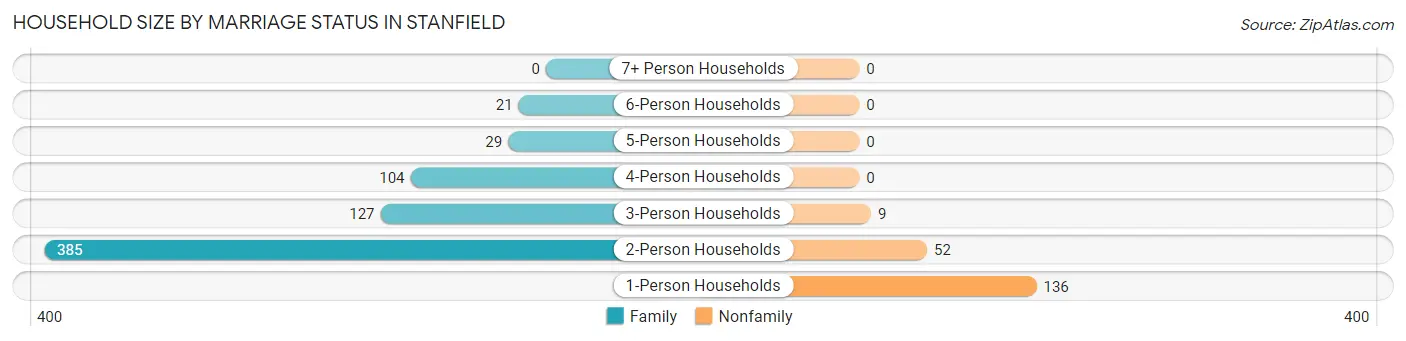
| Household Size | Family Households | Nonfamily Households |
| 1-Person Households | - | 136 (15.8%) |
| 2-Person Households | 385 (44.6%) | 52 (6.0%) |
| 3-Person Households | 127 (14.7%) | 9 (1.0%) |
| 4-Person Households | 104 (12.0%) | 0 (0.0%) |
| 5-Person Households | 29 (3.4%) | 0 (0.0%) |
| 6-Person Households | 21 (2.4%) | 0 (0.0%) |
| 7+ Person Households | 0 (0.0%) | 0 (0.0%) |
| Total | 666 (77.2%) | 197 (22.8%) |
Female Fertility in Stanfield
Fertility by Age in Stanfield
Average fertility rate in Stanfield is 199.0 births per 1,000 women. Women in the age bracket of 15 to 19 years have the highest fertility rate with 358.0 births per 1,000 women. Women in the age bracket of 20 to 34 years acount for 76.8% of all women with births.
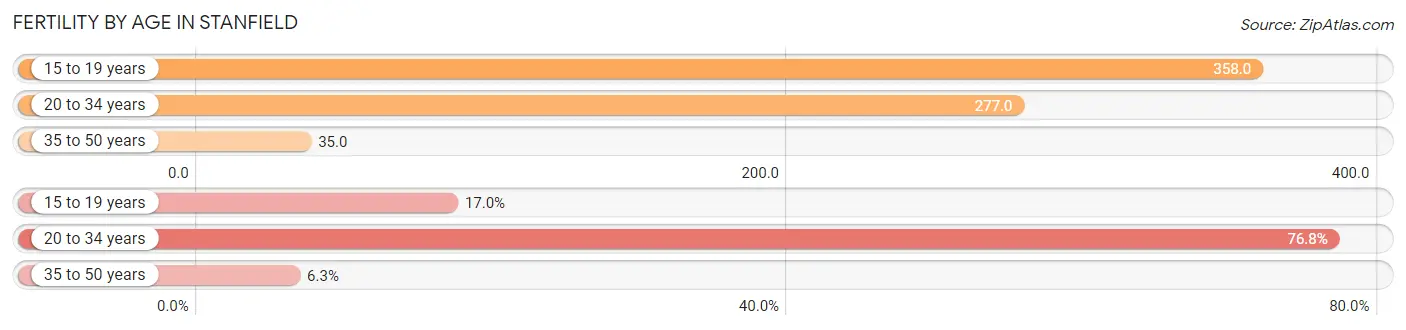
| Age Bracket | Women with Births | Births / 1,000 Women |
| 15 to 19 years | 19 (17.0%) | 358.0 |
| 20 to 34 years | 86 (76.8%) | 277.0 |
| 35 to 50 years | 7 (6.2%) | 35.0 |
| Total | 112 (100.0%) | 199.0 |
Fertility by Age by Marriage Status in Stanfield
63.4% of women with births (112) in Stanfield are married. The highest percentage of unmarried women with births falls into 15 to 19 years age bracket with 100.0% of them unmarried at the time of birth, while the lowest percentage of unmarried women with births belong to 20 to 34 years age bracket with 17.4% of them unmarried.
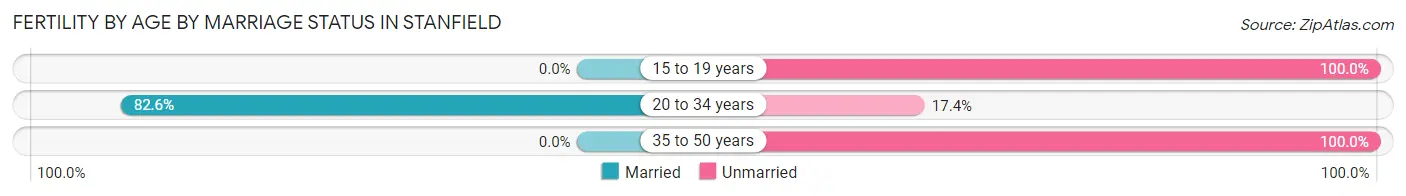
| Age Bracket | Married | Unmarried |
| 15 to 19 years | 0 (0.0%) | 19 (100.0%) |
| 20 to 34 years | 71 (82.6%) | 15 (17.4%) |
| 35 to 50 years | 0 (0.0%) | 7 (100.0%) |
| Total | 71 (63.4%) | 41 (36.6%) |
Fertility by Education in Stanfield
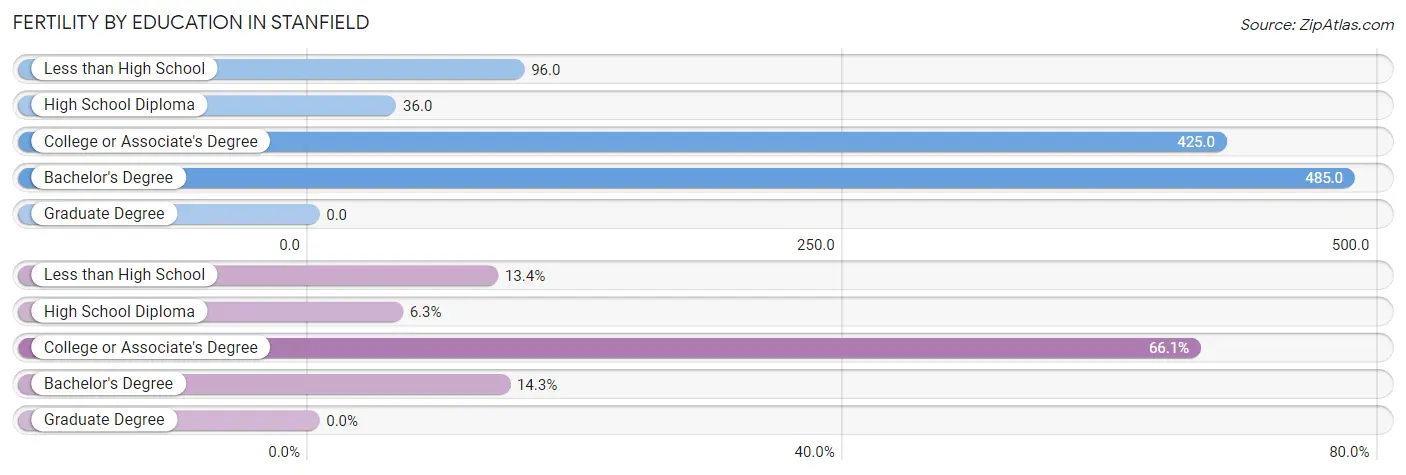
| Educational Attainment | Women with Births | Births / 1,000 Women |
| Less than High School | 15 (13.4%) | 96.0 |
| High School Diploma | 7 (6.2%) | 36.0 |
| College or Associate's Degree | 74 (66.1%) | 425.0 |
| Bachelor's Degree | 16 (14.3%) | 485.0 |
| Graduate Degree | 0 (0.0%) | 0.0 |
| Total | 112 (100.0%) | 199.0 |
Fertility by Education by Marriage Status in Stanfield
36.6% of women with births in Stanfield are unmarried. Women with the educational attainment of bachelor's degree are most likely to be married with 100.0% of them married at childbirth, while women with the educational attainment of less than high school are least likely to be married with 100.0% of them unmarried at childbirth.
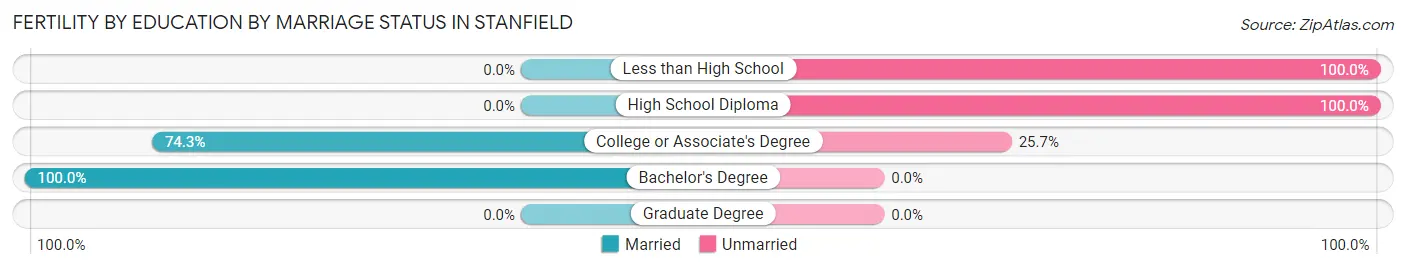
| Educational Attainment | Married | Unmarried |
| Less than High School | 0 (0.0%) | 15 (100.0%) |
| High School Diploma | 0 (0.0%) | 7 (100.0%) |
| College or Associate's Degree | 55 (74.3%) | 19 (25.7%) |
| Bachelor's Degree | 16 (100.0%) | 0 (0.0%) |
| Graduate Degree | 0 (0.0%) | 0 (0.0%) |
| Total | 71 (63.4%) | 41 (36.6%) |
Employment Characteristics in Stanfield
Employment by Class of Employer in Stanfield
Among the 972 employed individuals in Stanfield, private company employees (762 | 78.4%), state government employees (59 | 6.1%), and local government employees (53 | 5.4%) make up the most common classes of employment.
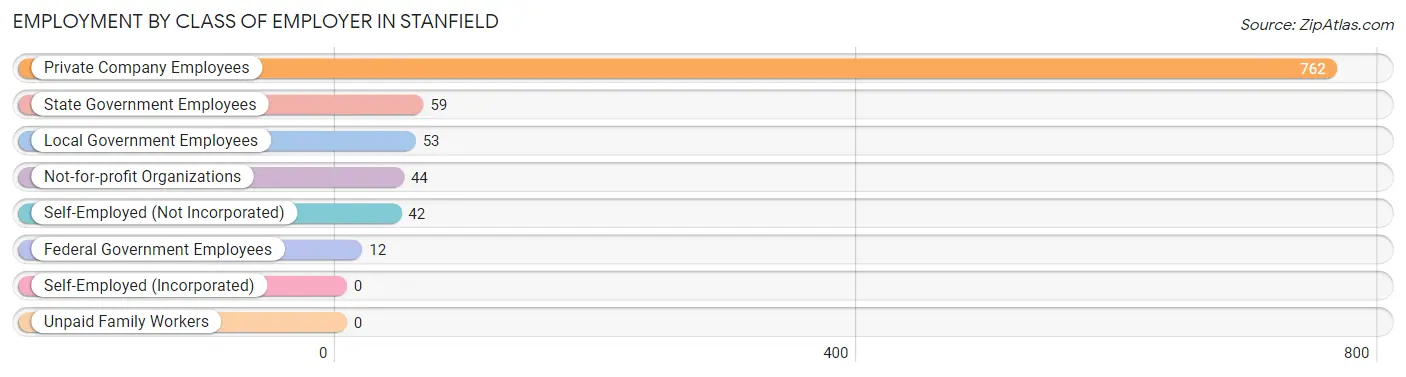
| Employer Class | # Employees | % Employees |
| Private Company Employees | 762 | 78.4% |
| Self-Employed (Incorporated) | 0 | 0.0% |
| Self-Employed (Not Incorporated) | 42 | 4.3% |
| Not-for-profit Organizations | 44 | 4.5% |
| Local Government Employees | 53 | 5.4% |
| State Government Employees | 59 | 6.1% |
| Federal Government Employees | 12 | 1.2% |
| Unpaid Family Workers | 0 | 0.0% |
| Total | 972 | 100.0% |
Employment Status by Age in Stanfield
According to the labor force statistics for Stanfield, out of the total population over 16 years of age (1,779), 60.9% or 1,083 individuals are in the labor force, with 6.7% or 73 of them unemployed. The age group with the highest labor force participation rate is 20 to 24 years, with 100.0% or 158 individuals in the labor force. Within the labor force, the 35 to 44 years age range has the highest percentage of unemployed individuals, with 12.2% or 17 of them being unemployed.
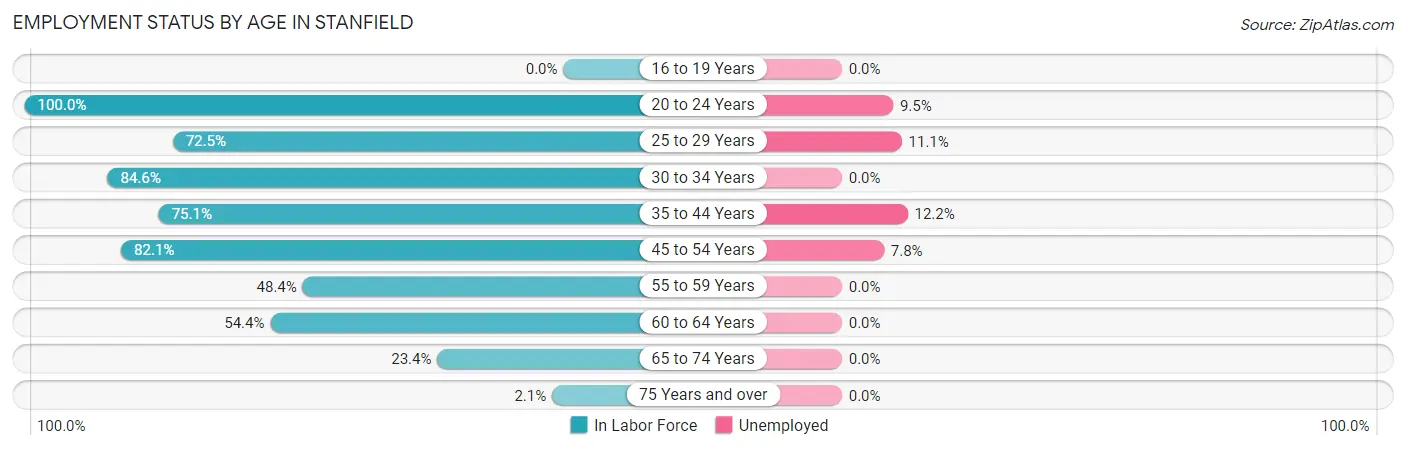
| Age Bracket | In Labor Force | Unemployed |
| 16 to 19 Years | 0 (0.0%) | 0 (0.0%) |
| 20 to 24 Years | 158 (100.0%) | 15 (9.5%) |
| 25 to 29 Years | 208 (72.5%) | 23 (11.1%) |
| 30 to 34 Years | 110 (84.6%) | 0 (0.0%) |
| 35 to 44 Years | 139 (75.1%) | 17 (12.2%) |
| 45 to 54 Years | 230 (82.1%) | 18 (7.8%) |
| 55 to 59 Years | 90 (48.4%) | 0 (0.0%) |
| 60 to 64 Years | 105 (54.4%) | 0 (0.0%) |
| 65 to 74 Years | 40 (23.4%) | 0 (0.0%) |
| 75 Years and over | 3 (2.1%) | 0 (0.0%) |
| Total | 1,083 (60.9%) | 73 (6.7%) |
Employment Status by Educational Attainment in Stanfield
According to labor force statistics for Stanfield, 69.9% of individuals (881) out of the total population between 25 and 64 years of age (1,261) are in the labor force, with 6.6% or 58 of them being unemployed. The group with the highest labor force participation rate are those with the educational attainment of bachelor's degree or higher, with 95.7% or 66 individuals in the labor force. Within the labor force, individuals with high school diploma education have the highest percentage of unemployment, with 7.9% or 31 of them being unemployed.
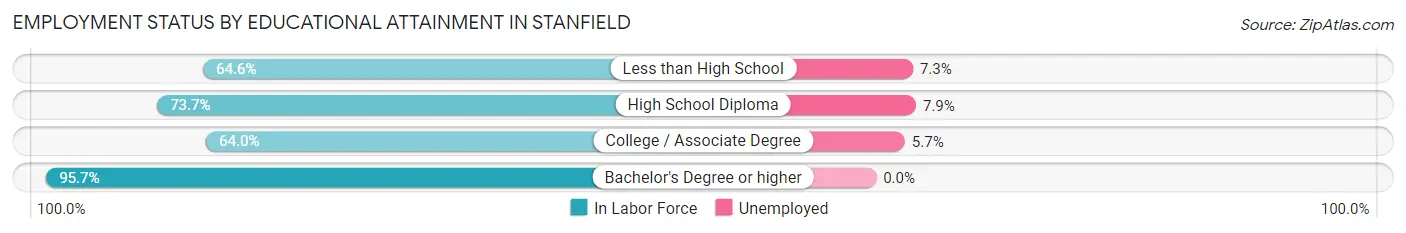
| Educational Attainment | In Labor Force | Unemployed |
| Less than High School | 179 (64.6%) | 20 (7.3%) |
| High School Diploma | 392 (73.7%) | 42 (7.9%) |
| College / Associate Degree | 245 (64.0%) | 22 (5.7%) |
| Bachelor's Degree or higher | 66 (95.7%) | 0 (0.0%) |
| Total | 881 (69.9%) | 83 (6.6%) |
Employment Occupations by Sex in Stanfield
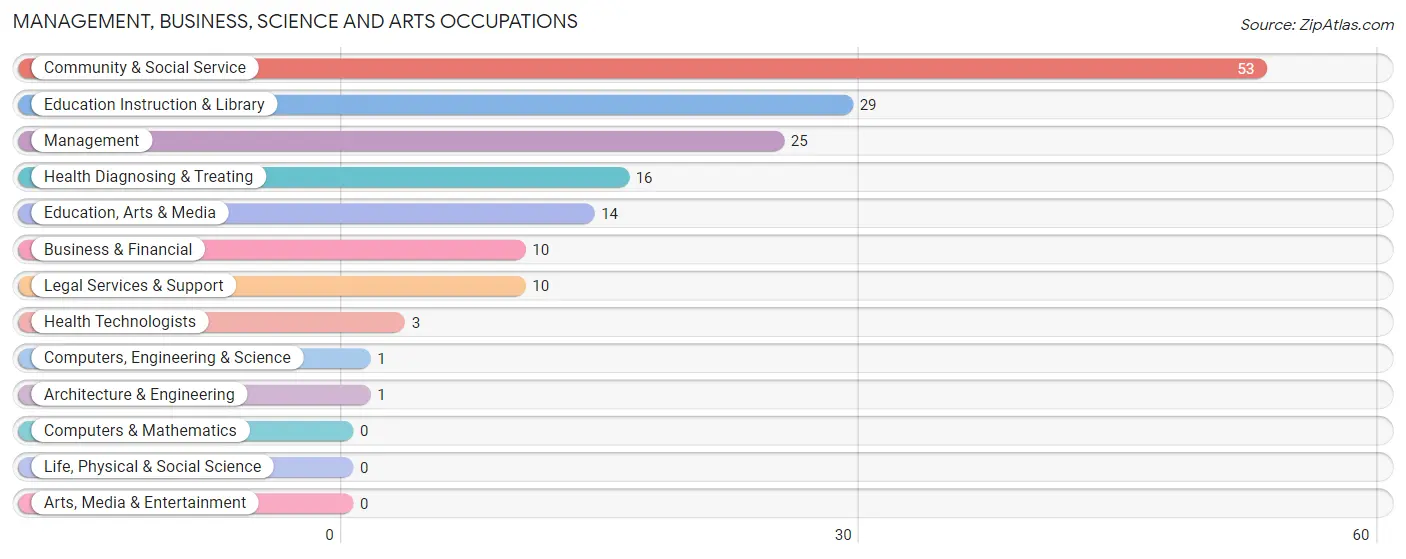
Management, Business, Science and Arts Occupations
The most common Management, Business, Science and Arts occupations in Stanfield are Community & Social Service (53 | 5.2%), Education Instruction & Library (29 | 2.9%), Management (25 | 2.5%), Health Diagnosing & Treating (16 | 1.6%), and Education, Arts & Media (14 | 1.4%).
Management, Business, Science and Arts Occupations by Sex
Within the Management, Business, Science and Arts occupations in Stanfield, the most male-oriented occupations are Computers, Engineering & Science (100.0%), Architecture & Engineering (100.0%), and Management (92.0%), while the most female-oriented occupations are Business & Financial (100.0%), Legal Services & Support (100.0%), and Health Diagnosing & Treating (100.0%).
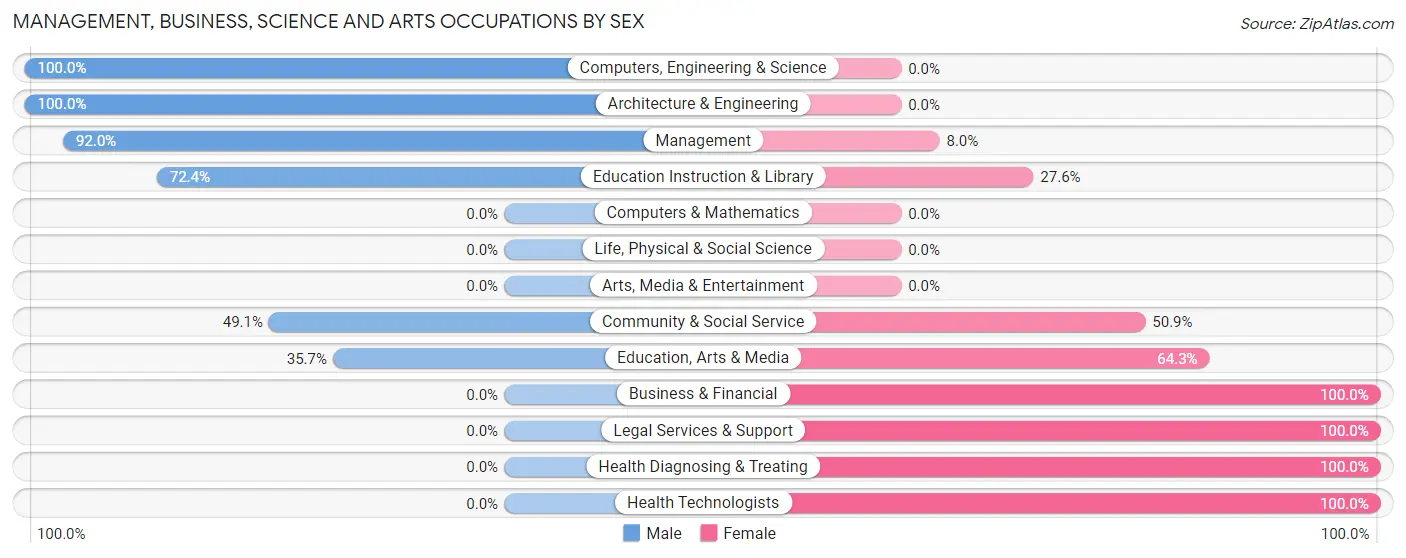
| Occupation | Male | Female |
| Management | 23 (92.0%) | 2 (8.0%) |
| Business & Financial | 0 (0.0%) | 10 (100.0%) |
| Computers, Engineering & Science | 1 (100.0%) | 0 (0.0%) |
| Computers & Mathematics | 0 (0.0%) | 0 (0.0%) |
| Architecture & Engineering | 1 (100.0%) | 0 (0.0%) |
| Life, Physical & Social Science | 0 (0.0%) | 0 (0.0%) |
| Community & Social Service | 26 (49.1%) | 27 (50.9%) |
| Education, Arts & Media | 5 (35.7%) | 9 (64.3%) |
| Legal Services & Support | 0 (0.0%) | 10 (100.0%) |
| Education Instruction & Library | 21 (72.4%) | 8 (27.6%) |
| Arts, Media & Entertainment | 0 (0.0%) | 0 (0.0%) |
| Health Diagnosing & Treating | 0 (0.0%) | 16 (100.0%) |
| Health Technologists | 0 (0.0%) | 3 (100.0%) |
| Total (Category) | 50 (47.6%) | 55 (52.4%) |
| Total (Overall) | 553 (54.7%) | 457 (45.3%) |
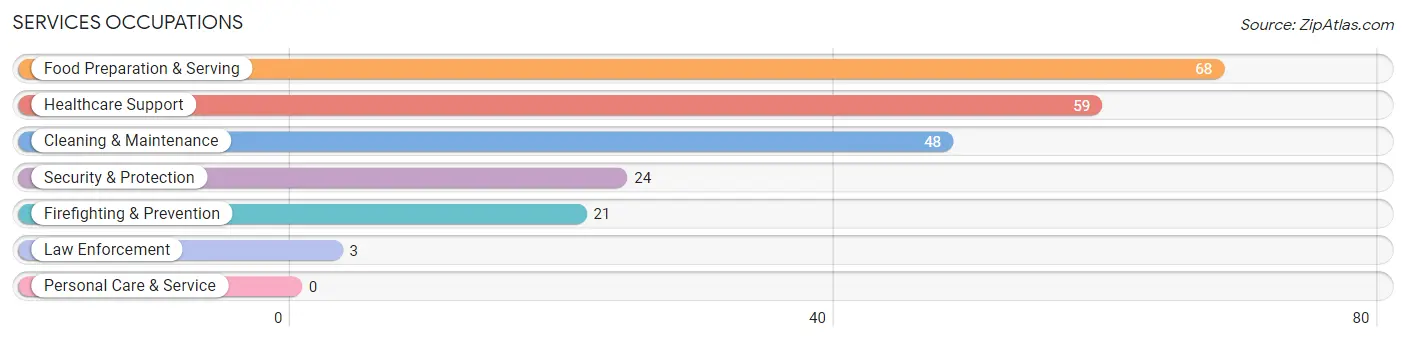
Services Occupations
The most common Services occupations in Stanfield are Food Preparation & Serving (68 | 6.7%), Healthcare Support (59 | 5.8%), Cleaning & Maintenance (48 | 4.8%), Security & Protection (24 | 2.4%), and Firefighting & Prevention (21 | 2.1%).
Services Occupations by Sex
Within the Services occupations in Stanfield, the most male-oriented occupations are Security & Protection (100.0%), Firefighting & Prevention (100.0%), and Law Enforcement (100.0%), while the most female-oriented occupations are Food Preparation & Serving (94.1%), Cleaning & Maintenance (75.0%), and Healthcare Support (69.5%).
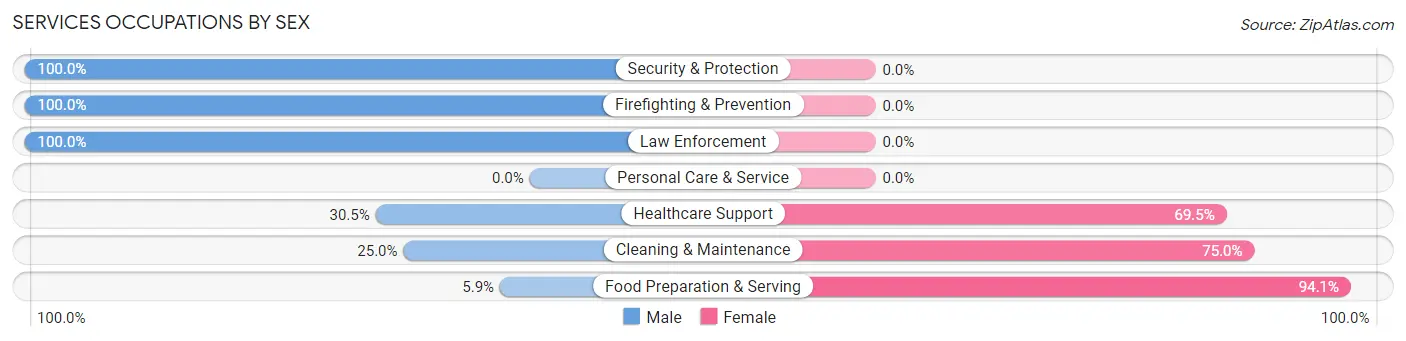
| Occupation | Male | Female |
| Healthcare Support | 18 (30.5%) | 41 (69.5%) |
| Security & Protection | 24 (100.0%) | 0 (0.0%) |
| Firefighting & Prevention | 21 (100.0%) | 0 (0.0%) |
| Law Enforcement | 3 (100.0%) | 0 (0.0%) |
| Food Preparation & Serving | 4 (5.9%) | 64 (94.1%) |
| Cleaning & Maintenance | 12 (25.0%) | 36 (75.0%) |
| Personal Care & Service | 0 (0.0%) | 0 (0.0%) |
| Total (Category) | 58 (29.1%) | 141 (70.9%) |
| Total (Overall) | 553 (54.7%) | 457 (45.3%) |
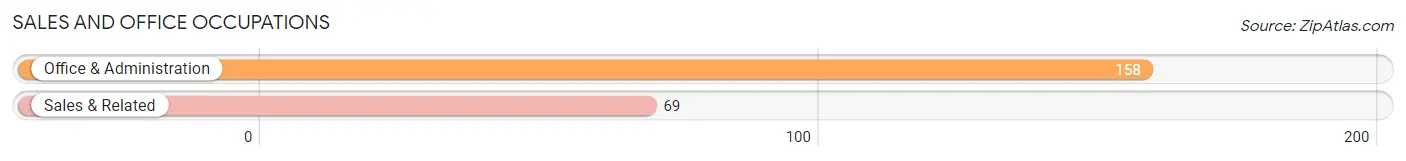
Sales and Office Occupations
The most common Sales and Office occupations in Stanfield are Office & Administration (158 | 15.6%), and Sales & Related (69 | 6.8%).
Sales and Office Occupations by Sex
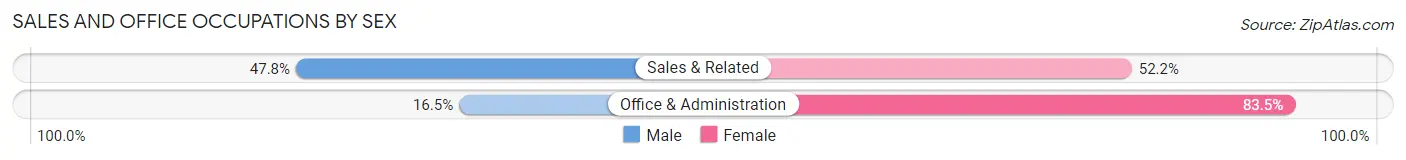
| Occupation | Male | Female |
| Sales & Related | 33 (47.8%) | 36 (52.2%) |
| Office & Administration | 26 (16.5%) | 132 (83.5%) |
| Total (Category) | 59 (26.0%) | 168 (74.0%) |
| Total (Overall) | 553 (54.7%) | 457 (45.3%) |
Natural Resources, Construction and Maintenance Occupations
The most common Natural Resources, Construction and Maintenance occupations in Stanfield are Installation, Maintenance & Repair (116 | 11.5%), Construction & Extraction (37 | 3.7%), and Farming, Fishing & Forestry (27 | 2.7%).
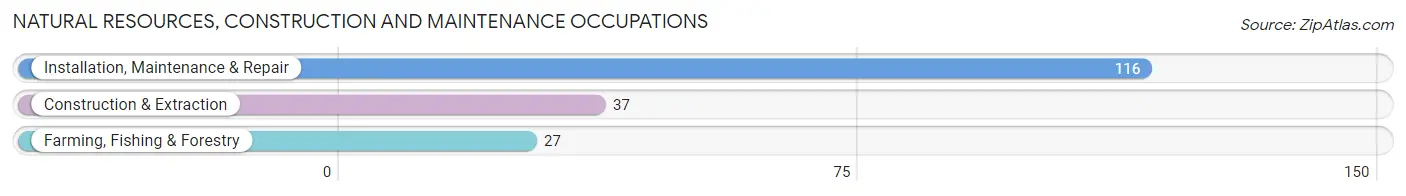
Natural Resources, Construction and Maintenance Occupations by Sex
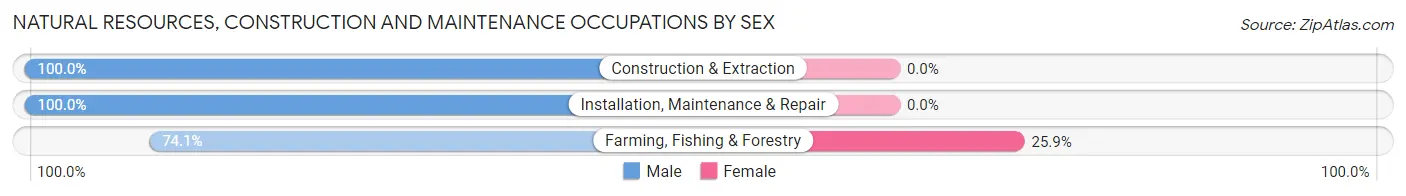
| Occupation | Male | Female |
| Farming, Fishing & Forestry | 20 (74.1%) | 7 (25.9%) |
| Construction & Extraction | 37 (100.0%) | 0 (0.0%) |
| Installation, Maintenance & Repair | 116 (100.0%) | 0 (0.0%) |
| Total (Category) | 173 (96.1%) | 7 (3.9%) |
| Total (Overall) | 553 (54.7%) | 457 (45.3%) |
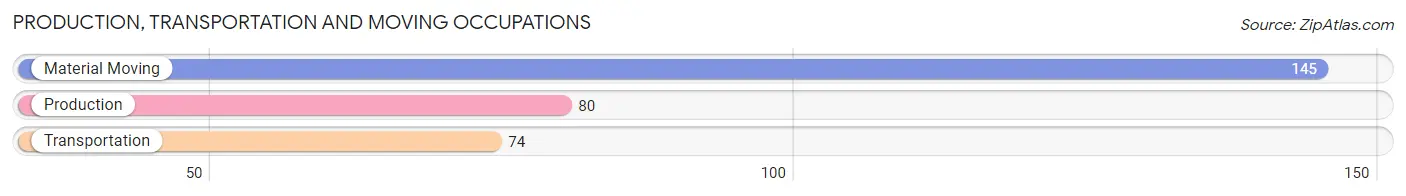
Production, Transportation and Moving Occupations
The most common Production, Transportation and Moving occupations in Stanfield are Material Moving (145 | 14.4%), Production (80 | 7.9%), and Transportation (74 | 7.3%).
Production, Transportation and Moving Occupations by Sex
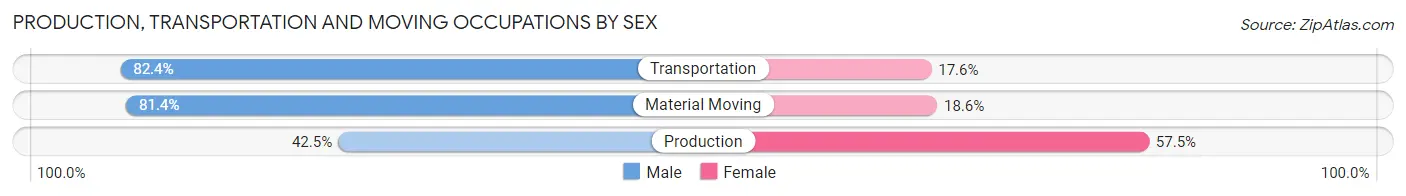
| Occupation | Male | Female |
| Production | 34 (42.5%) | 46 (57.5%) |
| Transportation | 61 (82.4%) | 13 (17.6%) |
| Material Moving | 118 (81.4%) | 27 (18.6%) |
| Total (Category) | 213 (71.2%) | 86 (28.8%) |
| Total (Overall) | 553 (54.7%) | 457 (45.3%) |
Employment Industries by Sex in Stanfield
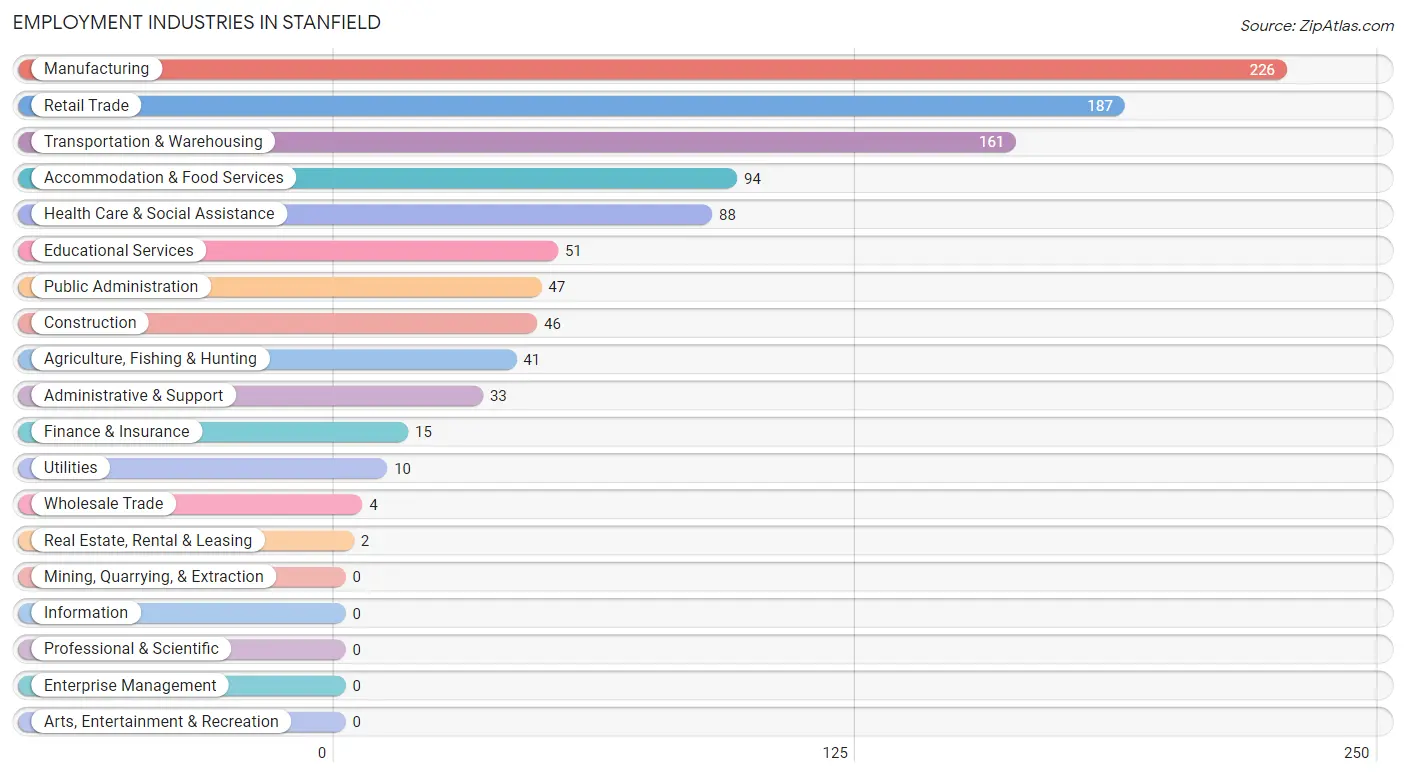
Employment Industries in Stanfield
The major employment industries in Stanfield include Manufacturing (226 | 22.4%), Retail Trade (187 | 18.5%), Transportation & Warehousing (161 | 15.9%), Accommodation & Food Services (94 | 9.3%), and Health Care & Social Assistance (88 | 8.7%).
Employment Industries by Sex in Stanfield
The Stanfield industries that see more men than women are Utilities (100.0%), Agriculture, Fishing & Hunting (82.9%), and Manufacturing (71.7%), whereas the industries that tend to have a higher number of women are Wholesale Trade (100.0%), Finance & Insurance (100.0%), and Real Estate, Rental & Leasing (100.0%).
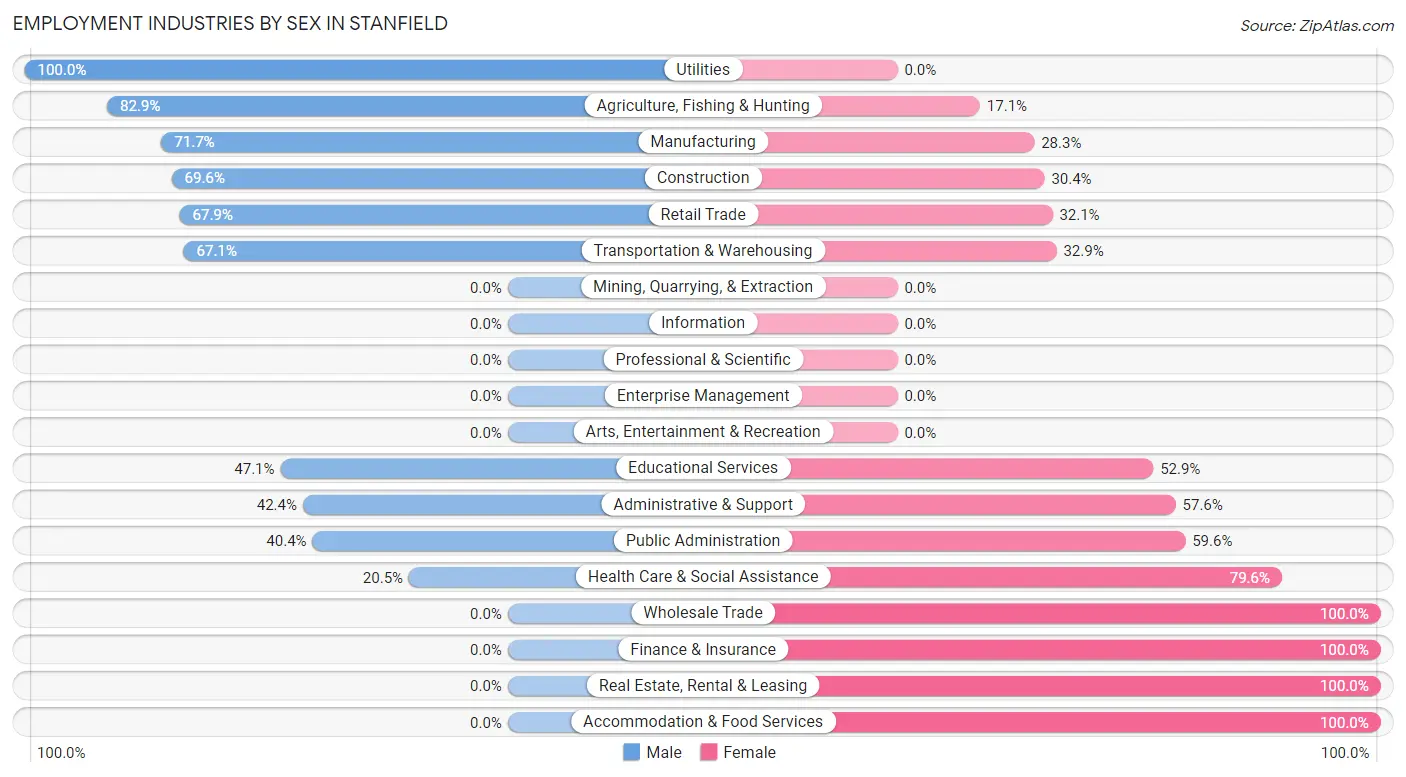
| Industry | Male | Female |
| Agriculture, Fishing & Hunting | 34 (82.9%) | 7 (17.1%) |
| Mining, Quarrying, & Extraction | 0 (0.0%) | 0 (0.0%) |
| Construction | 32 (69.6%) | 14 (30.4%) |
| Manufacturing | 162 (71.7%) | 64 (28.3%) |
| Wholesale Trade | 0 (0.0%) | 4 (100.0%) |
| Retail Trade | 127 (67.9%) | 60 (32.1%) |
| Transportation & Warehousing | 108 (67.1%) | 53 (32.9%) |
| Utilities | 10 (100.0%) | 0 (0.0%) |
| Information | 0 (0.0%) | 0 (0.0%) |
| Finance & Insurance | 0 (0.0%) | 15 (100.0%) |
| Real Estate, Rental & Leasing | 0 (0.0%) | 2 (100.0%) |
| Professional & Scientific | 0 (0.0%) | 0 (0.0%) |
| Enterprise Management | 0 (0.0%) | 0 (0.0%) |
| Administrative & Support | 14 (42.4%) | 19 (57.6%) |
| Educational Services | 24 (47.1%) | 27 (52.9%) |
| Health Care & Social Assistance | 18 (20.4%) | 70 (79.5%) |
| Arts, Entertainment & Recreation | 0 (0.0%) | 0 (0.0%) |
| Accommodation & Food Services | 0 (0.0%) | 94 (100.0%) |
| Public Administration | 19 (40.4%) | 28 (59.6%) |
| Total | 553 (54.7%) | 457 (45.3%) |
Education in Stanfield
School Enrollment in Stanfield
The most common levels of schooling among the 242 students in Stanfield are middle school (57 | 23.5%), elementary school (56 | 23.1%), and high school (52 | 21.5%).
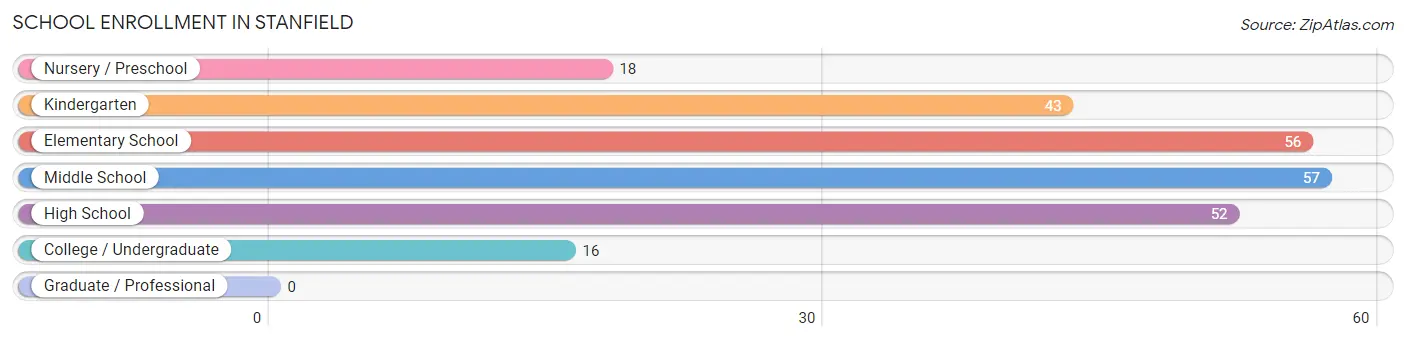
| School Level | # Students | % Students |
| Nursery / Preschool | 18 | 7.4% |
| Kindergarten | 43 | 17.8% |
| Elementary School | 56 | 23.1% |
| Middle School | 57 | 23.5% |
| High School | 52 | 21.5% |
| College / Undergraduate | 16 | 6.6% |
| Graduate / Professional | 0 | 0.0% |
| Total | 242 | 100.0% |
School Enrollment by Age by Funding Source in Stanfield
Out of a total of 242 students who are enrolled in schools in Stanfield, 5 (2.1%) attend a private institution, while the remaining 237 (97.9%) are enrolled in public schools. The age group of 35 years and over has the highest likelihood of being enrolled in private schools, with 5 (71.4% in the age bracket) enrolled. Conversely, the age group of 3 to 4 year olds has the lowest likelihood of being enrolled in a private school, with 10 (100.0% in the age bracket) attending a public institution.
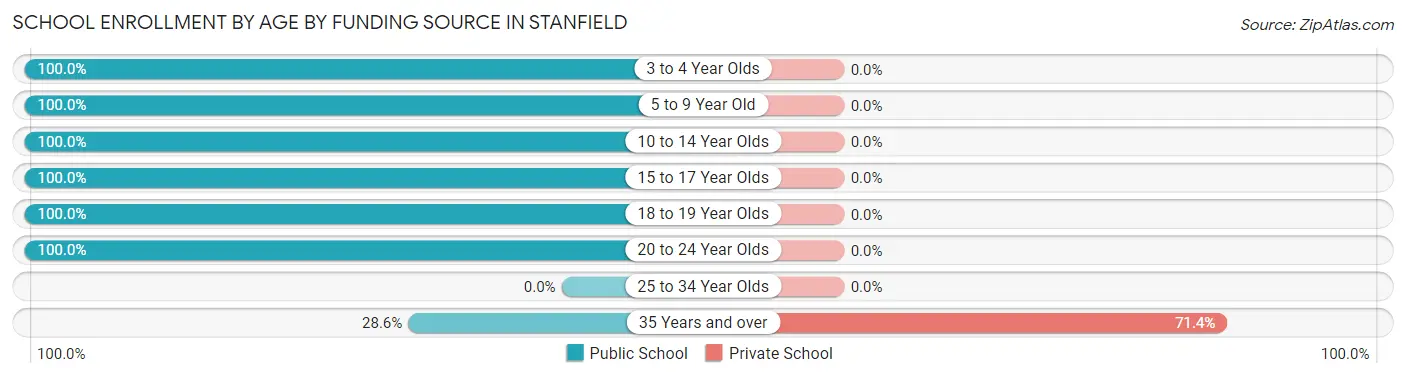
| Age Bracket | Public School | Private School |
| 3 to 4 Year Olds | 10 (100.0%) | 0 (0.0%) |
| 5 to 9 Year Old | 95 (100.0%) | 0 (0.0%) |
| 10 to 14 Year Olds | 84 (100.0%) | 0 (0.0%) |
| 15 to 17 Year Olds | 27 (100.0%) | 0 (0.0%) |
| 18 to 19 Year Olds | 10 (100.0%) | 0 (0.0%) |
| 20 to 24 Year Olds | 9 (100.0%) | 0 (0.0%) |
| 25 to 34 Year Olds | 0 (0.0%) | 0 (0.0%) |
| 35 Years and over | 2 (28.6%) | 5 (71.4%) |
| Total | 237 (97.9%) | 5 (2.1%) |
Educational Attainment by Field of Study in Stanfield
Education (44 | 31.4%), liberal arts & history (31 | 22.1%), business (23 | 16.4%), physical & health sciences (9 | 6.4%), and social sciences (9 | 6.4%) are the most common fields of study among 140 individuals in Stanfield who have obtained a bachelor's degree or higher.
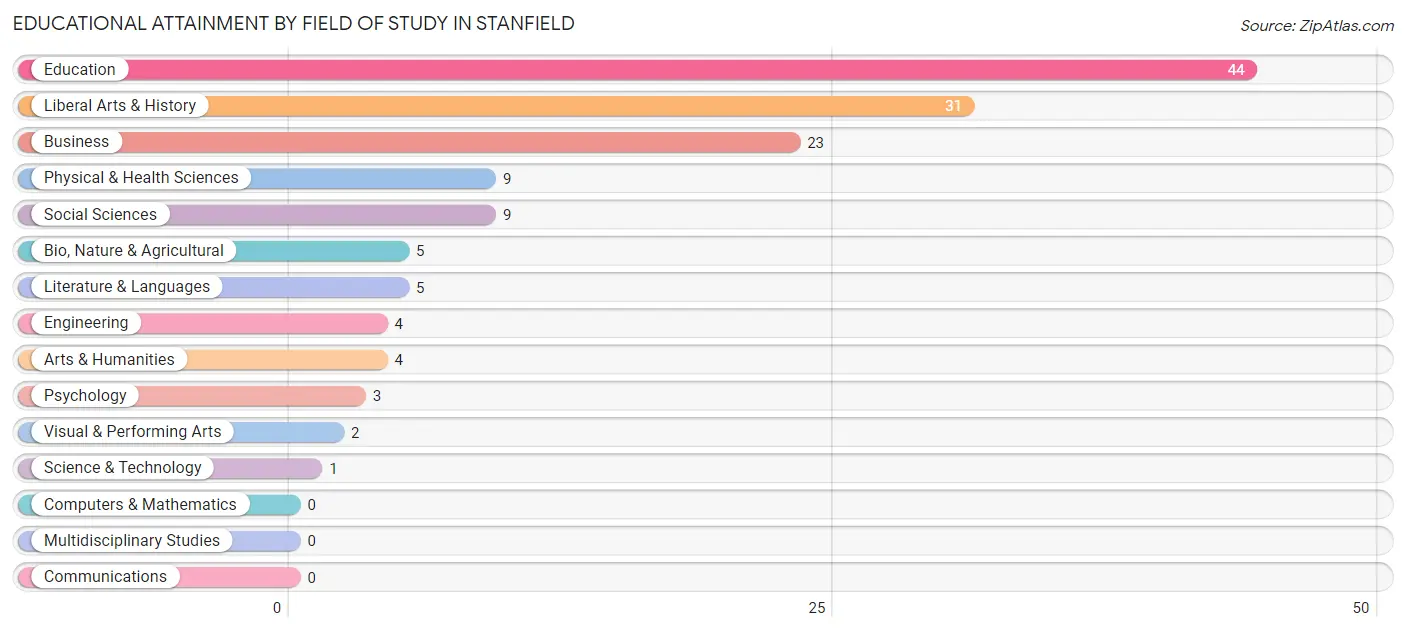
| Field of Study | # Graduates | % Graduates |
| Computers & Mathematics | 0 | 0.0% |
| Bio, Nature & Agricultural | 5 | 3.6% |
| Physical & Health Sciences | 9 | 6.4% |
| Psychology | 3 | 2.1% |
| Social Sciences | 9 | 6.4% |
| Engineering | 4 | 2.9% |
| Multidisciplinary Studies | 0 | 0.0% |
| Science & Technology | 1 | 0.7% |
| Business | 23 | 16.4% |
| Education | 44 | 31.4% |
| Literature & Languages | 5 | 3.6% |
| Liberal Arts & History | 31 | 22.1% |
| Visual & Performing Arts | 2 | 1.4% |
| Communications | 0 | 0.0% |
| Arts & Humanities | 4 | 2.9% |
| Total | 140 | 100.0% |
Transportation & Commute in Stanfield
Vehicle Availability by Sex in Stanfield
The most prevalent vehicle ownership categories in Stanfield are males with 2 vehicles (266, accounting for 49.6%) and females with 2 vehicles (108, making up 61.0%).
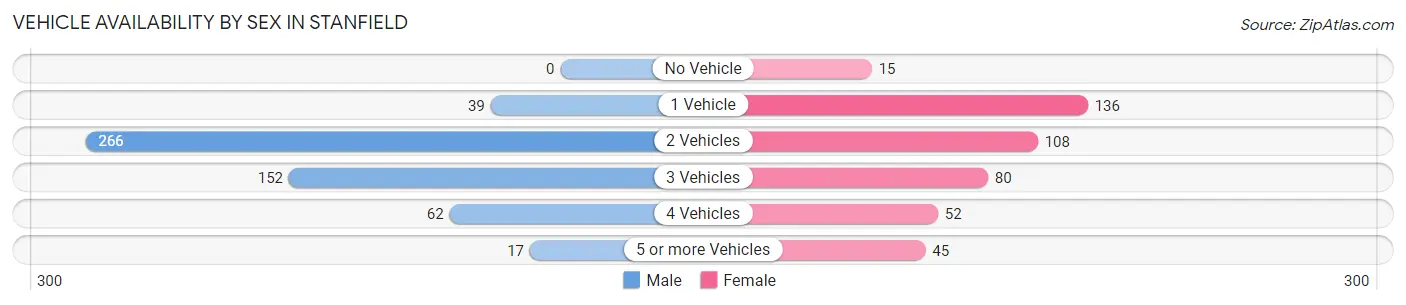
| Vehicles Available | Male | Female |
| No Vehicle | 0 (0.0%) | 15 (3.4%) |
| 1 Vehicle | 39 (7.3%) | 136 (31.2%) |
| 2 Vehicles | 266 (49.6%) | 108 (24.8%) |
| 3 Vehicles | 152 (28.4%) | 80 (18.3%) |
| 4 Vehicles | 62 (11.6%) | 52 (11.9%) |
| 5 or more Vehicles | 17 (3.2%) | 45 (10.3%) |
| Total | 536 (100.0%) | 436 (100.0%) |
Commute Time in Stanfield
The most frequently occuring commute durations in Stanfield are 5 to 9 minutes (225 commuters, 23.2%), 15 to 19 minutes (217 commuters, 22.3%), and 10 to 14 minutes (180 commuters, 18.5%).
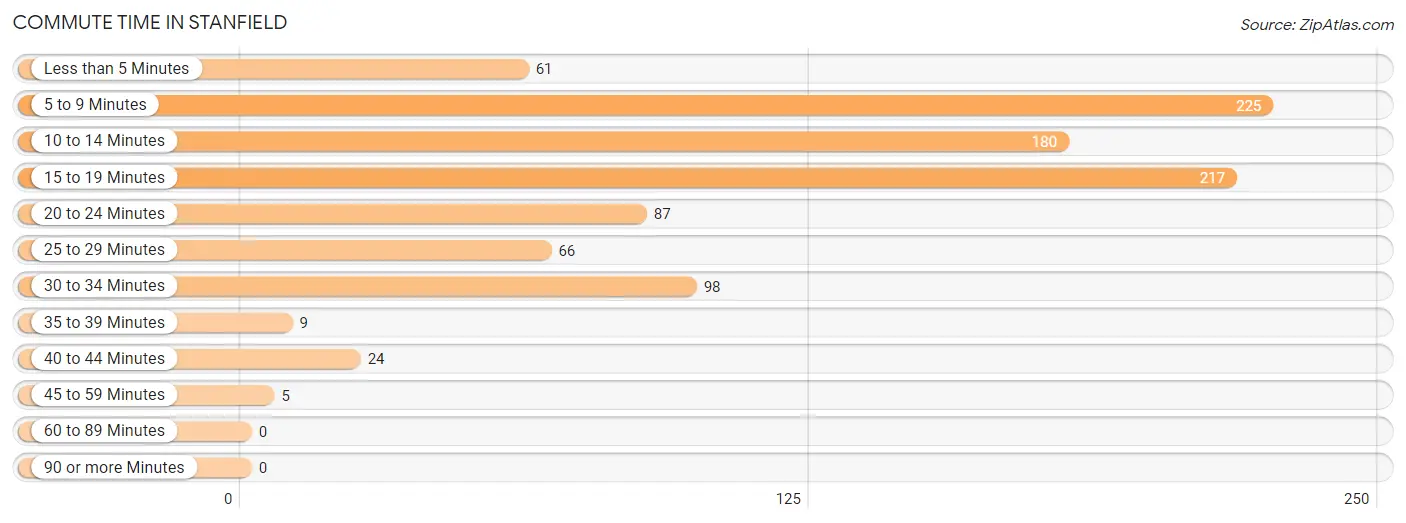
| Commute Time | # Commuters | % Commuters |
| Less than 5 Minutes | 61 | 6.3% |
| 5 to 9 Minutes | 225 | 23.2% |
| 10 to 14 Minutes | 180 | 18.5% |
| 15 to 19 Minutes | 217 | 22.3% |
| 20 to 24 Minutes | 87 | 8.9% |
| 25 to 29 Minutes | 66 | 6.8% |
| 30 to 34 Minutes | 98 | 10.1% |
| 35 to 39 Minutes | 9 | 0.9% |
| 40 to 44 Minutes | 24 | 2.5% |
| 45 to 59 Minutes | 5 | 0.5% |
| 60 to 89 Minutes | 0 | 0.0% |
| 90 or more Minutes | 0 | 0.0% |
Commute Time by Sex in Stanfield
The most common commute times in Stanfield are 5 to 9 minutes (144 commuters, 26.9%) for males and 15 to 19 minutes (132 commuters, 30.3%) for females.
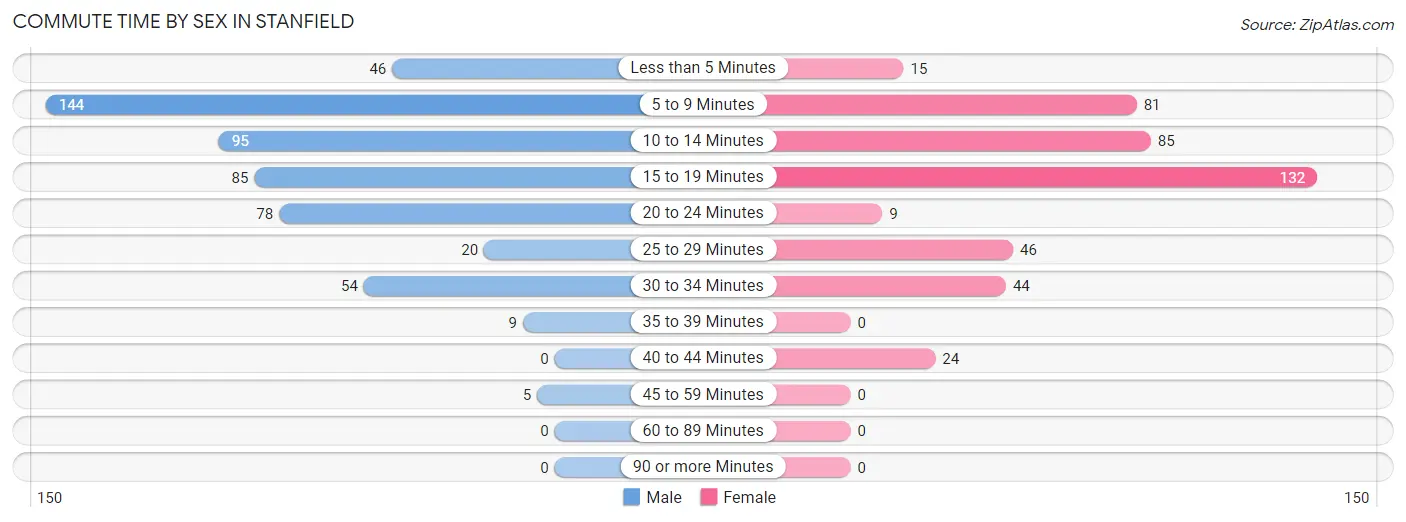
| Commute Time | Male | Female |
| Less than 5 Minutes | 46 (8.6%) | 15 (3.4%) |
| 5 to 9 Minutes | 144 (26.9%) | 81 (18.6%) |
| 10 to 14 Minutes | 95 (17.7%) | 85 (19.5%) |
| 15 to 19 Minutes | 85 (15.9%) | 132 (30.3%) |
| 20 to 24 Minutes | 78 (14.5%) | 9 (2.1%) |
| 25 to 29 Minutes | 20 (3.7%) | 46 (10.5%) |
| 30 to 34 Minutes | 54 (10.1%) | 44 (10.1%) |
| 35 to 39 Minutes | 9 (1.7%) | 0 (0.0%) |
| 40 to 44 Minutes | 0 (0.0%) | 24 (5.5%) |
| 45 to 59 Minutes | 5 (0.9%) | 0 (0.0%) |
| 60 to 89 Minutes | 0 (0.0%) | 0 (0.0%) |
| 90 or more Minutes | 0 (0.0%) | 0 (0.0%) |
Time of Departure to Work by Sex in Stanfield
The most frequent times of departure to work in Stanfield are 12:00 AM to 4:59 AM (146, 27.2%) for males and 4:00 PM to 11:59 PM (87, 20.0%) for females.
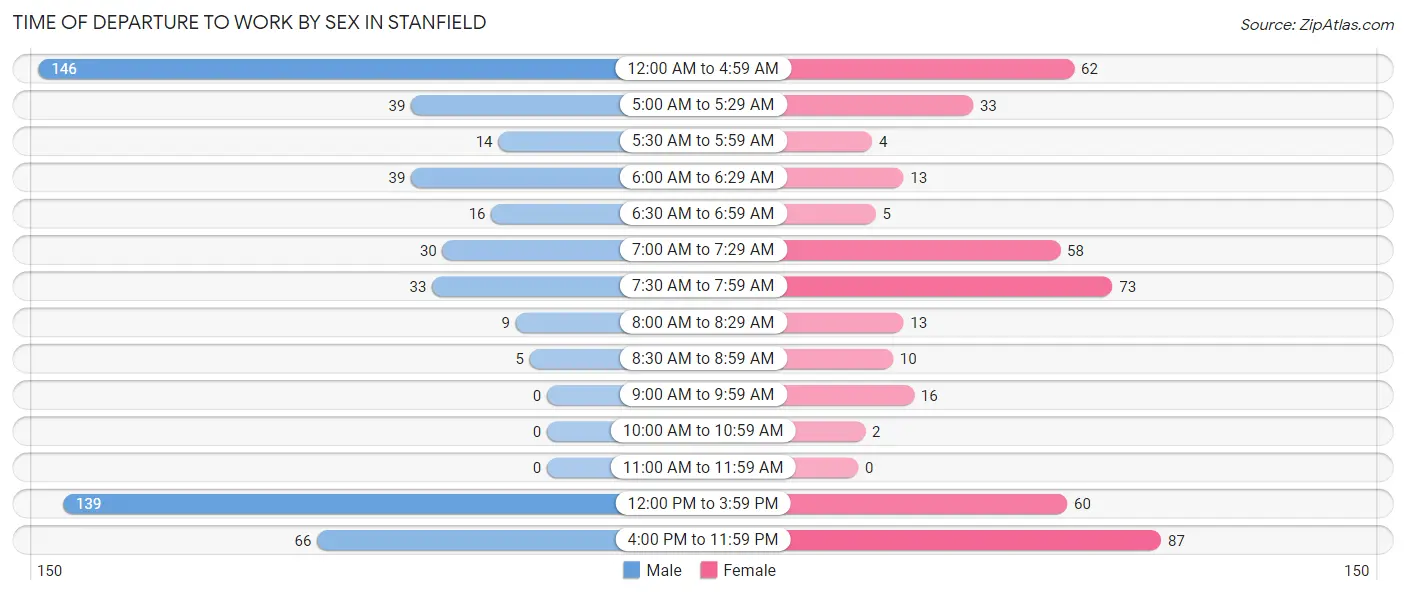
| Time of Departure | Male | Female |
| 12:00 AM to 4:59 AM | 146 (27.2%) | 62 (14.2%) |
| 5:00 AM to 5:29 AM | 39 (7.3%) | 33 (7.6%) |
| 5:30 AM to 5:59 AM | 14 (2.6%) | 4 (0.9%) |
| 6:00 AM to 6:29 AM | 39 (7.3%) | 13 (3.0%) |
| 6:30 AM to 6:59 AM | 16 (3.0%) | 5 (1.1%) |
| 7:00 AM to 7:29 AM | 30 (5.6%) | 58 (13.3%) |
| 7:30 AM to 7:59 AM | 33 (6.2%) | 73 (16.7%) |
| 8:00 AM to 8:29 AM | 9 (1.7%) | 13 (3.0%) |
| 8:30 AM to 8:59 AM | 5 (0.9%) | 10 (2.3%) |
| 9:00 AM to 9:59 AM | 0 (0.0%) | 16 (3.7%) |
| 10:00 AM to 10:59 AM | 0 (0.0%) | 2 (0.5%) |
| 11:00 AM to 11:59 AM | 0 (0.0%) | 0 (0.0%) |
| 12:00 PM to 3:59 PM | 139 (25.9%) | 60 (13.8%) |
| 4:00 PM to 11:59 PM | 66 (12.3%) | 87 (20.0%) |
| Total | 536 (100.0%) | 436 (100.0%) |
Housing Occupancy in Stanfield
Occupancy by Ownership in Stanfield
Of the total 863 dwellings in Stanfield, owner-occupied units account for 627 (72.7%), while renter-occupied units make up 236 (27.4%).
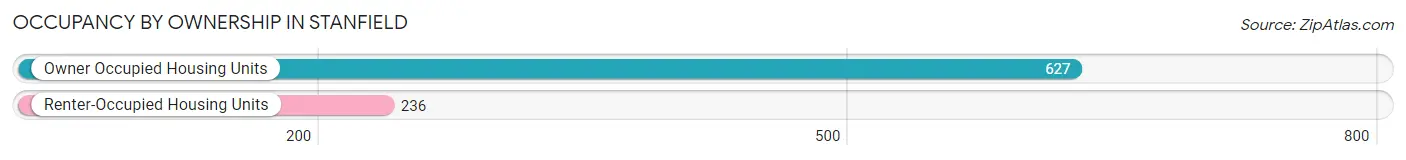
| Occupancy | # Housing Units | % Housing Units |
| Owner Occupied Housing Units | 627 | 72.7% |
| Renter-Occupied Housing Units | 236 | 27.4% |
| Total Occupied Housing Units | 863 | 100.0% |
Occupancy by Household Size in Stanfield
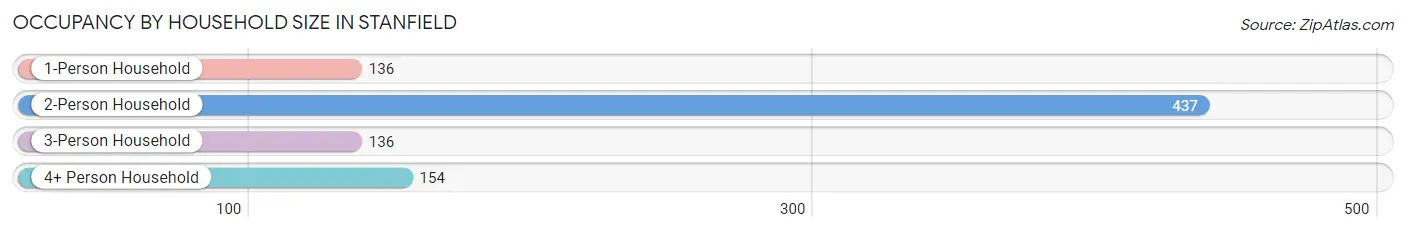
| Household Size | # Housing Units | % Housing Units |
| 1-Person Household | 136 | 15.8% |
| 2-Person Household | 437 | 50.6% |
| 3-Person Household | 136 | 15.8% |
| 4+ Person Household | 154 | 17.8% |
| Total Housing Units | 863 | 100.0% |
Occupancy by Ownership by Household Size in Stanfield
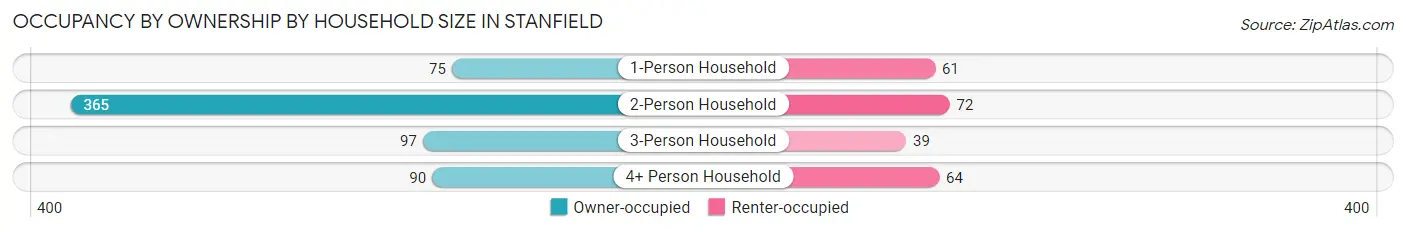
| Household Size | Owner-occupied | Renter-occupied |
| 1-Person Household | 75 (55.1%) | 61 (44.9%) |
| 2-Person Household | 365 (83.5%) | 72 (16.5%) |
| 3-Person Household | 97 (71.3%) | 39 (28.7%) |
| 4+ Person Household | 90 (58.4%) | 64 (41.6%) |
| Total Housing Units | 627 (72.7%) | 236 (27.4%) |
Occupancy by Educational Attainment in Stanfield
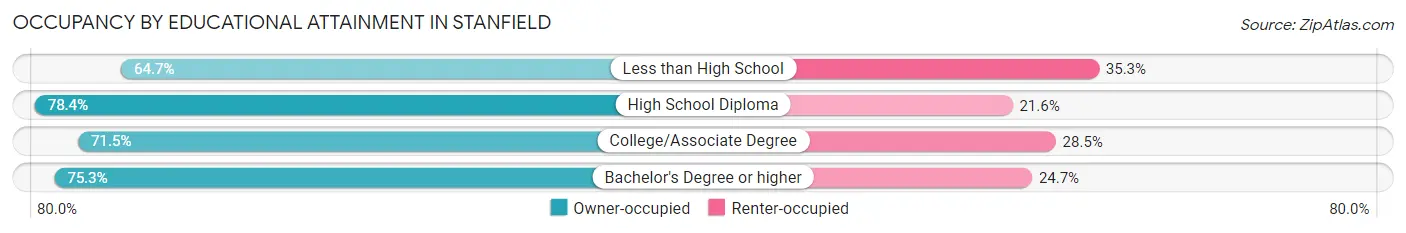
| Household Size | Owner-occupied | Renter-occupied |
| Less than High School | 130 (64.7%) | 71 (35.3%) |
| High School Diploma | 232 (78.4%) | 64 (21.6%) |
| College/Associate Degree | 201 (71.5%) | 80 (28.5%) |
| Bachelor's Degree or higher | 64 (75.3%) | 21 (24.7%) |
Occupancy by Age of Householder in Stanfield
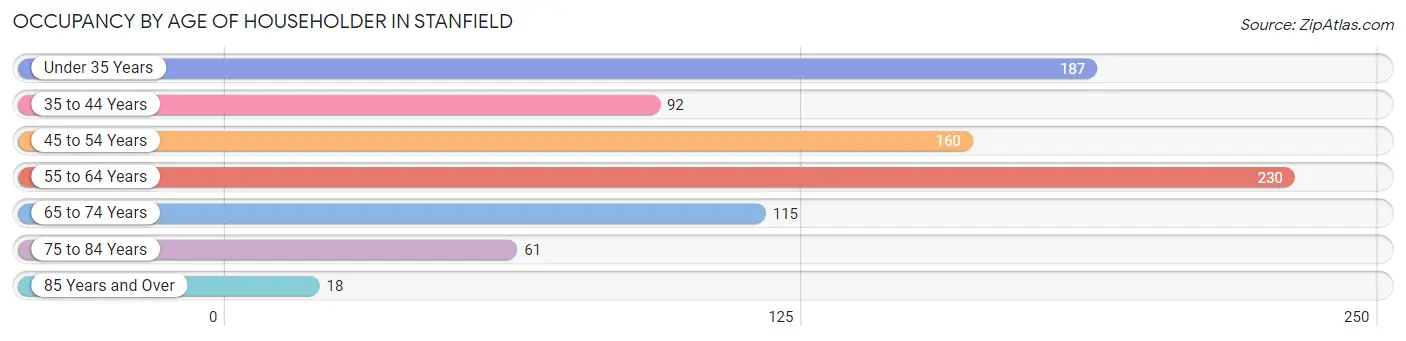
| Age Bracket | # Households | % Households |
| Under 35 Years | 187 | 21.7% |
| 35 to 44 Years | 92 | 10.7% |
| 45 to 54 Years | 160 | 18.5% |
| 55 to 64 Years | 230 | 26.7% |
| 65 to 74 Years | 115 | 13.3% |
| 75 to 84 Years | 61 | 7.1% |
| 85 Years and Over | 18 | 2.1% |
| Total | 863 | 100.0% |
Housing Finances in Stanfield
Median Income by Occupancy in Stanfield
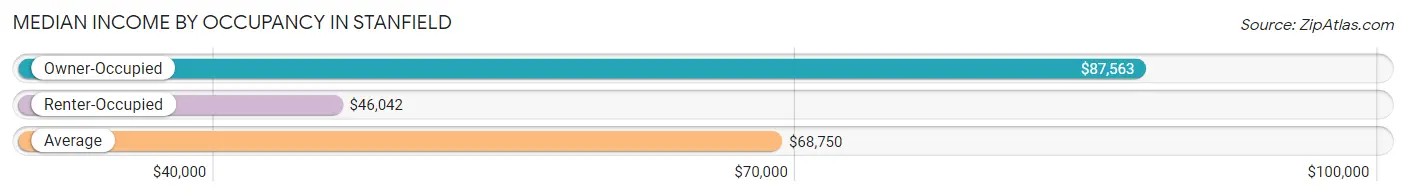
| Occupancy Type | # Households | Median Income |
| Owner-Occupied | 627 (72.7%) | $87,563 |
| Renter-Occupied | 236 (27.4%) | $46,042 |
| Average | 863 (100.0%) | $68,750 |
Occupancy by Householder Income Bracket in Stanfield
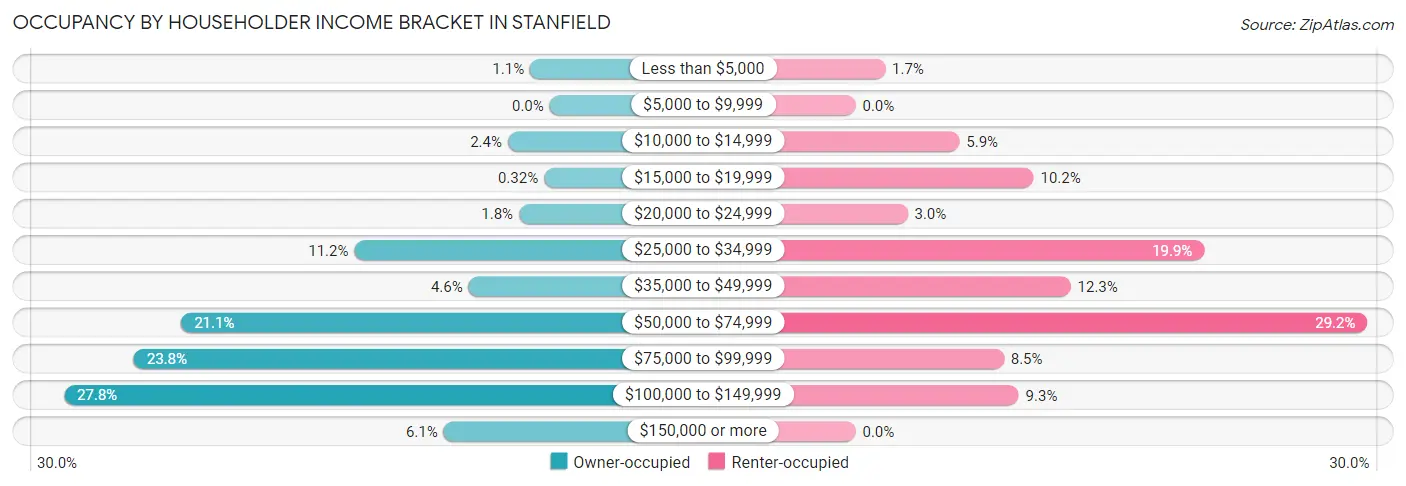
| Income Bracket | Owner-occupied | Renter-occupied |
| Less than $5,000 | 7 (1.1%) | 4 (1.7%) |
| $5,000 to $9,999 | 0 (0.0%) | 0 (0.0%) |
| $10,000 to $14,999 | 15 (2.4%) | 14 (5.9%) |
| $15,000 to $19,999 | 2 (0.3%) | 24 (10.2%) |
| $20,000 to $24,999 | 11 (1.8%) | 7 (3.0%) |
| $25,000 to $34,999 | 70 (11.2%) | 47 (19.9%) |
| $35,000 to $49,999 | 29 (4.6%) | 29 (12.3%) |
| $50,000 to $74,999 | 132 (21.0%) | 69 (29.2%) |
| $75,000 to $99,999 | 149 (23.8%) | 20 (8.5%) |
| $100,000 to $149,999 | 174 (27.8%) | 22 (9.3%) |
| $150,000 or more | 38 (6.1%) | 0 (0.0%) |
| Total | 627 (100.0%) | 236 (100.0%) |
Monthly Housing Cost Tiers in Stanfield
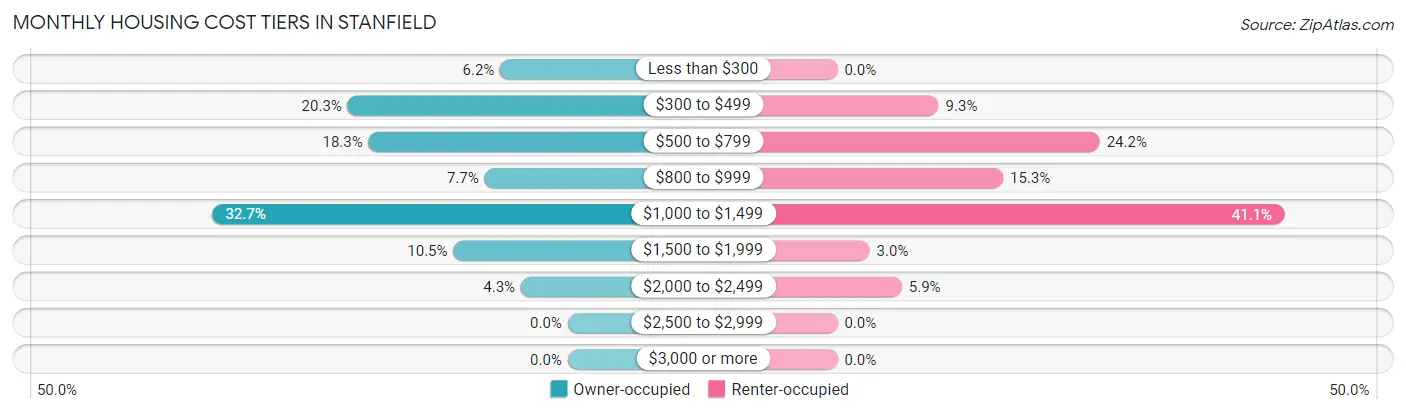
| Monthly Cost | Owner-occupied | Renter-occupied |
| Less than $300 | 39 (6.2%) | 0 (0.0%) |
| $300 to $499 | 127 (20.3%) | 22 (9.3%) |
| $500 to $799 | 115 (18.3%) | 57 (24.1%) |
| $800 to $999 | 48 (7.7%) | 36 (15.2%) |
| $1,000 to $1,499 | 205 (32.7%) | 97 (41.1%) |
| $1,500 to $1,999 | 66 (10.5%) | 7 (3.0%) |
| $2,000 to $2,499 | 27 (4.3%) | 14 (5.9%) |
| $2,500 to $2,999 | 0 (0.0%) | 0 (0.0%) |
| $3,000 or more | 0 (0.0%) | 0 (0.0%) |
| Total | 627 (100.0%) | 236 (100.0%) |
Physical Housing Characteristics in Stanfield
Housing Structures in Stanfield
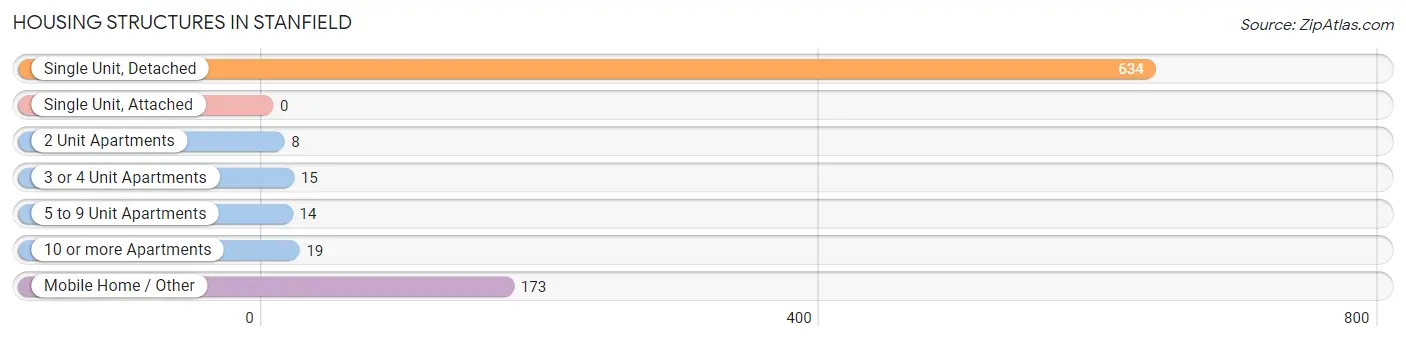
| Structure Type | # Housing Units | % Housing Units |
| Single Unit, Detached | 634 | 73.5% |
| Single Unit, Attached | 0 | 0.0% |
| 2 Unit Apartments | 8 | 0.9% |
| 3 or 4 Unit Apartments | 15 | 1.7% |
| 5 to 9 Unit Apartments | 14 | 1.6% |
| 10 or more Apartments | 19 | 2.2% |
| Mobile Home / Other | 173 | 20.1% |
| Total | 863 | 100.0% |
Housing Structures by Occupancy in Stanfield
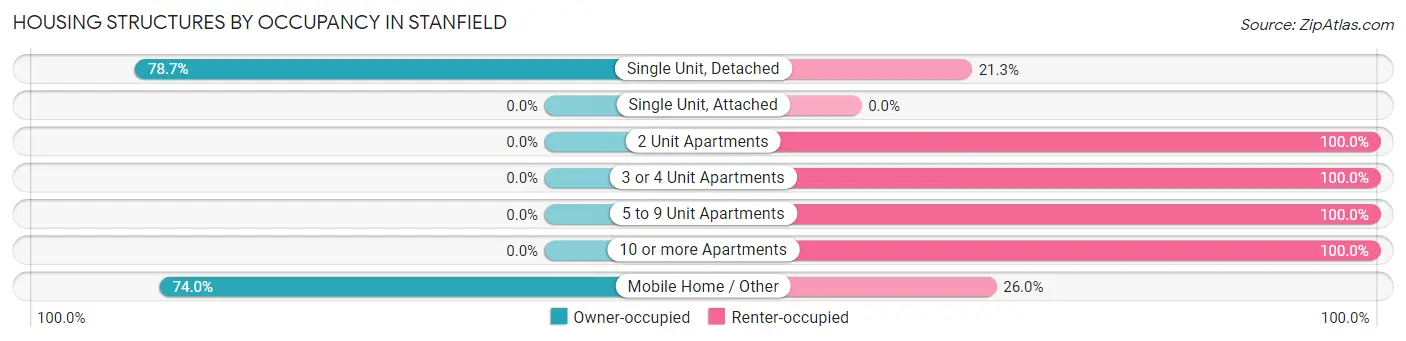
| Structure Type | Owner-occupied | Renter-occupied |
| Single Unit, Detached | 499 (78.7%) | 135 (21.3%) |
| Single Unit, Attached | 0 (0.0%) | 0 (0.0%) |
| 2 Unit Apartments | 0 (0.0%) | 8 (100.0%) |
| 3 or 4 Unit Apartments | 0 (0.0%) | 15 (100.0%) |
| 5 to 9 Unit Apartments | 0 (0.0%) | 14 (100.0%) |
| 10 or more Apartments | 0 (0.0%) | 19 (100.0%) |
| Mobile Home / Other | 128 (74.0%) | 45 (26.0%) |
| Total | 627 (72.7%) | 236 (27.4%) |
Housing Structures by Number of Rooms in Stanfield
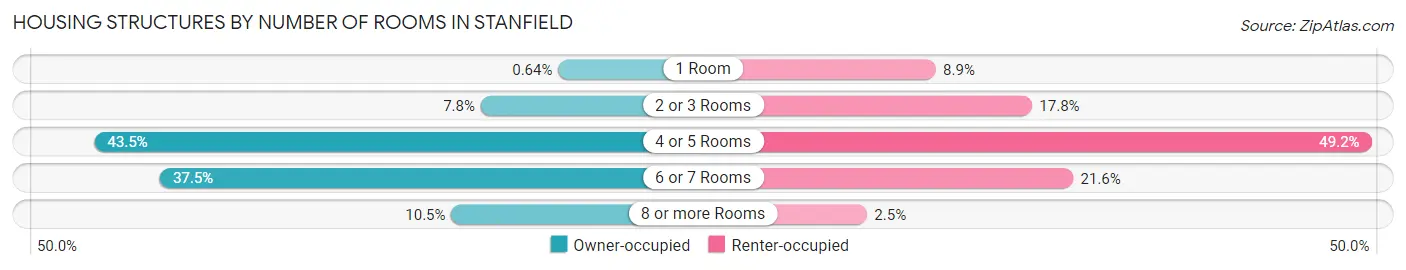
| Number of Rooms | Owner-occupied | Renter-occupied |
| 1 Room | 4 (0.6%) | 21 (8.9%) |
| 2 or 3 Rooms | 49 (7.8%) | 42 (17.8%) |
| 4 or 5 Rooms | 273 (43.5%) | 116 (49.1%) |
| 6 or 7 Rooms | 235 (37.5%) | 51 (21.6%) |
| 8 or more Rooms | 66 (10.5%) | 6 (2.5%) |
| Total | 627 (100.0%) | 236 (100.0%) |
Housing Structure by Heating Type in Stanfield
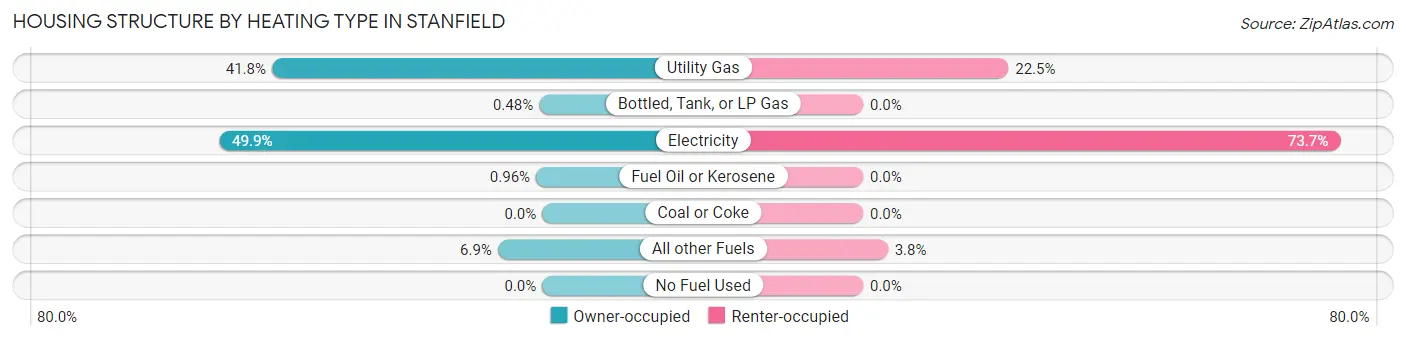
| Heating Type | Owner-occupied | Renter-occupied |
| Utility Gas | 262 (41.8%) | 53 (22.5%) |
| Bottled, Tank, or LP Gas | 3 (0.5%) | 0 (0.0%) |
| Electricity | 313 (49.9%) | 174 (73.7%) |
| Fuel Oil or Kerosene | 6 (1.0%) | 0 (0.0%) |
| Coal or Coke | 0 (0.0%) | 0 (0.0%) |
| All other Fuels | 43 (6.9%) | 9 (3.8%) |
| No Fuel Used | 0 (0.0%) | 0 (0.0%) |
| Total | 627 (100.0%) | 236 (100.0%) |
Household Vehicle Usage in Stanfield
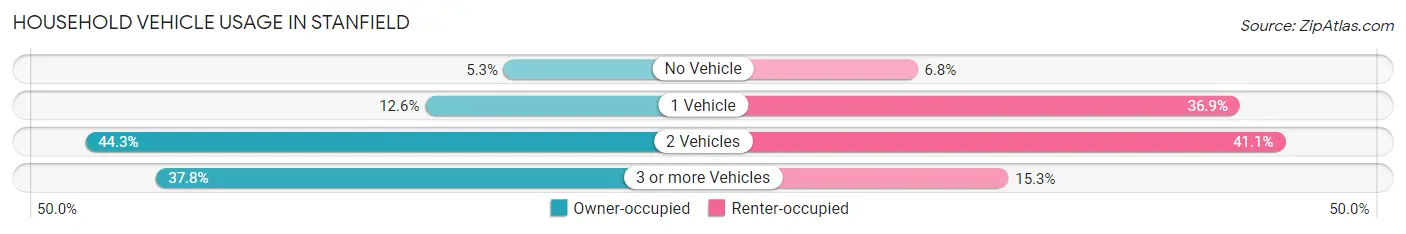
| Vehicles per Household | Owner-occupied | Renter-occupied |
| No Vehicle | 33 (5.3%) | 16 (6.8%) |
| 1 Vehicle | 79 (12.6%) | 87 (36.9%) |
| 2 Vehicles | 278 (44.3%) | 97 (41.1%) |
| 3 or more Vehicles | 237 (37.8%) | 36 (15.2%) |
| Total | 627 (100.0%) | 236 (100.0%) |
Real Estate & Mortgages in Stanfield
Real Estate and Mortgage Overview in Stanfield
| Characteristic | Without Mortgage | With Mortgage |
| Housing Units | 275 | 352 |
| Median Property Value | $117,200 | $196,000 |
| Median Household Income | $76,016 | $29 |
| Monthly Housing Costs | $451 | $0 |
| Real Estate Taxes | $1,264 | $0 |
Property Value by Mortgage Status in Stanfield
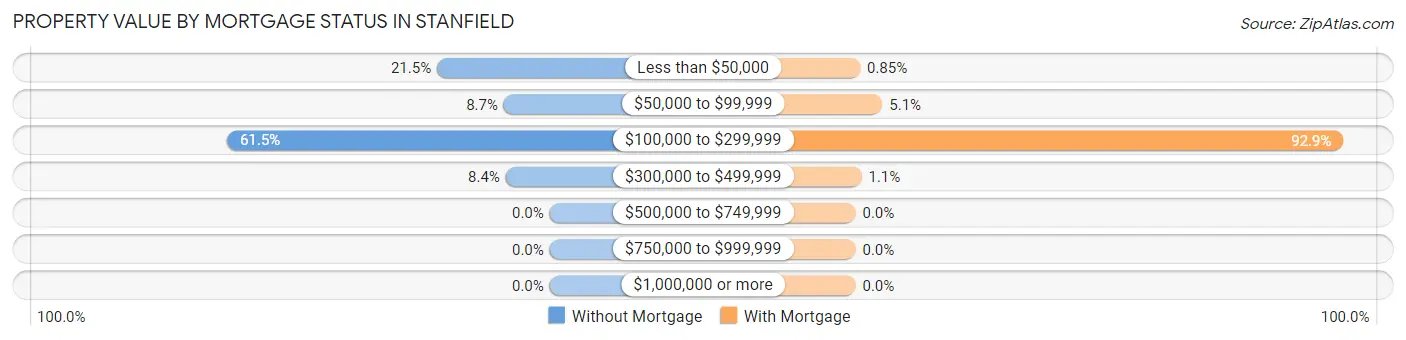
| Property Value | Without Mortgage | With Mortgage |
| Less than $50,000 | 59 (21.4%) | 3 (0.9%) |
| $50,000 to $99,999 | 24 (8.7%) | 18 (5.1%) |
| $100,000 to $299,999 | 169 (61.5%) | 327 (92.9%) |
| $300,000 to $499,999 | 23 (8.4%) | 4 (1.1%) |
| $500,000 to $749,999 | 0 (0.0%) | 0 (0.0%) |
| $750,000 to $999,999 | 0 (0.0%) | 0 (0.0%) |
| $1,000,000 or more | 0 (0.0%) | 0 (0.0%) |
| Total | 275 (100.0%) | 352 (100.0%) |
Household Income by Mortgage Status in Stanfield
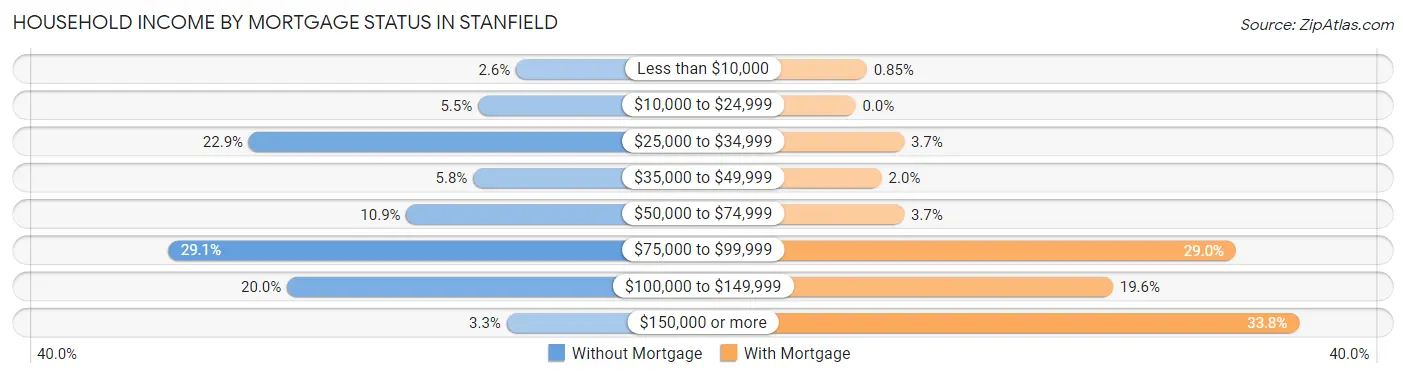
| Household Income | Without Mortgage | With Mortgage |
| Less than $10,000 | 7 (2.5%) | 3 (0.9%) |
| $10,000 to $24,999 | 15 (5.4%) | 0 (0.0%) |
| $25,000 to $34,999 | 63 (22.9%) | 13 (3.7%) |
| $35,000 to $49,999 | 16 (5.8%) | 7 (2.0%) |
| $50,000 to $74,999 | 30 (10.9%) | 13 (3.7%) |
| $75,000 to $99,999 | 80 (29.1%) | 102 (29.0%) |
| $100,000 to $149,999 | 55 (20.0%) | 69 (19.6%) |
| $150,000 or more | 9 (3.3%) | 119 (33.8%) |
| Total | 275 (100.0%) | 352 (100.0%) |
Property Value to Household Income Ratio in Stanfield
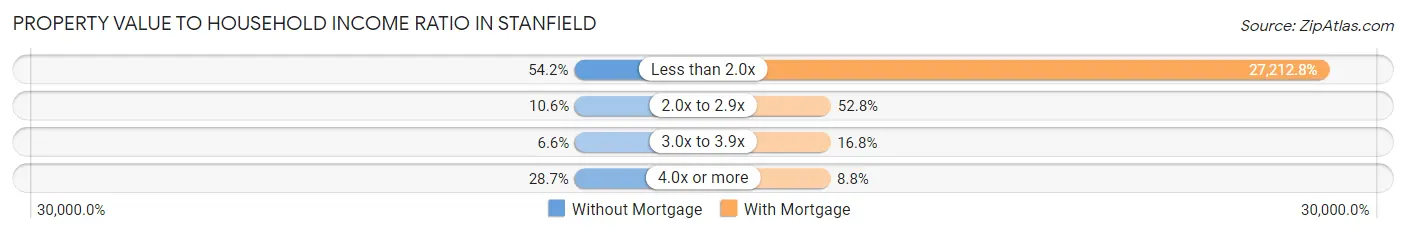
| Value-to-Income Ratio | Without Mortgage | With Mortgage |
| Less than 2.0x | 149 (54.2%) | 95,789 (27,212.8%) |
| 2.0x to 2.9x | 29 (10.5%) | 186 (52.8%) |
| 3.0x to 3.9x | 18 (6.6%) | 59 (16.8%) |
| 4.0x or more | 79 (28.7%) | 31 (8.8%) |
| Total | 275 (100.0%) | 352 (100.0%) |
Real Estate Taxes by Mortgage Status in Stanfield
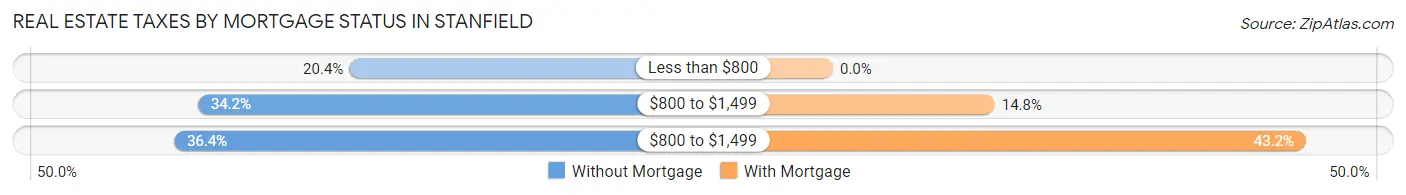
| Property Taxes | Without Mortgage | With Mortgage |
| Less than $800 | 56 (20.4%) | 0 (0.0%) |
| $800 to $1,499 | 94 (34.2%) | 52 (14.8%) |
| $800 to $1,499 | 100 (36.4%) | 152 (43.2%) |
| Total | 275 (100.0%) | 352 (100.0%) |
Health & Disability in Stanfield
Health Insurance Coverage by Age in Stanfield
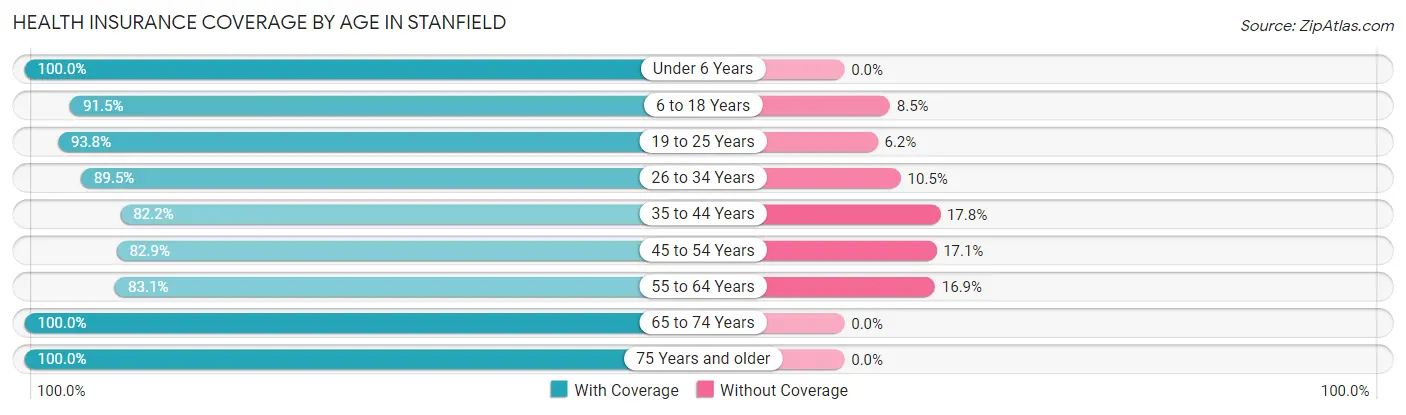
| Age Bracket | With Coverage | Without Coverage |
| Under 6 Years | 177 (100.0%) | 0 (0.0%) |
| 6 to 18 Years | 183 (91.5%) | 17 (8.5%) |
| 19 to 25 Years | 227 (93.8%) | 15 (6.2%) |
| 26 to 34 Years | 315 (89.5%) | 37 (10.5%) |
| 35 to 44 Years | 152 (82.2%) | 33 (17.8%) |
| 45 to 54 Years | 232 (82.9%) | 48 (17.1%) |
| 55 to 64 Years | 315 (83.1%) | 64 (16.9%) |
| 65 to 74 Years | 171 (100.0%) | 0 (0.0%) |
| 75 Years and older | 142 (100.0%) | 0 (0.0%) |
| Total | 1,914 (89.9%) | 214 (10.1%) |
Health Insurance Coverage by Citizenship Status in Stanfield
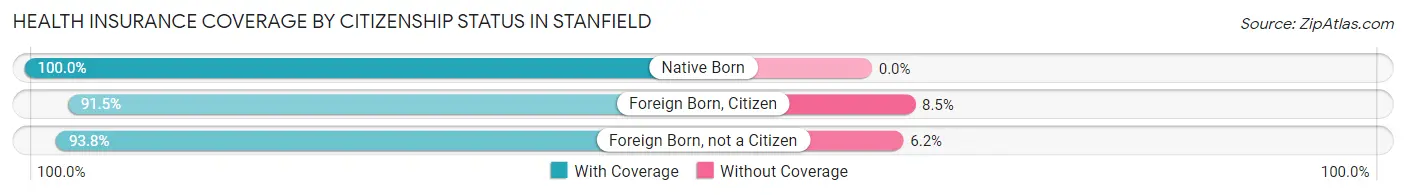
| Citizenship Status | With Coverage | Without Coverage |
| Native Born | 177 (100.0%) | 0 (0.0%) |
| Foreign Born, Citizen | 183 (91.5%) | 17 (8.5%) |
| Foreign Born, not a Citizen | 227 (93.8%) | 15 (6.2%) |
Health Insurance Coverage by Household Income in Stanfield
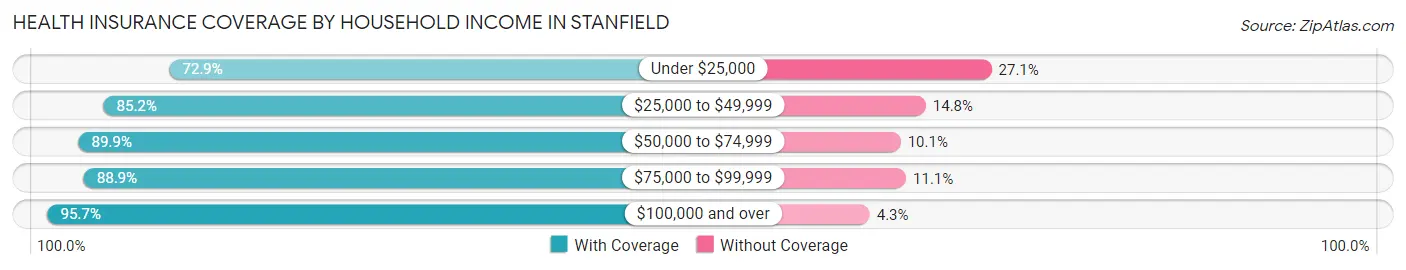
| Household Income | With Coverage | Without Coverage |
| Under $25,000 | 94 (72.9%) | 35 (27.1%) |
| $25,000 to $49,999 | 276 (85.2%) | 48 (14.8%) |
| $50,000 to $74,999 | 551 (89.9%) | 62 (10.1%) |
| $75,000 to $99,999 | 304 (88.9%) | 38 (11.1%) |
| $100,000 and over | 689 (95.7%) | 31 (4.3%) |
Public vs Private Health Insurance Coverage by Age in Stanfield
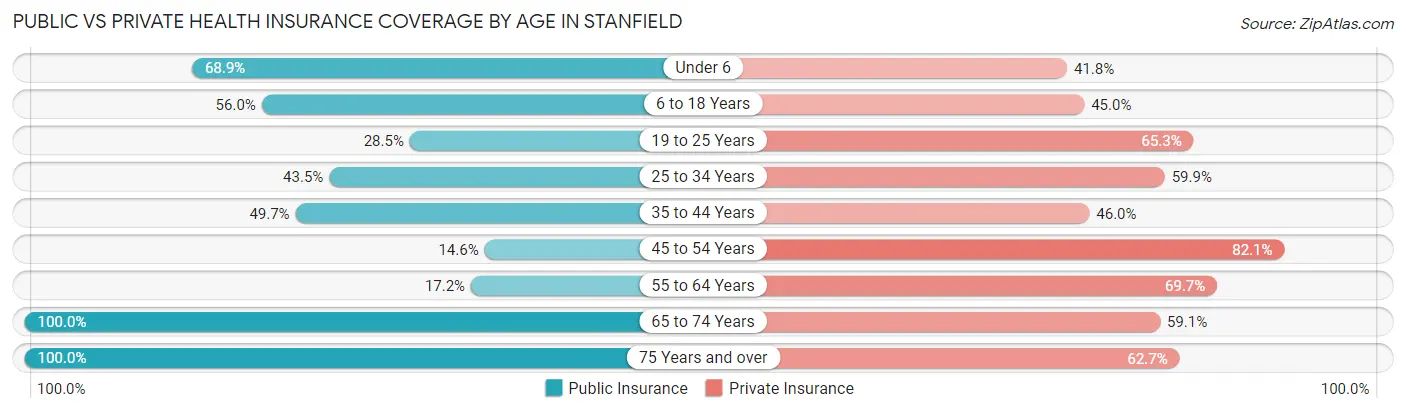
| Age Bracket | Public Insurance | Private Insurance |
| Under 6 | 122 (68.9%) | 74 (41.8%) |
| 6 to 18 Years | 112 (56.0%) | 90 (45.0%) |
| 19 to 25 Years | 69 (28.5%) | 158 (65.3%) |
| 25 to 34 Years | 153 (43.5%) | 211 (59.9%) |
| 35 to 44 Years | 92 (49.7%) | 85 (46.0%) |
| 45 to 54 Years | 41 (14.6%) | 230 (82.1%) |
| 55 to 64 Years | 65 (17.2%) | 264 (69.7%) |
| 65 to 74 Years | 171 (100.0%) | 101 (59.1%) |
| 75 Years and over | 142 (100.0%) | 89 (62.7%) |
| Total | 967 (45.4%) | 1,302 (61.2%) |
Disability Status by Sex by Age in Stanfield
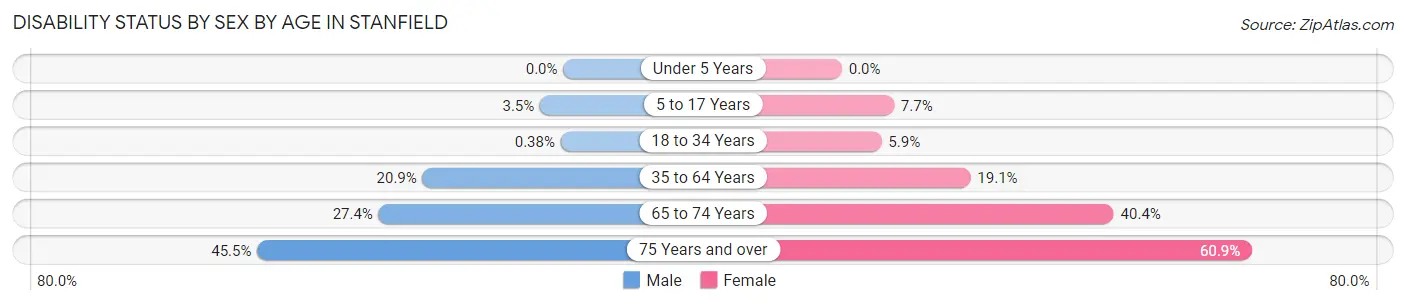
| Age Bracket | Male | Female |
| Under 5 Years | 0 (0.0%) | 0 (0.0%) |
| 5 to 17 Years | 2 (3.5%) | 12 (7.7%) |
| 18 to 34 Years | 1 (0.4%) | 20 (5.9%) |
| 35 to 64 Years | 79 (20.9%) | 89 (19.1%) |
| 65 to 74 Years | 17 (27.4%) | 44 (40.4%) |
| 75 Years and over | 25 (45.5%) | 53 (60.9%) |
Disability Class by Sex by Age in Stanfield
Disability Class: Hearing Difficulty
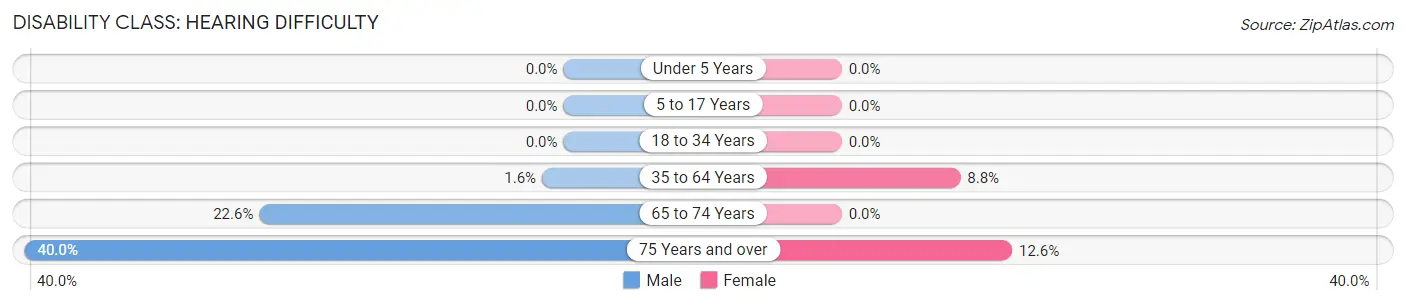
| Age Bracket | Male | Female |
| Under 5 Years | 0 (0.0%) | 0 (0.0%) |
| 5 to 17 Years | 0 (0.0%) | 0 (0.0%) |
| 18 to 34 Years | 0 (0.0%) | 0 (0.0%) |
| 35 to 64 Years | 6 (1.6%) | 41 (8.8%) |
| 65 to 74 Years | 14 (22.6%) | 0 (0.0%) |
| 75 Years and over | 22 (40.0%) | 11 (12.6%) |
Disability Class: Vision Difficulty
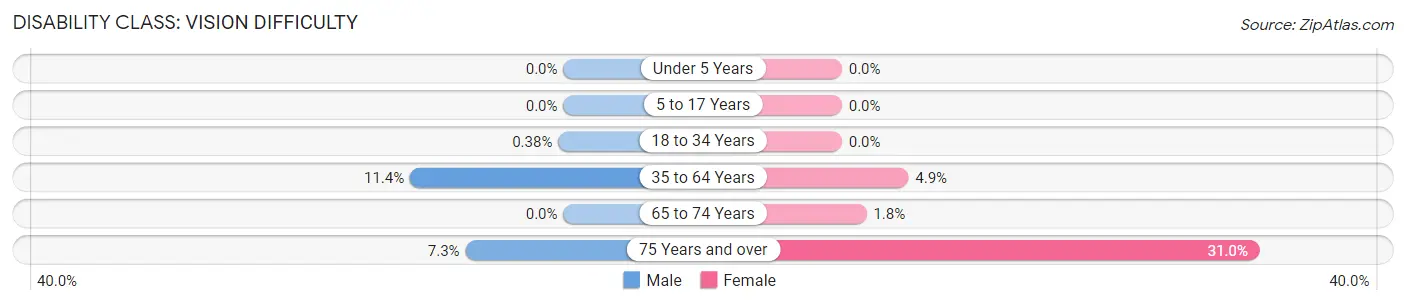
| Age Bracket | Male | Female |
| Under 5 Years | 0 (0.0%) | 0 (0.0%) |
| 5 to 17 Years | 0 (0.0%) | 0 (0.0%) |
| 18 to 34 Years | 1 (0.4%) | 0 (0.0%) |
| 35 to 64 Years | 43 (11.4%) | 23 (4.9%) |
| 65 to 74 Years | 0 (0.0%) | 2 (1.8%) |
| 75 Years and over | 4 (7.3%) | 27 (31.0%) |
Disability Class: Cognitive Difficulty
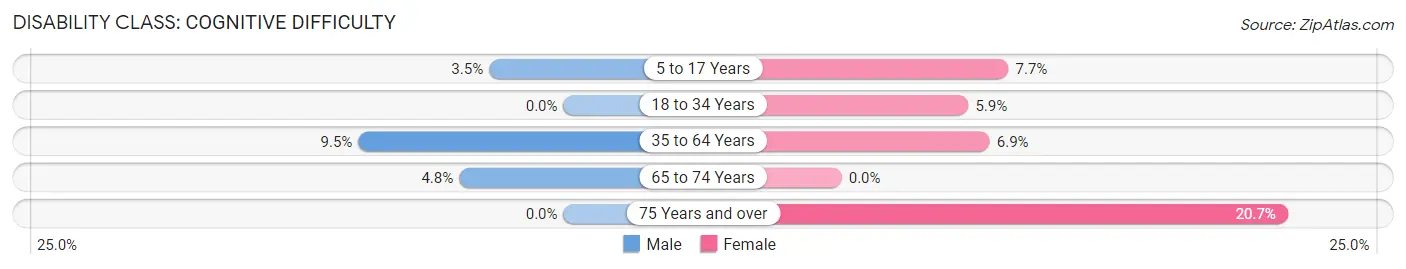
| Age Bracket | Male | Female |
| 5 to 17 Years | 2 (3.5%) | 12 (7.7%) |
| 18 to 34 Years | 0 (0.0%) | 20 (5.9%) |
| 35 to 64 Years | 36 (9.5%) | 32 (6.9%) |
| 65 to 74 Years | 3 (4.8%) | 0 (0.0%) |
| 75 Years and over | 0 (0.0%) | 18 (20.7%) |
Disability Class: Ambulatory Difficulty
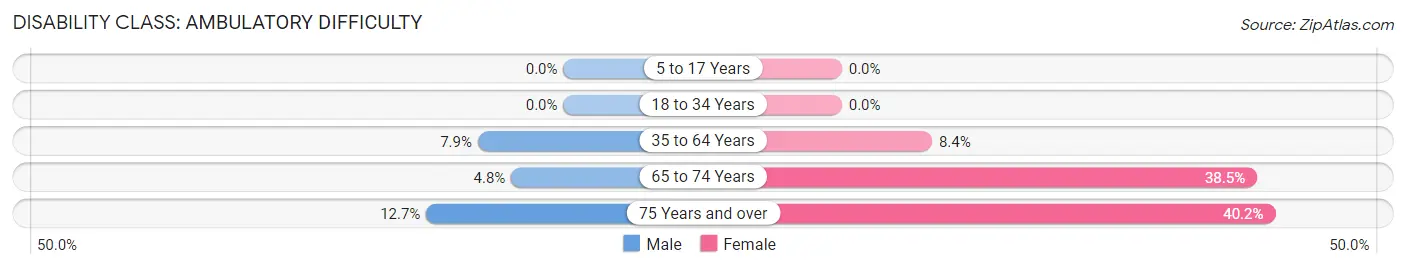
| Age Bracket | Male | Female |
| 5 to 17 Years | 0 (0.0%) | 0 (0.0%) |
| 18 to 34 Years | 0 (0.0%) | 0 (0.0%) |
| 35 to 64 Years | 30 (7.9%) | 39 (8.4%) |
| 65 to 74 Years | 3 (4.8%) | 42 (38.5%) |
| 75 Years and over | 7 (12.7%) | 35 (40.2%) |
Disability Class: Self-Care Difficulty
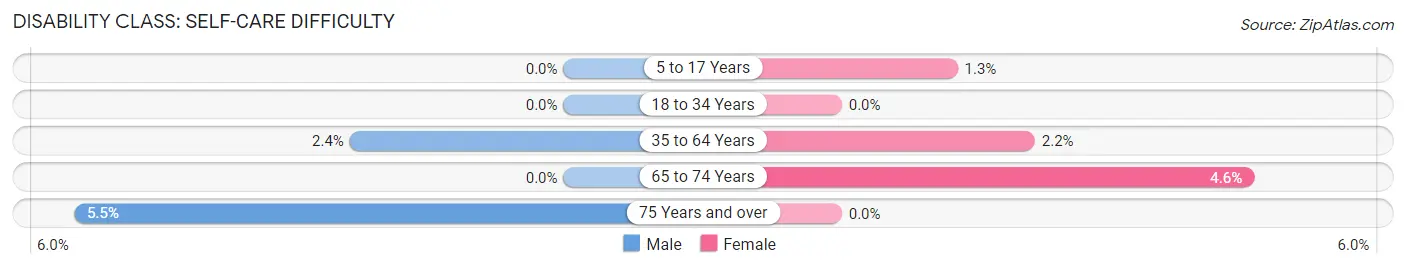
| Age Bracket | Male | Female |
| 5 to 17 Years | 0 (0.0%) | 2 (1.3%) |
| 18 to 34 Years | 0 (0.0%) | 0 (0.0%) |
| 35 to 64 Years | 9 (2.4%) | 10 (2.1%) |
| 65 to 74 Years | 0 (0.0%) | 5 (4.6%) |
| 75 Years and over | 3 (5.4%) | 0 (0.0%) |
Technology Access in Stanfield
Computing Device Access in Stanfield
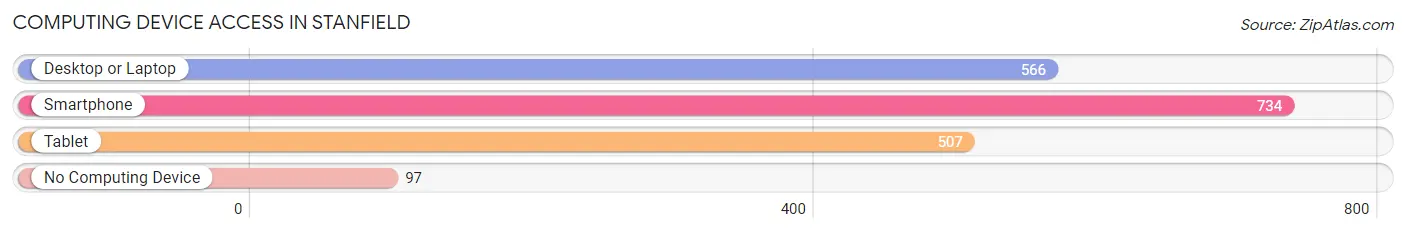
| Device Type | # Households | % Households |
| Desktop or Laptop | 566 | 65.6% |
| Smartphone | 734 | 85.1% |
| Tablet | 507 | 58.8% |
| No Computing Device | 97 | 11.2% |
| Total | 863 | 100.0% |
Internet Access in Stanfield
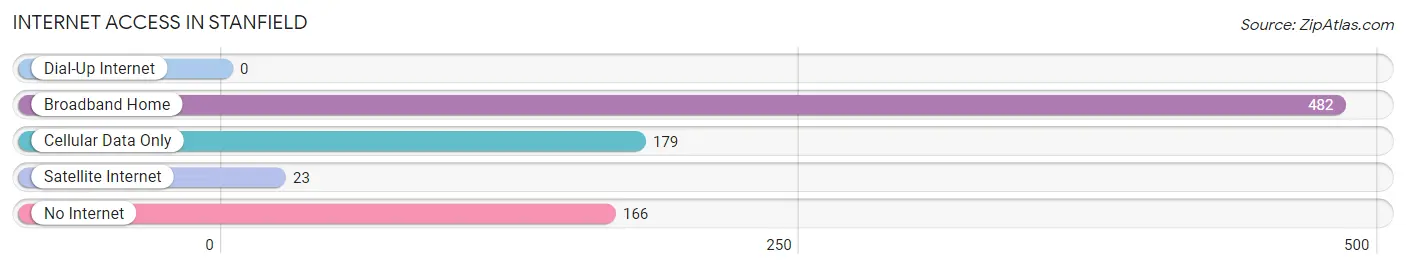
| Internet Type | # Households | % Households |
| Dial-Up Internet | 0 | 0.0% |
| Broadband Home | 482 | 55.8% |
| Cellular Data Only | 179 | 20.7% |
| Satellite Internet | 23 | 2.7% |
| No Internet | 166 | 19.2% |
| Total | 863 | 100.0% |
Stanfield Summary
Stanfield is a small city located in Umatilla County, Oregon, United States. It is situated along the Umatilla River, approximately 10 miles east of Hermiston and 20 miles west of Pendleton. The population was 1,541 at the 2010 census.
History
The area that is now Stanfield was originally inhabited by the Cayuse and Umatilla tribes. The first white settlers arrived in the area in the late 1800s, and the town was officially founded in 1887. The town was named after a local rancher, William Stanfield, who donated the land for the town.
In the early 1900s, Stanfield was a thriving agricultural community, with many farmers growing wheat, barley, and other crops. The town also had a number of businesses, including a bank, a hotel, a blacksmith, and a general store.
In the 1950s, Stanfield began to experience a decline in population as many of the town’s residents moved away in search of better economic opportunities. However, the town has experienced a resurgence in recent years, with many new businesses and residents moving to the area.
Geography
Stanfield is located in the Umatilla Valley, at an elevation of 1,717 feet. The city is situated along the Umatilla River, approximately 10 miles east of Hermiston and 20 miles west of Pendleton. The city covers an area of 1.3 square miles, and is located in the Umatilla National Forest.
The climate in Stanfield is semi-arid, with hot summers and cold winters. The average annual temperature is 54 degrees Fahrenheit, and the average annual precipitation is 8.5 inches.
Economy
The economy of Stanfield is largely based on agriculture. The city is home to several large farms, which produce a variety of crops, including wheat, barley, and hay. The city is also home to several food processing plants, which process and package a variety of fruits and vegetables.
In addition to agriculture, Stanfield is home to several small businesses, including restaurants, retail stores, and service providers. The city is also home to a number of manufacturing companies, which produce a variety of products, including furniture, clothing, and electronics.
Demographics
As of the 2010 census, the population of Stanfield was 1,541. The racial makeup of the city was 87.3% White, 0.7% African American, 0.7% Native American, 0.3% Asian, 0.1% Pacific Islander, 8.2% from other races, and 2.9% from two or more races. Hispanic or Latino of any race were 16.2% of the population.
The median household income in Stanfield was $37,917, and the median family income was $41,250. The per capita income for the city was $17,845. About 16.2% of families and 19.2% of the population were below the poverty line, including 25.2% of those under age 18 and 8.3% of those age 65 or over.
Common Questions
What is Per Capita Income in Stanfield?
Per Capita income in Stanfield is $29,077.
What is the Median Family Income in Stanfield?
Median Family Income in Stanfield is $74,167.
What is the Median Household income in Stanfield?
Median Household Income in Stanfield is $68,750.
What is Income or Wage Gap in Stanfield?
Income or Wage Gap in Stanfield is 45.1%.
Women in Stanfield earn 54.9 cents for every dollar earned by a man.
What is Family Income Deficit in Stanfield?
Family Income Deficit in Stanfield is $17,390.
Families that are below poverty line in Stanfield earn $17,390 less on average than the poverty threshold level.
What is Inequality or Gini Index in Stanfield?
Inequality or Gini Index in Stanfield is 0.33.
What is the Total Population of Stanfield?
Total Population of Stanfield is 2,128.
What is the Total Male Population of Stanfield?
Total Male Population of Stanfield is 924.
What is the Total Female Population of Stanfield?
Total Female Population of Stanfield is 1,204.
What is the Ratio of Males per 100 Females in Stanfield?
There are 76.74 Males per 100 Females in Stanfield.
What is the Ratio of Females per 100 Males in Stanfield?
There are 130.30 Females per 100 Males in Stanfield.
What is the Median Population Age in Stanfield?
Median Population Age in Stanfield is 40.9 Years.
What is the Average Family Size in Stanfield
Average Family Size in Stanfield is 2.7 People.
What is the Average Household Size in Stanfield
Average Household Size in Stanfield is 2.5 People.
How Large is the Labor Force in Stanfield?
There are 1,083 People in the Labor Forcein in Stanfield.
What is the Percentage of People in the Labor Force in Stanfield?
60.9% of People are in the Labor Force in Stanfield.
What is the Unemployment Rate in Stanfield?
Unemployment Rate in Stanfield is 6.7%.