Wasco, OR Map & Demographics
Wasco Map
Wasco Overview
$29,136
PER CAPITA INCOME
$54,063
AVG FAMILY INCOME
$53,542
AVG HOUSEHOLD INCOME
43.9%
WAGE / INCOME GAP [ % ]
56.1¢/ $1
WAGE / INCOME GAP [ $ ]
0.38
INEQUALITY / GINI INDEX
482
TOTAL POPULATION
248
MALE POPULATION
234
FEMALE POPULATION
105.98
MALES / 100 FEMALES
94.35
FEMALES / 100 MALES
51.7
MEDIAN AGE
3.1
AVG FAMILY SIZE
2.4
AVG HOUSEHOLD SIZE
196
LABOR FORCE [ PEOPLE ]
46.8%
PERCENT IN LABOR FORCE
2.0%
UNEMPLOYMENT RATE
Wasco Zip Codes
Wasco Area Codes
Income in Wasco
Income Overview in Wasco
Per Capita Income in Wasco is $29,136, while median incomes of families and households are $54,063 and $53,542 respectively.
| Characteristic | Number | Measure |
| Per Capita Income | 482 | $29,136 |
| Median Family Income | 115 | $54,063 |
| Mean Family Income | 115 | $67,926 |
| Median Household Income | 201 | $53,542 |
| Mean Household Income | 201 | $63,269 |
| Income Deficit | 115 | $0 |
| Wage / Income Gap (%) | 482 | 43.91% |
| Wage / Income Gap ($) | 482 | 56.09¢ per $1 |
| Gini / Inequality Index | 482 | 0.38 |
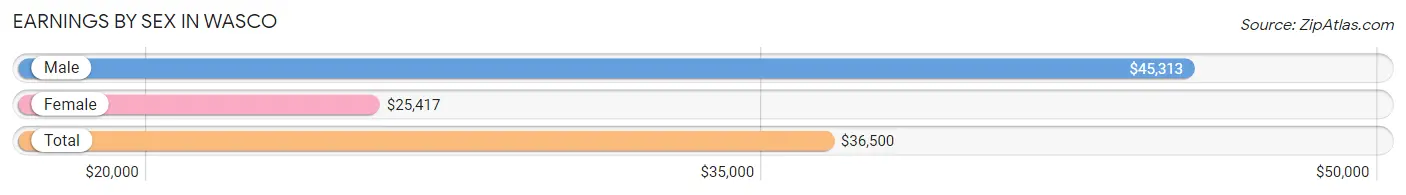
Earnings by Sex in Wasco
Average Earnings in Wasco are $36,500, $45,313 for men and $25,417 for women, a difference of 43.9%.
| Sex | Number | Average Earnings |
| Male | 133 (59.9%) | $45,313 |
| Female | 89 (40.1%) | $25,417 |
| Total | 222 (100.0%) | $36,500 |
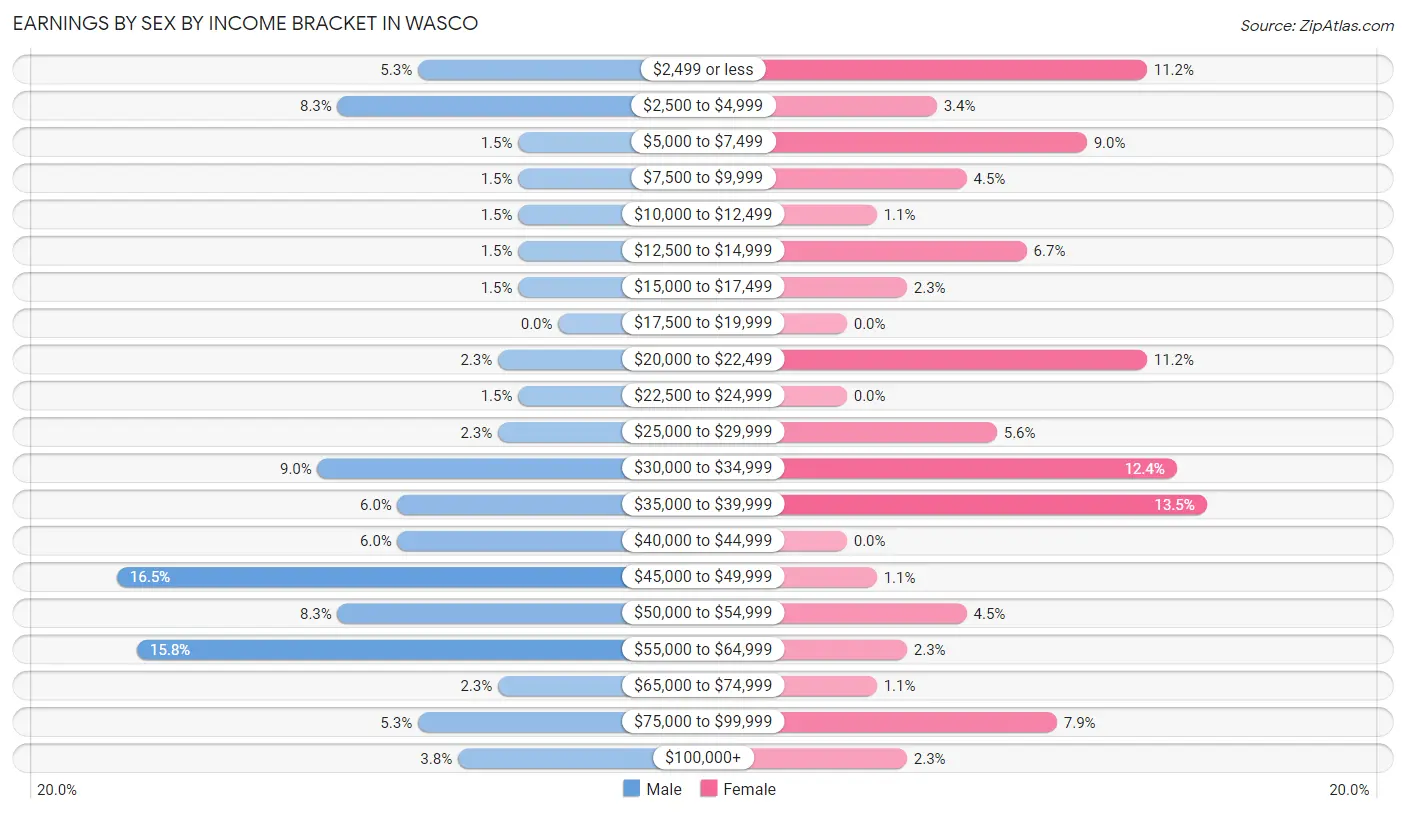
Earnings by Sex by Income Bracket in Wasco
The most common earnings brackets in Wasco are $45,000 to $49,999 for men (22 | 16.5%) and $35,000 to $39,999 for women (12 | 13.5%).
| Income | Male | Female |
| $2,499 or less | 7 (5.3%) | 10 (11.2%) |
| $2,500 to $4,999 | 11 (8.3%) | 3 (3.4%) |
| $5,000 to $7,499 | 2 (1.5%) | 8 (9.0%) |
| $7,500 to $9,999 | 2 (1.5%) | 4 (4.5%) |
| $10,000 to $12,499 | 2 (1.5%) | 1 (1.1%) |
| $12,500 to $14,999 | 2 (1.5%) | 6 (6.7%) |
| $15,000 to $17,499 | 2 (1.5%) | 2 (2.2%) |
| $17,500 to $19,999 | 0 (0.0%) | 0 (0.0%) |
| $20,000 to $22,499 | 3 (2.3%) | 10 (11.2%) |
| $22,500 to $24,999 | 2 (1.5%) | 0 (0.0%) |
| $25,000 to $29,999 | 3 (2.3%) | 5 (5.6%) |
| $30,000 to $34,999 | 12 (9.0%) | 11 (12.4%) |
| $35,000 to $39,999 | 8 (6.0%) | 12 (13.5%) |
| $40,000 to $44,999 | 8 (6.0%) | 0 (0.0%) |
| $45,000 to $49,999 | 22 (16.5%) | 1 (1.1%) |
| $50,000 to $54,999 | 11 (8.3%) | 4 (4.5%) |
| $55,000 to $64,999 | 21 (15.8%) | 2 (2.2%) |
| $65,000 to $74,999 | 3 (2.3%) | 1 (1.1%) |
| $75,000 to $99,999 | 7 (5.3%) | 7 (7.9%) |
| $100,000+ | 5 (3.8%) | 2 (2.2%) |
| Total | 133 (100.0%) | 89 (100.0%) |
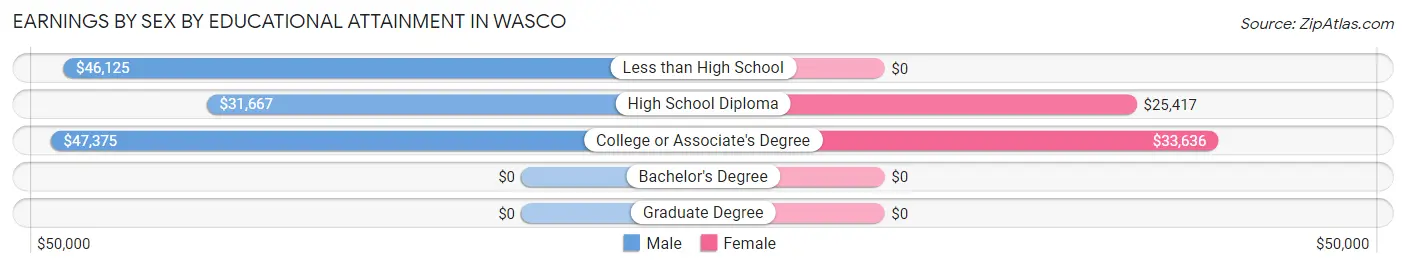
Earnings by Sex by Educational Attainment in Wasco
Average earnings in Wasco are $45,125 for men and $32,614 for women, a difference of 27.7%. Men with an educational attainment of college or associate's degree enjoy the highest average annual earnings of $47,375, while those with high school diploma education earn the least with $31,667. Women with an educational attainment of college or associate's degree earn the most with the average annual earnings of $33,636, while those with high school diploma education have the smallest earnings of $25,417.
| Educational Attainment | Male Income | Female Income |
| Less than High School | $46,125 | $0 |
| High School Diploma | $31,667 | $25,417 |
| College or Associate's Degree | $47,375 | $33,636 |
| Bachelor's Degree | - | - |
| Graduate Degree | - | - |
| Total | $45,125 | $32,614 |
Family Income in Wasco
Family Income Brackets in Wasco
According to the Wasco family income data, there are 27 families falling into the $75,000 to $99,999 income range, which is the most common income bracket and makes up 23.5% of all families. Conversely, the less than $10,000 income bracket is the least frequent group with only 3 families (2.6%) belonging to this category.
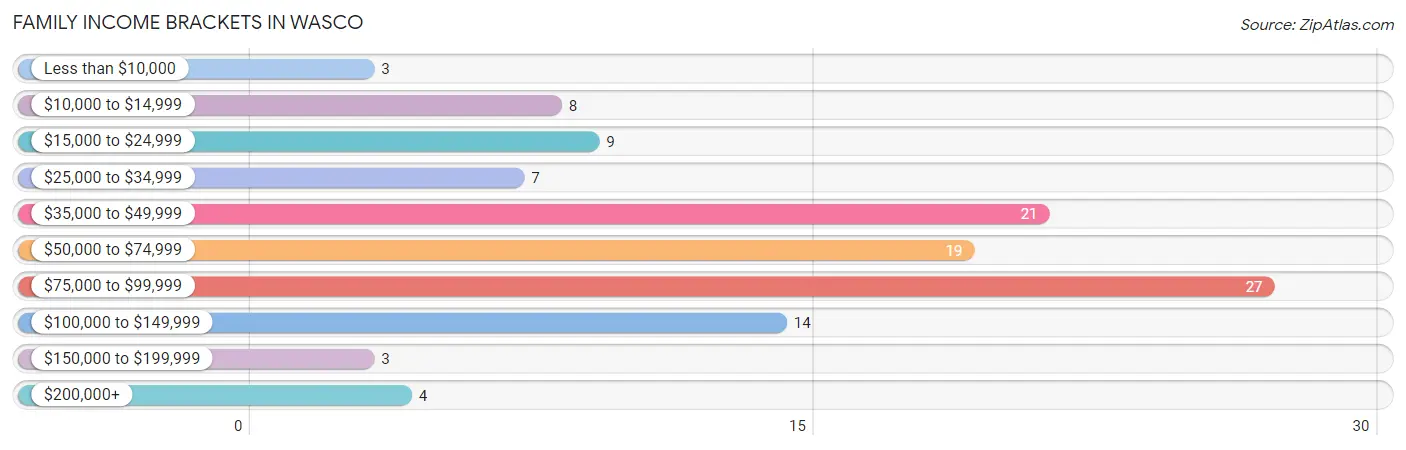
| Income Bracket | # Families | % Families |
| Less than $10,000 | 3 | 2.6% |
| $10,000 to $14,999 | 8 | 7.0% |
| $15,000 to $24,999 | 9 | 7.8% |
| $25,000 to $34,999 | 7 | 6.1% |
| $35,000 to $49,999 | 21 | 18.3% |
| $50,000 to $74,999 | 19 | 16.5% |
| $75,000 to $99,999 | 27 | 23.5% |
| $100,000 to $149,999 | 14 | 12.2% |
| $150,000 to $199,999 | 3 | 2.6% |
| $200,000+ | 4 | 3.5% |
Family Income by Famaliy Size in Wasco
3-person families (15 | 13.0%) account for the highest median family income in Wasco with $80,250 per family, while 3-person families (15 | 13.0%) have the highest median income of $26,750 per family member.
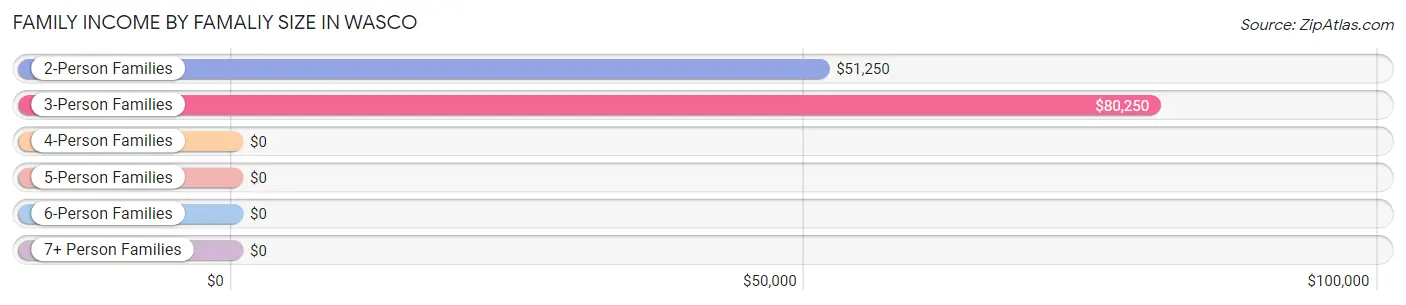
| Income Bracket | # Families | Median Income |
| 2-Person Families | 76 (66.1%) | $51,250 |
| 3-Person Families | 15 (13.0%) | $80,250 |
| 4-Person Families | 21 (18.3%) | $0 |
| 5-Person Families | 2 (1.7%) | $0 |
| 6-Person Families | 0 (0.0%) | $0 |
| 7+ Person Families | 1 (0.9%) | $0 |
| Total | 115 (100.0%) | $54,063 |
Family Income by Number of Earners in Wasco
The median family income in Wasco is $54,063, with families comprising 1 earner (51) having the highest median family income of $78,958, while families with no earners (34) have the lowest median family income of $36,250, accounting for 44.4% and 29.6% of families, respectively.
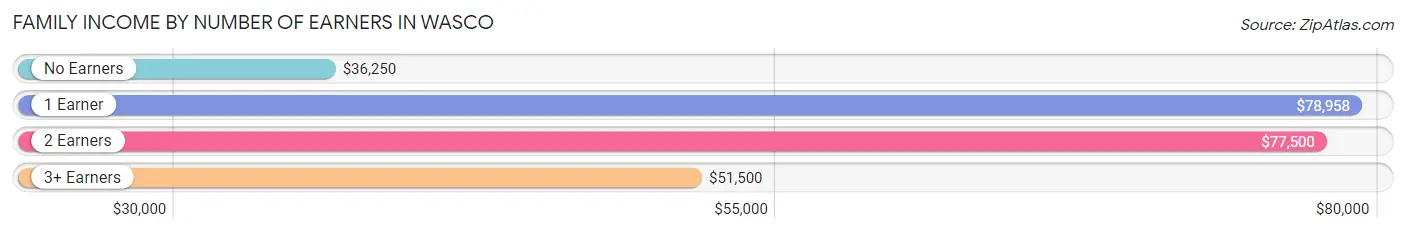
| Number of Earners | # Families | Median Income |
| No Earners | 34 (29.6%) | $36,250 |
| 1 Earner | 51 (44.4%) | $78,958 |
| 2 Earners | 22 (19.1%) | $77,500 |
| 3+ Earners | 8 (7.0%) | $51,500 |
| Total | 115 (100.0%) | $54,063 |
Household Income in Wasco
Household Income Brackets in Wasco
With 48 households falling in the category, the $50,000 to $74,999 income range is the most frequent in Wasco, accounting for 23.9% of all households. In contrast, only 3 households (1.5%) fall into the less than $10,000 income bracket, making it the least populous group.
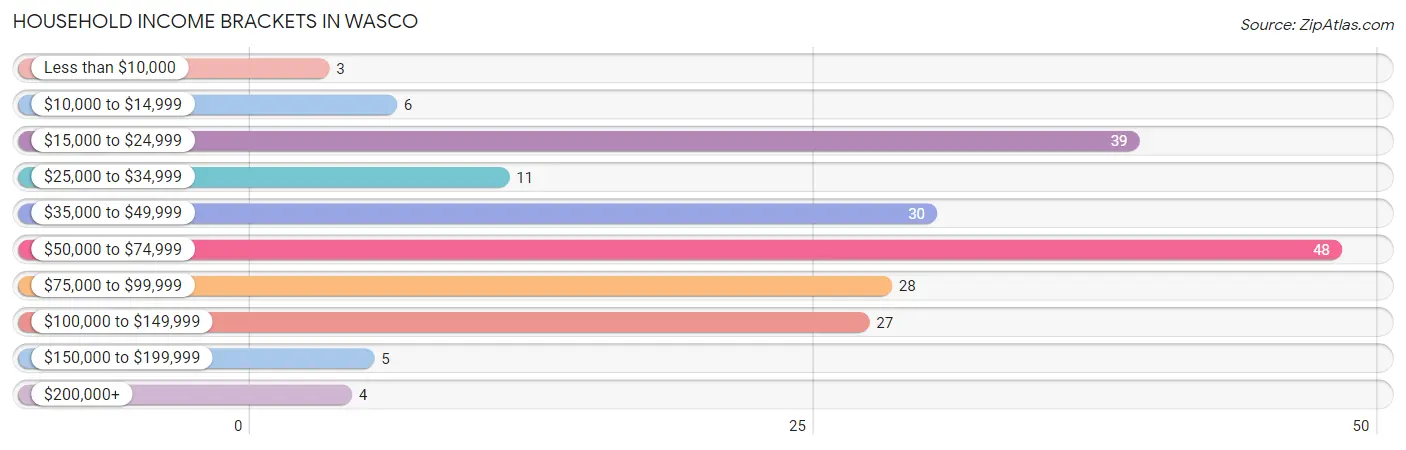
| Income Bracket | # Households | % Households |
| Less than $10,000 | 3 | 1.5% |
| $10,000 to $14,999 | 6 | 3.0% |
| $15,000 to $24,999 | 39 | 19.4% |
| $25,000 to $34,999 | 11 | 5.5% |
| $35,000 to $49,999 | 30 | 14.9% |
| $50,000 to $74,999 | 48 | 23.9% |
| $75,000 to $99,999 | 28 | 13.9% |
| $100,000 to $149,999 | 27 | 13.4% |
| $150,000 to $199,999 | 5 | 2.5% |
| $200,000+ | 4 | 2.0% |
Household Income by Householder Age in Wasco
The median household income in Wasco is $53,542, with the highest median household income of $76,563 found in the 25 to 44 years age bracket for the primary householder. A total of 45 households (22.4%) fall into this category. Meanwhile, the 15 to 24 years age bracket for the primary householder has the lowest median household income of $0, with 1 households (0.5%) in this group.
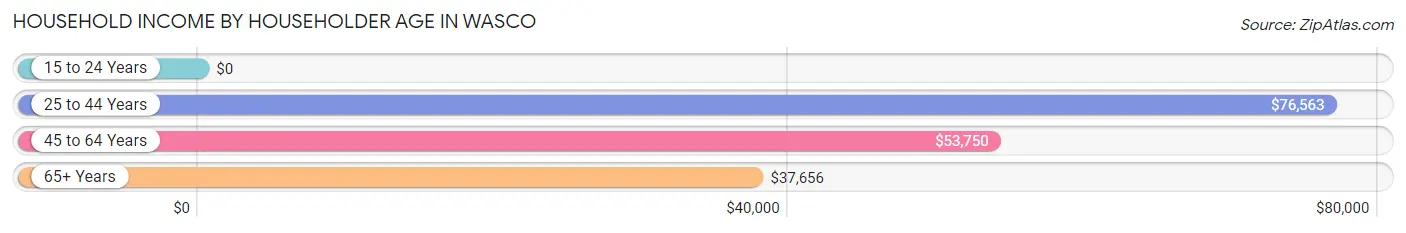
| Income Bracket | # Households | Median Income |
| 15 to 24 Years | 1 (0.5%) | $0 |
| 25 to 44 Years | 45 (22.4%) | $76,563 |
| 45 to 64 Years | 46 (22.9%) | $53,750 |
| 65+ Years | 109 (54.2%) | $37,656 |
| Total | 201 (100.0%) | $53,542 |
Poverty in Wasco
Income Below Poverty by Sex and Age in Wasco
With 16.5% poverty level for males and 17.9% for females among the residents of Wasco, 12 to 14 year old males and 5 year old females are the most vulnerable to poverty, with 10 males (100.0%) and 4 females (80.0%) in their respective age groups living below the poverty level.
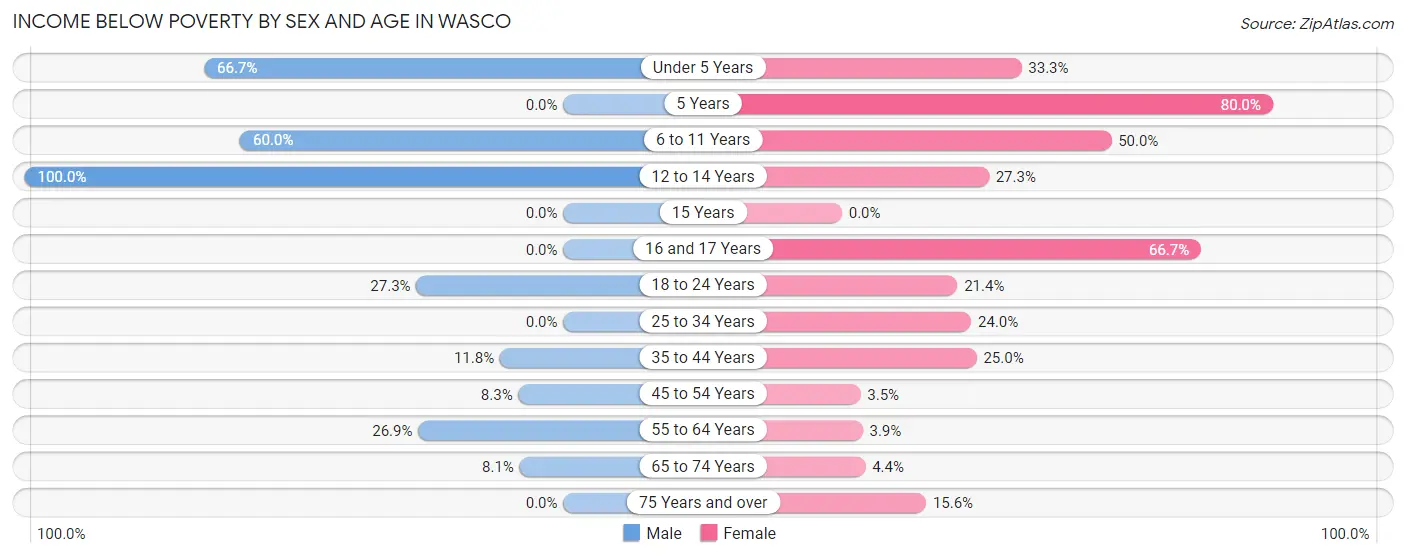
| Age Bracket | Male | Female |
| Under 5 Years | 4 (66.7%) | 2 (33.3%) |
| 5 Years | 0 (0.0%) | 4 (80.0%) |
| 6 to 11 Years | 3 (60.0%) | 8 (50.0%) |
| 12 to 14 Years | 10 (100.0%) | 3 (27.3%) |
| 15 Years | 0 (0.0%) | 0 (0.0%) |
| 16 and 17 Years | 0 (0.0%) | 2 (66.7%) |
| 18 to 24 Years | 3 (27.3%) | 3 (21.4%) |
| 25 to 34 Years | 0 (0.0%) | 6 (24.0%) |
| 35 to 44 Years | 2 (11.8%) | 5 (25.0%) |
| 45 to 54 Years | 2 (8.3%) | 1 (3.5%) |
| 55 to 64 Years | 14 (26.9%) | 1 (3.8%) |
| 65 to 74 Years | 3 (8.1%) | 2 (4.3%) |
| 75 Years and over | 0 (0.0%) | 5 (15.6%) |
| Total | 41 (16.5%) | 42 (17.9%) |
Income Above Poverty by Sex and Age in Wasco
According to the poverty statistics in Wasco, males aged 15 years and females aged 15 years are the age groups that are most secure financially, with 100.0% of males and 100.0% of females in these age groups living above the poverty line.
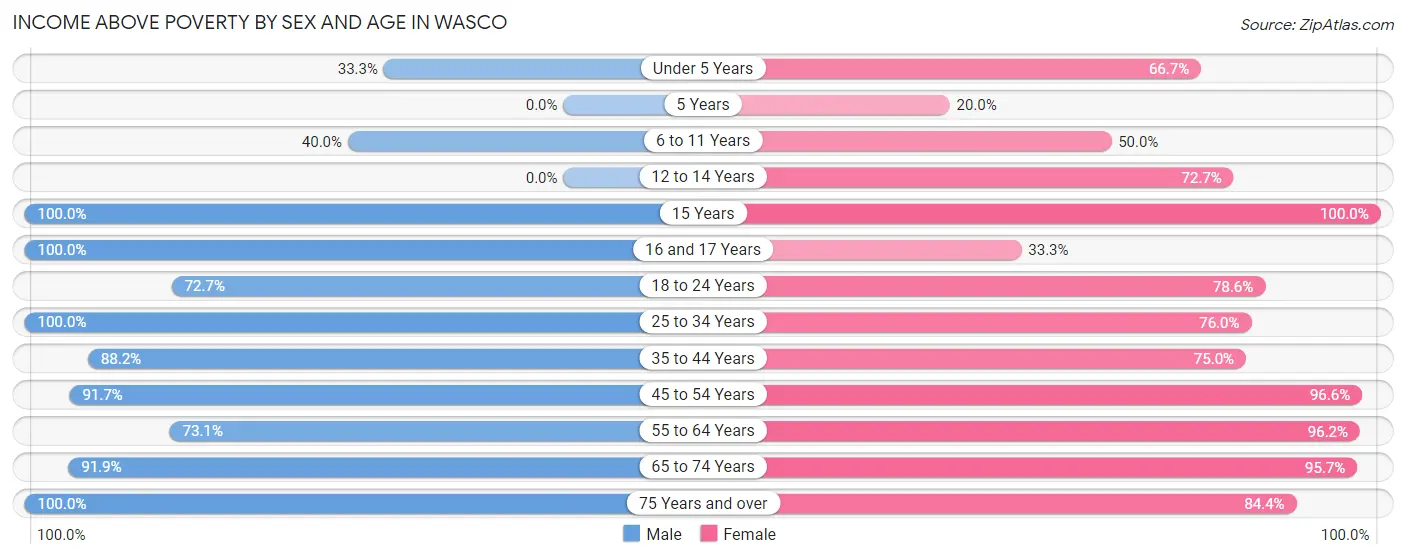
| Age Bracket | Male | Female |
| Under 5 Years | 2 (33.3%) | 4 (66.7%) |
| 5 Years | 0 (0.0%) | 1 (20.0%) |
| 6 to 11 Years | 2 (40.0%) | 8 (50.0%) |
| 12 to 14 Years | 0 (0.0%) | 8 (72.7%) |
| 15 Years | 3 (100.0%) | 1 (100.0%) |
| 16 and 17 Years | 3 (100.0%) | 1 (33.3%) |
| 18 to 24 Years | 8 (72.7%) | 11 (78.6%) |
| 25 to 34 Years | 41 (100.0%) | 19 (76.0%) |
| 35 to 44 Years | 15 (88.2%) | 15 (75.0%) |
| 45 to 54 Years | 22 (91.7%) | 28 (96.6%) |
| 55 to 64 Years | 38 (73.1%) | 25 (96.2%) |
| 65 to 74 Years | 34 (91.9%) | 44 (95.7%) |
| 75 Years and over | 39 (100.0%) | 27 (84.4%) |
| Total | 207 (83.5%) | 192 (82.1%) |
Income Below Poverty Among Married-Couple Families in Wasco
The poverty statistics for married-couple families in Wasco show that 4.7% or 4 of the total 85 families live below the poverty line. Families with 5 or more children have the highest poverty rate of 100.0%, comprising of 1 families. On the other hand, families with 3 or 4 children have the lowest poverty rate of 0.0%, which includes 0 families.
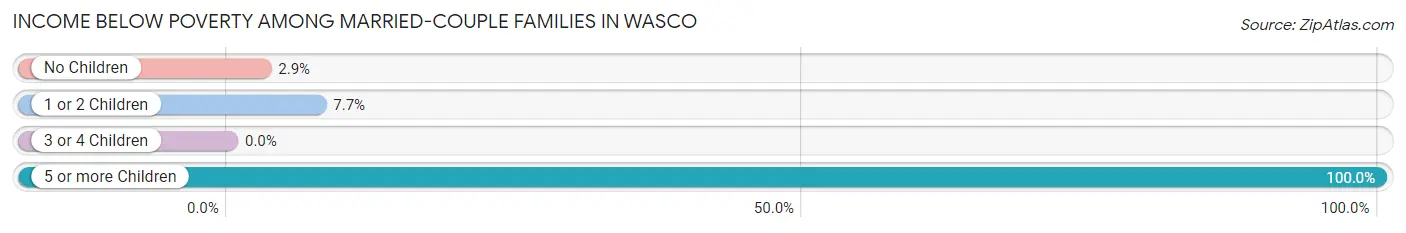
| Children | Above Poverty | Below Poverty |
| No Children | 67 (97.1%) | 2 (2.9%) |
| 1 or 2 Children | 12 (92.3%) | 1 (7.7%) |
| 3 or 4 Children | 2 (100.0%) | 0 (0.0%) |
| 5 or more Children | 0 (0.0%) | 1 (100.0%) |
| Total | 81 (95.3%) | 4 (4.7%) |
Income Below Poverty Among Single-Parent Households in Wasco
According to the poverty data in Wasco, 20.0% or 2 single-father households and 65.0% or 13 single-mother households are living below the poverty line. Among single-father households, those with 1 or 2 children have the highest poverty rate, with 2 households (66.7%) experiencing poverty. Likewise, among single-mother households, those with 3 or 4 children have the highest poverty rate, with 6 households (100.0%) falling below the poverty line.
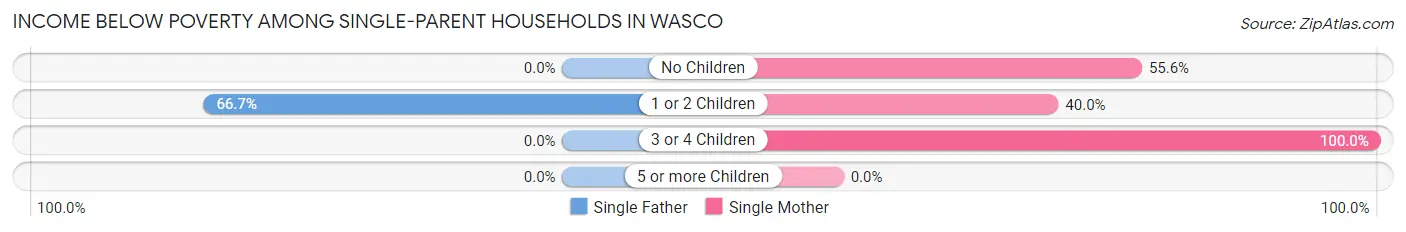
| Children | Single Father | Single Mother |
| No Children | 0 (0.0%) | 5 (55.6%) |
| 1 or 2 Children | 2 (66.7%) | 2 (40.0%) |
| 3 or 4 Children | 0 (0.0%) | 6 (100.0%) |
| 5 or more Children | 0 (0.0%) | 0 (0.0%) |
| Total | 2 (20.0%) | 13 (65.0%) |
Income Below Poverty Among Married-Couple vs Single-Parent Households in Wasco
The poverty data for Wasco shows that 4 of the married-couple family households (4.7%) and 15 of the single-parent households (50.0%) are living below the poverty level. Within the married-couple family households, those with 5 or more children have the highest poverty rate, with 1 households (100.0%) falling below the poverty line. Among the single-parent households, those with 3 or 4 children have the highest poverty rate, with 6 household (100.0%) living below poverty.
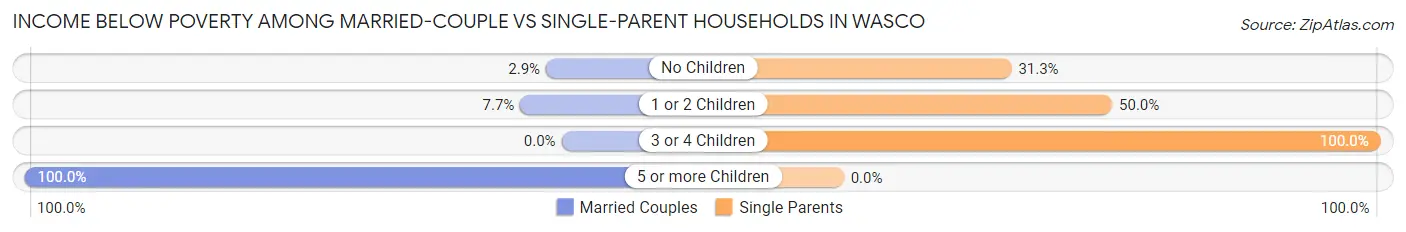
| Children | Married-Couple Families | Single-Parent Households |
| No Children | 2 (2.9%) | 5 (31.2%) |
| 1 or 2 Children | 1 (7.7%) | 4 (50.0%) |
| 3 or 4 Children | 0 (0.0%) | 6 (100.0%) |
| 5 or more Children | 1 (100.0%) | 0 (0.0%) |
| Total | 4 (4.7%) | 15 (50.0%) |
Race in Wasco
The most populous races in Wasco are White / Caucasian (410 | 85.1%), Two or more Races (64 | 13.3%), and Hispanic or Latino (28 | 5.8%).
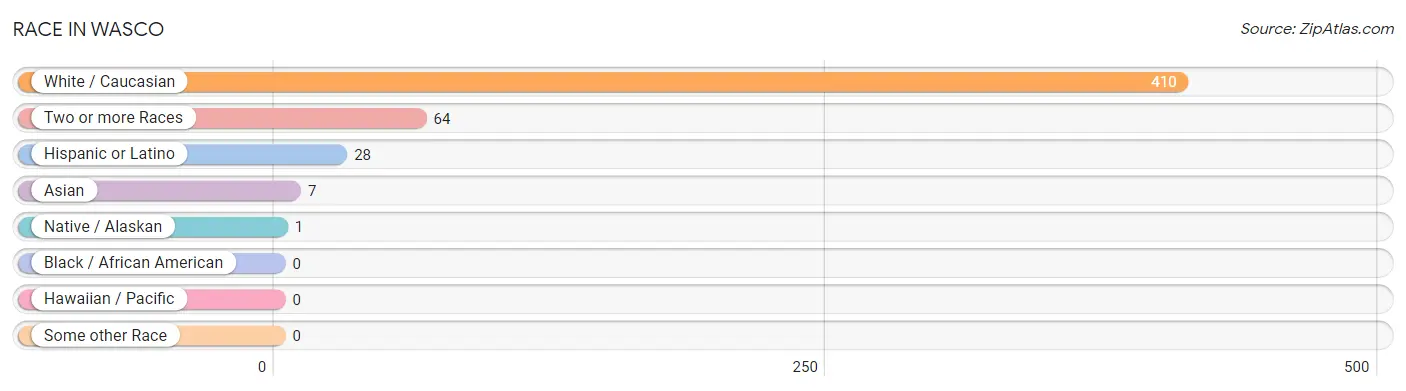
| Race | # Population | % Population |
| Asian | 7 | 1.5% |
| Black / African American | 0 | 0.0% |
| Hawaiian / Pacific | 0 | 0.0% |
| Hispanic or Latino | 28 | 5.8% |
| Native / Alaskan | 1 | 0.2% |
| White / Caucasian | 410 | 85.1% |
| Two or more Races | 64 | 13.3% |
| Some other Race | 0 | 0.0% |
| Total | 482 | 100.0% |
Ancestry in Wasco
The most populous ancestries reported in Wasco are English (114 | 23.6%), German (109 | 22.6%), European (39 | 8.1%), Irish (32 | 6.6%), and Mexican (23 | 4.8%), together accounting for 65.8% of all Wasco residents.
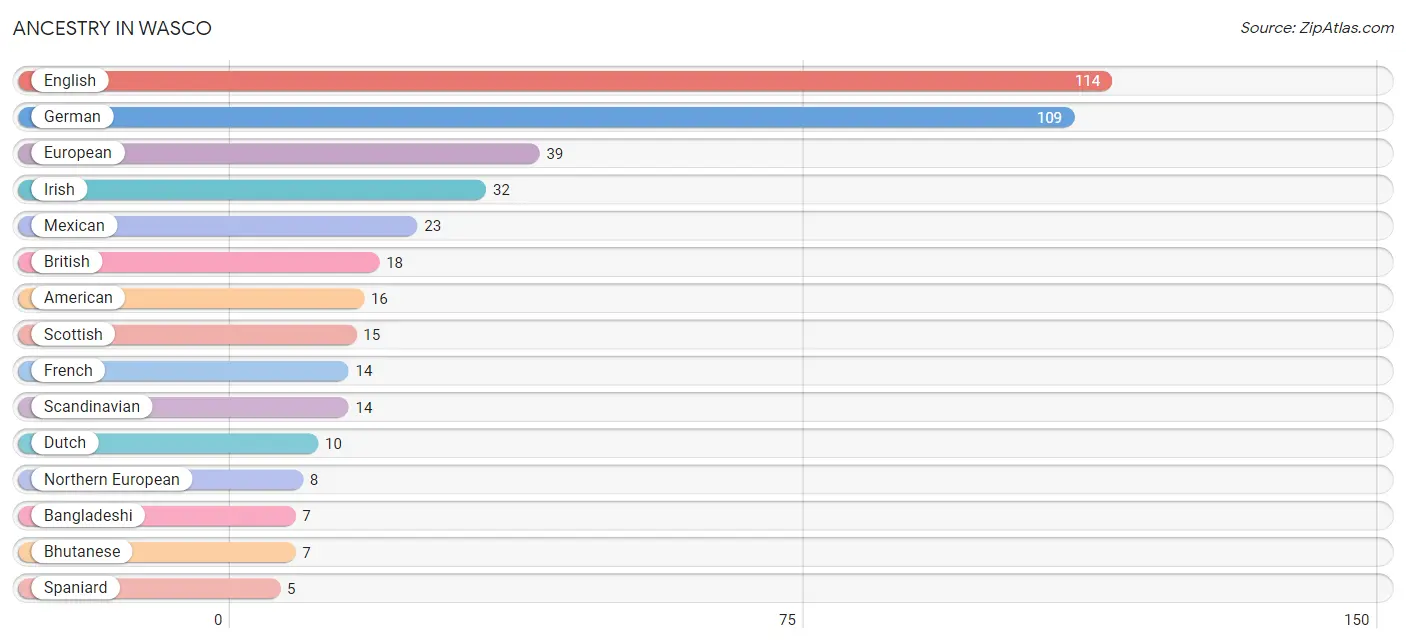
| Ancestry | # Population | % Population |
| American | 16 | 3.3% |
| Bangladeshi | 7 | 1.5% |
| Bhutanese | 7 | 1.5% |
| Blackfeet | 2 | 0.4% |
| British | 18 | 3.7% |
| Danish | 3 | 0.6% |
| Dutch | 10 | 2.1% |
| English | 114 | 23.6% |
| European | 39 | 8.1% |
| Finnish | 4 | 0.8% |
| French | 14 | 2.9% |
| German | 109 | 22.6% |
| Inupiat | 4 | 0.8% |
| Irish | 32 | 6.6% |
| Italian | 4 | 0.8% |
| Mexican | 23 | 4.8% |
| Navajo | 3 | 0.6% |
| Northern European | 8 | 1.7% |
| Norwegian | 4 | 0.8% |
| Polish | 2 | 0.4% |
| Scandinavian | 14 | 2.9% |
| Scottish | 15 | 3.1% |
| Sioux | 1 | 0.2% |
| Spaniard | 5 | 1.0% |
| Swedish | 2 | 0.4% |
| Swiss | 3 | 0.6% | View All 26 Rows |
Immigrants in Wasco
The most numerous immigrant groups reported in Wasco came from Eastern Europe (2 | 0.4%), Europe (2 | 0.4%), and Poland (2 | 0.4%), together accounting for 1.2% of all Wasco residents.
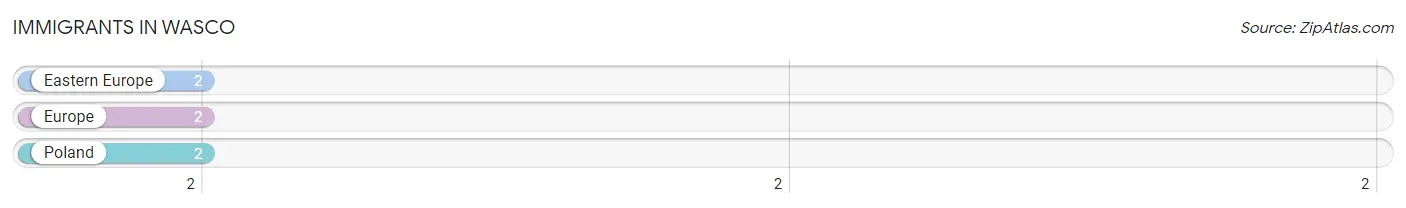
| Immigration Origin | # Population | % Population |
| Eastern Europe | 2 | 0.4% |
| Europe | 2 | 0.4% |
| Poland | 2 | 0.4% | View All 3 Rows |
Sex and Age in Wasco
Sex and Age in Wasco
The most populous age groups in Wasco are 55 to 59 Years (35 | 14.1%) for men and 70 to 74 Years (33 | 14.1%) for women.
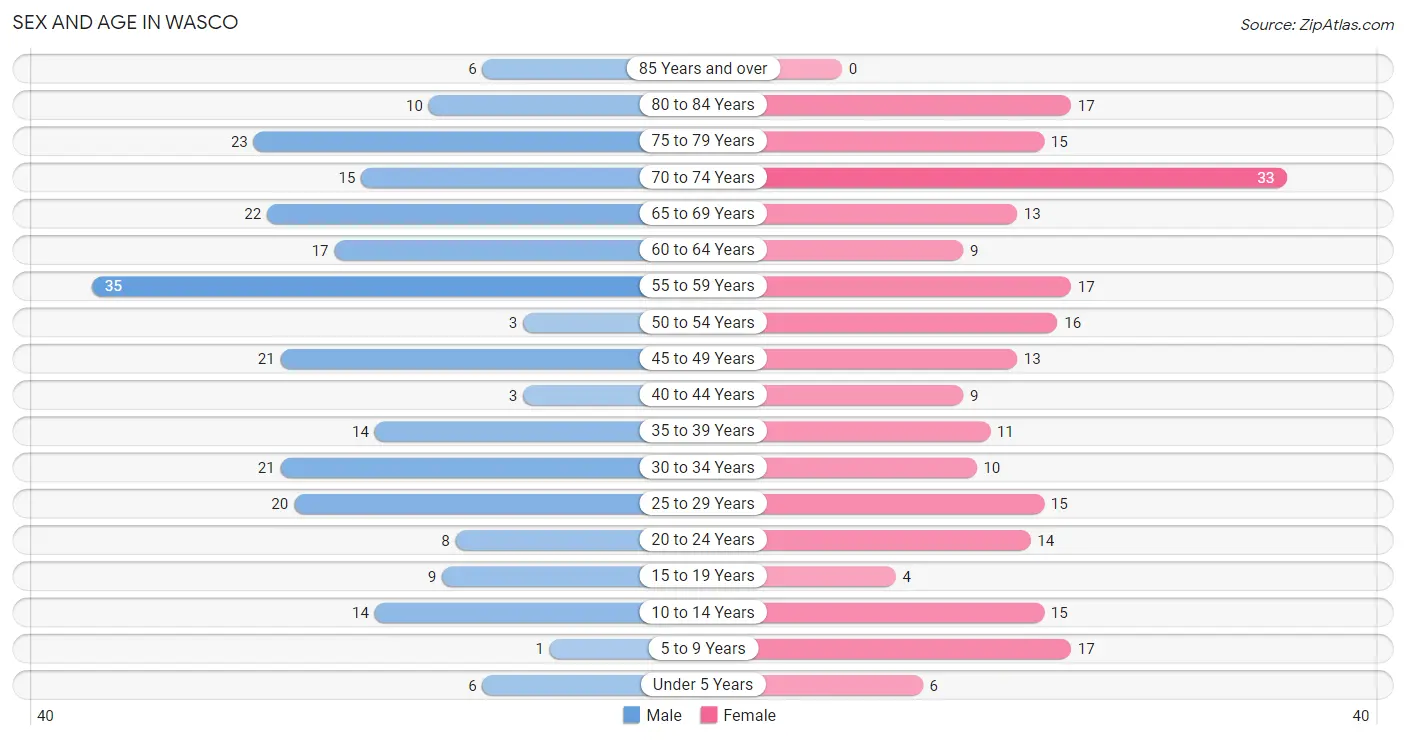
| Age Bracket | Male | Female |
| Under 5 Years | 6 (2.4%) | 6 (2.6%) |
| 5 to 9 Years | 1 (0.4%) | 17 (7.3%) |
| 10 to 14 Years | 14 (5.7%) | 15 (6.4%) |
| 15 to 19 Years | 9 (3.6%) | 4 (1.7%) |
| 20 to 24 Years | 8 (3.2%) | 14 (6.0%) |
| 25 to 29 Years | 20 (8.1%) | 15 (6.4%) |
| 30 to 34 Years | 21 (8.5%) | 10 (4.3%) |
| 35 to 39 Years | 14 (5.7%) | 11 (4.7%) |
| 40 to 44 Years | 3 (1.2%) | 9 (3.8%) |
| 45 to 49 Years | 21 (8.5%) | 13 (5.6%) |
| 50 to 54 Years | 3 (1.2%) | 16 (6.8%) |
| 55 to 59 Years | 35 (14.1%) | 17 (7.3%) |
| 60 to 64 Years | 17 (6.9%) | 9 (3.8%) |
| 65 to 69 Years | 22 (8.9%) | 13 (5.6%) |
| 70 to 74 Years | 15 (6.0%) | 33 (14.1%) |
| 75 to 79 Years | 23 (9.3%) | 15 (6.4%) |
| 80 to 84 Years | 10 (4.0%) | 17 (7.3%) |
| 85 Years and over | 6 (2.4%) | 0 (0.0%) |
| Total | 248 (100.0%) | 234 (100.0%) |
Families and Households in Wasco
Median Family Size in Wasco
The median family size in Wasco is 3.07 persons per family, with single male/father families (10 | 8.7%) accounting for the largest median family size of 4.7 persons per family. On the other hand, married-couple families (85 | 73.9%) represent the smallest median family size with 2.72 persons per family.
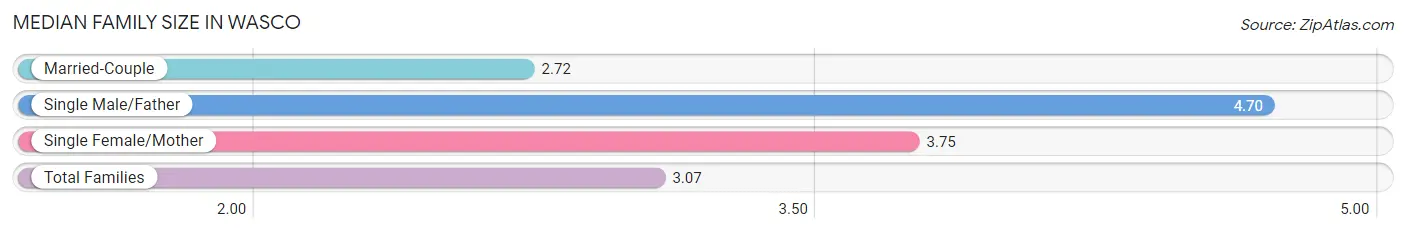
| Family Type | # Families | Family Size |
| Married-Couple | 85 (73.9%) | 2.72 |
| Single Male/Father | 10 (8.7%) | 4.70 |
| Single Female/Mother | 20 (17.4%) | 3.75 |
| Total Families | 115 (100.0%) | 3.07 |
Median Household Size in Wasco
The median household size in Wasco is 2.40 persons per household, with single male/father households (10 | 5.0%) accounting for the largest median household size of 4.9 persons per household. non-family households (86 | 42.8%) represent the smallest median household size with 1.34 persons per household.
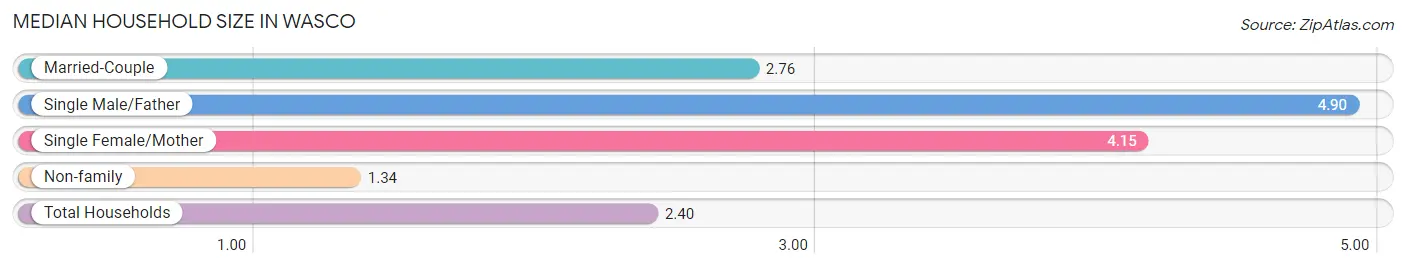
| Household Type | # Households | Household Size |
| Married-Couple | 85 (42.3%) | 2.76 |
| Single Male/Father | 10 (5.0%) | 4.90 |
| Single Female/Mother | 20 (10.0%) | 4.15 |
| Non-family | 86 (42.8%) | 1.34 |
| Total Households | 201 (100.0%) | 2.40 |
Household Size by Marriage Status in Wasco
Out of a total of 201 households in Wasco, 115 (57.2%) are family households, while 86 (42.8%) are nonfamily households. The most numerous type of family households are 2-person households, comprising 73, and the most common type of nonfamily households are 1-person households, comprising 65.
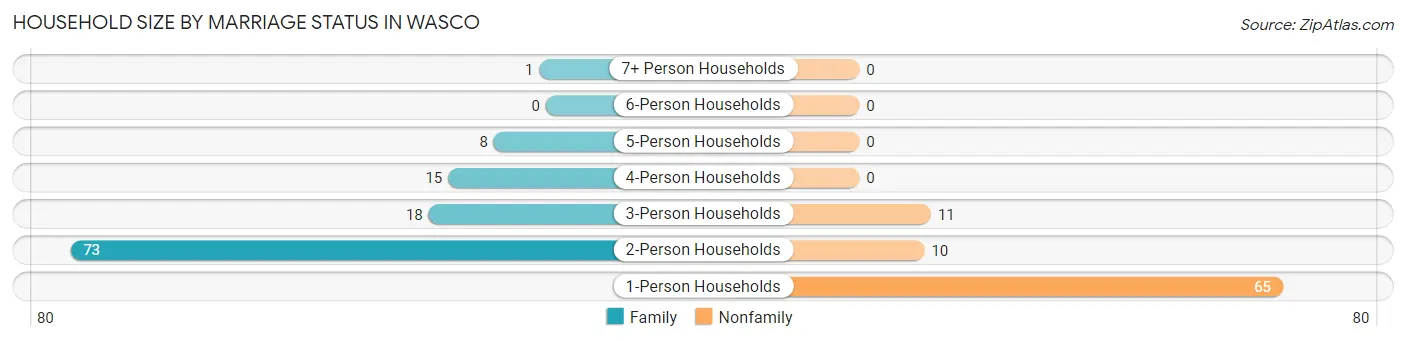
| Household Size | Family Households | Nonfamily Households |
| 1-Person Households | - | 65 (32.3%) |
| 2-Person Households | 73 (36.3%) | 10 (5.0%) |
| 3-Person Households | 18 (9.0%) | 11 (5.5%) |
| 4-Person Households | 15 (7.5%) | 0 (0.0%) |
| 5-Person Households | 8 (4.0%) | 0 (0.0%) |
| 6-Person Households | 0 (0.0%) | 0 (0.0%) |
| 7+ Person Households | 1 (0.5%) | 0 (0.0%) |
| Total | 115 (57.2%) | 86 (42.8%) |
Female Fertility in Wasco
Fertility by Age in Wasco
| Age Bracket | Women with Births | Births / 1,000 Women |
| 15 to 19 years | 0 (0.0%) | 0.0 |
| 20 to 34 years | 0 (0.0%) | 0.0 |
| 35 to 50 years | 0 (0.0%) | 0.0 |
| Total | 0 (0.0%) | 0.0 |
Fertility by Age by Marriage Status in Wasco
| Age Bracket | Married | Unmarried |
| 15 to 19 years | 0 (0.0%) | 0 (0.0%) |
| 20 to 34 years | 0 (0.0%) | 0 (0.0%) |
| 35 to 50 years | 0 (0.0%) | 0 (0.0%) |
| Total | 0 (0.0%) | 0 (0.0%) |
Fertility by Education in Wasco
| Educational Attainment | Women with Births | Births / 1,000 Women |
| Less than High School | 0 (0.0%) | 0.0 |
| High School Diploma | 0 (0.0%) | 0.0 |
| College or Associate's Degree | 0 (0.0%) | 0.0 |
| Bachelor's Degree | 0 (0.0%) | 0.0 |
| Graduate Degree | 0 (0.0%) | 0.0 |
| Total | 0 (0.0%) | 0.0 |
Fertility by Education by Marriage Status in Wasco
| Educational Attainment | Married | Unmarried |
| Less than High School | 0 (0.0%) | 0 (0.0%) |
| High School Diploma | 0 (0.0%) | 0 (0.0%) |
| College or Associate's Degree | 0 (0.0%) | 0 (0.0%) |
| Bachelor's Degree | 0 (0.0%) | 0 (0.0%) |
| Graduate Degree | 0 (0.0%) | 0 (0.0%) |
| Total | 0 (0.0%) | 0 (0.0%) |
Employment Characteristics in Wasco
Employment by Class of Employer in Wasco
Among the 184 employed individuals in Wasco, private company employees (120 | 65.2%), local government employees (38 | 20.6%), and self-employed (not incorporated) (12 | 6.5%) make up the most common classes of employment.
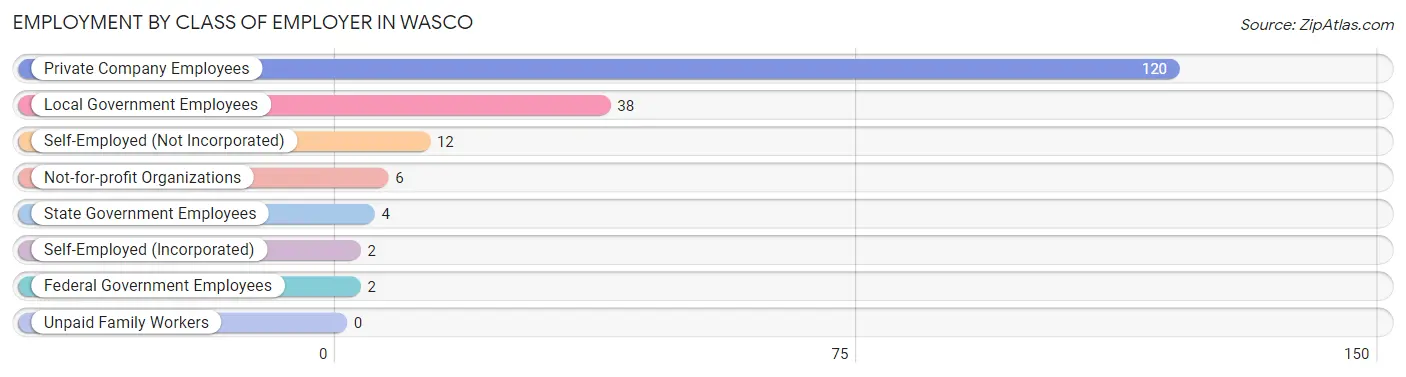
| Employer Class | # Employees | % Employees |
| Private Company Employees | 120 | 65.2% |
| Self-Employed (Incorporated) | 2 | 1.1% |
| Self-Employed (Not Incorporated) | 12 | 6.5% |
| Not-for-profit Organizations | 6 | 3.3% |
| Local Government Employees | 38 | 20.6% |
| State Government Employees | 4 | 2.2% |
| Federal Government Employees | 2 | 1.1% |
| Unpaid Family Workers | 0 | 0.0% |
| Total | 184 | 100.0% |
Employment Status by Age in Wasco
According to the labor force statistics for Wasco, out of the total population over 16 years of age (419), 46.8% or 196 individuals are in the labor force, with 2.0% or 4 of them unemployed. The age group with the highest labor force participation rate is 30 to 34 years, with 100.0% or 31 individuals in the labor force. Within the labor force, the 30 to 34 years age range has the highest percentage of unemployed individuals, with 12.9% or 4 of them being unemployed.
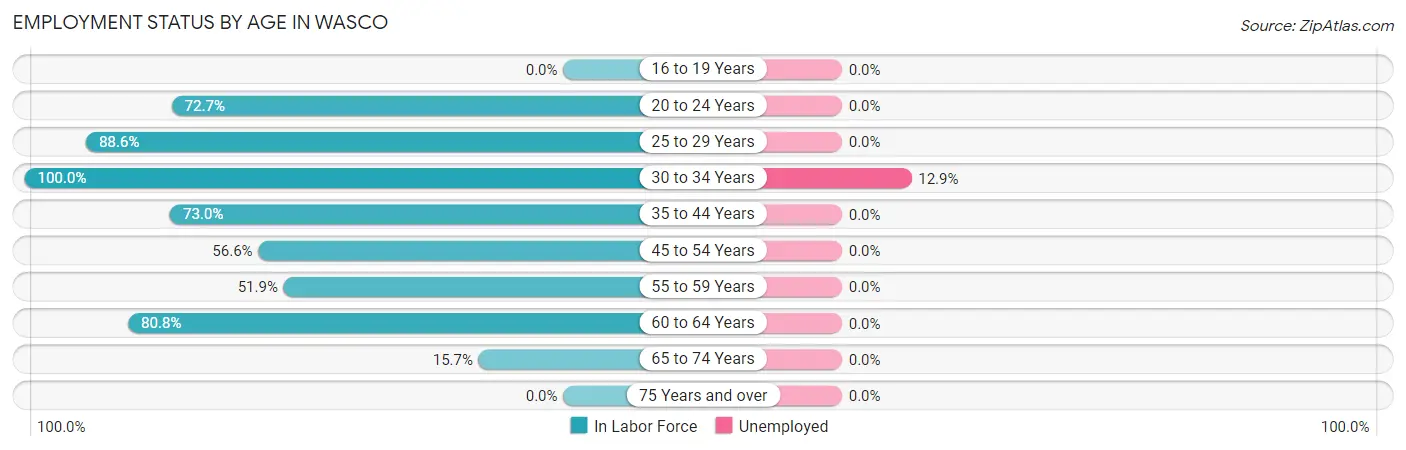
| Age Bracket | In Labor Force | Unemployed |
| 16 to 19 Years | 0 (0.0%) | 0 (0.0%) |
| 20 to 24 Years | 16 (72.7%) | 0 (0.0%) |
| 25 to 29 Years | 31 (88.6%) | 0 (0.0%) |
| 30 to 34 Years | 31 (100.0%) | 4 (12.9%) |
| 35 to 44 Years | 27 (73.0%) | 0 (0.0%) |
| 45 to 54 Years | 30 (56.6%) | 0 (0.0%) |
| 55 to 59 Years | 27 (51.9%) | 0 (0.0%) |
| 60 to 64 Years | 21 (80.8%) | 0 (0.0%) |
| 65 to 74 Years | 13 (15.7%) | 0 (0.0%) |
| 75 Years and over | 0 (0.0%) | 0 (0.0%) |
| Total | 196 (46.8%) | 4 (2.0%) |
Employment Status by Educational Attainment in Wasco
According to labor force statistics for Wasco, 71.4% of individuals (167) out of the total population between 25 and 64 years of age (234) are in the labor force, with 2.4% or 4 of them being unemployed. The group with the highest labor force participation rate are those with the educational attainment of high school diploma, with 78.2% or 61 individuals in the labor force. Within the labor force, individuals with bachelor's degree or higher education have the highest percentage of unemployment, with 36.4% or 4 of them being unemployed.
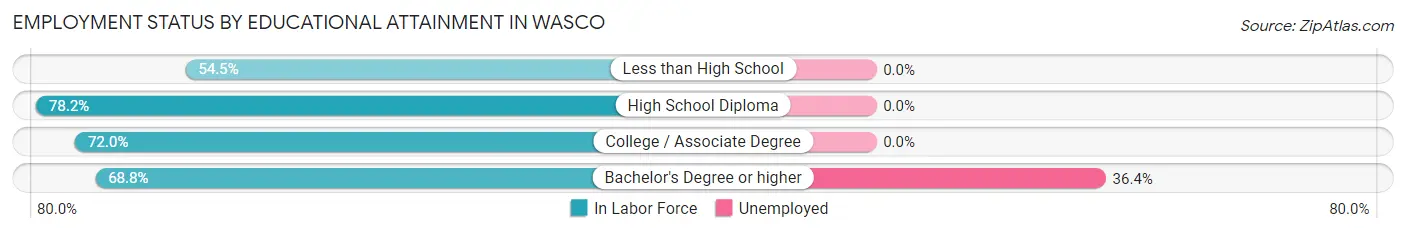
| Educational Attainment | In Labor Force | Unemployed |
| Less than High School | 18 (54.5%) | 0 (0.0%) |
| High School Diploma | 61 (78.2%) | 0 (0.0%) |
| College / Associate Degree | 77 (72.0%) | 0 (0.0%) |
| Bachelor's Degree or higher | 11 (68.8%) | 6 (36.4%) |
| Total | 167 (71.4%) | 6 (2.4%) |
Employment Occupations by Sex in Wasco
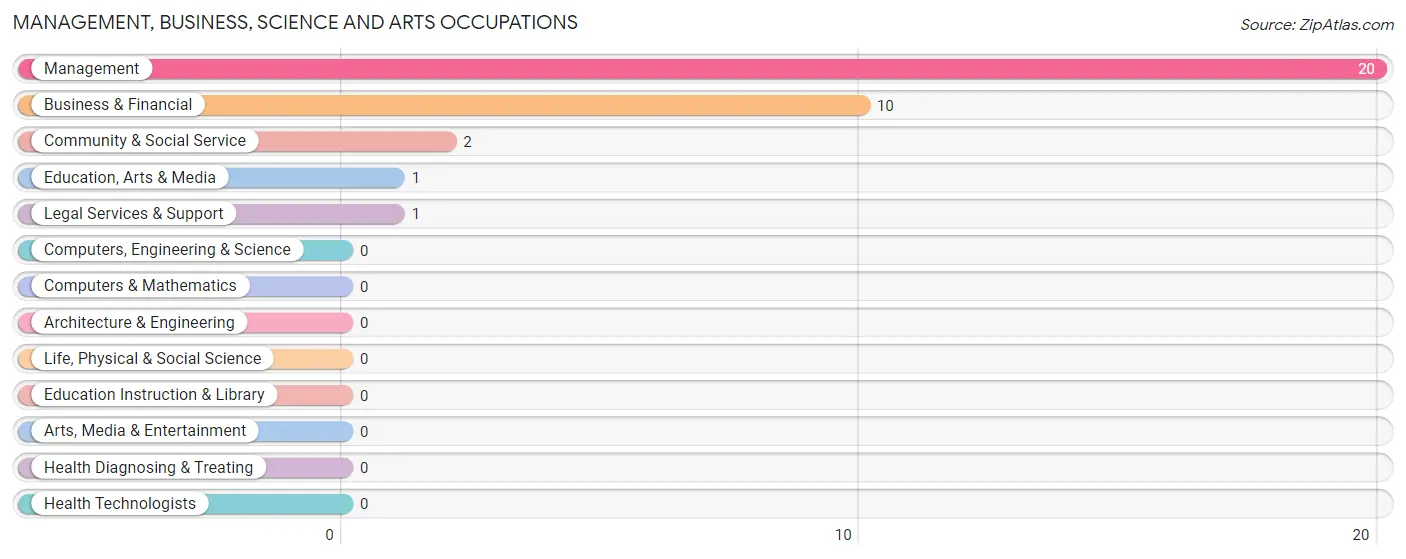
Management, Business, Science and Arts Occupations
The most common Management, Business, Science and Arts occupations in Wasco are Management (20 | 10.4%), Business & Financial (10 | 5.2%), Community & Social Service (2 | 1.0%), Education, Arts & Media (1 | 0.5%), and Legal Services & Support (1 | 0.5%).
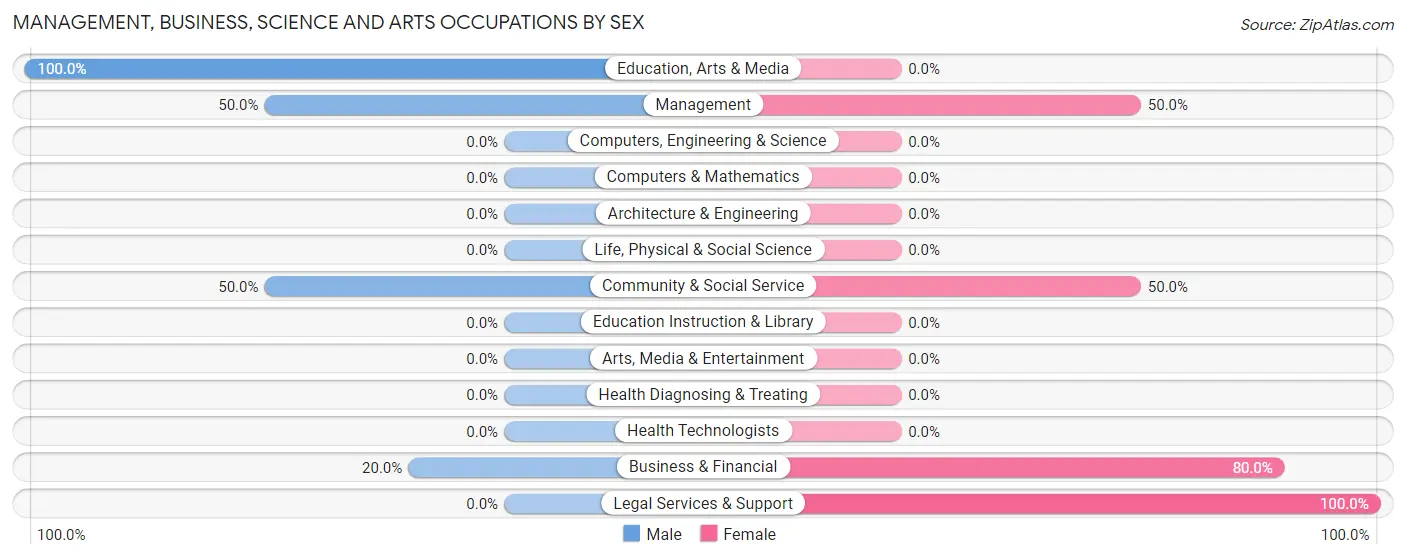
Management, Business, Science and Arts Occupations by Sex
Within the Management, Business, Science and Arts occupations in Wasco, the most male-oriented occupations are Education, Arts & Media (100.0%), Management (50.0%), and Community & Social Service (50.0%), while the most female-oriented occupations are Legal Services & Support (100.0%), Business & Financial (80.0%), and Management (50.0%).
| Occupation | Male | Female |
| Management | 10 (50.0%) | 10 (50.0%) |
| Business & Financial | 2 (20.0%) | 8 (80.0%) |
| Computers, Engineering & Science | 0 (0.0%) | 0 (0.0%) |
| Computers & Mathematics | 0 (0.0%) | 0 (0.0%) |
| Architecture & Engineering | 0 (0.0%) | 0 (0.0%) |
| Life, Physical & Social Science | 0 (0.0%) | 0 (0.0%) |
| Community & Social Service | 1 (50.0%) | 1 (50.0%) |
| Education, Arts & Media | 1 (100.0%) | 0 (0.0%) |
| Legal Services & Support | 0 (0.0%) | 1 (100.0%) |
| Education Instruction & Library | 0 (0.0%) | 0 (0.0%) |
| Arts, Media & Entertainment | 0 (0.0%) | 0 (0.0%) |
| Health Diagnosing & Treating | 0 (0.0%) | 0 (0.0%) |
| Health Technologists | 0 (0.0%) | 0 (0.0%) |
| Total (Category) | 13 (40.6%) | 19 (59.4%) |
| Total (Overall) | 120 (62.5%) | 72 (37.5%) |
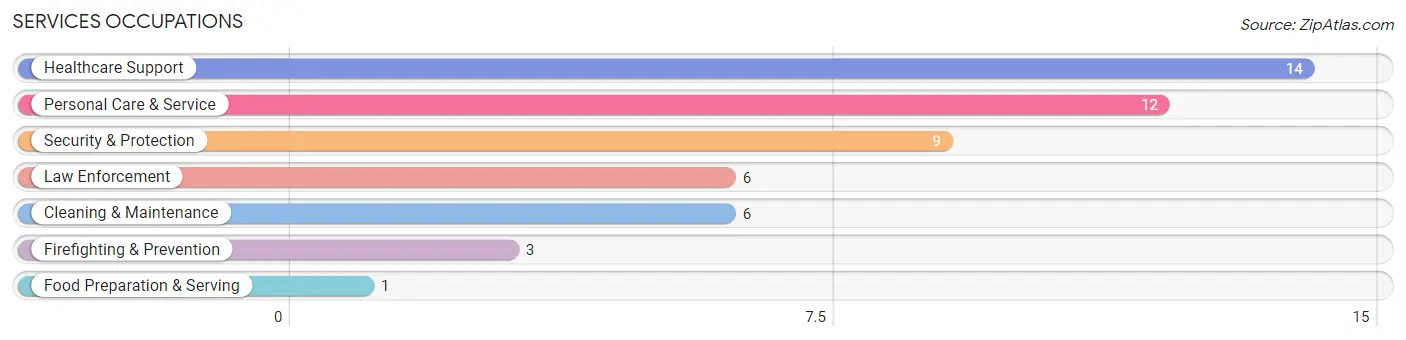
Services Occupations
The most common Services occupations in Wasco are Healthcare Support (14 | 7.3%), Personal Care & Service (12 | 6.2%), Security & Protection (9 | 4.7%), Law Enforcement (6 | 3.1%), and Cleaning & Maintenance (6 | 3.1%).
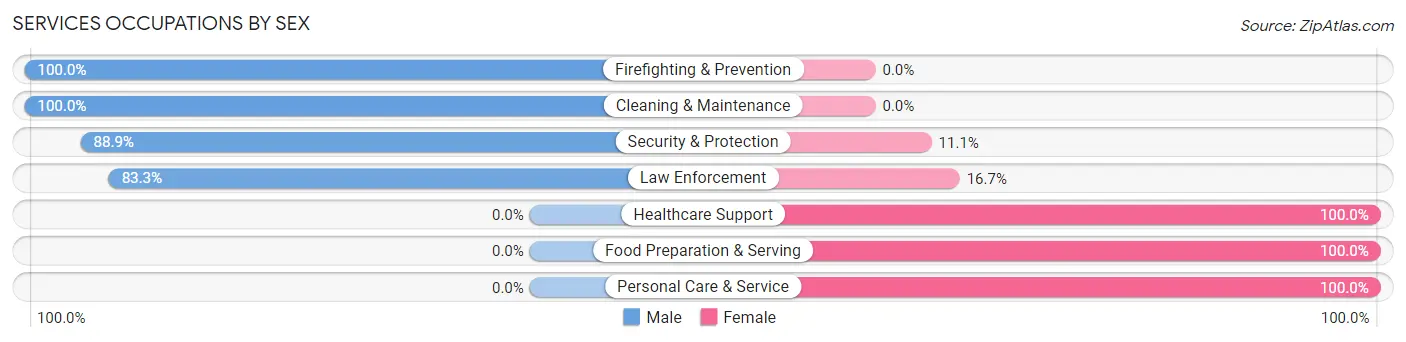
Services Occupations by Sex
Within the Services occupations in Wasco, the most male-oriented occupations are Firefighting & Prevention (100.0%), Cleaning & Maintenance (100.0%), and Security & Protection (88.9%), while the most female-oriented occupations are Healthcare Support (100.0%), Food Preparation & Serving (100.0%), and Personal Care & Service (100.0%).
| Occupation | Male | Female |
| Healthcare Support | 0 (0.0%) | 14 (100.0%) |
| Security & Protection | 8 (88.9%) | 1 (11.1%) |
| Firefighting & Prevention | 3 (100.0%) | 0 (0.0%) |
| Law Enforcement | 5 (83.3%) | 1 (16.7%) |
| Food Preparation & Serving | 0 (0.0%) | 1 (100.0%) |
| Cleaning & Maintenance | 6 (100.0%) | 0 (0.0%) |
| Personal Care & Service | 0 (0.0%) | 12 (100.0%) |
| Total (Category) | 14 (33.3%) | 28 (66.7%) |
| Total (Overall) | 120 (62.5%) | 72 (37.5%) |
Sales and Office Occupations
The most common Sales and Office occupations in Wasco are Office & Administration (21 | 10.9%), and Sales & Related (13 | 6.8%).

Sales and Office Occupations by Sex

| Occupation | Male | Female |
| Sales & Related | 7 (53.8%) | 6 (46.2%) |
| Office & Administration | 14 (66.7%) | 7 (33.3%) |
| Total (Category) | 21 (61.8%) | 13 (38.2%) |
| Total (Overall) | 120 (62.5%) | 72 (37.5%) |
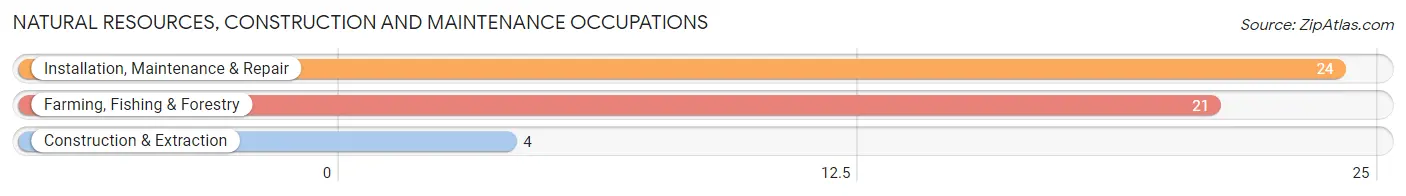
Natural Resources, Construction and Maintenance Occupations
The most common Natural Resources, Construction and Maintenance occupations in Wasco are Installation, Maintenance & Repair (24 | 12.5%), Farming, Fishing & Forestry (21 | 10.9%), and Construction & Extraction (4 | 2.1%).
Natural Resources, Construction and Maintenance Occupations by Sex
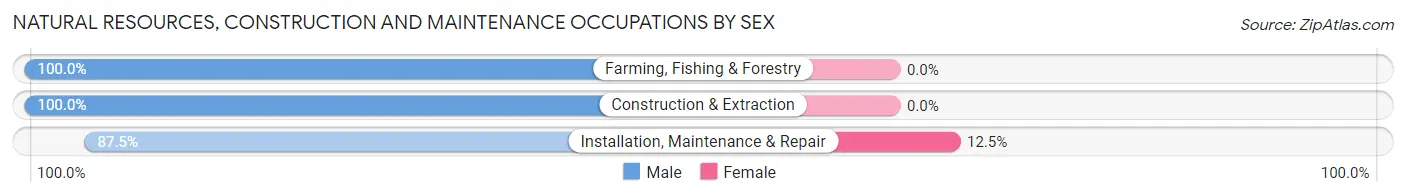
| Occupation | Male | Female |
| Farming, Fishing & Forestry | 21 (100.0%) | 0 (0.0%) |
| Construction & Extraction | 4 (100.0%) | 0 (0.0%) |
| Installation, Maintenance & Repair | 21 (87.5%) | 3 (12.5%) |
| Total (Category) | 46 (93.9%) | 3 (6.1%) |
| Total (Overall) | 120 (62.5%) | 72 (37.5%) |
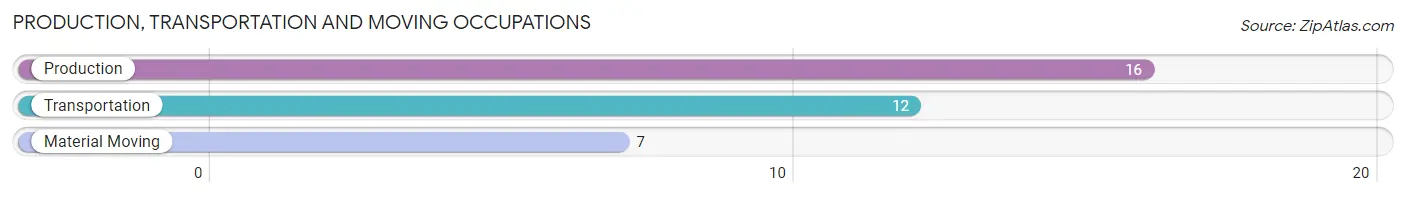
Production, Transportation and Moving Occupations
The most common Production, Transportation and Moving occupations in Wasco are Production (16 | 8.3%), Transportation (12 | 6.2%), and Material Moving (7 | 3.6%).
Production, Transportation and Moving Occupations by Sex
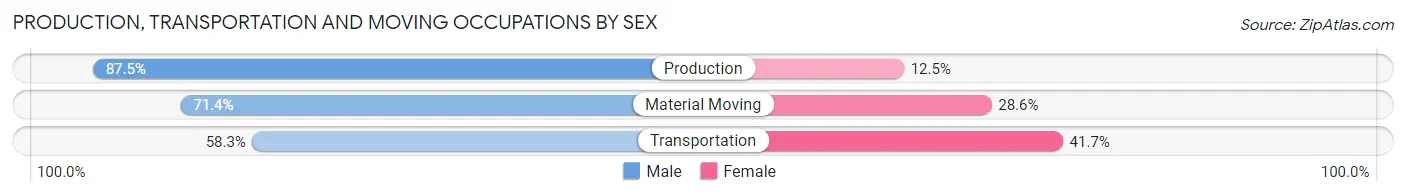
| Occupation | Male | Female |
| Production | 14 (87.5%) | 2 (12.5%) |
| Transportation | 7 (58.3%) | 5 (41.7%) |
| Material Moving | 5 (71.4%) | 2 (28.6%) |
| Total (Category) | 26 (74.3%) | 9 (25.7%) |
| Total (Overall) | 120 (62.5%) | 72 (37.5%) |
Employment Industries by Sex in Wasco
Employment Industries in Wasco
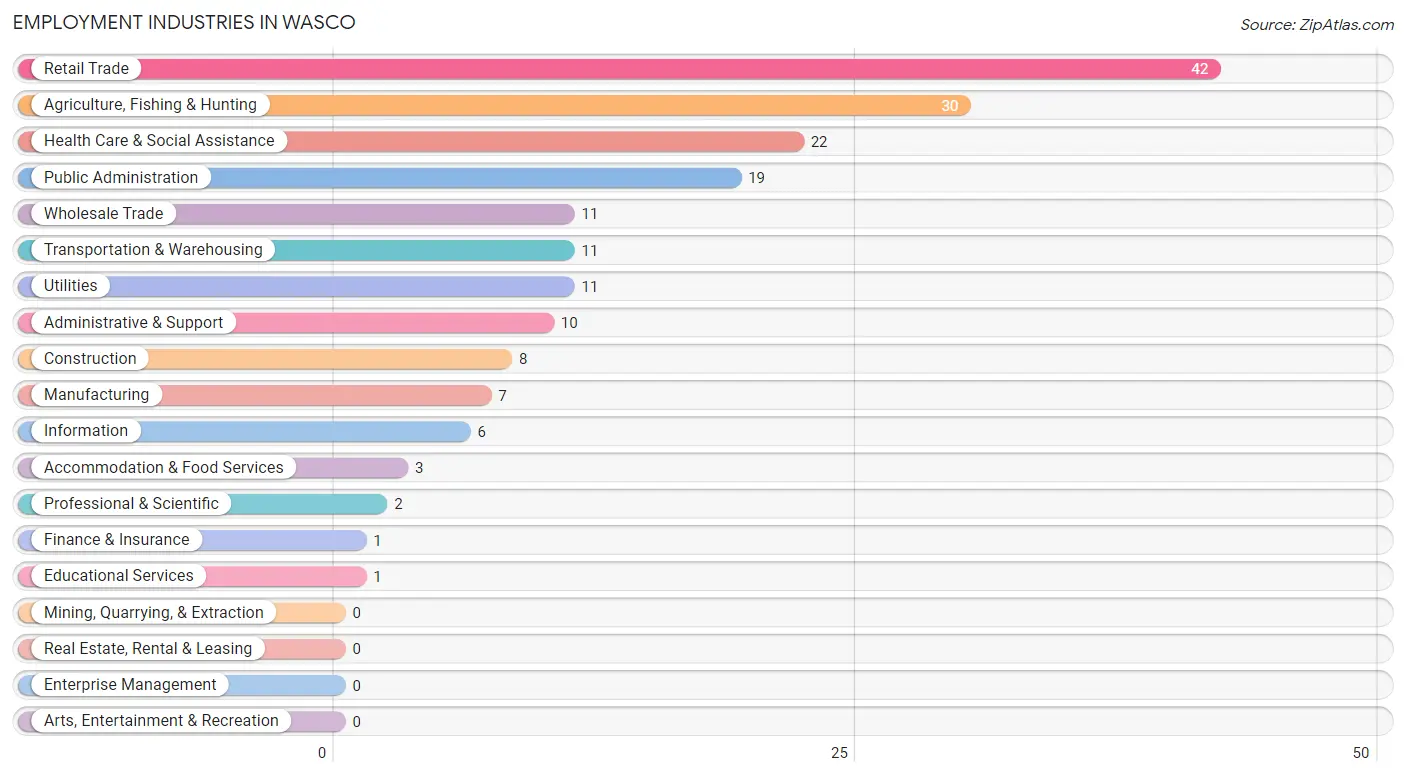
The major employment industries in Wasco include Retail Trade (42 | 21.9%), Agriculture, Fishing & Hunting (30 | 15.6%), Health Care & Social Assistance (22 | 11.5%), Public Administration (19 | 9.9%), and Wholesale Trade (11 | 5.7%).
Employment Industries by Sex in Wasco
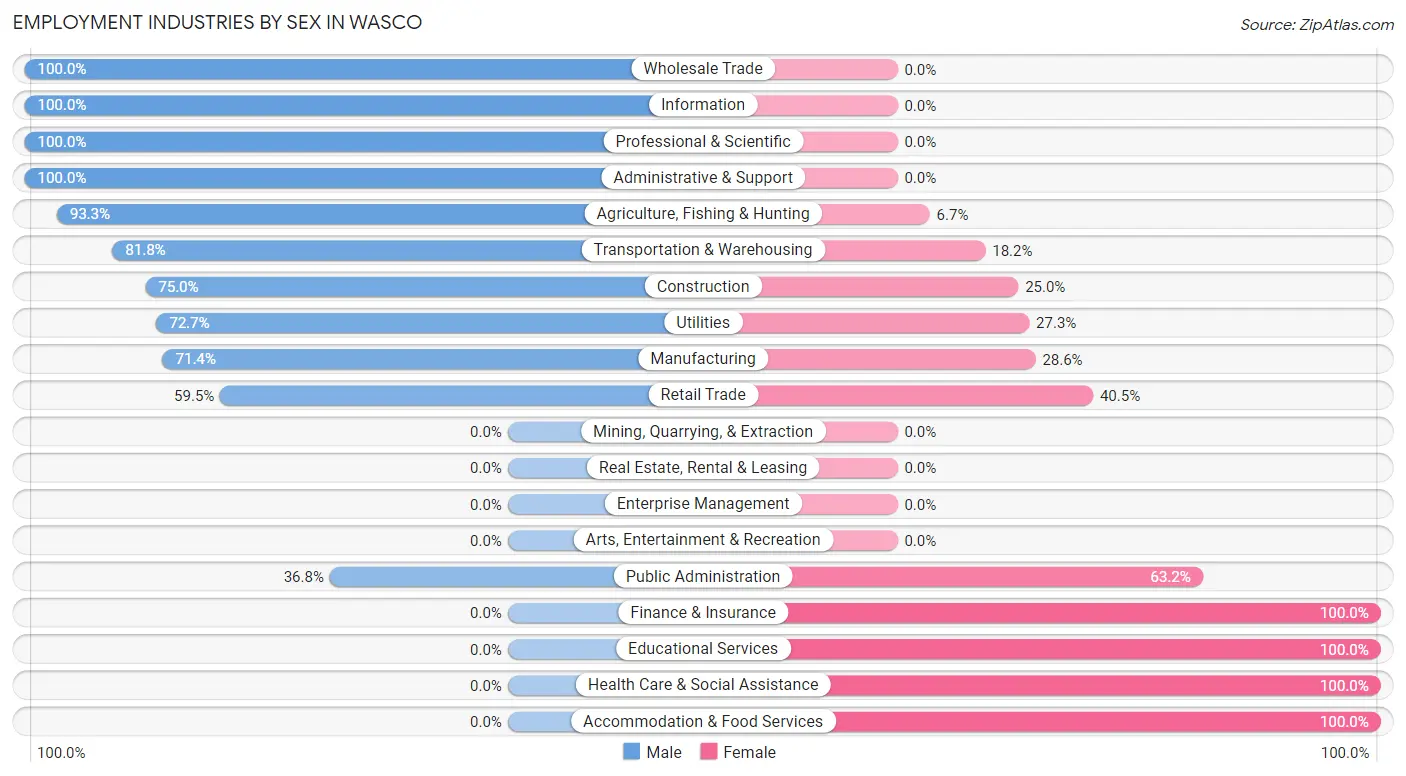
The Wasco industries that see more men than women are Wholesale Trade (100.0%), Information (100.0%), and Professional & Scientific (100.0%), whereas the industries that tend to have a higher number of women are Finance & Insurance (100.0%), Educational Services (100.0%), and Health Care & Social Assistance (100.0%).
| Industry | Male | Female |
| Agriculture, Fishing & Hunting | 28 (93.3%) | 2 (6.7%) |
| Mining, Quarrying, & Extraction | 0 (0.0%) | 0 (0.0%) |
| Construction | 6 (75.0%) | 2 (25.0%) |
| Manufacturing | 5 (71.4%) | 2 (28.6%) |
| Wholesale Trade | 11 (100.0%) | 0 (0.0%) |
| Retail Trade | 25 (59.5%) | 17 (40.5%) |
| Transportation & Warehousing | 9 (81.8%) | 2 (18.2%) |
| Utilities | 8 (72.7%) | 3 (27.3%) |
| Information | 6 (100.0%) | 0 (0.0%) |
| Finance & Insurance | 0 (0.0%) | 1 (100.0%) |
| Real Estate, Rental & Leasing | 0 (0.0%) | 0 (0.0%) |
| Professional & Scientific | 2 (100.0%) | 0 (0.0%) |
| Enterprise Management | 0 (0.0%) | 0 (0.0%) |
| Administrative & Support | 10 (100.0%) | 0 (0.0%) |
| Educational Services | 0 (0.0%) | 1 (100.0%) |
| Health Care & Social Assistance | 0 (0.0%) | 22 (100.0%) |
| Arts, Entertainment & Recreation | 0 (0.0%) | 0 (0.0%) |
| Accommodation & Food Services | 0 (0.0%) | 3 (100.0%) |
| Public Administration | 7 (36.8%) | 12 (63.2%) |
| Total | 120 (62.5%) | 72 (37.5%) |
Education in Wasco
School Enrollment in Wasco
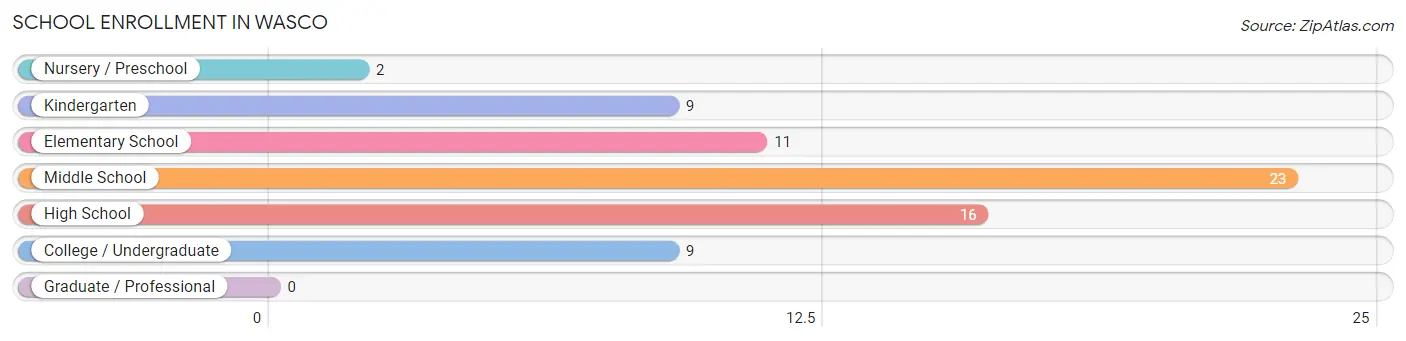
The most common levels of schooling among the 70 students in Wasco are middle school (23 | 32.9%), high school (16 | 22.9%), and elementary school (11 | 15.7%).
| School Level | # Students | % Students |
| Nursery / Preschool | 2 | 2.9% |
| Kindergarten | 9 | 12.9% |
| Elementary School | 11 | 15.7% |
| Middle School | 23 | 32.9% |
| High School | 16 | 22.9% |
| College / Undergraduate | 9 | 12.9% |
| Graduate / Professional | 0 | 0.0% |
| Total | 70 | 100.0% |
School Enrollment by Age by Funding Source in Wasco
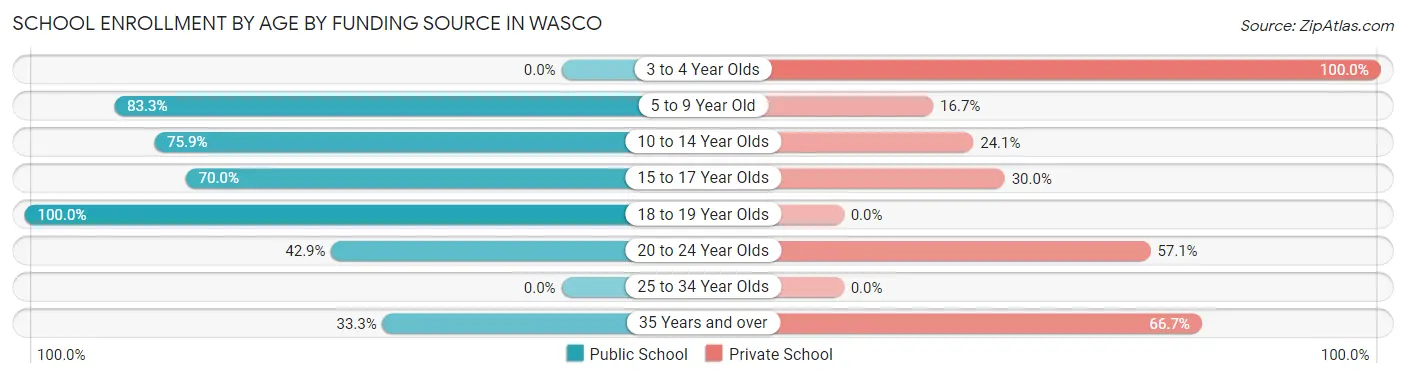
Out of a total of 70 students who are enrolled in schools in Wasco, 21 (30.0%) attend a private institution, while the remaining 49 (70.0%) are enrolled in public schools. The age group of 3 to 4 year olds has the highest likelihood of being enrolled in private schools, with 2 (100.0% in the age bracket) enrolled. Conversely, the age group of 18 to 19 year olds has the lowest likelihood of being enrolled in a private school, with 1 (100.0% in the age bracket) attending a public institution.
| Age Bracket | Public School | Private School |
| 3 to 4 Year Olds | 0 (0.0%) | 2 (100.0%) |
| 5 to 9 Year Old | 15 (83.3%) | 3 (16.7%) |
| 10 to 14 Year Olds | 22 (75.9%) | 7 (24.1%) |
| 15 to 17 Year Olds | 7 (70.0%) | 3 (30.0%) |
| 18 to 19 Year Olds | 1 (100.0%) | 0 (0.0%) |
| 20 to 24 Year Olds | 3 (42.9%) | 4 (57.1%) |
| 25 to 34 Year Olds | 0 (0.0%) | 0 (0.0%) |
| 35 Years and over | 1 (33.3%) | 2 (66.7%) |
| Total | 49 (70.0%) | 21 (30.0%) |
Educational Attainment by Field of Study in Wasco
Bio, nature & agricultural (8 | 22.2%), physical & health sciences (7 | 19.4%), business (5 | 13.9%), education (4 | 11.1%), and literature & languages (4 | 11.1%) are the most common fields of study among 36 individuals in Wasco who have obtained a bachelor's degree or higher.
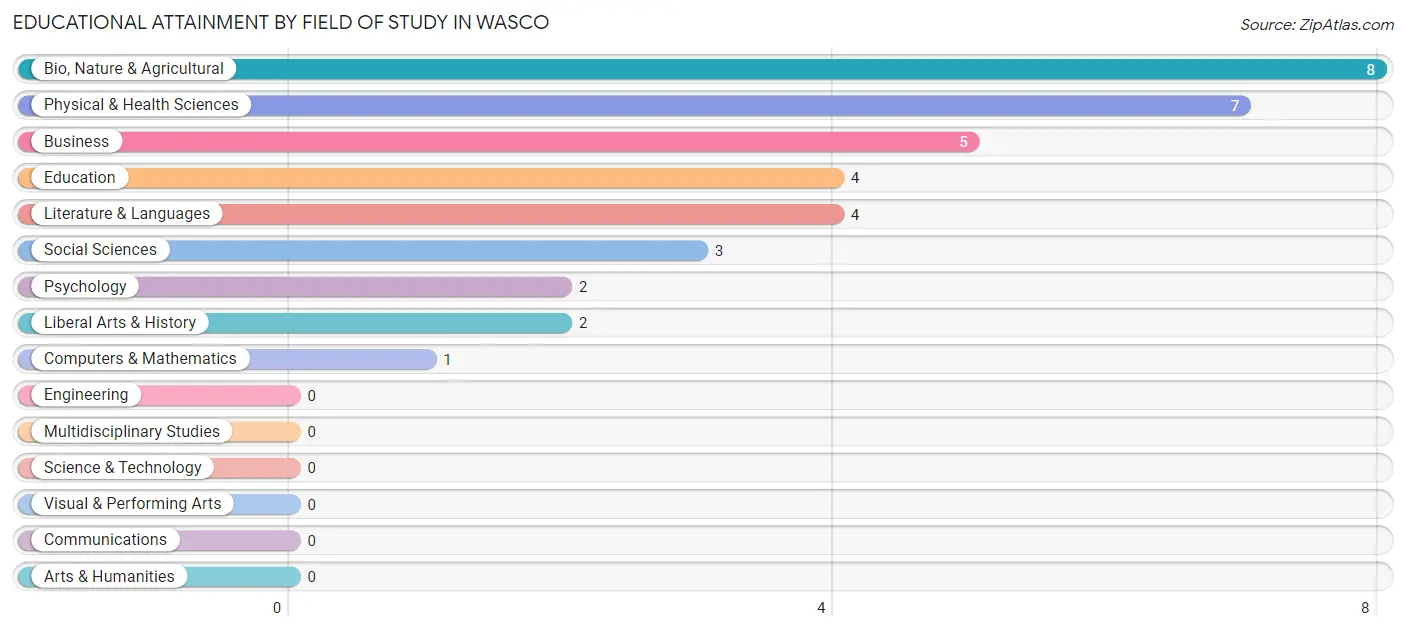
| Field of Study | # Graduates | % Graduates |
| Computers & Mathematics | 1 | 2.8% |
| Bio, Nature & Agricultural | 8 | 22.2% |
| Physical & Health Sciences | 7 | 19.4% |
| Psychology | 2 | 5.6% |
| Social Sciences | 3 | 8.3% |
| Engineering | 0 | 0.0% |
| Multidisciplinary Studies | 0 | 0.0% |
| Science & Technology | 0 | 0.0% |
| Business | 5 | 13.9% |
| Education | 4 | 11.1% |
| Literature & Languages | 4 | 11.1% |
| Liberal Arts & History | 2 | 5.6% |
| Visual & Performing Arts | 0 | 0.0% |
| Communications | 0 | 0.0% |
| Arts & Humanities | 0 | 0.0% |
| Total | 36 | 100.0% |
Transportation & Commute in Wasco
Vehicle Availability by Sex in Wasco
The most prevalent vehicle ownership categories in Wasco are males with 2 vehicles (43, accounting for 38.4%) and females with 2 vehicles (28, making up 59.7%).
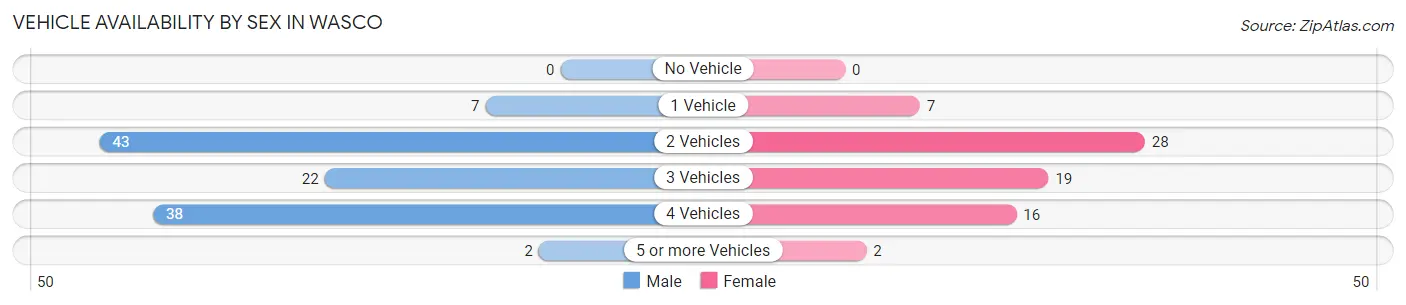
| Vehicles Available | Male | Female |
| No Vehicle | 0 (0.0%) | 0 (0.0%) |
| 1 Vehicle | 7 (6.2%) | 7 (9.7%) |
| 2 Vehicles | 43 (38.4%) | 28 (38.9%) |
| 3 Vehicles | 22 (19.6%) | 19 (26.4%) |
| 4 Vehicles | 38 (33.9%) | 16 (22.2%) |
| 5 or more Vehicles | 2 (1.8%) | 2 (2.8%) |
| Total | 112 (100.0%) | 72 (100.0%) |
Commute Time in Wasco
The most frequently occuring commute durations in Wasco are 5 to 9 minutes (39 commuters, 21.7%), 30 to 34 minutes (24 commuters, 13.3%), and less than 5 minutes (21 commuters, 11.7%).
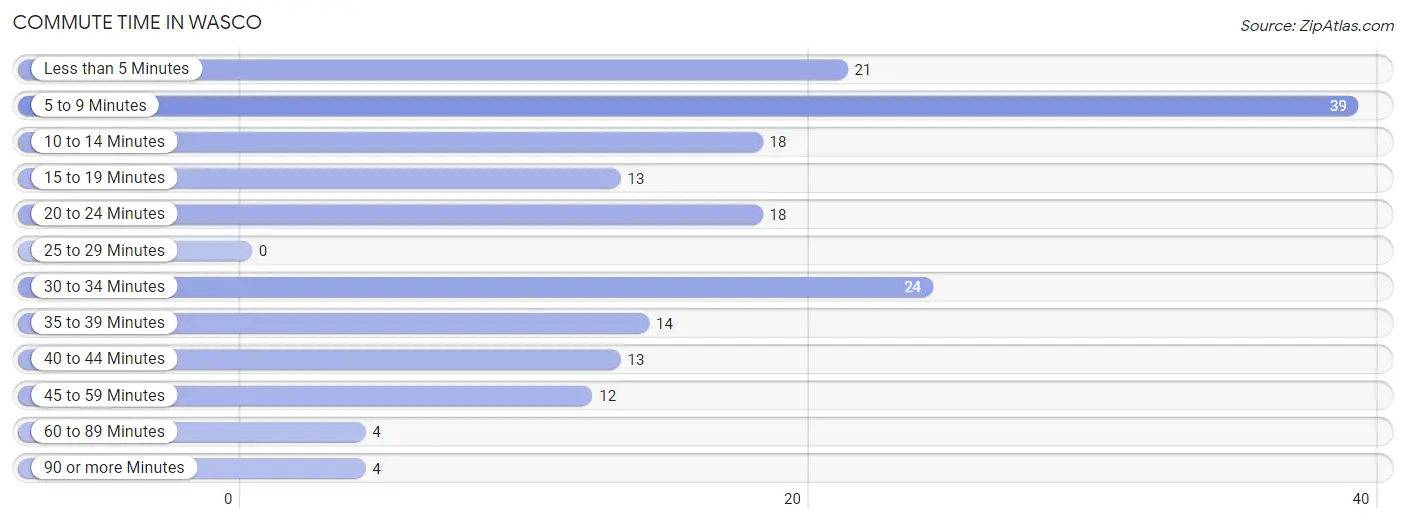
| Commute Time | # Commuters | % Commuters |
| Less than 5 Minutes | 21 | 11.7% |
| 5 to 9 Minutes | 39 | 21.7% |
| 10 to 14 Minutes | 18 | 10.0% |
| 15 to 19 Minutes | 13 | 7.2% |
| 20 to 24 Minutes | 18 | 10.0% |
| 25 to 29 Minutes | 0 | 0.0% |
| 30 to 34 Minutes | 24 | 13.3% |
| 35 to 39 Minutes | 14 | 7.8% |
| 40 to 44 Minutes | 13 | 7.2% |
| 45 to 59 Minutes | 12 | 6.7% |
| 60 to 89 Minutes | 4 | 2.2% |
| 90 or more Minutes | 4 | 2.2% |
Commute Time by Sex in Wasco
The most common commute times in Wasco are 5 to 9 minutes (27 commuters, 24.8%) for males and 30 to 34 minutes (17 commuters, 23.9%) for females.
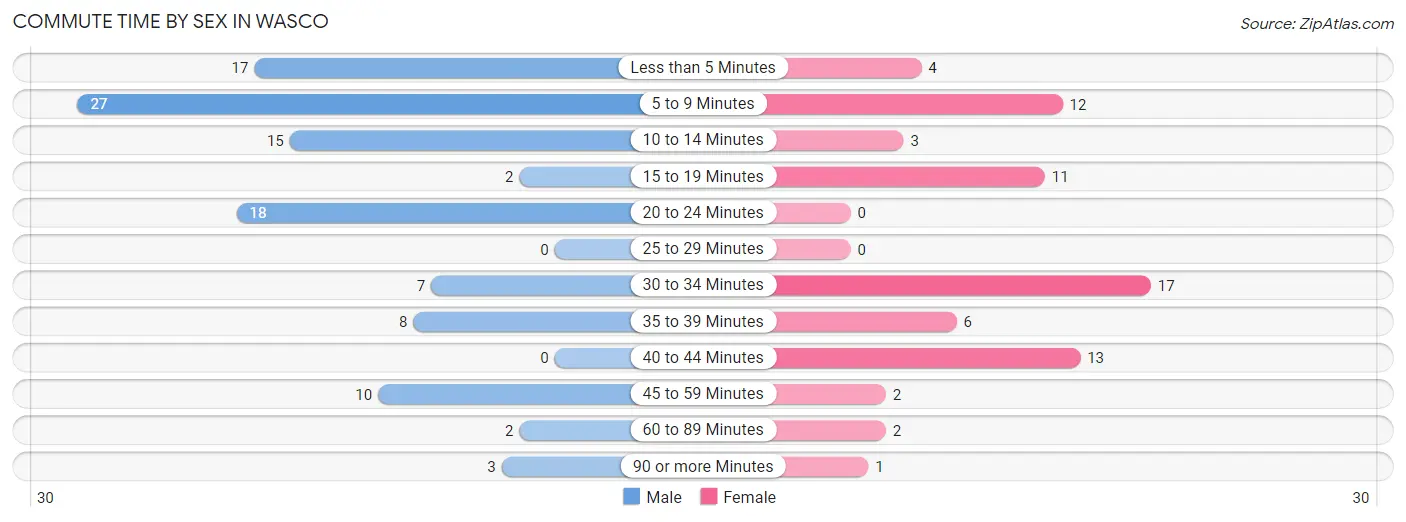
| Commute Time | Male | Female |
| Less than 5 Minutes | 17 (15.6%) | 4 (5.6%) |
| 5 to 9 Minutes | 27 (24.8%) | 12 (16.9%) |
| 10 to 14 Minutes | 15 (13.8%) | 3 (4.2%) |
| 15 to 19 Minutes | 2 (1.8%) | 11 (15.5%) |
| 20 to 24 Minutes | 18 (16.5%) | 0 (0.0%) |
| 25 to 29 Minutes | 0 (0.0%) | 0 (0.0%) |
| 30 to 34 Minutes | 7 (6.4%) | 17 (23.9%) |
| 35 to 39 Minutes | 8 (7.3%) | 6 (8.5%) |
| 40 to 44 Minutes | 0 (0.0%) | 13 (18.3%) |
| 45 to 59 Minutes | 10 (9.2%) | 2 (2.8%) |
| 60 to 89 Minutes | 2 (1.8%) | 2 (2.8%) |
| 90 or more Minutes | 3 (2.8%) | 1 (1.4%) |
Time of Departure to Work by Sex in Wasco
The most frequent times of departure to work in Wasco are 5:00 AM to 5:29 AM (23, 21.1%) for males and 7:30 AM to 7:59 AM (22, 31.0%) for females.
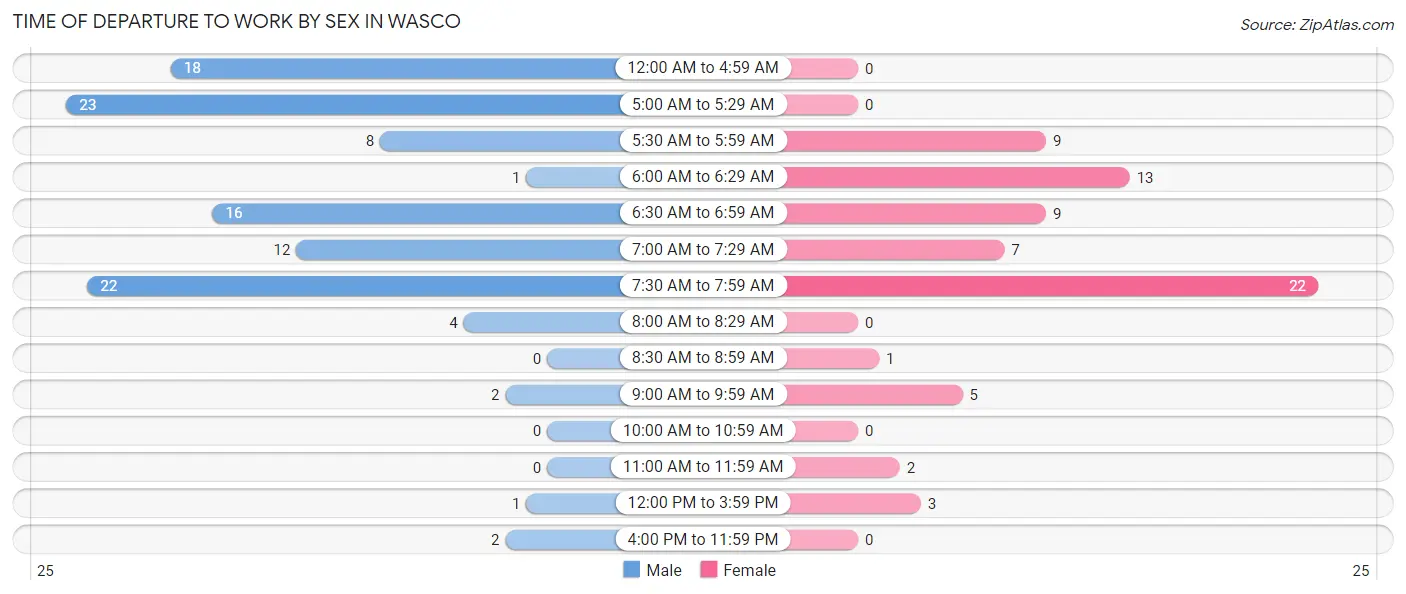
| Time of Departure | Male | Female |
| 12:00 AM to 4:59 AM | 18 (16.5%) | 0 (0.0%) |
| 5:00 AM to 5:29 AM | 23 (21.1%) | 0 (0.0%) |
| 5:30 AM to 5:59 AM | 8 (7.3%) | 9 (12.7%) |
| 6:00 AM to 6:29 AM | 1 (0.9%) | 13 (18.3%) |
| 6:30 AM to 6:59 AM | 16 (14.7%) | 9 (12.7%) |
| 7:00 AM to 7:29 AM | 12 (11.0%) | 7 (9.9%) |
| 7:30 AM to 7:59 AM | 22 (20.2%) | 22 (31.0%) |
| 8:00 AM to 8:29 AM | 4 (3.7%) | 0 (0.0%) |
| 8:30 AM to 8:59 AM | 0 (0.0%) | 1 (1.4%) |
| 9:00 AM to 9:59 AM | 2 (1.8%) | 5 (7.0%) |
| 10:00 AM to 10:59 AM | 0 (0.0%) | 0 (0.0%) |
| 11:00 AM to 11:59 AM | 0 (0.0%) | 2 (2.8%) |
| 12:00 PM to 3:59 PM | 1 (0.9%) | 3 (4.2%) |
| 4:00 PM to 11:59 PM | 2 (1.8%) | 0 (0.0%) |
| Total | 109 (100.0%) | 71 (100.0%) |
Housing Occupancy in Wasco
Occupancy by Ownership in Wasco
Of the total 201 dwellings in Wasco, owner-occupied units account for 157 (78.1%), while renter-occupied units make up 44 (21.9%).
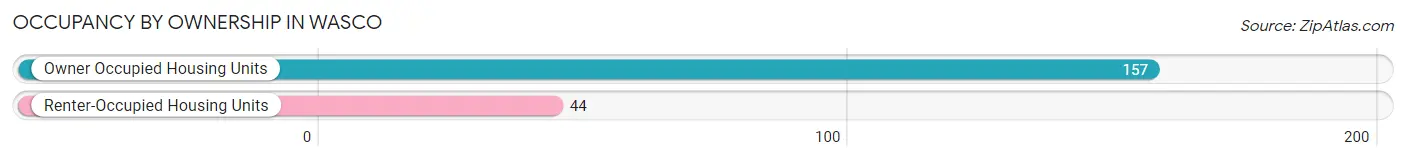
| Occupancy | # Housing Units | % Housing Units |
| Owner Occupied Housing Units | 157 | 78.1% |
| Renter-Occupied Housing Units | 44 | 21.9% |
| Total Occupied Housing Units | 201 | 100.0% |
Occupancy by Household Size in Wasco
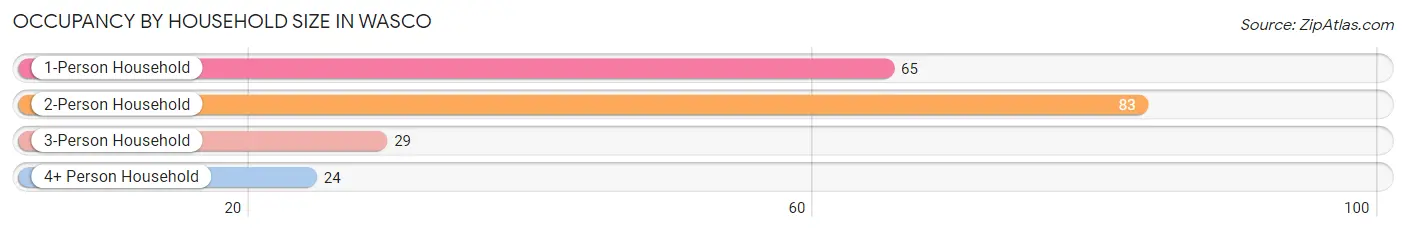
| Household Size | # Housing Units | % Housing Units |
| 1-Person Household | 65 | 32.3% |
| 2-Person Household | 83 | 41.3% |
| 3-Person Household | 29 | 14.4% |
| 4+ Person Household | 24 | 11.9% |
| Total Housing Units | 201 | 100.0% |
Occupancy by Ownership by Household Size in Wasco
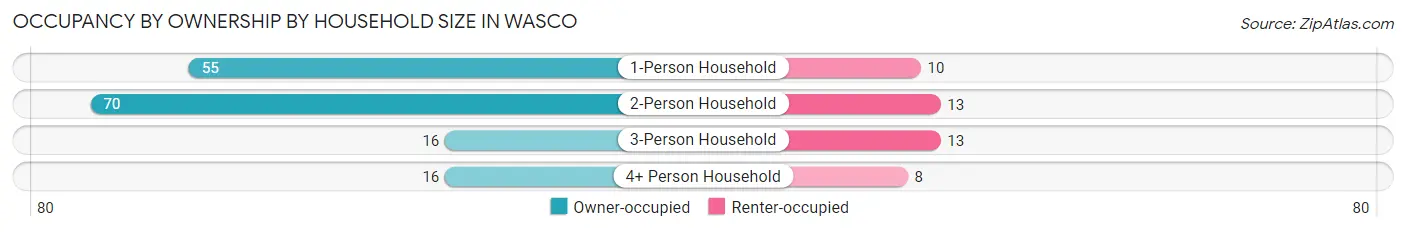
| Household Size | Owner-occupied | Renter-occupied |
| 1-Person Household | 55 (84.6%) | 10 (15.4%) |
| 2-Person Household | 70 (84.3%) | 13 (15.7%) |
| 3-Person Household | 16 (55.2%) | 13 (44.8%) |
| 4+ Person Household | 16 (66.7%) | 8 (33.3%) |
| Total Housing Units | 157 (78.1%) | 44 (21.9%) |
Occupancy by Educational Attainment in Wasco
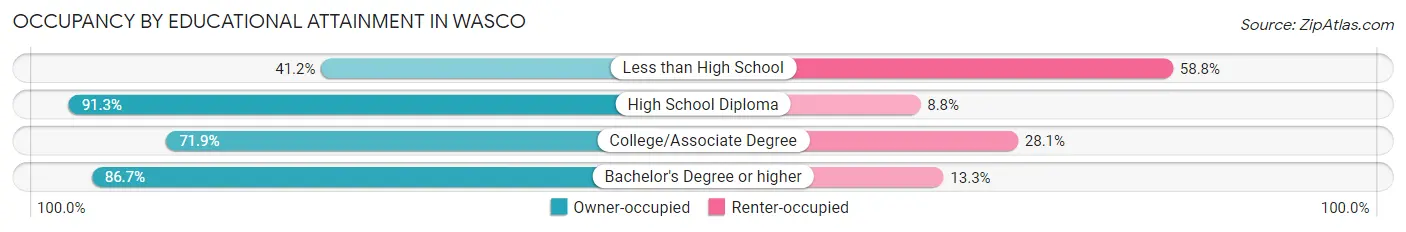
| Household Size | Owner-occupied | Renter-occupied |
| Less than High School | 7 (41.2%) | 10 (58.8%) |
| High School Diploma | 73 (91.2%) | 7 (8.7%) |
| College/Associate Degree | 64 (71.9%) | 25 (28.1%) |
| Bachelor's Degree or higher | 13 (86.7%) | 2 (13.3%) |
Occupancy by Age of Householder in Wasco
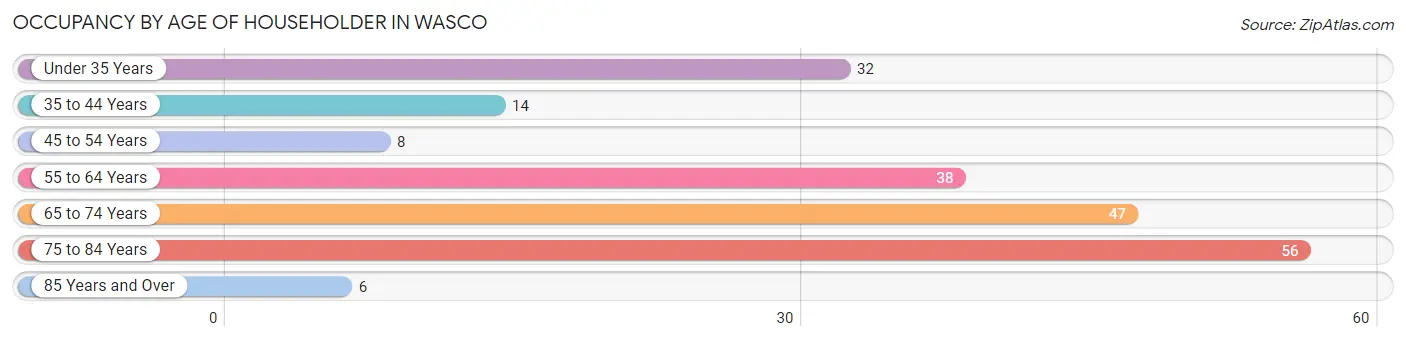
| Age Bracket | # Households | % Households |
| Under 35 Years | 32 | 15.9% |
| 35 to 44 Years | 14 | 7.0% |
| 45 to 54 Years | 8 | 4.0% |
| 55 to 64 Years | 38 | 18.9% |
| 65 to 74 Years | 47 | 23.4% |
| 75 to 84 Years | 56 | 27.9% |
| 85 Years and Over | 6 | 3.0% |
| Total | 201 | 100.0% |
Housing Finances in Wasco
Median Income by Occupancy in Wasco
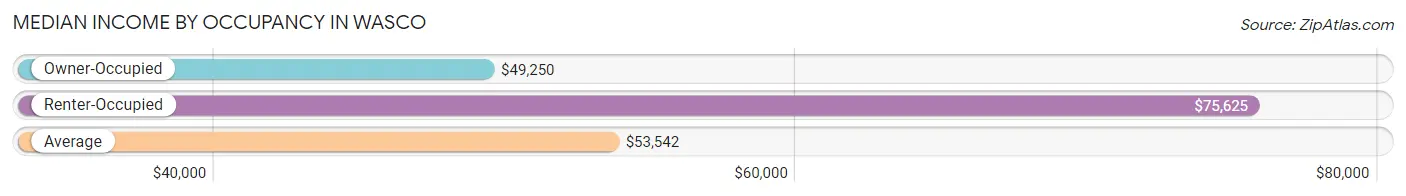
| Occupancy Type | # Households | Median Income |
| Owner-Occupied | 157 (78.1%) | $49,250 |
| Renter-Occupied | 44 (21.9%) | $75,625 |
| Average | 201 (100.0%) | $53,542 |
Occupancy by Householder Income Bracket in Wasco
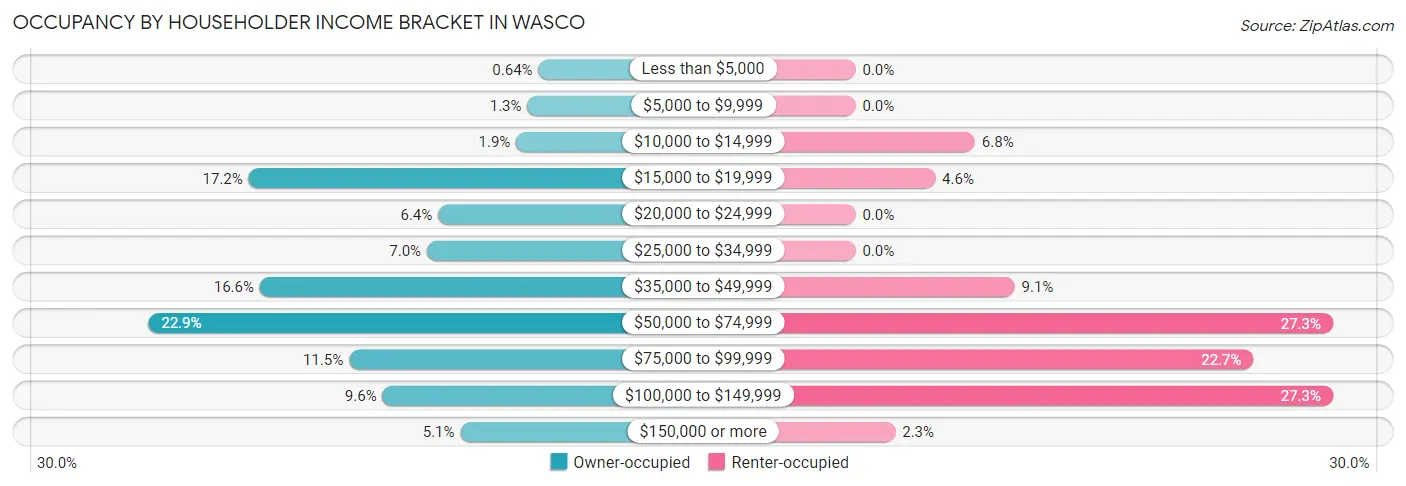
| Income Bracket | Owner-occupied | Renter-occupied |
| Less than $5,000 | 1 (0.6%) | 0 (0.0%) |
| $5,000 to $9,999 | 2 (1.3%) | 0 (0.0%) |
| $10,000 to $14,999 | 3 (1.9%) | 3 (6.8%) |
| $15,000 to $19,999 | 27 (17.2%) | 2 (4.5%) |
| $20,000 to $24,999 | 10 (6.4%) | 0 (0.0%) |
| $25,000 to $34,999 | 11 (7.0%) | 0 (0.0%) |
| $35,000 to $49,999 | 26 (16.6%) | 4 (9.1%) |
| $50,000 to $74,999 | 36 (22.9%) | 12 (27.3%) |
| $75,000 to $99,999 | 18 (11.5%) | 10 (22.7%) |
| $100,000 to $149,999 | 15 (9.6%) | 12 (27.3%) |
| $150,000 or more | 8 (5.1%) | 1 (2.3%) |
| Total | 157 (100.0%) | 44 (100.0%) |
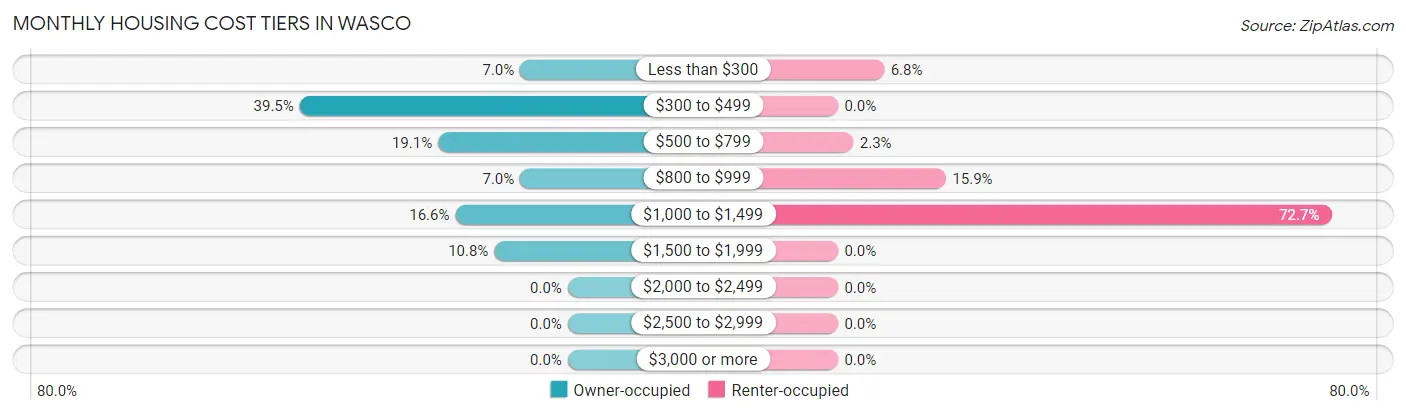
Monthly Housing Cost Tiers in Wasco
| Monthly Cost | Owner-occupied | Renter-occupied |
| Less than $300 | 11 (7.0%) | 3 (6.8%) |
| $300 to $499 | 62 (39.5%) | 0 (0.0%) |
| $500 to $799 | 30 (19.1%) | 1 (2.3%) |
| $800 to $999 | 11 (7.0%) | 7 (15.9%) |
| $1,000 to $1,499 | 26 (16.6%) | 32 (72.7%) |
| $1,500 to $1,999 | 17 (10.8%) | 0 (0.0%) |
| $2,000 to $2,499 | 0 (0.0%) | 0 (0.0%) |
| $2,500 to $2,999 | 0 (0.0%) | 0 (0.0%) |
| $3,000 or more | 0 (0.0%) | 0 (0.0%) |
| Total | 157 (100.0%) | 44 (100.0%) |
Physical Housing Characteristics in Wasco
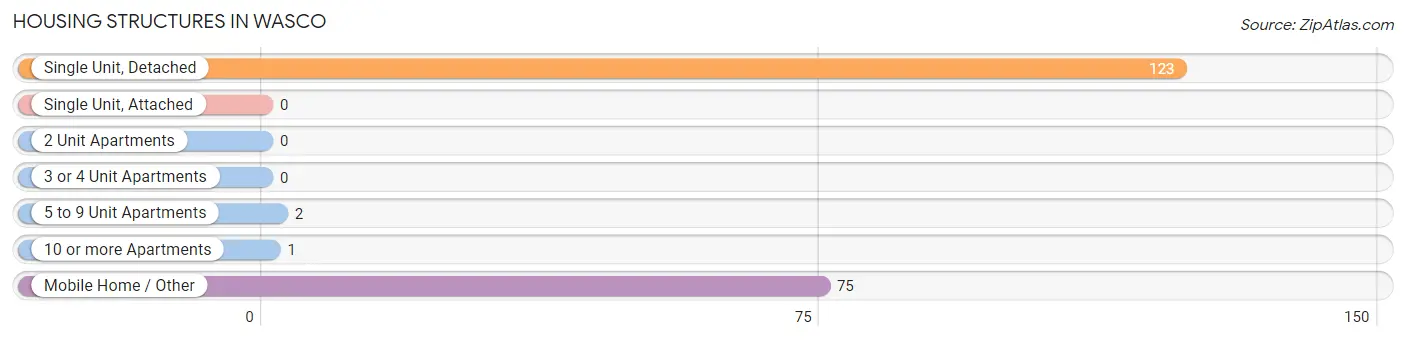
Housing Structures in Wasco
| Structure Type | # Housing Units | % Housing Units |
| Single Unit, Detached | 123 | 61.2% |
| Single Unit, Attached | 0 | 0.0% |
| 2 Unit Apartments | 0 | 0.0% |
| 3 or 4 Unit Apartments | 0 | 0.0% |
| 5 to 9 Unit Apartments | 2 | 1.0% |
| 10 or more Apartments | 1 | 0.5% |
| Mobile Home / Other | 75 | 37.3% |
| Total | 201 | 100.0% |
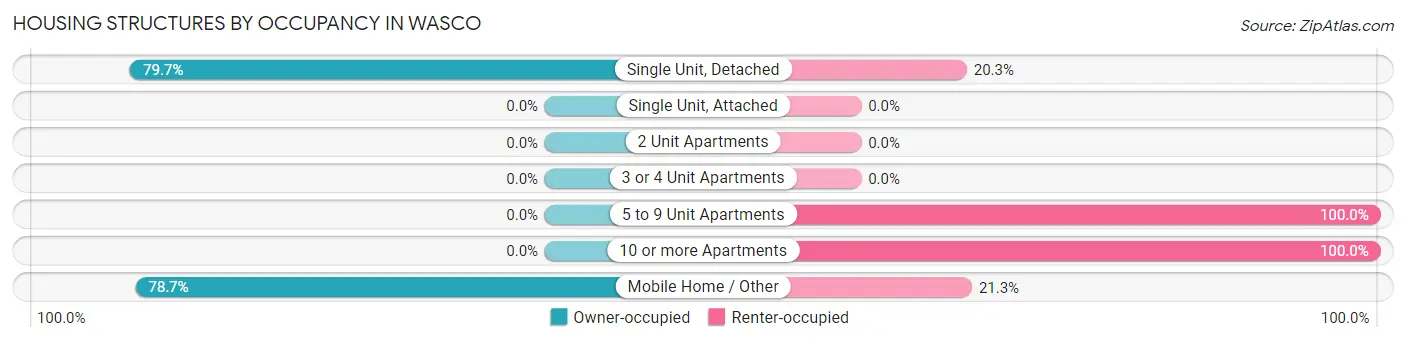
Housing Structures by Occupancy in Wasco
| Structure Type | Owner-occupied | Renter-occupied |
| Single Unit, Detached | 98 (79.7%) | 25 (20.3%) |
| Single Unit, Attached | 0 (0.0%) | 0 (0.0%) |
| 2 Unit Apartments | 0 (0.0%) | 0 (0.0%) |
| 3 or 4 Unit Apartments | 0 (0.0%) | 0 (0.0%) |
| 5 to 9 Unit Apartments | 0 (0.0%) | 2 (100.0%) |
| 10 or more Apartments | 0 (0.0%) | 1 (100.0%) |
| Mobile Home / Other | 59 (78.7%) | 16 (21.3%) |
| Total | 157 (78.1%) | 44 (21.9%) |
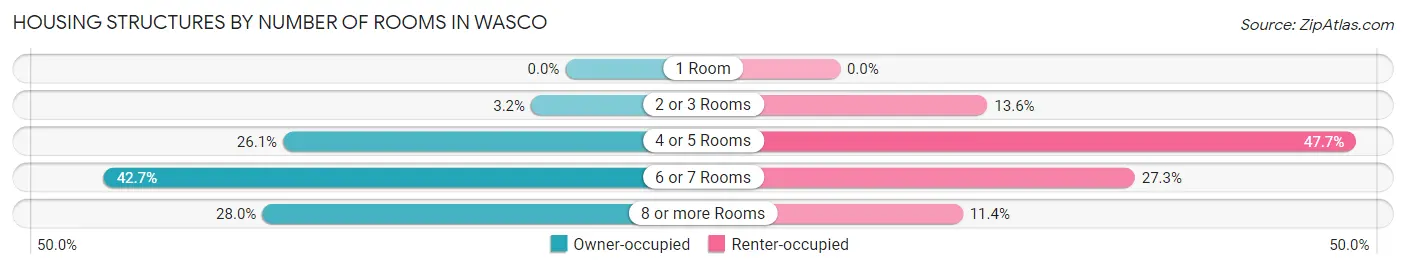
Housing Structures by Number of Rooms in Wasco
| Number of Rooms | Owner-occupied | Renter-occupied |
| 1 Room | 0 (0.0%) | 0 (0.0%) |
| 2 or 3 Rooms | 5 (3.2%) | 6 (13.6%) |
| 4 or 5 Rooms | 41 (26.1%) | 21 (47.7%) |
| 6 or 7 Rooms | 67 (42.7%) | 12 (27.3%) |
| 8 or more Rooms | 44 (28.0%) | 5 (11.4%) |
| Total | 157 (100.0%) | 44 (100.0%) |
Housing Structure by Heating Type in Wasco
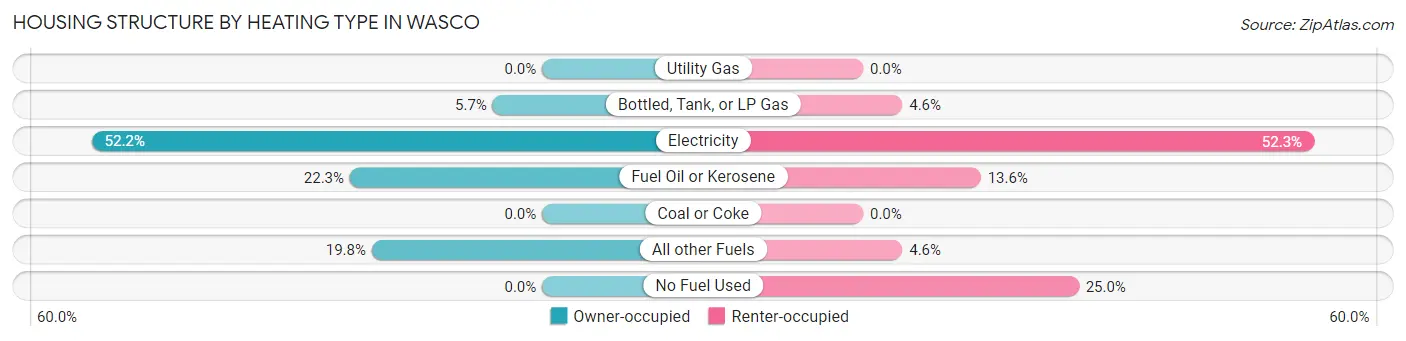
| Heating Type | Owner-occupied | Renter-occupied |
| Utility Gas | 0 (0.0%) | 0 (0.0%) |
| Bottled, Tank, or LP Gas | 9 (5.7%) | 2 (4.5%) |
| Electricity | 82 (52.2%) | 23 (52.3%) |
| Fuel Oil or Kerosene | 35 (22.3%) | 6 (13.6%) |
| Coal or Coke | 0 (0.0%) | 0 (0.0%) |
| All other Fuels | 31 (19.8%) | 2 (4.5%) |
| No Fuel Used | 0 (0.0%) | 11 (25.0%) |
| Total | 157 (100.0%) | 44 (100.0%) |
Household Vehicle Usage in Wasco
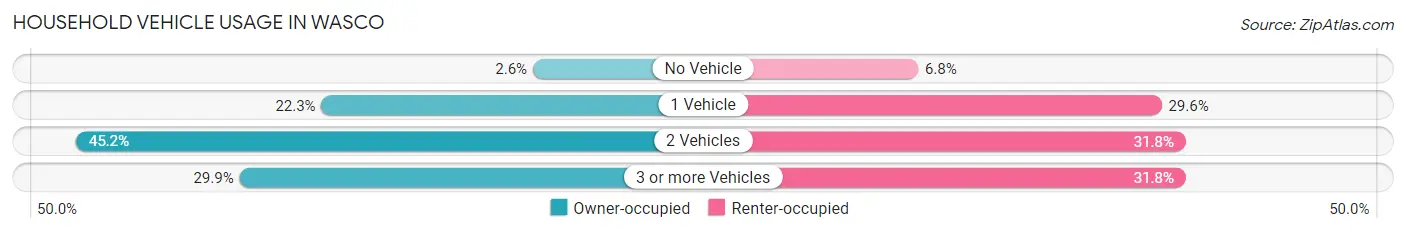
| Vehicles per Household | Owner-occupied | Renter-occupied |
| No Vehicle | 4 (2.5%) | 3 (6.8%) |
| 1 Vehicle | 35 (22.3%) | 13 (29.5%) |
| 2 Vehicles | 71 (45.2%) | 14 (31.8%) |
| 3 or more Vehicles | 47 (29.9%) | 14 (31.8%) |
| Total | 157 (100.0%) | 44 (100.0%) |
Real Estate & Mortgages in Wasco
Real Estate and Mortgage Overview in Wasco
| Characteristic | Without Mortgage | With Mortgage |
| Housing Units | 97 | 60 |
| Median Property Value | $113,400 | $219,000 |
| Median Household Income | $46,964 | $6 |
| Monthly Housing Costs | $402 | $0 |
| Real Estate Taxes | $1,273 | $0 |
Property Value by Mortgage Status in Wasco
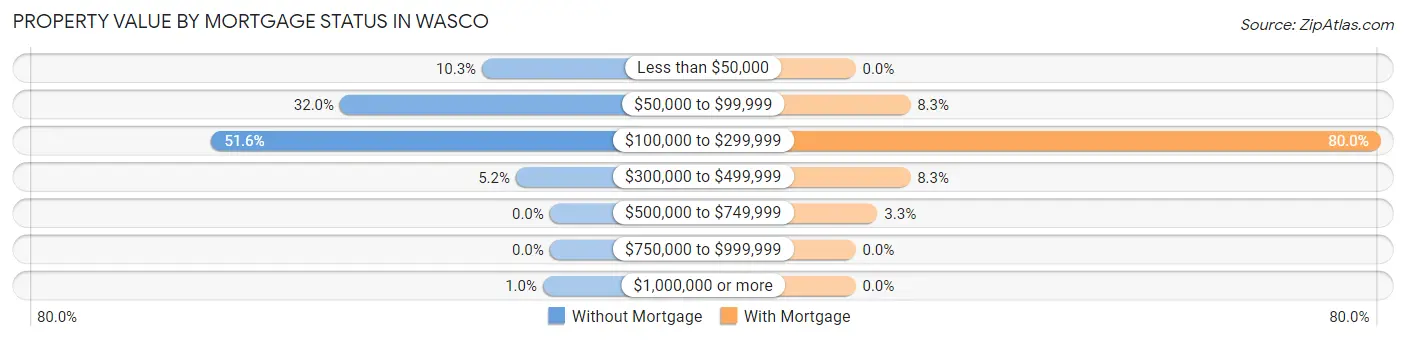
| Property Value | Without Mortgage | With Mortgage |
| Less than $50,000 | 10 (10.3%) | 0 (0.0%) |
| $50,000 to $99,999 | 31 (32.0%) | 5 (8.3%) |
| $100,000 to $299,999 | 50 (51.5%) | 48 (80.0%) |
| $300,000 to $499,999 | 5 (5.1%) | 5 (8.3%) |
| $500,000 to $749,999 | 0 (0.0%) | 2 (3.3%) |
| $750,000 to $999,999 | 0 (0.0%) | 0 (0.0%) |
| $1,000,000 or more | 1 (1.0%) | 0 (0.0%) |
| Total | 97 (100.0%) | 60 (100.0%) |
Household Income by Mortgage Status in Wasco
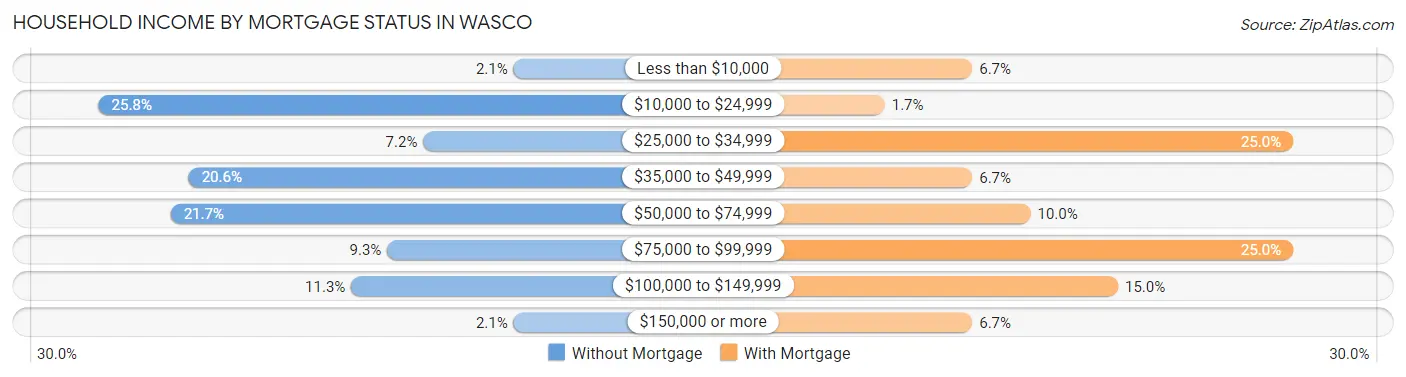
| Household Income | Without Mortgage | With Mortgage |
| Less than $10,000 | 2 (2.1%) | 4 (6.7%) |
| $10,000 to $24,999 | 25 (25.8%) | 1 (1.7%) |
| $25,000 to $34,999 | 7 (7.2%) | 15 (25.0%) |
| $35,000 to $49,999 | 20 (20.6%) | 4 (6.7%) |
| $50,000 to $74,999 | 21 (21.6%) | 6 (10.0%) |
| $75,000 to $99,999 | 9 (9.3%) | 15 (25.0%) |
| $100,000 to $149,999 | 11 (11.3%) | 9 (15.0%) |
| $150,000 or more | 2 (2.1%) | 4 (6.7%) |
| Total | 97 (100.0%) | 60 (100.0%) |
Property Value to Household Income Ratio in Wasco
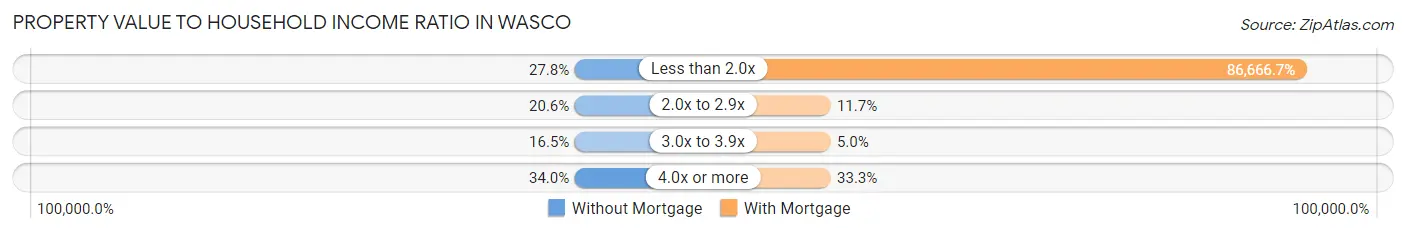
| Value-to-Income Ratio | Without Mortgage | With Mortgage |
| Less than 2.0x | 27 (27.8%) | 52,000 (86,666.7%) |
| 2.0x to 2.9x | 20 (20.6%) | 7 (11.7%) |
| 3.0x to 3.9x | 16 (16.5%) | 3 (5.0%) |
| 4.0x or more | 33 (34.0%) | 20 (33.3%) |
| Total | 97 (100.0%) | 60 (100.0%) |
Real Estate Taxes by Mortgage Status in Wasco

| Property Taxes | Without Mortgage | With Mortgage |
| Less than $800 | 17 (17.5%) | 0 (0.0%) |
| $800 to $1,499 | 44 (45.4%) | 16 (26.7%) |
| $800 to $1,499 | 32 (33.0%) | 19 (31.7%) |
| Total | 97 (100.0%) | 60 (100.0%) |
Health & Disability in Wasco
Health Insurance Coverage by Age in Wasco
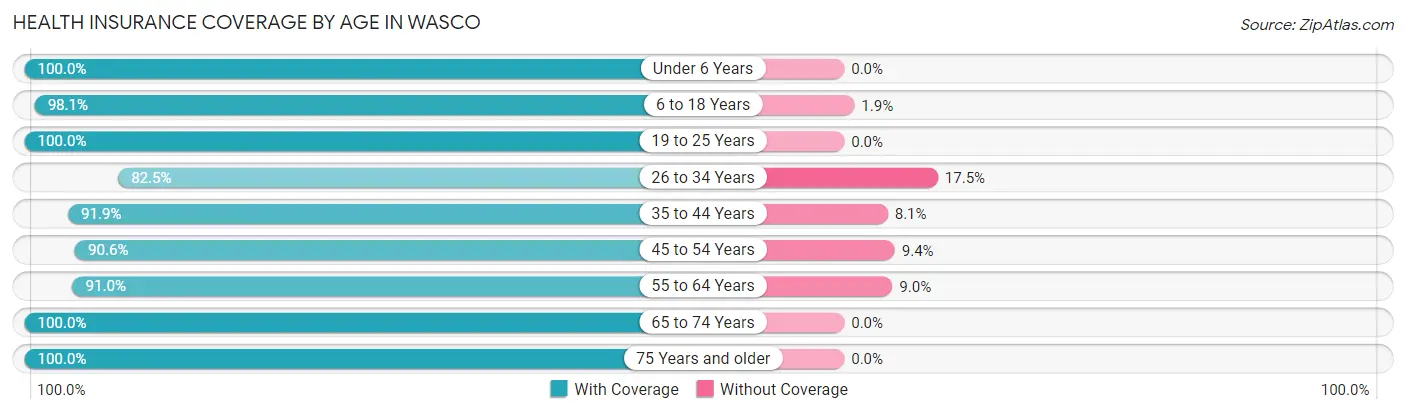
| Age Bracket | With Coverage | Without Coverage |
| Under 6 Years | 17 (100.0%) | 0 (0.0%) |
| 6 to 18 Years | 52 (98.1%) | 1 (1.9%) |
| 19 to 25 Years | 27 (100.0%) | 0 (0.0%) |
| 26 to 34 Years | 52 (82.5%) | 11 (17.5%) |
| 35 to 44 Years | 34 (91.9%) | 3 (8.1%) |
| 45 to 54 Years | 48 (90.6%) | 5 (9.4%) |
| 55 to 64 Years | 71 (91.0%) | 7 (9.0%) |
| 65 to 74 Years | 83 (100.0%) | 0 (0.0%) |
| 75 Years and older | 71 (100.0%) | 0 (0.0%) |
| Total | 455 (94.4%) | 27 (5.6%) |
Health Insurance Coverage by Citizenship Status in Wasco

| Citizenship Status | With Coverage | Without Coverage |
| Native Born | 17 (100.0%) | 0 (0.0%) |
| Foreign Born, Citizen | 52 (98.1%) | 1 (1.9%) |
| Foreign Born, not a Citizen | 27 (100.0%) | 0 (0.0%) |
Health Insurance Coverage by Household Income in Wasco
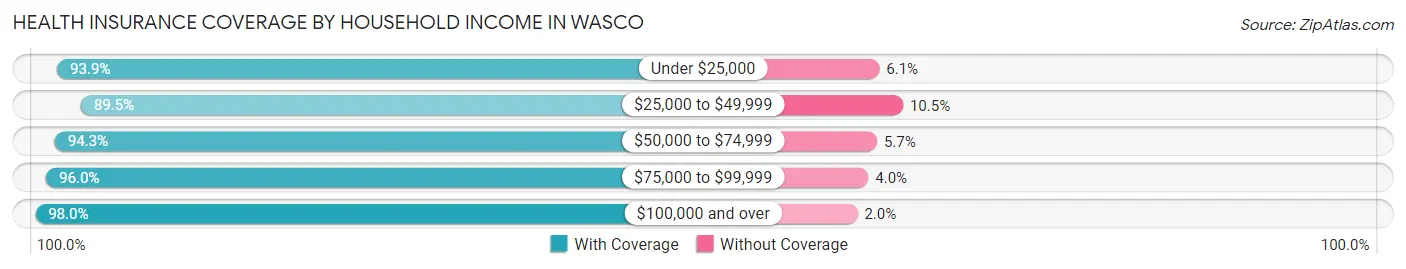
| Household Income | With Coverage | Without Coverage |
| Under $25,000 | 77 (93.9%) | 5 (6.1%) |
| $25,000 to $49,999 | 85 (89.5%) | 10 (10.5%) |
| $50,000 to $74,999 | 100 (94.3%) | 6 (5.7%) |
| $75,000 to $99,999 | 95 (96.0%) | 4 (4.0%) |
| $100,000 and over | 98 (98.0%) | 2 (2.0%) |
Public vs Private Health Insurance Coverage by Age in Wasco
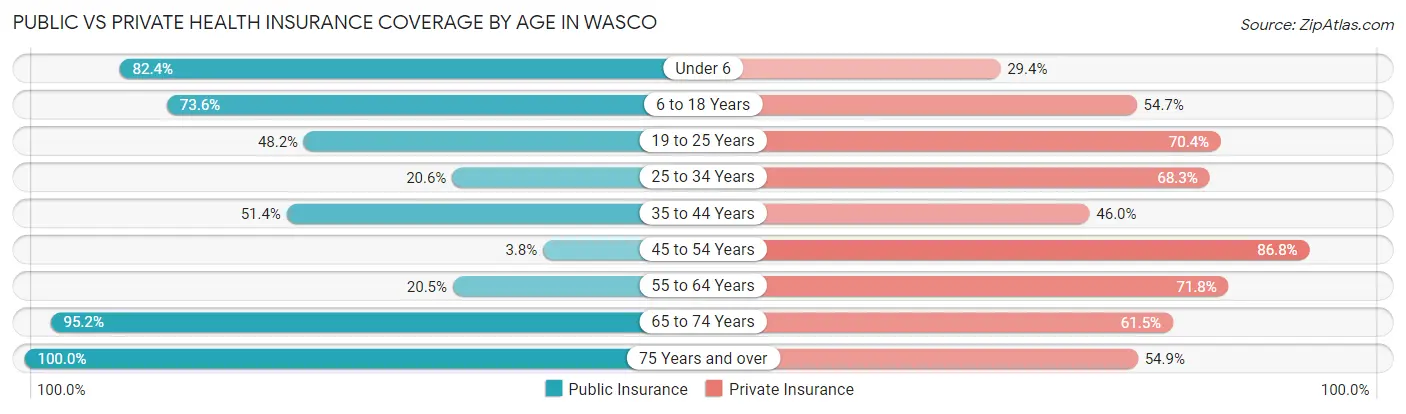
| Age Bracket | Public Insurance | Private Insurance |
| Under 6 | 14 (82.4%) | 5 (29.4%) |
| 6 to 18 Years | 39 (73.6%) | 29 (54.7%) |
| 19 to 25 Years | 13 (48.1%) | 19 (70.4%) |
| 25 to 34 Years | 13 (20.6%) | 43 (68.2%) |
| 35 to 44 Years | 19 (51.3%) | 17 (46.0%) |
| 45 to 54 Years | 2 (3.8%) | 46 (86.8%) |
| 55 to 64 Years | 16 (20.5%) | 56 (71.8%) |
| 65 to 74 Years | 79 (95.2%) | 51 (61.5%) |
| 75 Years and over | 71 (100.0%) | 39 (54.9%) |
| Total | 266 (55.2%) | 305 (63.3%) |
Disability Status by Sex by Age in Wasco
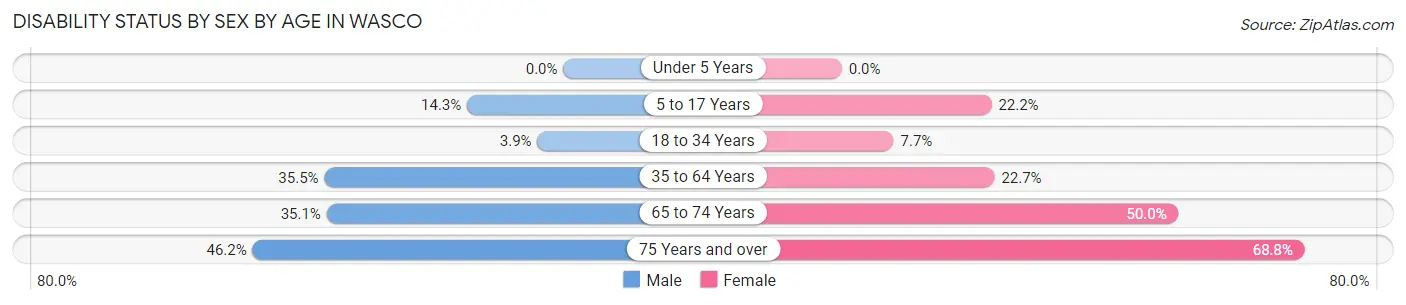
| Age Bracket | Male | Female |
| Under 5 Years | 0 (0.0%) | 0 (0.0%) |
| 5 to 17 Years | 3 (14.3%) | 8 (22.2%) |
| 18 to 34 Years | 2 (3.8%) | 3 (7.7%) |
| 35 to 64 Years | 33 (35.5%) | 17 (22.7%) |
| 65 to 74 Years | 13 (35.1%) | 23 (50.0%) |
| 75 Years and over | 18 (46.2%) | 22 (68.8%) |
Disability Class by Sex by Age in Wasco
Disability Class: Hearing Difficulty
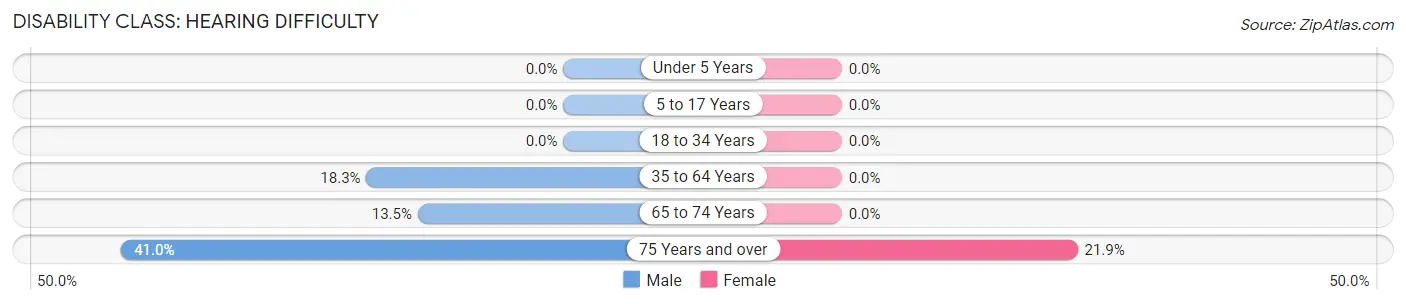
| Age Bracket | Male | Female |
| Under 5 Years | 0 (0.0%) | 0 (0.0%) |
| 5 to 17 Years | 0 (0.0%) | 0 (0.0%) |
| 18 to 34 Years | 0 (0.0%) | 0 (0.0%) |
| 35 to 64 Years | 17 (18.3%) | 0 (0.0%) |
| 65 to 74 Years | 5 (13.5%) | 0 (0.0%) |
| 75 Years and over | 16 (41.0%) | 7 (21.9%) |
Disability Class: Vision Difficulty
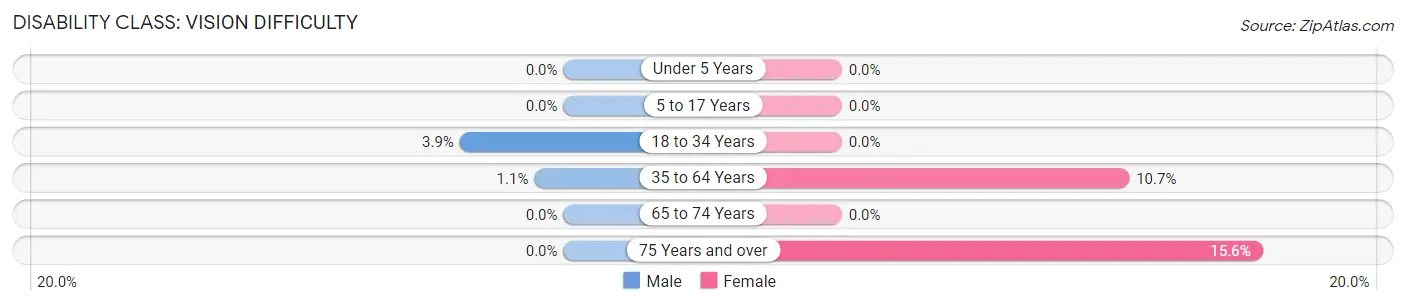
| Age Bracket | Male | Female |
| Under 5 Years | 0 (0.0%) | 0 (0.0%) |
| 5 to 17 Years | 0 (0.0%) | 0 (0.0%) |
| 18 to 34 Years | 2 (3.8%) | 0 (0.0%) |
| 35 to 64 Years | 1 (1.1%) | 8 (10.7%) |
| 65 to 74 Years | 0 (0.0%) | 0 (0.0%) |
| 75 Years and over | 0 (0.0%) | 5 (15.6%) |
Disability Class: Cognitive Difficulty
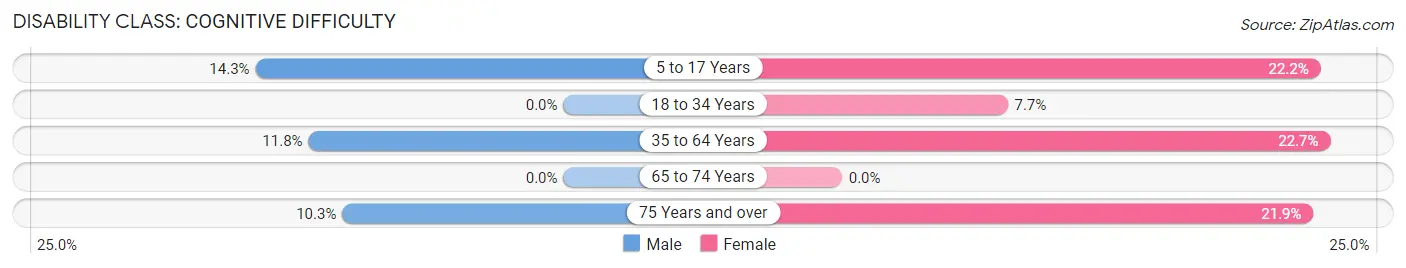
| Age Bracket | Male | Female |
| 5 to 17 Years | 3 (14.3%) | 8 (22.2%) |
| 18 to 34 Years | 0 (0.0%) | 3 (7.7%) |
| 35 to 64 Years | 11 (11.8%) | 17 (22.7%) |
| 65 to 74 Years | 0 (0.0%) | 0 (0.0%) |
| 75 Years and over | 4 (10.3%) | 7 (21.9%) |
Disability Class: Ambulatory Difficulty
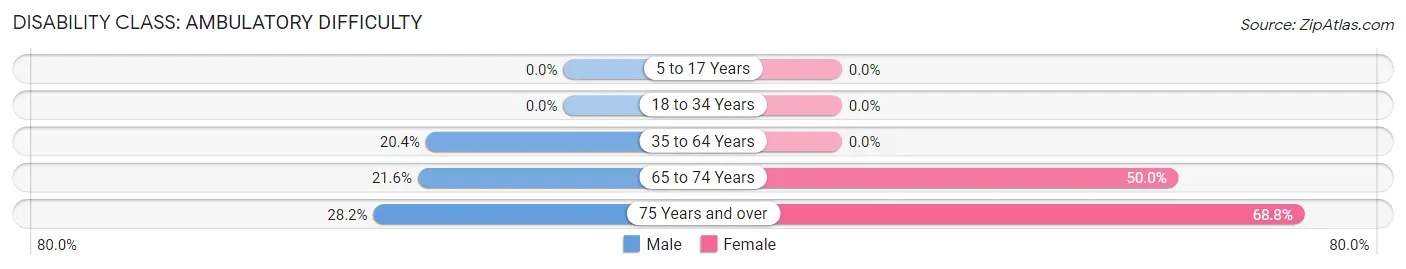
| Age Bracket | Male | Female |
| 5 to 17 Years | 0 (0.0%) | 0 (0.0%) |
| 18 to 34 Years | 0 (0.0%) | 0 (0.0%) |
| 35 to 64 Years | 19 (20.4%) | 0 (0.0%) |
| 65 to 74 Years | 8 (21.6%) | 23 (50.0%) |
| 75 Years and over | 11 (28.2%) | 22 (68.8%) |
Disability Class: Self-Care Difficulty
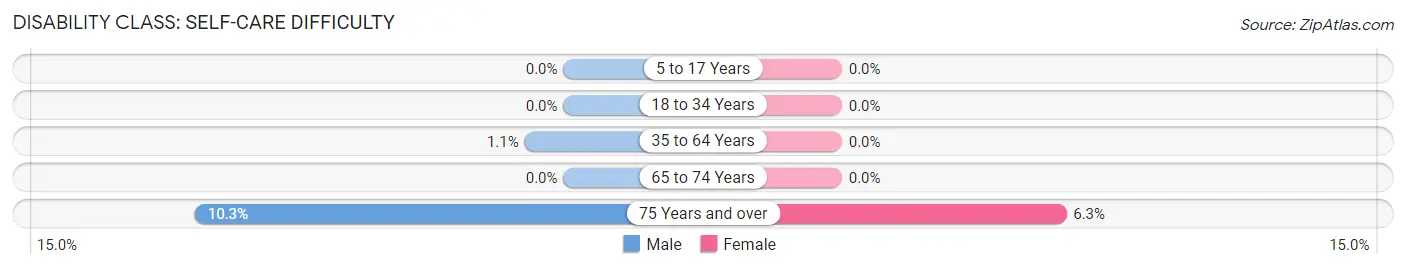
| Age Bracket | Male | Female |
| 5 to 17 Years | 0 (0.0%) | 0 (0.0%) |
| 18 to 34 Years | 0 (0.0%) | 0 (0.0%) |
| 35 to 64 Years | 1 (1.1%) | 0 (0.0%) |
| 65 to 74 Years | 0 (0.0%) | 0 (0.0%) |
| 75 Years and over | 4 (10.3%) | 2 (6.2%) |
Technology Access in Wasco
Computing Device Access in Wasco
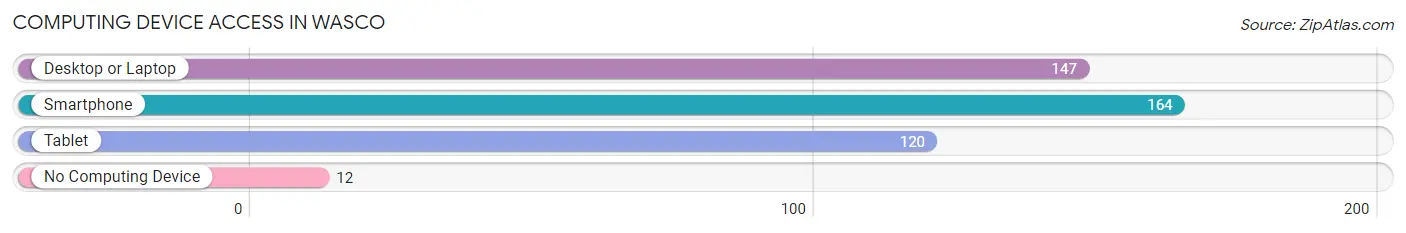
| Device Type | # Households | % Households |
| Desktop or Laptop | 147 | 73.1% |
| Smartphone | 164 | 81.6% |
| Tablet | 120 | 59.7% |
| No Computing Device | 12 | 6.0% |
| Total | 201 | 100.0% |
Internet Access in Wasco
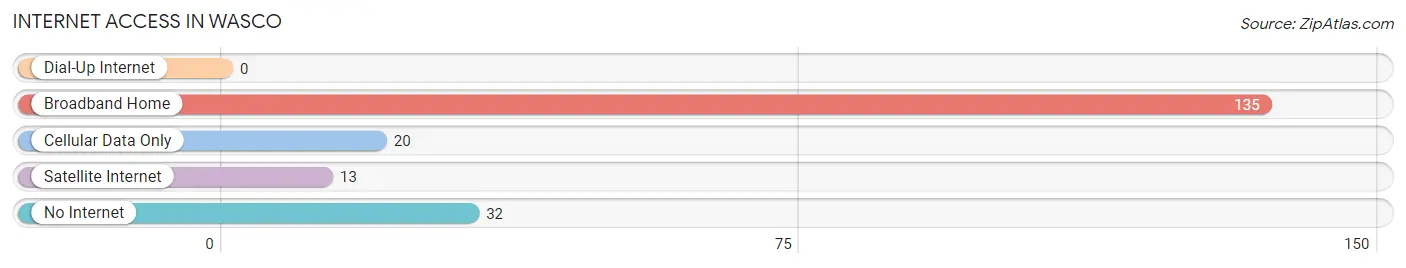
| Internet Type | # Households | % Households |
| Dial-Up Internet | 0 | 0.0% |
| Broadband Home | 135 | 67.2% |
| Cellular Data Only | 20 | 10.0% |
| Satellite Internet | 13 | 6.5% |
| No Internet | 32 | 15.9% |
| Total | 201 | 100.0% |
Wasco Summary
Wasco is a city located in Sherman County, Oregon, United States. It is situated along the Columbia River, approximately 20 miles east of The Dalles. The population was 1,719 at the 2010 census.
History
The area that is now Wasco was originally inhabited by the Wasco-Wishram people, a Native American tribe of the Chinookan language family. The first non-native settlers arrived in the area in the early 1850s, and the town was officially established in 1854. The town was named after the Wasco-Wishram people, and the name was officially adopted in 1859.
In the late 19th century, Wasco was a major shipping port for the region, with goods being shipped down the Columbia River to Portland and other cities. The town was also a major stop on the Oregon Trail, and many pioneers passed through Wasco on their way to the Willamette Valley.
Geography
Wasco is located in Sherman County, Oregon, at the confluence of the Columbia and Deschutes Rivers. The city has a total area of 1.3 square miles, all of which is land. The city is located at an elevation of 545 feet above sea level.
Climate
Wasco has a semi-arid climate, with hot summers and cold winters. The average annual temperature is 54°F, and the average annual precipitation is 11.5 inches.
Demographics
As of the 2010 census, there were 1,719 people, 690 households, and 463 families residing in Wasco. The population density was 1,323.8 people per square mile. The racial makeup of the city was 91.2% White, 0.2% African American, 0.7% Native American, 0.4% Asian, 0.1% Pacific Islander, 4.7% from other races, and 2.7% from two or more races. Hispanic or Latino of any race were 8.3% of the population.
Economy
The economy of Wasco is largely based on agriculture. The city is home to several large farms, and the surrounding area is known for its wheat, barley, and hay production. The city is also home to several small businesses, including restaurants, retail stores, and service providers.
The city is also home to several manufacturing companies, including a paper mill, a wood products plant, and a metal fabrication plant. The city is also home to a large wind farm, which provides electricity to the region.
Conclusion
Wasco is a small city located in Sherman County, Oregon. It is situated along the Columbia River, and has a population of 1,719 as of the 2010 census. The city has a semi-arid climate, with hot summers and cold winters. The economy of Wasco is largely based on agriculture, and the city is home to several large farms and manufacturing companies. The city is also home to several small businesses, and is a major stop on the Oregon Trail.
Common Questions
What is Per Capita Income in Wasco?
Per Capita income in Wasco is $29,136.
What is the Median Family Income in Wasco?
Median Family Income in Wasco is $54,063.
What is the Median Household income in Wasco?
Median Household Income in Wasco is $53,542.
What is Income or Wage Gap in Wasco?
Income or Wage Gap in Wasco is 43.9%.
Women in Wasco earn 56.1 cents for every dollar earned by a man.
What is Inequality or Gini Index in Wasco?
Inequality or Gini Index in Wasco is 0.38.
What is the Total Population of Wasco?
Total Population of Wasco is 482.
What is the Total Male Population of Wasco?
Total Male Population of Wasco is 248.
What is the Total Female Population of Wasco?
Total Female Population of Wasco is 234.
What is the Ratio of Males per 100 Females in Wasco?
There are 105.98 Males per 100 Females in Wasco.
What is the Ratio of Females per 100 Males in Wasco?
There are 94.35 Females per 100 Males in Wasco.
What is the Median Population Age in Wasco?
Median Population Age in Wasco is 51.7 Years.
What is the Average Family Size in Wasco
Average Family Size in Wasco is 3.1 People.
What is the Average Household Size in Wasco
Average Household Size in Wasco is 2.4 People.
How Large is the Labor Force in Wasco?
There are 196 People in the Labor Forcein in Wasco.
What is the Percentage of People in the Labor Force in Wasco?
46.8% of People are in the Labor Force in Wasco.
What is the Unemployment Rate in Wasco?
Unemployment Rate in Wasco is 2.0%.