Warm Springs, OR Map & Demographics
Warm Springs Map
Warm Springs Overview
$21,970
PER CAPITA INCOME
$58,548
AVG FAMILY INCOME
$59,167
AVG HOUSEHOLD INCOME
1.8%
WAGE / INCOME GAP [ % ]
98.2¢/ $1
WAGE / INCOME GAP [ $ ]
$13,839
FAMILY INCOME DEFICIT
0.50
INEQUALITY / GINI INDEX
2,453
TOTAL POPULATION
1,301
MALE POPULATION
1,152
FEMALE POPULATION
112.93
MALES / 100 FEMALES
88.55
FEMALES / 100 MALES
30.4
MEDIAN AGE
3.9
AVG FAMILY SIZE
3.6
AVG HOUSEHOLD SIZE
1,024
LABOR FORCE [ PEOPLE ]
55.6%
PERCENT IN LABOR FORCE
11.0%
UNEMPLOYMENT RATE
Warm Springs Zip Codes
Warm Springs Area Codes
Income in Warm Springs
Income Overview in Warm Springs
Per Capita Income in Warm Springs is $21,970, while median incomes of families and households are $58,548 and $59,167 respectively.
| Characteristic | Number | Measure |
| Per Capita Income | 2,453 | $21,970 |
| Median Family Income | 540 | $58,548 |
| Mean Family Income | 540 | $73,809 |
| Median Household Income | 656 | $59,167 |
| Mean Household Income | 656 | $74,448 |
| Income Deficit | 540 | $13,839 |
| Wage / Income Gap (%) | 2,453 | 1.76% |
| Wage / Income Gap ($) | 2,453 | 98.24¢ per $1 |
| Gini / Inequality Index | 2,453 | 0.50 |
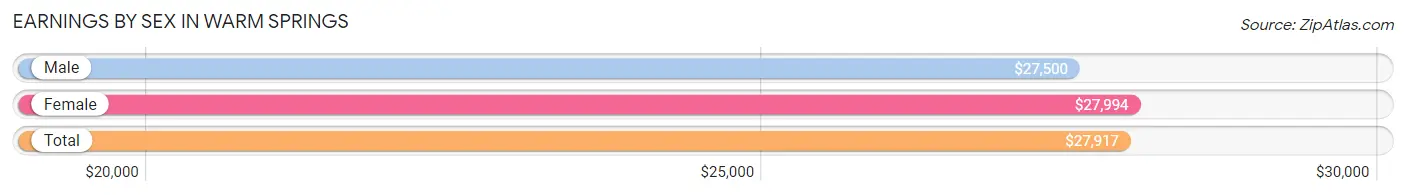
Earnings by Sex in Warm Springs
Average Earnings in Warm Springs are $27,917, $27,500 for men and $27,994 for women, a difference of 1.8%.
| Sex | Number | Average Earnings |
| Male | 562 (49.3%) | $27,500 |
| Female | 577 (50.7%) | $27,994 |
| Total | 1,139 (100.0%) | $27,917 |
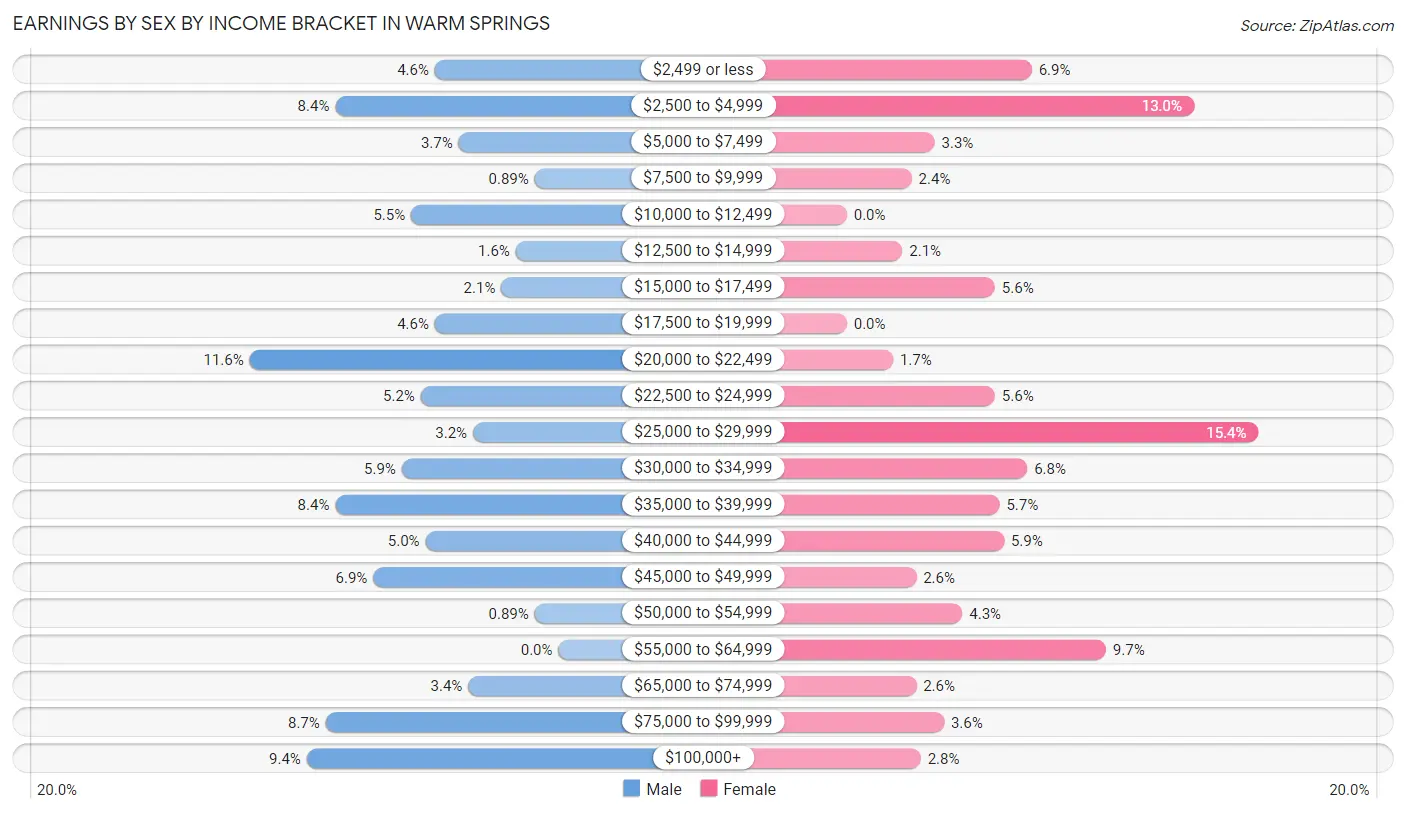
Earnings by Sex by Income Bracket in Warm Springs
The most common earnings brackets in Warm Springs are $20,000 to $22,499 for men (65 | 11.6%) and $25,000 to $29,999 for women (89 | 15.4%).
| Income | Male | Female |
| $2,499 or less | 26 (4.6%) | 40 (6.9%) |
| $2,500 to $4,999 | 47 (8.4%) | 75 (13.0%) |
| $5,000 to $7,499 | 21 (3.7%) | 19 (3.3%) |
| $7,500 to $9,999 | 5 (0.9%) | 14 (2.4%) |
| $10,000 to $12,499 | 31 (5.5%) | 0 (0.0%) |
| $12,500 to $14,999 | 9 (1.6%) | 12 (2.1%) |
| $15,000 to $17,499 | 12 (2.1%) | 32 (5.6%) |
| $17,500 to $19,999 | 26 (4.6%) | 0 (0.0%) |
| $20,000 to $22,499 | 65 (11.6%) | 10 (1.7%) |
| $22,500 to $24,999 | 29 (5.2%) | 32 (5.6%) |
| $25,000 to $29,999 | 18 (3.2%) | 89 (15.4%) |
| $30,000 to $34,999 | 33 (5.9%) | 39 (6.8%) |
| $35,000 to $39,999 | 47 (8.4%) | 33 (5.7%) |
| $40,000 to $44,999 | 28 (5.0%) | 34 (5.9%) |
| $45,000 to $49,999 | 39 (6.9%) | 15 (2.6%) |
| $50,000 to $54,999 | 5 (0.9%) | 25 (4.3%) |
| $55,000 to $64,999 | 0 (0.0%) | 56 (9.7%) |
| $65,000 to $74,999 | 19 (3.4%) | 15 (2.6%) |
| $75,000 to $99,999 | 49 (8.7%) | 21 (3.6%) |
| $100,000+ | 53 (9.4%) | 16 (2.8%) |
| Total | 562 (100.0%) | 577 (100.0%) |
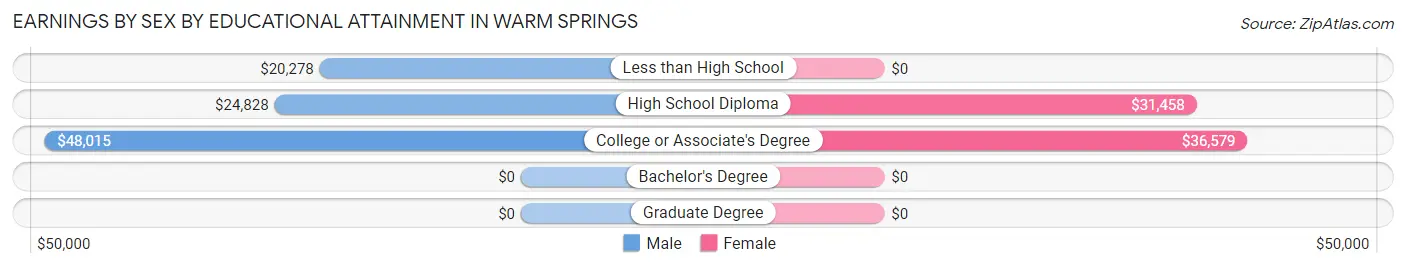
Earnings by Sex by Educational Attainment in Warm Springs
Average earnings in Warm Springs are $32,262 for men and $32,100 for women, a difference of 0.5%. Men with an educational attainment of college or associate's degree enjoy the highest average annual earnings of $48,015, while those with less than high school education earn the least with $20,278. Women with an educational attainment of college or associate's degree earn the most with the average annual earnings of $36,579, while those with high school diploma education have the smallest earnings of $31,458.
| Educational Attainment | Male Income | Female Income |
| Less than High School | $20,278 | $0 |
| High School Diploma | $24,828 | $31,458 |
| College or Associate's Degree | $48,015 | $36,579 |
| Bachelor's Degree | - | - |
| Graduate Degree | - | - |
| Total | $32,262 | $32,100 |
Family Income in Warm Springs
Family Income Brackets in Warm Springs
According to the Warm Springs family income data, there are 107 families falling into the less than $10,000 income range, which is the most common income bracket and makes up 19.8% of all families. Conversely, the $10,000 to $14,999 income bracket is the least frequent group with only 11 families (2.0%) belonging to this category.
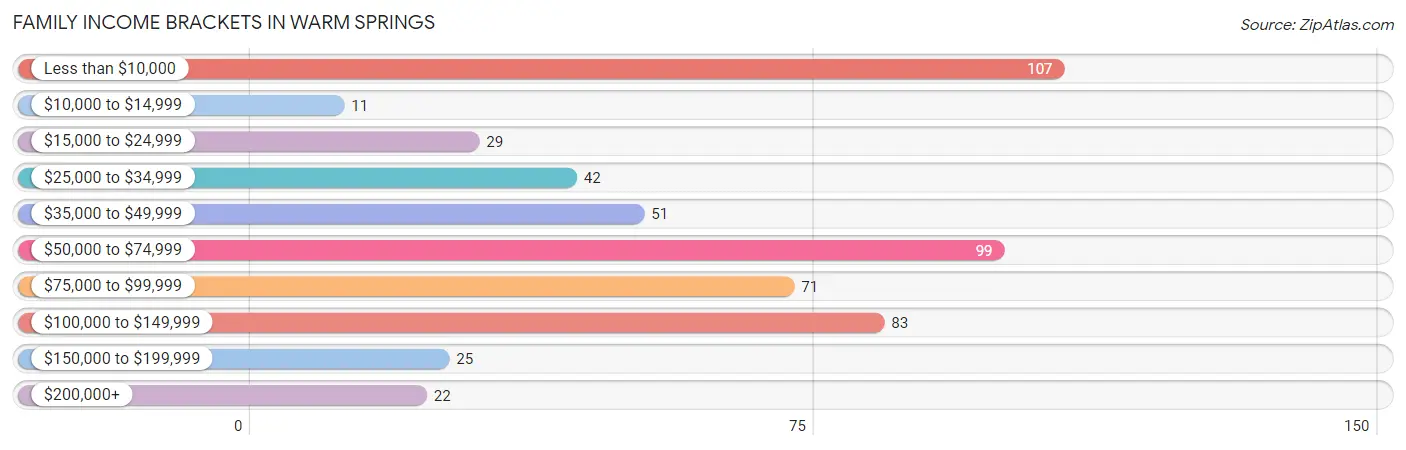
| Income Bracket | # Families | % Families |
| Less than $10,000 | 107 | 19.8% |
| $10,000 to $14,999 | 11 | 2.0% |
| $15,000 to $24,999 | 29 | 5.4% |
| $25,000 to $34,999 | 42 | 7.8% |
| $35,000 to $49,999 | 51 | 9.4% |
| $50,000 to $74,999 | 99 | 18.3% |
| $75,000 to $99,999 | 71 | 13.1% |
| $100,000 to $149,999 | 83 | 15.4% |
| $150,000 to $199,999 | 25 | 4.6% |
| $200,000+ | 22 | 4.1% |
Family Income by Famaliy Size in Warm Springs
5-person families (76 | 14.1%) account for the highest median family income in Warm Springs with $79,688 per family, while 2-person families (127 | 23.5%) have the highest median income of $16,875 per family member.
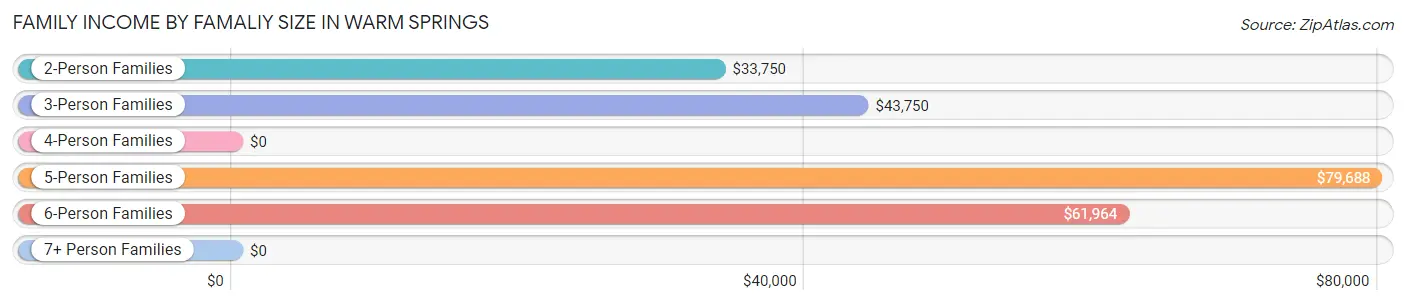
| Income Bracket | # Families | Median Income |
| 2-Person Families | 127 (23.5%) | $33,750 |
| 3-Person Families | 190 (35.2%) | $43,750 |
| 4-Person Families | 70 (13.0%) | $0 |
| 5-Person Families | 76 (14.1%) | $79,688 |
| 6-Person Families | 31 (5.7%) | $61,964 |
| 7+ Person Families | 46 (8.5%) | $0 |
| Total | 540 (100.0%) | $58,548 |
Family Income by Number of Earners in Warm Springs
The median family income in Warm Springs is $58,548, with families comprising 3+ earners (74) having the highest median family income of $122,813, while families with no earners (90) have the lowest median family income of $8,947, accounting for 13.7% and 16.7% of families, respectively.
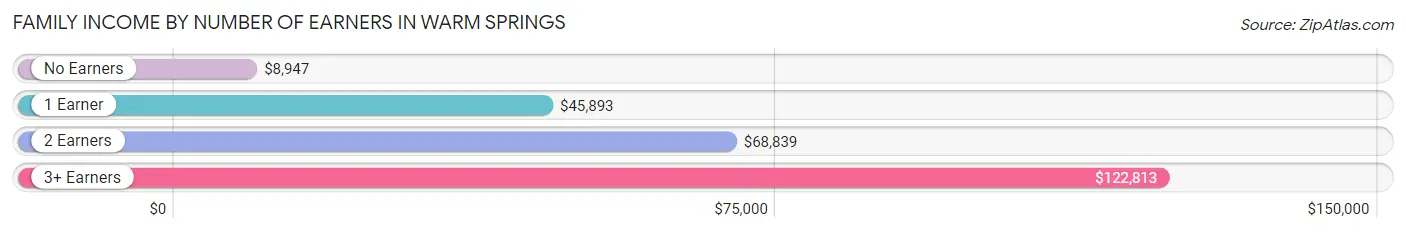
| Number of Earners | # Families | Median Income |
| No Earners | 90 (16.7%) | $8,947 |
| 1 Earner | 225 (41.7%) | $45,893 |
| 2 Earners | 151 (28.0%) | $68,839 |
| 3+ Earners | 74 (13.7%) | $122,813 |
| Total | 540 (100.0%) | $58,548 |
Household Income in Warm Springs
Household Income Brackets in Warm Springs
With 139 households falling in the category, the $100,000 to $149,999 income range is the most frequent in Warm Springs, accounting for 21.2% of all households. In contrast, only 22 households (3.4%) fall into the $200,000+ income bracket, making it the least populous group.
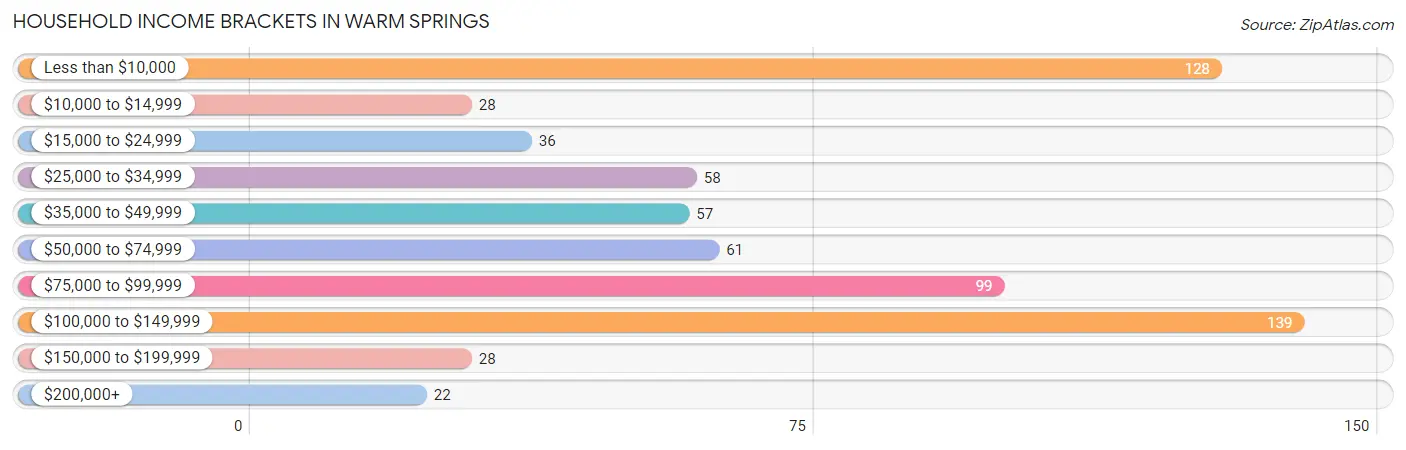
| Income Bracket | # Households | % Households |
| Less than $10,000 | 128 | 19.5% |
| $10,000 to $14,999 | 28 | 4.3% |
| $15,000 to $24,999 | 36 | 5.5% |
| $25,000 to $34,999 | 58 | 8.8% |
| $35,000 to $49,999 | 57 | 8.7% |
| $50,000 to $74,999 | 61 | 9.3% |
| $75,000 to $99,999 | 99 | 15.1% |
| $100,000 to $149,999 | 139 | 21.2% |
| $150,000 to $199,999 | 28 | 4.3% |
| $200,000+ | 22 | 3.4% |
Household Income by Householder Age in Warm Springs
The median household income in Warm Springs is $59,167, with the highest median household income of $81,827 found in the 45 to 64 years age bracket for the primary householder. A total of 319 households (48.6%) fall into this category. Meanwhile, the 15 to 24 years age bracket for the primary householder has the lowest median household income of $0, with 6 households (0.9%) in this group.
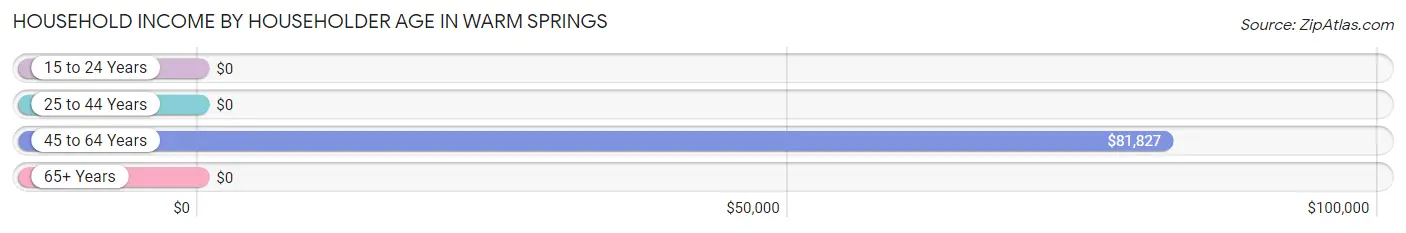
| Income Bracket | # Households | Median Income |
| 15 to 24 Years | 6 (0.9%) | $0 |
| 25 to 44 Years | 180 (27.4%) | $0 |
| 45 to 64 Years | 319 (48.6%) | $81,827 |
| 65+ Years | 151 (23.0%) | $0 |
| Total | 656 (100.0%) | $59,167 |
Poverty in Warm Springs
Income Below Poverty by Sex and Age in Warm Springs
With 27.8% poverty level for males and 27.4% for females among the residents of Warm Springs, 12 to 14 year old males and 15 year old females are the most vulnerable to poverty, with 66 males (54.5%) and 5 females (100.0%) in their respective age groups living below the poverty level.
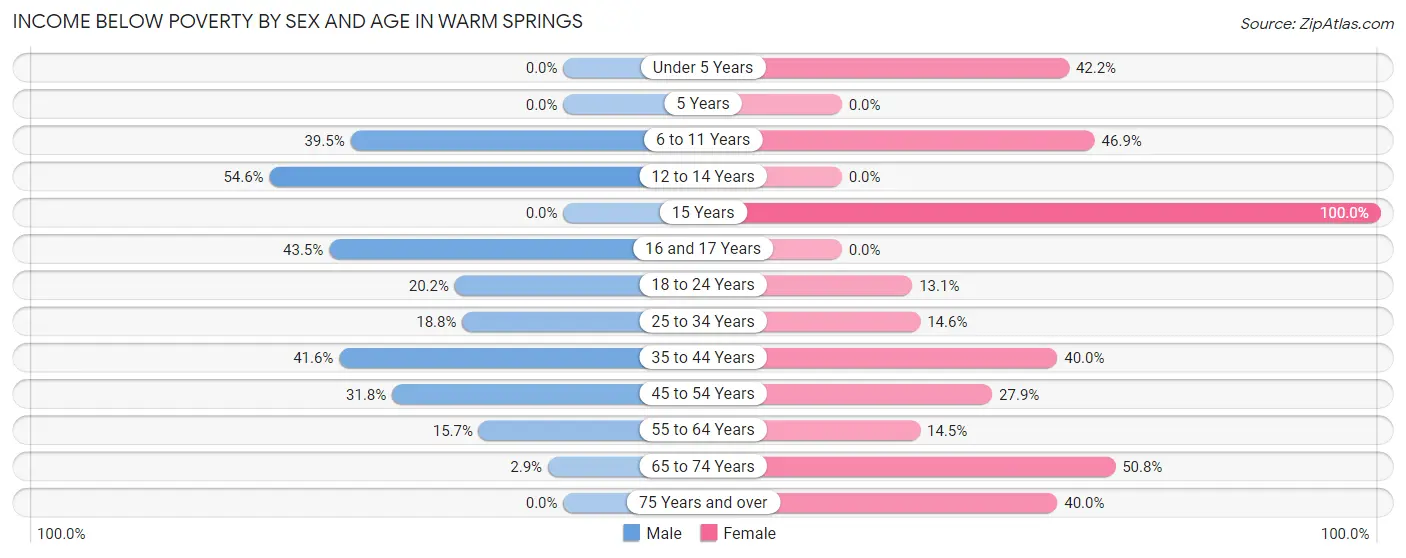
| Age Bracket | Male | Female |
| Under 5 Years | 0 (0.0%) | 43 (42.2%) |
| 5 Years | 0 (0.0%) | 0 (0.0%) |
| 6 to 11 Years | 81 (39.5%) | 46 (46.9%) |
| 12 to 14 Years | 66 (54.5%) | 0 (0.0%) |
| 15 Years | 0 (0.0%) | 5 (100.0%) |
| 16 and 17 Years | 10 (43.5%) | 0 (0.0%) |
| 18 to 24 Years | 27 (20.2%) | 20 (13.1%) |
| 25 to 34 Years | 51 (18.8%) | 30 (14.6%) |
| 35 to 44 Years | 62 (41.6%) | 44 (40.0%) |
| 45 to 54 Years | 34 (31.8%) | 24 (27.9%) |
| 55 to 64 Years | 19 (15.7%) | 25 (14.5%) |
| 65 to 74 Years | 2 (2.9%) | 68 (50.7%) |
| 75 Years and over | 0 (0.0%) | 6 (40.0%) |
| Total | 352 (27.8%) | 311 (27.4%) |
Income Above Poverty by Sex and Age in Warm Springs
According to the poverty statistics in Warm Springs, males aged under 5 years and females aged 5 years are the age groups that are most secure financially, with 100.0% of males and 100.0% of females in these age groups living above the poverty line.
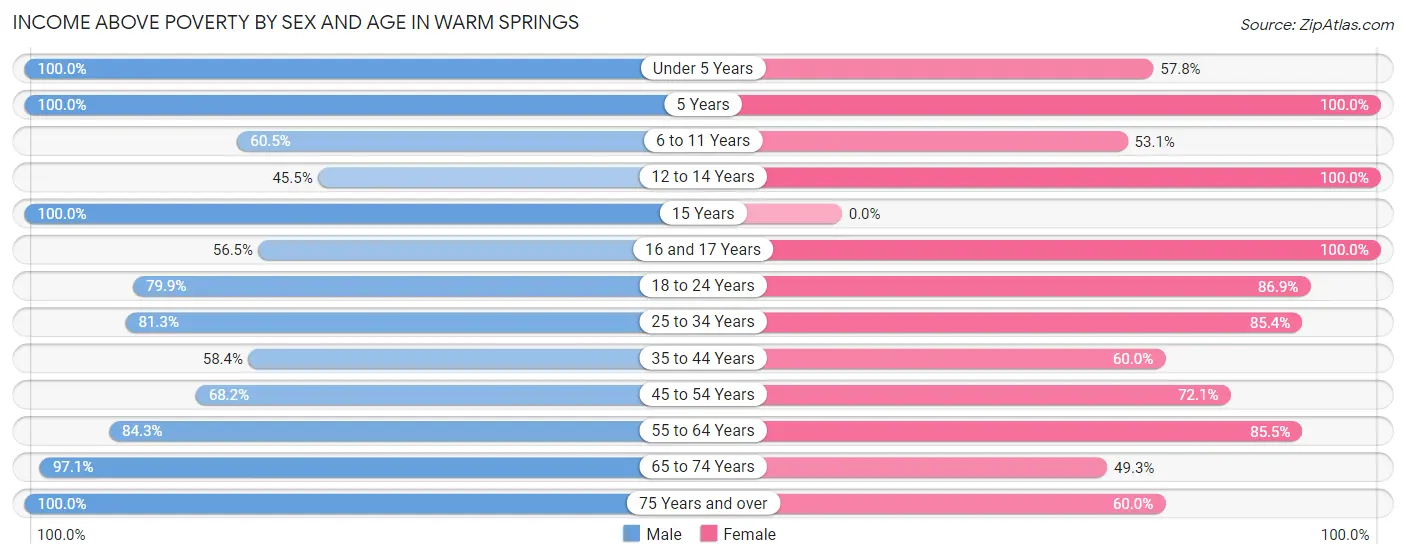
| Age Bracket | Male | Female |
| Under 5 Years | 27 (100.0%) | 59 (57.8%) |
| 5 Years | 8 (100.0%) | 14 (100.0%) |
| 6 to 11 Years | 124 (60.5%) | 52 (53.1%) |
| 12 to 14 Years | 55 (45.5%) | 15 (100.0%) |
| 15 Years | 17 (100.0%) | 0 (0.0%) |
| 16 and 17 Years | 13 (56.5%) | 26 (100.0%) |
| 18 to 24 Years | 107 (79.8%) | 133 (86.9%) |
| 25 to 34 Years | 221 (81.2%) | 176 (85.4%) |
| 35 to 44 Years | 87 (58.4%) | 66 (60.0%) |
| 45 to 54 Years | 73 (68.2%) | 62 (72.1%) |
| 55 to 64 Years | 102 (84.3%) | 147 (85.5%) |
| 65 to 74 Years | 68 (97.1%) | 66 (49.2%) |
| 75 Years and over | 13 (100.0%) | 9 (60.0%) |
| Total | 915 (72.2%) | 825 (72.6%) |
Income Below Poverty Among Married-Couple Families in Warm Springs
The poverty statistics for married-couple families in Warm Springs show that 14.4% or 25 of the total 173 families live below the poverty line. Families with 5 or more children have the highest poverty rate of 66.7%, comprising of 14 families. On the other hand, families with no children have the lowest poverty rate of 0.0%, which includes 0 families.
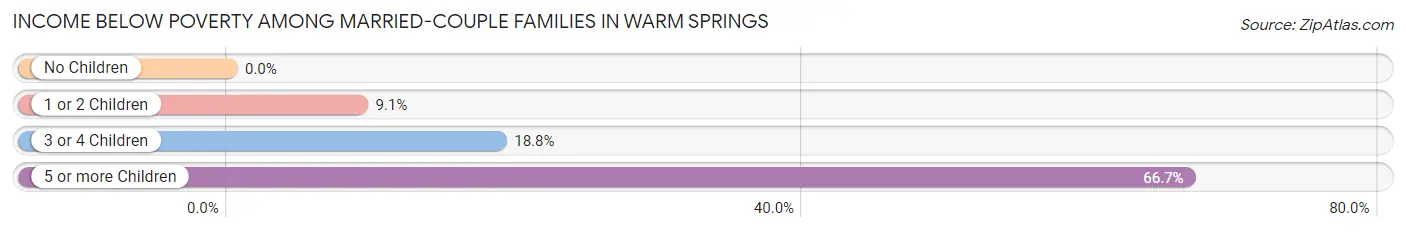
| Children | Above Poverty | Below Poverty |
| No Children | 82 (100.0%) | 0 (0.0%) |
| 1 or 2 Children | 20 (90.9%) | 2 (9.1%) |
| 3 or 4 Children | 39 (81.2%) | 9 (18.8%) |
| 5 or more Children | 7 (33.3%) | 14 (66.7%) |
| Total | 148 (85.6%) | 25 (14.4%) |
Income Below Poverty Among Single-Parent Households in Warm Springs
According to the poverty data in Warm Springs, 38.0% or 30 single-father households and 34.7% or 100 single-mother households are living below the poverty line. Among single-father households, those with 5 or more children have the highest poverty rate, with 10 households (62.5%) experiencing poverty. Likewise, among single-mother households, those with 1 or 2 children have the highest poverty rate, with 73 households (38.6%) falling below the poverty line.
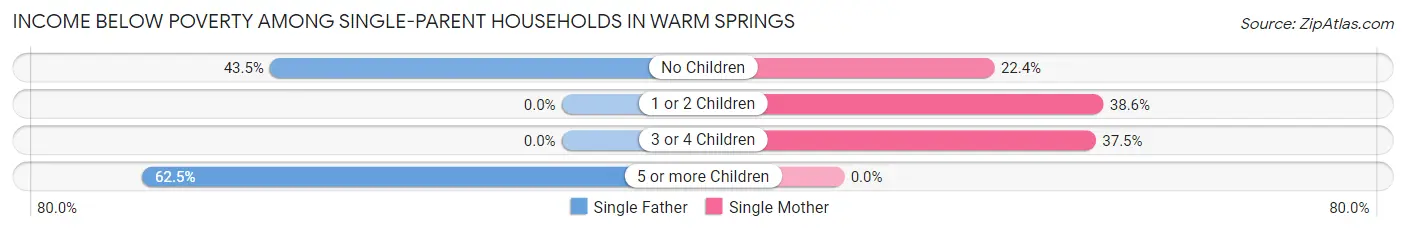
| Children | Single Father | Single Mother |
| No Children | 20 (43.5%) | 15 (22.4%) |
| 1 or 2 Children | 0 (0.0%) | 73 (38.6%) |
| 3 or 4 Children | 0 (0.0%) | 12 (37.5%) |
| 5 or more Children | 10 (62.5%) | 0 (0.0%) |
| Total | 30 (38.0%) | 100 (34.7%) |
Income Below Poverty Among Married-Couple vs Single-Parent Households in Warm Springs
The poverty data for Warm Springs shows that 25 of the married-couple family households (14.4%) and 130 of the single-parent households (35.4%) are living below the poverty level. Within the married-couple family households, those with 5 or more children have the highest poverty rate, with 14 households (66.7%) falling below the poverty line. Among the single-parent households, those with 5 or more children have the highest poverty rate, with 10 household (62.5%) living below poverty.
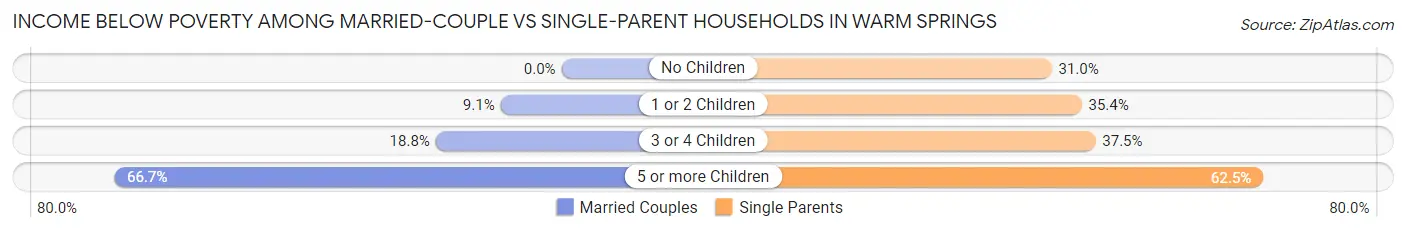
| Children | Married-Couple Families | Single-Parent Households |
| No Children | 0 (0.0%) | 35 (31.0%) |
| 1 or 2 Children | 2 (9.1%) | 73 (35.4%) |
| 3 or 4 Children | 9 (18.8%) | 12 (37.5%) |
| 5 or more Children | 14 (66.7%) | 10 (62.5%) |
| Total | 25 (14.4%) | 130 (35.4%) |
Race in Warm Springs
The most populous races in Warm Springs are Native / Alaskan (2,080 | 84.8%), Hispanic or Latino (222 | 9.0%), and White / Caucasian (125 | 5.1%).
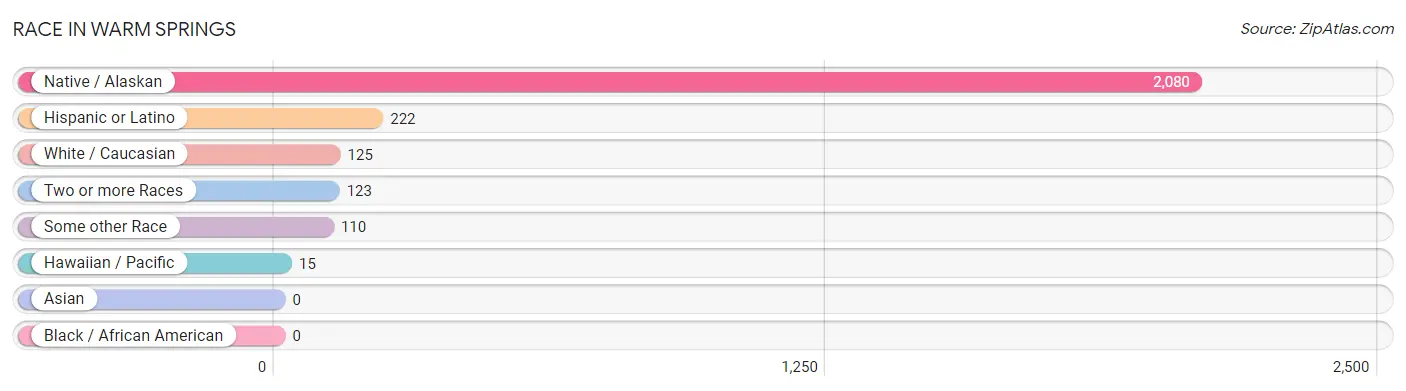
| Race | # Population | % Population |
| Asian | 0 | 0.0% |
| Black / African American | 0 | 0.0% |
| Hawaiian / Pacific | 15 | 0.6% |
| Hispanic or Latino | 222 | 9.0% |
| Native / Alaskan | 2,080 | 84.8% |
| White / Caucasian | 125 | 5.1% |
| Two or more Races | 123 | 5.0% |
| Some other Race | 110 | 4.5% |
| Total | 2,453 | 100.0% |
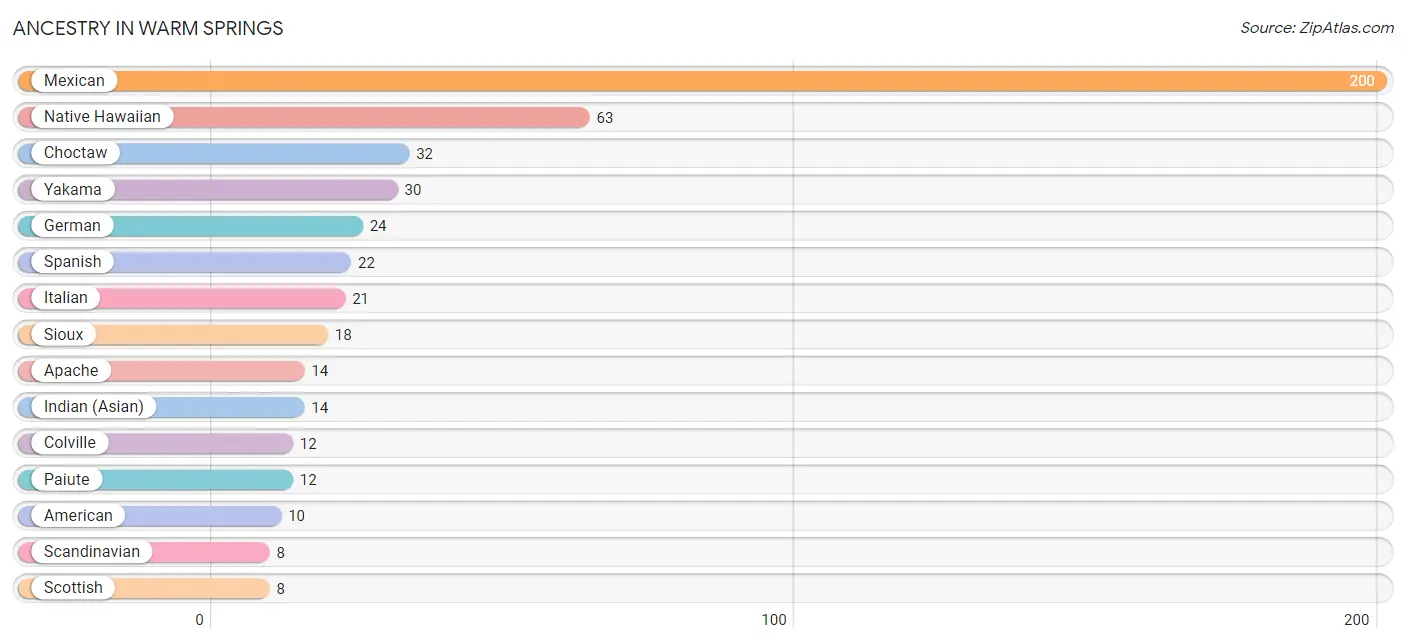
Ancestry in Warm Springs
The most populous ancestries reported in Warm Springs are Mexican (200 | 8.2%), Native Hawaiian (63 | 2.6%), Choctaw (32 | 1.3%), Yakama (30 | 1.2%), and German (24 | 1.0%), together accounting for 14.2% of all Warm Springs residents.
| Ancestry | # Population | % Population |
| American | 10 | 0.4% |
| Apache | 14 | 0.6% |
| Chippewa | 3 | 0.1% |
| Choctaw | 32 | 1.3% |
| Colville | 12 | 0.5% |
| English | 7 | 0.3% |
| European | 3 | 0.1% |
| French | 5 | 0.2% |
| French American Indian | 5 | 0.2% |
| French Canadian | 3 | 0.1% |
| German | 24 | 1.0% |
| Indian (Asian) | 14 | 0.6% |
| Italian | 21 | 0.9% |
| Mexican | 200 | 8.2% |
| Native Hawaiian | 63 | 2.6% |
| Navajo | 7 | 0.3% |
| Paiute | 12 | 0.5% |
| Puget Sound Salish | 4 | 0.2% |
| Scandinavian | 8 | 0.3% |
| Scottish | 8 | 0.3% |
| Sioux | 18 | 0.7% |
| Spanish | 22 | 0.9% |
| Tlingit-Haida | 4 | 0.2% |
| Yakama | 30 | 1.2% | View All 24 Rows |
Immigrants in Warm Springs
The most numerous immigrant groups reported in Warm Springs came from Central America (5 | 0.2%), Latin America (5 | 0.2%), and Mexico (5 | 0.2%), together accounting for 0.6% of all Warm Springs residents.
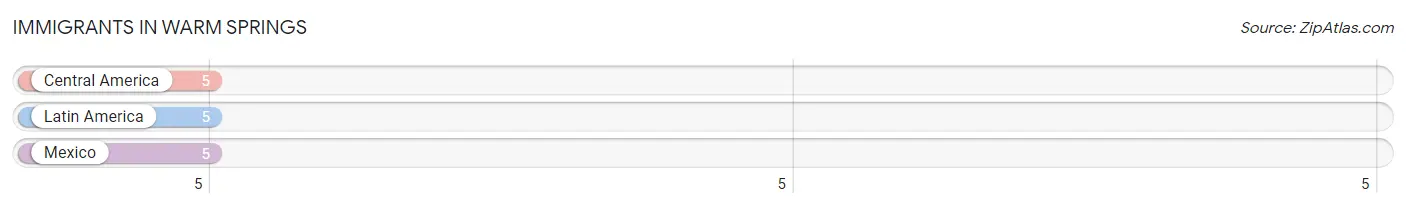
| Immigration Origin | # Population | % Population |
| Central America | 5 | 0.2% |
| Latin America | 5 | 0.2% |
| Mexico | 5 | 0.2% | View All 3 Rows |
Sex and Age in Warm Springs
Sex and Age in Warm Springs
The most populous age groups in Warm Springs are 10 to 14 Years (212 | 16.3%) for men and 20 to 24 Years (153 | 13.3%) for women.
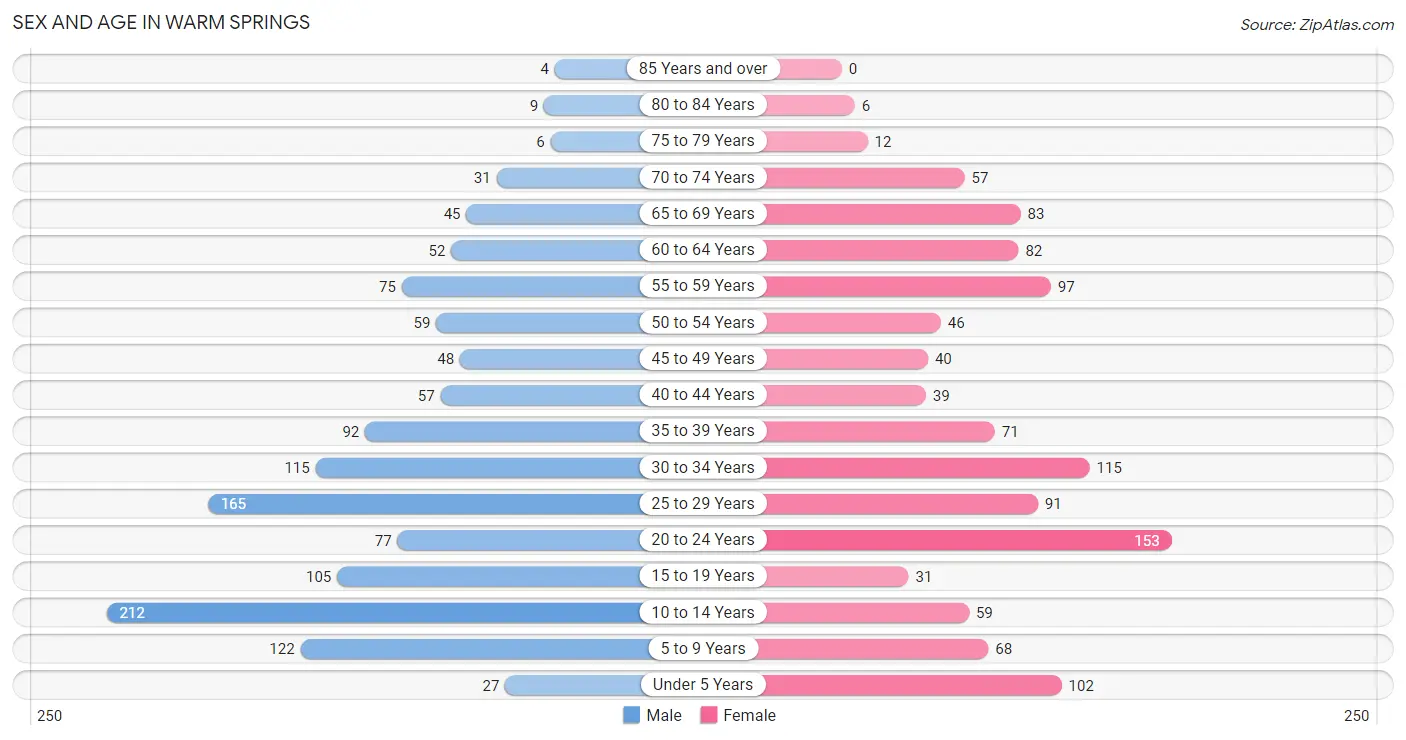
| Age Bracket | Male | Female |
| Under 5 Years | 27 (2.1%) | 102 (8.8%) |
| 5 to 9 Years | 122 (9.4%) | 68 (5.9%) |
| 10 to 14 Years | 212 (16.3%) | 59 (5.1%) |
| 15 to 19 Years | 105 (8.1%) | 31 (2.7%) |
| 20 to 24 Years | 77 (5.9%) | 153 (13.3%) |
| 25 to 29 Years | 165 (12.7%) | 91 (7.9%) |
| 30 to 34 Years | 115 (8.8%) | 115 (10.0%) |
| 35 to 39 Years | 92 (7.1%) | 71 (6.2%) |
| 40 to 44 Years | 57 (4.4%) | 39 (3.4%) |
| 45 to 49 Years | 48 (3.7%) | 40 (3.5%) |
| 50 to 54 Years | 59 (4.5%) | 46 (4.0%) |
| 55 to 59 Years | 75 (5.8%) | 97 (8.4%) |
| 60 to 64 Years | 52 (4.0%) | 82 (7.1%) |
| 65 to 69 Years | 45 (3.5%) | 83 (7.2%) |
| 70 to 74 Years | 31 (2.4%) | 57 (5.0%) |
| 75 to 79 Years | 6 (0.5%) | 12 (1.0%) |
| 80 to 84 Years | 9 (0.7%) | 6 (0.5%) |
| 85 Years and over | 4 (0.3%) | 0 (0.0%) |
| Total | 1,301 (100.0%) | 1,152 (100.0%) |
Families and Households in Warm Springs
Median Family Size in Warm Springs
The median family size in Warm Springs is 3.91 persons per family, with single male/father families (79 | 14.6%) accounting for the largest median family size of 4.7 persons per family. On the other hand, single female/mother families (288 | 53.3%) represent the smallest median family size with 3.42 persons per family.
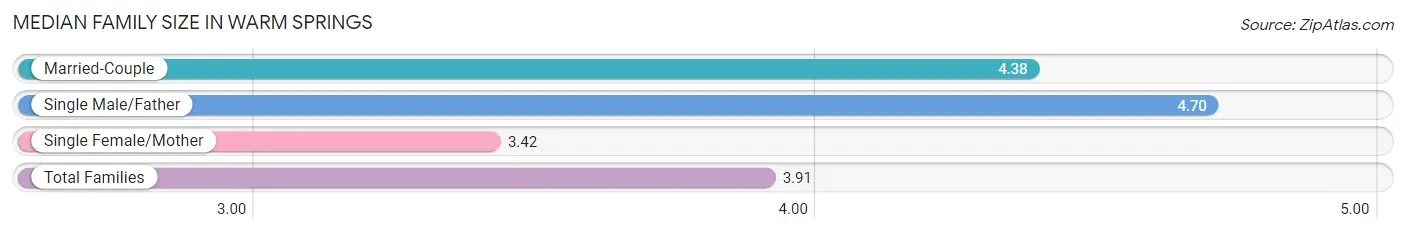
| Family Type | # Families | Family Size |
| Married-Couple | 173 (32.0%) | 4.38 |
| Single Male/Father | 79 (14.6%) | 4.70 |
| Single Female/Mother | 288 (53.3%) | 3.42 |
| Total Families | 540 (100.0%) | 3.91 |
Median Household Size in Warm Springs
The median household size in Warm Springs is 3.65 persons per household, with single male/father households (79 | 12.0%) accounting for the largest median household size of 4.9 persons per household. non-family households (116 | 17.7%) represent the smallest median household size with 1.34 persons per household.
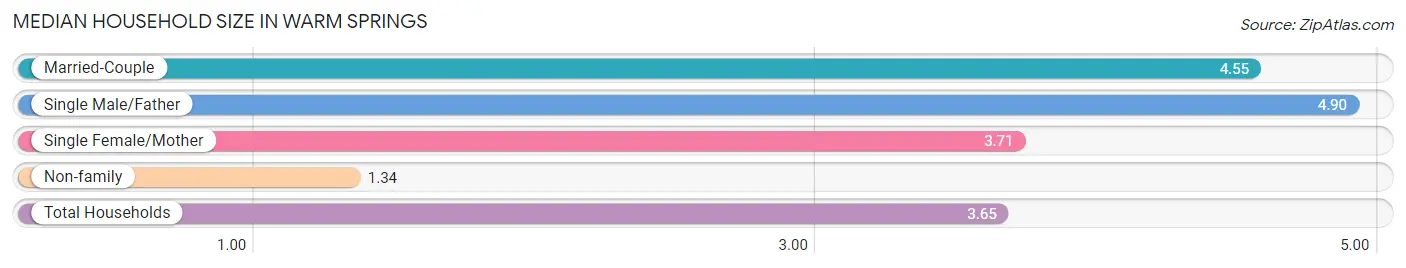
| Household Type | # Households | Household Size |
| Married-Couple | 173 (26.4%) | 4.55 |
| Single Male/Father | 79 (12.0%) | 4.90 |
| Single Female/Mother | 288 (43.9%) | 3.71 |
| Non-family | 116 (17.7%) | 1.34 |
| Total Households | 656 (100.0%) | 3.65 |
Household Size by Marriage Status in Warm Springs
Out of a total of 656 households in Warm Springs, 540 (82.3%) are family households, while 116 (17.7%) are nonfamily households. The most numerous type of family households are 3-person households, comprising 152, and the most common type of nonfamily households are 1-person households, comprising 95.
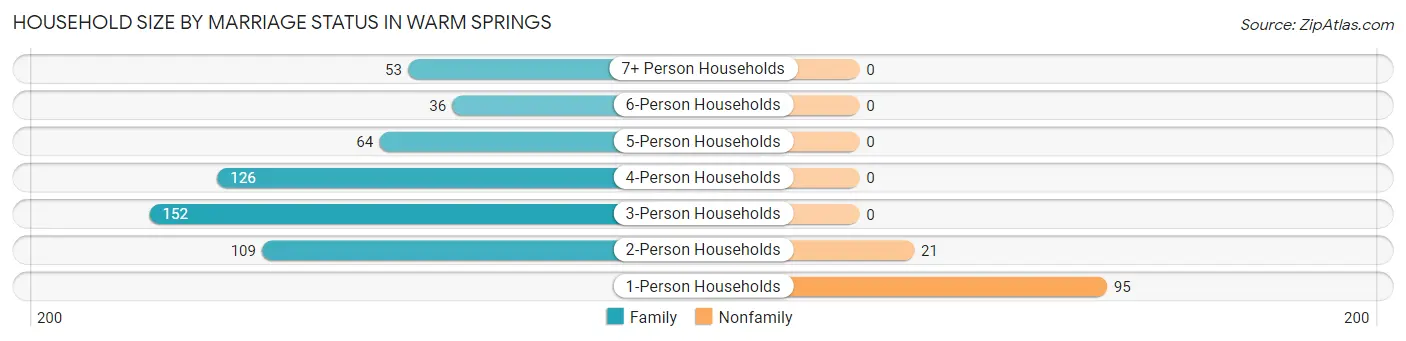
| Household Size | Family Households | Nonfamily Households |
| 1-Person Households | - | 95 (14.5%) |
| 2-Person Households | 109 (16.6%) | 21 (3.2%) |
| 3-Person Households | 152 (23.2%) | 0 (0.0%) |
| 4-Person Households | 126 (19.2%) | 0 (0.0%) |
| 5-Person Households | 64 (9.8%) | 0 (0.0%) |
| 6-Person Households | 36 (5.5%) | 0 (0.0%) |
| 7+ Person Households | 53 (8.1%) | 0 (0.0%) |
| Total | 540 (82.3%) | 116 (17.7%) |
Female Fertility in Warm Springs
Fertility by Age in Warm Springs
Average fertility rate in Warm Springs is 32.0 births per 1,000 women. Women in the age bracket of 35 to 50 years have the highest fertility rate with 107.0 births per 1,000 women. Women in the age bracket of 35 to 50 years acount for 100.0% of all women with births.
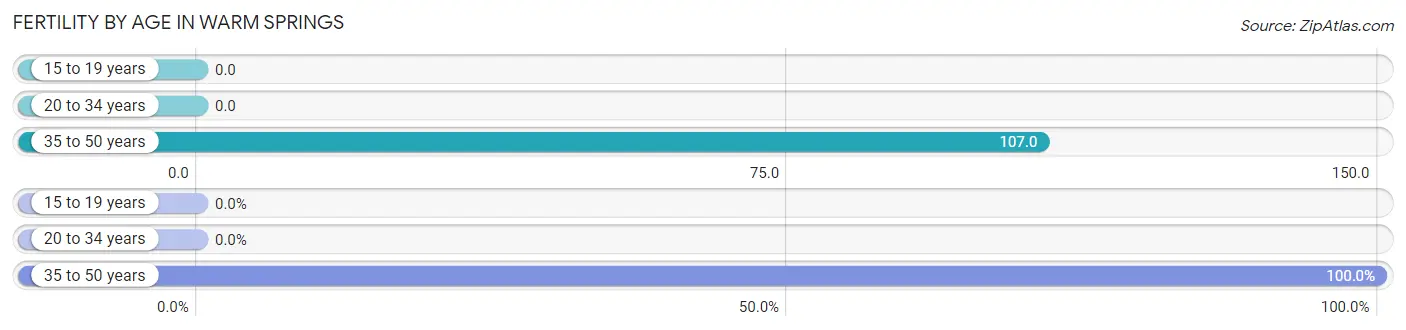
| Age Bracket | Women with Births | Births / 1,000 Women |
| 15 to 19 years | 0 (0.0%) | 0.0 |
| 20 to 34 years | 0 (0.0%) | 0.0 |
| 35 to 50 years | 18 (100.0%) | 107.0 |
| Total | 18 (100.0%) | 32.0 |
Fertility by Age by Marriage Status in Warm Springs
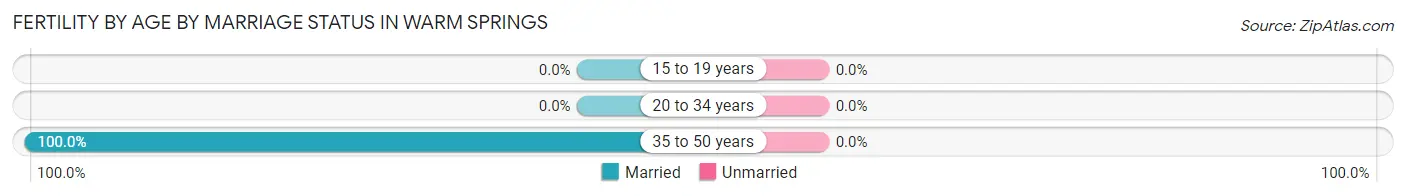
| Age Bracket | Married | Unmarried |
| 15 to 19 years | 0 (0.0%) | 0 (0.0%) |
| 20 to 34 years | 0 (0.0%) | 0 (0.0%) |
| 35 to 50 years | 18 (100.0%) | 0 (0.0%) |
| Total | 18 (100.0%) | 0 (0.0%) |
Fertility by Education in Warm Springs
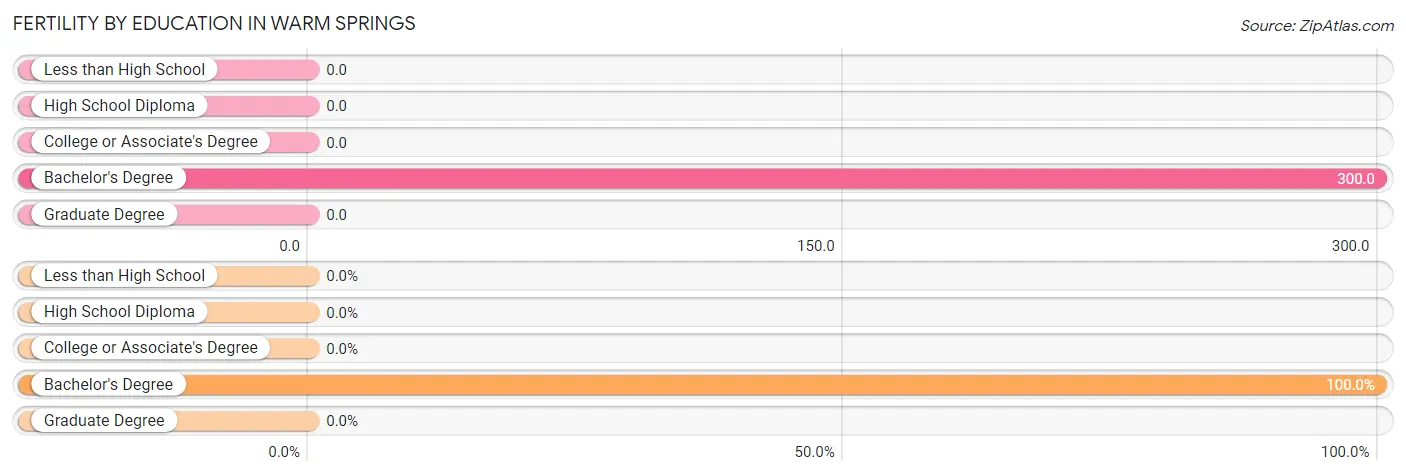
| Educational Attainment | Women with Births | Births / 1,000 Women |
| Less than High School | 0 (0.0%) | 0.0 |
| High School Diploma | 0 (0.0%) | 0.0 |
| College or Associate's Degree | 0 (0.0%) | 0.0 |
| Bachelor's Degree | 18 (100.0%) | 300.0 |
| Graduate Degree | 0 (0.0%) | 0.0 |
| Total | 18 (100.0%) | 32.0 |
Fertility by Education by Marriage Status in Warm Springs
| Educational Attainment | Married | Unmarried |
| Less than High School | 0 (0.0%) | 0 (0.0%) |
| High School Diploma | 0 (0.0%) | 0 (0.0%) |
| College or Associate's Degree | 0 (0.0%) | 0 (0.0%) |
| Bachelor's Degree | 18 (100.0%) | 0 (0.0%) |
| Graduate Degree | 0 (0.0%) | 0 (0.0%) |
| Total | 18 (100.0%) | 0 (0.0%) |
Employment Characteristics in Warm Springs
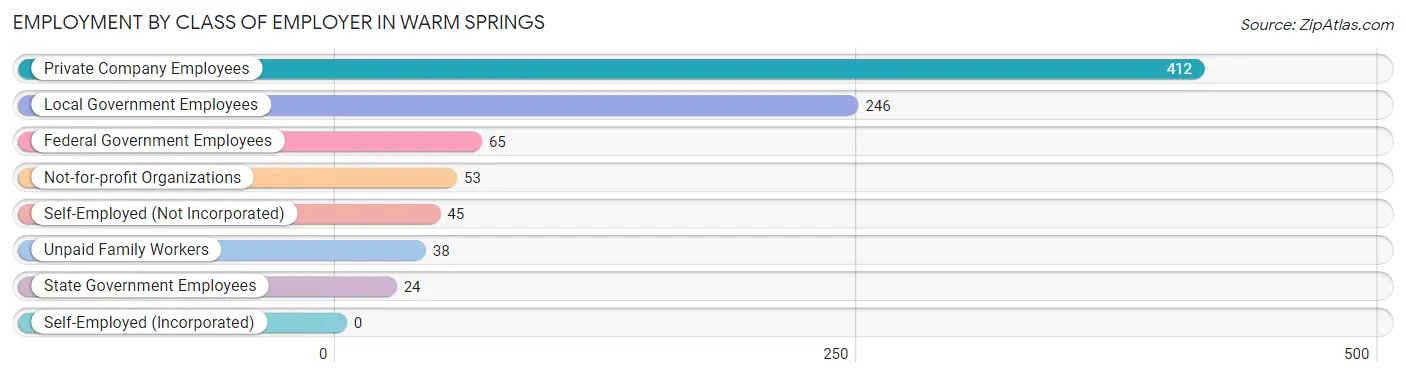
Employment by Class of Employer in Warm Springs
Among the 883 employed individuals in Warm Springs, private company employees (412 | 46.7%), local government employees (246 | 27.9%), and federal government employees (65 | 7.4%) make up the most common classes of employment.
| Employer Class | # Employees | % Employees |
| Private Company Employees | 412 | 46.7% |
| Self-Employed (Incorporated) | 0 | 0.0% |
| Self-Employed (Not Incorporated) | 45 | 5.1% |
| Not-for-profit Organizations | 53 | 6.0% |
| Local Government Employees | 246 | 27.9% |
| State Government Employees | 24 | 2.7% |
| Federal Government Employees | 65 | 7.4% |
| Unpaid Family Workers | 38 | 4.3% |
| Total | 883 | 100.0% |
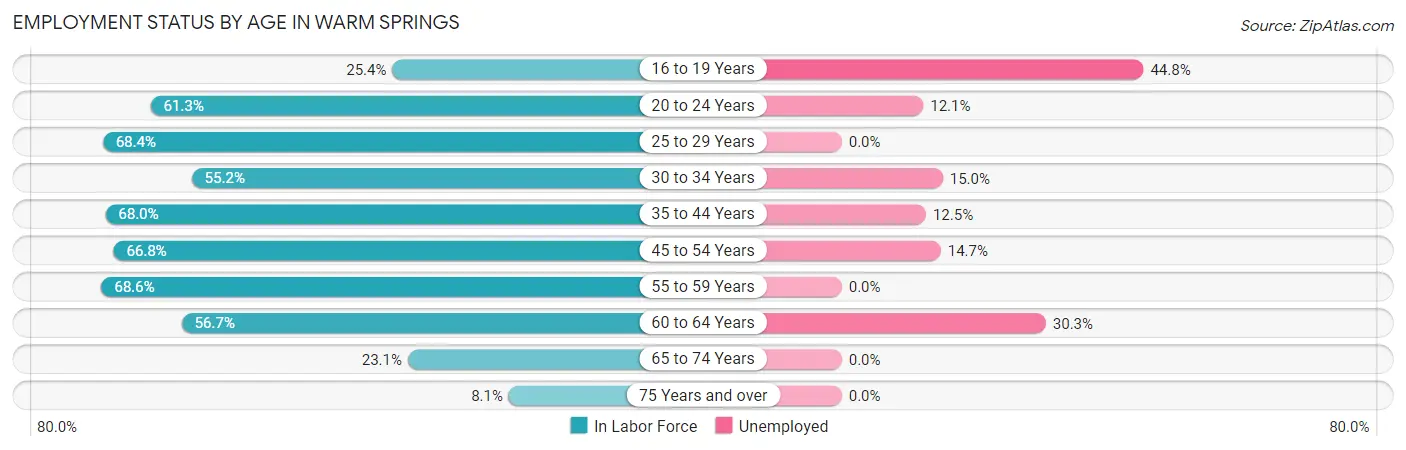
Employment Status by Age in Warm Springs
According to the labor force statistics for Warm Springs, out of the total population over 16 years of age (1,841), 55.6% or 1,024 individuals are in the labor force, with 11.0% or 113 of them unemployed. The age group with the highest labor force participation rate is 55 to 59 years, with 68.6% or 118 individuals in the labor force. Within the labor force, the 16 to 19 years age range has the highest percentage of unemployed individuals, with 44.8% or 13 of them being unemployed.
| Age Bracket | In Labor Force | Unemployed |
| 16 to 19 Years | 29 (25.4%) | 13 (44.8%) |
| 20 to 24 Years | 141 (61.3%) | 17 (12.1%) |
| 25 to 29 Years | 175 (68.4%) | 0 (0.0%) |
| 30 to 34 Years | 127 (55.2%) | 19 (15.0%) |
| 35 to 44 Years | 176 (68.0%) | 22 (12.5%) |
| 45 to 54 Years | 129 (66.8%) | 19 (14.7%) |
| 55 to 59 Years | 118 (68.6%) | 0 (0.0%) |
| 60 to 64 Years | 76 (56.7%) | 23 (30.3%) |
| 65 to 74 Years | 50 (23.1%) | 0 (0.0%) |
| 75 Years and over | 3 (8.1%) | 0 (0.0%) |
| Total | 1,024 (55.6%) | 113 (11.0%) |
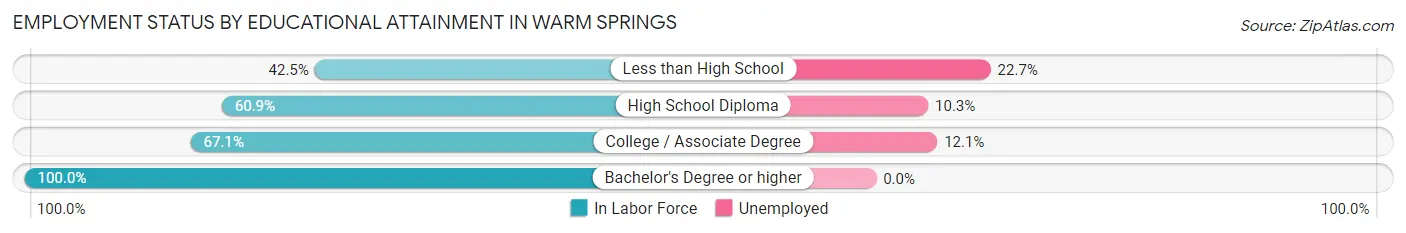
Employment Status by Educational Attainment in Warm Springs
According to labor force statistics for Warm Springs, 64.4% of individuals (801) out of the total population between 25 and 64 years of age (1,244) are in the labor force, with 10.4% or 83 of them being unemployed. The group with the highest labor force participation rate are those with the educational attainment of bachelor's degree or higher, with 100.0% or 146 individuals in the labor force. Within the labor force, individuals with less than high school education have the highest percentage of unemployment, with 22.7% or 20 of them being unemployed.
| Educational Attainment | In Labor Force | Unemployed |
| Less than High School | 88 (42.5%) | 47 (22.7%) |
| High School Diploma | 302 (60.9%) | 51 (10.3%) |
| College / Associate Degree | 265 (67.1%) | 48 (12.1%) |
| Bachelor's Degree or higher | 146 (100.0%) | 0 (0.0%) |
| Total | 801 (64.4%) | 129 (10.4%) |
Employment Occupations by Sex in Warm Springs
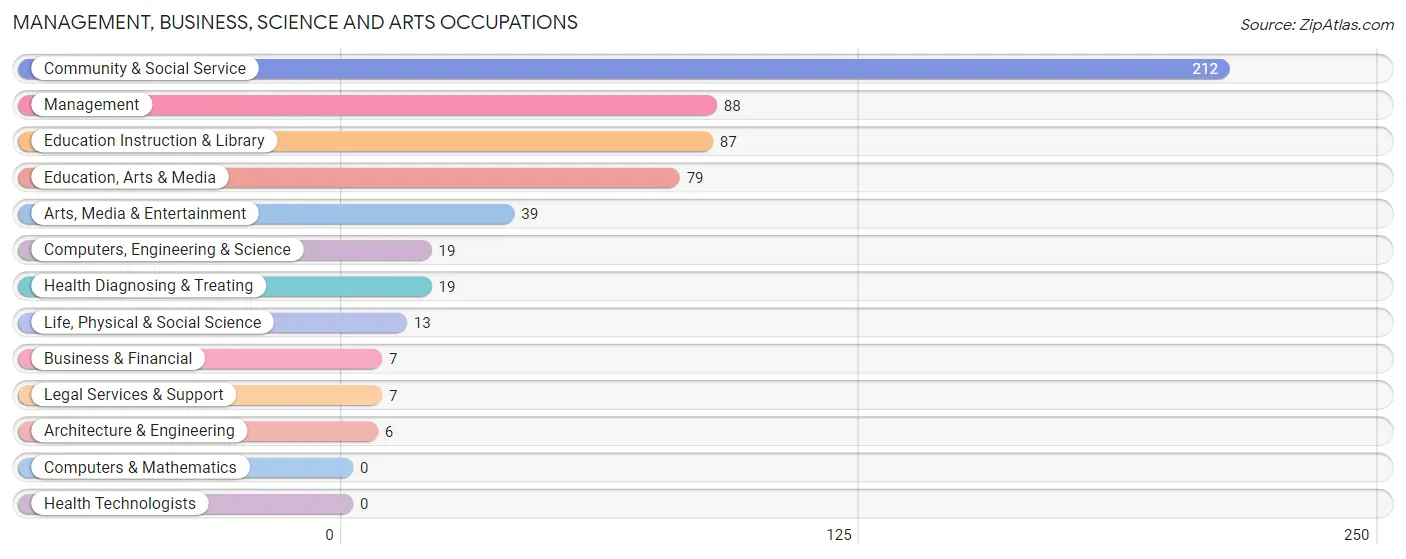
Management, Business, Science and Arts Occupations
The most common Management, Business, Science and Arts occupations in Warm Springs are Community & Social Service (212 | 23.3%), Management (88 | 9.7%), Education Instruction & Library (87 | 9.6%), Education, Arts & Media (79 | 8.7%), and Arts, Media & Entertainment (39 | 4.3%).
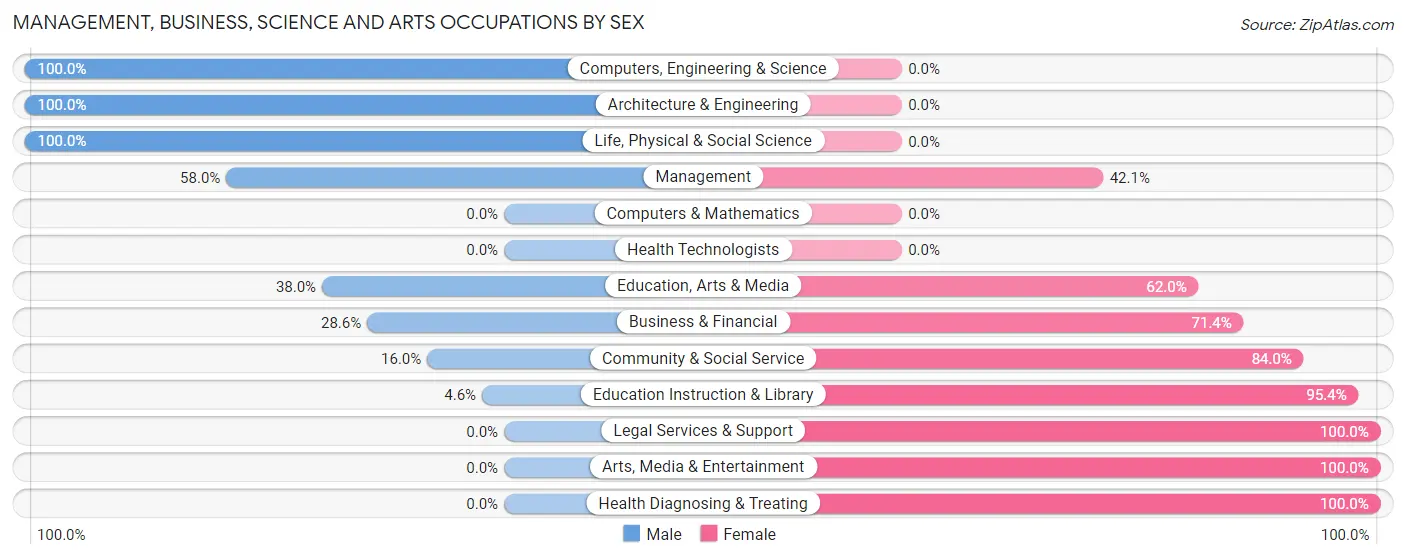
Management, Business, Science and Arts Occupations by Sex
Within the Management, Business, Science and Arts occupations in Warm Springs, the most male-oriented occupations are Computers, Engineering & Science (100.0%), Architecture & Engineering (100.0%), and Life, Physical & Social Science (100.0%), while the most female-oriented occupations are Legal Services & Support (100.0%), Arts, Media & Entertainment (100.0%), and Health Diagnosing & Treating (100.0%).
| Occupation | Male | Female |
| Management | 51 (58.0%) | 37 (42.0%) |
| Business & Financial | 2 (28.6%) | 5 (71.4%) |
| Computers, Engineering & Science | 19 (100.0%) | 0 (0.0%) |
| Computers & Mathematics | 0 (0.0%) | 0 (0.0%) |
| Architecture & Engineering | 6 (100.0%) | 0 (0.0%) |
| Life, Physical & Social Science | 13 (100.0%) | 0 (0.0%) |
| Community & Social Service | 34 (16.0%) | 178 (84.0%) |
| Education, Arts & Media | 30 (38.0%) | 49 (62.0%) |
| Legal Services & Support | 0 (0.0%) | 7 (100.0%) |
| Education Instruction & Library | 4 (4.6%) | 83 (95.4%) |
| Arts, Media & Entertainment | 0 (0.0%) | 39 (100.0%) |
| Health Diagnosing & Treating | 0 (0.0%) | 19 (100.0%) |
| Health Technologists | 0 (0.0%) | 0 (0.0%) |
| Total (Category) | 106 (30.7%) | 239 (69.3%) |
| Total (Overall) | 451 (49.5%) | 460 (50.5%) |
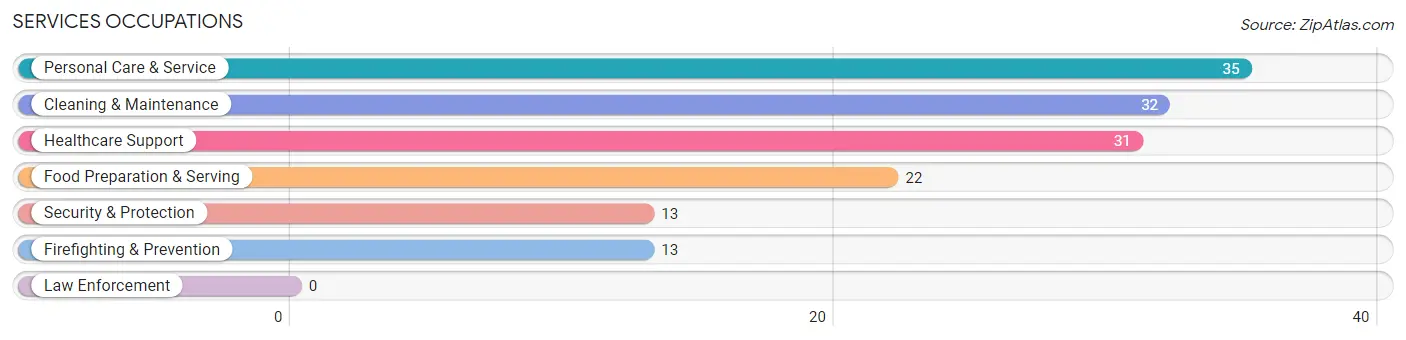
Services Occupations
The most common Services occupations in Warm Springs are Personal Care & Service (35 | 3.8%), Cleaning & Maintenance (32 | 3.5%), Healthcare Support (31 | 3.4%), Food Preparation & Serving (22 | 2.4%), and Security & Protection (13 | 1.4%).
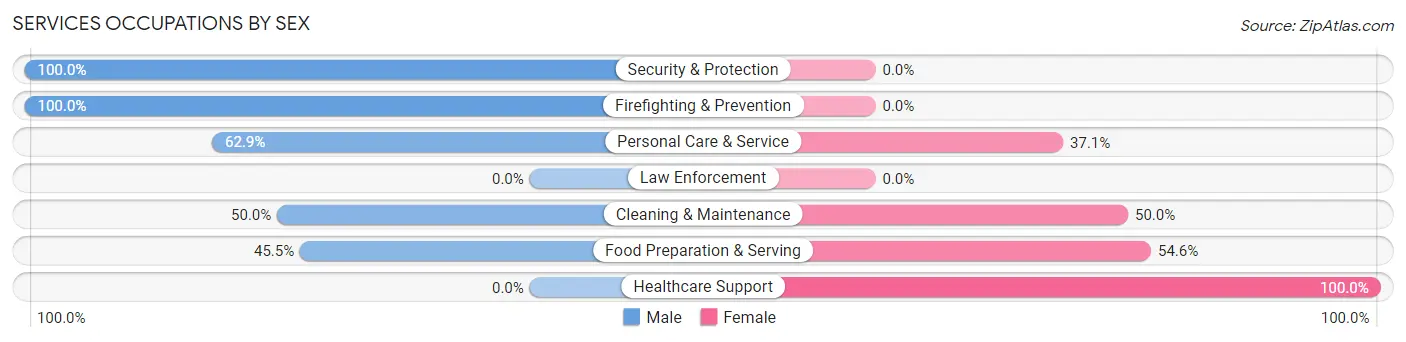
Services Occupations by Sex
Within the Services occupations in Warm Springs, the most male-oriented occupations are Security & Protection (100.0%), Firefighting & Prevention (100.0%), and Personal Care & Service (62.9%), while the most female-oriented occupations are Healthcare Support (100.0%), Food Preparation & Serving (54.5%), and Cleaning & Maintenance (50.0%).
| Occupation | Male | Female |
| Healthcare Support | 0 (0.0%) | 31 (100.0%) |
| Security & Protection | 13 (100.0%) | 0 (0.0%) |
| Firefighting & Prevention | 13 (100.0%) | 0 (0.0%) |
| Law Enforcement | 0 (0.0%) | 0 (0.0%) |
| Food Preparation & Serving | 10 (45.5%) | 12 (54.5%) |
| Cleaning & Maintenance | 16 (50.0%) | 16 (50.0%) |
| Personal Care & Service | 22 (62.9%) | 13 (37.1%) |
| Total (Category) | 61 (45.9%) | 72 (54.1%) |
| Total (Overall) | 451 (49.5%) | 460 (50.5%) |
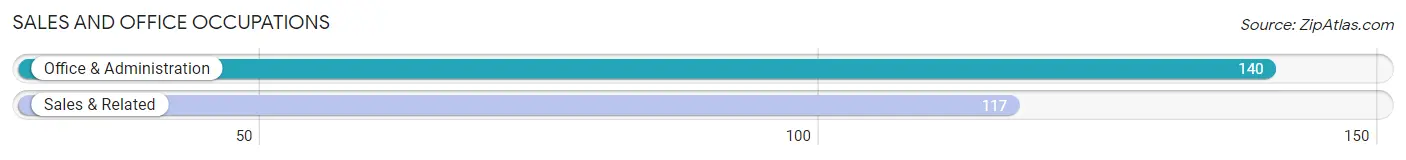
Sales and Office Occupations
The most common Sales and Office occupations in Warm Springs are Office & Administration (140 | 15.4%), and Sales & Related (117 | 12.8%).
Sales and Office Occupations by Sex
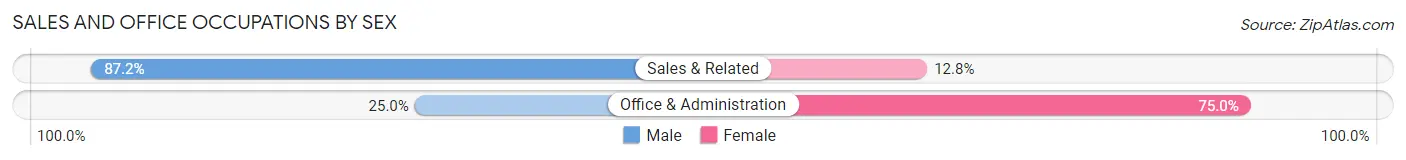
| Occupation | Male | Female |
| Sales & Related | 102 (87.2%) | 15 (12.8%) |
| Office & Administration | 35 (25.0%) | 105 (75.0%) |
| Total (Category) | 137 (53.3%) | 120 (46.7%) |
| Total (Overall) | 451 (49.5%) | 460 (50.5%) |
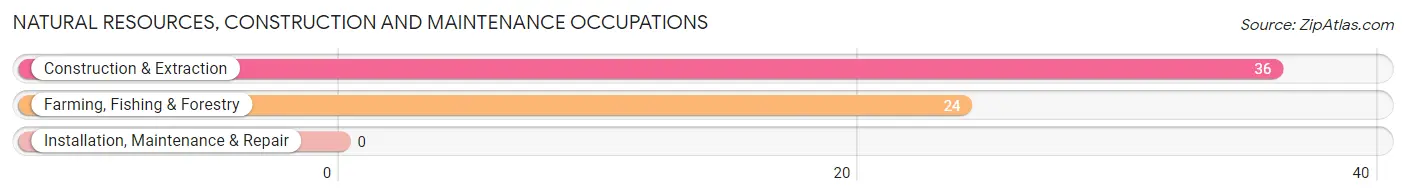
Natural Resources, Construction and Maintenance Occupations
The most common Natural Resources, Construction and Maintenance occupations in Warm Springs are Construction & Extraction (36 | 4.0%), and Farming, Fishing & Forestry (24 | 2.6%).
Natural Resources, Construction and Maintenance Occupations by Sex
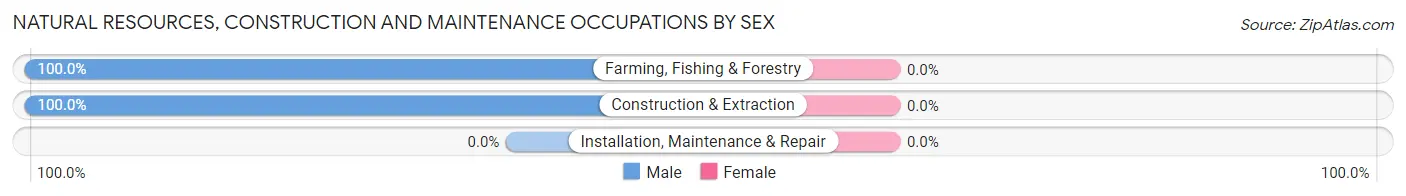
| Occupation | Male | Female |
| Farming, Fishing & Forestry | 24 (100.0%) | 0 (0.0%) |
| Construction & Extraction | 36 (100.0%) | 0 (0.0%) |
| Installation, Maintenance & Repair | 0 (0.0%) | 0 (0.0%) |
| Total (Category) | 60 (100.0%) | 0 (0.0%) |
| Total (Overall) | 451 (49.5%) | 460 (50.5%) |
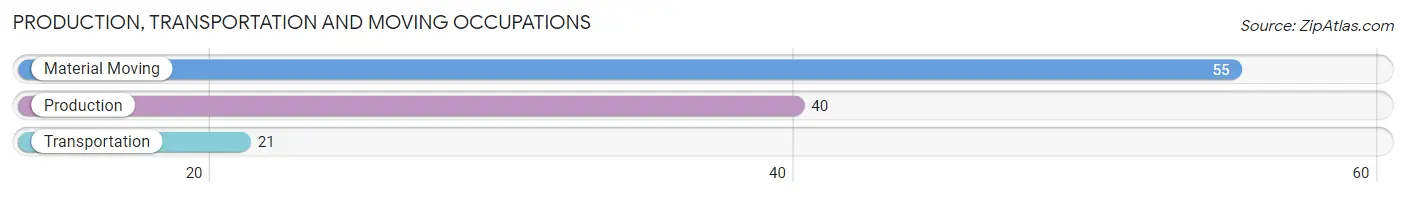
Production, Transportation and Moving Occupations
The most common Production, Transportation and Moving occupations in Warm Springs are Material Moving (55 | 6.0%), Production (40 | 4.4%), and Transportation (21 | 2.3%).
Production, Transportation and Moving Occupations by Sex
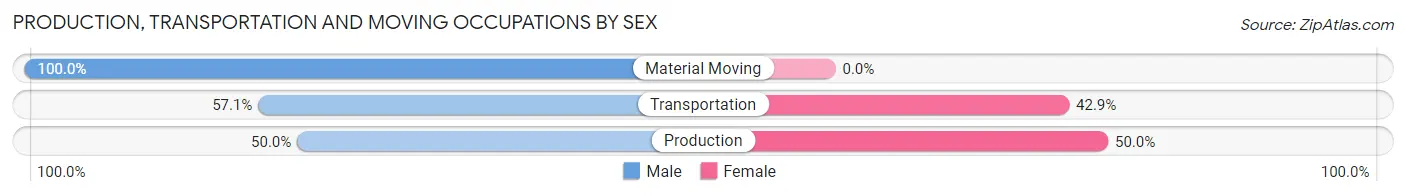
| Occupation | Male | Female |
| Production | 20 (50.0%) | 20 (50.0%) |
| Transportation | 12 (57.1%) | 9 (42.9%) |
| Material Moving | 55 (100.0%) | 0 (0.0%) |
| Total (Category) | 87 (75.0%) | 29 (25.0%) |
| Total (Overall) | 451 (49.5%) | 460 (50.5%) |
Employment Industries by Sex in Warm Springs
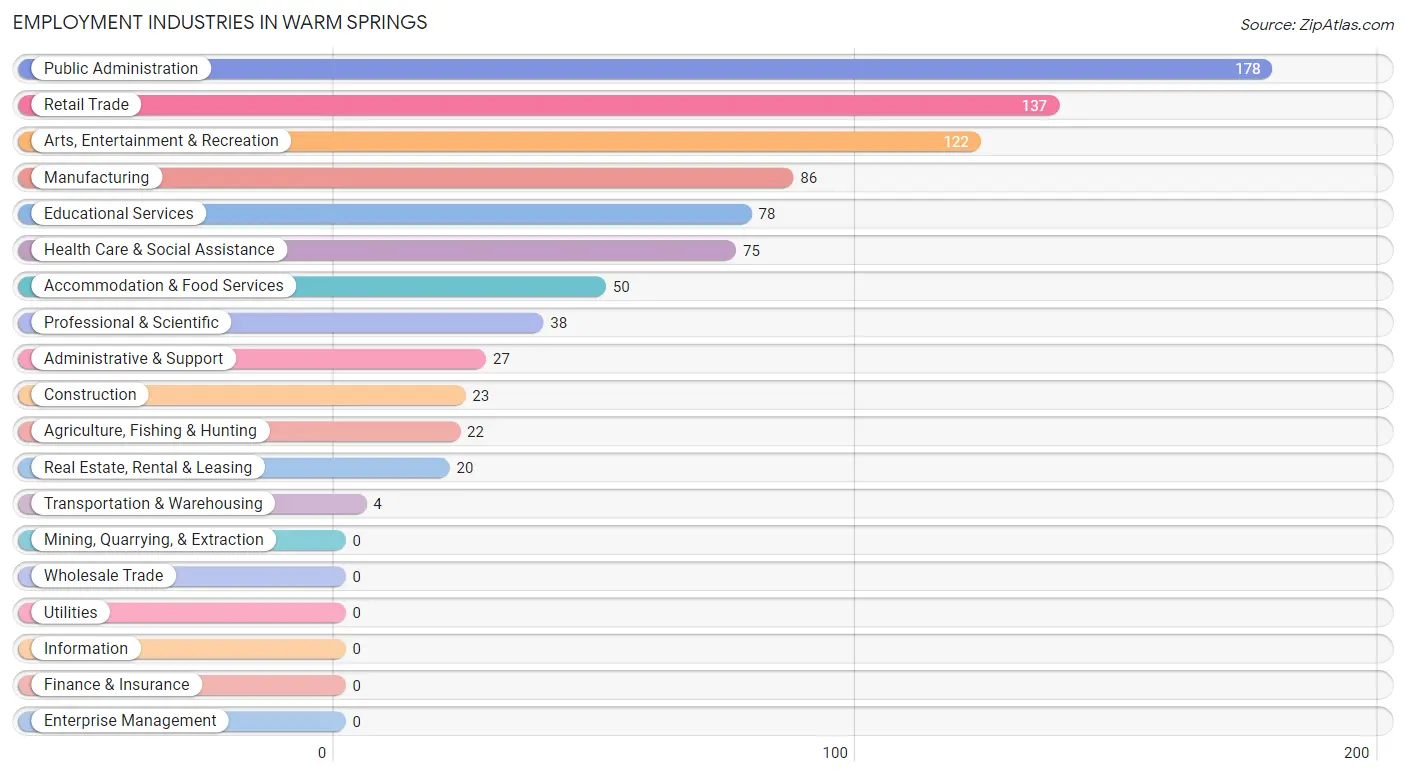
Employment Industries in Warm Springs
The major employment industries in Warm Springs include Public Administration (178 | 19.5%), Retail Trade (137 | 15.0%), Arts, Entertainment & Recreation (122 | 13.4%), Manufacturing (86 | 9.4%), and Educational Services (78 | 8.6%).
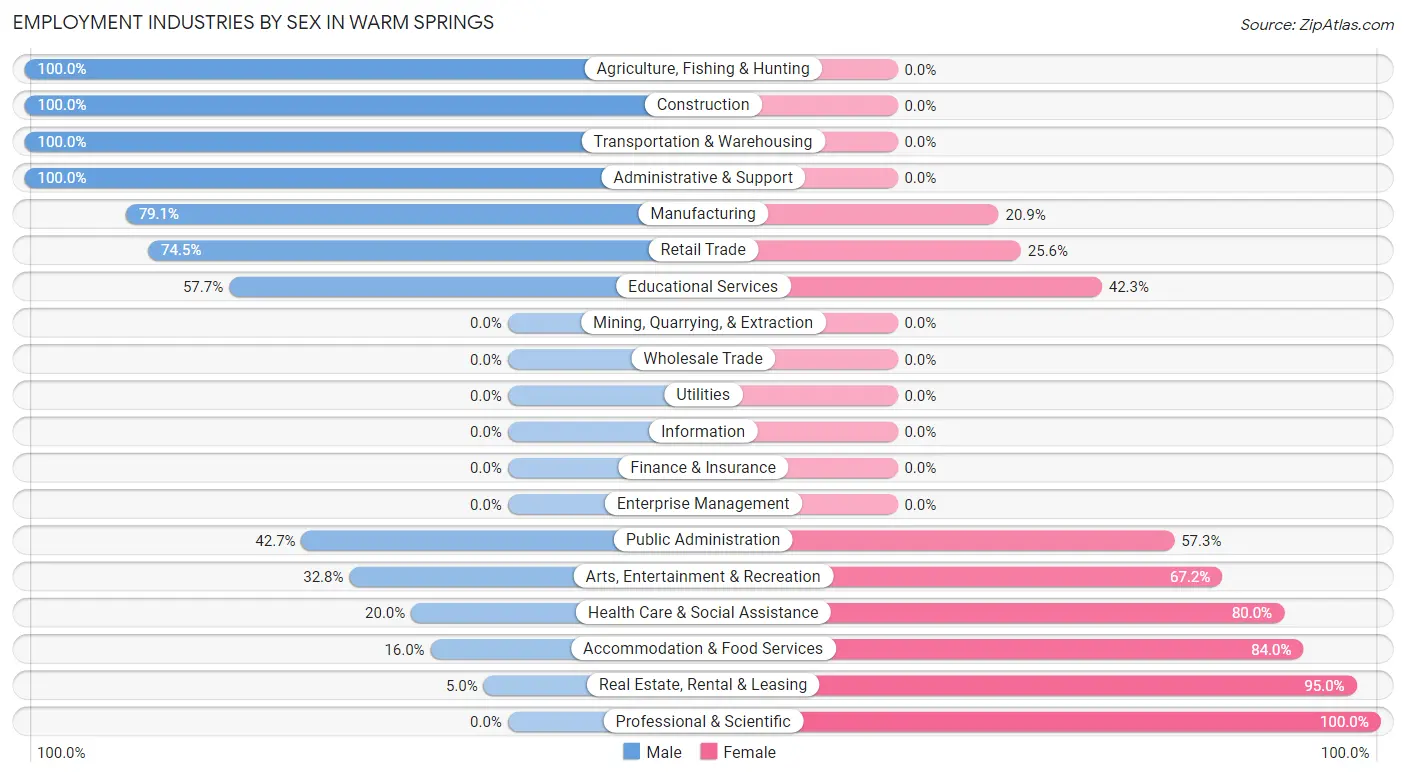
Employment Industries by Sex in Warm Springs
The Warm Springs industries that see more men than women are Agriculture, Fishing & Hunting (100.0%), Construction (100.0%), and Transportation & Warehousing (100.0%), whereas the industries that tend to have a higher number of women are Professional & Scientific (100.0%), Real Estate, Rental & Leasing (95.0%), and Accommodation & Food Services (84.0%).
| Industry | Male | Female |
| Agriculture, Fishing & Hunting | 22 (100.0%) | 0 (0.0%) |
| Mining, Quarrying, & Extraction | 0 (0.0%) | 0 (0.0%) |
| Construction | 23 (100.0%) | 0 (0.0%) |
| Manufacturing | 68 (79.1%) | 18 (20.9%) |
| Wholesale Trade | 0 (0.0%) | 0 (0.0%) |
| Retail Trade | 102 (74.5%) | 35 (25.6%) |
| Transportation & Warehousing | 4 (100.0%) | 0 (0.0%) |
| Utilities | 0 (0.0%) | 0 (0.0%) |
| Information | 0 (0.0%) | 0 (0.0%) |
| Finance & Insurance | 0 (0.0%) | 0 (0.0%) |
| Real Estate, Rental & Leasing | 1 (5.0%) | 19 (95.0%) |
| Professional & Scientific | 0 (0.0%) | 38 (100.0%) |
| Enterprise Management | 0 (0.0%) | 0 (0.0%) |
| Administrative & Support | 27 (100.0%) | 0 (0.0%) |
| Educational Services | 45 (57.7%) | 33 (42.3%) |
| Health Care & Social Assistance | 15 (20.0%) | 60 (80.0%) |
| Arts, Entertainment & Recreation | 40 (32.8%) | 82 (67.2%) |
| Accommodation & Food Services | 8 (16.0%) | 42 (84.0%) |
| Public Administration | 76 (42.7%) | 102 (57.3%) |
| Total | 451 (49.5%) | 460 (50.5%) |
Education in Warm Springs
School Enrollment in Warm Springs
The most common levels of schooling among the 670 students in Warm Springs are elementary school (211 | 31.5%), middle school (172 | 25.7%), and college / undergraduate (119 | 17.8%).
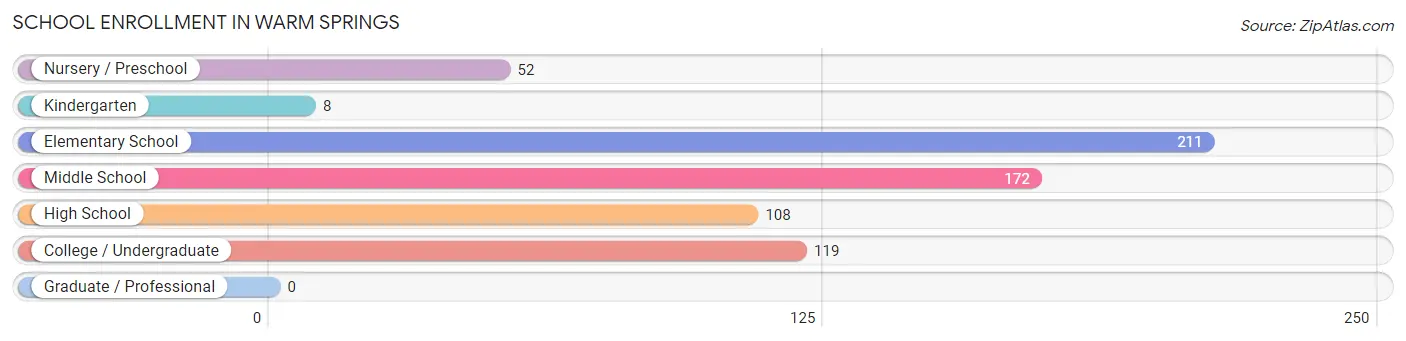
| School Level | # Students | % Students |
| Nursery / Preschool | 52 | 7.8% |
| Kindergarten | 8 | 1.2% |
| Elementary School | 211 | 31.5% |
| Middle School | 172 | 25.7% |
| High School | 108 | 16.1% |
| College / Undergraduate | 119 | 17.8% |
| Graduate / Professional | 0 | 0.0% |
| Total | 670 | 100.0% |
School Enrollment by Age by Funding Source in Warm Springs
Out of a total of 670 students who are enrolled in schools in Warm Springs, 56 (8.4%) attend a private institution, while the remaining 614 (91.6%) are enrolled in public schools. The age group of 5 to 9 year old has the highest likelihood of being enrolled in private schools, with 44 (23.9% in the age bracket) enrolled. Conversely, the age group of 15 to 17 year olds has the lowest likelihood of being enrolled in a private school, with 51 (100.0% in the age bracket) attending a public institution.
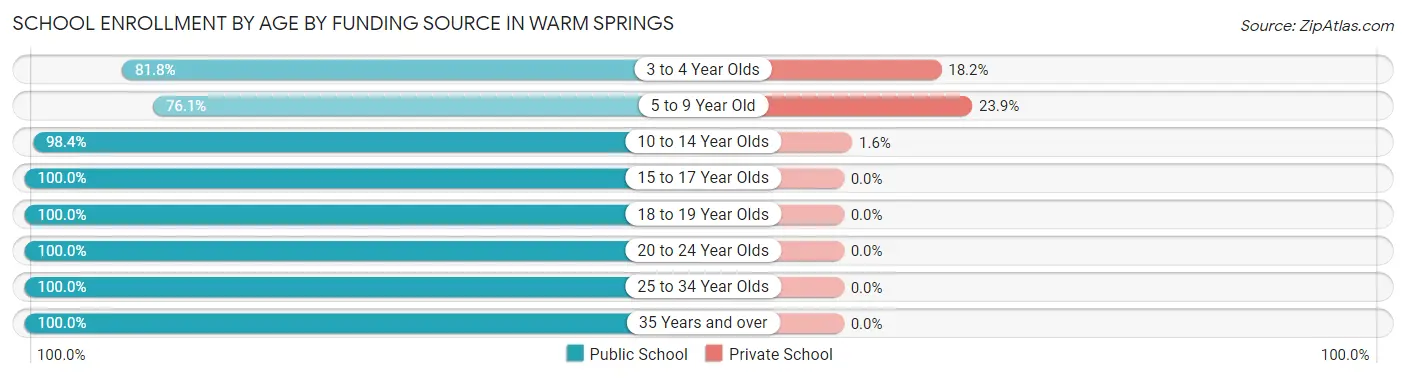
| Age Bracket | Public School | Private School |
| 3 to 4 Year Olds | 36 (81.8%) | 8 (18.2%) |
| 5 to 9 Year Old | 140 (76.1%) | 44 (23.9%) |
| 10 to 14 Year Olds | 250 (98.4%) | 4 (1.6%) |
| 15 to 17 Year Olds | 51 (100.0%) | 0 (0.0%) |
| 18 to 19 Year Olds | 40 (100.0%) | 0 (0.0%) |
| 20 to 24 Year Olds | 24 (100.0%) | 0 (0.0%) |
| 25 to 34 Year Olds | 50 (100.0%) | 0 (0.0%) |
| 35 Years and over | 23 (100.0%) | 0 (0.0%) |
| Total | 614 (91.6%) | 56 (8.4%) |
Educational Attainment by Field of Study in Warm Springs
Science & technology (64 | 28.6%), social sciences (42 | 18.8%), education (42 | 18.8%), liberal arts & history (20 | 8.9%), and psychology (16 | 7.1%) are the most common fields of study among 224 individuals in Warm Springs who have obtained a bachelor's degree or higher.
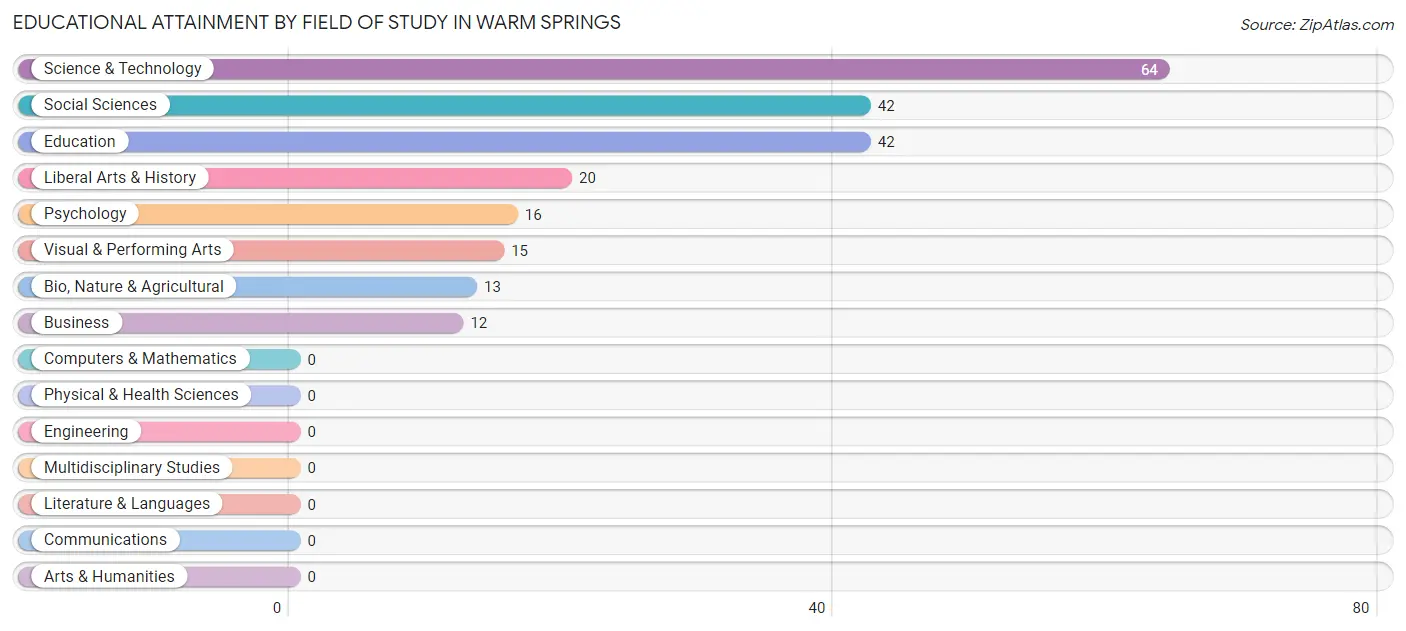
| Field of Study | # Graduates | % Graduates |
| Computers & Mathematics | 0 | 0.0% |
| Bio, Nature & Agricultural | 13 | 5.8% |
| Physical & Health Sciences | 0 | 0.0% |
| Psychology | 16 | 7.1% |
| Social Sciences | 42 | 18.8% |
| Engineering | 0 | 0.0% |
| Multidisciplinary Studies | 0 | 0.0% |
| Science & Technology | 64 | 28.6% |
| Business | 12 | 5.4% |
| Education | 42 | 18.8% |
| Literature & Languages | 0 | 0.0% |
| Liberal Arts & History | 20 | 8.9% |
| Visual & Performing Arts | 15 | 6.7% |
| Communications | 0 | 0.0% |
| Arts & Humanities | 0 | 0.0% |
| Total | 224 | 100.0% |
Transportation & Commute in Warm Springs
Vehicle Availability by Sex in Warm Springs
The most prevalent vehicle ownership categories in Warm Springs are males with 3 vehicles (110, accounting for 25.8%) and females with 3 vehicles (136, making up 24.1%).
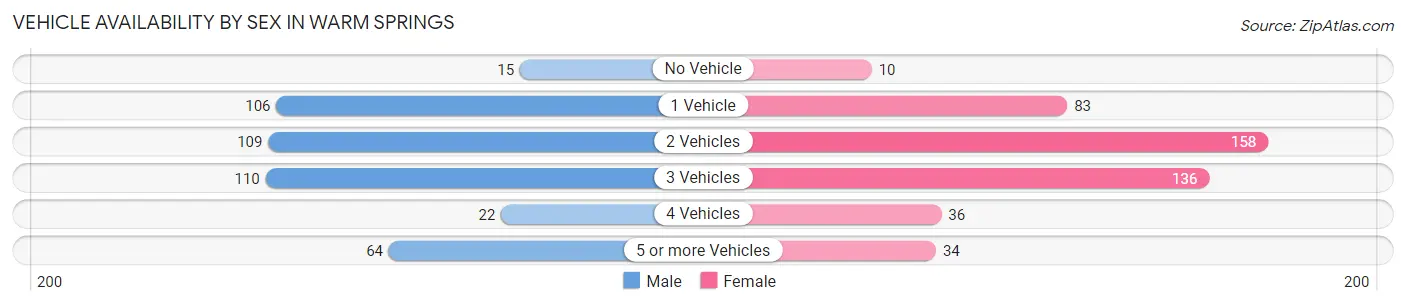
| Vehicles Available | Male | Female |
| No Vehicle | 15 (3.5%) | 10 (2.2%) |
| 1 Vehicle | 106 (24.9%) | 83 (18.2%) |
| 2 Vehicles | 109 (25.6%) | 158 (34.6%) |
| 3 Vehicles | 110 (25.8%) | 136 (29.8%) |
| 4 Vehicles | 22 (5.2%) | 36 (7.9%) |
| 5 or more Vehicles | 64 (15.0%) | 34 (7.4%) |
| Total | 426 (100.0%) | 457 (100.0%) |
Commute Time in Warm Springs
The most frequently occuring commute durations in Warm Springs are 5 to 9 minutes (244 commuters, 29.3%), 10 to 14 minutes (142 commuters, 17.1%), and 20 to 24 minutes (96 commuters, 11.5%).
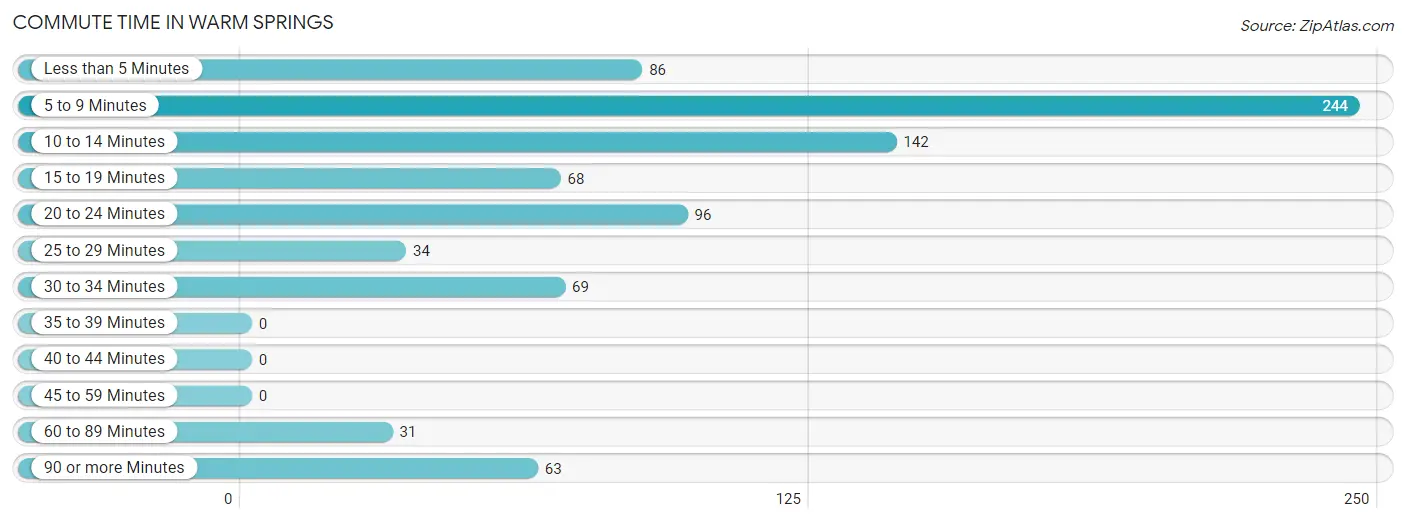
| Commute Time | # Commuters | % Commuters |
| Less than 5 Minutes | 86 | 10.3% |
| 5 to 9 Minutes | 244 | 29.3% |
| 10 to 14 Minutes | 142 | 17.1% |
| 15 to 19 Minutes | 68 | 8.2% |
| 20 to 24 Minutes | 96 | 11.5% |
| 25 to 29 Minutes | 34 | 4.1% |
| 30 to 34 Minutes | 69 | 8.3% |
| 35 to 39 Minutes | 0 | 0.0% |
| 40 to 44 Minutes | 0 | 0.0% |
| 45 to 59 Minutes | 0 | 0.0% |
| 60 to 89 Minutes | 31 | 3.7% |
| 90 or more Minutes | 63 | 7.6% |
Commute Time by Sex in Warm Springs
The most common commute times in Warm Springs are 5 to 9 minutes (85 commuters, 20.9%) for males and 5 to 9 minutes (159 commuters, 37.2%) for females.
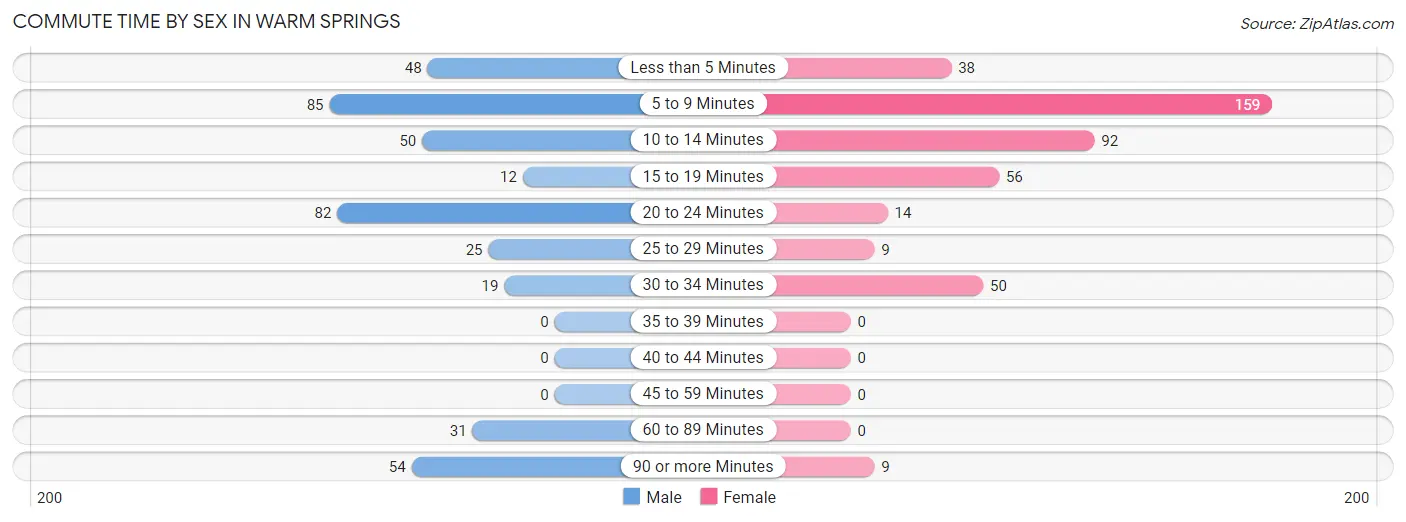
| Commute Time | Male | Female |
| Less than 5 Minutes | 48 (11.8%) | 38 (8.9%) |
| 5 to 9 Minutes | 85 (20.9%) | 159 (37.2%) |
| 10 to 14 Minutes | 50 (12.3%) | 92 (21.5%) |
| 15 to 19 Minutes | 12 (3.0%) | 56 (13.1%) |
| 20 to 24 Minutes | 82 (20.2%) | 14 (3.3%) |
| 25 to 29 Minutes | 25 (6.2%) | 9 (2.1%) |
| 30 to 34 Minutes | 19 (4.7%) | 50 (11.7%) |
| 35 to 39 Minutes | 0 (0.0%) | 0 (0.0%) |
| 40 to 44 Minutes | 0 (0.0%) | 0 (0.0%) |
| 45 to 59 Minutes | 0 (0.0%) | 0 (0.0%) |
| 60 to 89 Minutes | 31 (7.6%) | 0 (0.0%) |
| 90 or more Minutes | 54 (13.3%) | 9 (2.1%) |
Time of Departure to Work by Sex in Warm Springs
The most frequent times of departure to work in Warm Springs are 7:30 AM to 7:59 AM (103, 25.4%) for males and 7:30 AM to 7:59 AM (182, 42.6%) for females.
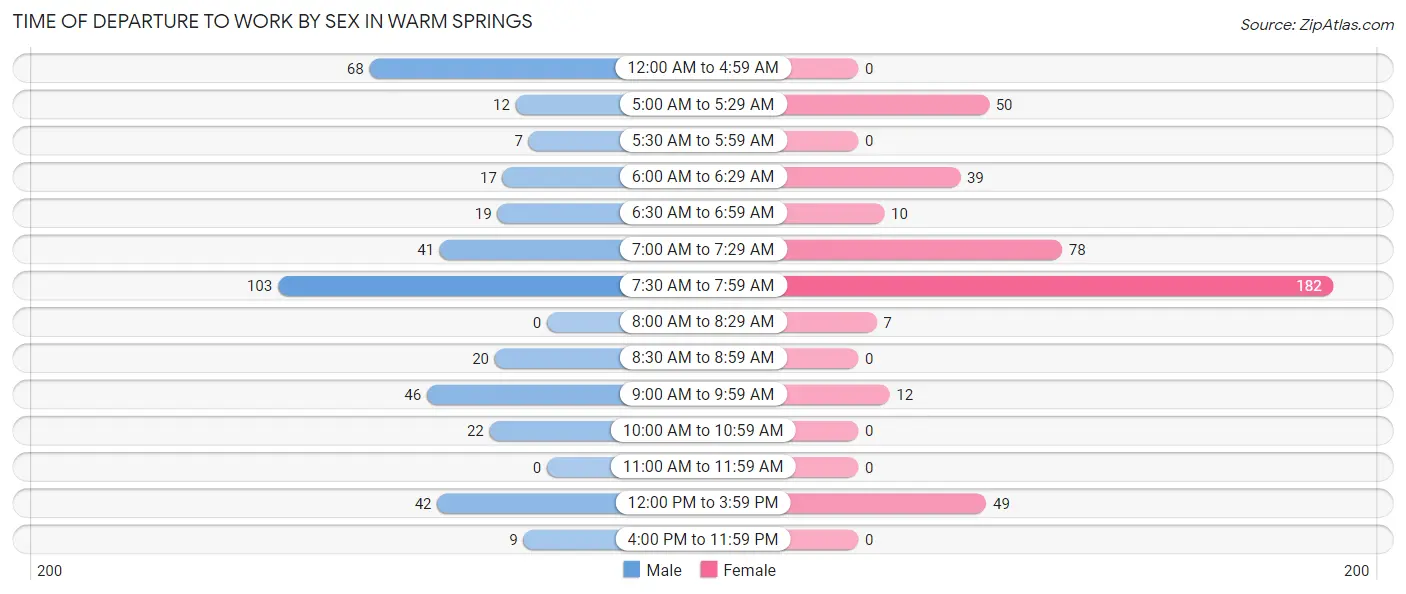
| Time of Departure | Male | Female |
| 12:00 AM to 4:59 AM | 68 (16.8%) | 0 (0.0%) |
| 5:00 AM to 5:29 AM | 12 (3.0%) | 50 (11.7%) |
| 5:30 AM to 5:59 AM | 7 (1.7%) | 0 (0.0%) |
| 6:00 AM to 6:29 AM | 17 (4.2%) | 39 (9.1%) |
| 6:30 AM to 6:59 AM | 19 (4.7%) | 10 (2.3%) |
| 7:00 AM to 7:29 AM | 41 (10.1%) | 78 (18.3%) |
| 7:30 AM to 7:59 AM | 103 (25.4%) | 182 (42.6%) |
| 8:00 AM to 8:29 AM | 0 (0.0%) | 7 (1.6%) |
| 8:30 AM to 8:59 AM | 20 (4.9%) | 0 (0.0%) |
| 9:00 AM to 9:59 AM | 46 (11.3%) | 12 (2.8%) |
| 10:00 AM to 10:59 AM | 22 (5.4%) | 0 (0.0%) |
| 11:00 AM to 11:59 AM | 0 (0.0%) | 0 (0.0%) |
| 12:00 PM to 3:59 PM | 42 (10.3%) | 49 (11.5%) |
| 4:00 PM to 11:59 PM | 9 (2.2%) | 0 (0.0%) |
| Total | 406 (100.0%) | 427 (100.0%) |
Housing Occupancy in Warm Springs
Occupancy by Ownership in Warm Springs
Of the total 656 dwellings in Warm Springs, owner-occupied units account for 358 (54.6%), while renter-occupied units make up 298 (45.4%).
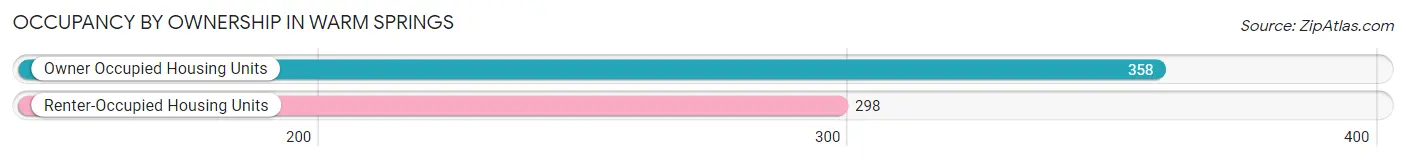
| Occupancy | # Housing Units | % Housing Units |
| Owner Occupied Housing Units | 358 | 54.6% |
| Renter-Occupied Housing Units | 298 | 45.4% |
| Total Occupied Housing Units | 656 | 100.0% |
Occupancy by Household Size in Warm Springs
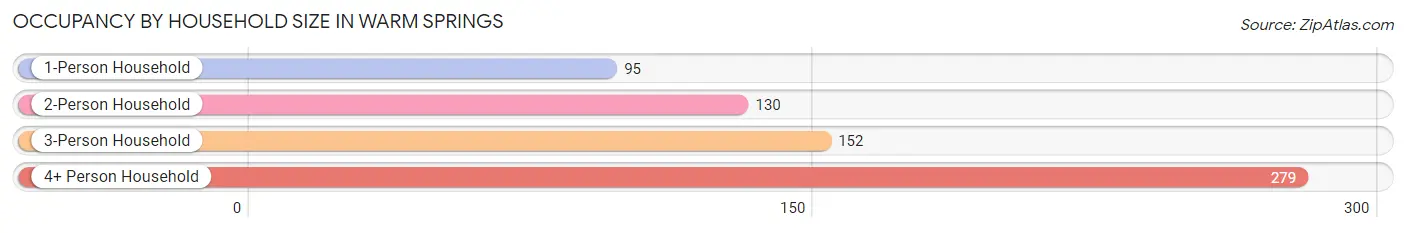
| Household Size | # Housing Units | % Housing Units |
| 1-Person Household | 95 | 14.5% |
| 2-Person Household | 130 | 19.8% |
| 3-Person Household | 152 | 23.2% |
| 4+ Person Household | 279 | 42.5% |
| Total Housing Units | 656 | 100.0% |
Occupancy by Ownership by Household Size in Warm Springs
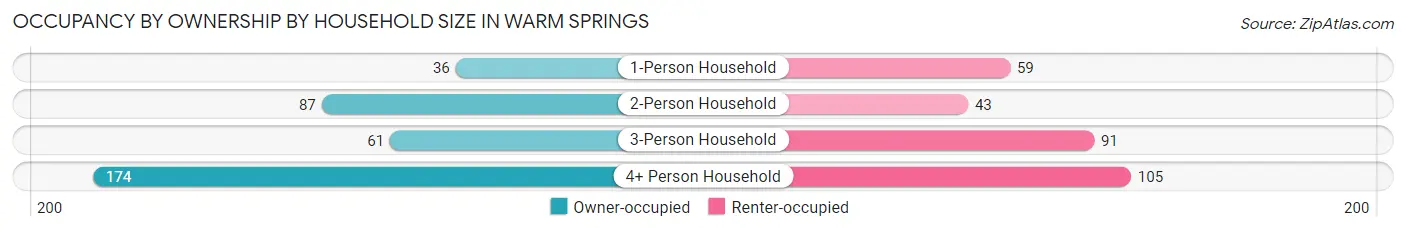
| Household Size | Owner-occupied | Renter-occupied |
| 1-Person Household | 36 (37.9%) | 59 (62.1%) |
| 2-Person Household | 87 (66.9%) | 43 (33.1%) |
| 3-Person Household | 61 (40.1%) | 91 (59.9%) |
| 4+ Person Household | 174 (62.4%) | 105 (37.6%) |
| Total Housing Units | 358 (54.6%) | 298 (45.4%) |
Occupancy by Educational Attainment in Warm Springs
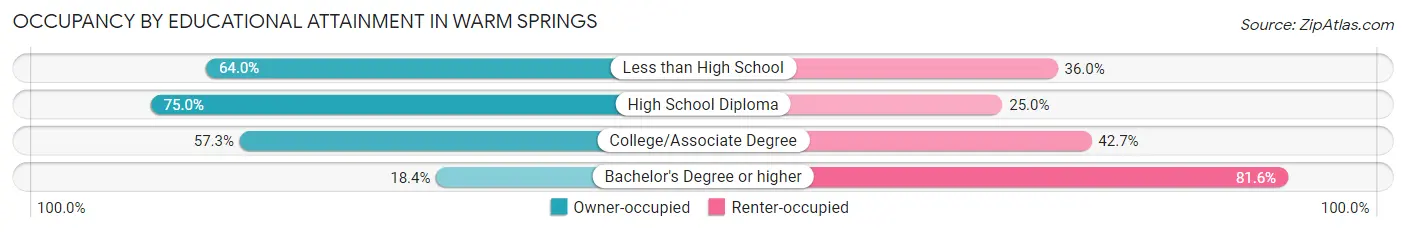
| Household Size | Owner-occupied | Renter-occupied |
| Less than High School | 57 (64.0%) | 32 (36.0%) |
| High School Diploma | 141 (75.0%) | 47 (25.0%) |
| College/Associate Degree | 133 (57.3%) | 99 (42.7%) |
| Bachelor's Degree or higher | 27 (18.4%) | 120 (81.6%) |
Occupancy by Age of Householder in Warm Springs
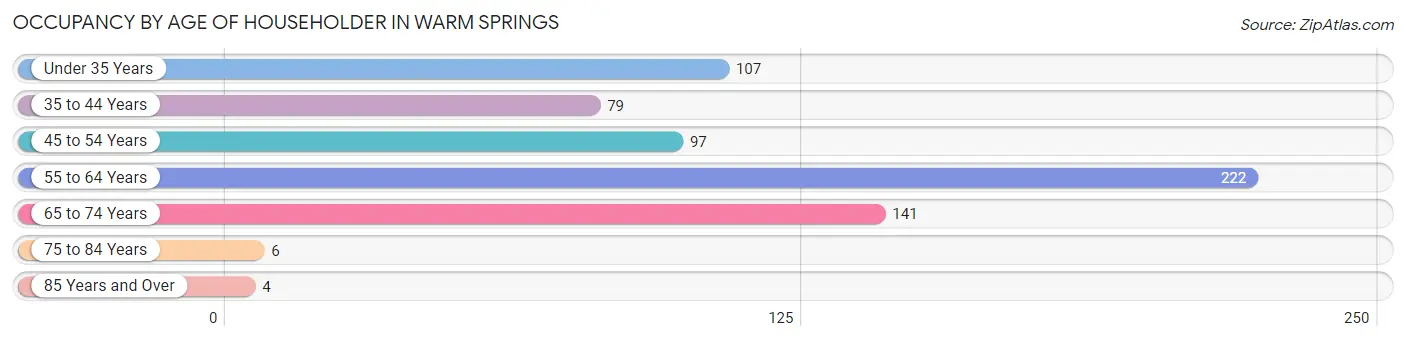
| Age Bracket | # Households | % Households |
| Under 35 Years | 107 | 16.3% |
| 35 to 44 Years | 79 | 12.0% |
| 45 to 54 Years | 97 | 14.8% |
| 55 to 64 Years | 222 | 33.8% |
| 65 to 74 Years | 141 | 21.5% |
| 75 to 84 Years | 6 | 0.9% |
| 85 Years and Over | 4 | 0.6% |
| Total | 656 | 100.0% |
Housing Finances in Warm Springs
Median Income by Occupancy in Warm Springs
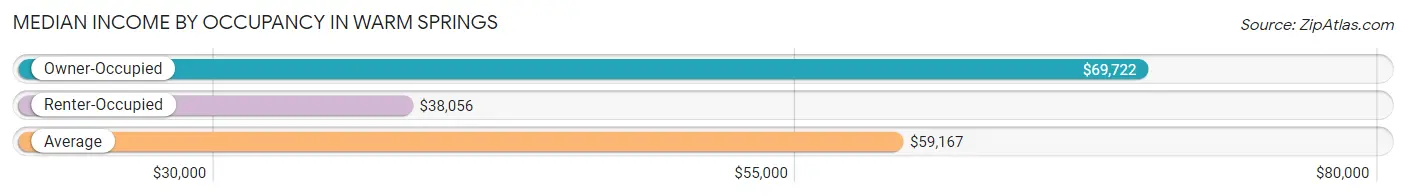
| Occupancy Type | # Households | Median Income |
| Owner-Occupied | 358 (54.6%) | $69,722 |
| Renter-Occupied | 298 (45.4%) | $38,056 |
| Average | 656 (100.0%) | $59,167 |
Occupancy by Householder Income Bracket in Warm Springs
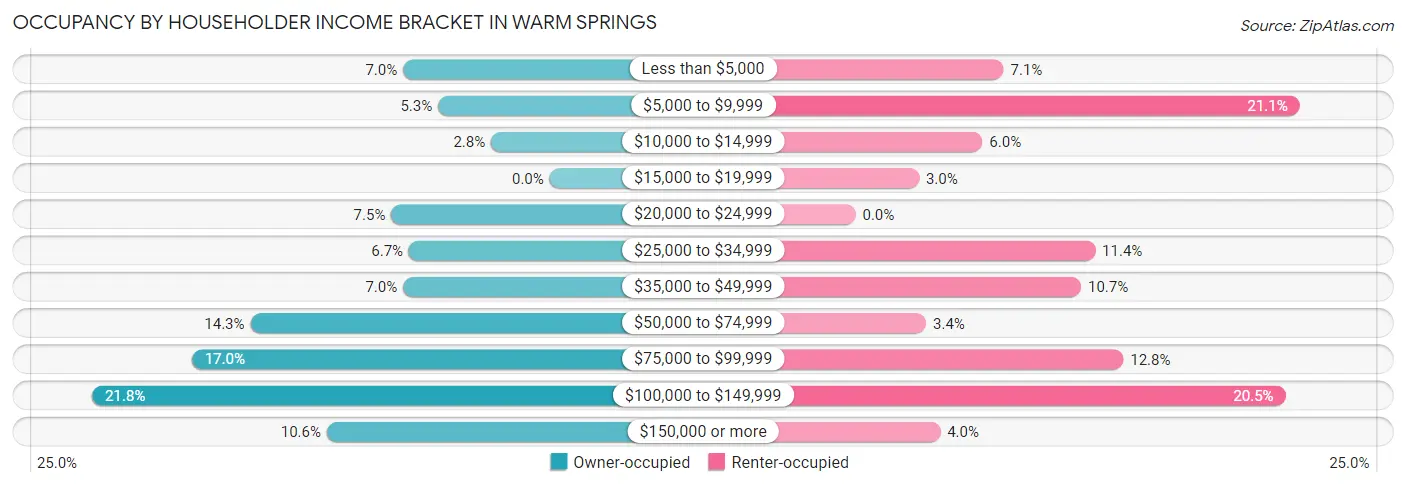
| Income Bracket | Owner-occupied | Renter-occupied |
| Less than $5,000 | 25 (7.0%) | 21 (7.0%) |
| $5,000 to $9,999 | 19 (5.3%) | 63 (21.1%) |
| $10,000 to $14,999 | 10 (2.8%) | 18 (6.0%) |
| $15,000 to $19,999 | 0 (0.0%) | 9 (3.0%) |
| $20,000 to $24,999 | 27 (7.5%) | 0 (0.0%) |
| $25,000 to $34,999 | 24 (6.7%) | 34 (11.4%) |
| $35,000 to $49,999 | 25 (7.0%) | 32 (10.7%) |
| $50,000 to $74,999 | 51 (14.2%) | 10 (3.4%) |
| $75,000 to $99,999 | 61 (17.0%) | 38 (12.8%) |
| $100,000 to $149,999 | 78 (21.8%) | 61 (20.5%) |
| $150,000 or more | 38 (10.6%) | 12 (4.0%) |
| Total | 358 (100.0%) | 298 (100.0%) |
Monthly Housing Cost Tiers in Warm Springs
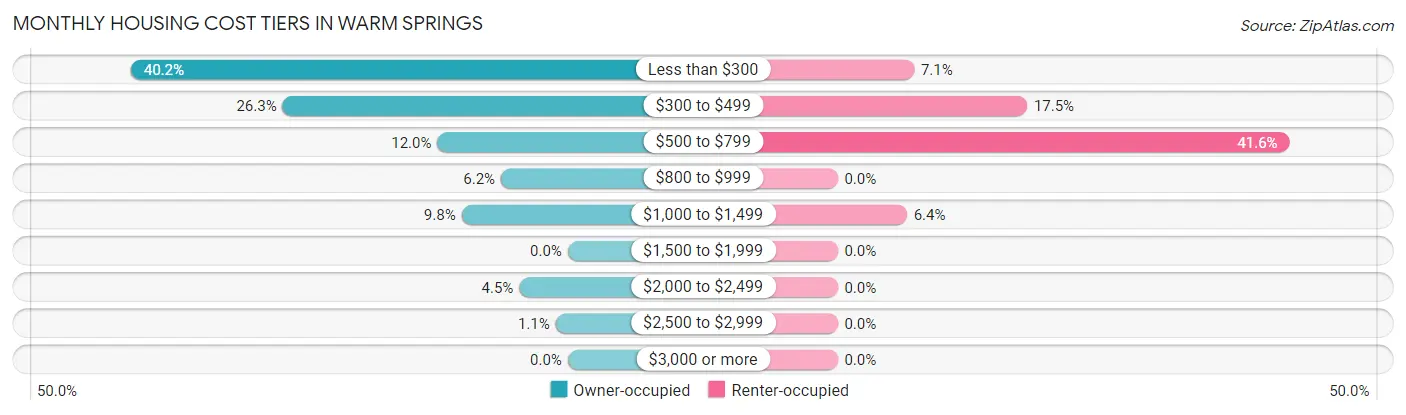
| Monthly Cost | Owner-occupied | Renter-occupied |
| Less than $300 | 144 (40.2%) | 21 (7.0%) |
| $300 to $499 | 94 (26.3%) | 52 (17.4%) |
| $500 to $799 | 43 (12.0%) | 124 (41.6%) |
| $800 to $999 | 22 (6.1%) | 0 (0.0%) |
| $1,000 to $1,499 | 35 (9.8%) | 19 (6.4%) |
| $1,500 to $1,999 | 0 (0.0%) | 0 (0.0%) |
| $2,000 to $2,499 | 16 (4.5%) | 0 (0.0%) |
| $2,500 to $2,999 | 4 (1.1%) | 0 (0.0%) |
| $3,000 or more | 0 (0.0%) | 0 (0.0%) |
| Total | 358 (100.0%) | 298 (100.0%) |
Physical Housing Characteristics in Warm Springs
Housing Structures in Warm Springs
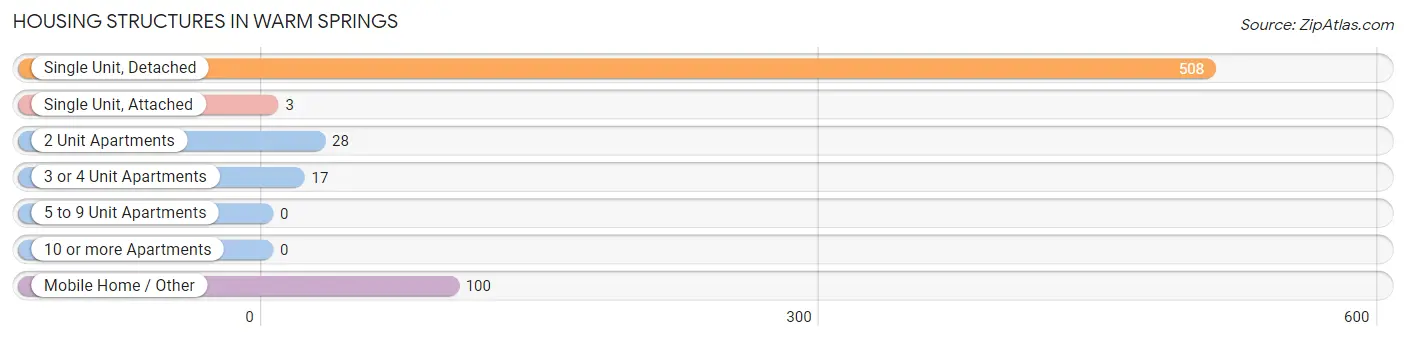
| Structure Type | # Housing Units | % Housing Units |
| Single Unit, Detached | 508 | 77.4% |
| Single Unit, Attached | 3 | 0.5% |
| 2 Unit Apartments | 28 | 4.3% |
| 3 or 4 Unit Apartments | 17 | 2.6% |
| 5 to 9 Unit Apartments | 0 | 0.0% |
| 10 or more Apartments | 0 | 0.0% |
| Mobile Home / Other | 100 | 15.2% |
| Total | 656 | 100.0% |
Housing Structures by Occupancy in Warm Springs
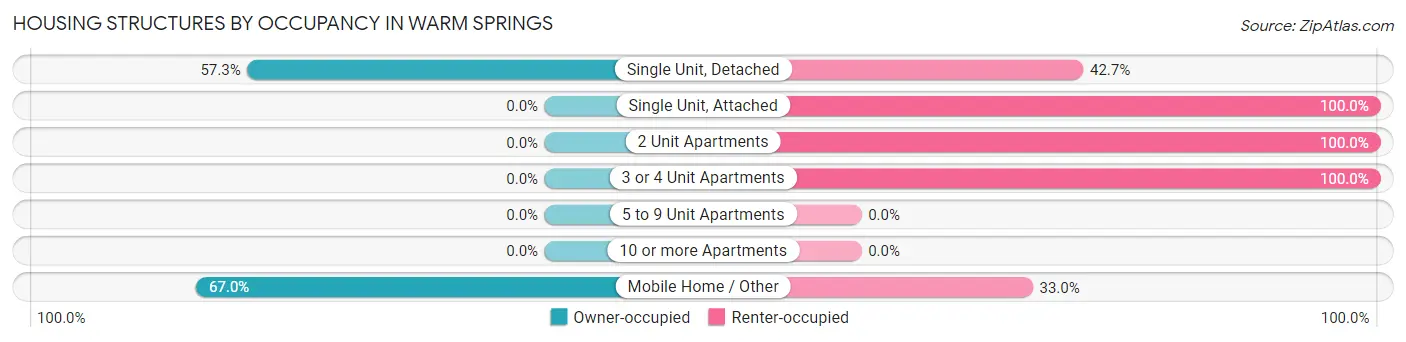
| Structure Type | Owner-occupied | Renter-occupied |
| Single Unit, Detached | 291 (57.3%) | 217 (42.7%) |
| Single Unit, Attached | 0 (0.0%) | 3 (100.0%) |
| 2 Unit Apartments | 0 (0.0%) | 28 (100.0%) |
| 3 or 4 Unit Apartments | 0 (0.0%) | 17 (100.0%) |
| 5 to 9 Unit Apartments | 0 (0.0%) | 0 (0.0%) |
| 10 or more Apartments | 0 (0.0%) | 0 (0.0%) |
| Mobile Home / Other | 67 (67.0%) | 33 (33.0%) |
| Total | 358 (54.6%) | 298 (45.4%) |
Housing Structures by Number of Rooms in Warm Springs
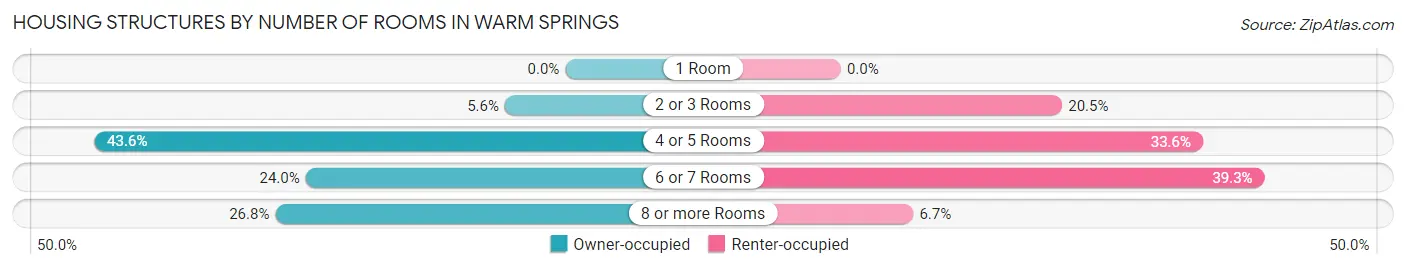
| Number of Rooms | Owner-occupied | Renter-occupied |
| 1 Room | 0 (0.0%) | 0 (0.0%) |
| 2 or 3 Rooms | 20 (5.6%) | 61 (20.5%) |
| 4 or 5 Rooms | 156 (43.6%) | 100 (33.6%) |
| 6 or 7 Rooms | 86 (24.0%) | 117 (39.3%) |
| 8 or more Rooms | 96 (26.8%) | 20 (6.7%) |
| Total | 358 (100.0%) | 298 (100.0%) |
Housing Structure by Heating Type in Warm Springs
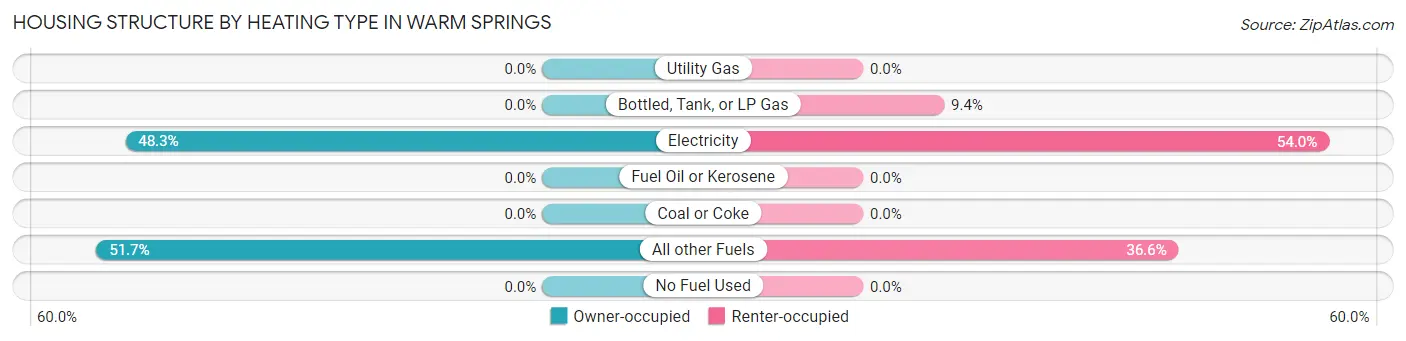
| Heating Type | Owner-occupied | Renter-occupied |
| Utility Gas | 0 (0.0%) | 0 (0.0%) |
| Bottled, Tank, or LP Gas | 0 (0.0%) | 28 (9.4%) |
| Electricity | 173 (48.3%) | 161 (54.0%) |
| Fuel Oil or Kerosene | 0 (0.0%) | 0 (0.0%) |
| Coal or Coke | 0 (0.0%) | 0 (0.0%) |
| All other Fuels | 185 (51.7%) | 109 (36.6%) |
| No Fuel Used | 0 (0.0%) | 0 (0.0%) |
| Total | 358 (100.0%) | 298 (100.0%) |
Household Vehicle Usage in Warm Springs
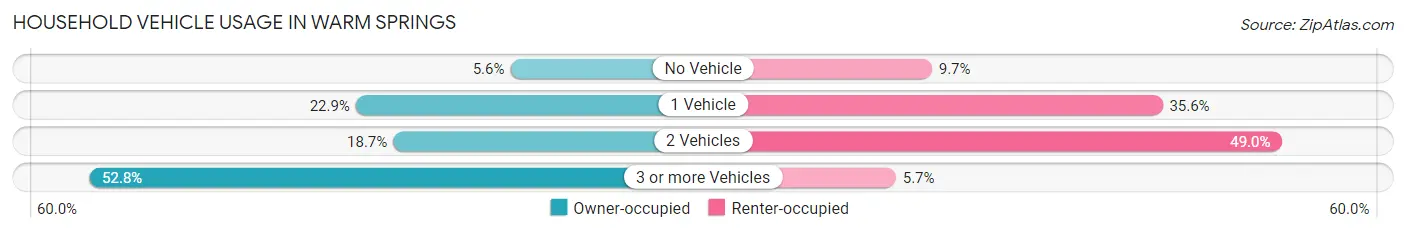
| Vehicles per Household | Owner-occupied | Renter-occupied |
| No Vehicle | 20 (5.6%) | 29 (9.7%) |
| 1 Vehicle | 82 (22.9%) | 106 (35.6%) |
| 2 Vehicles | 67 (18.7%) | 146 (49.0%) |
| 3 or more Vehicles | 189 (52.8%) | 17 (5.7%) |
| Total | 358 (100.0%) | 298 (100.0%) |
Real Estate & Mortgages in Warm Springs
Real Estate and Mortgage Overview in Warm Springs
| Characteristic | Without Mortgage | With Mortgage |
| Housing Units | 211 | 147 |
| Median Property Value | - | - |
| Median Household Income | $62,578 | $16 |
| Monthly Housing Costs | $214 | $0 |
| Real Estate Taxes | - | - |
Property Value by Mortgage Status in Warm Springs
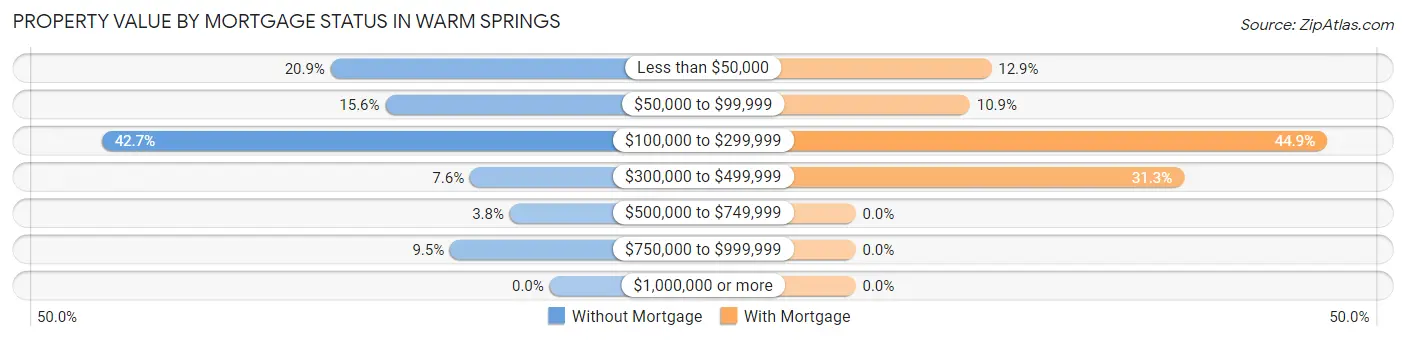
| Property Value | Without Mortgage | With Mortgage |
| Less than $50,000 | 44 (20.8%) | 19 (12.9%) |
| $50,000 to $99,999 | 33 (15.6%) | 16 (10.9%) |
| $100,000 to $299,999 | 90 (42.6%) | 66 (44.9%) |
| $300,000 to $499,999 | 16 (7.6%) | 46 (31.3%) |
| $500,000 to $749,999 | 8 (3.8%) | 0 (0.0%) |
| $750,000 to $999,999 | 20 (9.5%) | 0 (0.0%) |
| $1,000,000 or more | 0 (0.0%) | 0 (0.0%) |
| Total | 211 (100.0%) | 147 (100.0%) |
Household Income by Mortgage Status in Warm Springs
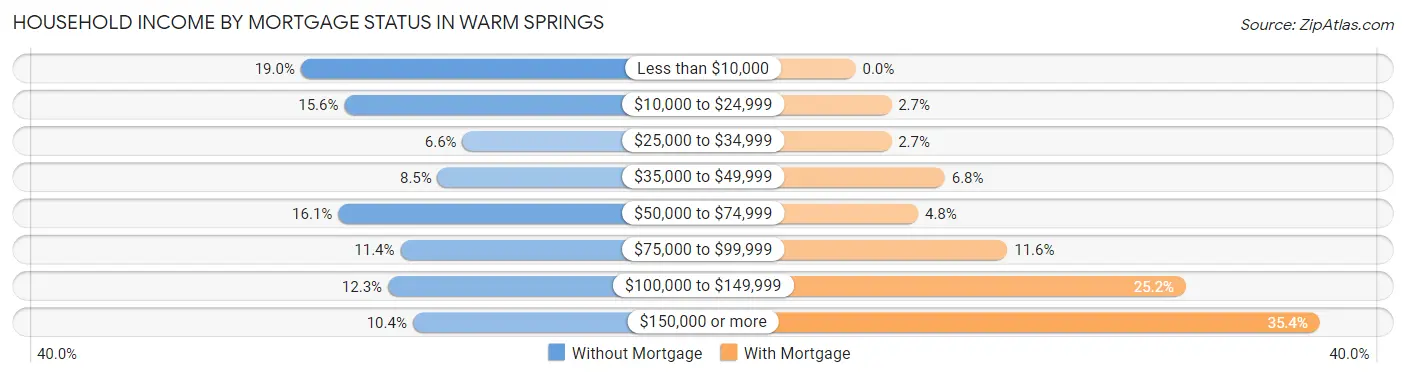
| Household Income | Without Mortgage | With Mortgage |
| Less than $10,000 | 40 (19.0%) | 0 (0.0%) |
| $10,000 to $24,999 | 33 (15.6%) | 4 (2.7%) |
| $25,000 to $34,999 | 14 (6.6%) | 4 (2.7%) |
| $35,000 to $49,999 | 18 (8.5%) | 10 (6.8%) |
| $50,000 to $74,999 | 34 (16.1%) | 7 (4.8%) |
| $75,000 to $99,999 | 24 (11.4%) | 17 (11.6%) |
| $100,000 to $149,999 | 26 (12.3%) | 37 (25.2%) |
| $150,000 or more | 22 (10.4%) | 52 (35.4%) |
| Total | 211 (100.0%) | 147 (100.0%) |
Property Value to Household Income Ratio in Warm Springs
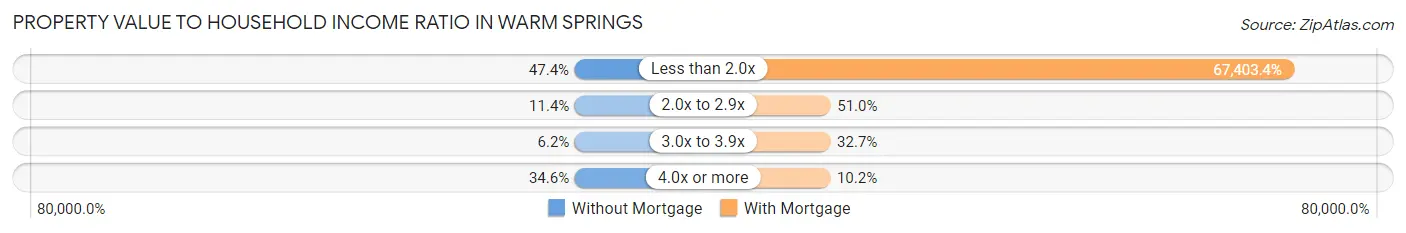
| Value-to-Income Ratio | Without Mortgage | With Mortgage |
| Less than 2.0x | 100 (47.4%) | 99,083 (67,403.4%) |
| 2.0x to 2.9x | 24 (11.4%) | 75 (51.0%) |
| 3.0x to 3.9x | 13 (6.2%) | 48 (32.7%) |
| 4.0x or more | 73 (34.6%) | 15 (10.2%) |
| Total | 211 (100.0%) | 147 (100.0%) |
Real Estate Taxes by Mortgage Status in Warm Springs
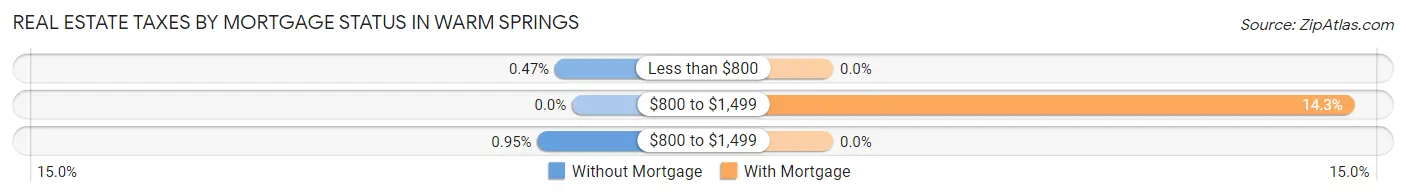
| Property Taxes | Without Mortgage | With Mortgage |
| Less than $800 | 1 (0.5%) | 0 (0.0%) |
| $800 to $1,499 | 0 (0.0%) | 21 (14.3%) |
| $800 to $1,499 | 2 (0.9%) | 0 (0.0%) |
| Total | 211 (100.0%) | 147 (100.0%) |
Health & Disability in Warm Springs
Health Insurance Coverage by Age in Warm Springs
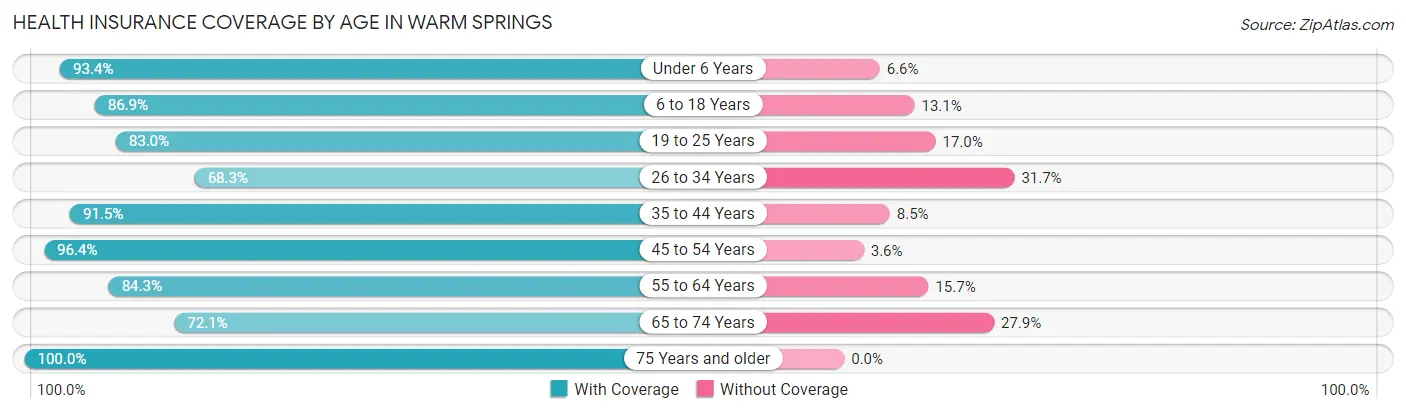
| Age Bracket | With Coverage | Without Coverage |
| Under 6 Years | 141 (93.4%) | 10 (6.6%) |
| 6 to 18 Years | 471 (86.9%) | 71 (13.1%) |
| 19 to 25 Years | 263 (83.0%) | 54 (17.0%) |
| 26 to 34 Years | 284 (68.3%) | 132 (31.7%) |
| 35 to 44 Years | 237 (91.5%) | 22 (8.5%) |
| 45 to 54 Years | 186 (96.4%) | 7 (3.6%) |
| 55 to 64 Years | 247 (84.3%) | 46 (15.7%) |
| 65 to 74 Years | 147 (72.1%) | 57 (27.9%) |
| 75 Years and older | 28 (100.0%) | 0 (0.0%) |
| Total | 2,004 (83.4%) | 399 (16.6%) |
Health Insurance Coverage by Citizenship Status in Warm Springs
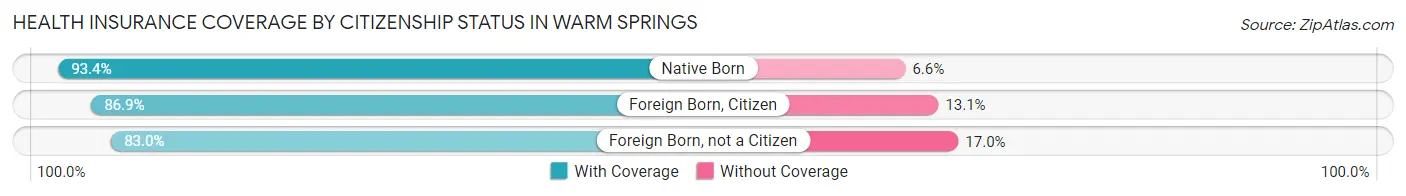
| Citizenship Status | With Coverage | Without Coverage |
| Native Born | 141 (93.4%) | 10 (6.6%) |
| Foreign Born, Citizen | 471 (86.9%) | 71 (13.1%) |
| Foreign Born, not a Citizen | 263 (83.0%) | 54 (17.0%) |
Health Insurance Coverage by Household Income in Warm Springs
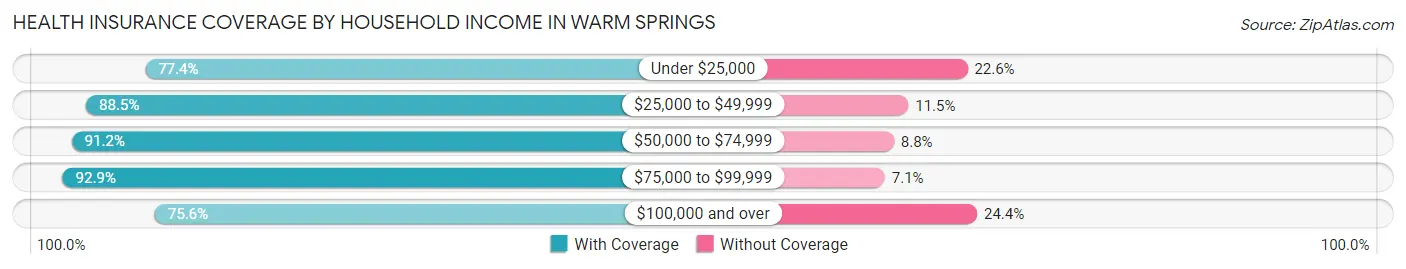
| Household Income | With Coverage | Without Coverage |
| Under $25,000 | 363 (77.4%) | 106 (22.6%) |
| $25,000 to $49,999 | 407 (88.5%) | 53 (11.5%) |
| $50,000 to $74,999 | 238 (91.2%) | 23 (8.8%) |
| $75,000 to $99,999 | 417 (92.9%) | 32 (7.1%) |
| $100,000 and over | 573 (75.6%) | 185 (24.4%) |
Public vs Private Health Insurance Coverage by Age in Warm Springs
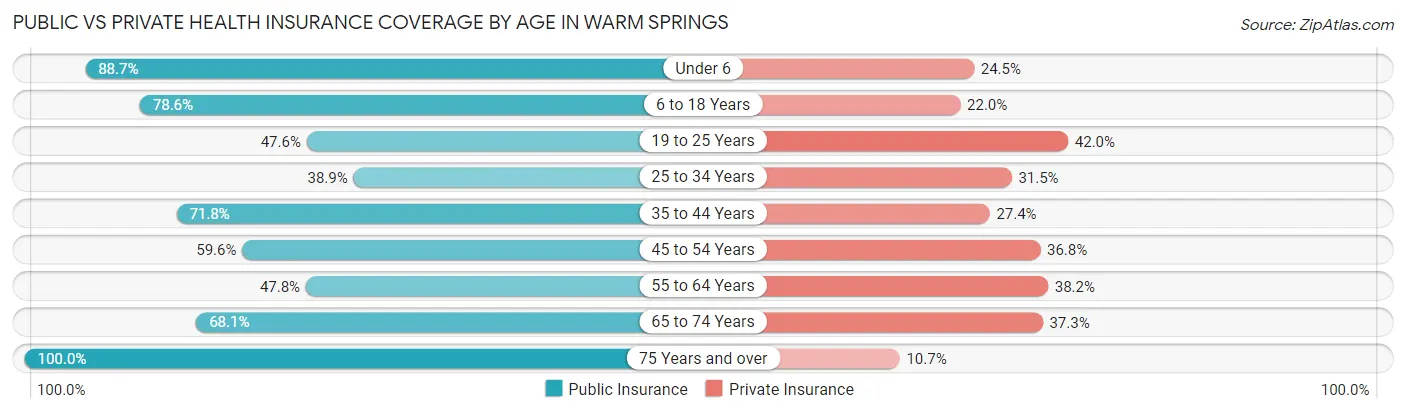
| Age Bracket | Public Insurance | Private Insurance |
| Under 6 | 134 (88.7%) | 37 (24.5%) |
| 6 to 18 Years | 426 (78.6%) | 119 (22.0%) |
| 19 to 25 Years | 151 (47.6%) | 133 (42.0%) |
| 25 to 34 Years | 162 (38.9%) | 131 (31.5%) |
| 35 to 44 Years | 186 (71.8%) | 71 (27.4%) |
| 45 to 54 Years | 115 (59.6%) | 71 (36.8%) |
| 55 to 64 Years | 140 (47.8%) | 112 (38.2%) |
| 65 to 74 Years | 139 (68.1%) | 76 (37.2%) |
| 75 Years and over | 28 (100.0%) | 3 (10.7%) |
| Total | 1,481 (61.6%) | 753 (31.3%) |
Disability Status by Sex by Age in Warm Springs
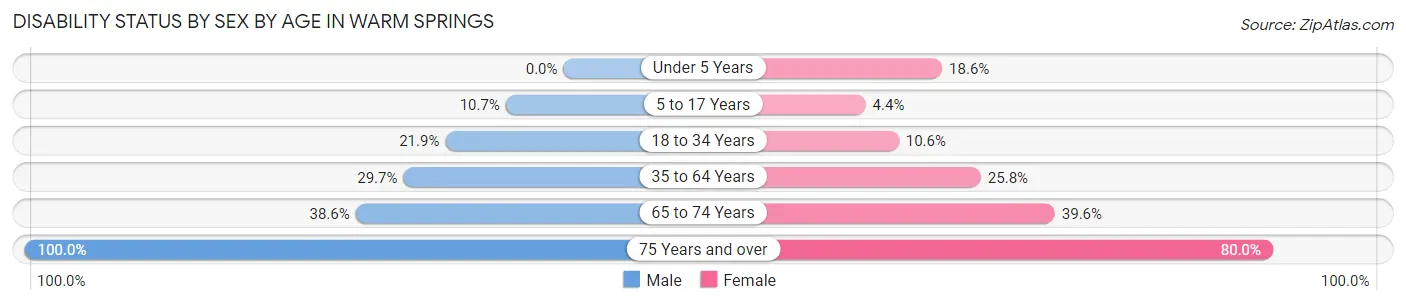
| Age Bracket | Male | Female |
| Under 5 Years | 0 (0.0%) | 19 (18.6%) |
| 5 to 17 Years | 40 (10.7%) | 7 (4.4%) |
| 18 to 34 Years | 89 (21.9%) | 38 (10.6%) |
| 35 to 64 Years | 112 (29.7%) | 95 (25.8%) |
| 65 to 74 Years | 27 (38.6%) | 53 (39.6%) |
| 75 Years and over | 13 (100.0%) | 12 (80.0%) |
Disability Class by Sex by Age in Warm Springs
Disability Class: Hearing Difficulty
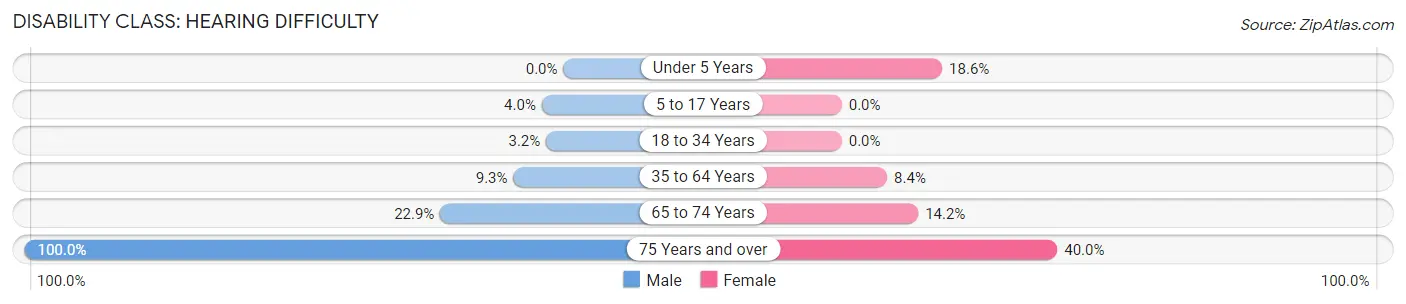
| Age Bracket | Male | Female |
| Under 5 Years | 0 (0.0%) | 19 (18.6%) |
| 5 to 17 Years | 15 (4.0%) | 0 (0.0%) |
| 18 to 34 Years | 13 (3.2%) | 0 (0.0%) |
| 35 to 64 Years | 35 (9.3%) | 31 (8.4%) |
| 65 to 74 Years | 16 (22.9%) | 19 (14.2%) |
| 75 Years and over | 13 (100.0%) | 6 (40.0%) |
Disability Class: Vision Difficulty
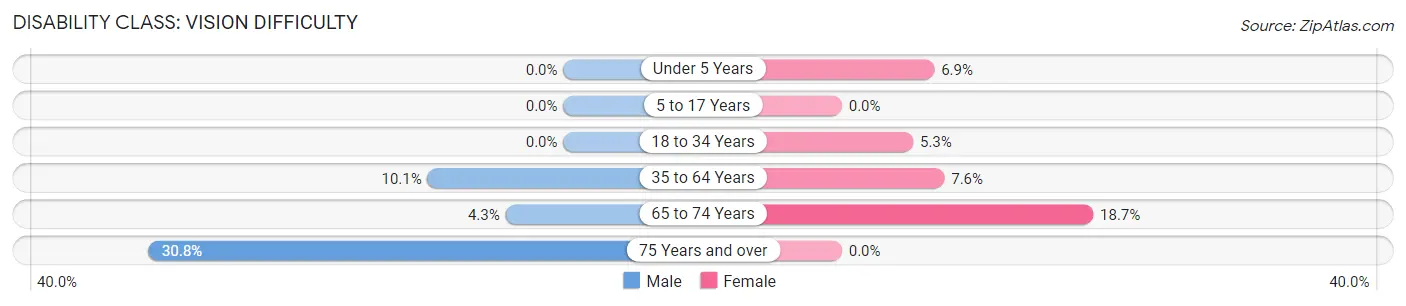
| Age Bracket | Male | Female |
| Under 5 Years | 0 (0.0%) | 7 (6.9%) |
| 5 to 17 Years | 0 (0.0%) | 0 (0.0%) |
| 18 to 34 Years | 0 (0.0%) | 19 (5.3%) |
| 35 to 64 Years | 38 (10.1%) | 28 (7.6%) |
| 65 to 74 Years | 3 (4.3%) | 25 (18.7%) |
| 75 Years and over | 4 (30.8%) | 0 (0.0%) |
Disability Class: Cognitive Difficulty
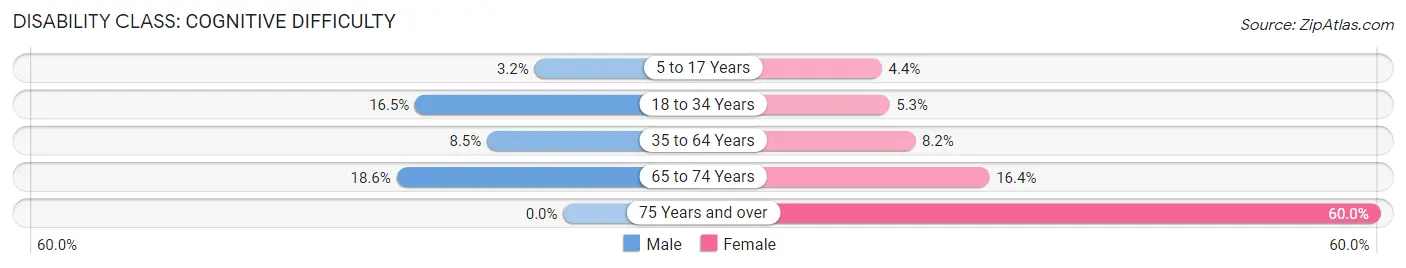
| Age Bracket | Male | Female |
| 5 to 17 Years | 12 (3.2%) | 7 (4.4%) |
| 18 to 34 Years | 67 (16.5%) | 19 (5.3%) |
| 35 to 64 Years | 32 (8.5%) | 30 (8.2%) |
| 65 to 74 Years | 13 (18.6%) | 22 (16.4%) |
| 75 Years and over | 0 (0.0%) | 9 (60.0%) |
Disability Class: Ambulatory Difficulty
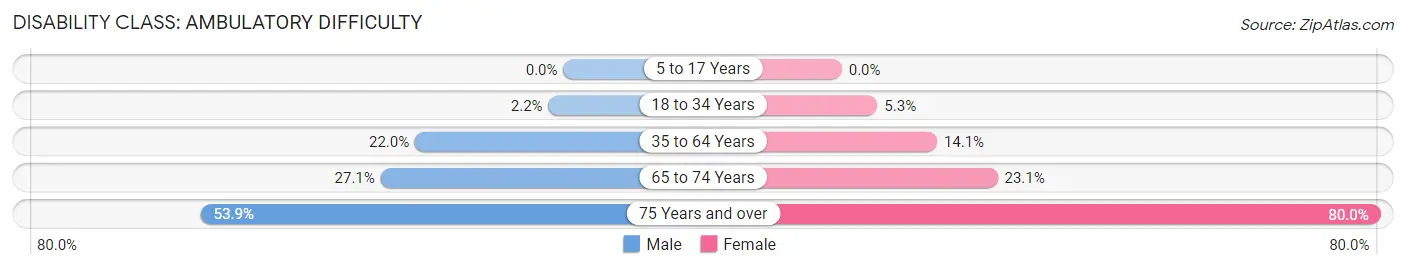
| Age Bracket | Male | Female |
| 5 to 17 Years | 0 (0.0%) | 0 (0.0%) |
| 18 to 34 Years | 9 (2.2%) | 19 (5.3%) |
| 35 to 64 Years | 83 (22.0%) | 52 (14.1%) |
| 65 to 74 Years | 19 (27.1%) | 31 (23.1%) |
| 75 Years and over | 7 (53.8%) | 12 (80.0%) |
Disability Class: Self-Care Difficulty
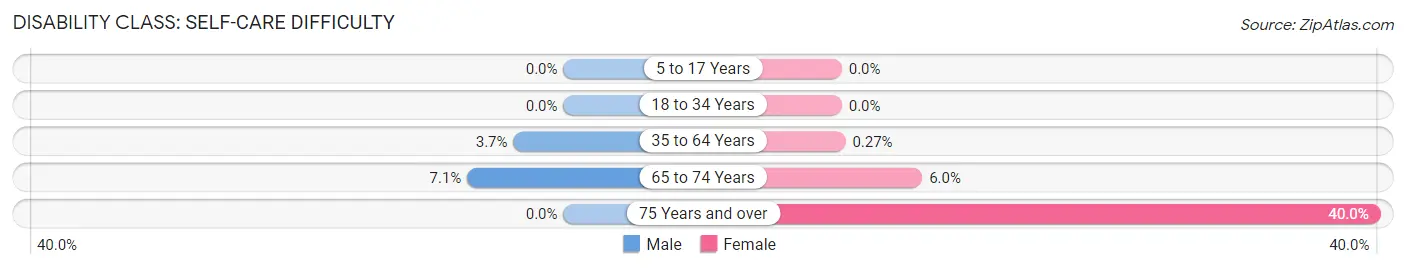
| Age Bracket | Male | Female |
| 5 to 17 Years | 0 (0.0%) | 0 (0.0%) |
| 18 to 34 Years | 0 (0.0%) | 0 (0.0%) |
| 35 to 64 Years | 14 (3.7%) | 1 (0.3%) |
| 65 to 74 Years | 5 (7.1%) | 8 (6.0%) |
| 75 Years and over | 0 (0.0%) | 6 (40.0%) |
Technology Access in Warm Springs
Computing Device Access in Warm Springs
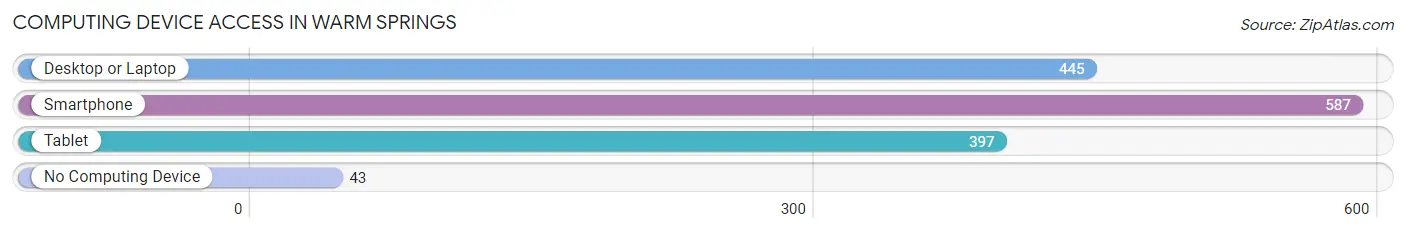
| Device Type | # Households | % Households |
| Desktop or Laptop | 445 | 67.8% |
| Smartphone | 587 | 89.5% |
| Tablet | 397 | 60.5% |
| No Computing Device | 43 | 6.6% |
| Total | 656 | 100.0% |
Internet Access in Warm Springs
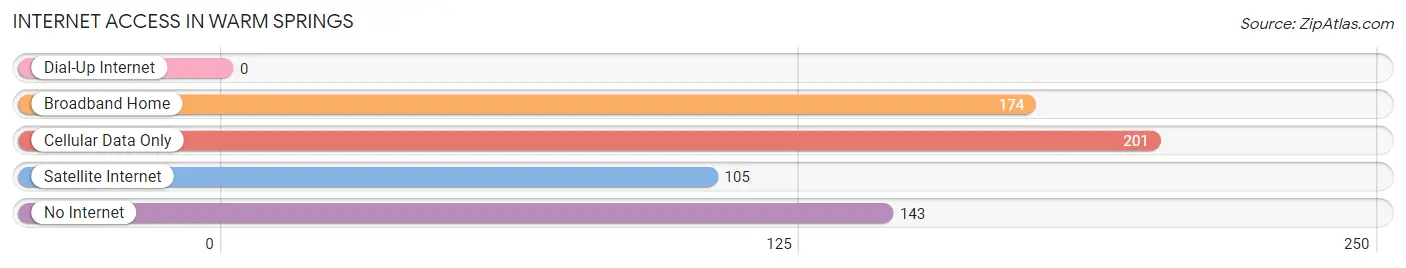
| Internet Type | # Households | % Households |
| Dial-Up Internet | 0 | 0.0% |
| Broadband Home | 174 | 26.5% |
| Cellular Data Only | 201 | 30.6% |
| Satellite Internet | 105 | 16.0% |
| No Internet | 143 | 21.8% |
| Total | 656 | 100.0% |
Warm Springs Summary
Warm Springs is a small unincorporated community located in Central Oregon, in the United States. It is situated in the foothills of the Cascade Mountains, approximately 50 miles east of Bend and 70 miles south of The Dalles. The community is located in Jefferson County and is home to the Confederated Tribes of Warm Springs, which includes the Wasco, Paiute, and Warm Springs tribes.
History
The area now known as Warm Springs has been inhabited by Native Americans for thousands of years. The Wasco, Paiute, and Warm Springs tribes have lived in the area for centuries, and the area is still home to the Confederated Tribes of Warm Springs. The tribes have a long and rich history in the area, and their culture and traditions are still celebrated today.
The first non-Native American settlers arrived in the area in the late 1800s. The settlers were primarily ranchers and farmers, and they established the town of Warm Springs in the early 1900s. The town was named after the nearby hot springs, which were believed to have healing properties.
Geography
Warm Springs is located in Central Oregon, in the foothills of the Cascade Mountains. The town is situated at an elevation of 2,400 feet, and the surrounding area is mostly mountainous and forested. The town is located approximately 50 miles east of Bend and 70 miles south of The Dalles.
The climate in Warm Springs is generally mild and dry, with hot summers and cold winters. The average annual temperature is around 50 degrees Fahrenheit, and the average annual precipitation is around 15 inches.
Economy
The economy of Warm Springs is largely based on tourism and agriculture. The town is home to several tourist attractions, including the nearby hot springs, which are believed to have healing properties. The town is also home to several wineries, and the surrounding area is known for its production of apples, pears, and other fruits.
The Confederated Tribes of Warm Springs also play an important role in the local economy. The tribes own and operate several businesses in the area, including a casino, a hotel, and a golf course. The tribes also own and manage several thousand acres of land, which is used for timber production, grazing, and recreation.
Demographics
As of the 2010 census, the population of Warm Springs was 1,743. The population is primarily Native American, with the Wasco, Paiute, and Warm Springs tribes making up the majority of the population. The town also has a small Hispanic population, as well as a small population of non-Hispanic whites.
The median household income in Warm Springs is $30,000, and the median home value is $150,000. The unemployment rate in the town is around 10%, and the poverty rate is around 20%.
Conclusion
Warm Springs is a small unincorporated community located in Central Oregon, in the United States. It is home to the Confederated Tribes of Warm Springs, which includes the Wasco, Paiute, and Warm Springs tribes. The economy of Warm Springs is largely based on tourism and agriculture, and the town is home to several tourist attractions, including the nearby hot springs. The population of Warm Springs is primarily Native American, and the median household income is around $30,000.
Common Questions
What is Per Capita Income in Warm Springs?
Per Capita income in Warm Springs is $21,970.
What is the Median Family Income in Warm Springs?
Median Family Income in Warm Springs is $58,548.
What is the Median Household income in Warm Springs?
Median Household Income in Warm Springs is $59,167.
What is Income or Wage Gap in Warm Springs?
Income or Wage Gap in Warm Springs is 1.8%.
Women in Warm Springs earn 98.2 cents for every dollar earned by a man.
What is Family Income Deficit in Warm Springs?
Family Income Deficit in Warm Springs is $13,839.
Families that are below poverty line in Warm Springs earn $13,839 less on average than the poverty threshold level.
What is Inequality or Gini Index in Warm Springs?
Inequality or Gini Index in Warm Springs is 0.50.
What is the Total Population of Warm Springs?
Total Population of Warm Springs is 2,453.
What is the Total Male Population of Warm Springs?
Total Male Population of Warm Springs is 1,301.
What is the Total Female Population of Warm Springs?
Total Female Population of Warm Springs is 1,152.
What is the Ratio of Males per 100 Females in Warm Springs?
There are 112.93 Males per 100 Females in Warm Springs.
What is the Ratio of Females per 100 Males in Warm Springs?
There are 88.55 Females per 100 Males in Warm Springs.
What is the Median Population Age in Warm Springs?
Median Population Age in Warm Springs is 30.4 Years.
What is the Average Family Size in Warm Springs
Average Family Size in Warm Springs is 3.9 People.
What is the Average Household Size in Warm Springs
Average Household Size in Warm Springs is 3.6 People.
How Large is the Labor Force in Warm Springs?
There are 1,024 People in the Labor Forcein in Warm Springs.
What is the Percentage of People in the Labor Force in Warm Springs?
55.6% of People are in the Labor Force in Warm Springs.
What is the Unemployment Rate in Warm Springs?
Unemployment Rate in Warm Springs is 11.0%.