Chiloquin, OR Map & Demographics
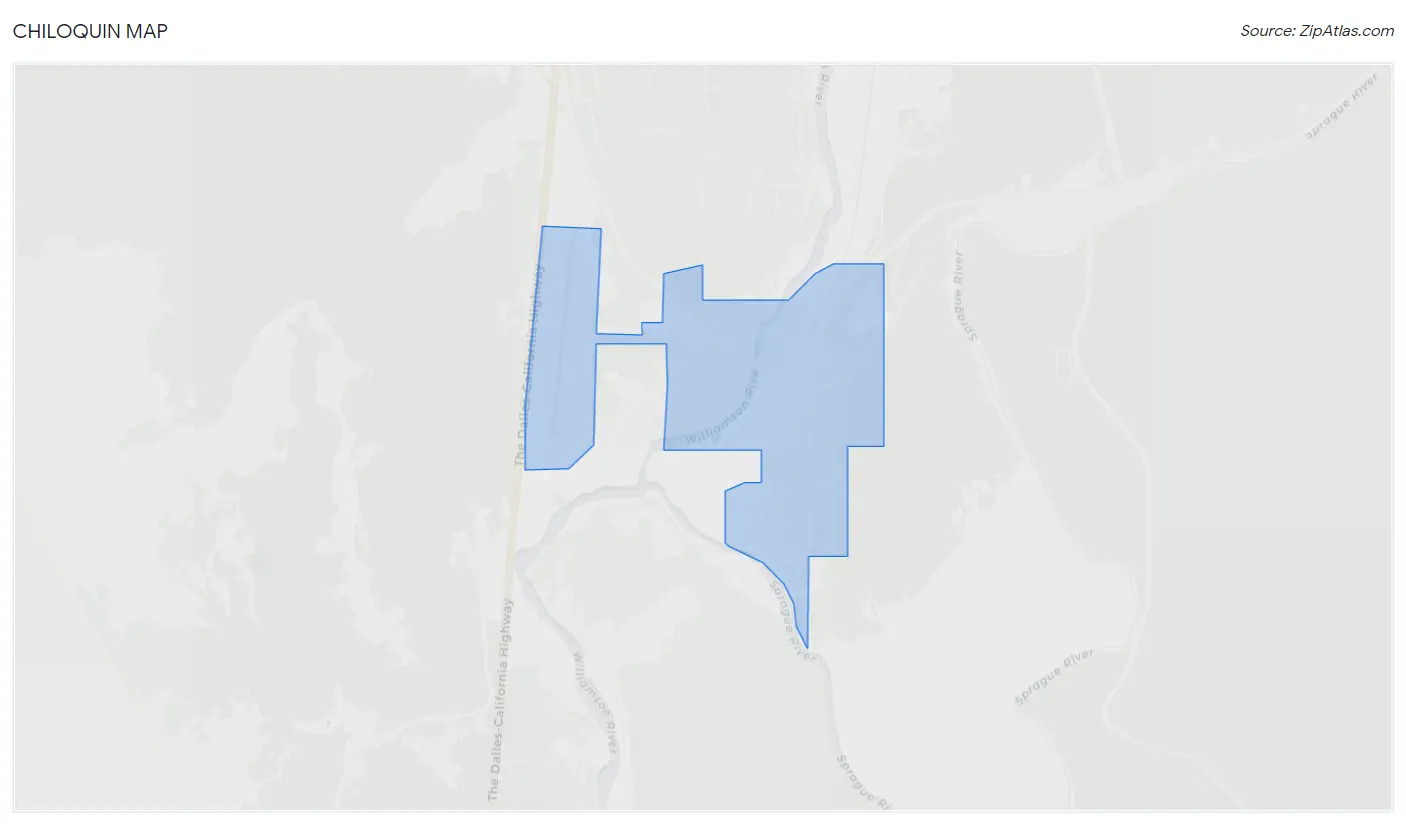
Chiloquin Map
Chiloquin Overview
$23,040
PER CAPITA INCOME
$57,813
AVG FAMILY INCOME
$40,781
AVG HOUSEHOLD INCOME
0.3%
WAGE / INCOME GAP [ % ]
99.7¢/ $1
WAGE / INCOME GAP [ $ ]
0.39
INEQUALITY / GINI INDEX
696
TOTAL POPULATION
366
MALE POPULATION
330
FEMALE POPULATION
110.91
MALES / 100 FEMALES
90.16
FEMALES / 100 MALES
37.5
MEDIAN AGE
2.5
AVG FAMILY SIZE
2.3
AVG HOUSEHOLD SIZE
337
LABOR FORCE [ PEOPLE ]
56.0%
PERCENT IN LABOR FORCE
25.2%
UNEMPLOYMENT RATE
Chiloquin Zip Codes
Chiloquin Area Codes
Income in Chiloquin
Income Overview in Chiloquin
Per Capita Income in Chiloquin is $23,040, while median incomes of families and households are $57,813 and $40,781 respectively.
| Characteristic | Number | Measure |
| Per Capita Income | 696 | $23,040 |
| Median Family Income | 172 | $57,813 |
| Mean Family Income | 172 | $60,581 |
| Median Household Income | 306 | $40,781 |
| Mean Household Income | 306 | $51,272 |
| Income Deficit | 172 | $0 |
| Wage / Income Gap (%) | 696 | 0.31% |
| Wage / Income Gap ($) | 696 | 99.69¢ per $1 |
| Gini / Inequality Index | 696 | 0.39 |
Earnings by Sex in Chiloquin
Average Earnings in Chiloquin are $30,134, $30,114 for men and $30,208 for women, a difference of 0.3%.
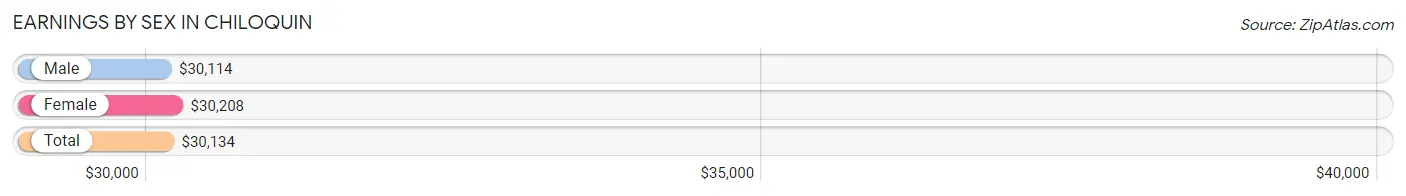
| Sex | Number | Average Earnings |
| Male | 194 (57.6%) | $30,114 |
| Female | 143 (42.4%) | $30,208 |
| Total | 337 (100.0%) | $30,134 |
Earnings by Sex by Income Bracket in Chiloquin
The most common earnings brackets in Chiloquin are $2,499 or less for men (44 | 22.7%) and $30,000 to $34,999 for women (29 | 20.3%).
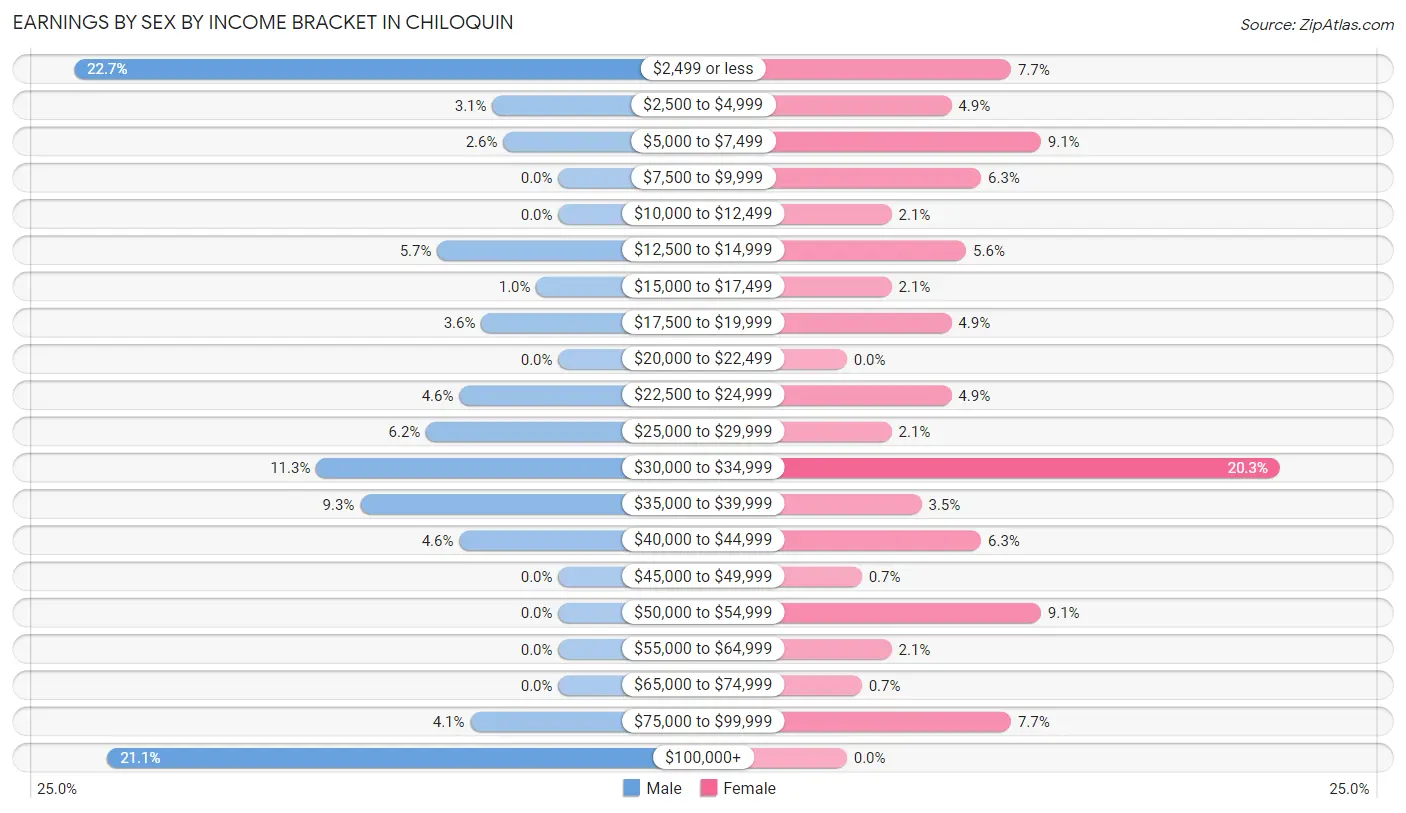
| Income | Male | Female |
| $2,499 or less | 44 (22.7%) | 11 (7.7%) |
| $2,500 to $4,999 | 6 (3.1%) | 7 (4.9%) |
| $5,000 to $7,499 | 5 (2.6%) | 13 (9.1%) |
| $7,500 to $9,999 | 0 (0.0%) | 9 (6.3%) |
| $10,000 to $12,499 | 0 (0.0%) | 3 (2.1%) |
| $12,500 to $14,999 | 11 (5.7%) | 8 (5.6%) |
| $15,000 to $17,499 | 2 (1.0%) | 3 (2.1%) |
| $17,500 to $19,999 | 7 (3.6%) | 7 (4.9%) |
| $20,000 to $22,499 | 0 (0.0%) | 0 (0.0%) |
| $22,500 to $24,999 | 9 (4.6%) | 7 (4.9%) |
| $25,000 to $29,999 | 12 (6.2%) | 3 (2.1%) |
| $30,000 to $34,999 | 22 (11.3%) | 29 (20.3%) |
| $35,000 to $39,999 | 18 (9.3%) | 5 (3.5%) |
| $40,000 to $44,999 | 9 (4.6%) | 9 (6.3%) |
| $45,000 to $49,999 | 0 (0.0%) | 1 (0.7%) |
| $50,000 to $54,999 | 0 (0.0%) | 13 (9.1%) |
| $55,000 to $64,999 | 0 (0.0%) | 3 (2.1%) |
| $65,000 to $74,999 | 0 (0.0%) | 1 (0.7%) |
| $75,000 to $99,999 | 8 (4.1%) | 11 (7.7%) |
| $100,000+ | 41 (21.1%) | 0 (0.0%) |
| Total | 194 (100.0%) | 143 (100.0%) |
Earnings by Sex by Educational Attainment in Chiloquin
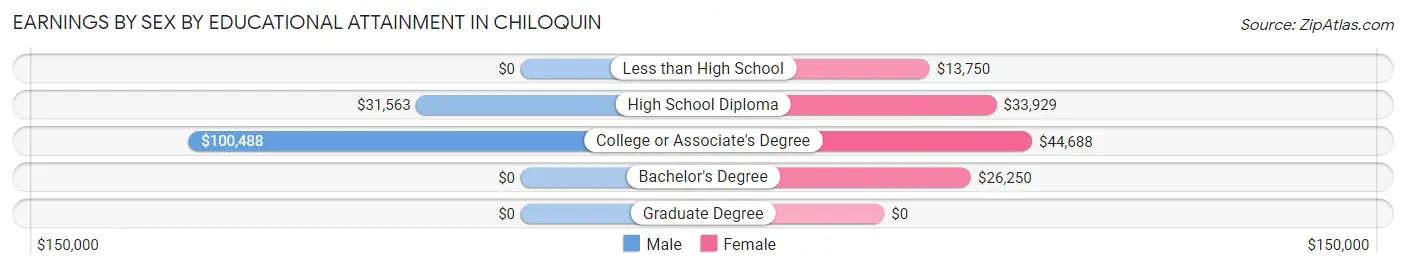
| Educational Attainment | Male Income | Female Income |
| Less than High School | - | - |
| High School Diploma | $31,563 | $33,929 |
| College or Associate's Degree | $100,488 | $44,688 |
| Bachelor's Degree | - | - |
| Graduate Degree | - | - |
| Total | - | - |
Family Income in Chiloquin
Family Income Brackets in Chiloquin
According to the Chiloquin family income data, there are 50 families falling into the $100,000 to $149,999 income range, which is the most common income bracket and makes up 29.1% of all families.
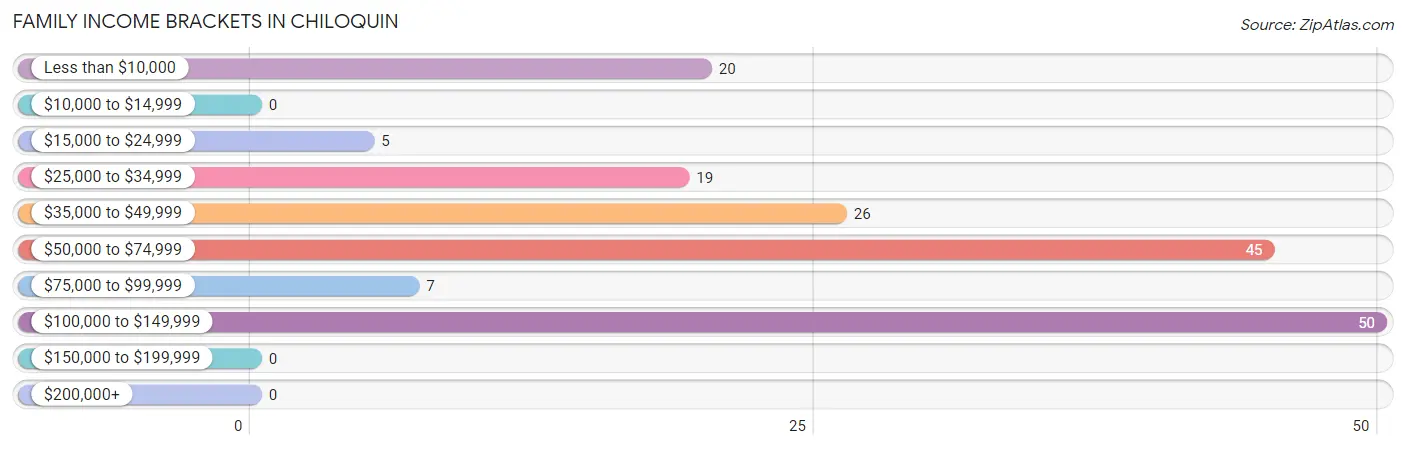
| Income Bracket | # Families | % Families |
| Less than $10,000 | 20 | 11.6% |
| $10,000 to $14,999 | 0 | 0.0% |
| $15,000 to $24,999 | 5 | 2.9% |
| $25,000 to $34,999 | 19 | 11.0% |
| $35,000 to $49,999 | 26 | 15.1% |
| $50,000 to $74,999 | 45 | 26.2% |
| $75,000 to $99,999 | 7 | 4.1% |
| $100,000 to $149,999 | 50 | 29.1% |
| $150,000 to $199,999 | 0 | 0.0% |
| $200,000+ | 0 | 0.0% |
Family Income by Famaliy Size in Chiloquin
2-person families (124 | 72.1%) account for the highest median family income in Chiloquin with $67,500 per family, while 2-person families (124 | 72.1%) have the highest median income of $33,750 per family member.
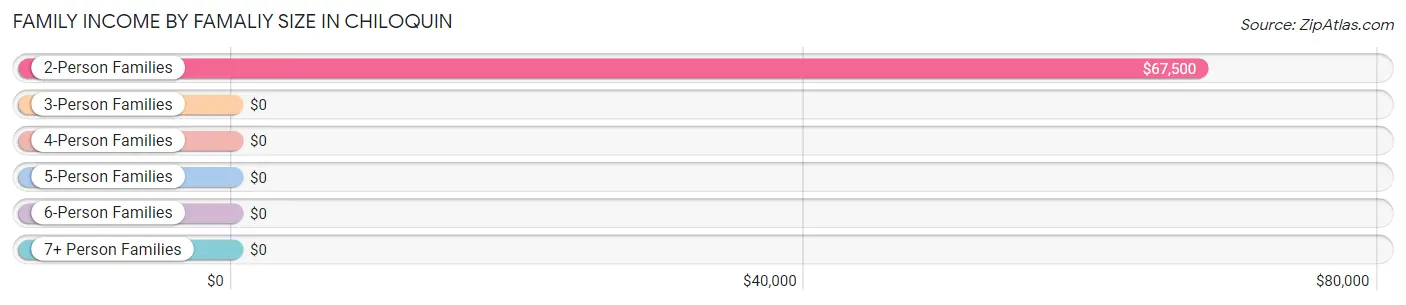
| Income Bracket | # Families | Median Income |
| 2-Person Families | 124 (72.1%) | $67,500 |
| 3-Person Families | 7 (4.1%) | $0 |
| 4-Person Families | 32 (18.6%) | $0 |
| 5-Person Families | 5 (2.9%) | $0 |
| 6-Person Families | 4 (2.3%) | $0 |
| 7+ Person Families | 0 (0.0%) | $0 |
| Total | 172 (100.0%) | $57,813 |
Family Income by Number of Earners in Chiloquin
The median family income in Chiloquin is $57,813, with families comprising 2 earners (71) having the highest median family income of $100,884, while families with no earners (31) have the lowest median family income of $2,499, accounting for 41.3% and 18.0% of families, respectively.
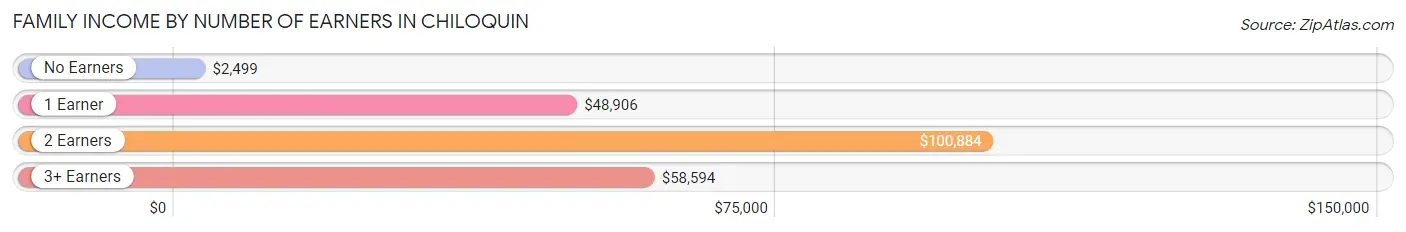
| Number of Earners | # Families | Median Income |
| No Earners | 31 (18.0%) | $2,499 |
| 1 Earner | 61 (35.5%) | $48,906 |
| 2 Earners | 71 (41.3%) | $100,884 |
| 3+ Earners | 9 (5.2%) | $58,594 |
| Total | 172 (100.0%) | $57,813 |
Household Income in Chiloquin
Household Income Brackets in Chiloquin
With 72 households falling in the category, the $25,000 to $34,999 income range is the most frequent in Chiloquin, accounting for 23.5% of all households.
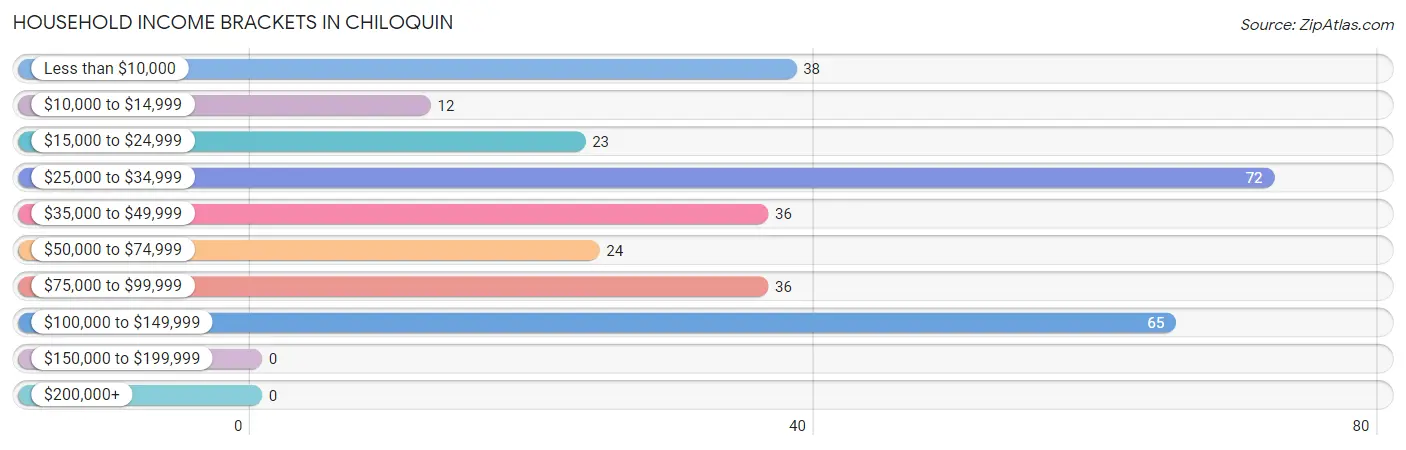
| Income Bracket | # Households | % Households |
| Less than $10,000 | 38 | 12.4% |
| $10,000 to $14,999 | 12 | 3.9% |
| $15,000 to $24,999 | 23 | 7.5% |
| $25,000 to $34,999 | 72 | 23.5% |
| $35,000 to $49,999 | 36 | 11.8% |
| $50,000 to $74,999 | 24 | 7.8% |
| $75,000 to $99,999 | 36 | 11.8% |
| $100,000 to $149,999 | 65 | 21.2% |
| $150,000 to $199,999 | 0 | 0.0% |
| $200,000+ | 0 | 0.0% |
Household Income by Householder Age in Chiloquin
The median household income in Chiloquin is $40,781, with the highest median household income of $41,161 found in the 25 to 44 years age bracket for the primary householder. A total of 51 households (16.7%) fall into this category. Meanwhile, the 15 to 24 years age bracket for the primary householder has the lowest median household income of $0, with 26 households (8.5%) in this group.
| Income Bracket | # Households | Median Income |
| 15 to 24 Years | 26 (8.5%) | $0 |
| 25 to 44 Years | 51 (16.7%) | $41,161 |
| 45 to 64 Years | 138 (45.1%) | $0 |
| 65+ Years | 91 (29.7%) | $0 |
| Total | 306 (100.0%) | $40,781 |
Poverty in Chiloquin
Income Below Poverty by Sex and Age in Chiloquin
With 19.7% poverty level for males and 36.0% for females among the residents of Chiloquin, 6 to 11 year old males and 65 to 74 year old females are the most vulnerable to poverty, with 12 males (52.2%) and 20 females (69.0%) in their respective age groups living below the poverty level.
| Age Bracket | Male | Female |
| Under 5 Years | 0 (0.0%) | 13 (65.0%) |
| 5 Years | 0 (0.0%) | 0 (0.0%) |
| 6 to 11 Years | 12 (52.2%) | 0 (0.0%) |
| 12 to 14 Years | 0 (0.0%) | 0 (0.0%) |
| 15 Years | 0 (0.0%) | 0 (0.0%) |
| 16 and 17 Years | 1 (50.0%) | 0 (0.0%) |
| 18 to 24 Years | 26 (24.8%) | 25 (43.1%) |
| 25 to 34 Years | 9 (25.7%) | 13 (35.1%) |
| 35 to 44 Years | 0 (0.0%) | 15 (45.5%) |
| 45 to 54 Years | 0 (0.0%) | 23 (57.5%) |
| 55 to 64 Years | 14 (30.4%) | 4 (8.3%) |
| 65 to 74 Years | 8 (19.5%) | 20 (69.0%) |
| 75 Years and over | 2 (7.1%) | 0 (0.0%) |
| Total | 72 (19.7%) | 113 (36.0%) |
Income Above Poverty by Sex and Age in Chiloquin
According to the poverty statistics in Chiloquin, males aged under 5 years and females aged 6 to 11 years are the age groups that are most secure financially, with 100.0% of males and 100.0% of females in these age groups living above the poverty line.
| Age Bracket | Male | Female |
| Under 5 Years | 8 (100.0%) | 7 (35.0%) |
| 5 Years | 1 (100.0%) | 0 (0.0%) |
| 6 to 11 Years | 11 (47.8%) | 17 (100.0%) |
| 12 to 14 Years | 0 (0.0%) | 6 (100.0%) |
| 15 Years | 3 (100.0%) | 0 (0.0%) |
| 16 and 17 Years | 1 (50.0%) | 1 (100.0%) |
| 18 to 24 Years | 79 (75.2%) | 33 (56.9%) |
| 25 to 34 Years | 26 (74.3%) | 24 (64.9%) |
| 35 to 44 Years | 25 (100.0%) | 18 (54.5%) |
| 45 to 54 Years | 49 (100.0%) | 17 (42.5%) |
| 55 to 64 Years | 32 (69.6%) | 44 (91.7%) |
| 65 to 74 Years | 33 (80.5%) | 9 (31.0%) |
| 75 Years and over | 26 (92.9%) | 25 (100.0%) |
| Total | 294 (80.3%) | 201 (64.0%) |
Income Below Poverty Among Married-Couple Families in Chiloquin
The poverty statistics for married-couple families in Chiloquin show that 5.8% or 3 of the total 52 families live below the poverty line. Families with 1 or 2 children have the highest poverty rate of 6.2%, comprising of 1 families. On the other hand, families with 3 or 4 children have the lowest poverty rate of 0.0%, which includes 0 families.
| Children | Above Poverty | Below Poverty |
| No Children | 33 (94.3%) | 2 (5.7%) |
| 1 or 2 Children | 15 (93.8%) | 1 (6.2%) |
| 3 or 4 Children | 1 (100.0%) | 0 (0.0%) |
| 5 or more Children | 0 (0.0%) | 0 (0.0%) |
| Total | 49 (94.2%) | 3 (5.8%) |
Income Below Poverty Among Single-Parent Households in Chiloquin
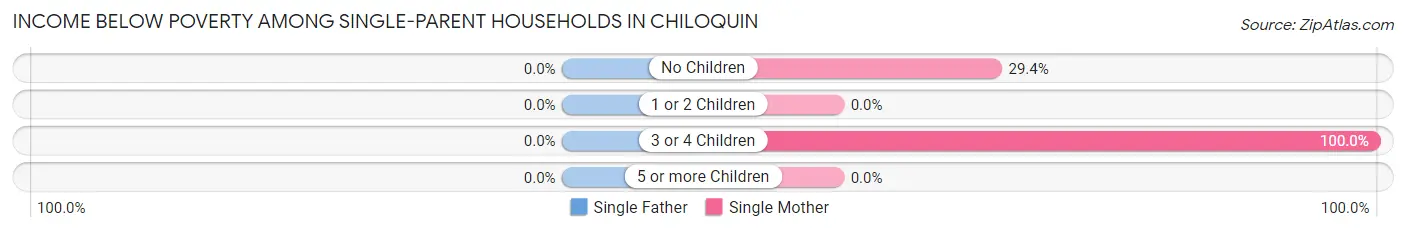
| Children | Single Father | Single Mother |
| No Children | 0 (0.0%) | 10 (29.4%) |
| 1 or 2 Children | 0 (0.0%) | 0 (0.0%) |
| 3 or 4 Children | 0 (0.0%) | 13 (100.0%) |
| 5 or more Children | 0 (0.0%) | 0 (0.0%) |
| Total | 0 (0.0%) | 23 (32.4%) |
Income Below Poverty Among Married-Couple vs Single-Parent Households in Chiloquin
The poverty data for Chiloquin shows that 3 of the married-couple family households (5.8%) and 23 of the single-parent households (19.2%) are living below the poverty level. Within the married-couple family households, those with 1 or 2 children have the highest poverty rate, with 1 households (6.2%) falling below the poverty line. Among the single-parent households, those with 3 or 4 children have the highest poverty rate, with 13 household (100.0%) living below poverty.
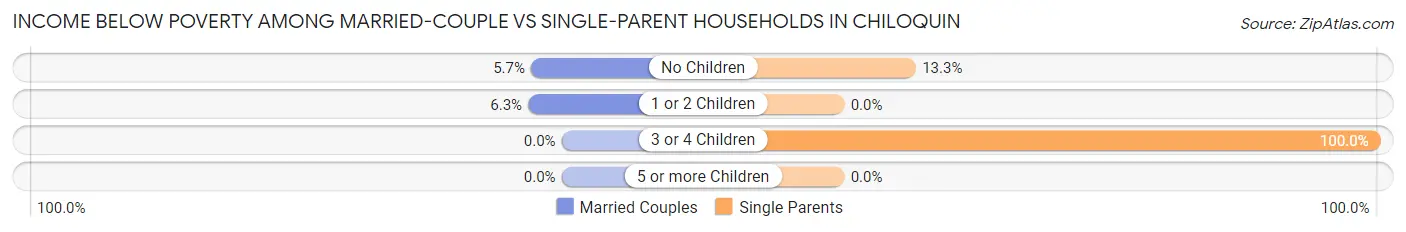
| Children | Married-Couple Families | Single-Parent Households |
| No Children | 2 (5.7%) | 10 (13.3%) |
| 1 or 2 Children | 1 (6.2%) | 0 (0.0%) |
| 3 or 4 Children | 0 (0.0%) | 13 (100.0%) |
| 5 or more Children | 0 (0.0%) | 0 (0.0%) |
| Total | 3 (5.8%) | 23 (19.2%) |
Race in Chiloquin
The most populous races in Chiloquin are Native / Alaskan (360 | 51.7%), White / Caucasian (301 | 43.2%), and Two or more Races (33 | 4.7%).
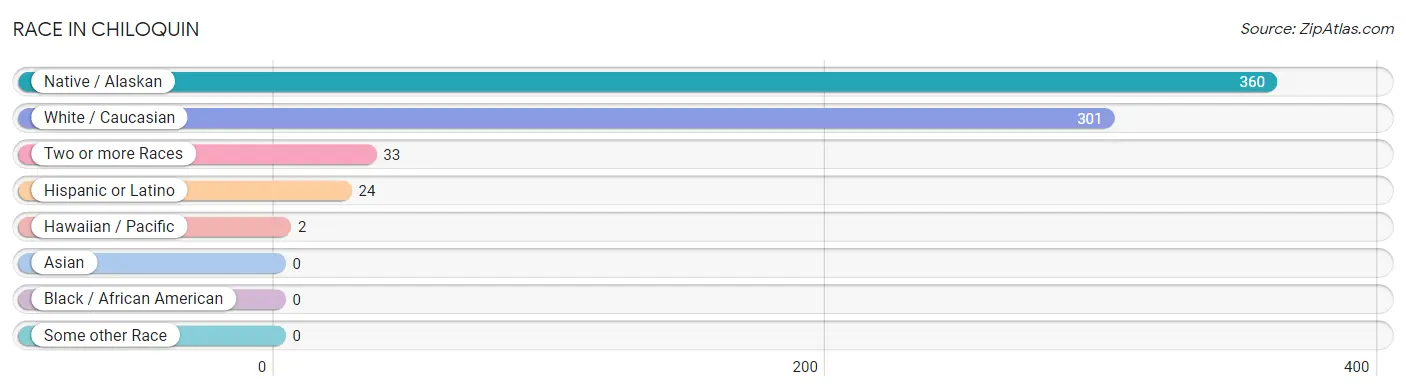
| Race | # Population | % Population |
| Asian | 0 | 0.0% |
| Black / African American | 0 | 0.0% |
| Hawaiian / Pacific | 2 | 0.3% |
| Hispanic or Latino | 24 | 3.5% |
| Native / Alaskan | 360 | 51.7% |
| White / Caucasian | 301 | 43.2% |
| Two or more Races | 33 | 4.7% |
| Some other Race | 0 | 0.0% |
| Total | 696 | 100.0% |
Ancestry in Chiloquin
The most populous ancestries reported in Chiloquin are German (94 | 13.5%), Irish (50 | 7.2%), English (25 | 3.6%), Scottish (23 | 3.3%), and Scotch-Irish (19 | 2.7%), together accounting for 30.3% of all Chiloquin residents.
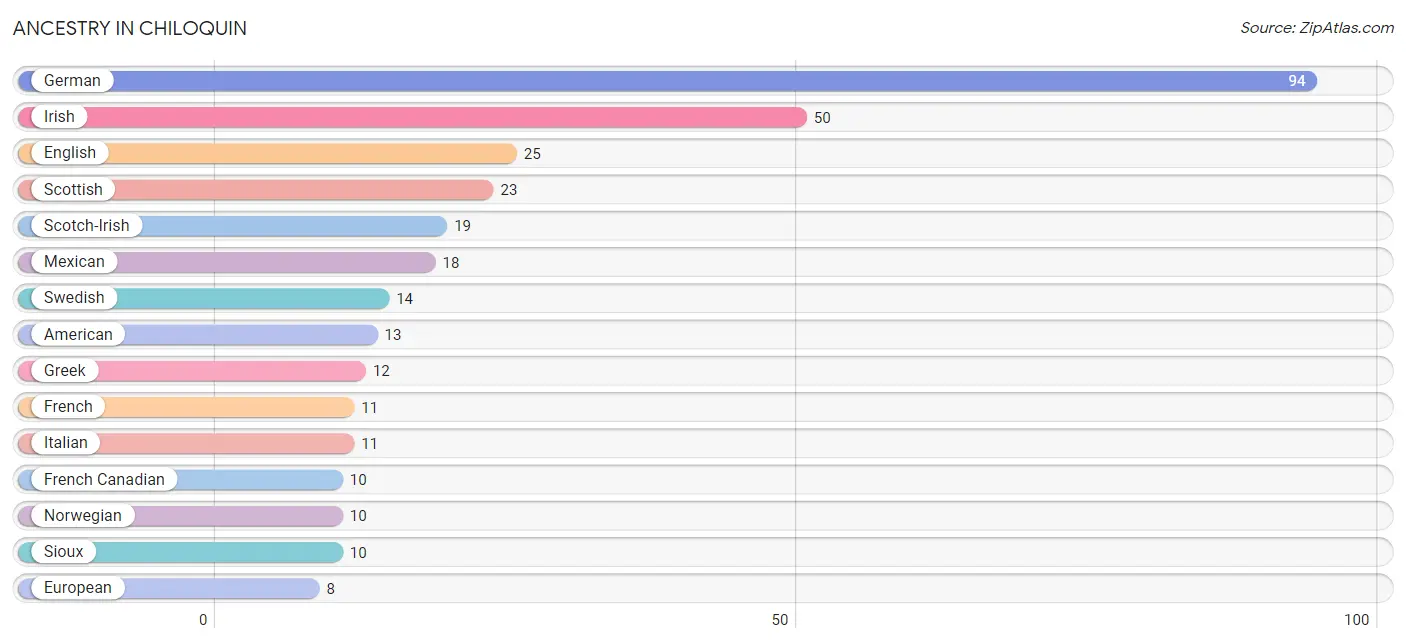
| Ancestry | # Population | % Population |
| American | 13 | 1.9% |
| Argentinean | 4 | 0.6% |
| Cherokee | 5 | 0.7% |
| Danish | 2 | 0.3% |
| English | 25 | 3.6% |
| European | 8 | 1.1% |
| French | 11 | 1.6% |
| French Canadian | 10 | 1.4% |
| German | 94 | 13.5% |
| Greek | 12 | 1.7% |
| Hungarian | 3 | 0.4% |
| Irish | 50 | 7.2% |
| Italian | 11 | 1.6% |
| Korean | 6 | 0.9% |
| Mexican | 18 | 2.6% |
| Native Hawaiian | 2 | 0.3% |
| Norwegian | 10 | 1.4% |
| Paiute | 1 | 0.1% |
| Pima | 1 | 0.1% |
| Portuguese | 3 | 0.4% |
| Puerto Rican | 2 | 0.3% |
| Scotch-Irish | 19 | 2.7% |
| Scottish | 23 | 3.3% |
| Sioux | 10 | 1.4% |
| South American | 4 | 0.6% |
| Swedish | 14 | 2.0% |
| Welsh | 8 | 1.1% | View All 27 Rows |
Immigrants in Chiloquin

| Immigration Origin | # Population | % Population | View All 0 Rows |
Sex and Age in Chiloquin
Sex and Age in Chiloquin
The most populous age groups in Chiloquin are 20 to 24 Years (58 | 15.9%) for men and 20 to 24 Years (46 | 13.9%) for women.
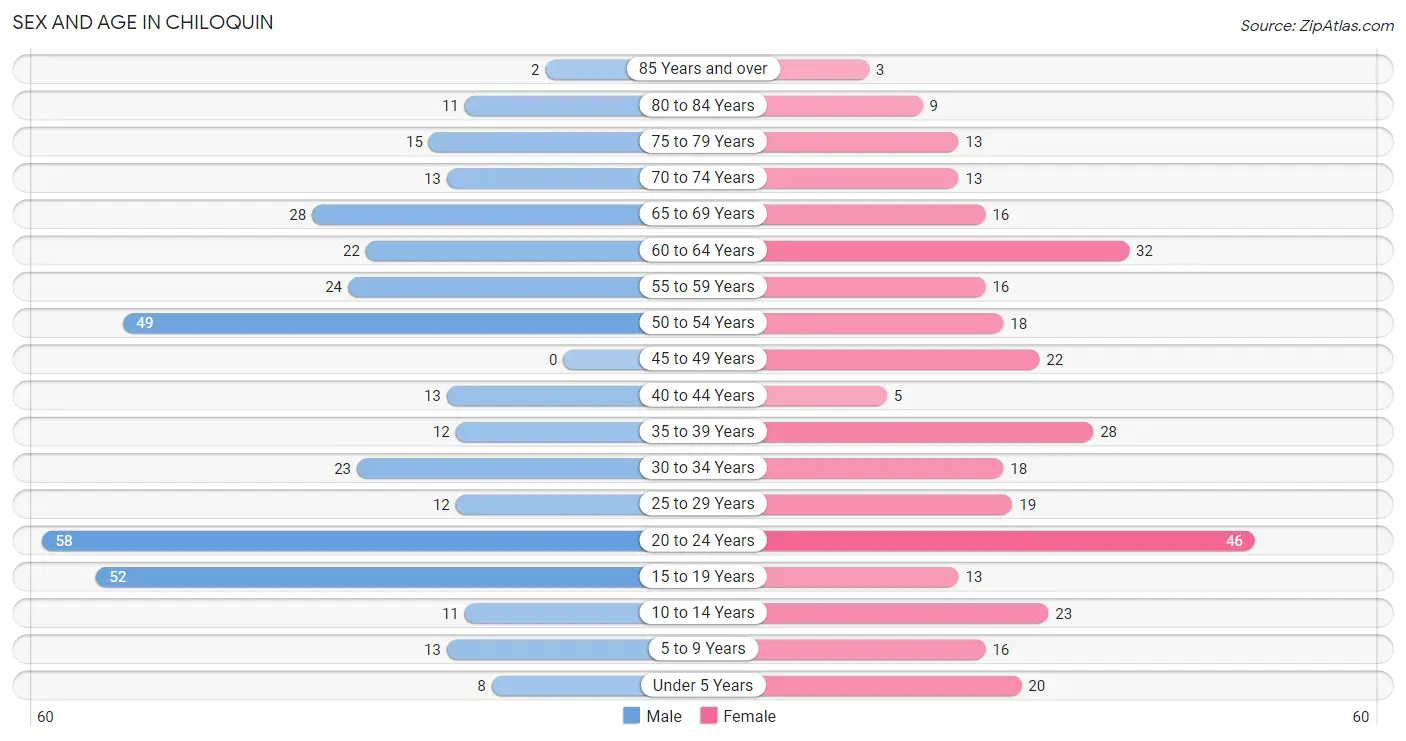
| Age Bracket | Male | Female |
| Under 5 Years | 8 (2.2%) | 20 (6.1%) |
| 5 to 9 Years | 13 (3.5%) | 16 (4.9%) |
| 10 to 14 Years | 11 (3.0%) | 23 (7.0%) |
| 15 to 19 Years | 52 (14.2%) | 13 (3.9%) |
| 20 to 24 Years | 58 (15.9%) | 46 (13.9%) |
| 25 to 29 Years | 12 (3.3%) | 19 (5.8%) |
| 30 to 34 Years | 23 (6.3%) | 18 (5.4%) |
| 35 to 39 Years | 12 (3.3%) | 28 (8.5%) |
| 40 to 44 Years | 13 (3.5%) | 5 (1.5%) |
| 45 to 49 Years | 0 (0.0%) | 22 (6.7%) |
| 50 to 54 Years | 49 (13.4%) | 18 (5.4%) |
| 55 to 59 Years | 24 (6.6%) | 16 (4.9%) |
| 60 to 64 Years | 22 (6.0%) | 32 (9.7%) |
| 65 to 69 Years | 28 (7.6%) | 16 (4.9%) |
| 70 to 74 Years | 13 (3.5%) | 13 (3.9%) |
| 75 to 79 Years | 15 (4.1%) | 13 (3.9%) |
| 80 to 84 Years | 11 (3.0%) | 9 (2.7%) |
| 85 Years and over | 2 (0.5%) | 3 (0.9%) |
| Total | 366 (100.0%) | 330 (100.0%) |
Families and Households in Chiloquin
Median Family Size in Chiloquin
The median family size in Chiloquin is 2.55 persons per family, with single female/mother families (71 | 41.3%) accounting for the largest median family size of 2.8 persons per family. On the other hand, single male/father families (49 | 28.5%) represent the smallest median family size with 1.96 persons per family.
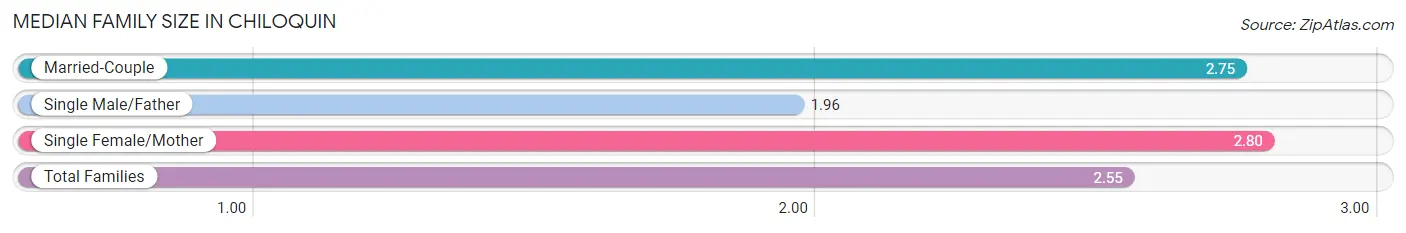
| Family Type | # Families | Family Size |
| Married-Couple | 52 (30.2%) | 2.75 |
| Single Male/Father | 49 (28.5%) | 1.96 |
| Single Female/Mother | 71 (41.3%) | 2.80 |
| Total Families | 172 (100.0%) | 2.55 |
Median Household Size in Chiloquin
The median household size in Chiloquin is 2.27 persons per household, with single female/mother households (71 | 23.2%) accounting for the largest median household size of 3.37 persons per household. non-family households (134 | 43.8%) represent the smallest median household size with 1.47 persons per household.
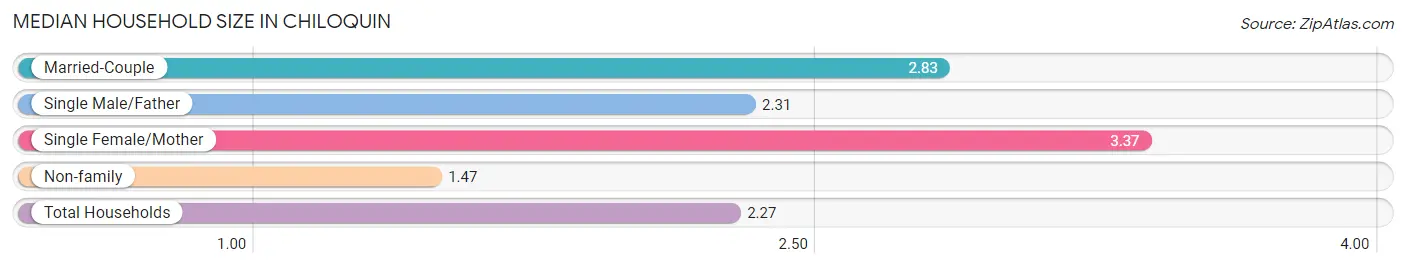
| Household Type | # Households | Household Size |
| Married-Couple | 52 (17.0%) | 2.83 |
| Single Male/Father | 49 (16.0%) | 2.31 |
| Single Female/Mother | 71 (23.2%) | 3.37 |
| Non-family | 134 (43.8%) | 1.47 |
| Total Households | 306 (100.0%) | 2.27 |
Household Size by Marriage Status in Chiloquin
Out of a total of 306 households in Chiloquin, 172 (56.2%) are family households, while 134 (43.8%) are nonfamily households. The most numerous type of family households are 2-person households, comprising 93, and the most common type of nonfamily households are 1-person households, comprising 103.
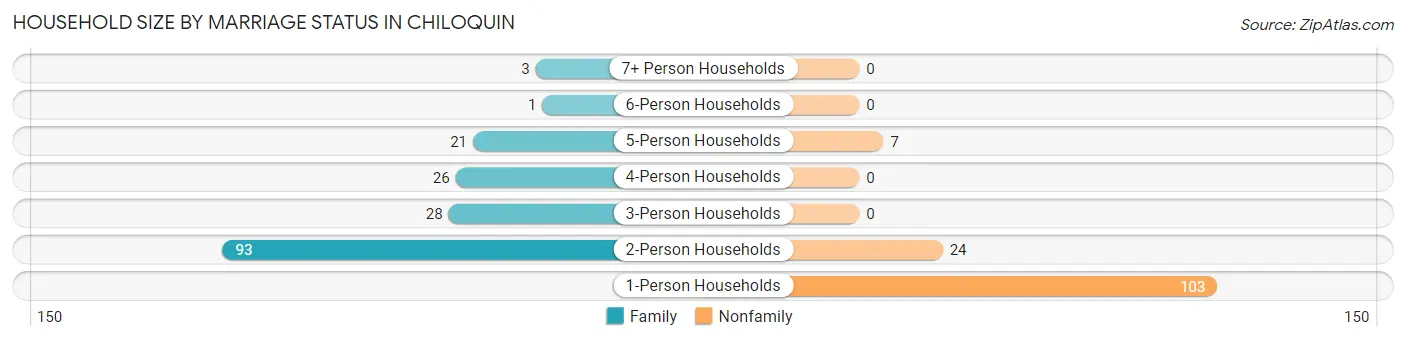
| Household Size | Family Households | Nonfamily Households |
| 1-Person Households | - | 103 (33.7%) |
| 2-Person Households | 93 (30.4%) | 24 (7.8%) |
| 3-Person Households | 28 (9.1%) | 0 (0.0%) |
| 4-Person Households | 26 (8.5%) | 0 (0.0%) |
| 5-Person Households | 21 (6.9%) | 7 (2.3%) |
| 6-Person Households | 1 (0.3%) | 0 (0.0%) |
| 7+ Person Households | 3 (1.0%) | 0 (0.0%) |
| Total | 172 (56.2%) | 134 (43.8%) |
Female Fertility in Chiloquin
Fertility by Age in Chiloquin
| Age Bracket | Women with Births | Births / 1,000 Women |
| 15 to 19 years | 0 (0.0%) | 0.0 |
| 20 to 34 years | 0 (0.0%) | 0.0 |
| 35 to 50 years | 0 (0.0%) | 0.0 |
| Total | 0 (0.0%) | 0.0 |
Fertility by Age by Marriage Status in Chiloquin
| Age Bracket | Married | Unmarried |
| 15 to 19 years | 0 (0.0%) | 0 (0.0%) |
| 20 to 34 years | 0 (0.0%) | 0 (0.0%) |
| 35 to 50 years | 0 (0.0%) | 0 (0.0%) |
| Total | 0 (0.0%) | 0 (0.0%) |
Fertility by Education in Chiloquin
| Educational Attainment | Women with Births | Births / 1,000 Women |
| Less than High School | 0 (0.0%) | 0.0 |
| High School Diploma | 0 (0.0%) | 0.0 |
| College or Associate's Degree | 0 (0.0%) | 0.0 |
| Bachelor's Degree | 0 (0.0%) | 0.0 |
| Graduate Degree | 0 (0.0%) | 0.0 |
| Total | 0 (0.0%) | 0.0 |
Fertility by Education by Marriage Status in Chiloquin
| Educational Attainment | Married | Unmarried |
| Less than High School | 0 (0.0%) | 0 (0.0%) |
| High School Diploma | 0 (0.0%) | 0 (0.0%) |
| College or Associate's Degree | 0 (0.0%) | 0 (0.0%) |
| Bachelor's Degree | 0 (0.0%) | 0 (0.0%) |
| Graduate Degree | 0 (0.0%) | 0 (0.0%) |
| Total | 0 (0.0%) | 0 (0.0%) |
Employment Characteristics in Chiloquin
Employment by Class of Employer in Chiloquin
Among the 247 employed individuals in Chiloquin, private company employees (120 | 48.6%), local government employees (69 | 27.9%), and federal government employees (34 | 13.8%) make up the most common classes of employment.
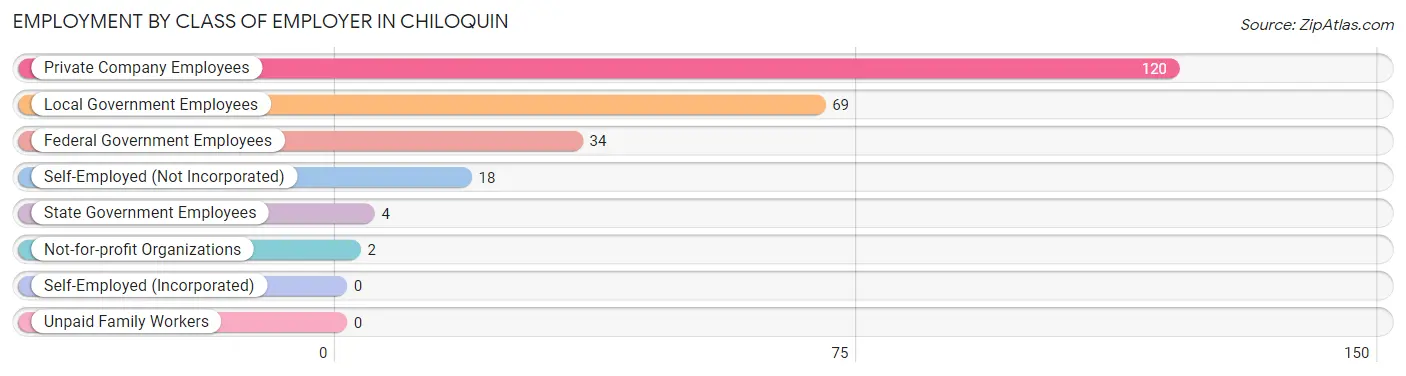
| Employer Class | # Employees | % Employees |
| Private Company Employees | 120 | 48.6% |
| Self-Employed (Incorporated) | 0 | 0.0% |
| Self-Employed (Not Incorporated) | 18 | 7.3% |
| Not-for-profit Organizations | 2 | 0.8% |
| Local Government Employees | 69 | 27.9% |
| State Government Employees | 4 | 1.6% |
| Federal Government Employees | 34 | 13.8% |
| Unpaid Family Workers | 0 | 0.0% |
| Total | 247 | 100.0% |
Employment Status by Age in Chiloquin
According to the labor force statistics for Chiloquin, out of the total population over 16 years of age (602), 56.0% or 337 individuals are in the labor force, with 25.2% or 85 of them unemployed. The age group with the highest labor force participation rate is 16 to 19 years, with 88.7% or 55 individuals in the labor force. Within the labor force, the 16 to 19 years age range has the highest percentage of unemployed individuals, with 70.9% or 39 of them being unemployed.
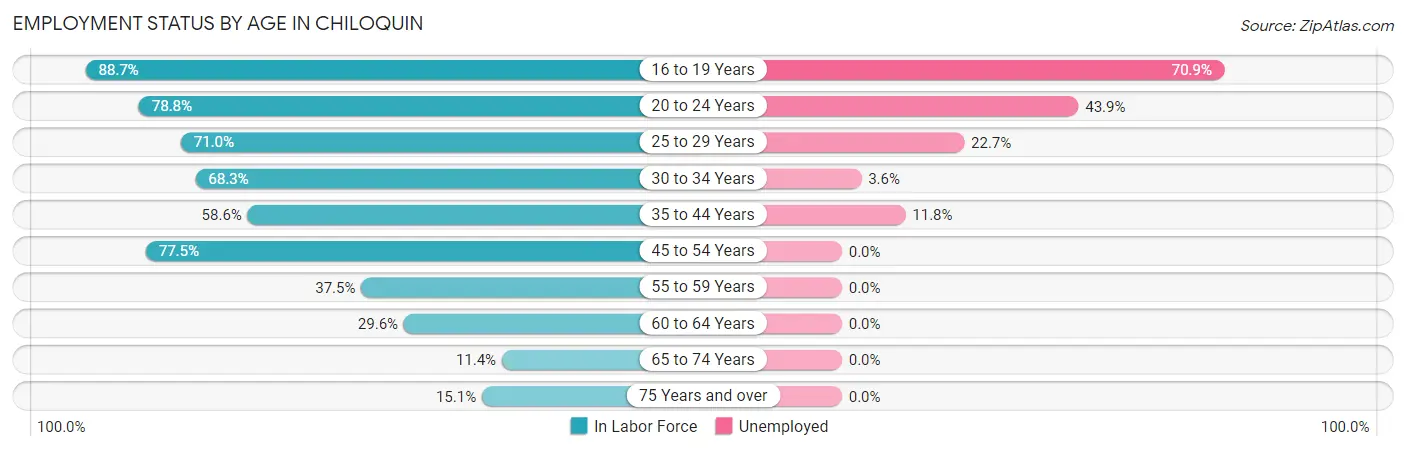
| Age Bracket | In Labor Force | Unemployed |
| 16 to 19 Years | 55 (88.7%) | 39 (70.9%) |
| 20 to 24 Years | 82 (78.8%) | 36 (43.9%) |
| 25 to 29 Years | 22 (71.0%) | 5 (22.7%) |
| 30 to 34 Years | 28 (68.3%) | 1 (3.6%) |
| 35 to 44 Years | 34 (58.6%) | 4 (11.8%) |
| 45 to 54 Years | 69 (77.5%) | 0 (0.0%) |
| 55 to 59 Years | 15 (37.5%) | 0 (0.0%) |
| 60 to 64 Years | 16 (29.6%) | 0 (0.0%) |
| 65 to 74 Years | 8 (11.4%) | 0 (0.0%) |
| 75 Years and over | 8 (15.1%) | 0 (0.0%) |
| Total | 337 (56.0%) | 85 (25.2%) |
Employment Status by Educational Attainment in Chiloquin
According to labor force statistics for Chiloquin, 58.8% of individuals (184) out of the total population between 25 and 64 years of age (313) are in the labor force, with 5.4% or 10 of them being unemployed. The group with the highest labor force participation rate are those with the educational attainment of bachelor's degree or higher, with 100.0% or 5 individuals in the labor force. Within the labor force, individuals with high school diploma education have the highest percentage of unemployment, with 12.7% or 10 of them being unemployed.
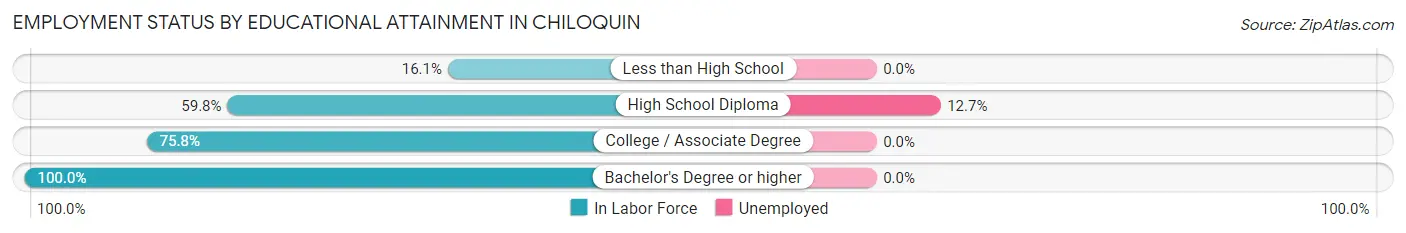
| Educational Attainment | In Labor Force | Unemployed |
| Less than High School | 9 (16.1%) | 0 (0.0%) |
| High School Diploma | 79 (59.8%) | 17 (12.7%) |
| College / Associate Degree | 91 (75.8%) | 0 (0.0%) |
| Bachelor's Degree or higher | 5 (100.0%) | 0 (0.0%) |
| Total | 184 (58.8%) | 17 (5.4%) |
Employment Occupations by Sex in Chiloquin
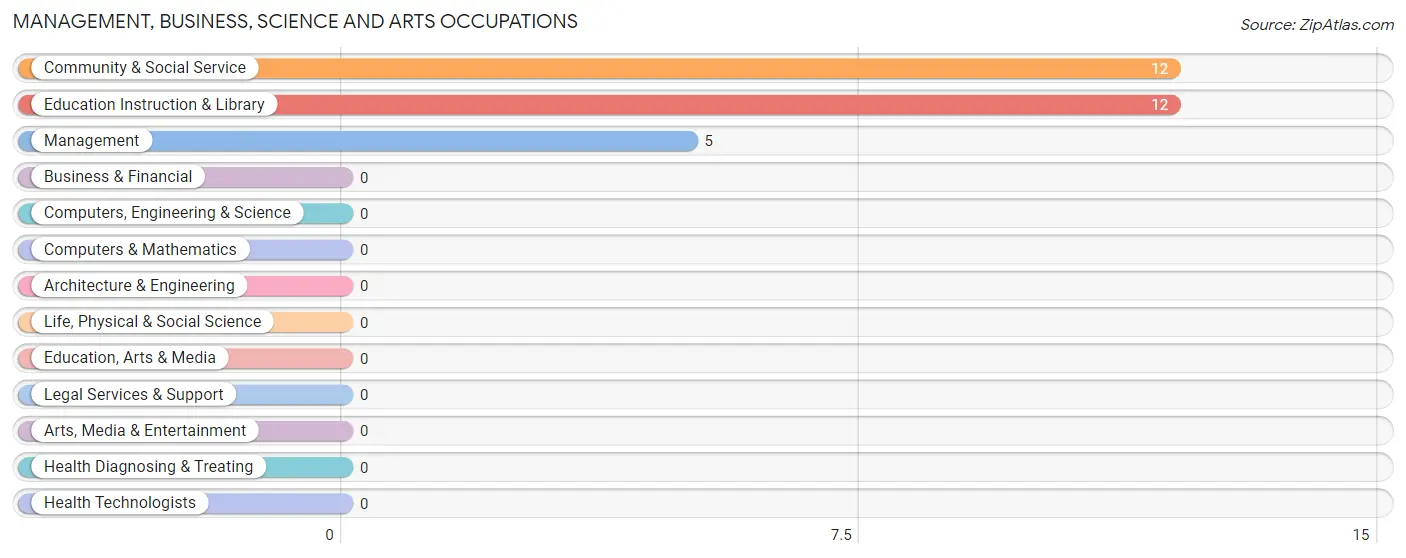
Management, Business, Science and Arts Occupations
The most common Management, Business, Science and Arts occupations in Chiloquin are Community & Social Service (12 | 4.8%), Education Instruction & Library (12 | 4.8%), and Management (5 | 2.0%).
Management, Business, Science and Arts Occupations by Sex
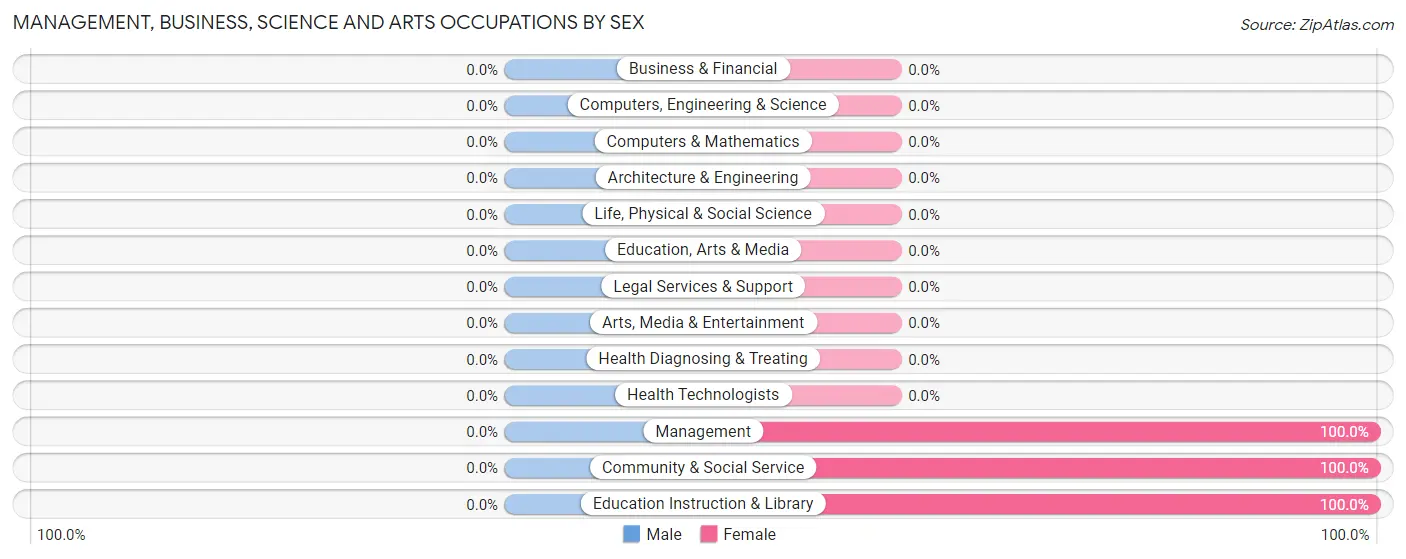
| Occupation | Male | Female |
| Management | 0 (0.0%) | 5 (100.0%) |
| Business & Financial | 0 (0.0%) | 0 (0.0%) |
| Computers, Engineering & Science | 0 (0.0%) | 0 (0.0%) |
| Computers & Mathematics | 0 (0.0%) | 0 (0.0%) |
| Architecture & Engineering | 0 (0.0%) | 0 (0.0%) |
| Life, Physical & Social Science | 0 (0.0%) | 0 (0.0%) |
| Community & Social Service | 0 (0.0%) | 12 (100.0%) |
| Education, Arts & Media | 0 (0.0%) | 0 (0.0%) |
| Legal Services & Support | 0 (0.0%) | 0 (0.0%) |
| Education Instruction & Library | 0 (0.0%) | 12 (100.0%) |
| Arts, Media & Entertainment | 0 (0.0%) | 0 (0.0%) |
| Health Diagnosing & Treating | 0 (0.0%) | 0 (0.0%) |
| Health Technologists | 0 (0.0%) | 0 (0.0%) |
| Total (Category) | 0 (0.0%) | 17 (100.0%) |
| Total (Overall) | 142 (56.4%) | 110 (43.6%) |
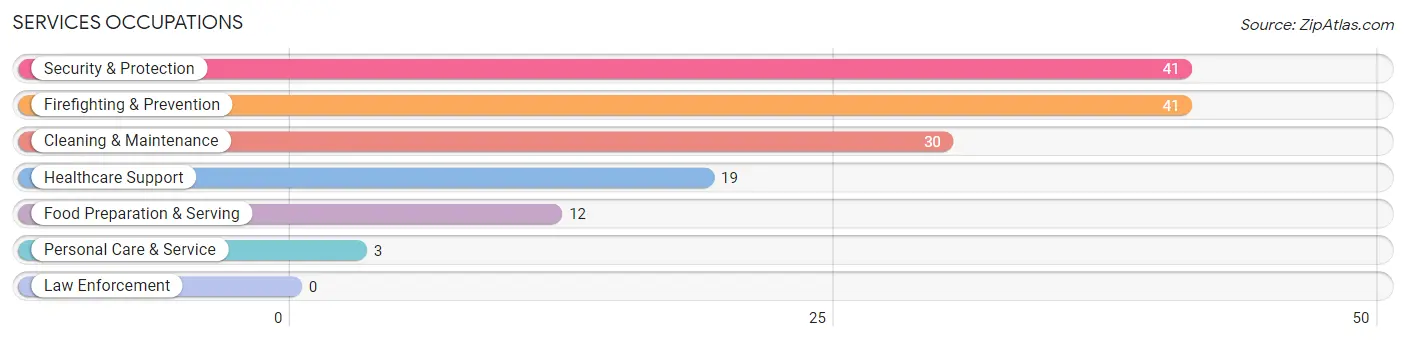
Services Occupations
The most common Services occupations in Chiloquin are Security & Protection (41 | 16.3%), Firefighting & Prevention (41 | 16.3%), Cleaning & Maintenance (30 | 11.9%), Healthcare Support (19 | 7.5%), and Food Preparation & Serving (12 | 4.8%).
Services Occupations by Sex
Within the Services occupations in Chiloquin, the most male-oriented occupations are Security & Protection (100.0%), Firefighting & Prevention (100.0%), and Cleaning & Maintenance (43.3%), while the most female-oriented occupations are Healthcare Support (100.0%), Food Preparation & Serving (100.0%), and Personal Care & Service (100.0%).
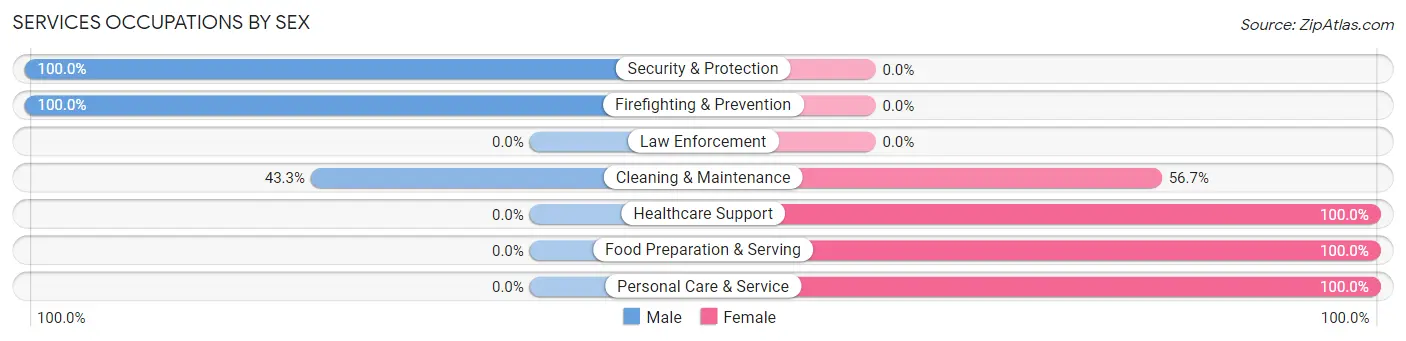
| Occupation | Male | Female |
| Healthcare Support | 0 (0.0%) | 19 (100.0%) |
| Security & Protection | 41 (100.0%) | 0 (0.0%) |
| Firefighting & Prevention | 41 (100.0%) | 0 (0.0%) |
| Law Enforcement | 0 (0.0%) | 0 (0.0%) |
| Food Preparation & Serving | 0 (0.0%) | 12 (100.0%) |
| Cleaning & Maintenance | 13 (43.3%) | 17 (56.7%) |
| Personal Care & Service | 0 (0.0%) | 3 (100.0%) |
| Total (Category) | 54 (51.4%) | 51 (48.6%) |
| Total (Overall) | 142 (56.4%) | 110 (43.6%) |
Sales and Office Occupations
The most common Sales and Office occupations in Chiloquin are , and Office & Administration (46 | 18.2%).
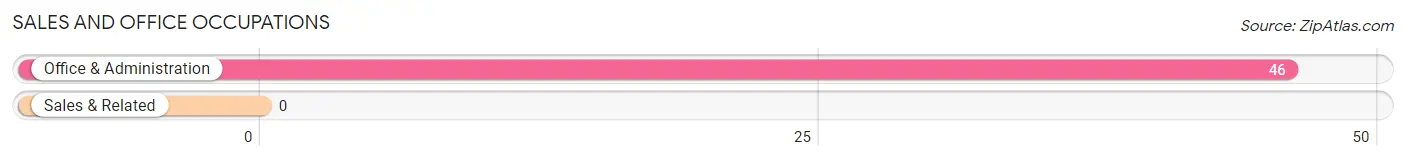
Sales and Office Occupations by Sex
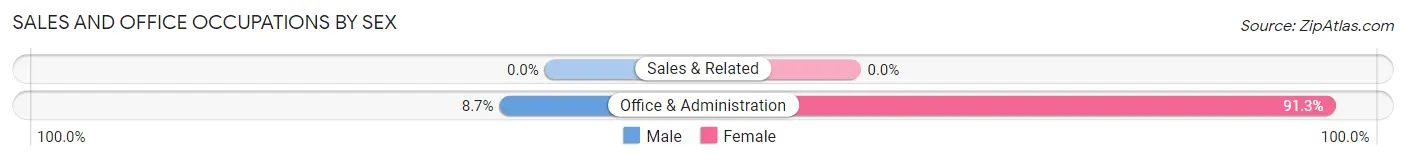
| Occupation | Male | Female |
| Sales & Related | 0 (0.0%) | 0 (0.0%) |
| Office & Administration | 4 (8.7%) | 42 (91.3%) |
| Total (Category) | 4 (8.7%) | 42 (91.3%) |
| Total (Overall) | 142 (56.4%) | 110 (43.6%) |
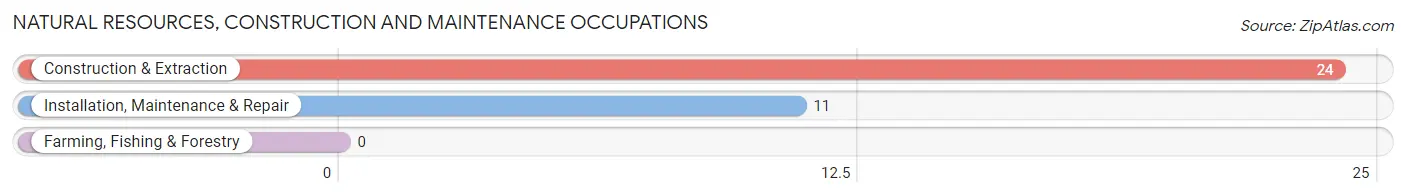
Natural Resources, Construction and Maintenance Occupations
The most common Natural Resources, Construction and Maintenance occupations in Chiloquin are Construction & Extraction (24 | 9.5%), and Installation, Maintenance & Repair (11 | 4.4%).
Natural Resources, Construction and Maintenance Occupations by Sex
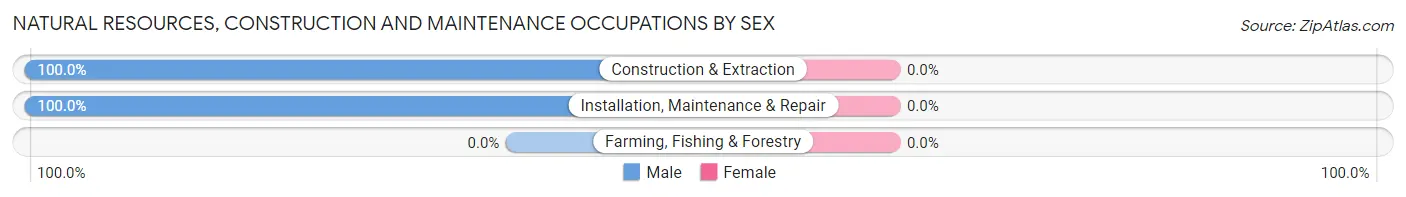
| Occupation | Male | Female |
| Farming, Fishing & Forestry | 0 (0.0%) | 0 (0.0%) |
| Construction & Extraction | 24 (100.0%) | 0 (0.0%) |
| Installation, Maintenance & Repair | 11 (100.0%) | 0 (0.0%) |
| Total (Category) | 35 (100.0%) | 0 (0.0%) |
| Total (Overall) | 142 (56.4%) | 110 (43.6%) |
Production, Transportation and Moving Occupations
The most common Production, Transportation and Moving occupations in Chiloquin are Material Moving (22 | 8.7%), Transportation (21 | 8.3%), and Production (6 | 2.4%).
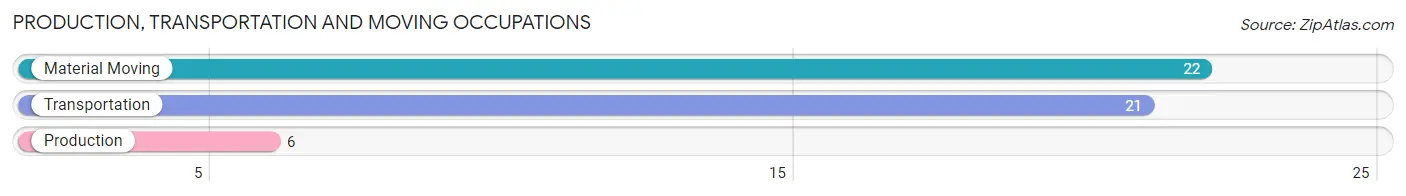
Production, Transportation and Moving Occupations by Sex
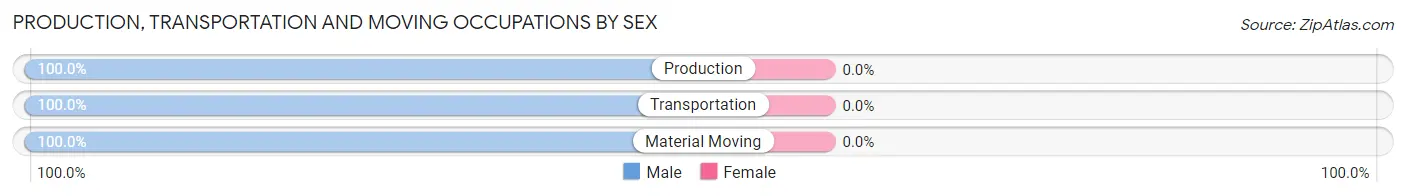
| Occupation | Male | Female |
| Production | 6 (100.0%) | 0 (0.0%) |
| Transportation | 21 (100.0%) | 0 (0.0%) |
| Material Moving | 22 (100.0%) | 0 (0.0%) |
| Total (Category) | 49 (100.0%) | 0 (0.0%) |
| Total (Overall) | 142 (56.4%) | 110 (43.6%) |
Employment Industries by Sex in Chiloquin
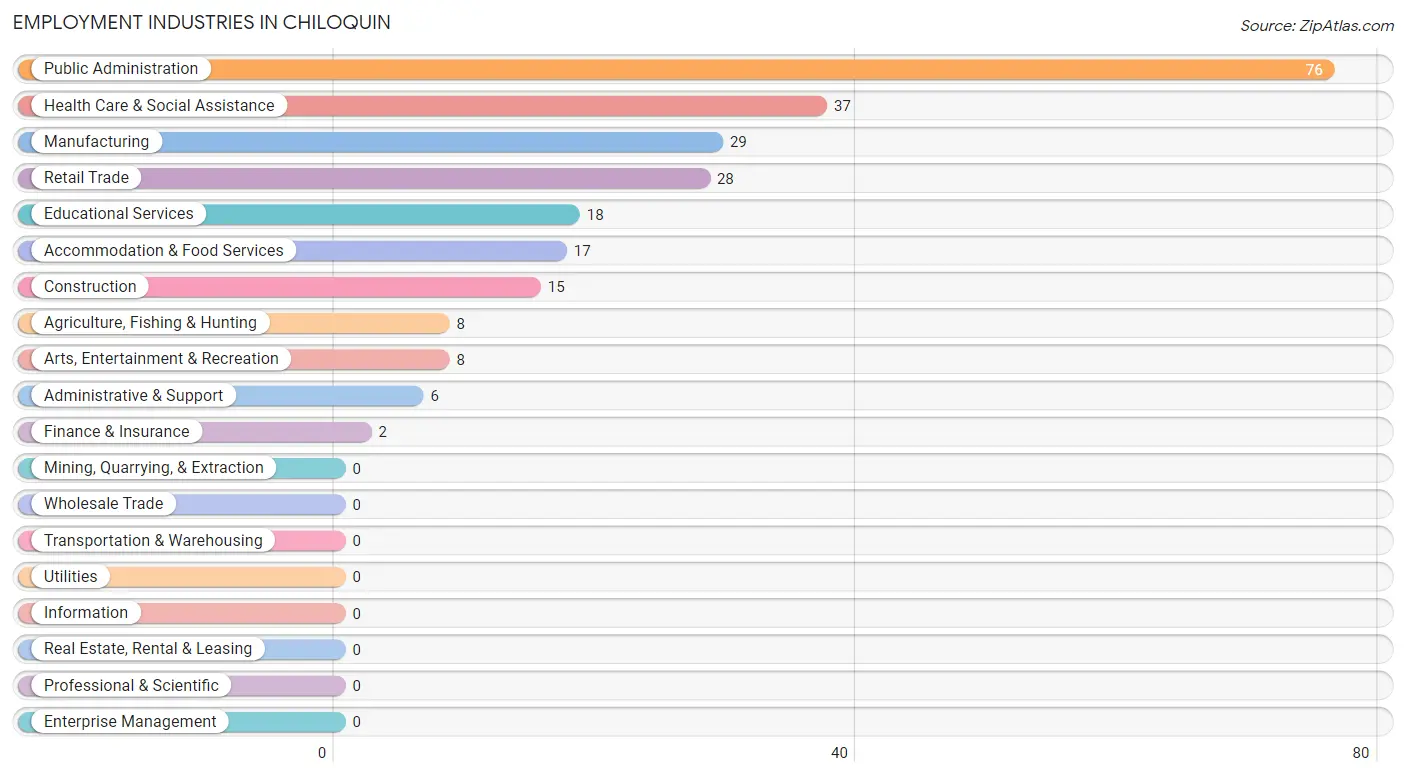
Employment Industries in Chiloquin
The major employment industries in Chiloquin include Public Administration (76 | 30.2%), Health Care & Social Assistance (37 | 14.7%), Manufacturing (29 | 11.5%), Retail Trade (28 | 11.1%), and Educational Services (18 | 7.1%).
Employment Industries by Sex in Chiloquin
The Chiloquin industries that see more men than women are Agriculture, Fishing & Hunting (100.0%), Construction (100.0%), and Manufacturing (100.0%), whereas the industries that tend to have a higher number of women are Finance & Insurance (100.0%), Educational Services (100.0%), and Health Care & Social Assistance (100.0%).
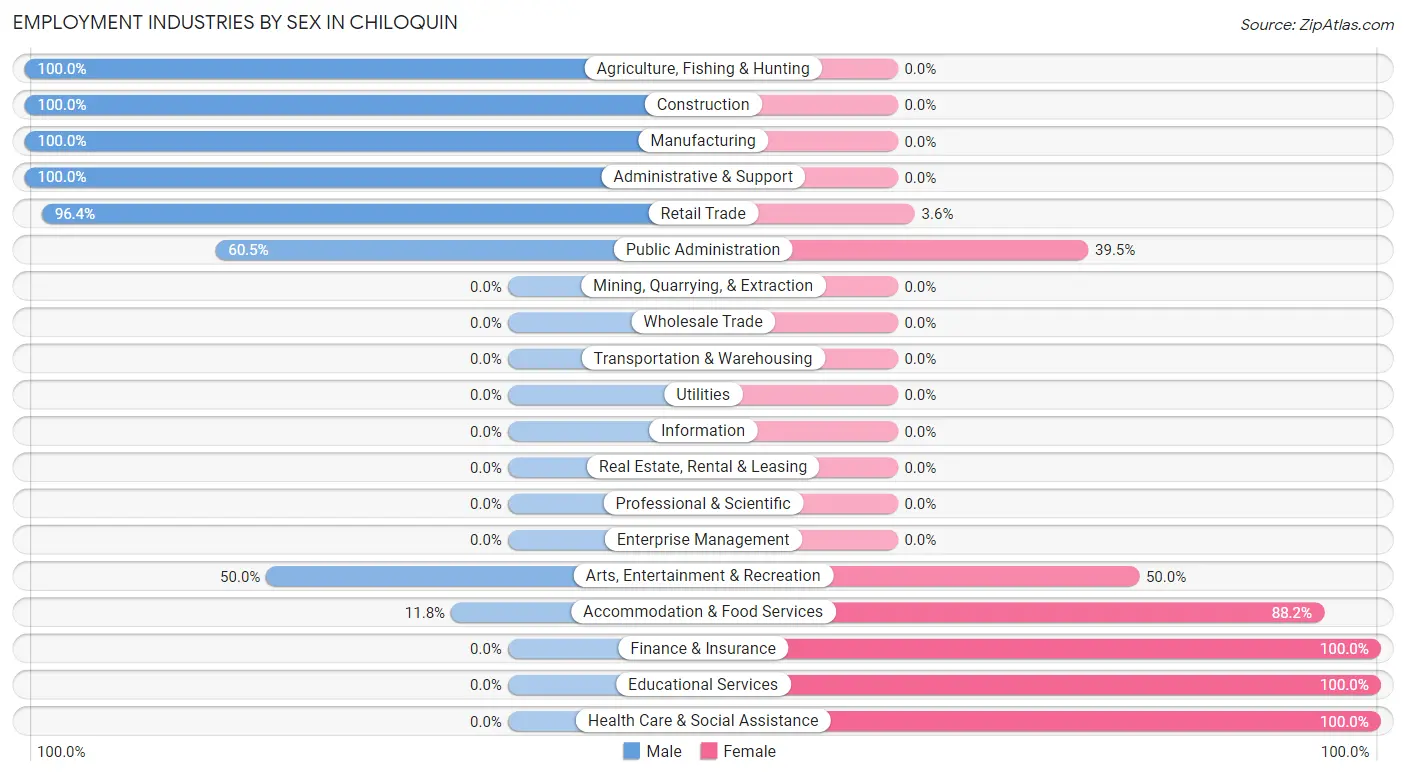
| Industry | Male | Female |
| Agriculture, Fishing & Hunting | 8 (100.0%) | 0 (0.0%) |
| Mining, Quarrying, & Extraction | 0 (0.0%) | 0 (0.0%) |
| Construction | 15 (100.0%) | 0 (0.0%) |
| Manufacturing | 29 (100.0%) | 0 (0.0%) |
| Wholesale Trade | 0 (0.0%) | 0 (0.0%) |
| Retail Trade | 27 (96.4%) | 1 (3.6%) |
| Transportation & Warehousing | 0 (0.0%) | 0 (0.0%) |
| Utilities | 0 (0.0%) | 0 (0.0%) |
| Information | 0 (0.0%) | 0 (0.0%) |
| Finance & Insurance | 0 (0.0%) | 2 (100.0%) |
| Real Estate, Rental & Leasing | 0 (0.0%) | 0 (0.0%) |
| Professional & Scientific | 0 (0.0%) | 0 (0.0%) |
| Enterprise Management | 0 (0.0%) | 0 (0.0%) |
| Administrative & Support | 6 (100.0%) | 0 (0.0%) |
| Educational Services | 0 (0.0%) | 18 (100.0%) |
| Health Care & Social Assistance | 0 (0.0%) | 37 (100.0%) |
| Arts, Entertainment & Recreation | 4 (50.0%) | 4 (50.0%) |
| Accommodation & Food Services | 2 (11.8%) | 15 (88.2%) |
| Public Administration | 46 (60.5%) | 30 (39.5%) |
| Total | 142 (56.4%) | 110 (43.6%) |
Education in Chiloquin
School Enrollment in Chiloquin
The most common levels of schooling among the 97 students in Chiloquin are middle school (30 | 30.9%), elementary school (24 | 24.7%), and college / undergraduate (21 | 21.6%).
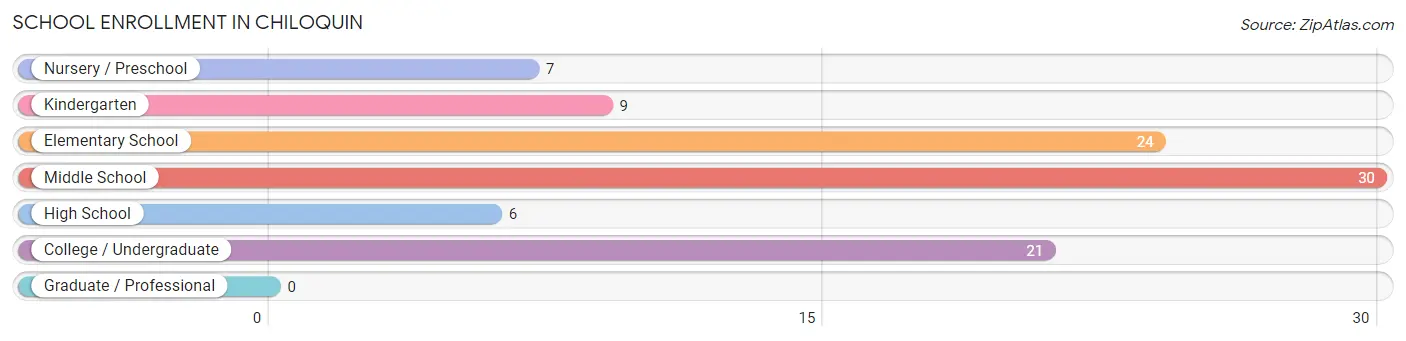
| School Level | # Students | % Students |
| Nursery / Preschool | 7 | 7.2% |
| Kindergarten | 9 | 9.3% |
| Elementary School | 24 | 24.7% |
| Middle School | 30 | 30.9% |
| High School | 6 | 6.2% |
| College / Undergraduate | 21 | 21.6% |
| Graduate / Professional | 0 | 0.0% |
| Total | 97 | 100.0% |
School Enrollment by Age by Funding Source in Chiloquin
Out of a total of 97 students who are enrolled in schools in Chiloquin, 1 (1.0%) attend a private institution, while the remaining 96 (99.0%) are enrolled in public schools. The age group of 35 years and over has the highest likelihood of being enrolled in private schools, with 1 (25.0% in the age bracket) enrolled. Conversely, the age group of 3 to 4 year olds has the lowest likelihood of being enrolled in a private school, with 7 (100.0% in the age bracket) attending a public institution.
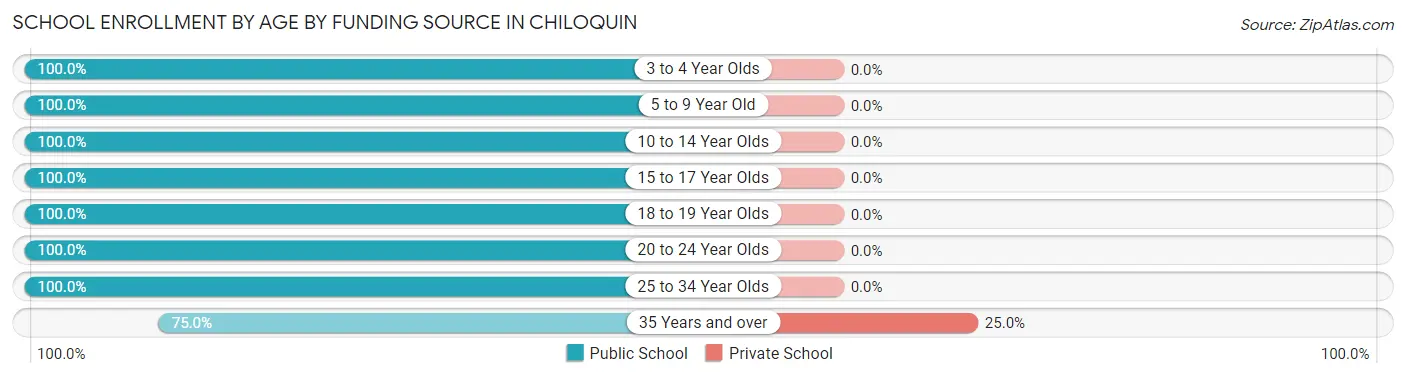
| Age Bracket | Public School | Private School |
| 3 to 4 Year Olds | 7 (100.0%) | 0 (0.0%) |
| 5 to 9 Year Old | 29 (100.0%) | 0 (0.0%) |
| 10 to 14 Year Olds | 34 (100.0%) | 0 (0.0%) |
| 15 to 17 Year Olds | 6 (100.0%) | 0 (0.0%) |
| 18 to 19 Year Olds | 10 (100.0%) | 0 (0.0%) |
| 20 to 24 Year Olds | 2 (100.0%) | 0 (0.0%) |
| 25 to 34 Year Olds | 5 (100.0%) | 0 (0.0%) |
| 35 Years and over | 3 (75.0%) | 1 (25.0%) |
| Total | 96 (99.0%) | 1 (1.0%) |
Educational Attainment by Field of Study in Chiloquin
Physical & health sciences (4 | 36.4%), business (4 | 36.4%), social sciences (2 | 18.2%), and science & technology (1 | 9.1%) are the most common fields of study among 11 individuals in Chiloquin who have obtained a bachelor's degree or higher.
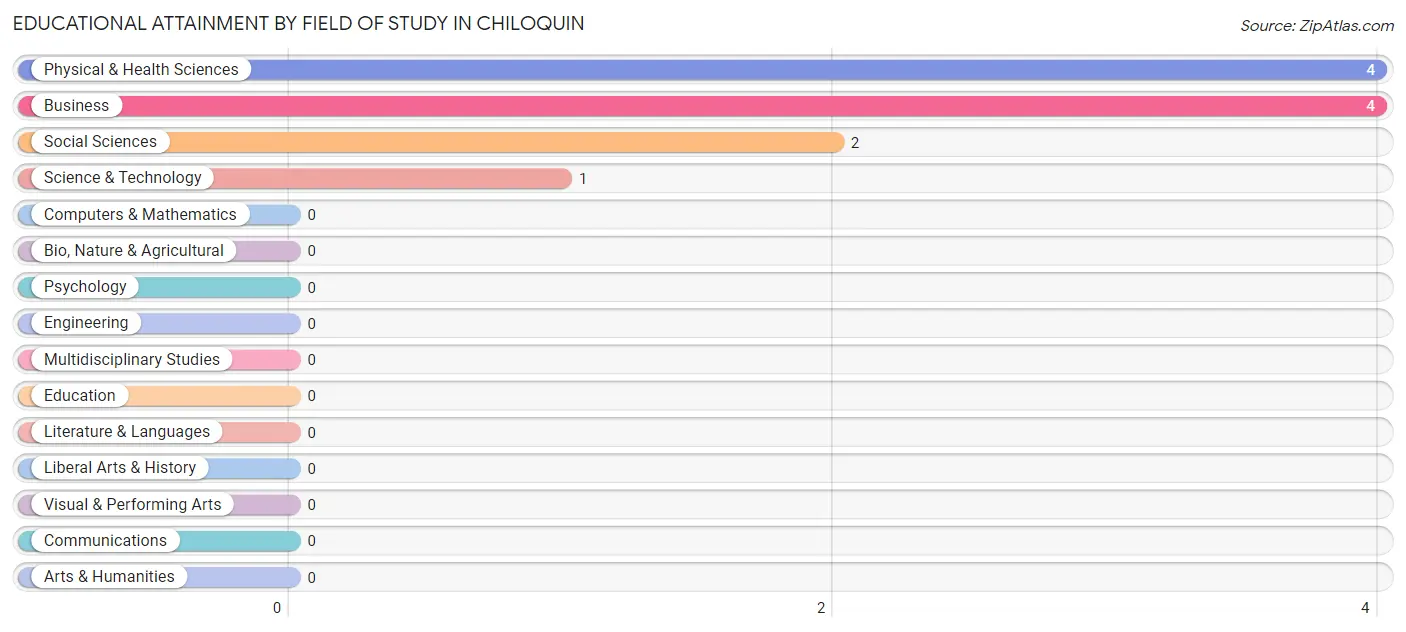
| Field of Study | # Graduates | % Graduates |
| Computers & Mathematics | 0 | 0.0% |
| Bio, Nature & Agricultural | 0 | 0.0% |
| Physical & Health Sciences | 4 | 36.4% |
| Psychology | 0 | 0.0% |
| Social Sciences | 2 | 18.2% |
| Engineering | 0 | 0.0% |
| Multidisciplinary Studies | 0 | 0.0% |
| Science & Technology | 1 | 9.1% |
| Business | 4 | 36.4% |
| Education | 0 | 0.0% |
| Literature & Languages | 0 | 0.0% |
| Liberal Arts & History | 0 | 0.0% |
| Visual & Performing Arts | 0 | 0.0% |
| Communications | 0 | 0.0% |
| Arts & Humanities | 0 | 0.0% |
| Total | 11 | 100.0% |
Transportation & Commute in Chiloquin
Vehicle Availability by Sex in Chiloquin
The most prevalent vehicle ownership categories in Chiloquin are males with 2 vehicles (72, accounting for 52.5%) and females with 2 vehicles (32, making up 65.4%).
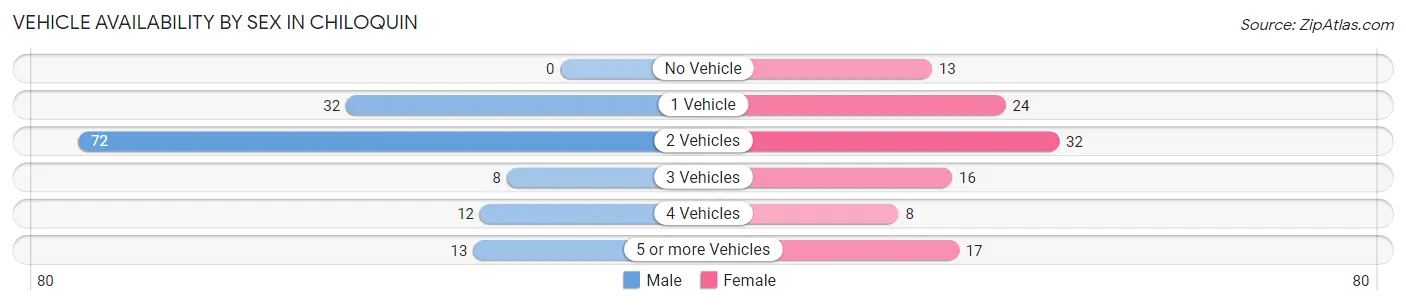
| Vehicles Available | Male | Female |
| No Vehicle | 0 (0.0%) | 13 (11.8%) |
| 1 Vehicle | 32 (23.4%) | 24 (21.8%) |
| 2 Vehicles | 72 (52.5%) | 32 (29.1%) |
| 3 Vehicles | 8 (5.8%) | 16 (14.5%) |
| 4 Vehicles | 12 (8.8%) | 8 (7.3%) |
| 5 or more Vehicles | 13 (9.5%) | 17 (15.4%) |
| Total | 137 (100.0%) | 110 (100.0%) |
Commute Time in Chiloquin
The most frequently occuring commute durations in Chiloquin are 5 to 9 minutes (56 commuters, 25.0%), 10 to 14 minutes (44 commuters, 19.6%), and 15 to 19 minutes (31 commuters, 13.8%).
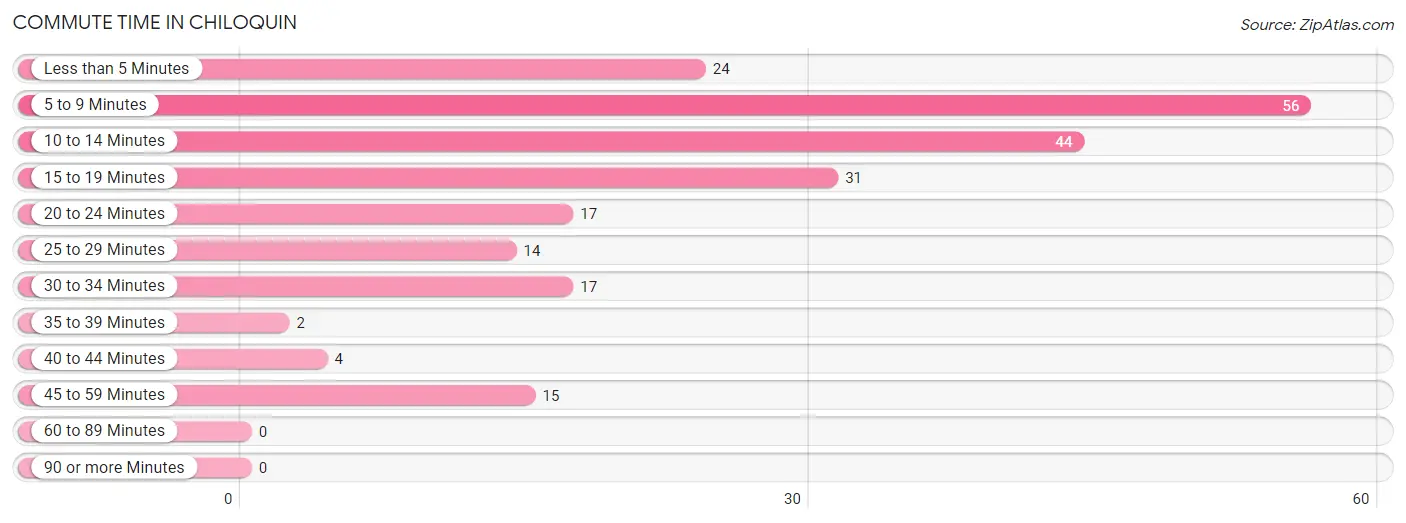
| Commute Time | # Commuters | % Commuters |
| Less than 5 Minutes | 24 | 10.7% |
| 5 to 9 Minutes | 56 | 25.0% |
| 10 to 14 Minutes | 44 | 19.6% |
| 15 to 19 Minutes | 31 | 13.8% |
| 20 to 24 Minutes | 17 | 7.6% |
| 25 to 29 Minutes | 14 | 6.2% |
| 30 to 34 Minutes | 17 | 7.6% |
| 35 to 39 Minutes | 2 | 0.9% |
| 40 to 44 Minutes | 4 | 1.8% |
| 45 to 59 Minutes | 15 | 6.7% |
| 60 to 89 Minutes | 0 | 0.0% |
| 90 or more Minutes | 0 | 0.0% |
Commute Time by Sex in Chiloquin
The most common commute times in Chiloquin are 5 to 9 minutes (44 commuters, 33.9%) for males and 10 to 14 minutes (31 commuters, 33.0%) for females.
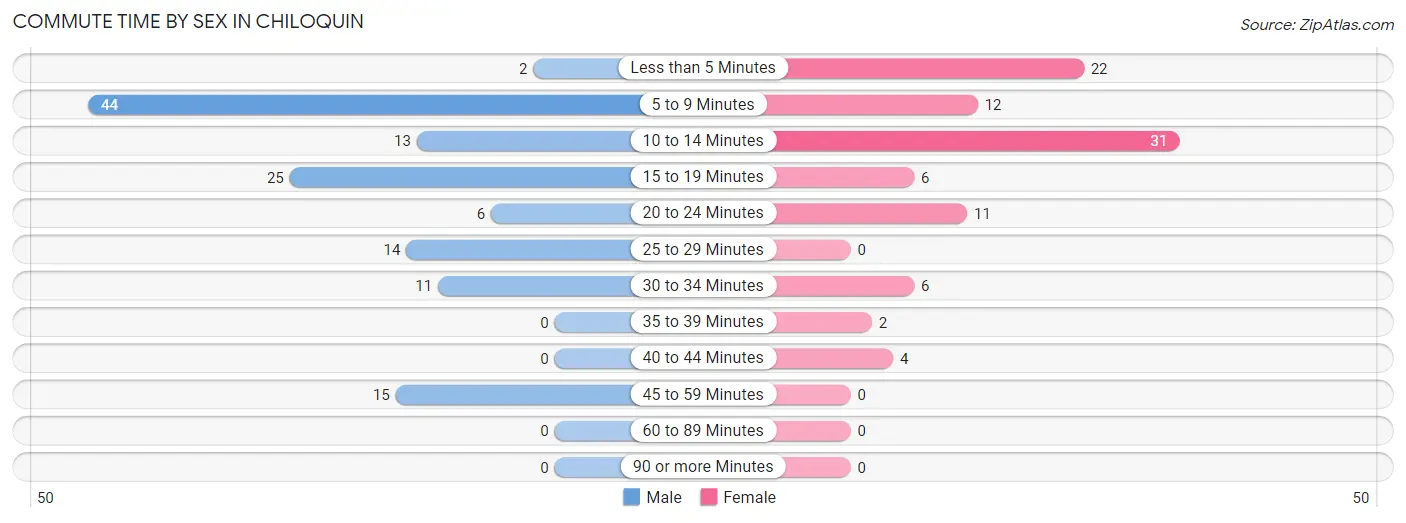
| Commute Time | Male | Female |
| Less than 5 Minutes | 2 (1.5%) | 22 (23.4%) |
| 5 to 9 Minutes | 44 (33.9%) | 12 (12.8%) |
| 10 to 14 Minutes | 13 (10.0%) | 31 (33.0%) |
| 15 to 19 Minutes | 25 (19.2%) | 6 (6.4%) |
| 20 to 24 Minutes | 6 (4.6%) | 11 (11.7%) |
| 25 to 29 Minutes | 14 (10.8%) | 0 (0.0%) |
| 30 to 34 Minutes | 11 (8.5%) | 6 (6.4%) |
| 35 to 39 Minutes | 0 (0.0%) | 2 (2.1%) |
| 40 to 44 Minutes | 0 (0.0%) | 4 (4.3%) |
| 45 to 59 Minutes | 15 (11.5%) | 0 (0.0%) |
| 60 to 89 Minutes | 0 (0.0%) | 0 (0.0%) |
| 90 or more Minutes | 0 (0.0%) | 0 (0.0%) |
Time of Departure to Work by Sex in Chiloquin
The most frequent times of departure to work in Chiloquin are 8:00 AM to 8:29 AM (41, 31.5%) for males and 7:30 AM to 7:59 AM (43, 45.7%) for females.
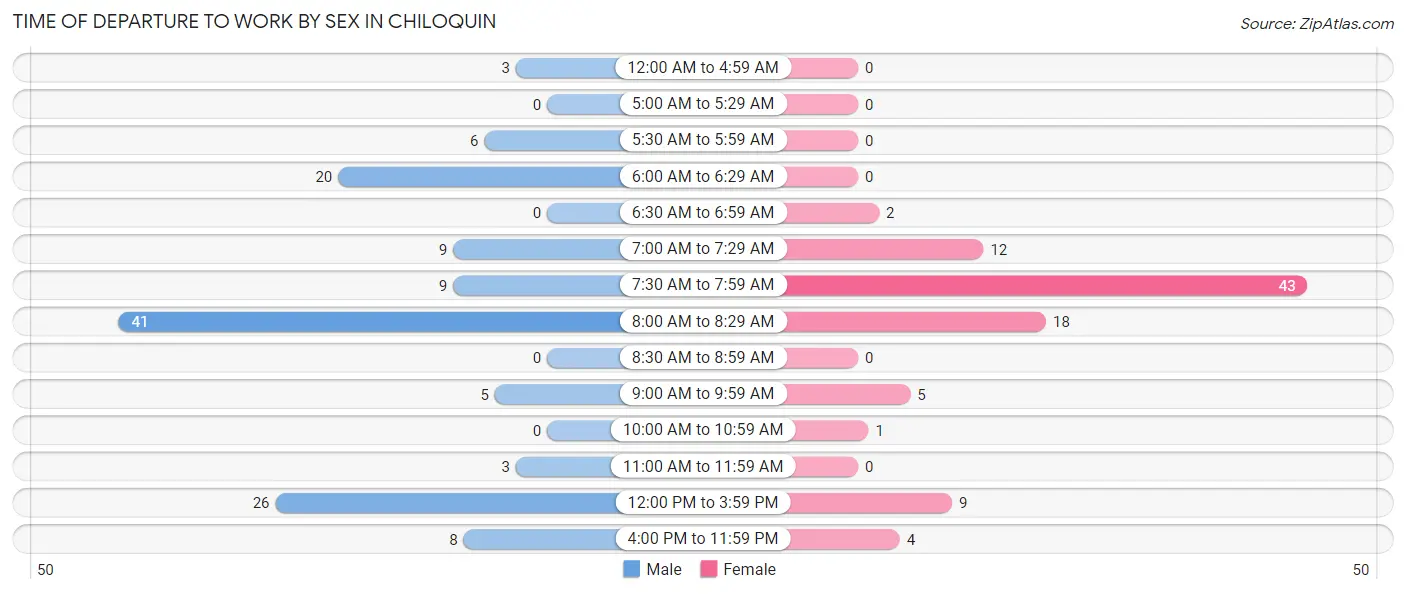
| Time of Departure | Male | Female |
| 12:00 AM to 4:59 AM | 3 (2.3%) | 0 (0.0%) |
| 5:00 AM to 5:29 AM | 0 (0.0%) | 0 (0.0%) |
| 5:30 AM to 5:59 AM | 6 (4.6%) | 0 (0.0%) |
| 6:00 AM to 6:29 AM | 20 (15.4%) | 0 (0.0%) |
| 6:30 AM to 6:59 AM | 0 (0.0%) | 2 (2.1%) |
| 7:00 AM to 7:29 AM | 9 (6.9%) | 12 (12.8%) |
| 7:30 AM to 7:59 AM | 9 (6.9%) | 43 (45.7%) |
| 8:00 AM to 8:29 AM | 41 (31.5%) | 18 (19.2%) |
| 8:30 AM to 8:59 AM | 0 (0.0%) | 0 (0.0%) |
| 9:00 AM to 9:59 AM | 5 (3.8%) | 5 (5.3%) |
| 10:00 AM to 10:59 AM | 0 (0.0%) | 1 (1.1%) |
| 11:00 AM to 11:59 AM | 3 (2.3%) | 0 (0.0%) |
| 12:00 PM to 3:59 PM | 26 (20.0%) | 9 (9.6%) |
| 4:00 PM to 11:59 PM | 8 (6.1%) | 4 (4.3%) |
| Total | 130 (100.0%) | 94 (100.0%) |
Housing Occupancy in Chiloquin
Occupancy by Ownership in Chiloquin
Of the total 306 dwellings in Chiloquin, owner-occupied units account for 207 (67.6%), while renter-occupied units make up 99 (32.4%).
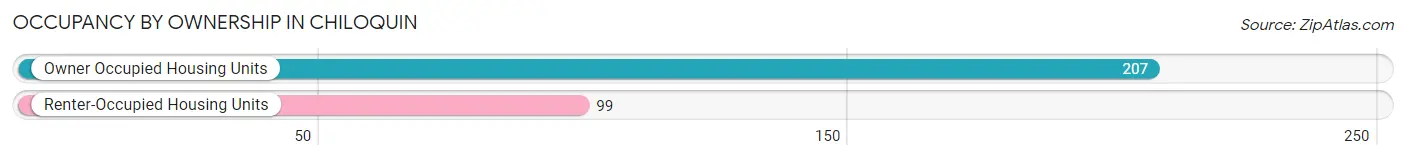
| Occupancy | # Housing Units | % Housing Units |
| Owner Occupied Housing Units | 207 | 67.6% |
| Renter-Occupied Housing Units | 99 | 32.4% |
| Total Occupied Housing Units | 306 | 100.0% |
Occupancy by Household Size in Chiloquin
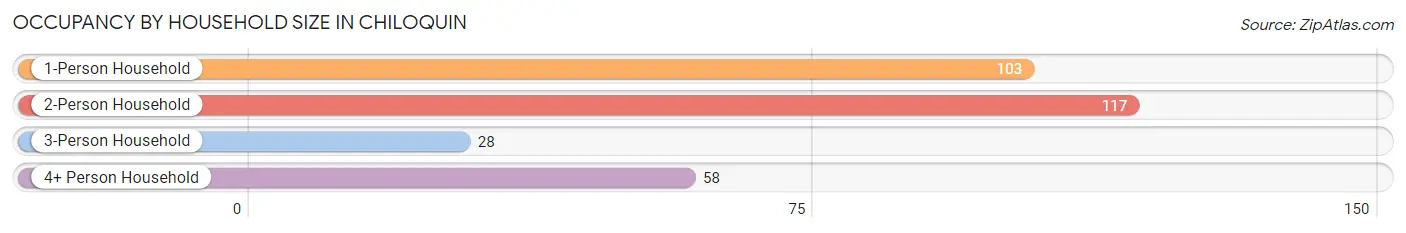
| Household Size | # Housing Units | % Housing Units |
| 1-Person Household | 103 | 33.7% |
| 2-Person Household | 117 | 38.2% |
| 3-Person Household | 28 | 9.1% |
| 4+ Person Household | 58 | 19.0% |
| Total Housing Units | 306 | 100.0% |
Occupancy by Ownership by Household Size in Chiloquin
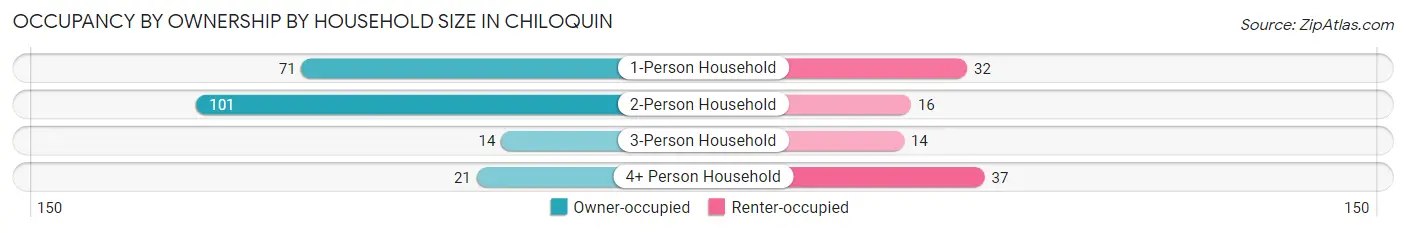
| Household Size | Owner-occupied | Renter-occupied |
| 1-Person Household | 71 (68.9%) | 32 (31.1%) |
| 2-Person Household | 101 (86.3%) | 16 (13.7%) |
| 3-Person Household | 14 (50.0%) | 14 (50.0%) |
| 4+ Person Household | 21 (36.2%) | 37 (63.8%) |
| Total Housing Units | 207 (67.6%) | 99 (32.4%) |
Occupancy by Educational Attainment in Chiloquin
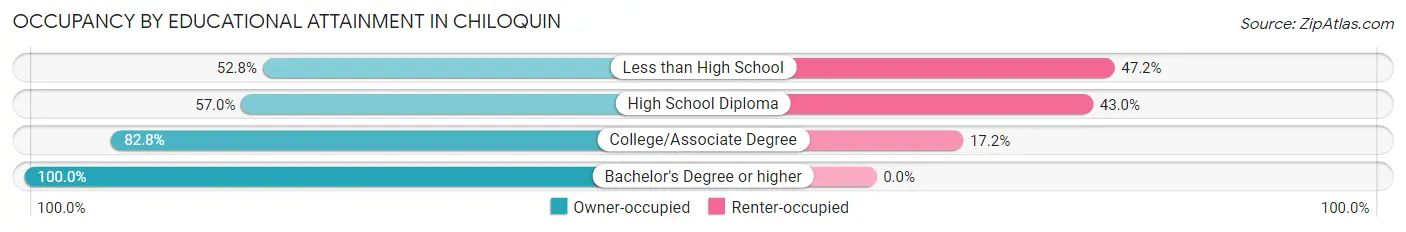
| Household Size | Owner-occupied | Renter-occupied |
| Less than High School | 19 (52.8%) | 17 (47.2%) |
| High School Diploma | 81 (57.0%) | 61 (43.0%) |
| College/Associate Degree | 101 (82.8%) | 21 (17.2%) |
| Bachelor's Degree or higher | 6 (100.0%) | 0 (0.0%) |
Occupancy by Age of Householder in Chiloquin
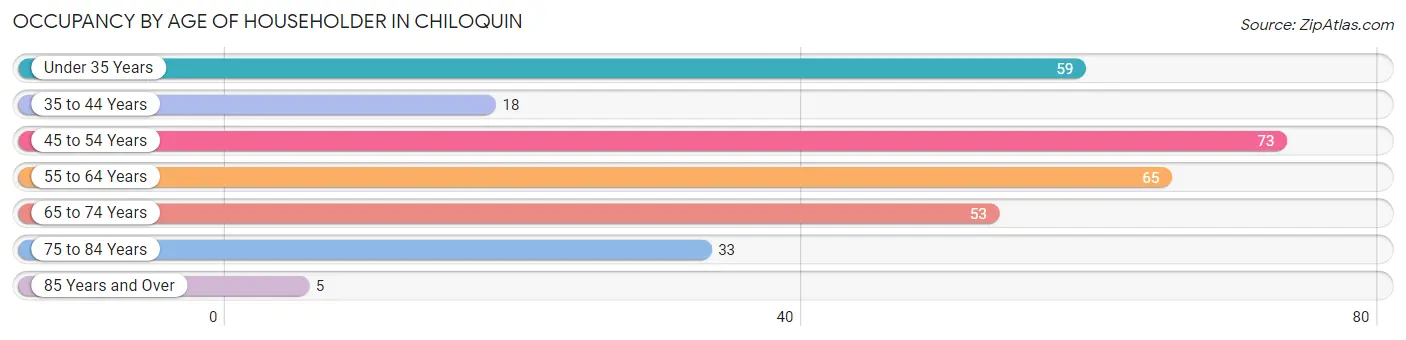
| Age Bracket | # Households | % Households |
| Under 35 Years | 59 | 19.3% |
| 35 to 44 Years | 18 | 5.9% |
| 45 to 54 Years | 73 | 23.9% |
| 55 to 64 Years | 65 | 21.2% |
| 65 to 74 Years | 53 | 17.3% |
| 75 to 84 Years | 33 | 10.8% |
| 85 Years and Over | 5 | 1.6% |
| Total | 306 | 100.0% |
Housing Finances in Chiloquin
Median Income by Occupancy in Chiloquin
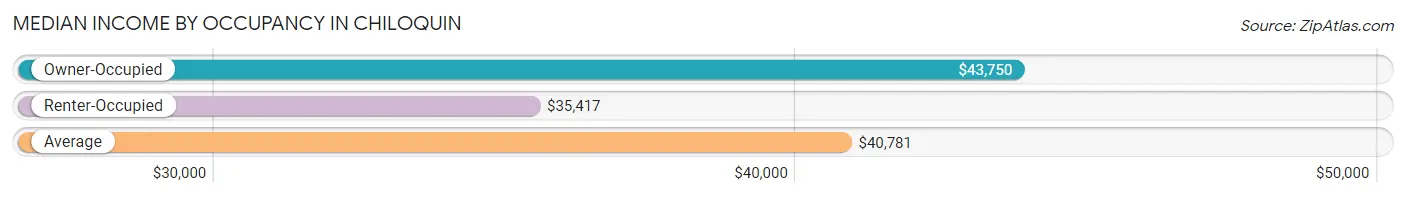
| Occupancy Type | # Households | Median Income |
| Owner-Occupied | 207 (67.6%) | $43,750 |
| Renter-Occupied | 99 (32.4%) | $35,417 |
| Average | 306 (100.0%) | $40,781 |
Occupancy by Householder Income Bracket in Chiloquin
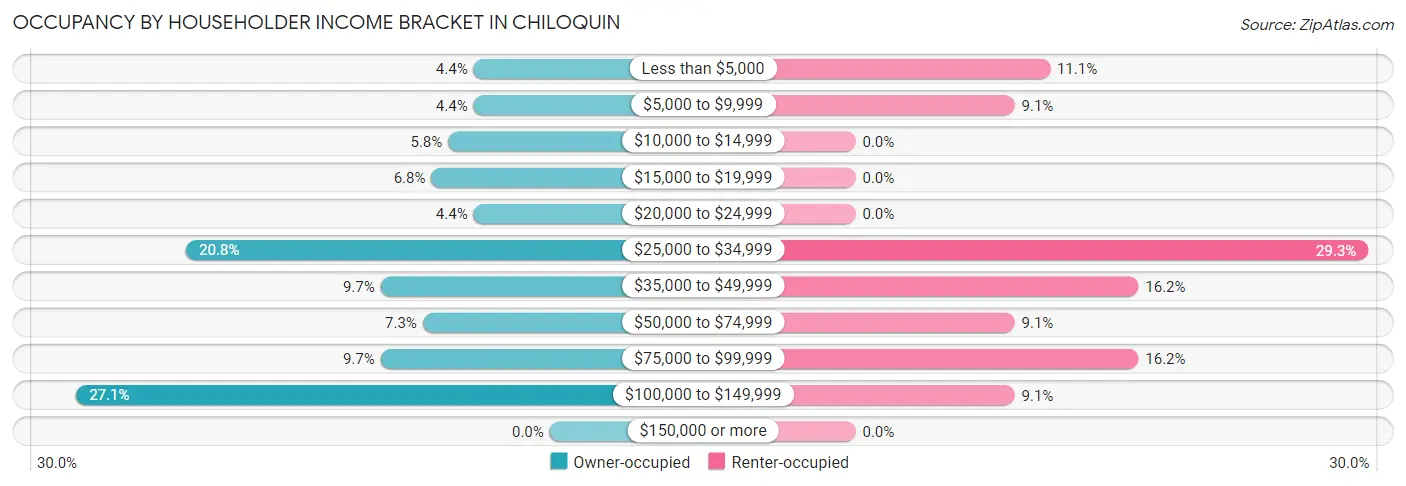
| Income Bracket | Owner-occupied | Renter-occupied |
| Less than $5,000 | 9 (4.3%) | 11 (11.1%) |
| $5,000 to $9,999 | 9 (4.3%) | 9 (9.1%) |
| $10,000 to $14,999 | 12 (5.8%) | 0 (0.0%) |
| $15,000 to $19,999 | 14 (6.8%) | 0 (0.0%) |
| $20,000 to $24,999 | 9 (4.3%) | 0 (0.0%) |
| $25,000 to $34,999 | 43 (20.8%) | 29 (29.3%) |
| $35,000 to $49,999 | 20 (9.7%) | 16 (16.2%) |
| $50,000 to $74,999 | 15 (7.2%) | 9 (9.1%) |
| $75,000 to $99,999 | 20 (9.7%) | 16 (16.2%) |
| $100,000 to $149,999 | 56 (27.1%) | 9 (9.1%) |
| $150,000 or more | 0 (0.0%) | 0 (0.0%) |
| Total | 207 (100.0%) | 99 (100.0%) |
Monthly Housing Cost Tiers in Chiloquin
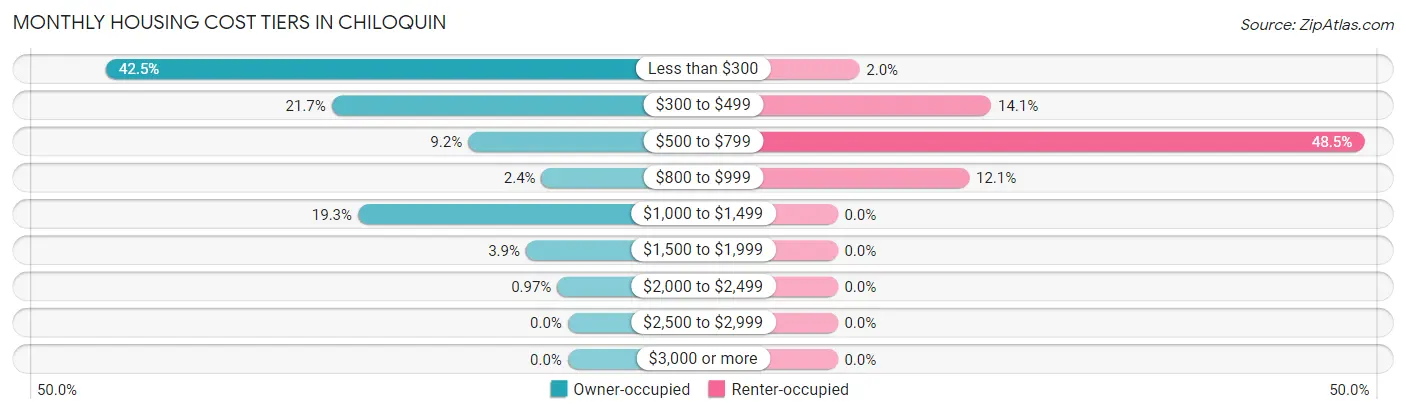
| Monthly Cost | Owner-occupied | Renter-occupied |
| Less than $300 | 88 (42.5%) | 2 (2.0%) |
| $300 to $499 | 45 (21.7%) | 14 (14.1%) |
| $500 to $799 | 19 (9.2%) | 48 (48.5%) |
| $800 to $999 | 5 (2.4%) | 12 (12.1%) |
| $1,000 to $1,499 | 40 (19.3%) | 0 (0.0%) |
| $1,500 to $1,999 | 8 (3.9%) | 0 (0.0%) |
| $2,000 to $2,499 | 2 (1.0%) | 0 (0.0%) |
| $2,500 to $2,999 | 0 (0.0%) | 0 (0.0%) |
| $3,000 or more | 0 (0.0%) | 0 (0.0%) |
| Total | 207 (100.0%) | 99 (100.0%) |
Physical Housing Characteristics in Chiloquin
Housing Structures in Chiloquin
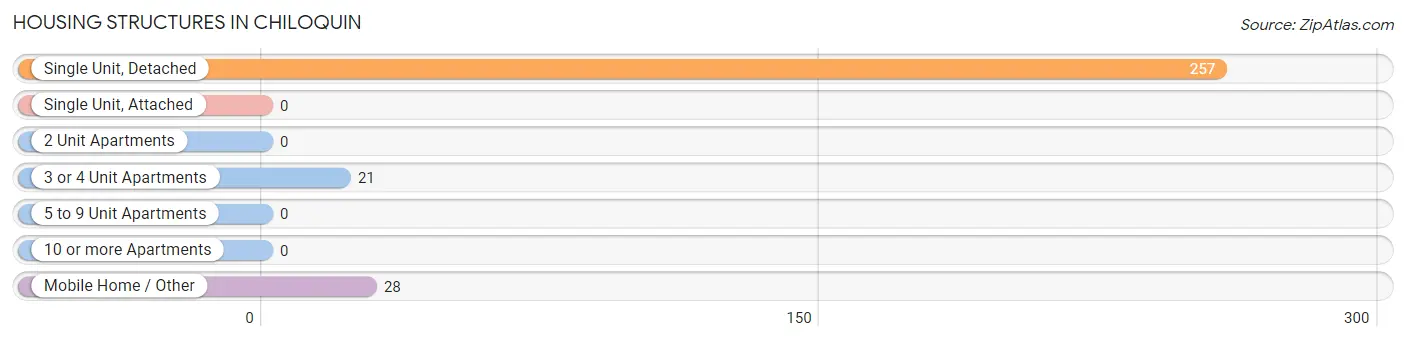
| Structure Type | # Housing Units | % Housing Units |
| Single Unit, Detached | 257 | 84.0% |
| Single Unit, Attached | 0 | 0.0% |
| 2 Unit Apartments | 0 | 0.0% |
| 3 or 4 Unit Apartments | 21 | 6.9% |
| 5 to 9 Unit Apartments | 0 | 0.0% |
| 10 or more Apartments | 0 | 0.0% |
| Mobile Home / Other | 28 | 9.1% |
| Total | 306 | 100.0% |
Housing Structures by Occupancy in Chiloquin
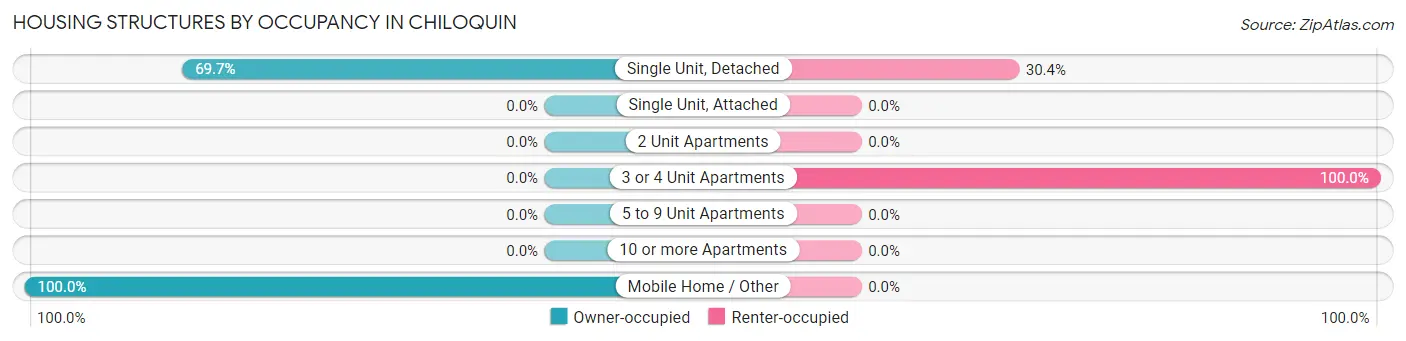
| Structure Type | Owner-occupied | Renter-occupied |
| Single Unit, Detached | 179 (69.7%) | 78 (30.3%) |
| Single Unit, Attached | 0 (0.0%) | 0 (0.0%) |
| 2 Unit Apartments | 0 (0.0%) | 0 (0.0%) |
| 3 or 4 Unit Apartments | 0 (0.0%) | 21 (100.0%) |
| 5 to 9 Unit Apartments | 0 (0.0%) | 0 (0.0%) |
| 10 or more Apartments | 0 (0.0%) | 0 (0.0%) |
| Mobile Home / Other | 28 (100.0%) | 0 (0.0%) |
| Total | 207 (67.6%) | 99 (32.4%) |
Housing Structures by Number of Rooms in Chiloquin
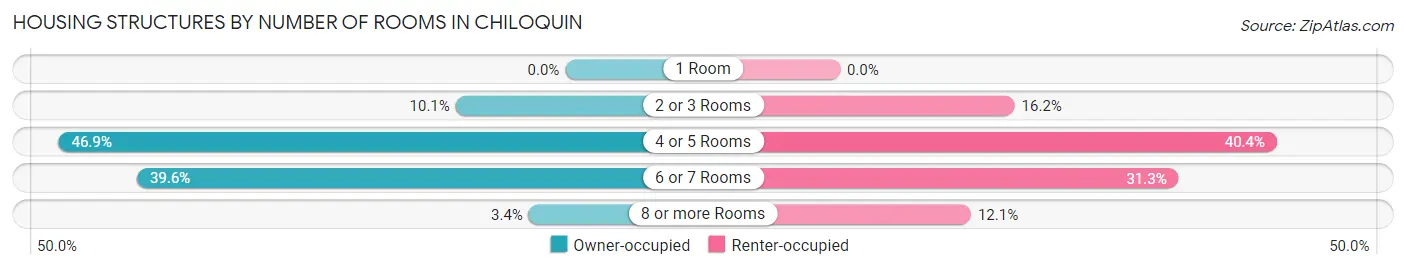
| Number of Rooms | Owner-occupied | Renter-occupied |
| 1 Room | 0 (0.0%) | 0 (0.0%) |
| 2 or 3 Rooms | 21 (10.1%) | 16 (16.2%) |
| 4 or 5 Rooms | 97 (46.9%) | 40 (40.4%) |
| 6 or 7 Rooms | 82 (39.6%) | 31 (31.3%) |
| 8 or more Rooms | 7 (3.4%) | 12 (12.1%) |
| Total | 207 (100.0%) | 99 (100.0%) |
Housing Structure by Heating Type in Chiloquin
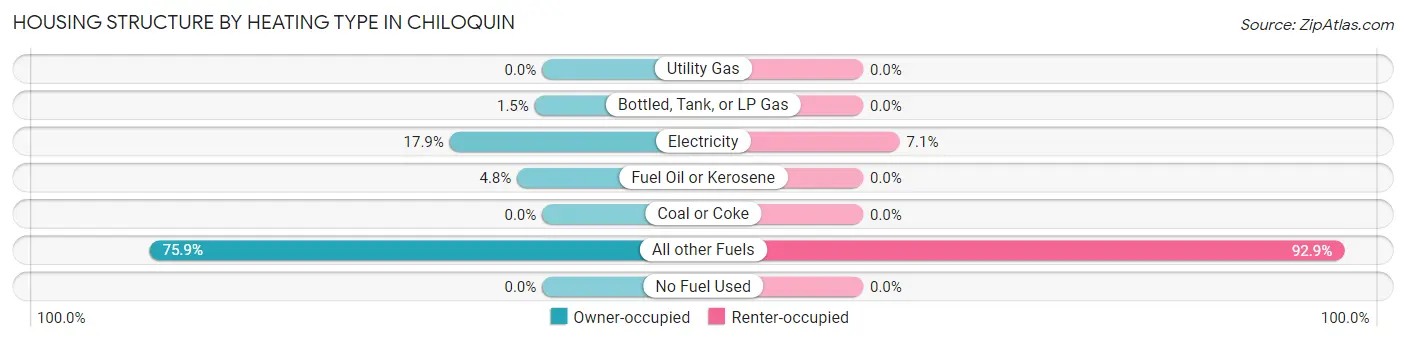
| Heating Type | Owner-occupied | Renter-occupied |
| Utility Gas | 0 (0.0%) | 0 (0.0%) |
| Bottled, Tank, or LP Gas | 3 (1.5%) | 0 (0.0%) |
| Electricity | 37 (17.9%) | 7 (7.1%) |
| Fuel Oil or Kerosene | 10 (4.8%) | 0 (0.0%) |
| Coal or Coke | 0 (0.0%) | 0 (0.0%) |
| All other Fuels | 157 (75.8%) | 92 (92.9%) |
| No Fuel Used | 0 (0.0%) | 0 (0.0%) |
| Total | 207 (100.0%) | 99 (100.0%) |
Household Vehicle Usage in Chiloquin
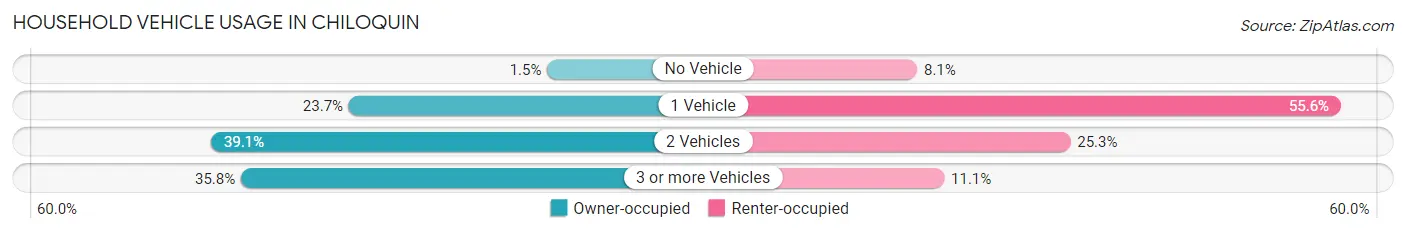
| Vehicles per Household | Owner-occupied | Renter-occupied |
| No Vehicle | 3 (1.5%) | 8 (8.1%) |
| 1 Vehicle | 49 (23.7%) | 55 (55.6%) |
| 2 Vehicles | 81 (39.1%) | 25 (25.3%) |
| 3 or more Vehicles | 74 (35.7%) | 11 (11.1%) |
| Total | 207 (100.0%) | 99 (100.0%) |
Real Estate & Mortgages in Chiloquin
Real Estate and Mortgage Overview in Chiloquin
| Characteristic | Without Mortgage | With Mortgage |
| Housing Units | 145 | 62 |
| Median Property Value | $75,500 | $136,800 |
| Median Household Income | - | - |
| Monthly Housing Costs | $248 | $0 |
| Real Estate Taxes | $702 | $0 |
Property Value by Mortgage Status in Chiloquin
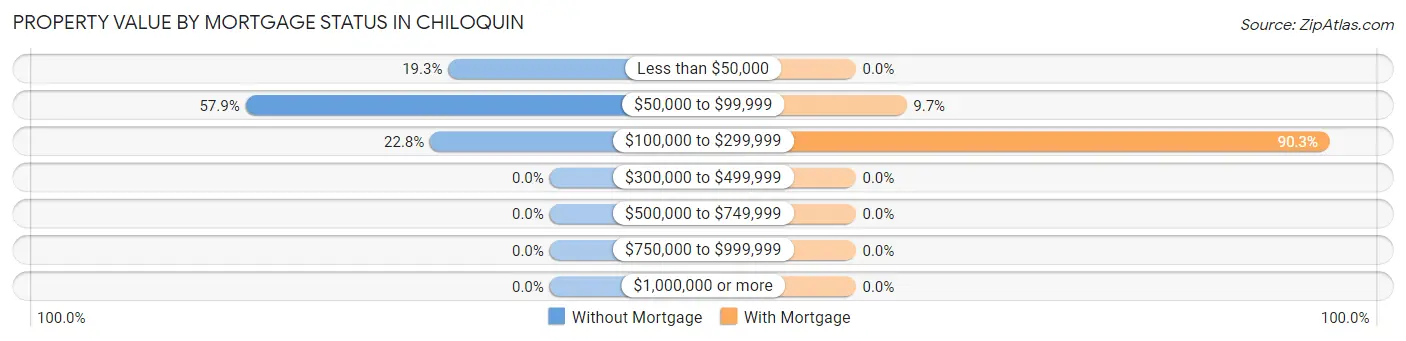
| Property Value | Without Mortgage | With Mortgage |
| Less than $50,000 | 28 (19.3%) | 0 (0.0%) |
| $50,000 to $99,999 | 84 (57.9%) | 6 (9.7%) |
| $100,000 to $299,999 | 33 (22.8%) | 56 (90.3%) |
| $300,000 to $499,999 | 0 (0.0%) | 0 (0.0%) |
| $500,000 to $749,999 | 0 (0.0%) | 0 (0.0%) |
| $750,000 to $999,999 | 0 (0.0%) | 0 (0.0%) |
| $1,000,000 or more | 0 (0.0%) | 0 (0.0%) |
| Total | 145 (100.0%) | 62 (100.0%) |
Household Income by Mortgage Status in Chiloquin
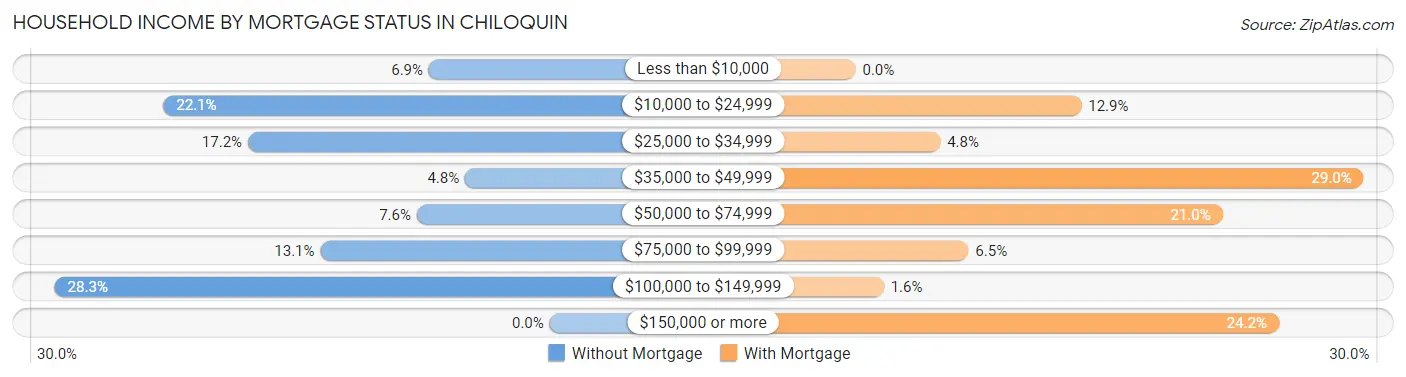
| Household Income | Without Mortgage | With Mortgage |
| Less than $10,000 | 10 (6.9%) | 0 (0.0%) |
| $10,000 to $24,999 | 32 (22.1%) | 8 (12.9%) |
| $25,000 to $34,999 | 25 (17.2%) | 3 (4.8%) |
| $35,000 to $49,999 | 7 (4.8%) | 18 (29.0%) |
| $50,000 to $74,999 | 11 (7.6%) | 13 (21.0%) |
| $75,000 to $99,999 | 19 (13.1%) | 4 (6.5%) |
| $100,000 to $149,999 | 41 (28.3%) | 1 (1.6%) |
| $150,000 or more | 0 (0.0%) | 15 (24.2%) |
| Total | 145 (100.0%) | 62 (100.0%) |
Property Value to Household Income Ratio in Chiloquin
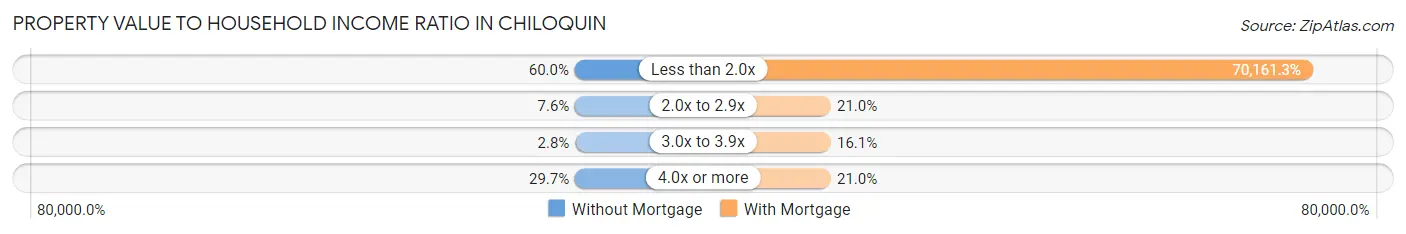
| Value-to-Income Ratio | Without Mortgage | With Mortgage |
| Less than 2.0x | 87 (60.0%) | 43,500 (70,161.3%) |
| 2.0x to 2.9x | 11 (7.6%) | 13 (21.0%) |
| 3.0x to 3.9x | 4 (2.8%) | 10 (16.1%) |
| 4.0x or more | 43 (29.7%) | 13 (21.0%) |
| Total | 145 (100.0%) | 62 (100.0%) |
Real Estate Taxes by Mortgage Status in Chiloquin
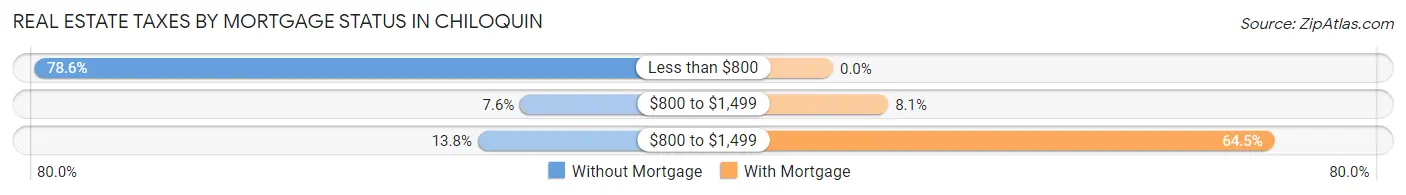
| Property Taxes | Without Mortgage | With Mortgage |
| Less than $800 | 114 (78.6%) | 0 (0.0%) |
| $800 to $1,499 | 11 (7.6%) | 5 (8.1%) |
| $800 to $1,499 | 20 (13.8%) | 40 (64.5%) |
| Total | 145 (100.0%) | 62 (100.0%) |
Health & Disability in Chiloquin
Health Insurance Coverage by Age in Chiloquin
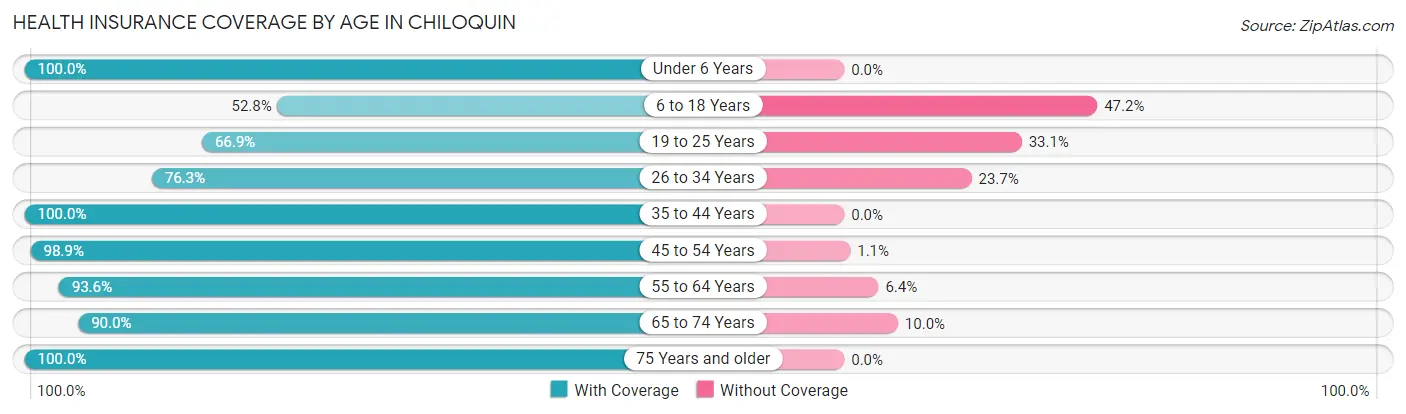
| Age Bracket | With Coverage | Without Coverage |
| Under 6 Years | 37 (100.0%) | 0 (0.0%) |
| 6 to 18 Years | 56 (52.8%) | 50 (47.2%) |
| 19 to 25 Years | 87 (66.9%) | 43 (33.1%) |
| 26 to 34 Years | 45 (76.3%) | 14 (23.7%) |
| 35 to 44 Years | 58 (100.0%) | 0 (0.0%) |
| 45 to 54 Years | 88 (98.9%) | 1 (1.1%) |
| 55 to 64 Years | 88 (93.6%) | 6 (6.4%) |
| 65 to 74 Years | 63 (90.0%) | 7 (10.0%) |
| 75 Years and older | 53 (100.0%) | 0 (0.0%) |
| Total | 575 (82.6%) | 121 (17.4%) |
Health Insurance Coverage by Citizenship Status in Chiloquin
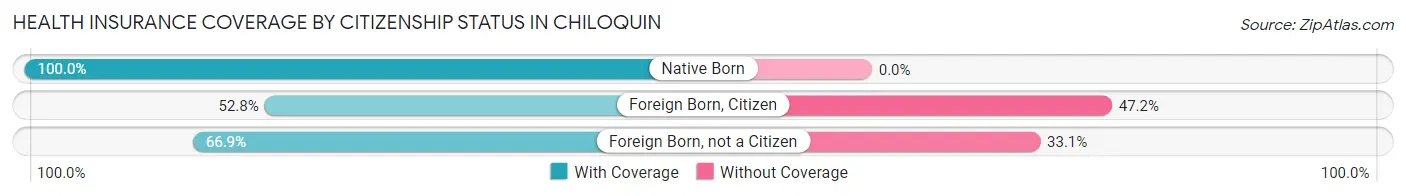
| Citizenship Status | With Coverage | Without Coverage |
| Native Born | 37 (100.0%) | 0 (0.0%) |
| Foreign Born, Citizen | 56 (52.8%) | 50 (47.2%) |
| Foreign Born, not a Citizen | 87 (66.9%) | 43 (33.1%) |
Health Insurance Coverage by Household Income in Chiloquin
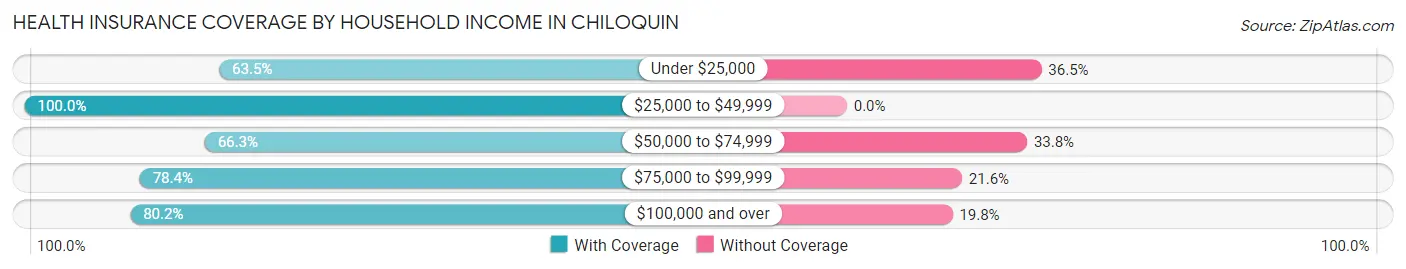
| Household Income | With Coverage | Without Coverage |
| Under $25,000 | 61 (63.5%) | 35 (36.5%) |
| $25,000 to $49,999 | 231 (100.0%) | 0 (0.0%) |
| $50,000 to $74,999 | 53 (66.2%) | 27 (33.8%) |
| $75,000 to $99,999 | 80 (78.4%) | 22 (21.6%) |
| $100,000 and over | 150 (80.2%) | 37 (19.8%) |
Public vs Private Health Insurance Coverage by Age in Chiloquin
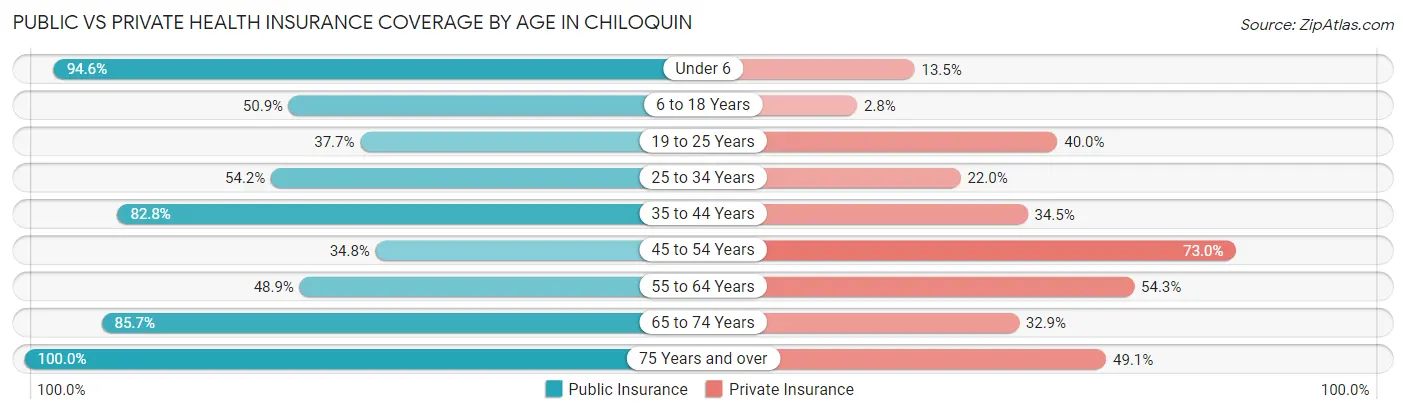
| Age Bracket | Public Insurance | Private Insurance |
| Under 6 | 35 (94.6%) | 5 (13.5%) |
| 6 to 18 Years | 54 (50.9%) | 3 (2.8%) |
| 19 to 25 Years | 49 (37.7%) | 52 (40.0%) |
| 25 to 34 Years | 32 (54.2%) | 13 (22.0%) |
| 35 to 44 Years | 48 (82.8%) | 20 (34.5%) |
| 45 to 54 Years | 31 (34.8%) | 65 (73.0%) |
| 55 to 64 Years | 46 (48.9%) | 51 (54.3%) |
| 65 to 74 Years | 60 (85.7%) | 23 (32.9%) |
| 75 Years and over | 53 (100.0%) | 26 (49.1%) |
| Total | 408 (58.6%) | 258 (37.1%) |
Disability Status by Sex by Age in Chiloquin
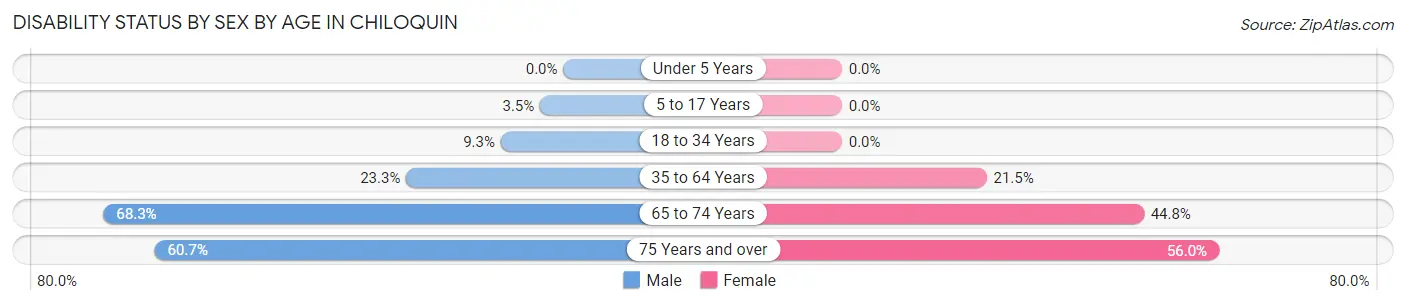
| Age Bracket | Male | Female |
| Under 5 Years | 0 (0.0%) | 0 (0.0%) |
| 5 to 17 Years | 1 (3.5%) | 0 (0.0%) |
| 18 to 34 Years | 13 (9.3%) | 0 (0.0%) |
| 35 to 64 Years | 28 (23.3%) | 26 (21.5%) |
| 65 to 74 Years | 28 (68.3%) | 13 (44.8%) |
| 75 Years and over | 17 (60.7%) | 14 (56.0%) |
Disability Class by Sex by Age in Chiloquin
Disability Class: Hearing Difficulty
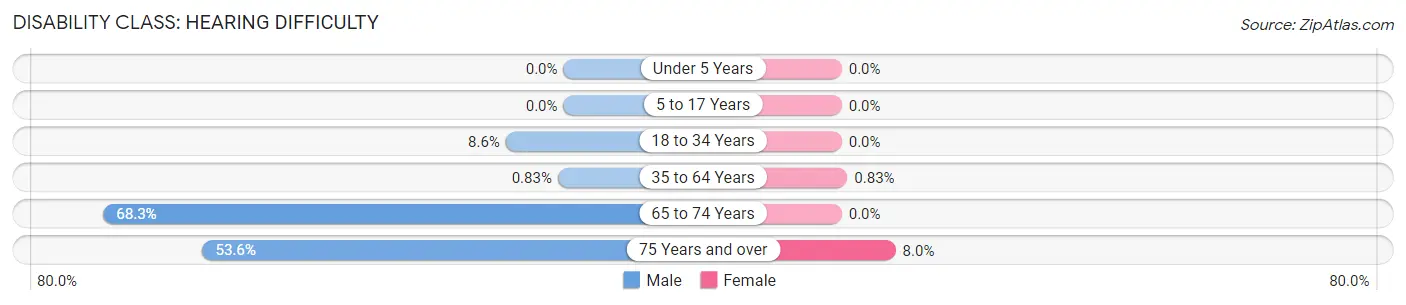
| Age Bracket | Male | Female |
| Under 5 Years | 0 (0.0%) | 0 (0.0%) |
| 5 to 17 Years | 0 (0.0%) | 0 (0.0%) |
| 18 to 34 Years | 12 (8.6%) | 0 (0.0%) |
| 35 to 64 Years | 1 (0.8%) | 1 (0.8%) |
| 65 to 74 Years | 28 (68.3%) | 0 (0.0%) |
| 75 Years and over | 15 (53.6%) | 2 (8.0%) |
Disability Class: Vision Difficulty
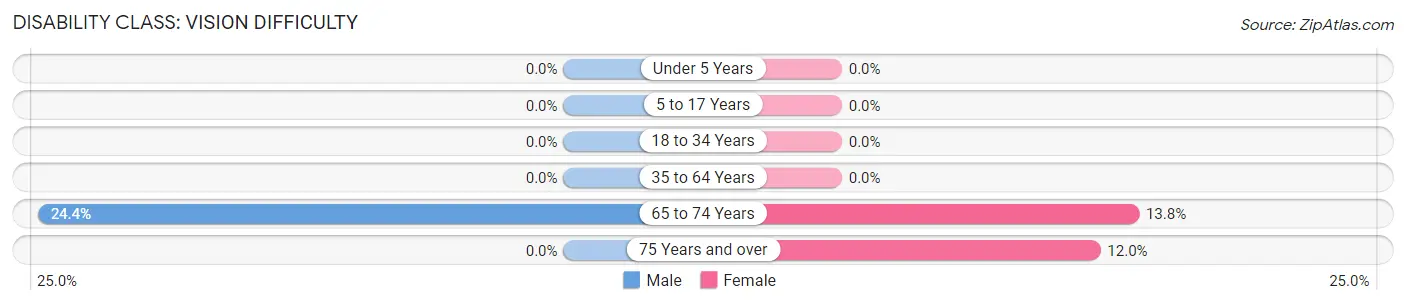
| Age Bracket | Male | Female |
| Under 5 Years | 0 (0.0%) | 0 (0.0%) |
| 5 to 17 Years | 0 (0.0%) | 0 (0.0%) |
| 18 to 34 Years | 0 (0.0%) | 0 (0.0%) |
| 35 to 64 Years | 0 (0.0%) | 0 (0.0%) |
| 65 to 74 Years | 10 (24.4%) | 4 (13.8%) |
| 75 Years and over | 0 (0.0%) | 3 (12.0%) |
Disability Class: Cognitive Difficulty
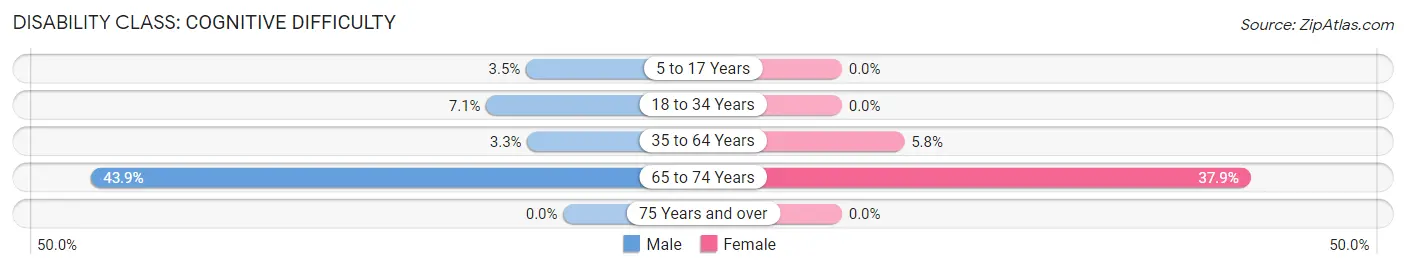
| Age Bracket | Male | Female |
| 5 to 17 Years | 1 (3.5%) | 0 (0.0%) |
| 18 to 34 Years | 10 (7.1%) | 0 (0.0%) |
| 35 to 64 Years | 4 (3.3%) | 7 (5.8%) |
| 65 to 74 Years | 18 (43.9%) | 11 (37.9%) |
| 75 Years and over | 0 (0.0%) | 0 (0.0%) |
Disability Class: Ambulatory Difficulty
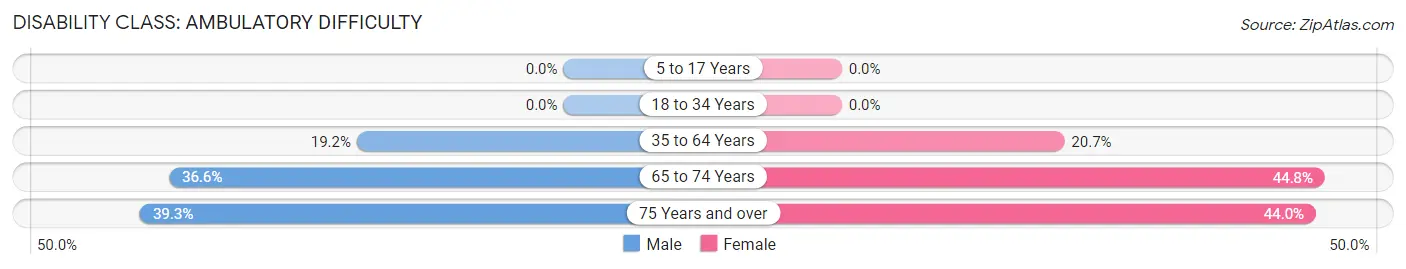
| Age Bracket | Male | Female |
| 5 to 17 Years | 0 (0.0%) | 0 (0.0%) |
| 18 to 34 Years | 0 (0.0%) | 0 (0.0%) |
| 35 to 64 Years | 23 (19.2%) | 25 (20.7%) |
| 65 to 74 Years | 15 (36.6%) | 13 (44.8%) |
| 75 Years and over | 11 (39.3%) | 11 (44.0%) |
Disability Class: Self-Care Difficulty
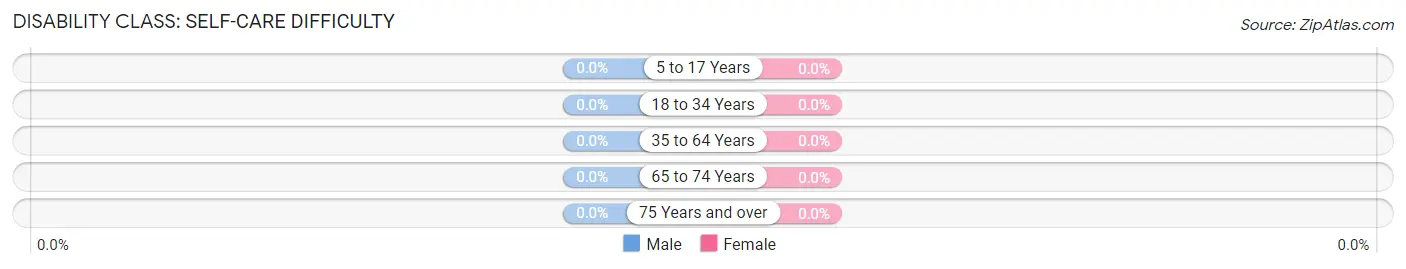
| Age Bracket | Male | Female |
| 5 to 17 Years | 0 (0.0%) | 0 (0.0%) |
| 18 to 34 Years | 0 (0.0%) | 0 (0.0%) |
| 35 to 64 Years | 0 (0.0%) | 0 (0.0%) |
| 65 to 74 Years | 0 (0.0%) | 0 (0.0%) |
| 75 Years and over | 0 (0.0%) | 0 (0.0%) |
Technology Access in Chiloquin
Computing Device Access in Chiloquin
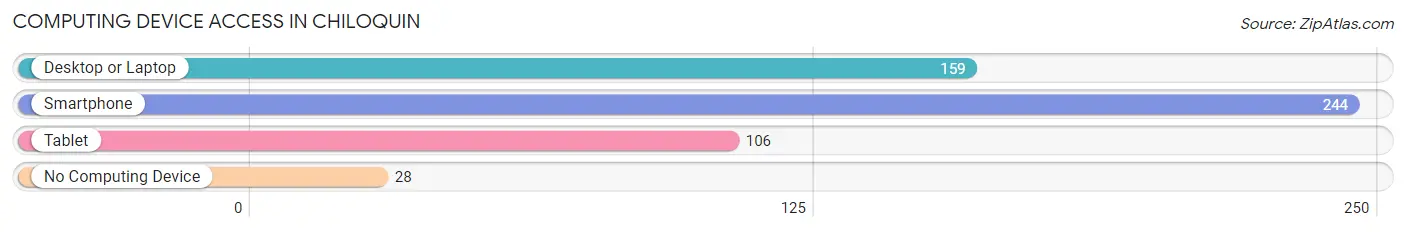
| Device Type | # Households | % Households |
| Desktop or Laptop | 159 | 52.0% |
| Smartphone | 244 | 79.7% |
| Tablet | 106 | 34.6% |
| No Computing Device | 28 | 9.1% |
| Total | 306 | 100.0% |
Internet Access in Chiloquin
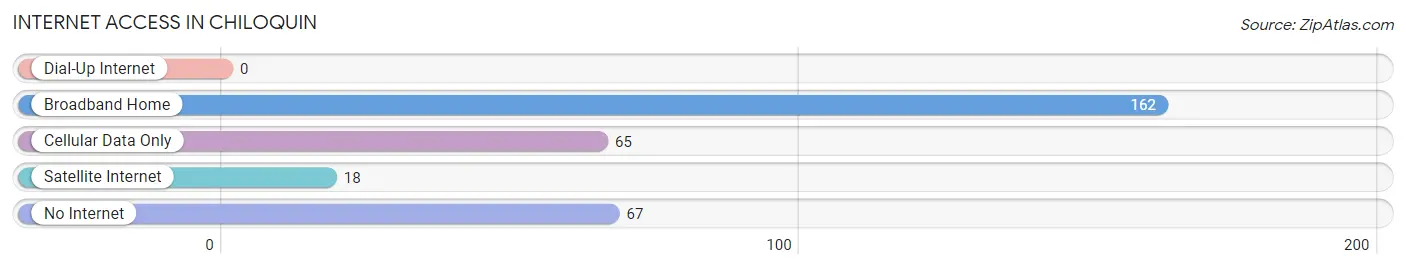
| Internet Type | # Households | % Households |
| Dial-Up Internet | 0 | 0.0% |
| Broadband Home | 162 | 52.9% |
| Cellular Data Only | 65 | 21.2% |
| Satellite Internet | 18 | 5.9% |
| No Internet | 67 | 21.9% |
| Total | 306 | 100.0% |
Chiloquin Summary
Chiloquin, Oregon is a small city located in Klamath County, Oregon. It is situated on the south shore of Agency Lake, a large body of water that is part of the Klamath River system. The city is located in the Klamath Basin, an area of high desert and sagebrush that is home to a variety of wildlife. The city is home to a population of approximately 1,000 people, and is the largest city in Klamath County.
History
The area that is now Chiloquin was originally inhabited by the Klamath people, who lived in the area for thousands of years before the arrival of European settlers. The first European settlers arrived in the area in the late 1800s, and the city was officially incorporated in 1911. The city was named after Chief Chiloquin, a Klamath leader who was instrumental in negotiating the Treaty of 1864, which established the Klamath Reservation.
The city grew slowly over the years, and by the 1950s it had become a popular tourist destination. The city was home to a number of resorts, and was known for its fishing and hunting opportunities. In the 1960s, the city began to experience a decline in population as people moved away to larger cities.
Geography
Chiloquin is located in the Klamath Basin, an area of high desert and sagebrush. The city is situated on the south shore of Agency Lake, a large body of water that is part of the Klamath River system. The city is located at an elevation of 4,000 feet, and is surrounded by the Cascade Mountains to the west and the High Desert to the east.
The climate in Chiloquin is semi-arid, with hot summers and cold winters. The average annual temperature is around 50 degrees Fahrenheit, and the average annual precipitation is around 10 inches.
Economy
The economy of Chiloquin is largely based on tourism and agriculture. The city is home to a number of resorts and recreational facilities, and is a popular destination for fishing and hunting. The city is also home to a number of agricultural operations, including cattle ranches, hay farms, and orchards.
The city is also home to a number of businesses, including restaurants, retail stores, and service providers. The city is home to a number of manufacturing companies, including a wood products plant and a metal fabrication plant.
Demographics
As of the 2010 census, the population of Chiloquin was 1,039. The racial makeup of the city was 79.3% White, 0.7% African American, 0.9% Native American, 0.3% Asian, 0.1% Pacific Islander, and 18.7% from other races. The median household income was $30,938, and the median family income was $35,625.
The city is home to a number of churches, including the Church of Jesus Christ of Latter-day Saints, the United Methodist Church, and the Catholic Church. The city is also home to a number of schools, including Chiloquin Elementary School, Chiloquin High School, and Klamath Community College.
Common Questions
What is Per Capita Income in Chiloquin?
Per Capita income in Chiloquin is $23,040.
What is the Median Family Income in Chiloquin?
Median Family Income in Chiloquin is $57,813.
What is the Median Household income in Chiloquin?
Median Household Income in Chiloquin is $40,781.
What is Income or Wage Gap in Chiloquin?
Income or Wage Gap in Chiloquin is 0.3%.
Women in Chiloquin earn 99.7 cents for every dollar earned by a man.
What is Inequality or Gini Index in Chiloquin?
Inequality or Gini Index in Chiloquin is 0.39.
What is the Total Population of Chiloquin?
Total Population of Chiloquin is 696.
What is the Total Male Population of Chiloquin?
Total Male Population of Chiloquin is 366.
What is the Total Female Population of Chiloquin?
Total Female Population of Chiloquin is 330.
What is the Ratio of Males per 100 Females in Chiloquin?
There are 110.91 Males per 100 Females in Chiloquin.
What is the Ratio of Females per 100 Males in Chiloquin?
There are 90.16 Females per 100 Males in Chiloquin.
What is the Median Population Age in Chiloquin?
Median Population Age in Chiloquin is 37.5 Years.
What is the Average Family Size in Chiloquin
Average Family Size in Chiloquin is 2.5 People.
What is the Average Household Size in Chiloquin
Average Household Size in Chiloquin is 2.3 People.
How Large is the Labor Force in Chiloquin?
There are 337 People in the Labor Forcein in Chiloquin.
What is the Percentage of People in the Labor Force in Chiloquin?
56.0% of People are in the Labor Force in Chiloquin.
What is the Unemployment Rate in Chiloquin?
Unemployment Rate in Chiloquin is 25.2%.