Oakridge, OR Map & Demographics
Oakridge Map
Oakridge Overview
$20,251
PER CAPITA INCOME
$46,602
AVG FAMILY INCOME
$29,336
AVG HOUSEHOLD INCOME
80.3%
WAGE / INCOME GAP [ % ]
19.7¢/ $1
WAGE / INCOME GAP [ $ ]
0.45
INEQUALITY / GINI INDEX
3,208
TOTAL POPULATION
1,478
MALE POPULATION
1,730
FEMALE POPULATION
85.43
MALES / 100 FEMALES
117.05
FEMALES / 100 MALES
48.2
MEDIAN AGE
2.7
AVG FAMILY SIZE
2.2
AVG HOUSEHOLD SIZE
978
LABOR FORCE [ PEOPLE ]
38.2%
PERCENT IN LABOR FORCE
23.5%
UNEMPLOYMENT RATE
Oakridge Zip Codes
Oakridge Area Codes
Income in Oakridge
Income Overview in Oakridge
Per Capita Income in Oakridge is $20,251, while median incomes of families and households are $46,602 and $29,336 respectively.
| Characteristic | Number | Measure |
| Per Capita Income | 3,208 | $20,251 |
| Median Family Income | 824 | $46,602 |
| Mean Family Income | 824 | $58,124 |
| Median Household Income | 1,463 | $29,336 |
| Mean Household Income | 1,463 | $44,223 |
| Income Deficit | 824 | $0 |
| Wage / Income Gap (%) | 3,208 | 80.28% |
| Wage / Income Gap ($) | 3,208 | 19.72¢ per $1 |
| Gini / Inequality Index | 3,208 | 0.45 |
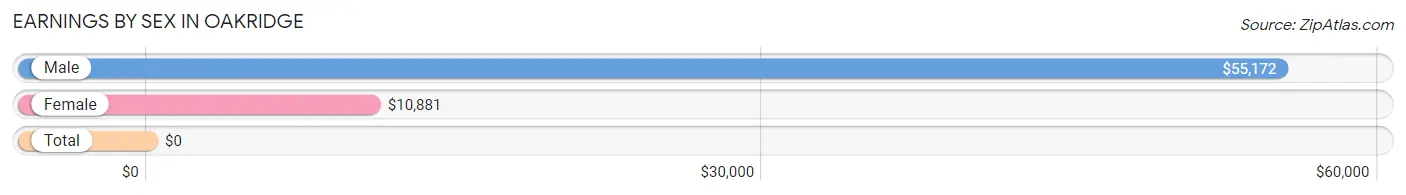
Earnings by Sex in Oakridge
| Sex | Number | Average Earnings |
| Male | 382 (42.5%) | $55,172 |
| Female | 516 (57.5%) | $10,881 |
| Total | 898 (100.0%) | $0 |
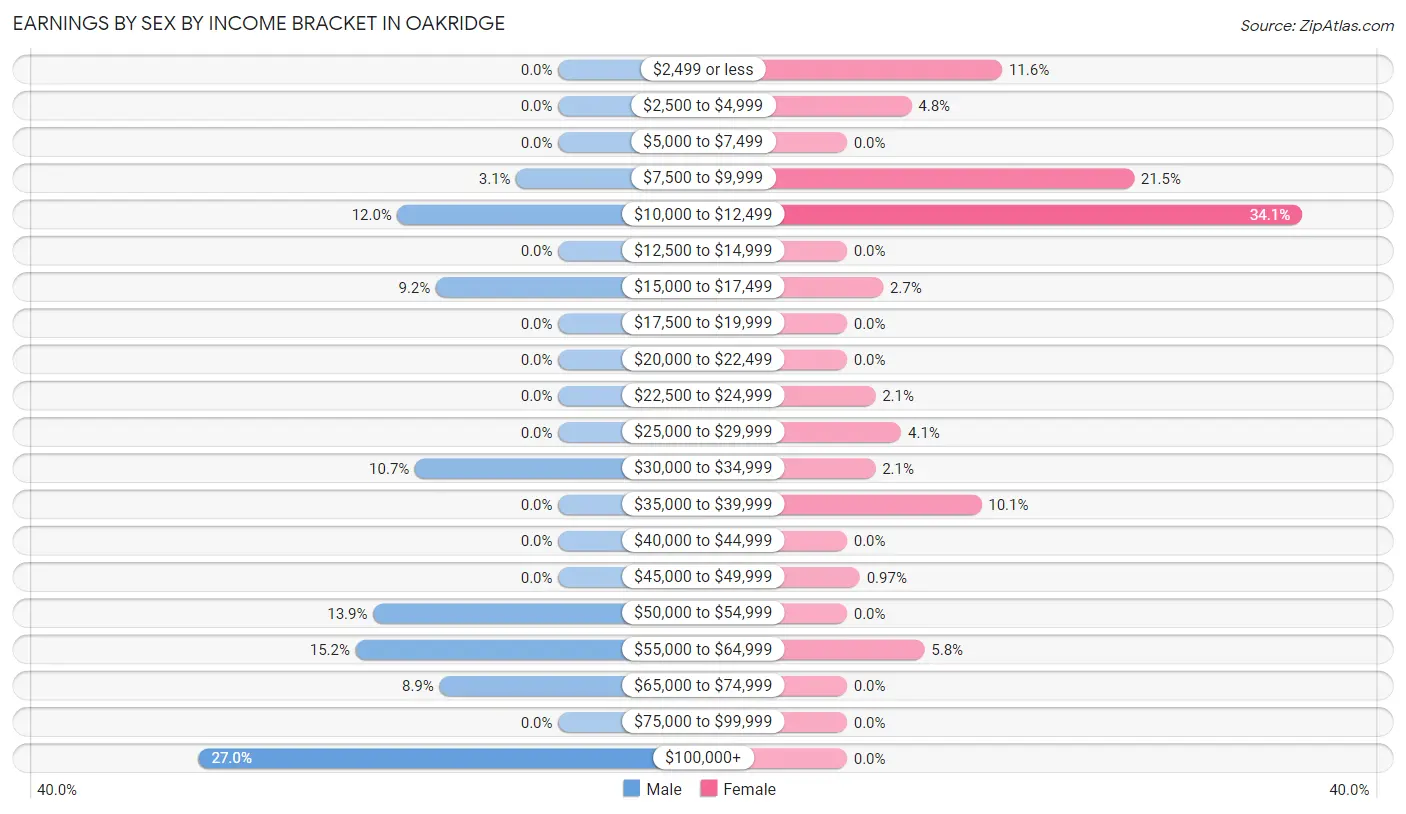
Earnings by Sex by Income Bracket in Oakridge
The most common earnings brackets in Oakridge are $100,000+ for men (103 | 27.0%) and $10,000 to $12,499 for women (176 | 34.1%).
| Income | Male | Female |
| $2,499 or less | 0 (0.0%) | 60 (11.6%) |
| $2,500 to $4,999 | 0 (0.0%) | 25 (4.8%) |
| $5,000 to $7,499 | 0 (0.0%) | 0 (0.0%) |
| $7,500 to $9,999 | 12 (3.1%) | 111 (21.5%) |
| $10,000 to $12,499 | 46 (12.0%) | 176 (34.1%) |
| $12,500 to $14,999 | 0 (0.0%) | 0 (0.0%) |
| $15,000 to $17,499 | 35 (9.2%) | 14 (2.7%) |
| $17,500 to $19,999 | 0 (0.0%) | 0 (0.0%) |
| $20,000 to $22,499 | 0 (0.0%) | 0 (0.0%) |
| $22,500 to $24,999 | 0 (0.0%) | 11 (2.1%) |
| $25,000 to $29,999 | 0 (0.0%) | 21 (4.1%) |
| $30,000 to $34,999 | 41 (10.7%) | 11 (2.1%) |
| $35,000 to $39,999 | 0 (0.0%) | 52 (10.1%) |
| $40,000 to $44,999 | 0 (0.0%) | 0 (0.0%) |
| $45,000 to $49,999 | 0 (0.0%) | 5 (1.0%) |
| $50,000 to $54,999 | 53 (13.9%) | 0 (0.0%) |
| $55,000 to $64,999 | 58 (15.2%) | 30 (5.8%) |
| $65,000 to $74,999 | 34 (8.9%) | 0 (0.0%) |
| $75,000 to $99,999 | 0 (0.0%) | 0 (0.0%) |
| $100,000+ | 103 (27.0%) | 0 (0.0%) |
| Total | 382 (100.0%) | 516 (100.0%) |
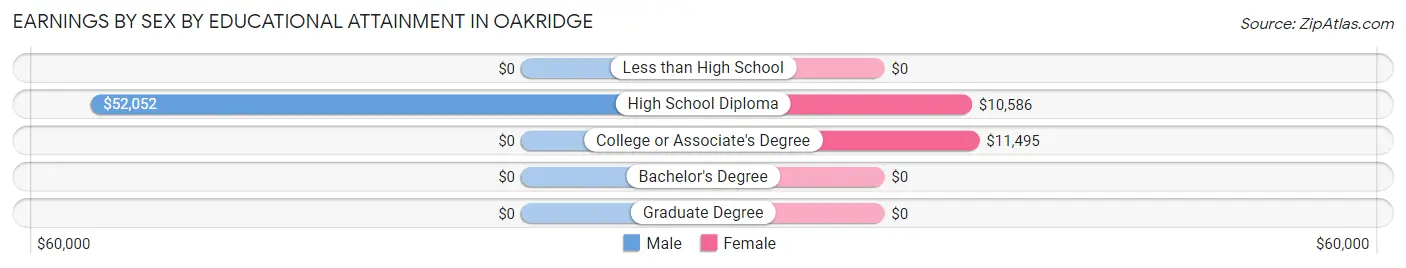
Earnings by Sex by Educational Attainment in Oakridge
Average earnings in Oakridge are $56,164 for men and $11,058 for women, a difference of 80.3%. Men with an educational attainment of high school diploma enjoy the highest average annual earnings of $52,052, while those with high school diploma education earn the least with $52,052. Women with an educational attainment of college or associate's degree earn the most with the average annual earnings of $11,495, while those with high school diploma education have the smallest earnings of $10,586.
| Educational Attainment | Male Income | Female Income |
| Less than High School | - | - |
| High School Diploma | $52,052 | $10,586 |
| College or Associate's Degree | - | - |
| Bachelor's Degree | - | - |
| Graduate Degree | - | - |
| Total | $56,164 | $11,058 |
Family Income in Oakridge
Family Income Brackets in Oakridge
According to the Oakridge family income data, there are 172 families falling into the $50,000 to $74,999 income range, which is the most common income bracket and makes up 20.9% of all families.
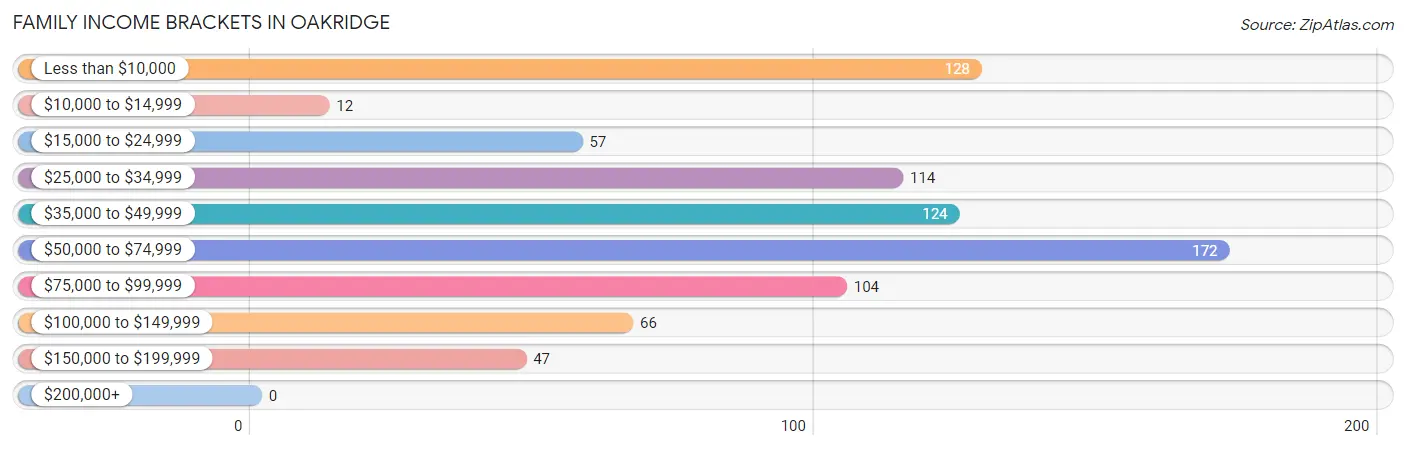
| Income Bracket | # Families | % Families |
| Less than $10,000 | 128 | 15.5% |
| $10,000 to $14,999 | 12 | 1.5% |
| $15,000 to $24,999 | 57 | 6.9% |
| $25,000 to $34,999 | 114 | 13.8% |
| $35,000 to $49,999 | 124 | 15.0% |
| $50,000 to $74,999 | 172 | 20.9% |
| $75,000 to $99,999 | 104 | 12.6% |
| $100,000 to $149,999 | 66 | 8.0% |
| $150,000 to $199,999 | 47 | 5.7% |
| $200,000+ | 0 | 0.0% |
Family Income by Famaliy Size in Oakridge
3-person families (66 | 8.0%) account for the highest median family income in Oakridge with $91,587 per family, while 3-person families (66 | 8.0%) have the highest median income of $30,529 per family member.
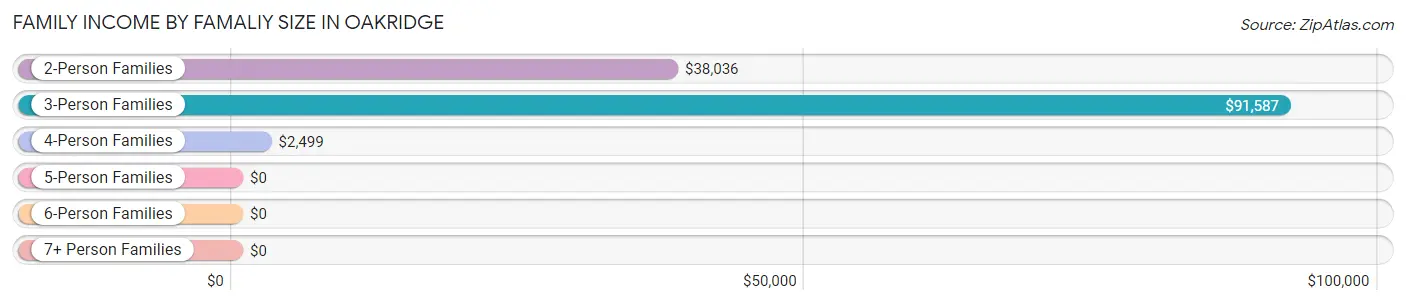
| Income Bracket | # Families | Median Income |
| 2-Person Families | 516 (62.6%) | $38,036 |
| 3-Person Families | 66 (8.0%) | $91,587 |
| 4-Person Families | 181 (22.0%) | $2,499 |
| 5-Person Families | 61 (7.4%) | $0 |
| 6-Person Families | 0 (0.0%) | $0 |
| 7+ Person Families | 0 (0.0%) | $0 |
| Total | 824 (100.0%) | $46,602 |
Family Income by Number of Earners in Oakridge
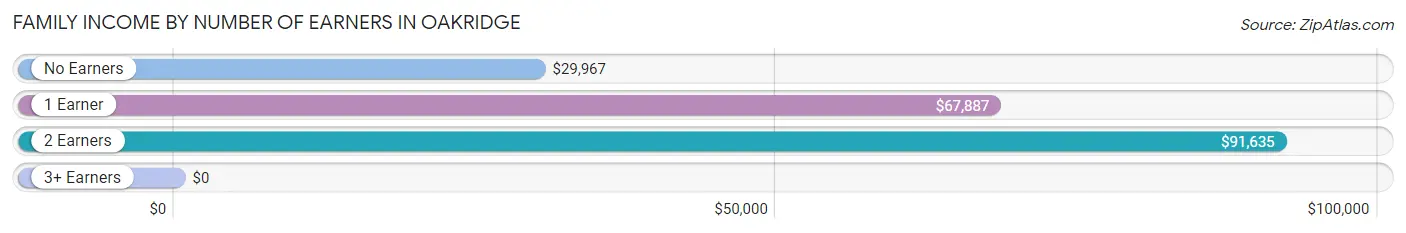
| Number of Earners | # Families | Median Income |
| No Earners | 410 (49.8%) | $29,967 |
| 1 Earner | 266 (32.3%) | $67,887 |
| 2 Earners | 148 (18.0%) | $91,635 |
| 3+ Earners | 0 (0.0%) | $0 |
| Total | 824 (100.0%) | $46,602 |
Household Income in Oakridge
Household Income Brackets in Oakridge
With 414 households falling in the category, the $15,000 to $24,999 income range is the most frequent in Oakridge, accounting for 28.3% of all households.
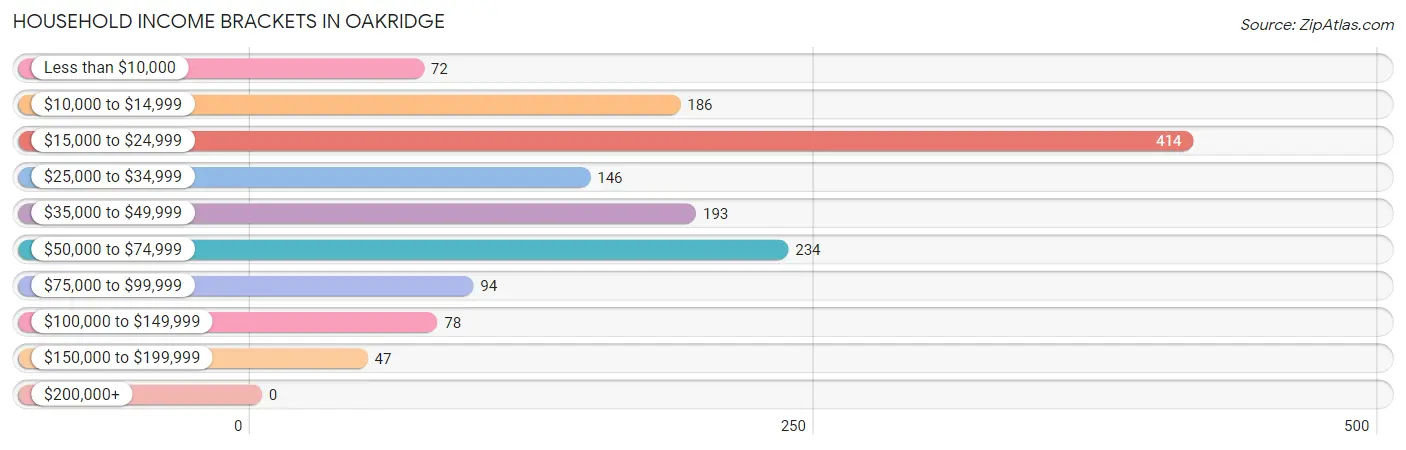
| Income Bracket | # Households | % Households |
| Less than $10,000 | 72 | 4.9% |
| $10,000 to $14,999 | 186 | 12.7% |
| $15,000 to $24,999 | 414 | 28.3% |
| $25,000 to $34,999 | 146 | 10.0% |
| $35,000 to $49,999 | 193 | 13.2% |
| $50,000 to $74,999 | 234 | 16.0% |
| $75,000 to $99,999 | 94 | 6.4% |
| $100,000 to $149,999 | 78 | 5.3% |
| $150,000 to $199,999 | 47 | 3.2% |
| $200,000+ | 0 | 0.0% |
Household Income by Householder Age in Oakridge
The median household income in Oakridge is $29,336, with the highest median household income of $34,591 found in the 65+ years age bracket for the primary householder. A total of 523 households (35.7%) fall into this category. Meanwhile, the 15 to 24 years age bracket for the primary householder has the lowest median household income of $0, with 25 households (1.7%) in this group.
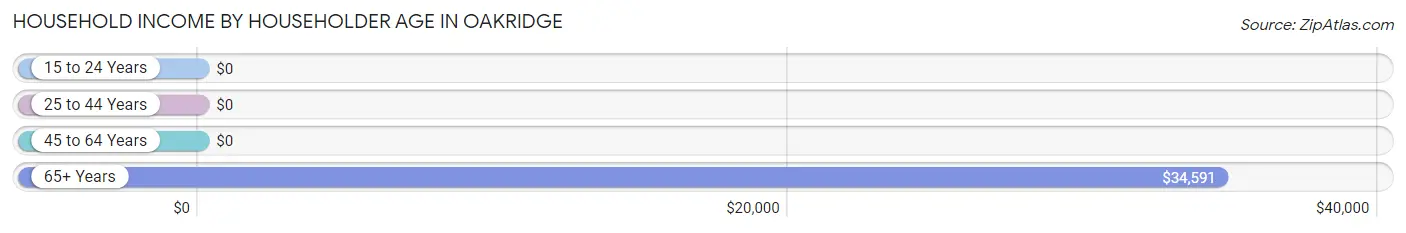
| Income Bracket | # Households | Median Income |
| 15 to 24 Years | 25 (1.7%) | $0 |
| 25 to 44 Years | 472 (32.3%) | $0 |
| 45 to 64 Years | 443 (30.3%) | $0 |
| 65+ Years | 523 (35.7%) | $34,591 |
| Total | 1,463 (100.0%) | $29,336 |
Poverty in Oakridge
Income Below Poverty by Sex and Age in Oakridge
With 21.6% poverty level for males and 40.2% for females among the residents of Oakridge, 5 year old males and 6 to 11 year old females are the most vulnerable to poverty, with 16 males (100.0%) and 160 females (75.1%) in their respective age groups living below the poverty level.
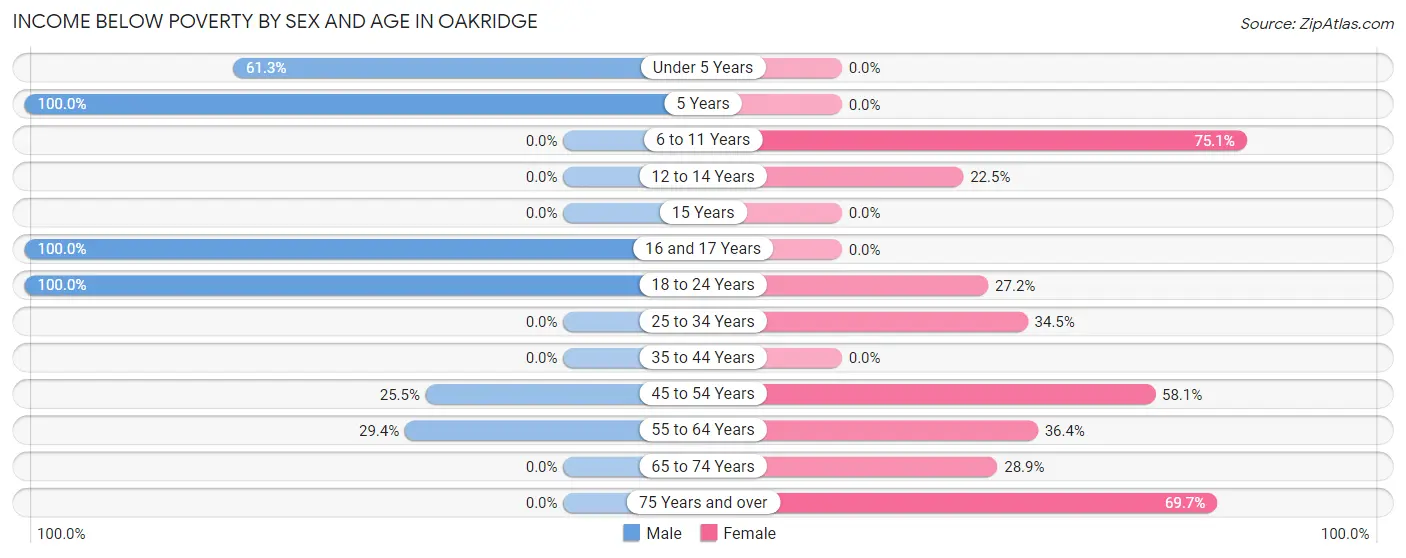
| Age Bracket | Male | Female |
| Under 5 Years | 84 (61.3%) | 0 (0.0%) |
| 5 Years | 16 (100.0%) | 0 (0.0%) |
| 6 to 11 Years | 0 (0.0%) | 160 (75.1%) |
| 12 to 14 Years | 0 (0.0%) | 16 (22.5%) |
| 15 Years | 0 (0.0%) | 0 (0.0%) |
| 16 and 17 Years | 40 (100.0%) | 0 (0.0%) |
| 18 to 24 Years | 46 (100.0%) | 25 (27.2%) |
| 25 to 34 Years | 0 (0.0%) | 109 (34.5%) |
| 35 to 44 Years | 0 (0.0%) | 0 (0.0%) |
| 45 to 54 Years | 24 (25.5%) | 100 (58.1%) |
| 55 to 64 Years | 109 (29.4%) | 92 (36.4%) |
| 65 to 74 Years | 0 (0.0%) | 69 (28.9%) |
| 75 Years and over | 0 (0.0%) | 124 (69.7%) |
| Total | 319 (21.6%) | 695 (40.2%) |
Income Above Poverty by Sex and Age in Oakridge
According to the poverty statistics in Oakridge, males aged 6 to 11 years and females aged under 5 years are the age groups that are most secure financially, with 100.0% of males and 100.0% of females in these age groups living above the poverty line.
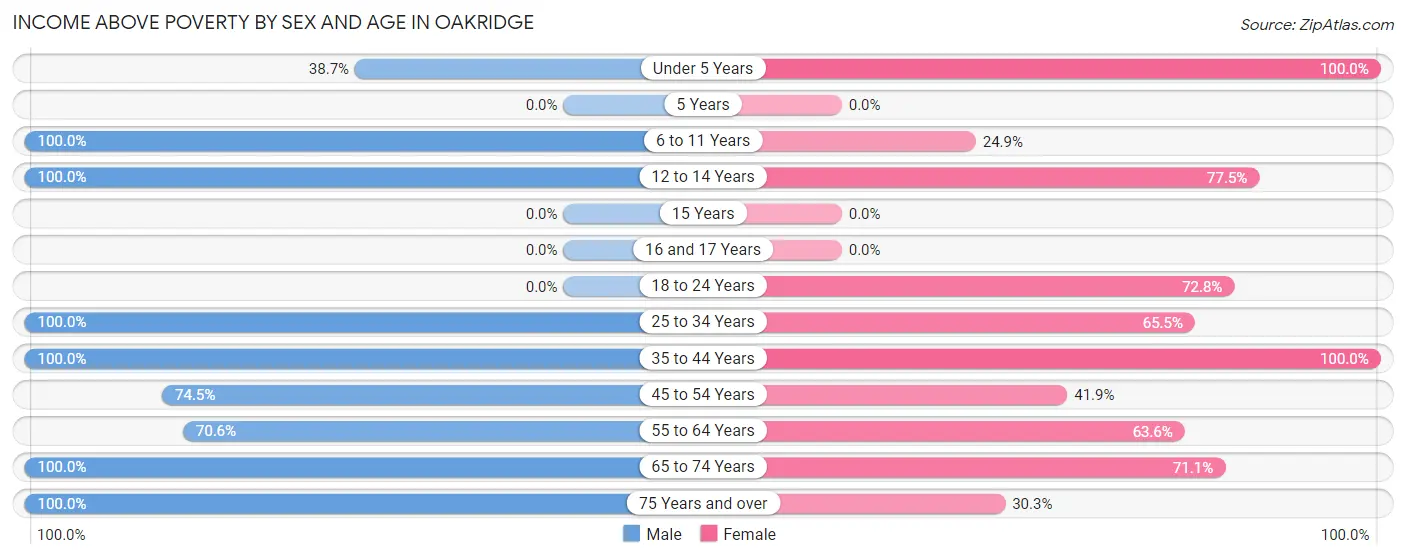
| Age Bracket | Male | Female |
| Under 5 Years | 53 (38.7%) | 85 (100.0%) |
| 5 Years | 0 (0.0%) | 0 (0.0%) |
| 6 to 11 Years | 15 (100.0%) | 53 (24.9%) |
| 12 to 14 Years | 110 (100.0%) | 55 (77.5%) |
| 15 Years | 0 (0.0%) | 0 (0.0%) |
| 16 and 17 Years | 0 (0.0%) | 0 (0.0%) |
| 18 to 24 Years | 0 (0.0%) | 67 (72.8%) |
| 25 to 34 Years | 233 (100.0%) | 207 (65.5%) |
| 35 to 44 Years | 109 (100.0%) | 111 (100.0%) |
| 45 to 54 Years | 70 (74.5%) | 72 (41.9%) |
| 55 to 64 Years | 262 (70.6%) | 161 (63.6%) |
| 65 to 74 Years | 240 (100.0%) | 170 (71.1%) |
| 75 Years and over | 67 (100.0%) | 54 (30.3%) |
| Total | 1,159 (78.4%) | 1,035 (59.8%) |
Income Below Poverty Among Married-Couple Families in Oakridge
The poverty statistics for married-couple families in Oakridge show that 4.6% or 24 of the total 521 families live below the poverty line. Families with no children have the highest poverty rate of 7.3%, comprising of 24 families. On the other hand, families with 1 or 2 children have the lowest poverty rate of 0.0%, which includes 0 families.
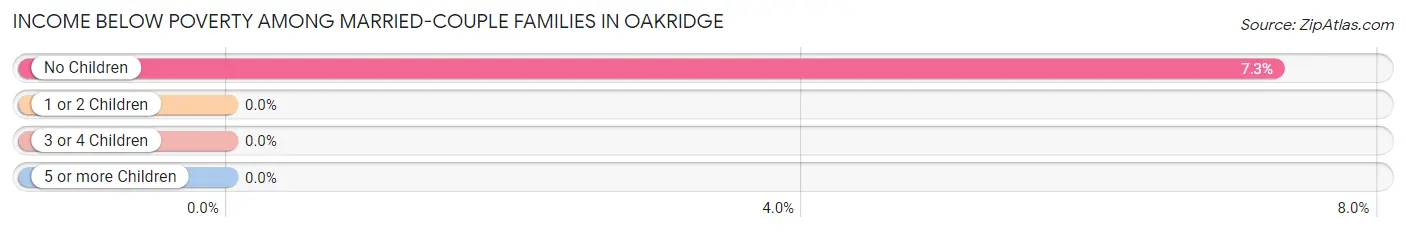
| Children | Above Poverty | Below Poverty |
| No Children | 305 (92.7%) | 24 (7.3%) |
| 1 or 2 Children | 192 (100.0%) | 0 (0.0%) |
| 3 or 4 Children | 0 (0.0%) | 0 (0.0%) |
| 5 or more Children | 0 (0.0%) | 0 (0.0%) |
| Total | 497 (95.4%) | 24 (4.6%) |
Income Below Poverty Among Single-Parent Households in Oakridge
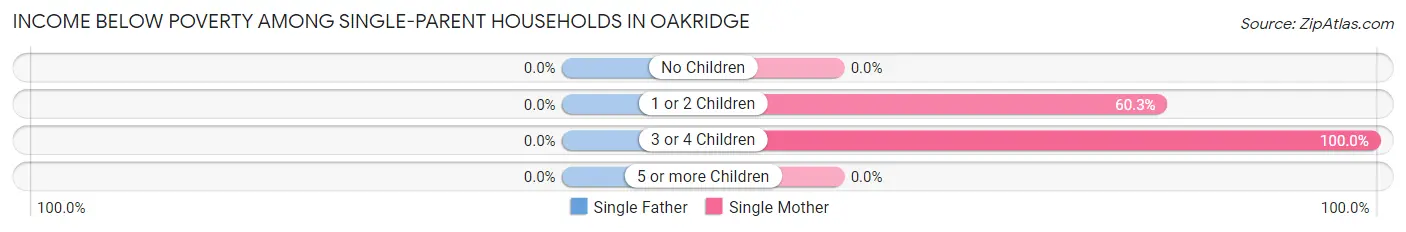
| Children | Single Father | Single Mother |
| No Children | 0 (0.0%) | 0 (0.0%) |
| 1 or 2 Children | 0 (0.0%) | 82 (60.3%) |
| 3 or 4 Children | 0 (0.0%) | 91 (100.0%) |
| 5 or more Children | 0 (0.0%) | 0 (0.0%) |
| Total | 0 (0.0%) | 173 (72.4%) |
Income Below Poverty Among Married-Couple vs Single-Parent Households in Oakridge
The poverty data for Oakridge shows that 24 of the married-couple family households (4.6%) and 173 of the single-parent households (57.1%) are living below the poverty level. Within the married-couple family households, those with no children have the highest poverty rate, with 24 households (7.3%) falling below the poverty line. Among the single-parent households, those with 3 or 4 children have the highest poverty rate, with 91 household (100.0%) living below poverty.
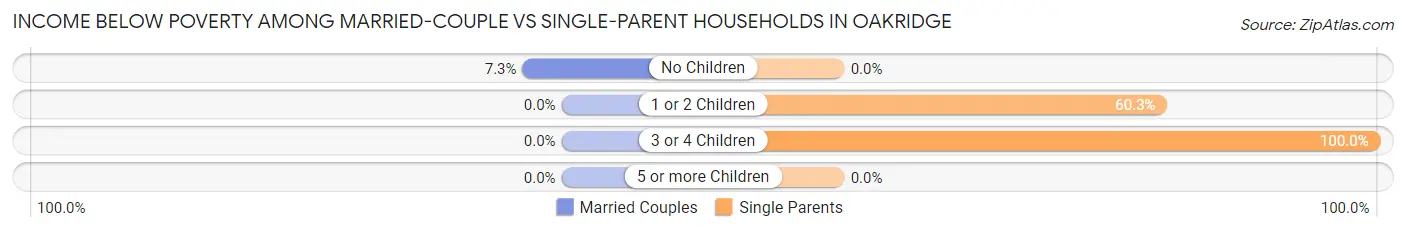
| Children | Married-Couple Families | Single-Parent Households |
| No Children | 24 (7.3%) | 0 (0.0%) |
| 1 or 2 Children | 0 (0.0%) | 82 (60.3%) |
| 3 or 4 Children | 0 (0.0%) | 91 (100.0%) |
| 5 or more Children | 0 (0.0%) | 0 (0.0%) |
| Total | 24 (4.6%) | 173 (57.1%) |
Race in Oakridge
The most populous races in Oakridge are White / Caucasian (3,126 | 97.4%), Hispanic or Latino (111 | 3.5%), and Two or more Races (82 | 2.6%).
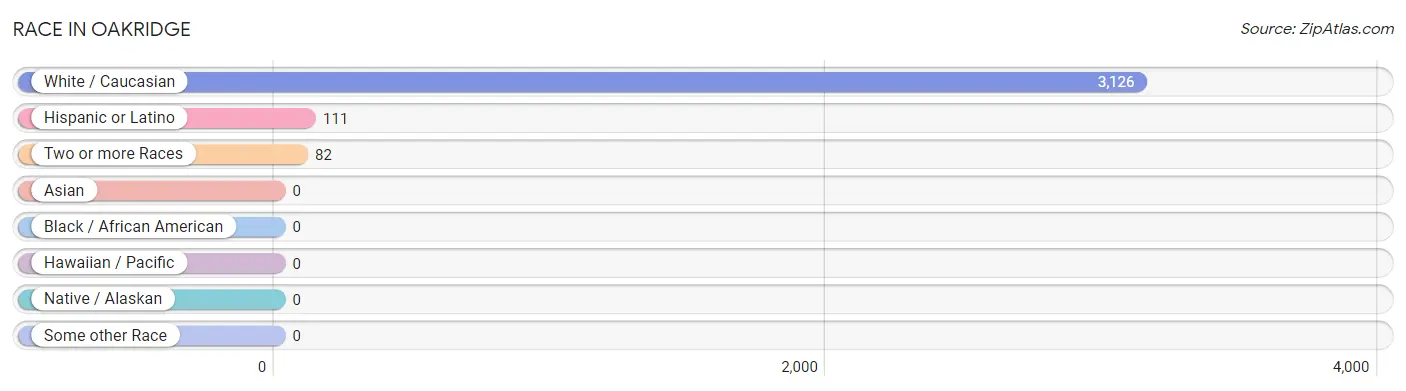
| Race | # Population | % Population |
| Asian | 0 | 0.0% |
| Black / African American | 0 | 0.0% |
| Hawaiian / Pacific | 0 | 0.0% |
| Hispanic or Latino | 111 | 3.5% |
| Native / Alaskan | 0 | 0.0% |
| White / Caucasian | 3,126 | 97.4% |
| Two or more Races | 82 | 2.6% |
| Some other Race | 0 | 0.0% |
| Total | 3,208 | 100.0% |
Ancestry in Oakridge
The most populous ancestries reported in Oakridge are German (927 | 28.9%), Irish (905 | 28.2%), English (752 | 23.4%), Scottish (321 | 10.0%), and American (218 | 6.8%), together accounting for 97.4% of all Oakridge residents.
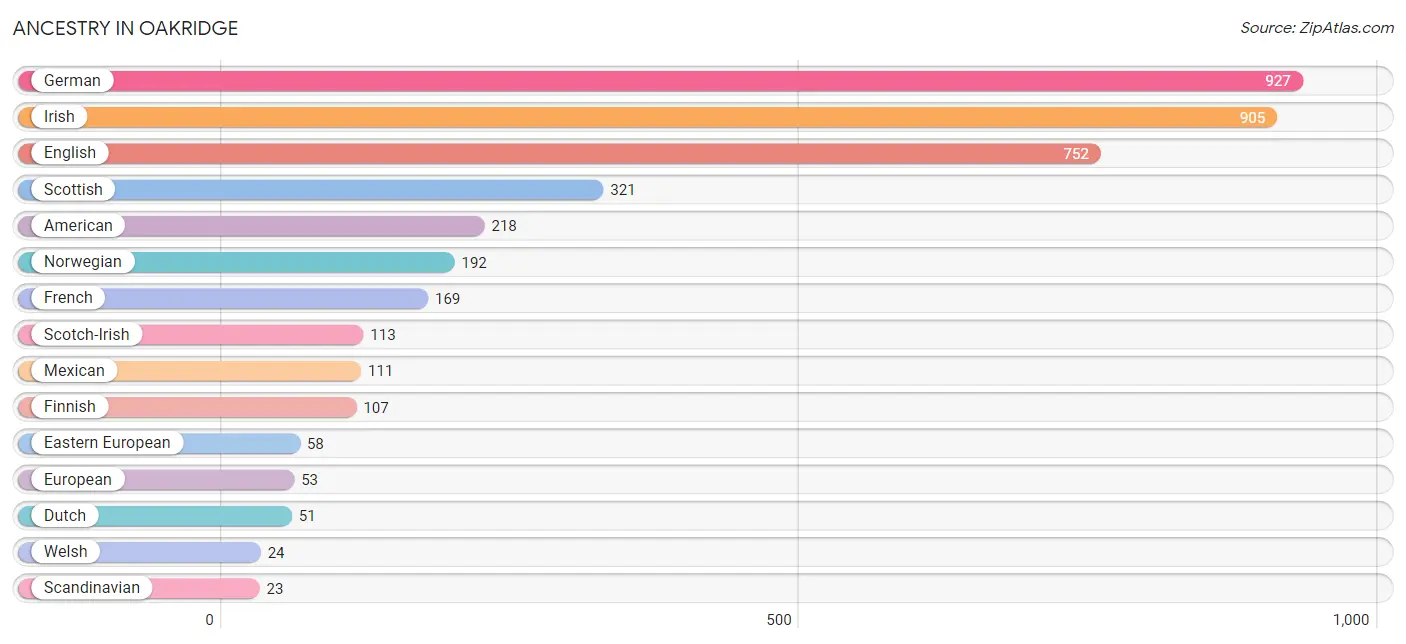
| Ancestry | # Population | % Population |
| American | 218 | 6.8% |
| Cherokee | 20 | 0.6% |
| Dutch | 51 | 1.6% |
| Eastern European | 58 | 1.8% |
| English | 752 | 23.4% |
| European | 53 | 1.7% |
| Finnish | 107 | 3.3% |
| French | 169 | 5.3% |
| French Canadian | 18 | 0.6% |
| German | 927 | 28.9% |
| Irish | 905 | 28.2% |
| Mexican | 111 | 3.5% |
| New Zealander | 11 | 0.3% |
| Norwegian | 192 | 6.0% |
| Scandinavian | 23 | 0.7% |
| Scotch-Irish | 113 | 3.5% |
| Scottish | 321 | 10.0% |
| Swedish | 11 | 0.3% |
| Swiss | 16 | 0.5% |
| Welsh | 24 | 0.7% | View All 20 Rows |
Immigrants in Oakridge
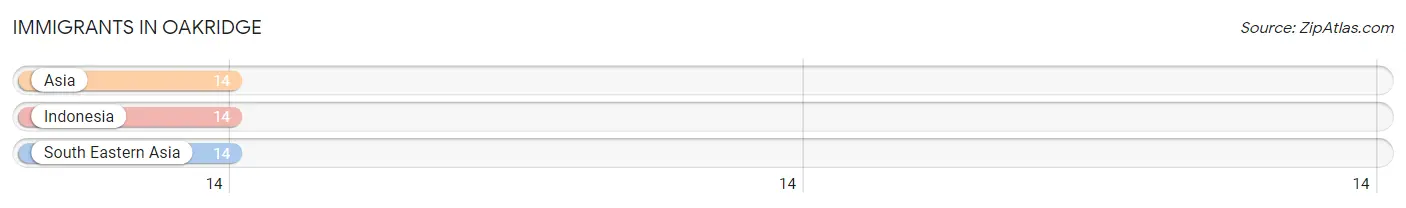
The most numerous immigrant groups reported in Oakridge came from Asia (14 | 0.4%), Indonesia (14 | 0.4%), and South Eastern Asia (14 | 0.4%), together accounting for 1.3% of all Oakridge residents.
| Immigration Origin | # Population | % Population |
| Asia | 14 | 0.4% |
| Indonesia | 14 | 0.4% |
| South Eastern Asia | 14 | 0.4% | View All 3 Rows |
Sex and Age in Oakridge
Sex and Age in Oakridge
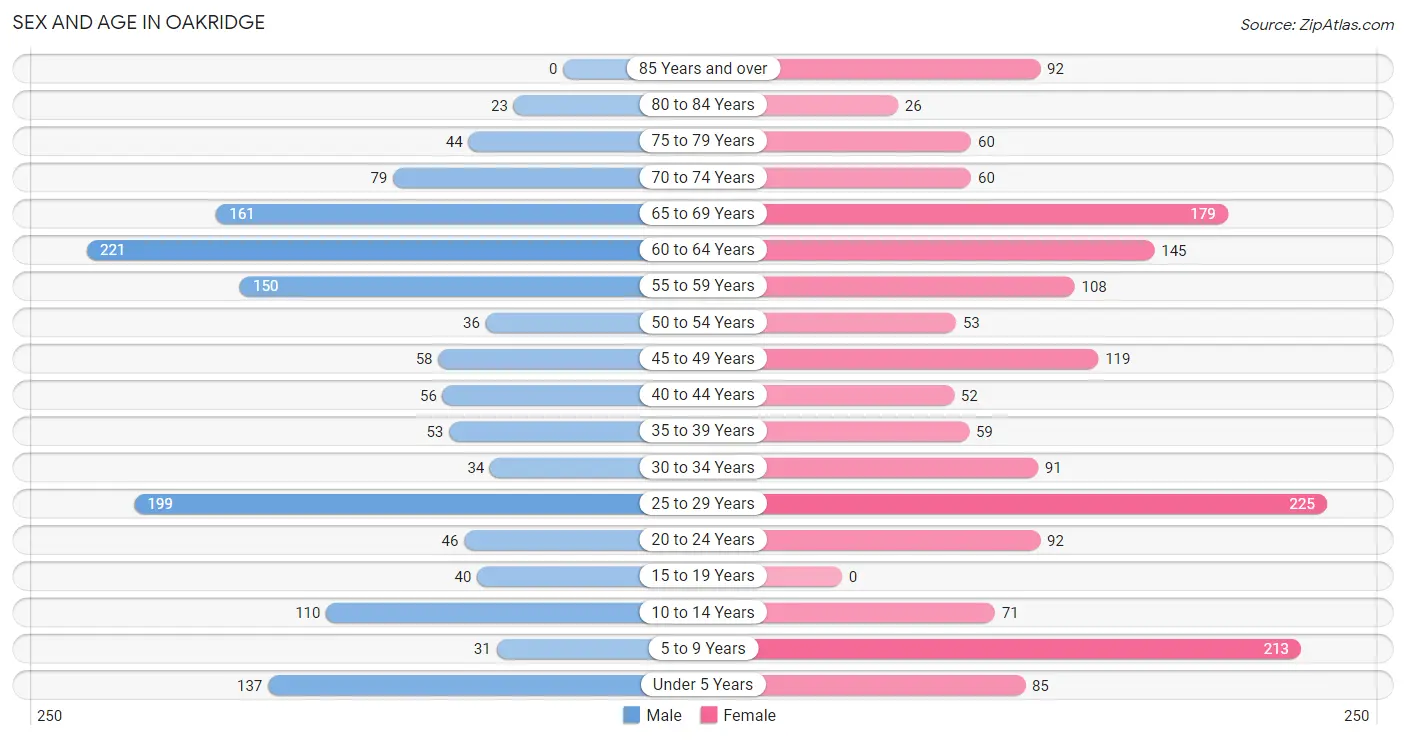
The most populous age groups in Oakridge are 60 to 64 Years (221 | 14.9%) for men and 25 to 29 Years (225 | 13.0%) for women.
| Age Bracket | Male | Female |
| Under 5 Years | 137 (9.3%) | 85 (4.9%) |
| 5 to 9 Years | 31 (2.1%) | 213 (12.3%) |
| 10 to 14 Years | 110 (7.4%) | 71 (4.1%) |
| 15 to 19 Years | 40 (2.7%) | 0 (0.0%) |
| 20 to 24 Years | 46 (3.1%) | 92 (5.3%) |
| 25 to 29 Years | 199 (13.5%) | 225 (13.0%) |
| 30 to 34 Years | 34 (2.3%) | 91 (5.3%) |
| 35 to 39 Years | 53 (3.6%) | 59 (3.4%) |
| 40 to 44 Years | 56 (3.8%) | 52 (3.0%) |
| 45 to 49 Years | 58 (3.9%) | 119 (6.9%) |
| 50 to 54 Years | 36 (2.4%) | 53 (3.1%) |
| 55 to 59 Years | 150 (10.2%) | 108 (6.2%) |
| 60 to 64 Years | 221 (14.9%) | 145 (8.4%) |
| 65 to 69 Years | 161 (10.9%) | 179 (10.3%) |
| 70 to 74 Years | 79 (5.3%) | 60 (3.5%) |
| 75 to 79 Years | 44 (3.0%) | 60 (3.5%) |
| 80 to 84 Years | 23 (1.6%) | 26 (1.5%) |
| 85 Years and over | 0 (0.0%) | 92 (5.3%) |
| Total | 1,478 (100.0%) | 1,730 (100.0%) |
Families and Households in Oakridge
Median Family Size in Oakridge
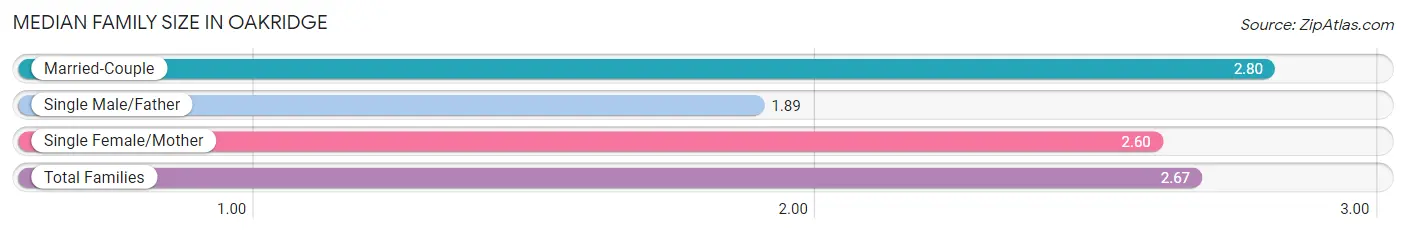
The median family size in Oakridge is 2.67 persons per family, with married-couple families (521 | 63.2%) accounting for the largest median family size of 2.8 persons per family. On the other hand, single male/father families (64 | 7.8%) represent the smallest median family size with 1.89 persons per family.
| Family Type | # Families | Family Size |
| Married-Couple | 521 (63.2%) | 2.80 |
| Single Male/Father | 64 (7.8%) | 1.89 |
| Single Female/Mother | 239 (29.0%) | 2.60 |
| Total Families | 824 (100.0%) | 2.67 |
Median Household Size in Oakridge
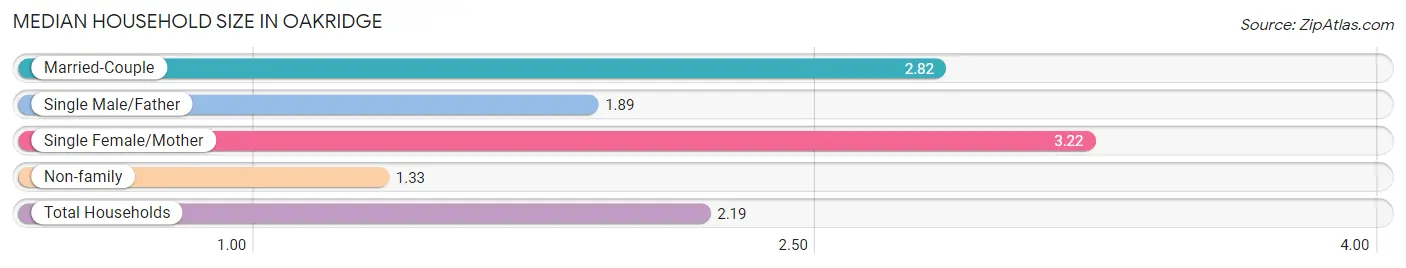
The median household size in Oakridge is 2.19 persons per household, with single female/mother households (239 | 16.3%) accounting for the largest median household size of 3.22 persons per household. non-family households (639 | 43.7%) represent the smallest median household size with 1.33 persons per household.
| Household Type | # Households | Household Size |
| Married-Couple | 521 (35.6%) | 2.82 |
| Single Male/Father | 64 (4.4%) | 1.89 |
| Single Female/Mother | 239 (16.3%) | 3.22 |
| Non-family | 639 (43.7%) | 1.33 |
| Total Households | 1,463 (100.0%) | 2.19 |
Household Size by Marriage Status in Oakridge
Out of a total of 1,463 households in Oakridge, 824 (56.3%) are family households, while 639 (43.7%) are nonfamily households. The most numerous type of family households are 2-person households, comprising 491, and the most common type of nonfamily households are 1-person households, comprising 528.
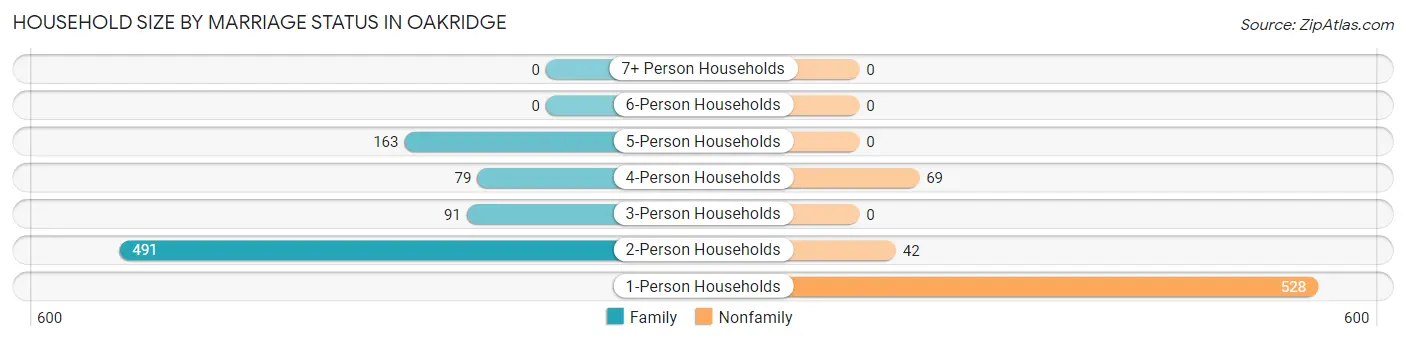
| Household Size | Family Households | Nonfamily Households |
| 1-Person Households | - | 528 (36.1%) |
| 2-Person Households | 491 (33.6%) | 42 (2.9%) |
| 3-Person Households | 91 (6.2%) | 0 (0.0%) |
| 4-Person Households | 79 (5.4%) | 69 (4.7%) |
| 5-Person Households | 163 (11.1%) | 0 (0.0%) |
| 6-Person Households | 0 (0.0%) | 0 (0.0%) |
| 7+ Person Households | 0 (0.0%) | 0 (0.0%) |
| Total | 824 (56.3%) | 639 (43.7%) |
Female Fertility in Oakridge
Fertility by Age in Oakridge
Average fertility rate in Oakridge is 105.0 births per 1,000 women. Women in the age bracket of 20 to 34 years have the highest fertility rate with 164.0 births per 1,000 women. Women in the age bracket of 20 to 34 years acount for 100.0% of all women with births.
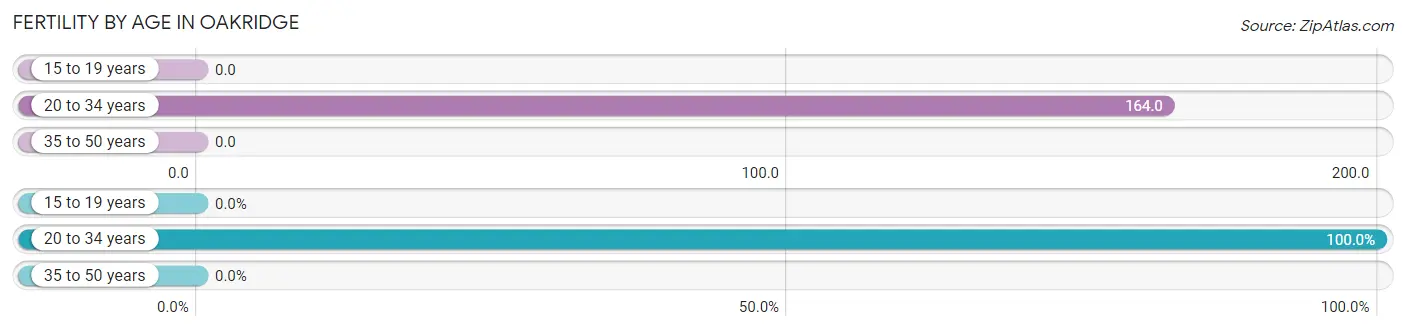
| Age Bracket | Women with Births | Births / 1,000 Women |
| 15 to 19 years | 0 (0.0%) | 0.0 |
| 20 to 34 years | 67 (100.0%) | 164.0 |
| 35 to 50 years | 0 (0.0%) | 0.0 |
| Total | 67 (100.0%) | 105.0 |
Fertility by Age by Marriage Status in Oakridge
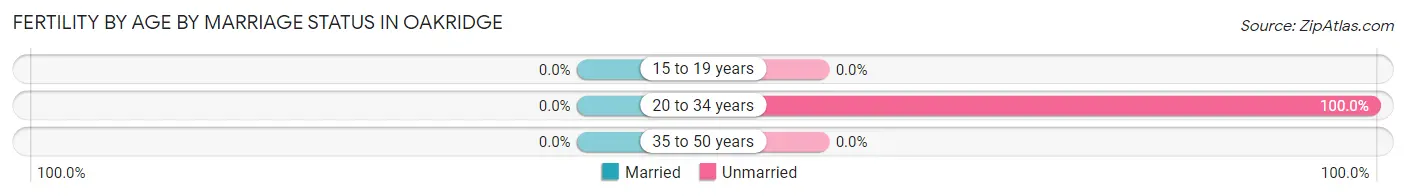
| Age Bracket | Married | Unmarried |
| 15 to 19 years | 0 (0.0%) | 0 (0.0%) |
| 20 to 34 years | 0 (0.0%) | 67 (100.0%) |
| 35 to 50 years | 0 (0.0%) | 0 (0.0%) |
| Total | 0 (0.0%) | 67 (100.0%) |
Fertility by Education in Oakridge
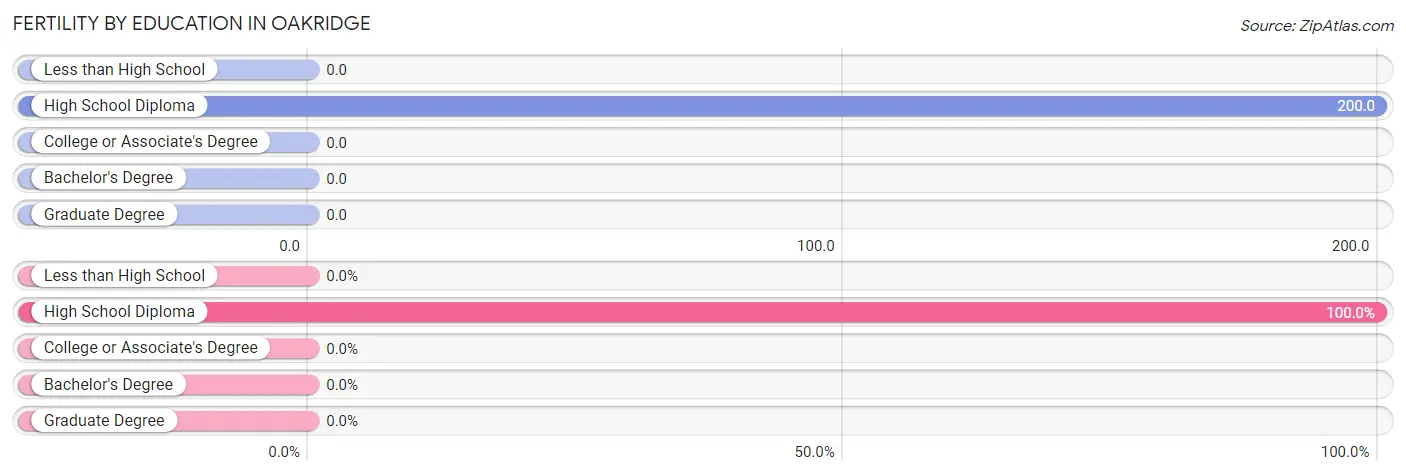
| Educational Attainment | Women with Births | Births / 1,000 Women |
| Less than High School | 0 (0.0%) | 0.0 |
| High School Diploma | 67 (100.0%) | 200.0 |
| College or Associate's Degree | 0 (0.0%) | 0.0 |
| Bachelor's Degree | 0 (0.0%) | 0.0 |
| Graduate Degree | 0 (0.0%) | 0.0 |
| Total | 67 (100.0%) | 105.0 |
Fertility by Education by Marriage Status in Oakridge
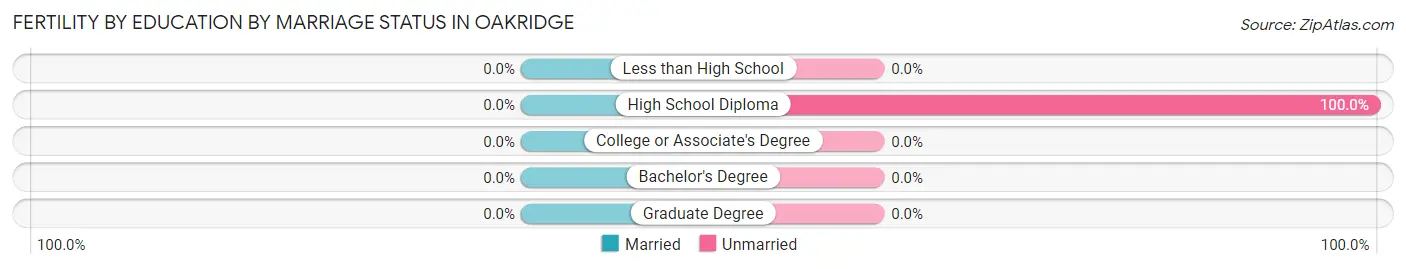
| Educational Attainment | Married | Unmarried |
| Less than High School | 0 (0.0%) | 0 (0.0%) |
| High School Diploma | 0 (0.0%) | 67 (100.0%) |
| College or Associate's Degree | 0 (0.0%) | 0 (0.0%) |
| Bachelor's Degree | 0 (0.0%) | 0 (0.0%) |
| Graduate Degree | 0 (0.0%) | 0 (0.0%) |
| Total | 0 (0.0%) | 67 (100.0%) |
Employment Characteristics in Oakridge
Employment by Class of Employer in Oakridge
Among the 748 employed individuals in Oakridge, private company employees (355 | 47.5%), self-employed (not incorporated) (160 | 21.4%), and local government employees (121 | 16.2%) make up the most common classes of employment.
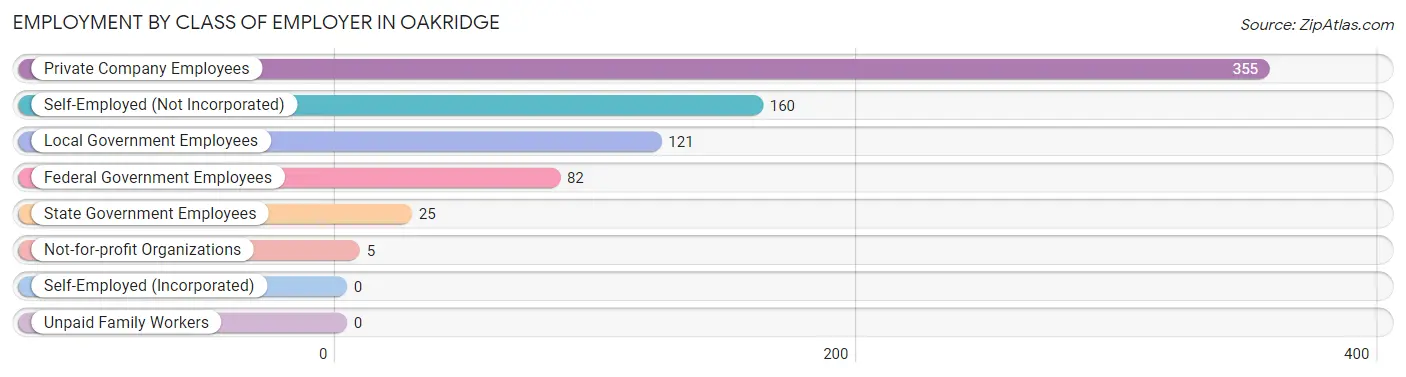
| Employer Class | # Employees | % Employees |
| Private Company Employees | 355 | 47.5% |
| Self-Employed (Incorporated) | 0 | 0.0% |
| Self-Employed (Not Incorporated) | 160 | 21.4% |
| Not-for-profit Organizations | 5 | 0.7% |
| Local Government Employees | 121 | 16.2% |
| State Government Employees | 25 | 3.3% |
| Federal Government Employees | 82 | 11.0% |
| Unpaid Family Workers | 0 | 0.0% |
| Total | 748 | 100.0% |
Employment Status by Age in Oakridge
According to the labor force statistics for Oakridge, out of the total population over 16 years of age (2,561), 38.2% or 978 individuals are in the labor force, with 23.5% or 230 of them unemployed. The age group with the highest labor force participation rate is 35 to 44 years, with 75.5% or 166 individuals in the labor force. Within the labor force, the 25 to 29 years age range has the highest percentage of unemployed individuals, with 85.6% or 202 of them being unemployed.
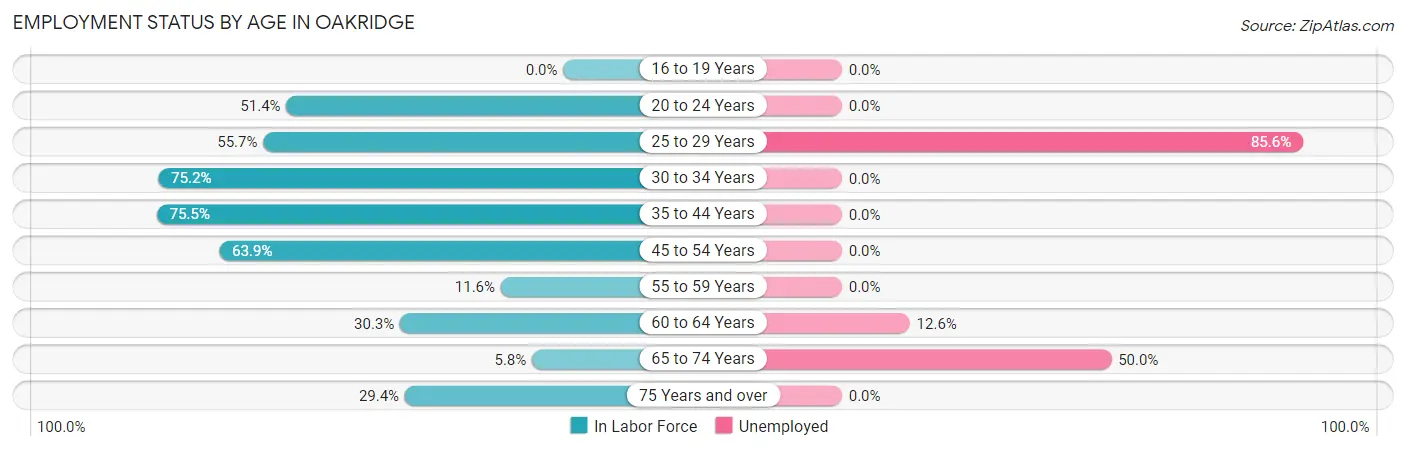
| Age Bracket | In Labor Force | Unemployed |
| 16 to 19 Years | 0 (0.0%) | 0 (0.0%) |
| 20 to 24 Years | 71 (51.4%) | 0 (0.0%) |
| 25 to 29 Years | 236 (55.7%) | 202 (85.6%) |
| 30 to 34 Years | 94 (75.2%) | 0 (0.0%) |
| 35 to 44 Years | 166 (75.5%) | 0 (0.0%) |
| 45 to 54 Years | 170 (63.9%) | 0 (0.0%) |
| 55 to 59 Years | 30 (11.6%) | 0 (0.0%) |
| 60 to 64 Years | 111 (30.3%) | 14 (12.6%) |
| 65 to 74 Years | 28 (5.8%) | 14 (50.0%) |
| 75 Years and over | 72 (29.4%) | 0 (0.0%) |
| Total | 978 (38.2%) | 230 (23.5%) |
Employment Status by Educational Attainment in Oakridge
According to labor force statistics for Oakridge, 48.6% of individuals (806) out of the total population between 25 and 64 years of age (1,659) are in the labor force, with 26.8% or 216 of them being unemployed. The group with the highest labor force participation rate are those with the educational attainment of college / associate degree, with 65.8% or 208 individuals in the labor force. Within the labor force, individuals with college / associate degree education have the highest percentage of unemployment, with 43.8% or 91 of them being unemployed.
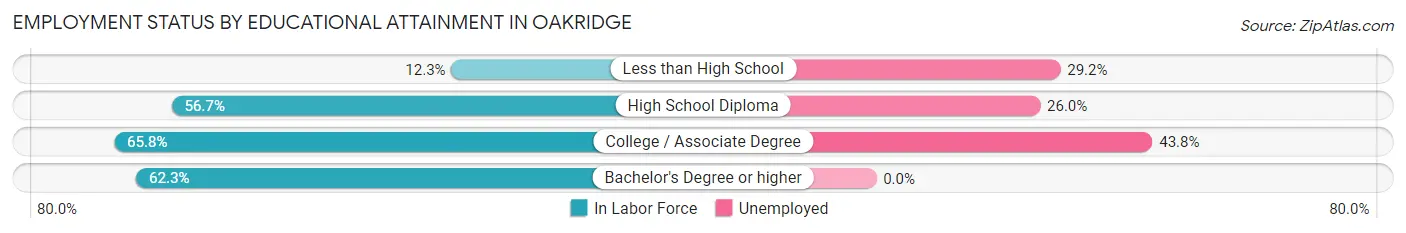
| Educational Attainment | In Labor Force | Unemployed |
| Less than High School | 48 (12.3%) | 114 (29.2%) |
| High School Diploma | 427 (56.7%) | 196 (26.0%) |
| College / Associate Degree | 208 (65.8%) | 138 (43.8%) |
| Bachelor's Degree or higher | 124 (62.3%) | 0 (0.0%) |
| Total | 806 (48.6%) | 445 (26.8%) |
Employment Occupations by Sex in Oakridge
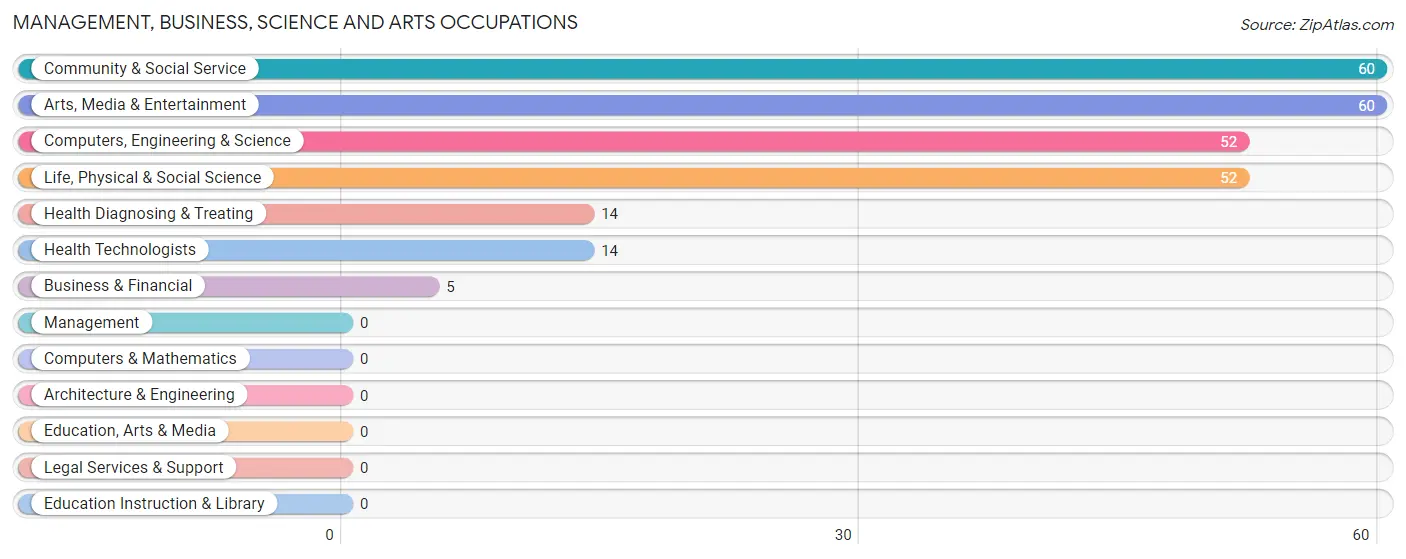
Management, Business, Science and Arts Occupations
The most common Management, Business, Science and Arts occupations in Oakridge are Community & Social Service (60 | 8.0%), Arts, Media & Entertainment (60 | 8.0%), Computers, Engineering & Science (52 | 7.0%), Life, Physical & Social Science (52 | 7.0%), and Health Diagnosing & Treating (14 | 1.9%).
Management, Business, Science and Arts Occupations by Sex
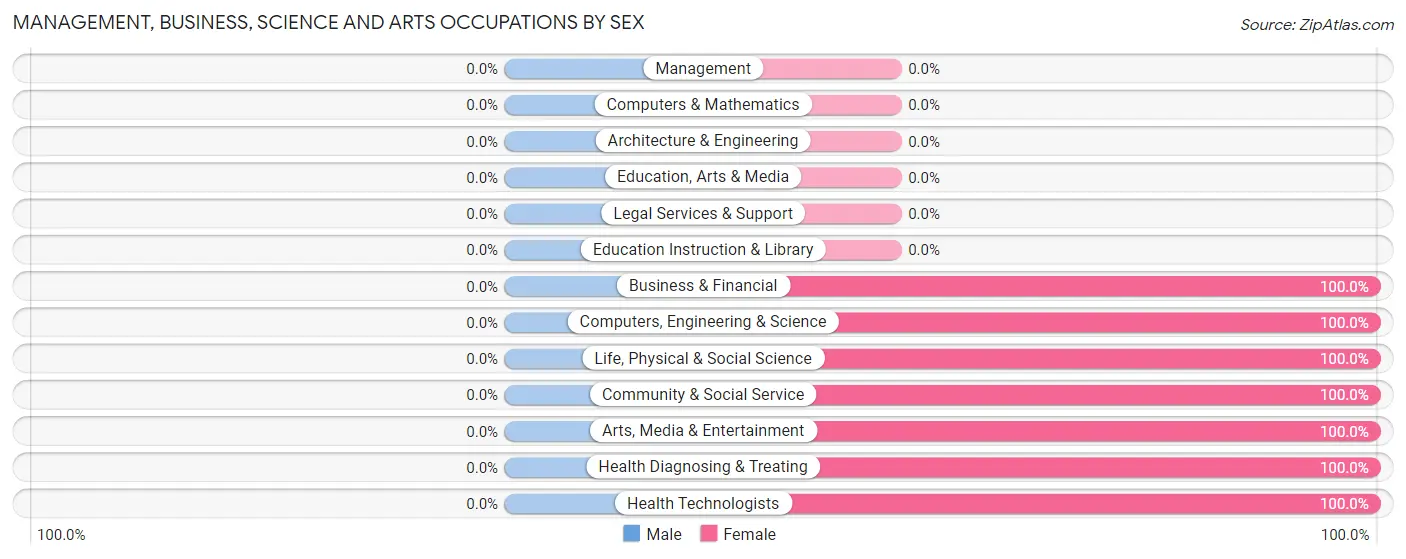
| Occupation | Male | Female |
| Management | 0 (0.0%) | 0 (0.0%) |
| Business & Financial | 0 (0.0%) | 5 (100.0%) |
| Computers, Engineering & Science | 0 (0.0%) | 52 (100.0%) |
| Computers & Mathematics | 0 (0.0%) | 0 (0.0%) |
| Architecture & Engineering | 0 (0.0%) | 0 (0.0%) |
| Life, Physical & Social Science | 0 (0.0%) | 52 (100.0%) |
| Community & Social Service | 0 (0.0%) | 60 (100.0%) |
| Education, Arts & Media | 0 (0.0%) | 0 (0.0%) |
| Legal Services & Support | 0 (0.0%) | 0 (0.0%) |
| Education Instruction & Library | 0 (0.0%) | 0 (0.0%) |
| Arts, Media & Entertainment | 0 (0.0%) | 60 (100.0%) |
| Health Diagnosing & Treating | 0 (0.0%) | 14 (100.0%) |
| Health Technologists | 0 (0.0%) | 14 (100.0%) |
| Total (Category) | 0 (0.0%) | 131 (100.0%) |
| Total (Overall) | 357 (47.7%) | 391 (52.3%) |
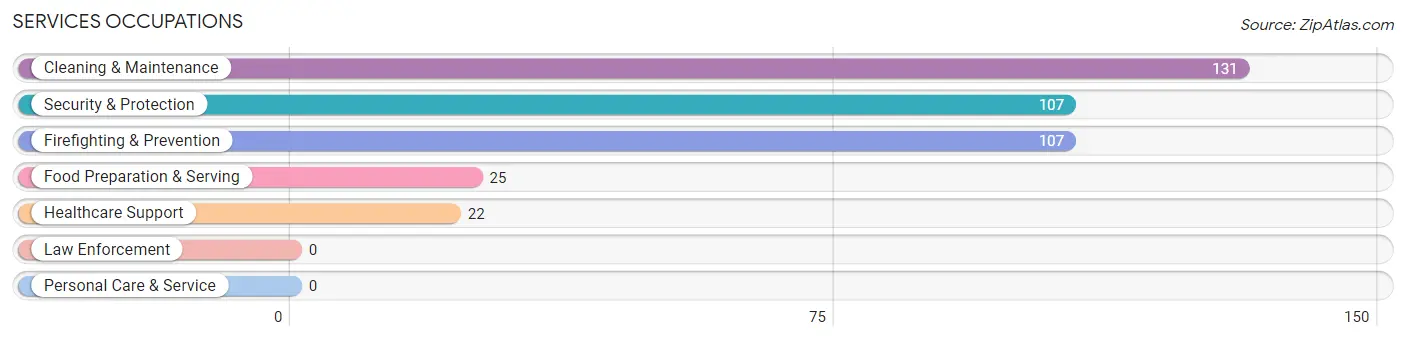
Services Occupations
The most common Services occupations in Oakridge are Cleaning & Maintenance (131 | 17.5%), Security & Protection (107 | 14.3%), Firefighting & Prevention (107 | 14.3%), Food Preparation & Serving (25 | 3.3%), and Healthcare Support (22 | 2.9%).
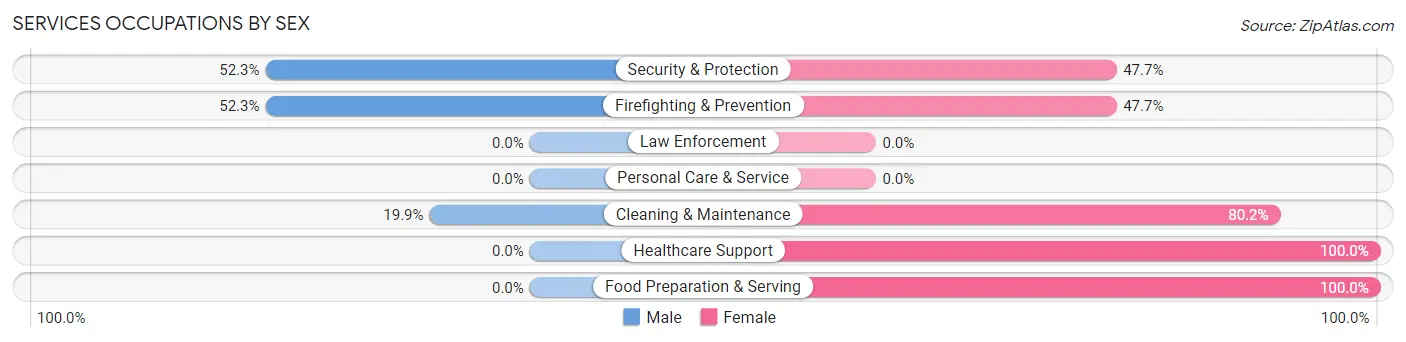
Services Occupations by Sex
Within the Services occupations in Oakridge, the most male-oriented occupations are Security & Protection (52.3%), Firefighting & Prevention (52.3%), and Cleaning & Maintenance (19.9%), while the most female-oriented occupations are Healthcare Support (100.0%), Food Preparation & Serving (100.0%), and Cleaning & Maintenance (80.1%).
| Occupation | Male | Female |
| Healthcare Support | 0 (0.0%) | 22 (100.0%) |
| Security & Protection | 56 (52.3%) | 51 (47.7%) |
| Firefighting & Prevention | 56 (52.3%) | 51 (47.7%) |
| Law Enforcement | 0 (0.0%) | 0 (0.0%) |
| Food Preparation & Serving | 0 (0.0%) | 25 (100.0%) |
| Cleaning & Maintenance | 26 (19.9%) | 105 (80.1%) |
| Personal Care & Service | 0 (0.0%) | 0 (0.0%) |
| Total (Category) | 82 (28.8%) | 203 (71.2%) |
| Total (Overall) | 357 (47.7%) | 391 (52.3%) |
Sales and Office Occupations
The most common Sales and Office occupations in Oakridge are , and Office & Administration (52 | 7.0%).
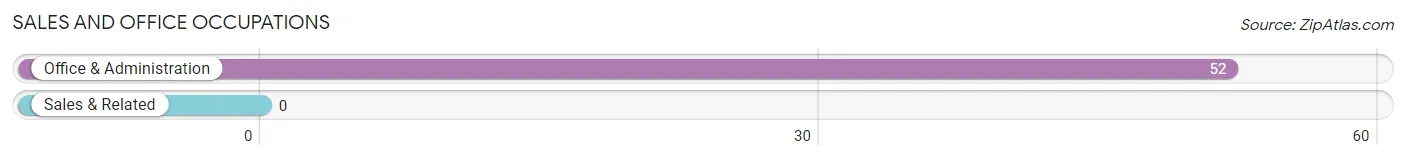
Sales and Office Occupations by Sex

| Occupation | Male | Female |
| Sales & Related | 0 (0.0%) | 0 (0.0%) |
| Office & Administration | 0 (0.0%) | 52 (100.0%) |
| Total (Category) | 0 (0.0%) | 52 (100.0%) |
| Total (Overall) | 357 (47.7%) | 391 (52.3%) |
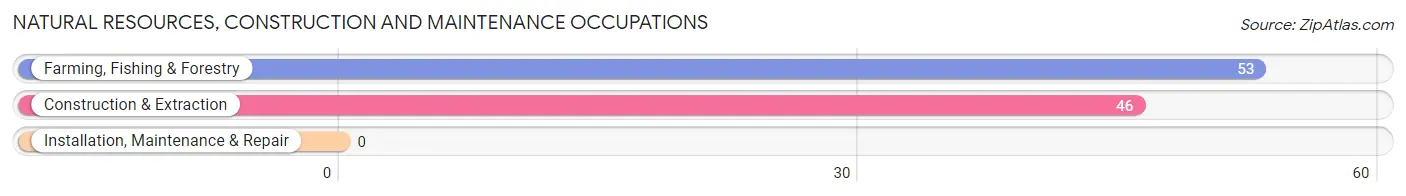
Natural Resources, Construction and Maintenance Occupations
The most common Natural Resources, Construction and Maintenance occupations in Oakridge are Farming, Fishing & Forestry (53 | 7.1%), and Construction & Extraction (46 | 6.1%).
Natural Resources, Construction and Maintenance Occupations by Sex
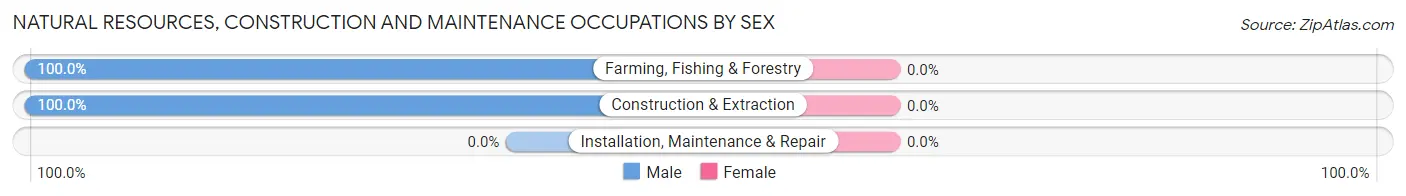
| Occupation | Male | Female |
| Farming, Fishing & Forestry | 53 (100.0%) | 0 (0.0%) |
| Construction & Extraction | 46 (100.0%) | 0 (0.0%) |
| Installation, Maintenance & Repair | 0 (0.0%) | 0 (0.0%) |
| Total (Category) | 99 (100.0%) | 0 (0.0%) |
| Total (Overall) | 357 (47.7%) | 391 (52.3%) |
Production, Transportation and Moving Occupations
The most common Production, Transportation and Moving occupations in Oakridge are Transportation (151 | 20.2%), Production (26 | 3.5%), and Material Moving (4 | 0.5%).
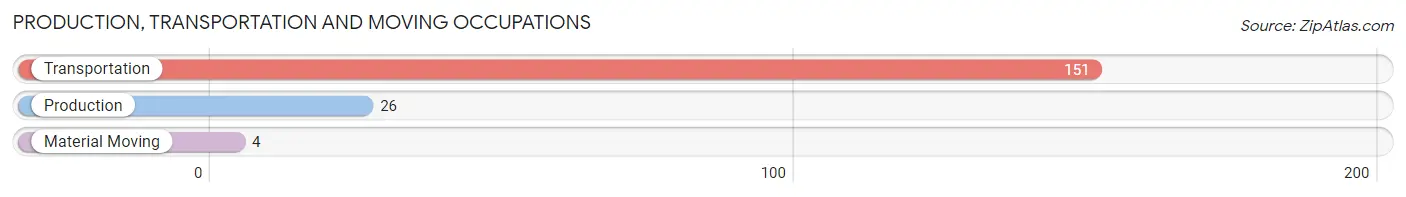
Production, Transportation and Moving Occupations by Sex
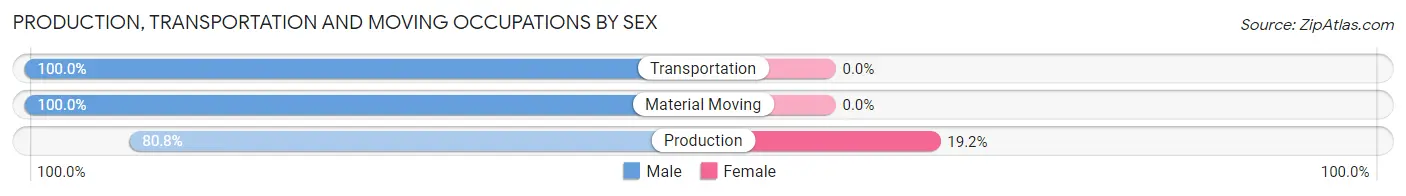
| Occupation | Male | Female |
| Production | 21 (80.8%) | 5 (19.2%) |
| Transportation | 151 (100.0%) | 0 (0.0%) |
| Material Moving | 4 (100.0%) | 0 (0.0%) |
| Total (Category) | 176 (97.2%) | 5 (2.8%) |
| Total (Overall) | 357 (47.7%) | 391 (52.3%) |
Employment Industries by Sex in Oakridge
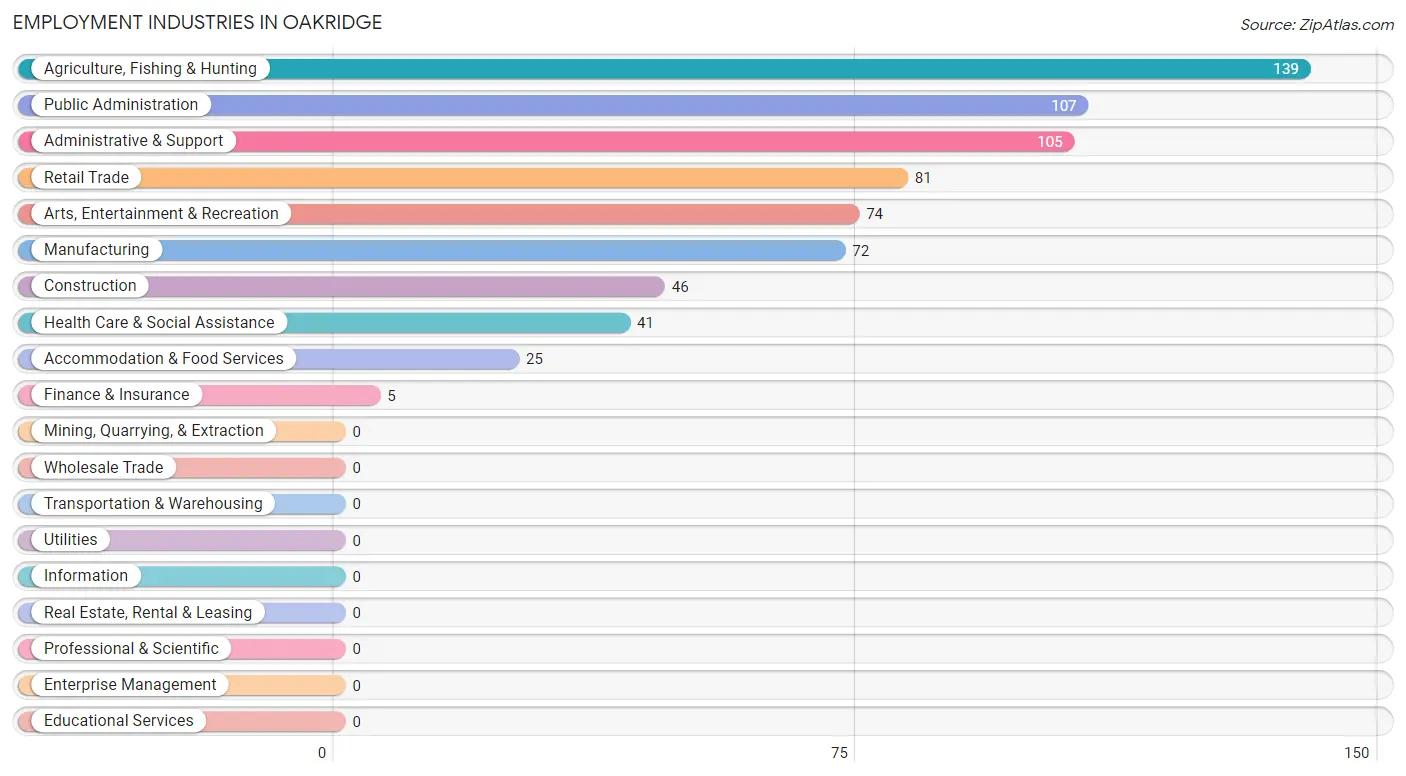
Employment Industries in Oakridge
The major employment industries in Oakridge include Agriculture, Fishing & Hunting (139 | 18.6%), Public Administration (107 | 14.3%), Administrative & Support (105 | 14.0%), Retail Trade (81 | 10.8%), and Arts, Entertainment & Recreation (74 | 9.9%).
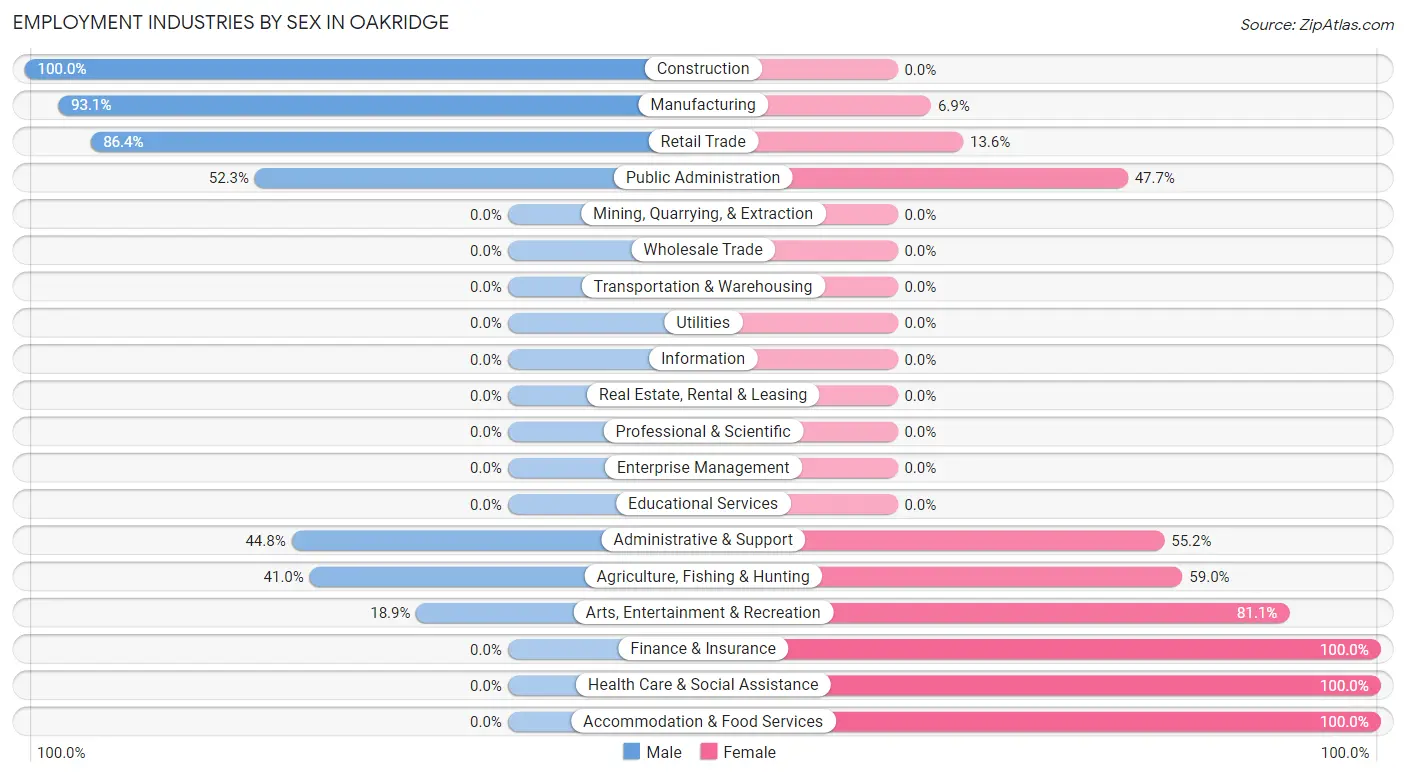
Employment Industries by Sex in Oakridge
The Oakridge industries that see more men than women are Construction (100.0%), Manufacturing (93.1%), and Retail Trade (86.4%), whereas the industries that tend to have a higher number of women are Finance & Insurance (100.0%), Health Care & Social Assistance (100.0%), and Accommodation & Food Services (100.0%).
| Industry | Male | Female |
| Agriculture, Fishing & Hunting | 57 (41.0%) | 82 (59.0%) |
| Mining, Quarrying, & Extraction | 0 (0.0%) | 0 (0.0%) |
| Construction | 46 (100.0%) | 0 (0.0%) |
| Manufacturing | 67 (93.1%) | 5 (6.9%) |
| Wholesale Trade | 0 (0.0%) | 0 (0.0%) |
| Retail Trade | 70 (86.4%) | 11 (13.6%) |
| Transportation & Warehousing | 0 (0.0%) | 0 (0.0%) |
| Utilities | 0 (0.0%) | 0 (0.0%) |
| Information | 0 (0.0%) | 0 (0.0%) |
| Finance & Insurance | 0 (0.0%) | 5 (100.0%) |
| Real Estate, Rental & Leasing | 0 (0.0%) | 0 (0.0%) |
| Professional & Scientific | 0 (0.0%) | 0 (0.0%) |
| Enterprise Management | 0 (0.0%) | 0 (0.0%) |
| Administrative & Support | 47 (44.8%) | 58 (55.2%) |
| Educational Services | 0 (0.0%) | 0 (0.0%) |
| Health Care & Social Assistance | 0 (0.0%) | 41 (100.0%) |
| Arts, Entertainment & Recreation | 14 (18.9%) | 60 (81.1%) |
| Accommodation & Food Services | 0 (0.0%) | 25 (100.0%) |
| Public Administration | 56 (52.3%) | 51 (47.7%) |
| Total | 357 (47.7%) | 391 (52.3%) |
Education in Oakridge
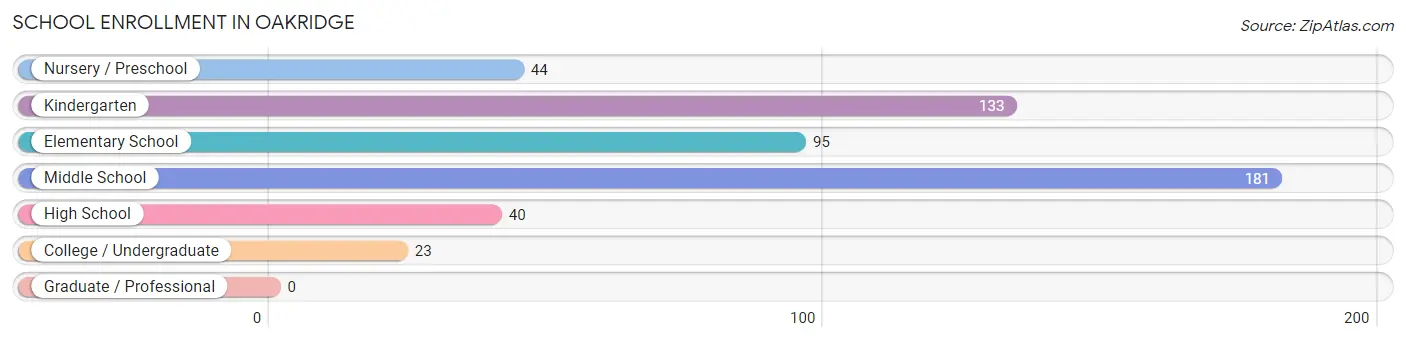
School Enrollment in Oakridge
The most common levels of schooling among the 516 students in Oakridge are middle school (181 | 35.1%), kindergarten (133 | 25.8%), and elementary school (95 | 18.4%).
| School Level | # Students | % Students |
| Nursery / Preschool | 44 | 8.5% |
| Kindergarten | 133 | 25.8% |
| Elementary School | 95 | 18.4% |
| Middle School | 181 | 35.1% |
| High School | 40 | 7.7% |
| College / Undergraduate | 23 | 4.5% |
| Graduate / Professional | 0 | 0.0% |
| Total | 516 | 100.0% |
School Enrollment by Age by Funding Source in Oakridge
Out of a total of 516 students who are enrolled in schools in Oakridge, 16 (3.1%) attend a private institution, while the remaining 500 (96.9%) are enrolled in public schools. The age group of 10 to 14 year olds has the highest likelihood of being enrolled in private schools, with 16 (8.8% in the age bracket) enrolled. Conversely, the age group of 3 to 4 year olds has the lowest likelihood of being enrolled in a private school, with 28 (100.0% in the age bracket) attending a public institution.
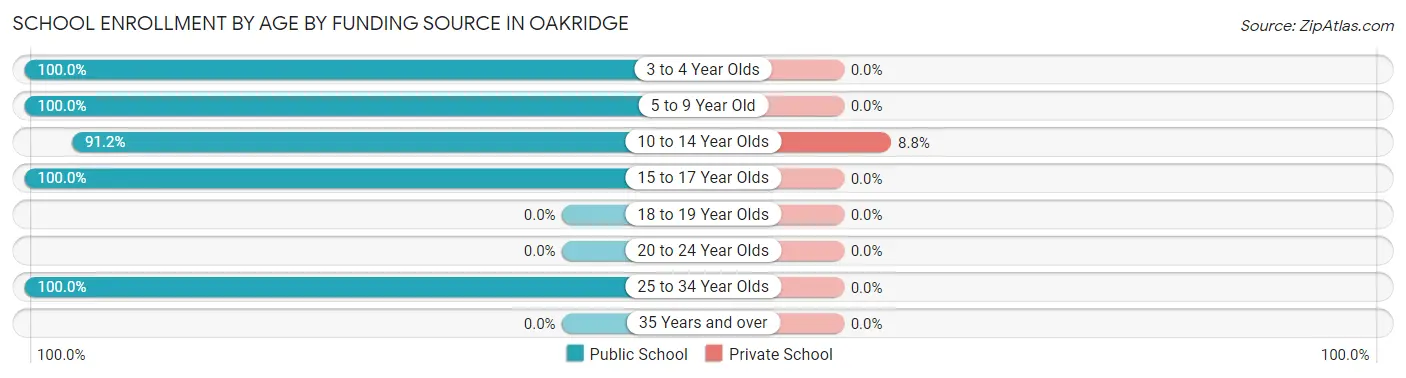
| Age Bracket | Public School | Private School |
| 3 to 4 Year Olds | 28 (100.0%) | 0 (0.0%) |
| 5 to 9 Year Old | 244 (100.0%) | 0 (0.0%) |
| 10 to 14 Year Olds | 165 (91.2%) | 16 (8.8%) |
| 15 to 17 Year Olds | 40 (100.0%) | 0 (0.0%) |
| 18 to 19 Year Olds | 0 (0.0%) | 0 (0.0%) |
| 20 to 24 Year Olds | 0 (0.0%) | 0 (0.0%) |
| 25 to 34 Year Olds | 23 (100.0%) | 0 (0.0%) |
| 35 Years and over | 0 (0.0%) | 0 (0.0%) |
| Total | 500 (96.9%) | 16 (3.1%) |
Educational Attainment by Field of Study in Oakridge
Visual & performing arts (88 | 21.6%), business (70 | 17.2%), literature & languages (60 | 14.7%), engineering (57 | 14.0%), and bio, nature & agricultural (52 | 12.8%) are the most common fields of study among 408 individuals in Oakridge who have obtained a bachelor's degree or higher.
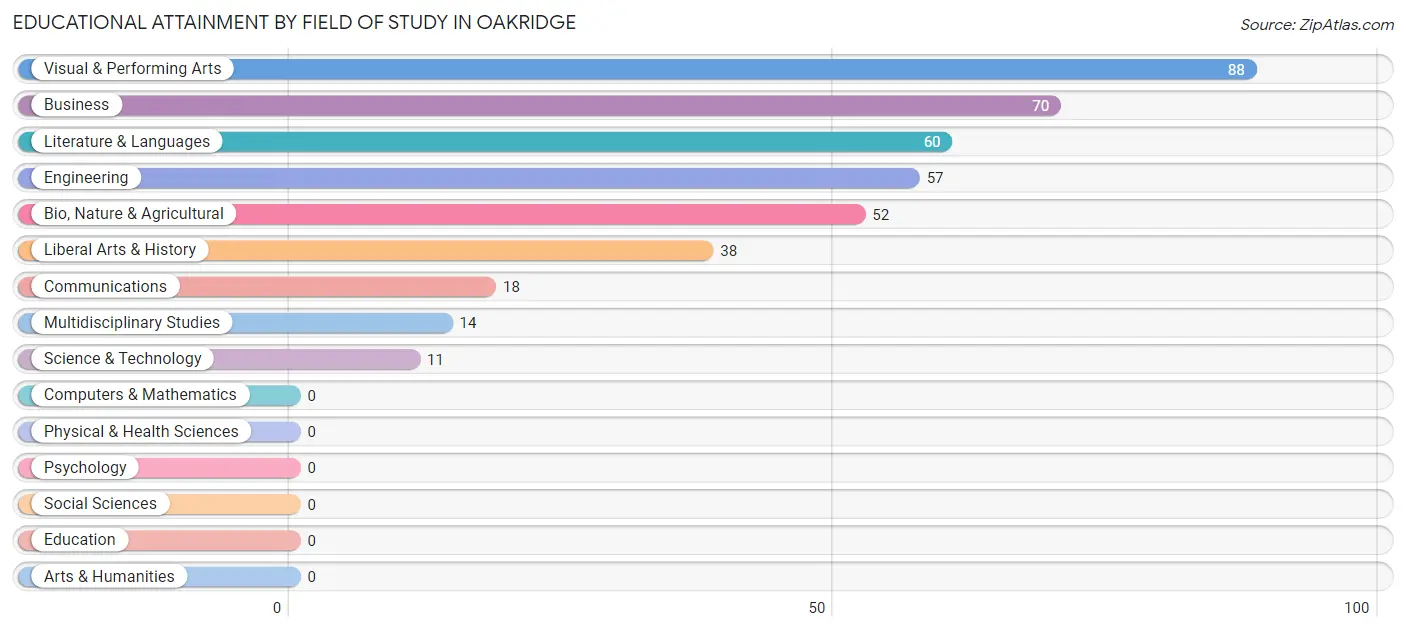
| Field of Study | # Graduates | % Graduates |
| Computers & Mathematics | 0 | 0.0% |
| Bio, Nature & Agricultural | 52 | 12.8% |
| Physical & Health Sciences | 0 | 0.0% |
| Psychology | 0 | 0.0% |
| Social Sciences | 0 | 0.0% |
| Engineering | 57 | 14.0% |
| Multidisciplinary Studies | 14 | 3.4% |
| Science & Technology | 11 | 2.7% |
| Business | 70 | 17.2% |
| Education | 0 | 0.0% |
| Literature & Languages | 60 | 14.7% |
| Liberal Arts & History | 38 | 9.3% |
| Visual & Performing Arts | 88 | 21.6% |
| Communications | 18 | 4.4% |
| Arts & Humanities | 0 | 0.0% |
| Total | 408 | 100.0% |
Transportation & Commute in Oakridge
Vehicle Availability by Sex in Oakridge
The most prevalent vehicle ownership categories in Oakridge are males with 2 vehicles (188, accounting for 52.7%) and females with 2 vehicles (78, making up 48.1%).
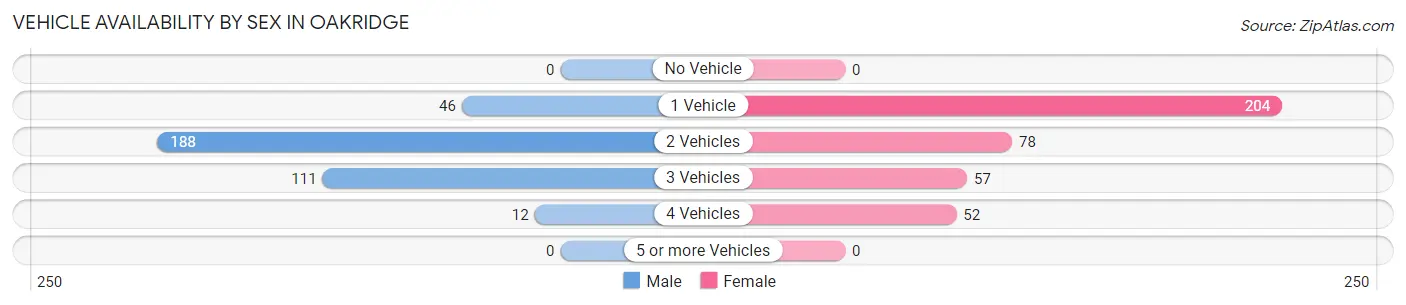
| Vehicles Available | Male | Female |
| No Vehicle | 0 (0.0%) | 0 (0.0%) |
| 1 Vehicle | 46 (12.9%) | 204 (52.2%) |
| 2 Vehicles | 188 (52.7%) | 78 (20.0%) |
| 3 Vehicles | 111 (31.1%) | 57 (14.6%) |
| 4 Vehicles | 12 (3.4%) | 52 (13.3%) |
| 5 or more Vehicles | 0 (0.0%) | 0 (0.0%) |
| Total | 357 (100.0%) | 391 (100.0%) |
Commute Time in Oakridge
The most frequently occuring commute durations in Oakridge are 45 to 59 minutes (227 commuters, 36.3%), 5 to 9 minutes (174 commuters, 27.8%), and 60 to 89 minutes (80 commuters, 12.8%).
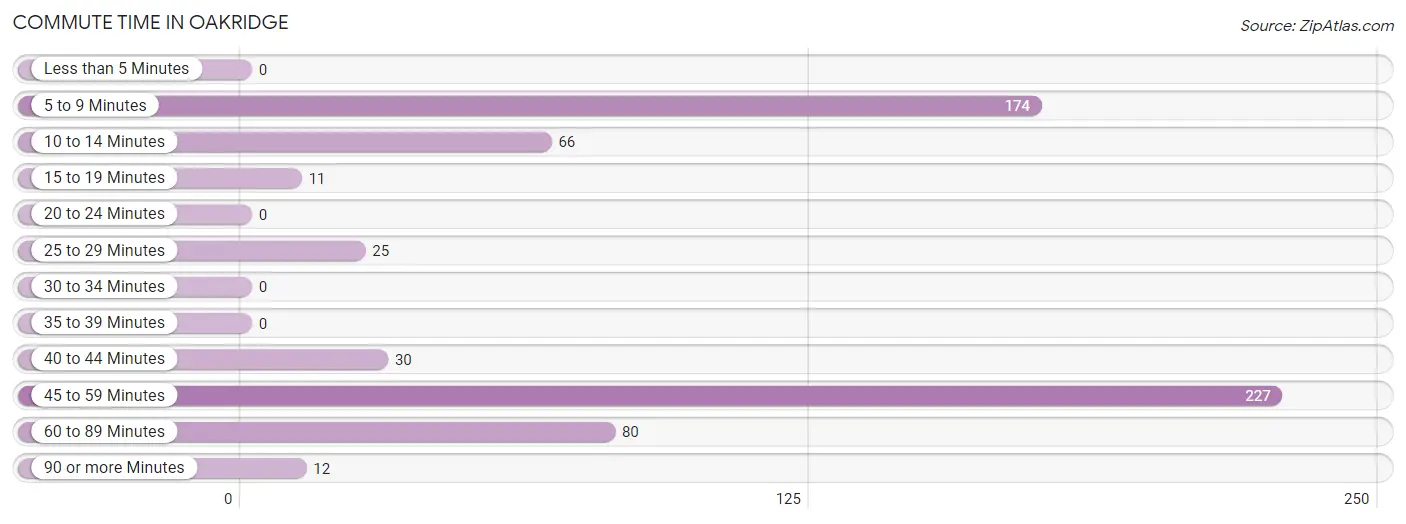
| Commute Time | # Commuters | % Commuters |
| Less than 5 Minutes | 0 | 0.0% |
| 5 to 9 Minutes | 174 | 27.8% |
| 10 to 14 Minutes | 66 | 10.6% |
| 15 to 19 Minutes | 11 | 1.8% |
| 20 to 24 Minutes | 0 | 0.0% |
| 25 to 29 Minutes | 25 | 4.0% |
| 30 to 34 Minutes | 0 | 0.0% |
| 35 to 39 Minutes | 0 | 0.0% |
| 40 to 44 Minutes | 30 | 4.8% |
| 45 to 59 Minutes | 227 | 36.3% |
| 60 to 89 Minutes | 80 | 12.8% |
| 90 or more Minutes | 12 | 1.9% |
Commute Time by Sex in Oakridge
The most common commute times in Oakridge are 45 to 59 minutes (121 commuters, 39.0%) for males and 5 to 9 minutes (116 commuters, 36.8%) for females.
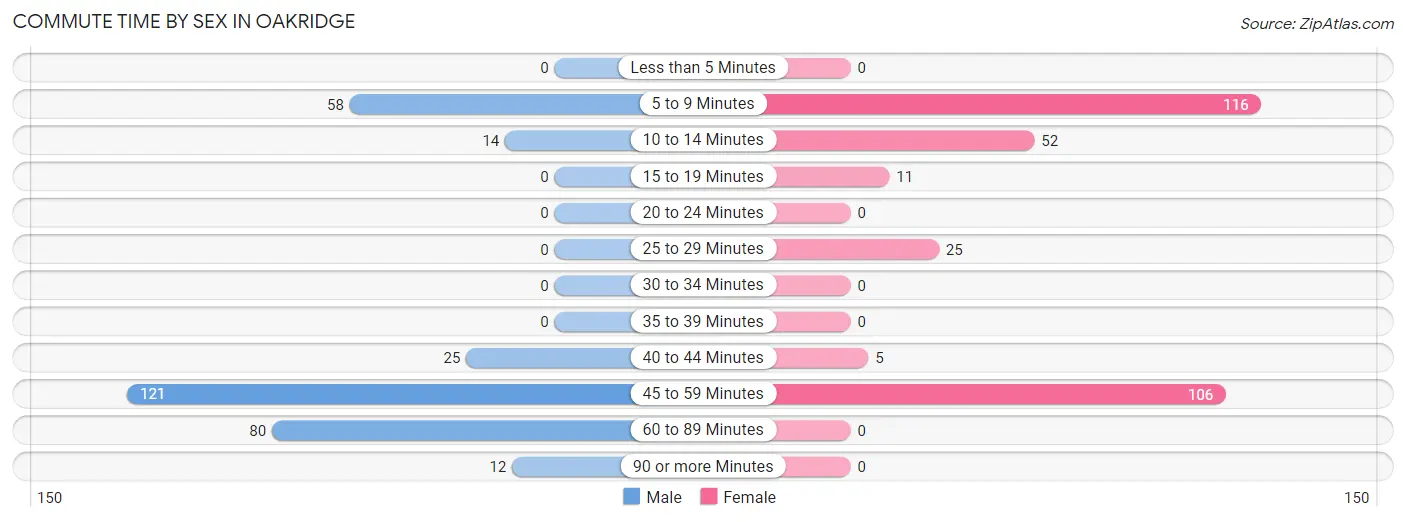
| Commute Time | Male | Female |
| Less than 5 Minutes | 0 (0.0%) | 0 (0.0%) |
| 5 to 9 Minutes | 58 (18.7%) | 116 (36.8%) |
| 10 to 14 Minutes | 14 (4.5%) | 52 (16.5%) |
| 15 to 19 Minutes | 0 (0.0%) | 11 (3.5%) |
| 20 to 24 Minutes | 0 (0.0%) | 0 (0.0%) |
| 25 to 29 Minutes | 0 (0.0%) | 25 (7.9%) |
| 30 to 34 Minutes | 0 (0.0%) | 0 (0.0%) |
| 35 to 39 Minutes | 0 (0.0%) | 0 (0.0%) |
| 40 to 44 Minutes | 25 (8.1%) | 5 (1.6%) |
| 45 to 59 Minutes | 121 (39.0%) | 106 (33.7%) |
| 60 to 89 Minutes | 80 (25.8%) | 0 (0.0%) |
| 90 or more Minutes | 12 (3.9%) | 0 (0.0%) |
Time of Departure to Work by Sex in Oakridge
The most frequent times of departure to work in Oakridge are 7:00 AM to 7:29 AM (84, 27.1%) for males and 6:30 AM to 6:59 AM (97, 30.8%) for females.
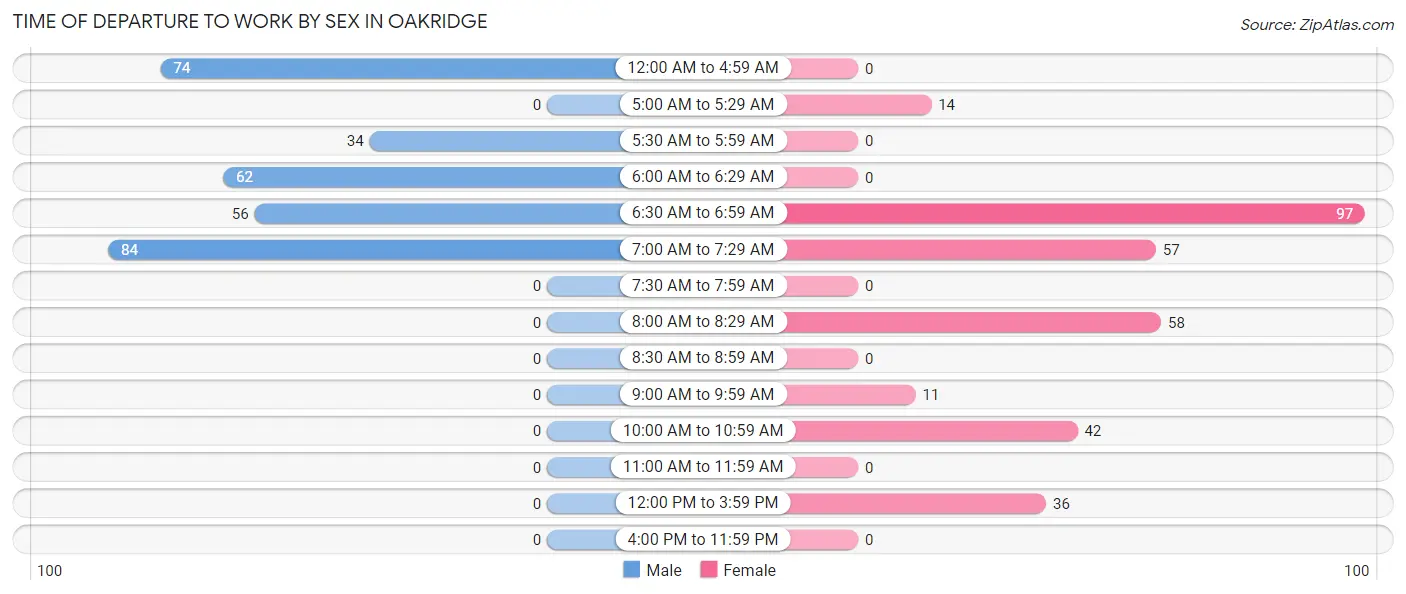
| Time of Departure | Male | Female |
| 12:00 AM to 4:59 AM | 74 (23.9%) | 0 (0.0%) |
| 5:00 AM to 5:29 AM | 0 (0.0%) | 14 (4.4%) |
| 5:30 AM to 5:59 AM | 34 (11.0%) | 0 (0.0%) |
| 6:00 AM to 6:29 AM | 62 (20.0%) | 0 (0.0%) |
| 6:30 AM to 6:59 AM | 56 (18.1%) | 97 (30.8%) |
| 7:00 AM to 7:29 AM | 84 (27.1%) | 57 (18.1%) |
| 7:30 AM to 7:59 AM | 0 (0.0%) | 0 (0.0%) |
| 8:00 AM to 8:29 AM | 0 (0.0%) | 58 (18.4%) |
| 8:30 AM to 8:59 AM | 0 (0.0%) | 0 (0.0%) |
| 9:00 AM to 9:59 AM | 0 (0.0%) | 11 (3.5%) |
| 10:00 AM to 10:59 AM | 0 (0.0%) | 42 (13.3%) |
| 11:00 AM to 11:59 AM | 0 (0.0%) | 0 (0.0%) |
| 12:00 PM to 3:59 PM | 0 (0.0%) | 36 (11.4%) |
| 4:00 PM to 11:59 PM | 0 (0.0%) | 0 (0.0%) |
| Total | 310 (100.0%) | 315 (100.0%) |
Housing Occupancy in Oakridge
Occupancy by Ownership in Oakridge
Of the total 1,463 dwellings in Oakridge, owner-occupied units account for 943 (64.5%), while renter-occupied units make up 520 (35.5%).
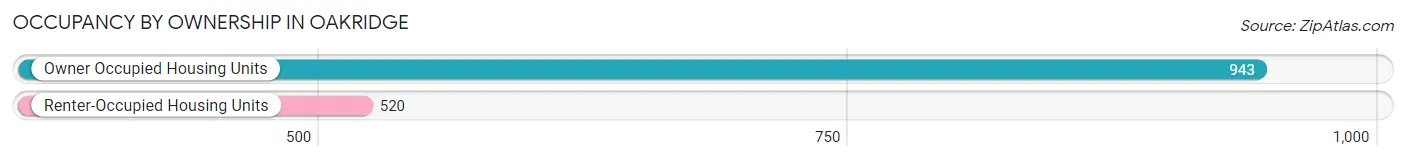
| Occupancy | # Housing Units | % Housing Units |
| Owner Occupied Housing Units | 943 | 64.5% |
| Renter-Occupied Housing Units | 520 | 35.5% |
| Total Occupied Housing Units | 1,463 | 100.0% |
Occupancy by Household Size in Oakridge
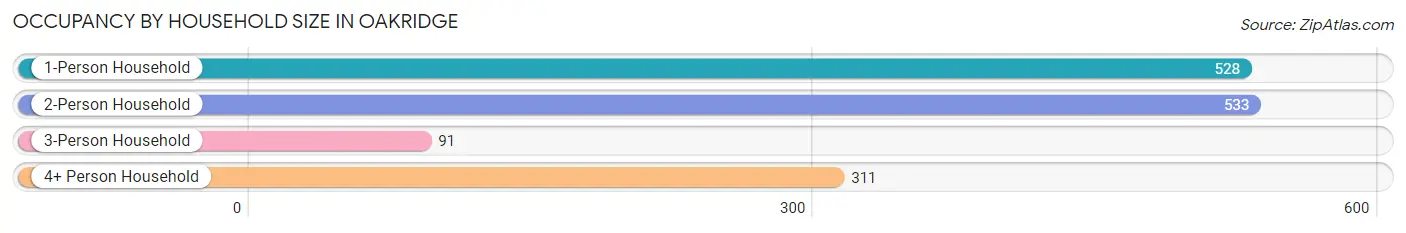
| Household Size | # Housing Units | % Housing Units |
| 1-Person Household | 528 | 36.1% |
| 2-Person Household | 533 | 36.4% |
| 3-Person Household | 91 | 6.2% |
| 4+ Person Household | 311 | 21.3% |
| Total Housing Units | 1,463 | 100.0% |
Occupancy by Ownership by Household Size in Oakridge
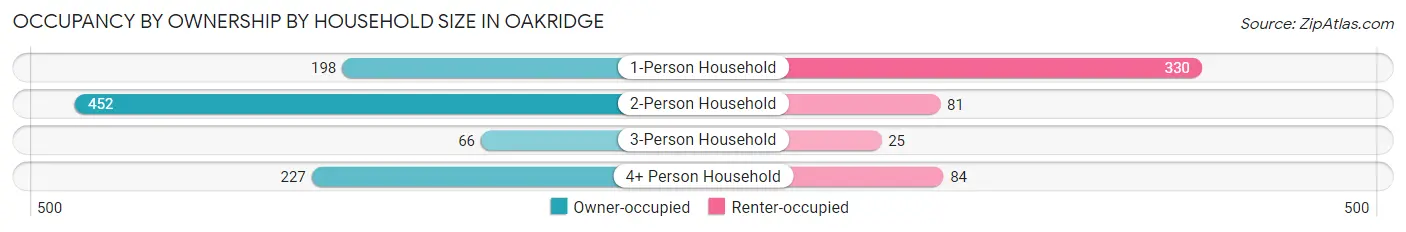
| Household Size | Owner-occupied | Renter-occupied |
| 1-Person Household | 198 (37.5%) | 330 (62.5%) |
| 2-Person Household | 452 (84.8%) | 81 (15.2%) |
| 3-Person Household | 66 (72.5%) | 25 (27.5%) |
| 4+ Person Household | 227 (73.0%) | 84 (27.0%) |
| Total Housing Units | 943 (64.5%) | 520 (35.5%) |
Occupancy by Educational Attainment in Oakridge
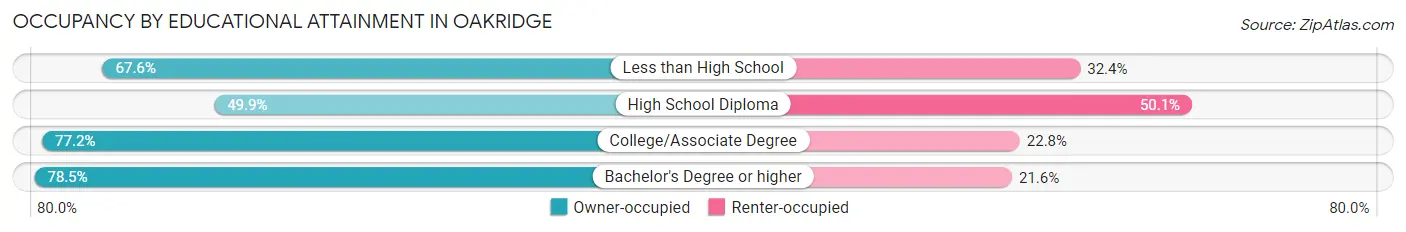
| Household Size | Owner-occupied | Renter-occupied |
| Less than High School | 190 (67.6%) | 91 (32.4%) |
| High School Diploma | 296 (49.9%) | 297 (50.1%) |
| College/Associate Degree | 315 (77.2%) | 93 (22.8%) |
| Bachelor's Degree or higher | 142 (78.4%) | 39 (21.5%) |
Occupancy by Age of Householder in Oakridge
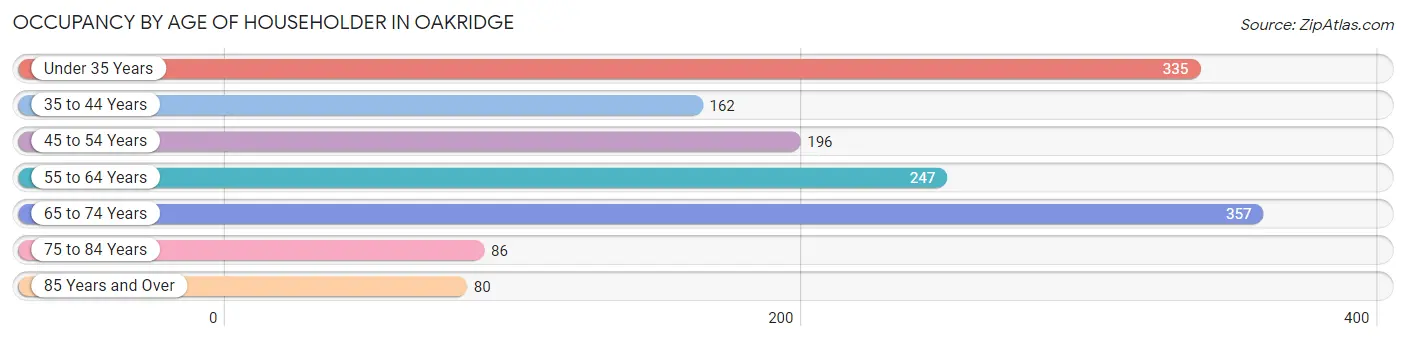
| Age Bracket | # Households | % Households |
| Under 35 Years | 335 | 22.9% |
| 35 to 44 Years | 162 | 11.1% |
| 45 to 54 Years | 196 | 13.4% |
| 55 to 64 Years | 247 | 16.9% |
| 65 to 74 Years | 357 | 24.4% |
| 75 to 84 Years | 86 | 5.9% |
| 85 Years and Over | 80 | 5.5% |
| Total | 1,463 | 100.0% |
Housing Finances in Oakridge
Median Income by Occupancy in Oakridge
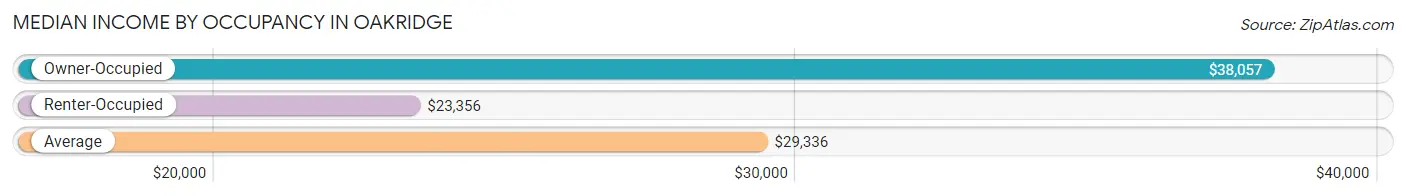
| Occupancy Type | # Households | Median Income |
| Owner-Occupied | 943 (64.5%) | $38,057 |
| Renter-Occupied | 520 (35.5%) | $23,356 |
| Average | 1,463 (100.0%) | $29,336 |
Occupancy by Householder Income Bracket in Oakridge
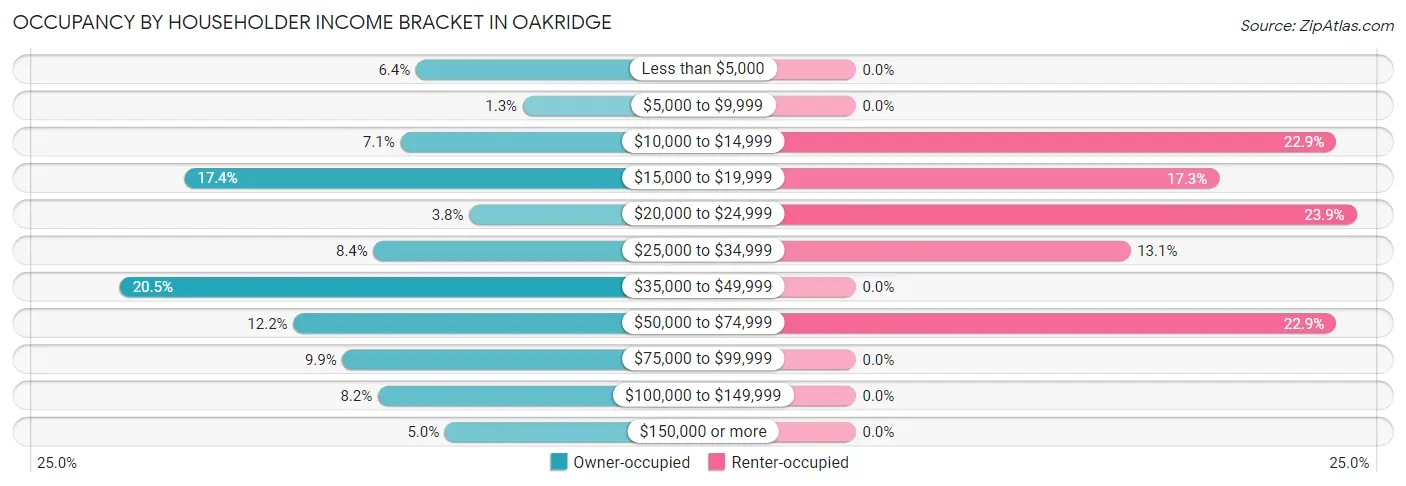
| Income Bracket | Owner-occupied | Renter-occupied |
| Less than $5,000 | 60 (6.4%) | 0 (0.0%) |
| $5,000 to $9,999 | 12 (1.3%) | 0 (0.0%) |
| $10,000 to $14,999 | 67 (7.1%) | 119 (22.9%) |
| $15,000 to $19,999 | 164 (17.4%) | 90 (17.3%) |
| $20,000 to $24,999 | 36 (3.8%) | 124 (23.8%) |
| $25,000 to $34,999 | 79 (8.4%) | 68 (13.1%) |
| $35,000 to $49,999 | 193 (20.5%) | 0 (0.0%) |
| $50,000 to $74,999 | 115 (12.2%) | 119 (22.9%) |
| $75,000 to $99,999 | 93 (9.9%) | 0 (0.0%) |
| $100,000 to $149,999 | 77 (8.2%) | 0 (0.0%) |
| $150,000 or more | 47 (5.0%) | 0 (0.0%) |
| Total | 943 (100.0%) | 520 (100.0%) |
Monthly Housing Cost Tiers in Oakridge
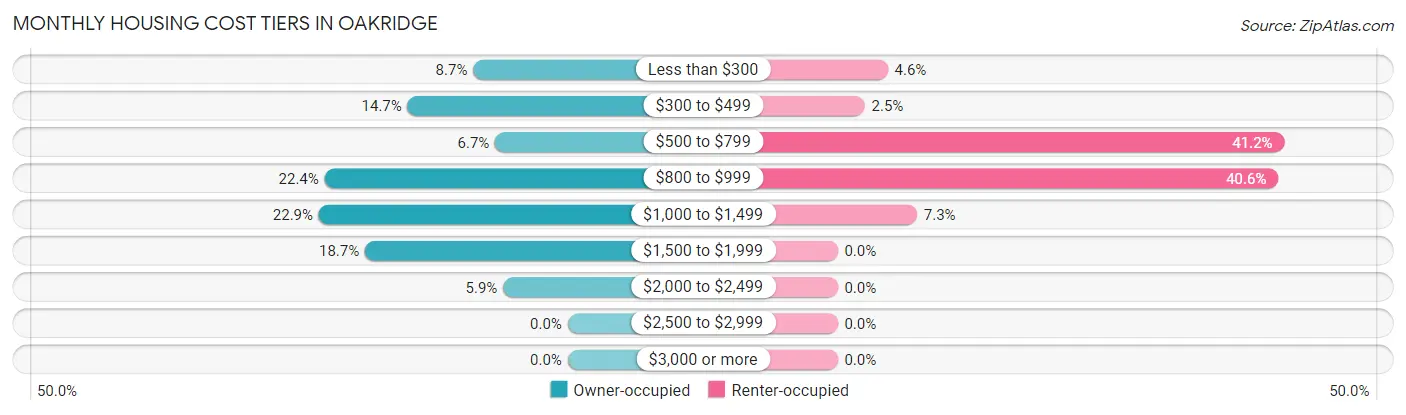
| Monthly Cost | Owner-occupied | Renter-occupied |
| Less than $300 | 82 (8.7%) | 24 (4.6%) |
| $300 to $499 | 139 (14.7%) | 13 (2.5%) |
| $500 to $799 | 63 (6.7%) | 214 (41.1%) |
| $800 to $999 | 211 (22.4%) | 211 (40.6%) |
| $1,000 to $1,499 | 216 (22.9%) | 38 (7.3%) |
| $1,500 to $1,999 | 176 (18.7%) | 0 (0.0%) |
| $2,000 to $2,499 | 56 (5.9%) | 0 (0.0%) |
| $2,500 to $2,999 | 0 (0.0%) | 0 (0.0%) |
| $3,000 or more | 0 (0.0%) | 0 (0.0%) |
| Total | 943 (100.0%) | 520 (100.0%) |
Physical Housing Characteristics in Oakridge
Housing Structures in Oakridge
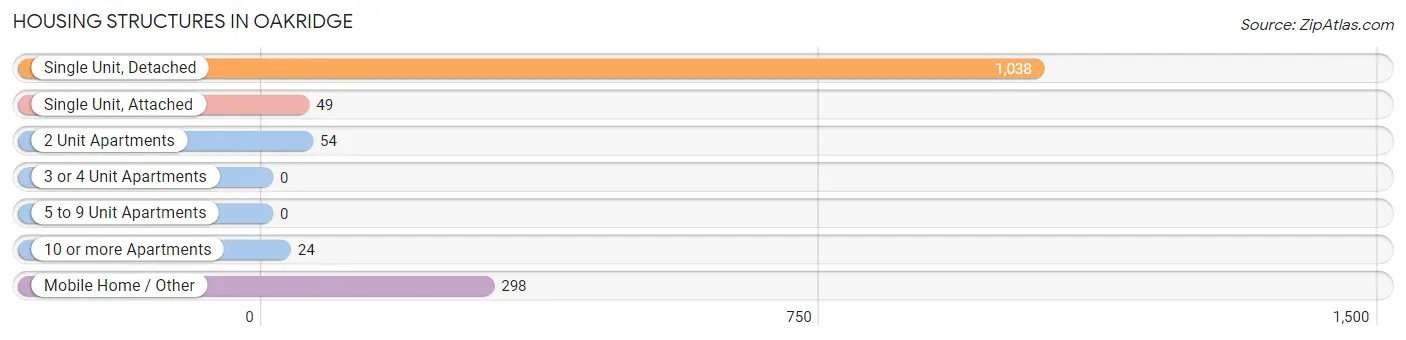
| Structure Type | # Housing Units | % Housing Units |
| Single Unit, Detached | 1,038 | 71.0% |
| Single Unit, Attached | 49 | 3.4% |
| 2 Unit Apartments | 54 | 3.7% |
| 3 or 4 Unit Apartments | 0 | 0.0% |
| 5 to 9 Unit Apartments | 0 | 0.0% |
| 10 or more Apartments | 24 | 1.6% |
| Mobile Home / Other | 298 | 20.4% |
| Total | 1,463 | 100.0% |
Housing Structures by Occupancy in Oakridge
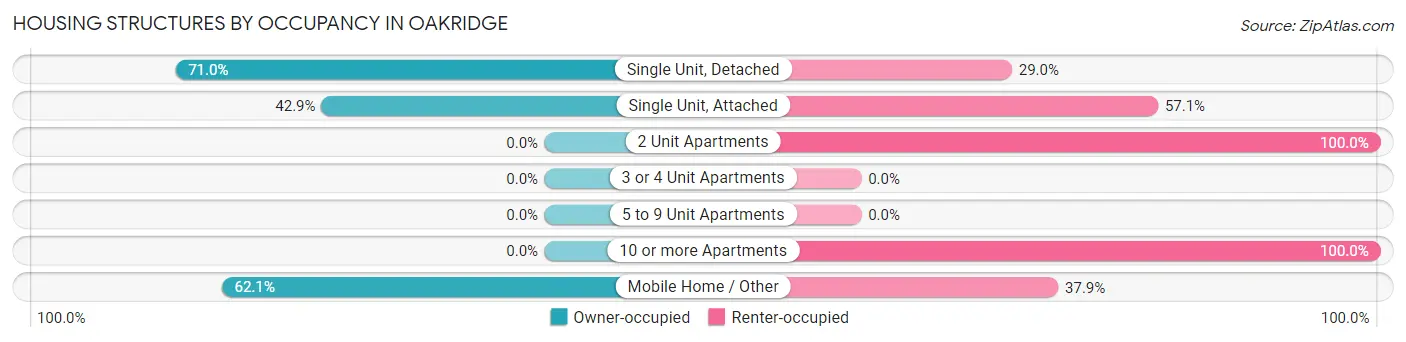
| Structure Type | Owner-occupied | Renter-occupied |
| Single Unit, Detached | 737 (71.0%) | 301 (29.0%) |
| Single Unit, Attached | 21 (42.9%) | 28 (57.1%) |
| 2 Unit Apartments | 0 (0.0%) | 54 (100.0%) |
| 3 or 4 Unit Apartments | 0 (0.0%) | 0 (0.0%) |
| 5 to 9 Unit Apartments | 0 (0.0%) | 0 (0.0%) |
| 10 or more Apartments | 0 (0.0%) | 24 (100.0%) |
| Mobile Home / Other | 185 (62.1%) | 113 (37.9%) |
| Total | 943 (64.5%) | 520 (35.5%) |
Housing Structures by Number of Rooms in Oakridge
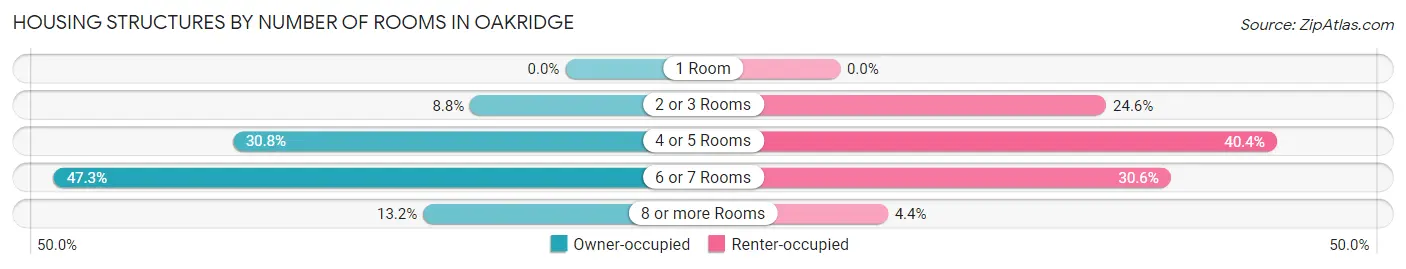
| Number of Rooms | Owner-occupied | Renter-occupied |
| 1 Room | 0 (0.0%) | 0 (0.0%) |
| 2 or 3 Rooms | 83 (8.8%) | 128 (24.6%) |
| 4 or 5 Rooms | 290 (30.7%) | 210 (40.4%) |
| 6 or 7 Rooms | 446 (47.3%) | 159 (30.6%) |
| 8 or more Rooms | 124 (13.2%) | 23 (4.4%) |
| Total | 943 (100.0%) | 520 (100.0%) |
Housing Structure by Heating Type in Oakridge
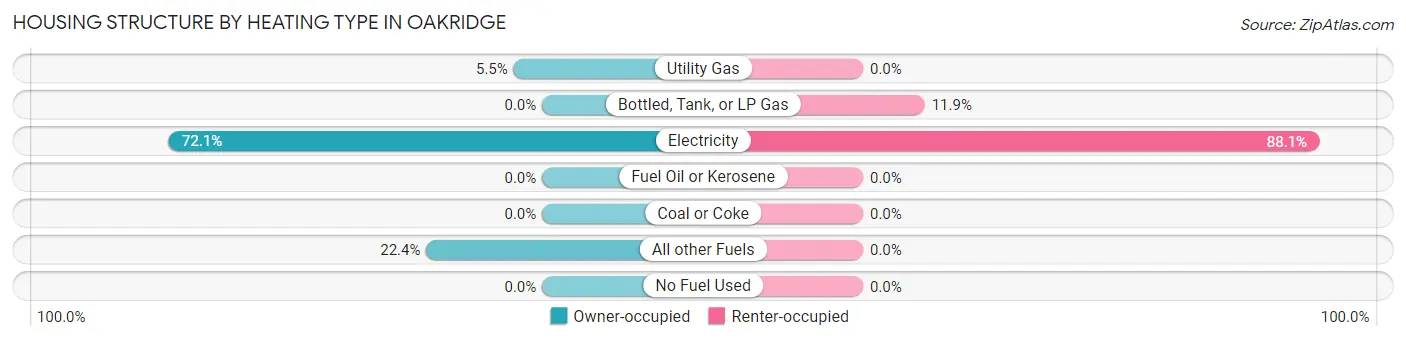
| Heating Type | Owner-occupied | Renter-occupied |
| Utility Gas | 52 (5.5%) | 0 (0.0%) |
| Bottled, Tank, or LP Gas | 0 (0.0%) | 62 (11.9%) |
| Electricity | 680 (72.1%) | 458 (88.1%) |
| Fuel Oil or Kerosene | 0 (0.0%) | 0 (0.0%) |
| Coal or Coke | 0 (0.0%) | 0 (0.0%) |
| All other Fuels | 211 (22.4%) | 0 (0.0%) |
| No Fuel Used | 0 (0.0%) | 0 (0.0%) |
| Total | 943 (100.0%) | 520 (100.0%) |
Household Vehicle Usage in Oakridge
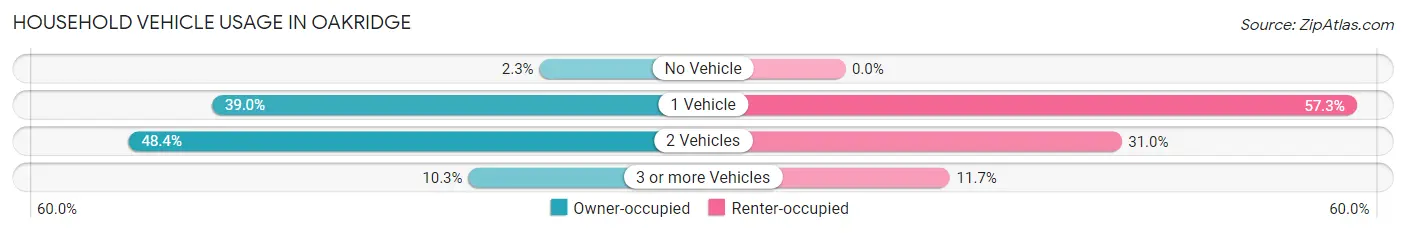
| Vehicles per Household | Owner-occupied | Renter-occupied |
| No Vehicle | 22 (2.3%) | 0 (0.0%) |
| 1 Vehicle | 368 (39.0%) | 298 (57.3%) |
| 2 Vehicles | 456 (48.4%) | 161 (31.0%) |
| 3 or more Vehicles | 97 (10.3%) | 61 (11.7%) |
| Total | 943 (100.0%) | 520 (100.0%) |
Real Estate & Mortgages in Oakridge
Real Estate and Mortgage Overview in Oakridge
| Characteristic | Without Mortgage | With Mortgage |
| Housing Units | 319 | 624 |
| Median Property Value | $54,600 | $230,800 |
| Median Household Income | $45,527 | $47 |
| Monthly Housing Costs | $430 | $0 |
| Real Estate Taxes | $1,364 | $0 |
Property Value by Mortgage Status in Oakridge
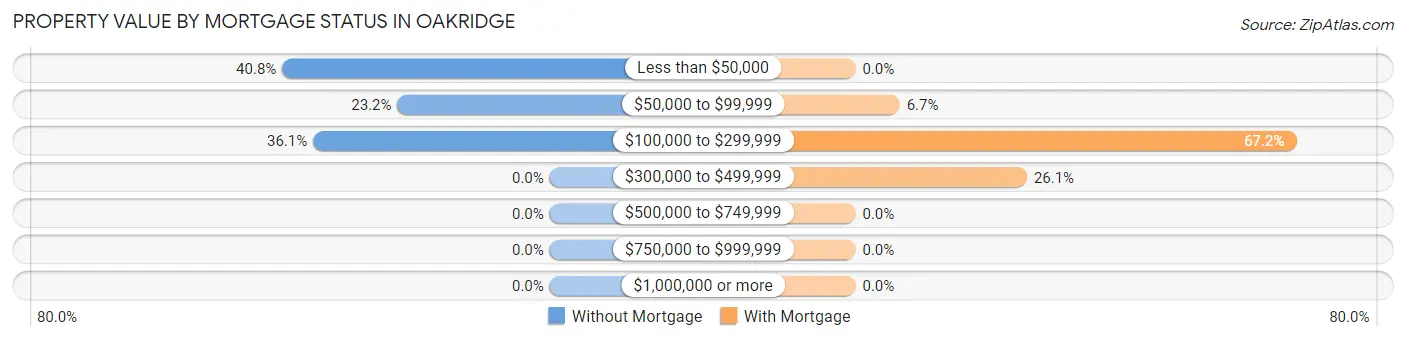
| Property Value | Without Mortgage | With Mortgage |
| Less than $50,000 | 130 (40.7%) | 0 (0.0%) |
| $50,000 to $99,999 | 74 (23.2%) | 42 (6.7%) |
| $100,000 to $299,999 | 115 (36.0%) | 419 (67.1%) |
| $300,000 to $499,999 | 0 (0.0%) | 163 (26.1%) |
| $500,000 to $749,999 | 0 (0.0%) | 0 (0.0%) |
| $750,000 to $999,999 | 0 (0.0%) | 0 (0.0%) |
| $1,000,000 or more | 0 (0.0%) | 0 (0.0%) |
| Total | 319 (100.0%) | 624 (100.0%) |
Household Income by Mortgage Status in Oakridge
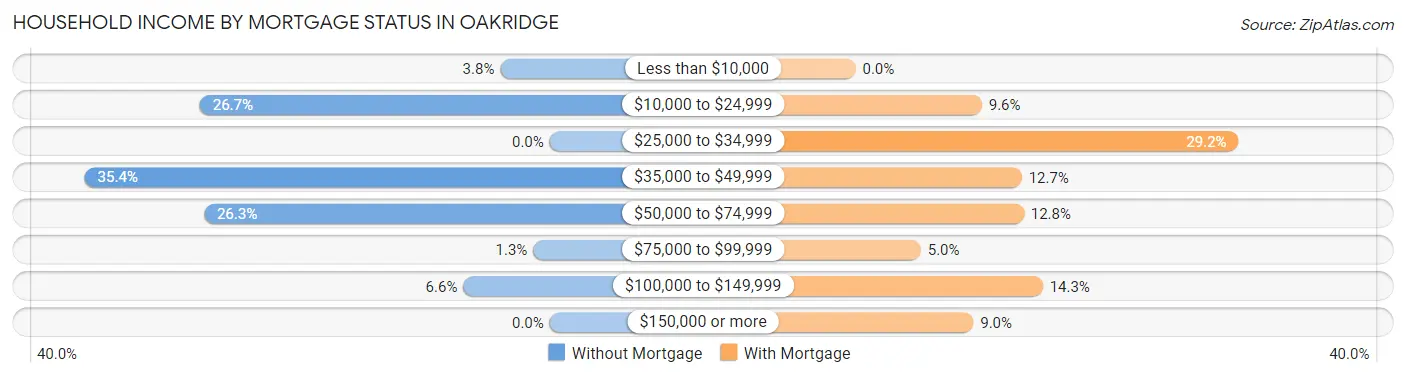
| Household Income | Without Mortgage | With Mortgage |
| Less than $10,000 | 12 (3.8%) | 0 (0.0%) |
| $10,000 to $24,999 | 85 (26.7%) | 60 (9.6%) |
| $25,000 to $34,999 | 0 (0.0%) | 182 (29.2%) |
| $35,000 to $49,999 | 113 (35.4%) | 79 (12.7%) |
| $50,000 to $74,999 | 84 (26.3%) | 80 (12.8%) |
| $75,000 to $99,999 | 4 (1.3%) | 31 (5.0%) |
| $100,000 to $149,999 | 21 (6.6%) | 89 (14.3%) |
| $150,000 or more | 0 (0.0%) | 56 (9.0%) |
| Total | 319 (100.0%) | 624 (100.0%) |
Property Value to Household Income Ratio in Oakridge
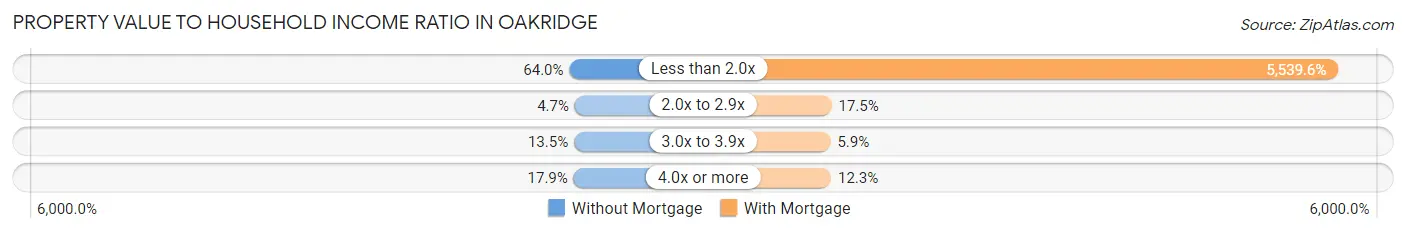
| Value-to-Income Ratio | Without Mortgage | With Mortgage |
| Less than 2.0x | 204 (63.9%) | 34,567 (5,539.6%) |
| 2.0x to 2.9x | 15 (4.7%) | 109 (17.5%) |
| 3.0x to 3.9x | 43 (13.5%) | 37 (5.9%) |
| 4.0x or more | 57 (17.9%) | 77 (12.3%) |
| Total | 319 (100.0%) | 624 (100.0%) |
Real Estate Taxes by Mortgage Status in Oakridge
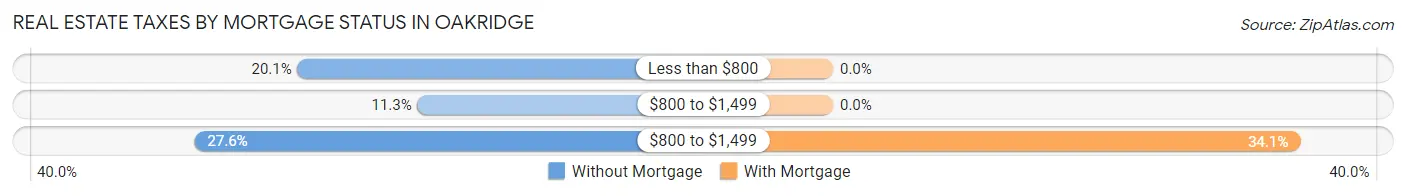
| Property Taxes | Without Mortgage | With Mortgage |
| Less than $800 | 64 (20.1%) | 0 (0.0%) |
| $800 to $1,499 | 36 (11.3%) | 0 (0.0%) |
| $800 to $1,499 | 88 (27.6%) | 213 (34.1%) |
| Total | 319 (100.0%) | 624 (100.0%) |
Health & Disability in Oakridge
Health Insurance Coverage by Age in Oakridge
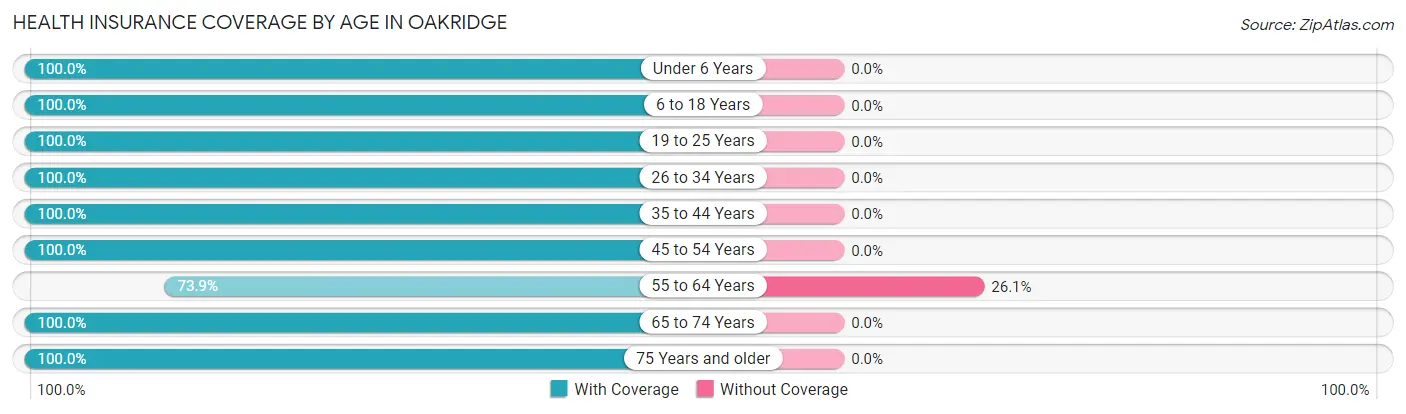
| Age Bracket | With Coverage | Without Coverage |
| Under 6 Years | 238 (100.0%) | 0 (0.0%) |
| 6 to 18 Years | 449 (100.0%) | 0 (0.0%) |
| 19 to 25 Years | 138 (100.0%) | 0 (0.0%) |
| 26 to 34 Years | 549 (100.0%) | 0 (0.0%) |
| 35 to 44 Years | 220 (100.0%) | 0 (0.0%) |
| 45 to 54 Years | 266 (100.0%) | 0 (0.0%) |
| 55 to 64 Years | 461 (73.9%) | 163 (26.1%) |
| 65 to 74 Years | 479 (100.0%) | 0 (0.0%) |
| 75 Years and older | 245 (100.0%) | 0 (0.0%) |
| Total | 3,045 (94.9%) | 163 (5.1%) |
Health Insurance Coverage by Citizenship Status in Oakridge
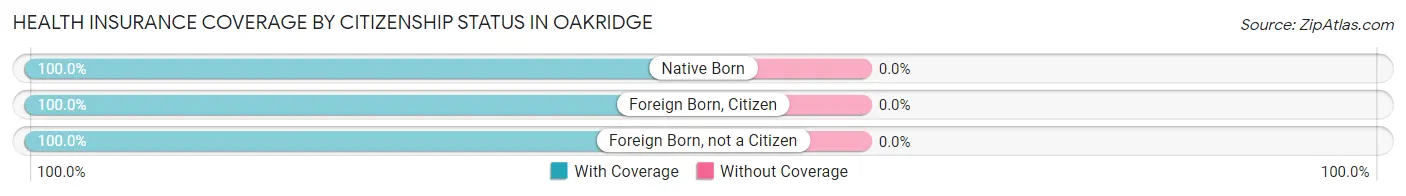
| Citizenship Status | With Coverage | Without Coverage |
| Native Born | 238 (100.0%) | 0 (0.0%) |
| Foreign Born, Citizen | 449 (100.0%) | 0 (0.0%) |
| Foreign Born, not a Citizen | 138 (100.0%) | 0 (0.0%) |
Health Insurance Coverage by Household Income in Oakridge
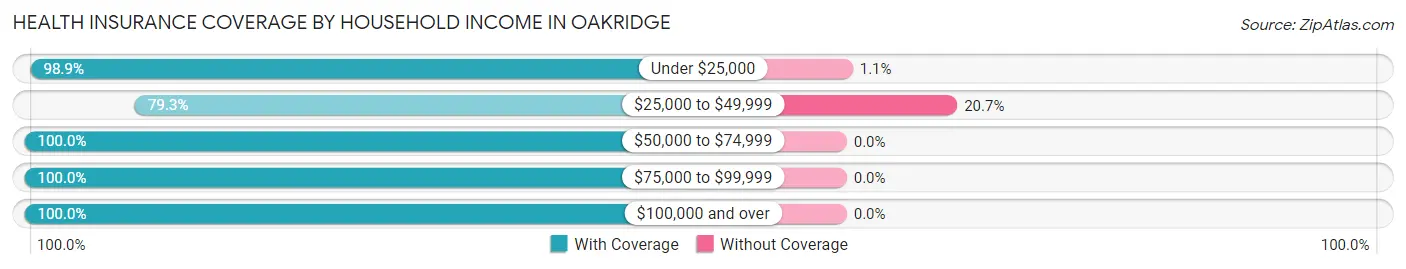
| Household Income | With Coverage | Without Coverage |
| Under $25,000 | 1,145 (98.9%) | 13 (1.1%) |
| $25,000 to $49,999 | 575 (79.3%) | 150 (20.7%) |
| $50,000 to $74,999 | 678 (100.0%) | 0 (0.0%) |
| $75,000 to $99,999 | 246 (100.0%) | 0 (0.0%) |
| $100,000 and over | 401 (100.0%) | 0 (0.0%) |
Public vs Private Health Insurance Coverage by Age in Oakridge
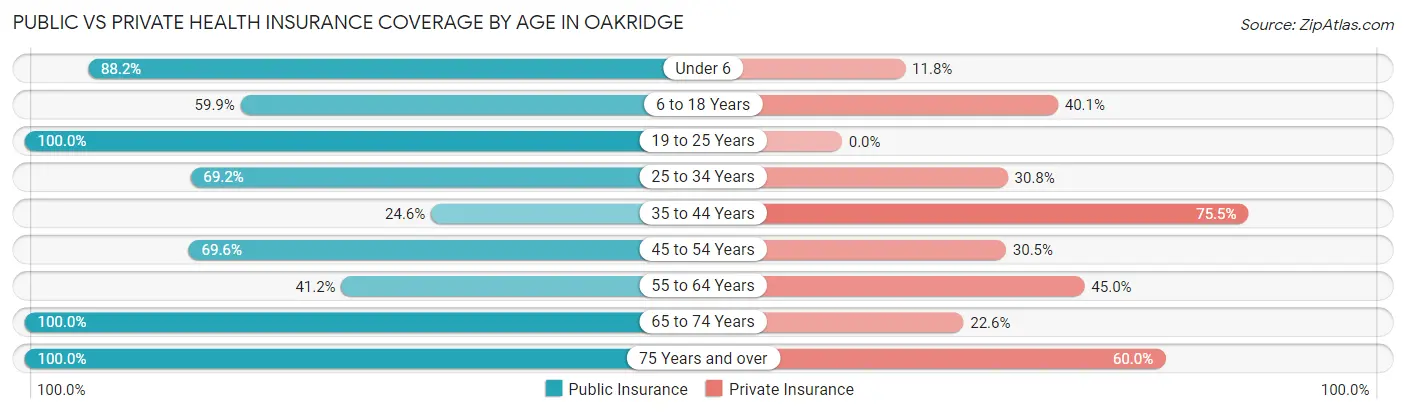
| Age Bracket | Public Insurance | Private Insurance |
| Under 6 | 210 (88.2%) | 28 (11.8%) |
| 6 to 18 Years | 269 (59.9%) | 180 (40.1%) |
| 19 to 25 Years | 138 (100.0%) | 0 (0.0%) |
| 25 to 34 Years | 380 (69.2%) | 169 (30.8%) |
| 35 to 44 Years | 54 (24.5%) | 166 (75.4%) |
| 45 to 54 Years | 185 (69.6%) | 81 (30.4%) |
| 55 to 64 Years | 257 (41.2%) | 281 (45.0%) |
| 65 to 74 Years | 479 (100.0%) | 108 (22.6%) |
| 75 Years and over | 245 (100.0%) | 147 (60.0%) |
| Total | 2,217 (69.1%) | 1,160 (36.2%) |
Disability Status by Sex by Age in Oakridge
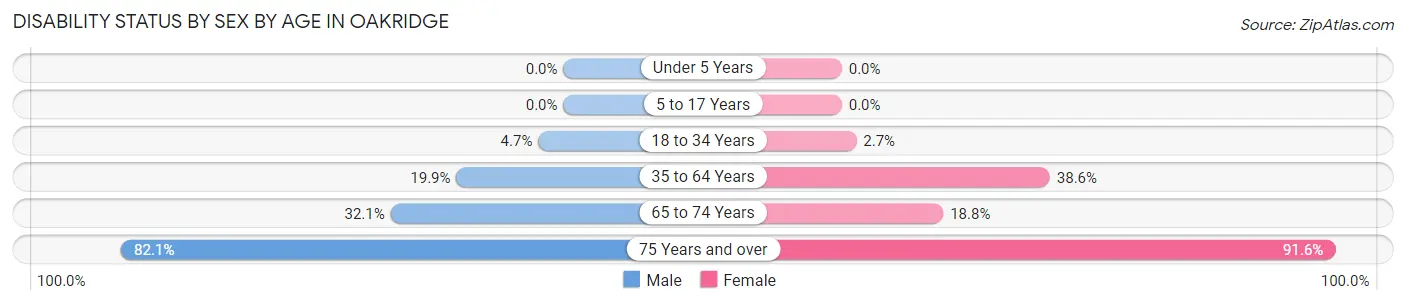
| Age Bracket | Male | Female |
| Under 5 Years | 0 (0.0%) | 0 (0.0%) |
| 5 to 17 Years | 0 (0.0%) | 0 (0.0%) |
| 18 to 34 Years | 13 (4.7%) | 11 (2.7%) |
| 35 to 64 Years | 114 (19.9%) | 207 (38.6%) |
| 65 to 74 Years | 77 (32.1%) | 45 (18.8%) |
| 75 Years and over | 55 (82.1%) | 163 (91.6%) |
Disability Class by Sex by Age in Oakridge
Disability Class: Hearing Difficulty
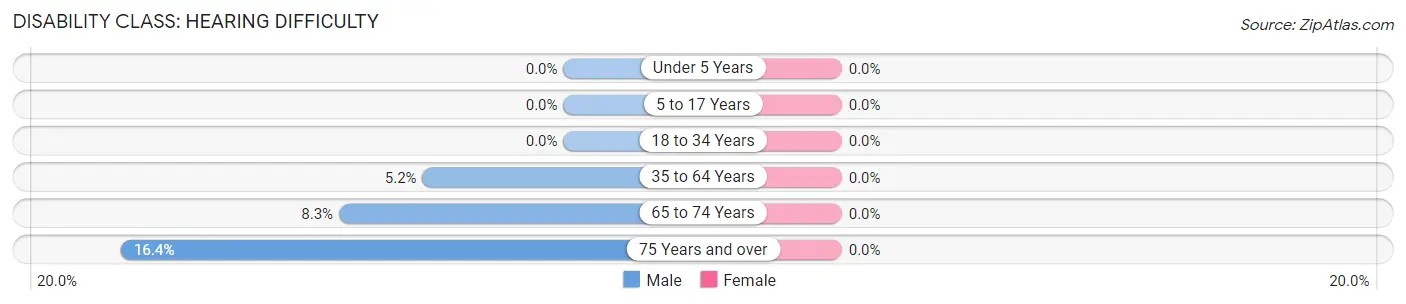
| Age Bracket | Male | Female |
| Under 5 Years | 0 (0.0%) | 0 (0.0%) |
| 5 to 17 Years | 0 (0.0%) | 0 (0.0%) |
| 18 to 34 Years | 0 (0.0%) | 0 (0.0%) |
| 35 to 64 Years | 30 (5.2%) | 0 (0.0%) |
| 65 to 74 Years | 20 (8.3%) | 0 (0.0%) |
| 75 Years and over | 11 (16.4%) | 0 (0.0%) |
Disability Class: Vision Difficulty
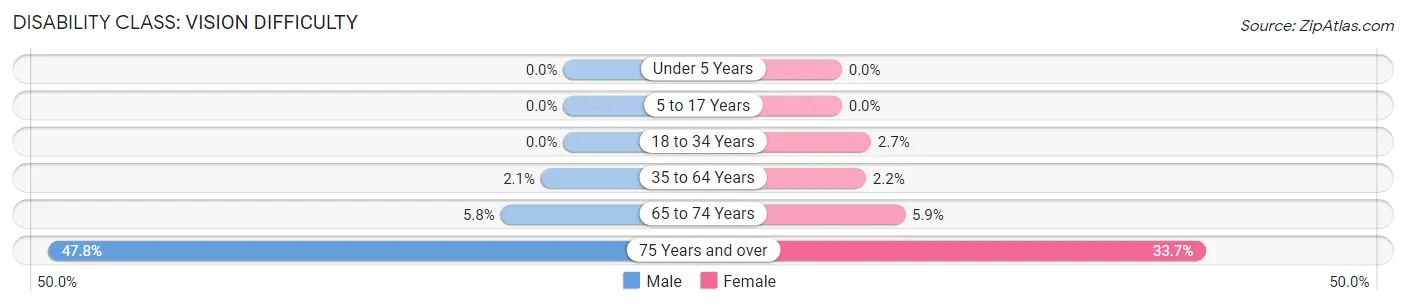
| Age Bracket | Male | Female |
| Under 5 Years | 0 (0.0%) | 0 (0.0%) |
| 5 to 17 Years | 0 (0.0%) | 0 (0.0%) |
| 18 to 34 Years | 0 (0.0%) | 11 (2.7%) |
| 35 to 64 Years | 12 (2.1%) | 12 (2.2%) |
| 65 to 74 Years | 14 (5.8%) | 14 (5.9%) |
| 75 Years and over | 32 (47.8%) | 60 (33.7%) |
Disability Class: Cognitive Difficulty
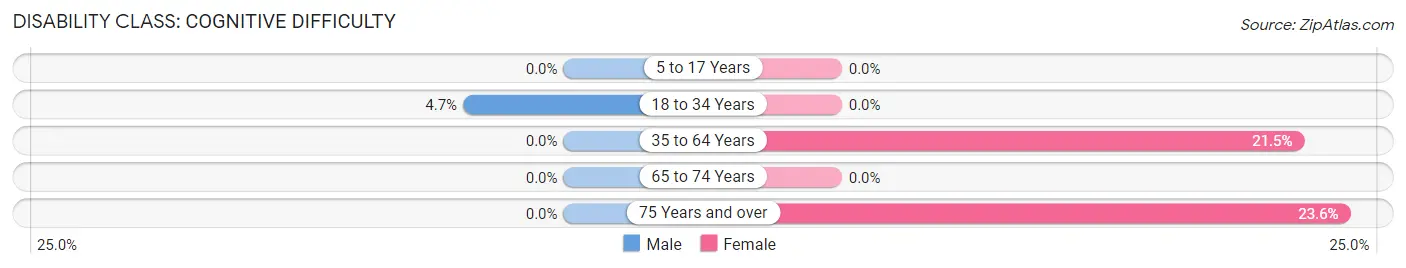
| Age Bracket | Male | Female |
| 5 to 17 Years | 0 (0.0%) | 0 (0.0%) |
| 18 to 34 Years | 13 (4.7%) | 0 (0.0%) |
| 35 to 64 Years | 0 (0.0%) | 115 (21.5%) |
| 65 to 74 Years | 0 (0.0%) | 0 (0.0%) |
| 75 Years and over | 0 (0.0%) | 42 (23.6%) |
Disability Class: Ambulatory Difficulty
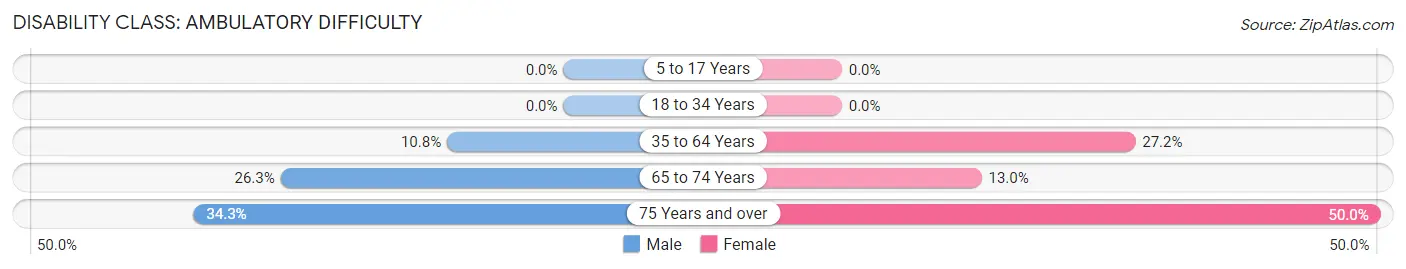
| Age Bracket | Male | Female |
| 5 to 17 Years | 0 (0.0%) | 0 (0.0%) |
| 18 to 34 Years | 0 (0.0%) | 0 (0.0%) |
| 35 to 64 Years | 62 (10.8%) | 146 (27.2%) |
| 65 to 74 Years | 63 (26.3%) | 31 (13.0%) |
| 75 Years and over | 23 (34.3%) | 89 (50.0%) |
Disability Class: Self-Care Difficulty
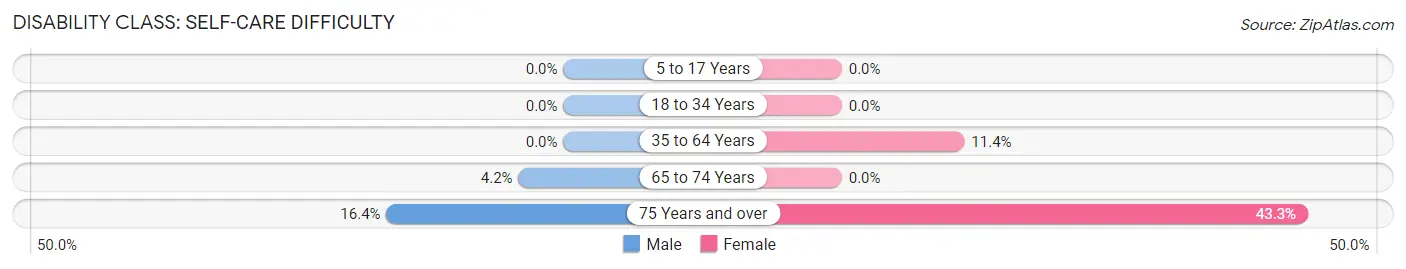
| Age Bracket | Male | Female |
| 5 to 17 Years | 0 (0.0%) | 0 (0.0%) |
| 18 to 34 Years | 0 (0.0%) | 0 (0.0%) |
| 35 to 64 Years | 0 (0.0%) | 61 (11.4%) |
| 65 to 74 Years | 10 (4.2%) | 0 (0.0%) |
| 75 Years and over | 11 (16.4%) | 77 (43.3%) |
Technology Access in Oakridge
Computing Device Access in Oakridge
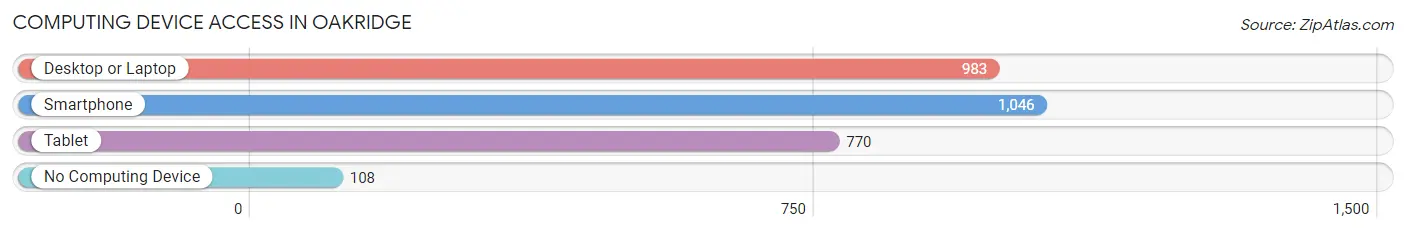
| Device Type | # Households | % Households |
| Desktop or Laptop | 983 | 67.2% |
| Smartphone | 1,046 | 71.5% |
| Tablet | 770 | 52.6% |
| No Computing Device | 108 | 7.4% |
| Total | 1,463 | 100.0% |
Internet Access in Oakridge
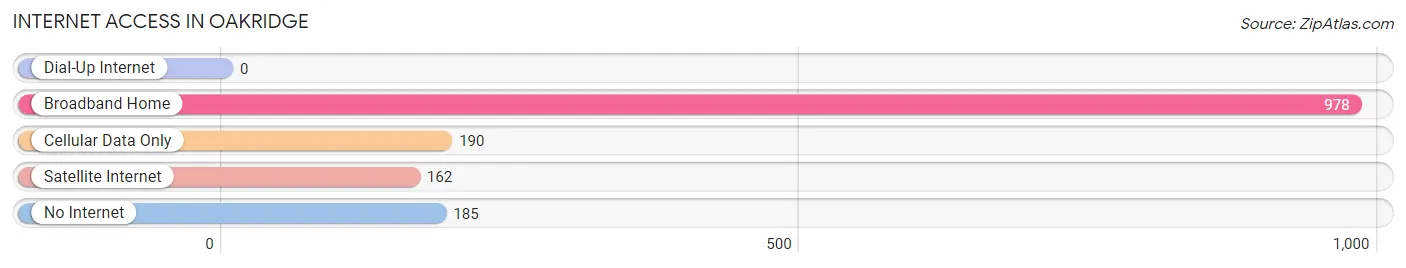
| Internet Type | # Households | % Households |
| Dial-Up Internet | 0 | 0.0% |
| Broadband Home | 978 | 66.8% |
| Cellular Data Only | 190 | 13.0% |
| Satellite Internet | 162 | 11.1% |
| No Internet | 185 | 12.7% |
| Total | 1,463 | 100.0% |
Oakridge Summary
Oakridge, Oregon is a small city located in Lane County, Oregon, United States. It is situated in the foothills of the Cascade Mountains, approximately 50 miles east of Eugene. The city is surrounded by the Willamette National Forest and is home to the Middle Fork Willamette River. The population of Oakridge was 2,541 at the 2010 census.
History
Oakridge was founded in the late 1800s as a logging town. The town was named after the nearby Oakridge Mountain, which was named by early settlers for its abundance of oak trees. The first post office was established in Oakridge in 1891.
In the early 1900s, the town began to grow as a railroad hub. The Southern Pacific Railroad built a line through the town in 1910, and the Oregon Pacific Railroad followed in 1912. The railroads brought in new businesses and industries, and the town began to thrive.
In the 1950s, the town began to decline as the logging industry began to decline. The railroads stopped running in the 1960s, and the town's population began to decline.
In the 1970s, the town began to experience a resurgence as a tourist destination. The Willamette National Forest was established in the area, and the town began to attract visitors for its outdoor recreation opportunities.
Geography
Oakridge is located in the foothills of the Cascade Mountains, approximately 50 miles east of Eugene. The city is surrounded by the Willamette National Forest and is home to the Middle Fork Willamette River. The city has a total area of 2.2 square miles, all of which is land.
Economy
Oakridge's economy is largely based on tourism and outdoor recreation. The city is home to several outdoor recreation businesses, including a ski resort, a golf course, and several campgrounds. The city also has several restaurants and retail stores.
The city is also home to several manufacturing businesses, including a lumber mill and a wood products plant. The city is also home to several logging companies.
Demographics
As of the 2010 census, the population of Oakridge was 2,541. The racial makeup of the city was 92.3% White, 0.7% African American, 0.7% Native American, 0.7% Asian, 0.2% Pacific Islander, 0.7% from other races, and 4.5% from two or more races. Hispanic or Latino of any race were 3.2% of the population.
The median income for a household in the city was $37,917, and the median income for a family was $45,000. The per capita income for the city was $19,945. About 11.3% of families and 14.2% of the population were below the poverty line, including 18.2% of those under age 18 and 8.3% of those age 65 or over.
Common Questions
What is Per Capita Income in Oakridge?
Per Capita income in Oakridge is $20,251.
What is the Median Family Income in Oakridge?
Median Family Income in Oakridge is $46,602.
What is the Median Household income in Oakridge?
Median Household Income in Oakridge is $29,336.
What is Income or Wage Gap in Oakridge?
Income or Wage Gap in Oakridge is 80.3%.
Women in Oakridge earn 19.7 cents for every dollar earned by a man.
What is Inequality or Gini Index in Oakridge?
Inequality or Gini Index in Oakridge is 0.45.
What is the Total Population of Oakridge?
Total Population of Oakridge is 3,208.
What is the Total Male Population of Oakridge?
Total Male Population of Oakridge is 1,478.
What is the Total Female Population of Oakridge?
Total Female Population of Oakridge is 1,730.
What is the Ratio of Males per 100 Females in Oakridge?
There are 85.43 Males per 100 Females in Oakridge.
What is the Ratio of Females per 100 Males in Oakridge?
There are 117.05 Females per 100 Males in Oakridge.
What is the Median Population Age in Oakridge?
Median Population Age in Oakridge is 48.2 Years.
What is the Average Family Size in Oakridge
Average Family Size in Oakridge is 2.7 People.
What is the Average Household Size in Oakridge
Average Household Size in Oakridge is 2.2 People.
How Large is the Labor Force in Oakridge?
There are 978 People in the Labor Forcein in Oakridge.
What is the Percentage of People in the Labor Force in Oakridge?
38.2% of People are in the Labor Force in Oakridge.
What is the Unemployment Rate in Oakridge?
Unemployment Rate in Oakridge is 23.5%.