Rufus, OR Map & Demographics
Rufus Map
Rufus Overview
$35,121
PER CAPITA INCOME
$66,667
AVG FAMILY INCOME
$60,625
AVG HOUSEHOLD INCOME
51.3%
WAGE / INCOME GAP [ % ]
48.7¢/ $1
WAGE / INCOME GAP [ $ ]
$4,167
FAMILY INCOME DEFICIT
0.40
INEQUALITY / GINI INDEX
220
TOTAL POPULATION
133
MALE POPULATION
87
FEMALE POPULATION
152.87
MALES / 100 FEMALES
65.41
FEMALES / 100 MALES
56.5
MEDIAN AGE
2.6
AVG FAMILY SIZE
1.9
AVG HOUSEHOLD SIZE
82
LABOR FORCE [ PEOPLE ]
44.8%
PERCENT IN LABOR FORCE
6.1%
UNEMPLOYMENT RATE
Rufus Zip Codes
Rufus Area Codes
Income in Rufus
Income Overview in Rufus
Per Capita Income in Rufus is $35,121, while median incomes of families and households are $66,667 and $60,625 respectively.
| Characteristic | Number | Measure |
| Per Capita Income | 220 | $35,121 |
| Median Family Income | 60 | $66,667 |
| Mean Family Income | 60 | $67,537 |
| Median Household Income | 117 | $60,625 |
| Mean Household Income | 117 | $64,151 |
| Income Deficit | 60 | $4,167 |
| Wage / Income Gap (%) | 220 | 51.28% |
| Wage / Income Gap ($) | 220 | 48.72¢ per $1 |
| Gini / Inequality Index | 220 | 0.40 |
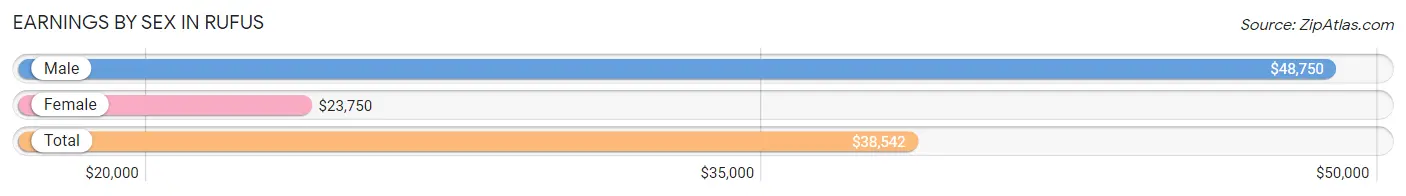
Earnings by Sex in Rufus
Average Earnings in Rufus are $38,542, $48,750 for men and $23,750 for women, a difference of 51.3%.
| Sex | Number | Average Earnings |
| Male | 55 (64.7%) | $48,750 |
| Female | 30 (35.3%) | $23,750 |
| Total | 85 (100.0%) | $38,542 |
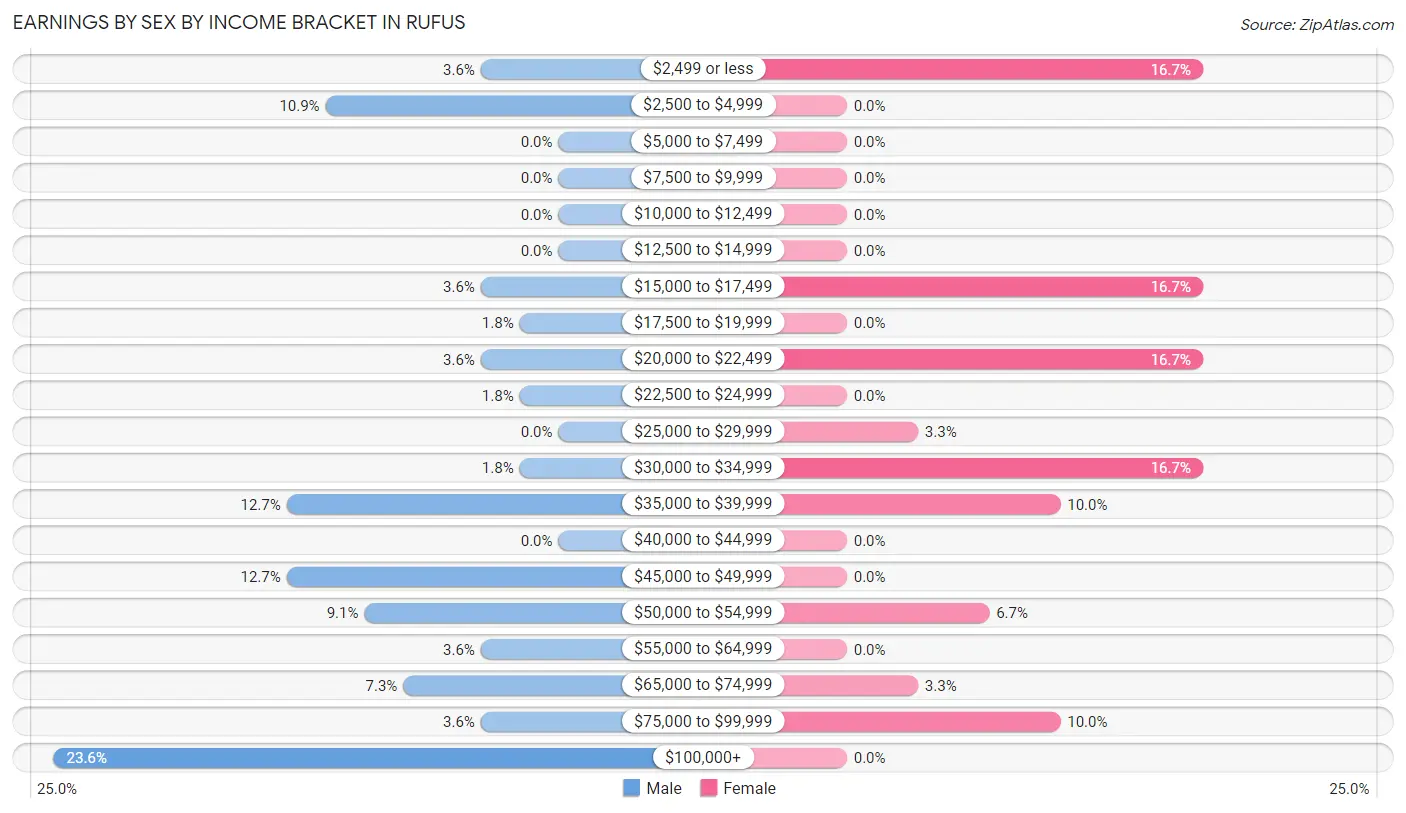
Earnings by Sex by Income Bracket in Rufus
The most common earnings brackets in Rufus are $100,000+ for men (13 | 23.6%) and $2,499 or less for women (5 | 16.7%).
| Income | Male | Female |
| $2,499 or less | 2 (3.6%) | 5 (16.7%) |
| $2,500 to $4,999 | 6 (10.9%) | 0 (0.0%) |
| $5,000 to $7,499 | 0 (0.0%) | 0 (0.0%) |
| $7,500 to $9,999 | 0 (0.0%) | 0 (0.0%) |
| $10,000 to $12,499 | 0 (0.0%) | 0 (0.0%) |
| $12,500 to $14,999 | 0 (0.0%) | 0 (0.0%) |
| $15,000 to $17,499 | 2 (3.6%) | 5 (16.7%) |
| $17,500 to $19,999 | 1 (1.8%) | 0 (0.0%) |
| $20,000 to $22,499 | 2 (3.6%) | 5 (16.7%) |
| $22,500 to $24,999 | 1 (1.8%) | 0 (0.0%) |
| $25,000 to $29,999 | 0 (0.0%) | 1 (3.3%) |
| $30,000 to $34,999 | 1 (1.8%) | 5 (16.7%) |
| $35,000 to $39,999 | 7 (12.7%) | 3 (10.0%) |
| $40,000 to $44,999 | 0 (0.0%) | 0 (0.0%) |
| $45,000 to $49,999 | 7 (12.7%) | 0 (0.0%) |
| $50,000 to $54,999 | 5 (9.1%) | 2 (6.7%) |
| $55,000 to $64,999 | 2 (3.6%) | 0 (0.0%) |
| $65,000 to $74,999 | 4 (7.3%) | 1 (3.3%) |
| $75,000 to $99,999 | 2 (3.6%) | 3 (10.0%) |
| $100,000+ | 13 (23.6%) | 0 (0.0%) |
| Total | 55 (100.0%) | 30 (100.0%) |
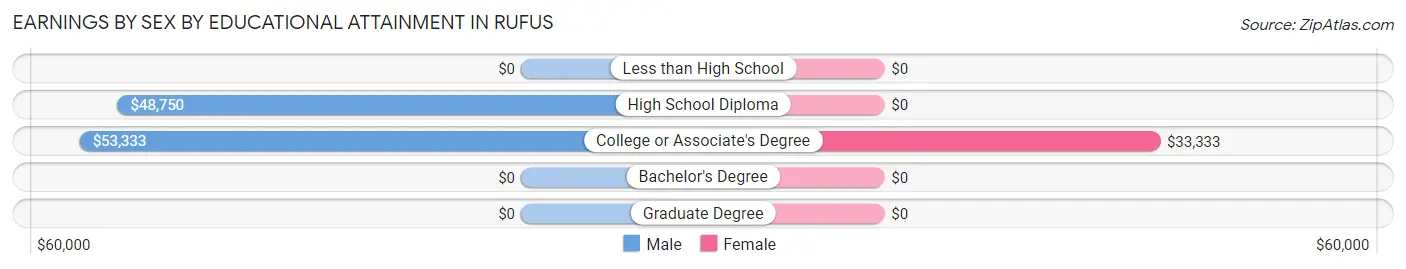
Earnings by Sex by Educational Attainment in Rufus
Average earnings in Rufus are $53,250 for men and $23,750 for women, a difference of 55.4%. Men with an educational attainment of college or associate's degree enjoy the highest average annual earnings of $53,333, while those with high school diploma education earn the least with $48,750. Women with an educational attainment of college or associate's degree earn the most with the average annual earnings of $33,333, while those with college or associate's degree education have the smallest earnings of $33,333.
| Educational Attainment | Male Income | Female Income |
| Less than High School | - | - |
| High School Diploma | $48,750 | $0 |
| College or Associate's Degree | $53,333 | $33,333 |
| Bachelor's Degree | - | - |
| Graduate Degree | - | - |
| Total | $53,250 | $23,750 |
Family Income in Rufus
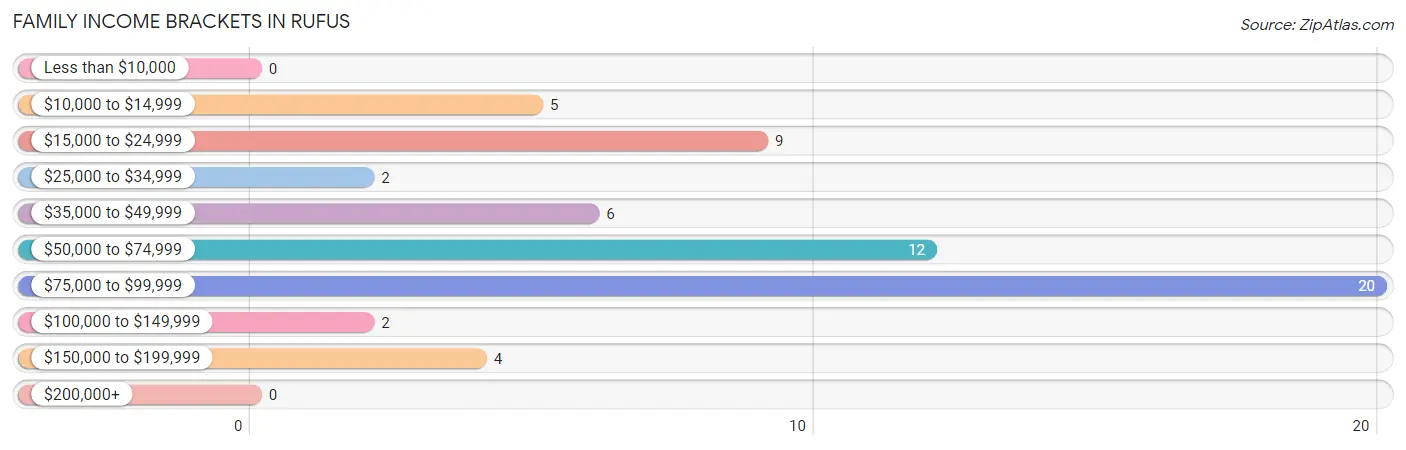
Family Income Brackets in Rufus
According to the Rufus family income data, there are 20 families falling into the $75,000 to $99,999 income range, which is the most common income bracket and makes up 33.3% of all families.
| Income Bracket | # Families | % Families |
| Less than $10,000 | 0 | 0.0% |
| $10,000 to $14,999 | 5 | 8.3% |
| $15,000 to $24,999 | 9 | 15.0% |
| $25,000 to $34,999 | 2 | 3.3% |
| $35,000 to $49,999 | 6 | 10.0% |
| $50,000 to $74,999 | 12 | 20.0% |
| $75,000 to $99,999 | 20 | 33.3% |
| $100,000 to $149,999 | 2 | 3.3% |
| $150,000 to $199,999 | 4 | 6.7% |
| $200,000+ | 0 | 0.0% |
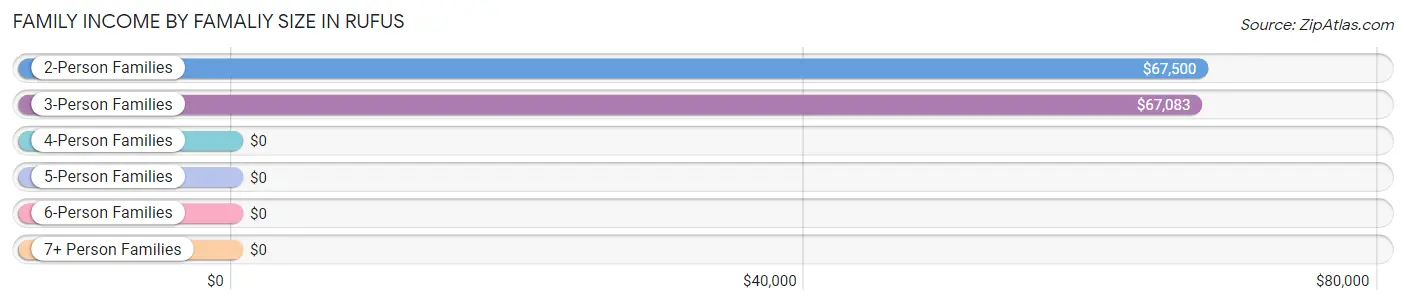
Family Income by Famaliy Size in Rufus
2-person families (44 | 73.3%) account for the highest median family income in Rufus with $67,500 per family, while 2-person families (44 | 73.3%) have the highest median income of $33,750 per family member.
| Income Bracket | # Families | Median Income |
| 2-Person Families | 44 (73.3%) | $67,500 |
| 3-Person Families | 9 (15.0%) | $67,083 |
| 4-Person Families | 4 (6.7%) | $0 |
| 5-Person Families | 3 (5.0%) | $0 |
| 6-Person Families | 0 (0.0%) | $0 |
| 7+ Person Families | 0 (0.0%) | $0 |
| Total | 60 (100.0%) | $66,667 |
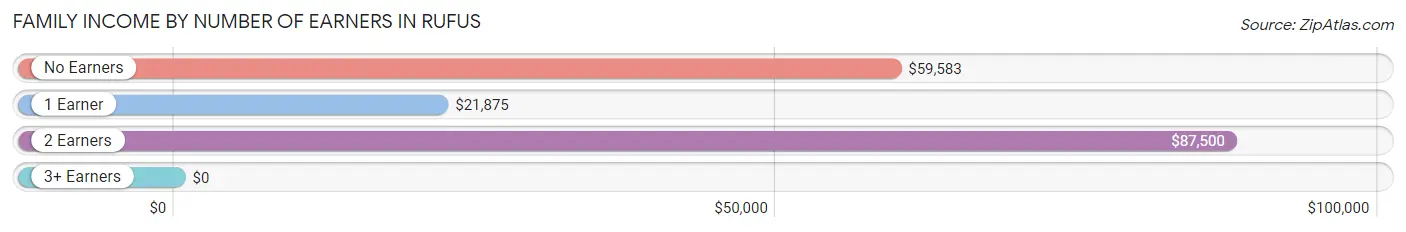
Family Income by Number of Earners in Rufus
| Number of Earners | # Families | Median Income |
| No Earners | 25 (41.7%) | $59,583 |
| 1 Earner | 17 (28.3%) | $21,875 |
| 2 Earners | 18 (30.0%) | $87,500 |
| 3+ Earners | 0 (0.0%) | $0 |
| Total | 60 (100.0%) | $66,667 |
Household Income in Rufus
Household Income Brackets in Rufus
With 26 households falling in the category, the $75,000 to $99,999 income range is the most frequent in Rufus, accounting for 22.2% of all households.
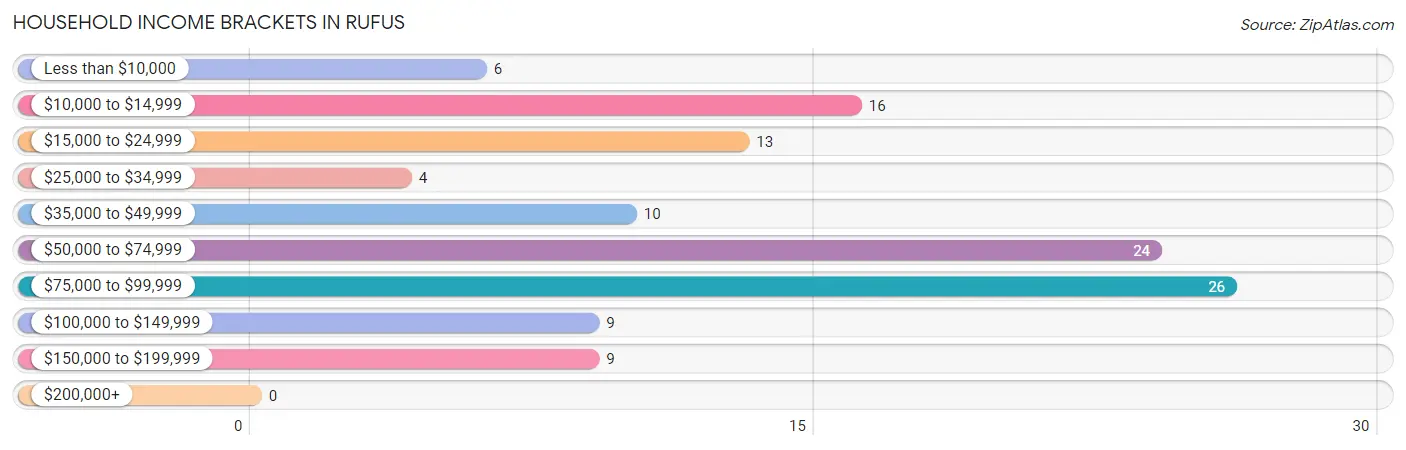
| Income Bracket | # Households | % Households |
| Less than $10,000 | 6 | 5.1% |
| $10,000 to $14,999 | 16 | 13.7% |
| $15,000 to $24,999 | 13 | 11.1% |
| $25,000 to $34,999 | 4 | 3.4% |
| $35,000 to $49,999 | 10 | 8.5% |
| $50,000 to $74,999 | 24 | 20.5% |
| $75,000 to $99,999 | 26 | 22.2% |
| $100,000 to $149,999 | 9 | 7.7% |
| $150,000 to $199,999 | 9 | 7.7% |
| $200,000+ | 0 | 0.0% |
Household Income by Householder Age in Rufus
The median household income in Rufus is $60,625, with the highest median household income of $83,750 found in the 25 to 44 years age bracket for the primary householder. A total of 22 households (18.8%) fall into this category. Meanwhile, the 15 to 24 years age bracket for the primary householder has the lowest median household income of $0, with 4 households (3.4%) in this group.
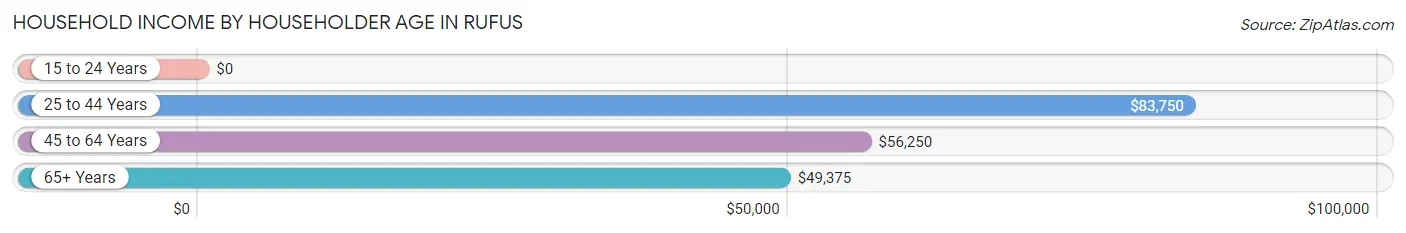
| Income Bracket | # Households | Median Income |
| 15 to 24 Years | 4 (3.4%) | $0 |
| 25 to 44 Years | 22 (18.8%) | $83,750 |
| 45 to 64 Years | 44 (37.6%) | $56,250 |
| 65+ Years | 47 (40.2%) | $49,375 |
| Total | 117 (100.0%) | $60,625 |
Poverty in Rufus
Income Below Poverty by Sex and Age in Rufus
With 14.3% poverty level for males and 32.2% for females among the residents of Rufus, 18 to 24 year old males and 12 to 14 year old females are the most vulnerable to poverty, with 3 males (75.0%) and 3 females (100.0%) in their respective age groups living below the poverty level.
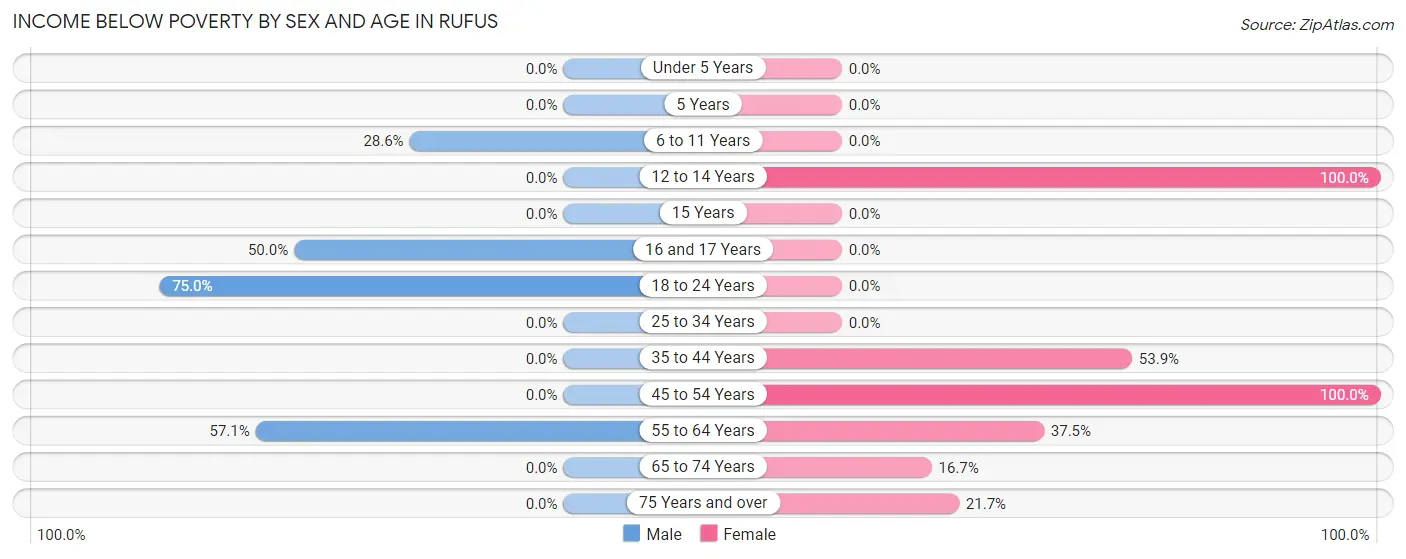
| Age Bracket | Male | Female |
| Under 5 Years | 0 (0.0%) | 0 (0.0%) |
| 5 Years | 0 (0.0%) | 0 (0.0%) |
| 6 to 11 Years | 2 (28.6%) | 0 (0.0%) |
| 12 to 14 Years | 0 (0.0%) | 3 (100.0%) |
| 15 Years | 0 (0.0%) | 0 (0.0%) |
| 16 and 17 Years | 2 (50.0%) | 0 (0.0%) |
| 18 to 24 Years | 3 (75.0%) | 0 (0.0%) |
| 25 to 34 Years | 0 (0.0%) | 0 (0.0%) |
| 35 to 44 Years | 0 (0.0%) | 7 (53.8%) |
| 45 to 54 Years | 0 (0.0%) | 3 (100.0%) |
| 55 to 64 Years | 12 (57.1%) | 6 (37.5%) |
| 65 to 74 Years | 0 (0.0%) | 4 (16.7%) |
| 75 Years and over | 0 (0.0%) | 5 (21.7%) |
| Total | 19 (14.3%) | 28 (32.2%) |
Income Above Poverty by Sex and Age in Rufus
According to the poverty statistics in Rufus, males aged under 5 years and females aged 25 to 34 years are the age groups that are most secure financially, with 100.0% of males and 100.0% of females in these age groups living above the poverty line.
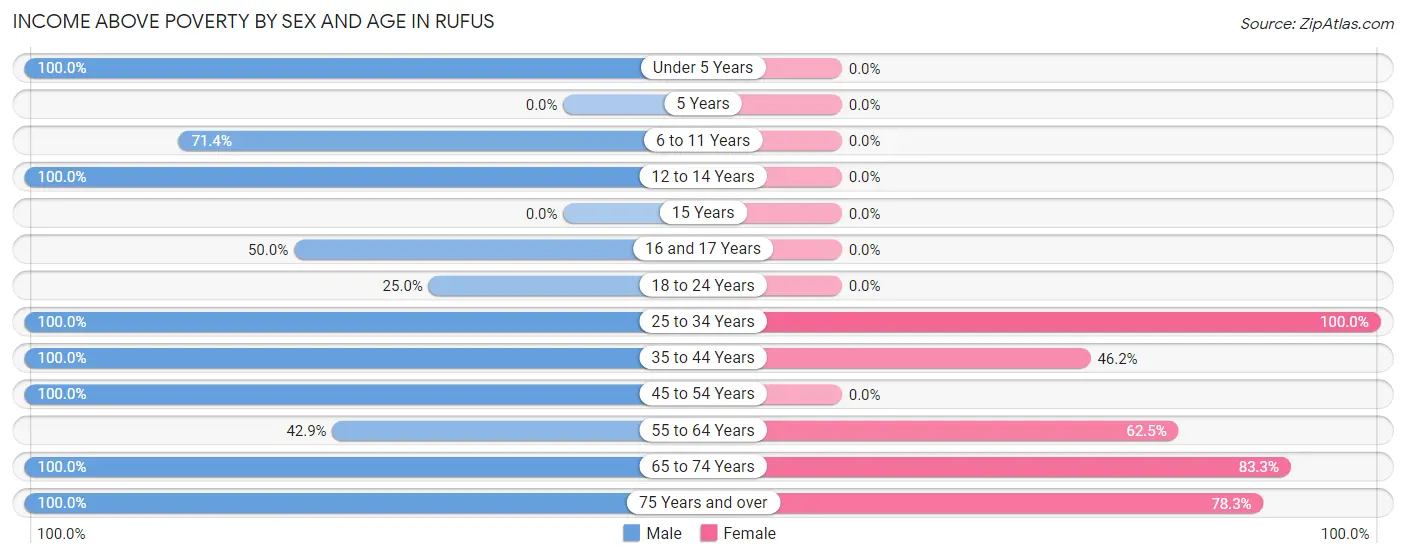
| Age Bracket | Male | Female |
| Under 5 Years | 5 (100.0%) | 0 (0.0%) |
| 5 Years | 0 (0.0%) | 0 (0.0%) |
| 6 to 11 Years | 5 (71.4%) | 0 (0.0%) |
| 12 to 14 Years | 22 (100.0%) | 0 (0.0%) |
| 15 Years | 0 (0.0%) | 0 (0.0%) |
| 16 and 17 Years | 2 (50.0%) | 0 (0.0%) |
| 18 to 24 Years | 1 (25.0%) | 0 (0.0%) |
| 25 to 34 Years | 9 (100.0%) | 5 (100.0%) |
| 35 to 44 Years | 13 (100.0%) | 6 (46.2%) |
| 45 to 54 Years | 17 (100.0%) | 0 (0.0%) |
| 55 to 64 Years | 9 (42.9%) | 10 (62.5%) |
| 65 to 74 Years | 20 (100.0%) | 20 (83.3%) |
| 75 Years and over | 11 (100.0%) | 18 (78.3%) |
| Total | 114 (85.7%) | 59 (67.8%) |
Income Below Poverty Among Married-Couple Families in Rufus
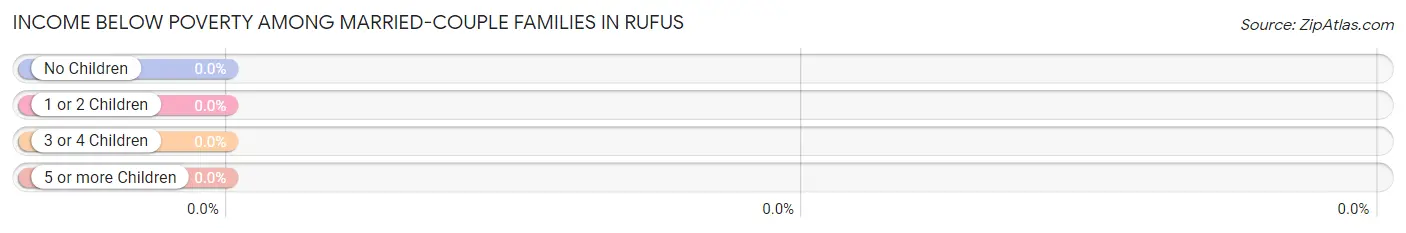
| Children | Above Poverty | Below Poverty |
| No Children | 33 (100.0%) | 0 (0.0%) |
| 1 or 2 Children | 4 (100.0%) | 0 (0.0%) |
| 3 or 4 Children | 3 (100.0%) | 0 (0.0%) |
| 5 or more Children | 0 (0.0%) | 0 (0.0%) |
| Total | 40 (100.0%) | 0 (0.0%) |
Income Below Poverty Among Single-Parent Households in Rufus
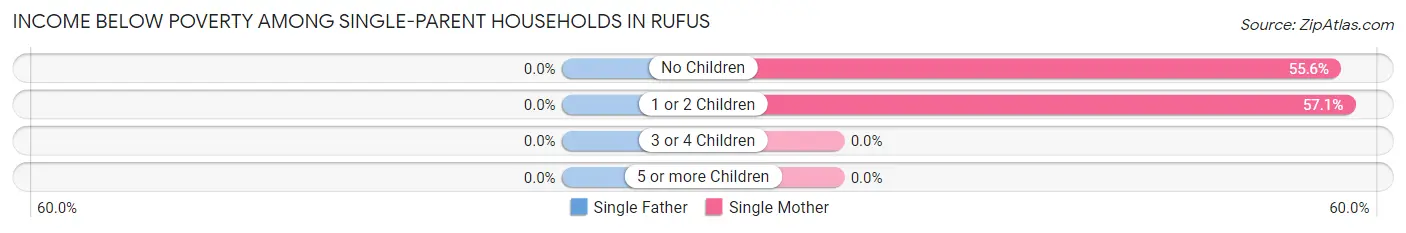
| Children | Single Father | Single Mother |
| No Children | 0 (0.0%) | 5 (55.6%) |
| 1 or 2 Children | 0 (0.0%) | 4 (57.1%) |
| 3 or 4 Children | 0 (0.0%) | 0 (0.0%) |
| 5 or more Children | 0 (0.0%) | 0 (0.0%) |
| Total | 0 (0.0%) | 9 (56.2%) |
Income Below Poverty Among Married-Couple vs Single-Parent Households in Rufus
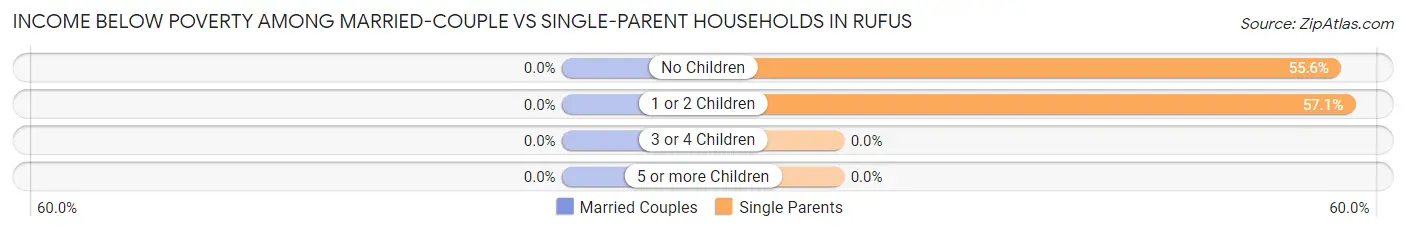
| Children | Married-Couple Families | Single-Parent Households |
| No Children | 0 (0.0%) | 5 (55.6%) |
| 1 or 2 Children | 0 (0.0%) | 4 (57.1%) |
| 3 or 4 Children | 0 (0.0%) | 0 (0.0%) |
| 5 or more Children | 0 (0.0%) | 0 (0.0%) |
| Total | 0 (0.0%) | 9 (45.0%) |
Race in Rufus
The most populous races in Rufus are White / Caucasian (167 | 75.9%), Two or more Races (50 | 22.7%), and Hispanic or Latino (46 | 20.9%).
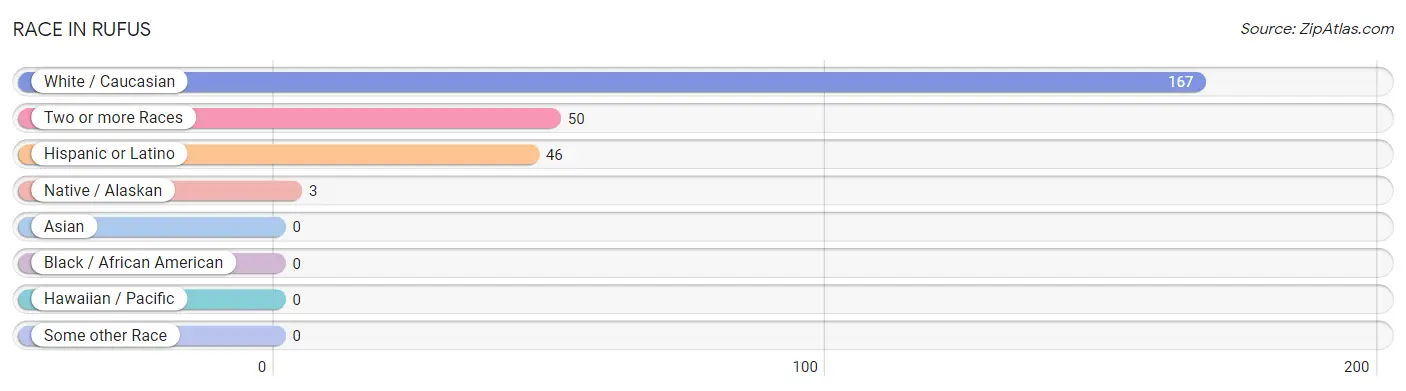
| Race | # Population | % Population |
| Asian | 0 | 0.0% |
| Black / African American | 0 | 0.0% |
| Hawaiian / Pacific | 0 | 0.0% |
| Hispanic or Latino | 46 | 20.9% |
| Native / Alaskan | 3 | 1.4% |
| White / Caucasian | 167 | 75.9% |
| Two or more Races | 50 | 22.7% |
| Some other Race | 0 | 0.0% |
| Total | 220 | 100.0% |
Ancestry in Rufus
The most populous ancestries reported in Rufus are German (53 | 24.1%), Mexican (37 | 16.8%), English (33 | 15.0%), American (22 | 10.0%), and Irish (14 | 6.4%), together accounting for 72.3% of all Rufus residents.
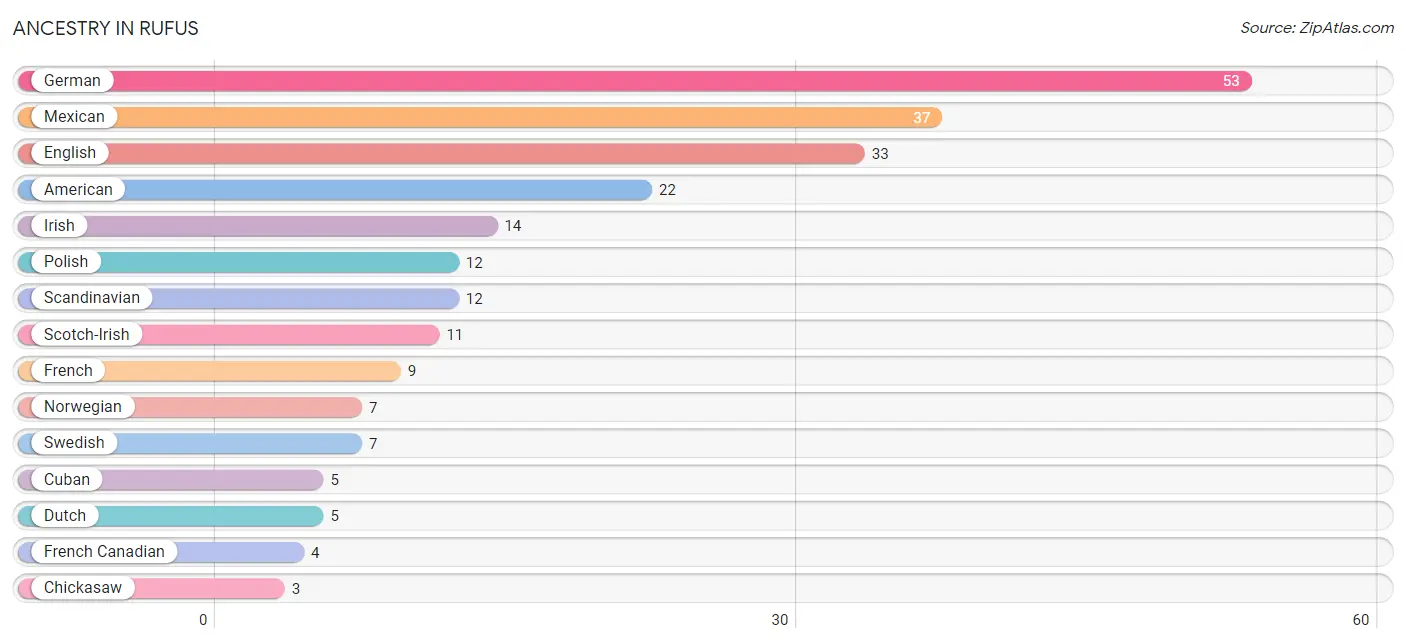
| Ancestry | # Population | % Population |
| American | 22 | 10.0% |
| Chickasaw | 3 | 1.4% |
| Cuban | 5 | 2.3% |
| Czech | 1 | 0.4% |
| Danish | 2 | 0.9% |
| Dutch | 5 | 2.3% |
| English | 33 | 15.0% |
| European | 2 | 0.9% |
| Finnish | 2 | 0.9% |
| French | 9 | 4.1% |
| French Canadian | 4 | 1.8% |
| German | 53 | 24.1% |
| Irish | 14 | 6.4% |
| Mexican | 37 | 16.8% |
| Northern European | 2 | 0.9% |
| Norwegian | 7 | 3.2% |
| Polish | 12 | 5.4% |
| Portuguese | 3 | 1.4% |
| Russian | 2 | 0.9% |
| Scandinavian | 12 | 5.4% |
| Scotch-Irish | 11 | 5.0% |
| Spaniard | 1 | 0.4% |
| Swedish | 7 | 3.2% |
| Swiss | 3 | 1.4% |
| Welsh | 3 | 1.4% | View All 25 Rows |
Immigrants in Rufus
The most numerous immigrant groups reported in Rufus came from Europe (6 | 2.7%), Western Europe (6 | 2.7%), Central America (5 | 2.3%), Latin America (5 | 2.3%), and Mexico (5 | 2.3%), together accounting for 12.3% of all Rufus residents.
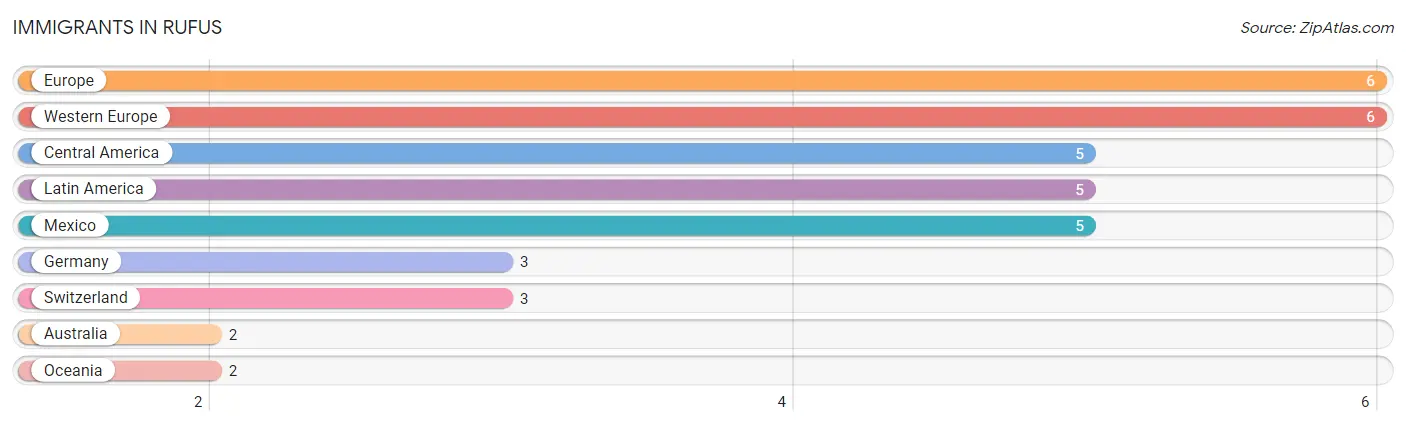
| Immigration Origin | # Population | % Population |
| Australia | 2 | 0.9% |
| Central America | 5 | 2.3% |
| Europe | 6 | 2.7% |
| Germany | 3 | 1.4% |
| Latin America | 5 | 2.3% |
| Mexico | 5 | 2.3% |
| Oceania | 2 | 0.9% |
| Switzerland | 3 | 1.4% |
| Western Europe | 6 | 2.7% | View All 9 Rows |
Sex and Age in Rufus
Sex and Age in Rufus
The most populous age groups in Rufus are 10 to 14 Years (25 | 18.8%) for men and 65 to 69 Years (17 | 19.5%) for women.
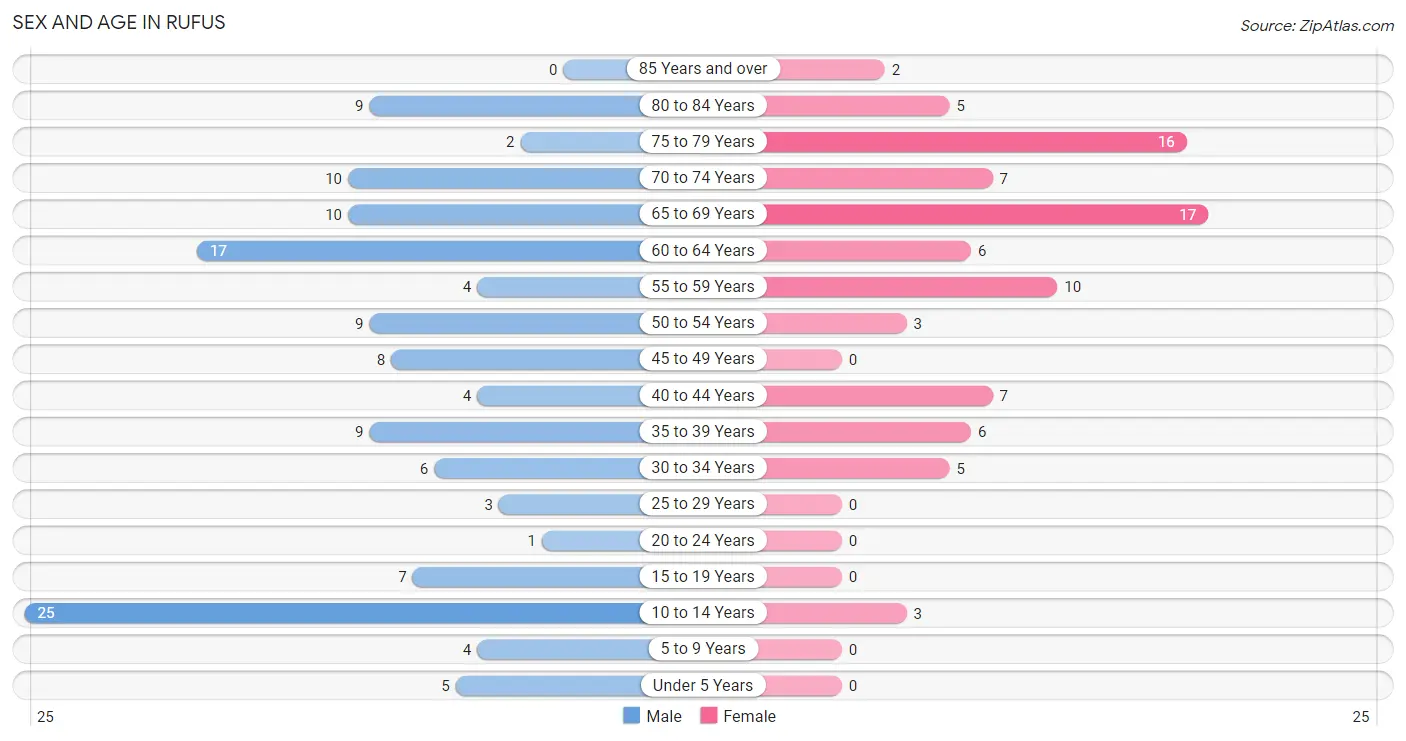
| Age Bracket | Male | Female |
| Under 5 Years | 5 (3.8%) | 0 (0.0%) |
| 5 to 9 Years | 4 (3.0%) | 0 (0.0%) |
| 10 to 14 Years | 25 (18.8%) | 3 (3.5%) |
| 15 to 19 Years | 7 (5.3%) | 0 (0.0%) |
| 20 to 24 Years | 1 (0.7%) | 0 (0.0%) |
| 25 to 29 Years | 3 (2.3%) | 0 (0.0%) |
| 30 to 34 Years | 6 (4.5%) | 5 (5.8%) |
| 35 to 39 Years | 9 (6.8%) | 6 (6.9%) |
| 40 to 44 Years | 4 (3.0%) | 7 (8.1%) |
| 45 to 49 Years | 8 (6.0%) | 0 (0.0%) |
| 50 to 54 Years | 9 (6.8%) | 3 (3.5%) |
| 55 to 59 Years | 4 (3.0%) | 10 (11.5%) |
| 60 to 64 Years | 17 (12.8%) | 6 (6.9%) |
| 65 to 69 Years | 10 (7.5%) | 17 (19.5%) |
| 70 to 74 Years | 10 (7.5%) | 7 (8.1%) |
| 75 to 79 Years | 2 (1.5%) | 16 (18.4%) |
| 80 to 84 Years | 9 (6.8%) | 5 (5.8%) |
| 85 Years and over | 0 (0.0%) | 2 (2.3%) |
| Total | 133 (100.0%) | 87 (100.0%) |
Families and Households in Rufus
Median Family Size in Rufus
The median family size in Rufus is 2.63 persons per family, with single male/father families (4 | 6.7%) accounting for the largest median family size of 6.5 persons per family. On the other hand, married-couple families (40 | 66.7%) represent the smallest median family size with 2.33 persons per family.
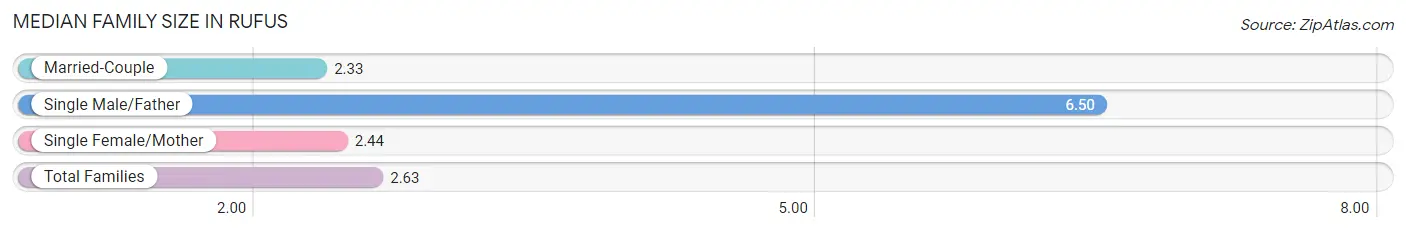
| Family Type | # Families | Family Size |
| Married-Couple | 40 (66.7%) | 2.33 |
| Single Male/Father | 4 (6.7%) | 6.50 |
| Single Female/Mother | 16 (26.7%) | 2.44 |
| Total Families | 60 (100.0%) | 2.63 |
Median Household Size in Rufus
The median household size in Rufus is 1.88 persons per household, with single male/father households (4 | 3.4%) accounting for the largest median household size of 6.5 persons per household. non-family households (57 | 48.7%) represent the smallest median household size with 1.09 persons per household.
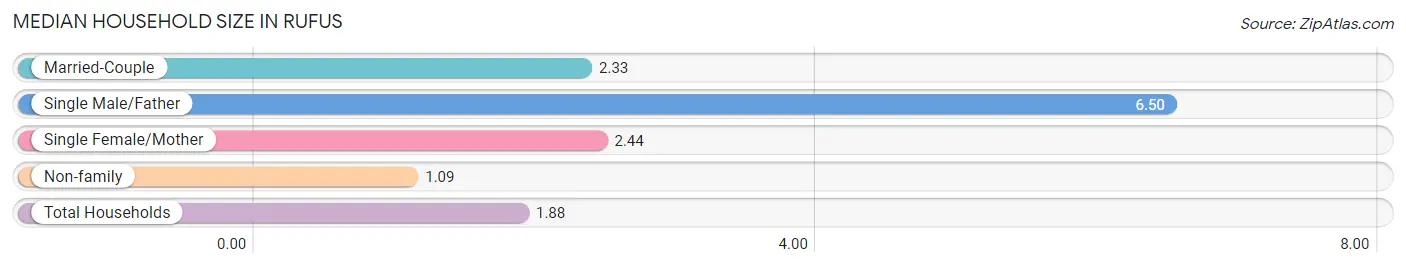
| Household Type | # Households | Household Size |
| Married-Couple | 40 (34.2%) | 2.33 |
| Single Male/Father | 4 (3.4%) | 6.50 |
| Single Female/Mother | 16 (13.7%) | 2.44 |
| Non-family | 57 (48.7%) | 1.09 |
| Total Households | 117 (100.0%) | 1.88 |
Household Size by Marriage Status in Rufus
Out of a total of 117 households in Rufus, 60 (51.3%) are family households, while 57 (48.7%) are nonfamily households. The most numerous type of family households are 2-person households, comprising 44, and the most common type of nonfamily households are 1-person households, comprising 51.
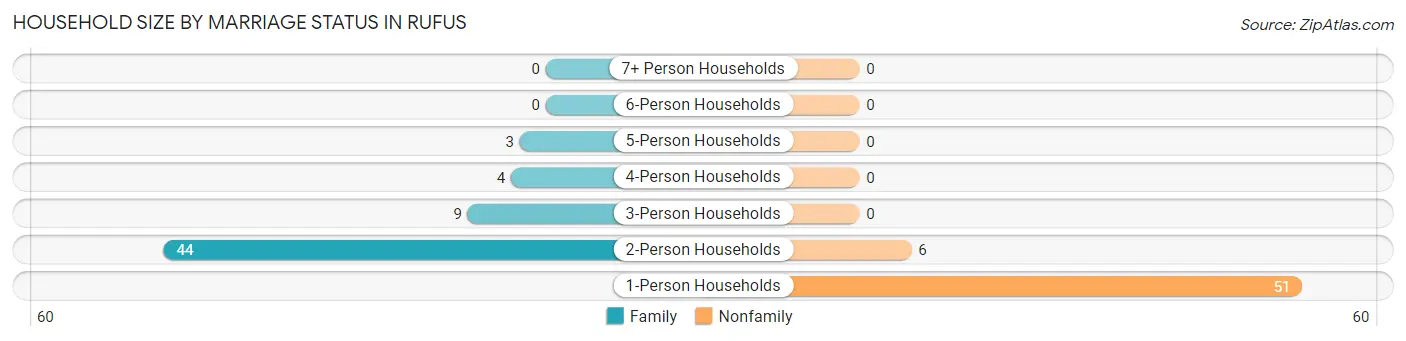
| Household Size | Family Households | Nonfamily Households |
| 1-Person Households | - | 51 (43.6%) |
| 2-Person Households | 44 (37.6%) | 6 (5.1%) |
| 3-Person Households | 9 (7.7%) | 0 (0.0%) |
| 4-Person Households | 4 (3.4%) | 0 (0.0%) |
| 5-Person Households | 3 (2.6%) | 0 (0.0%) |
| 6-Person Households | 0 (0.0%) | 0 (0.0%) |
| 7+ Person Households | 0 (0.0%) | 0 (0.0%) |
| Total | 60 (51.3%) | 57 (48.7%) |
Female Fertility in Rufus
Fertility by Age in Rufus
Average fertility rate in Rufus is 167.0 births per 1,000 women. Women in the age bracket of 20 to 34 years have the highest fertility rate with 600.0 births per 1,000 women. Women in the age bracket of 20 to 34 years acount for 100.0% of all women with births.
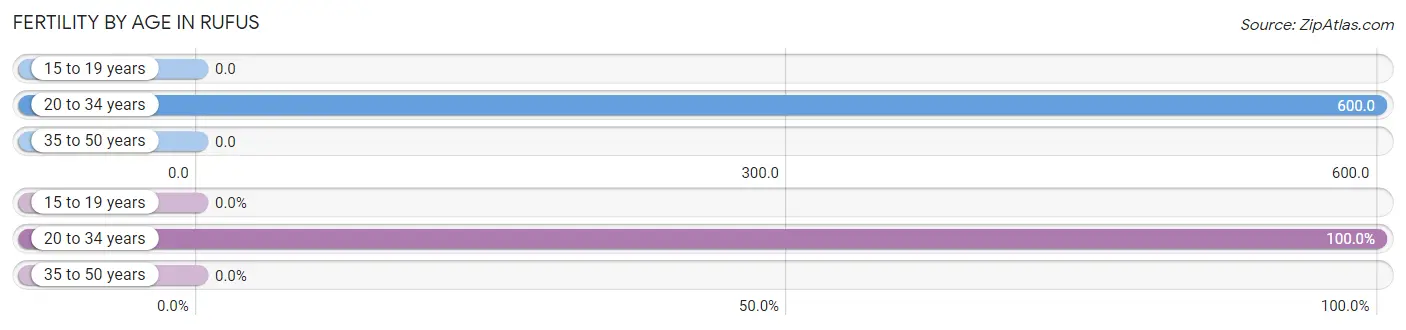
| Age Bracket | Women with Births | Births / 1,000 Women |
| 15 to 19 years | 0 (0.0%) | 0.0 |
| 20 to 34 years | 3 (100.0%) | 600.0 |
| 35 to 50 years | 0 (0.0%) | 0.0 |
| Total | 3 (100.0%) | 167.0 |
Fertility by Age by Marriage Status in Rufus
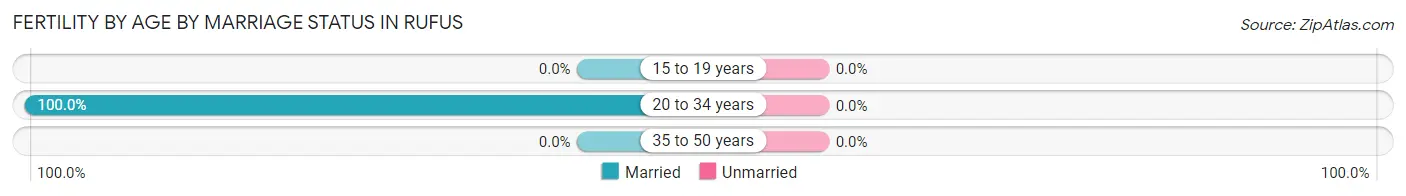
| Age Bracket | Married | Unmarried |
| 15 to 19 years | 0 (0.0%) | 0 (0.0%) |
| 20 to 34 years | 3 (100.0%) | 0 (0.0%) |
| 35 to 50 years | 0 (0.0%) | 0 (0.0%) |
| Total | 3 (100.0%) | 0 (0.0%) |
Fertility by Education in Rufus
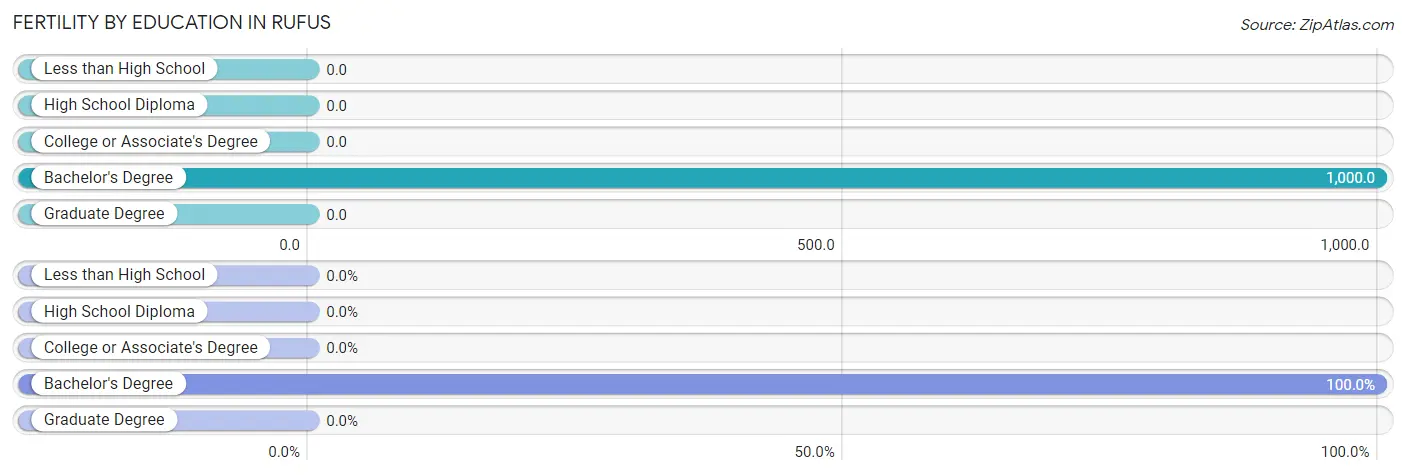
| Educational Attainment | Women with Births | Births / 1,000 Women |
| Less than High School | 0 (0.0%) | 0.0 |
| High School Diploma | 0 (0.0%) | 0.0 |
| College or Associate's Degree | 0 (0.0%) | 0.0 |
| Bachelor's Degree | 3 (100.0%) | 1,000.0 |
| Graduate Degree | 0 (0.0%) | 0.0 |
| Total | 3 (100.0%) | 167.0 |
Fertility by Education by Marriage Status in Rufus
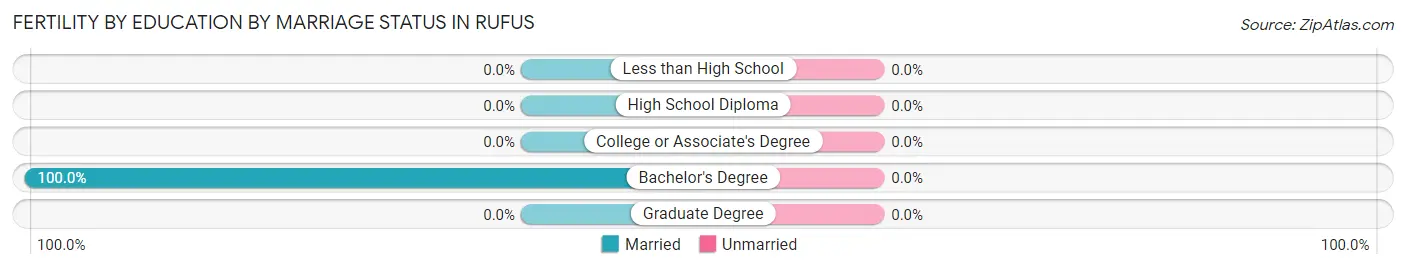
| Educational Attainment | Married | Unmarried |
| Less than High School | 0 (0.0%) | 0 (0.0%) |
| High School Diploma | 0 (0.0%) | 0 (0.0%) |
| College or Associate's Degree | 0 (0.0%) | 0 (0.0%) |
| Bachelor's Degree | 3 (100.0%) | 0 (0.0%) |
| Graduate Degree | 0 (0.0%) | 0 (0.0%) |
| Total | 3 (100.0%) | 0 (0.0%) |
Employment Characteristics in Rufus
Employment by Class of Employer in Rufus
Among the 72 employed individuals in Rufus, private company employees (61 | 84.7%), self-employed (not incorporated) (3 | 4.2%), and local government employees (3 | 4.2%) make up the most common classes of employment.
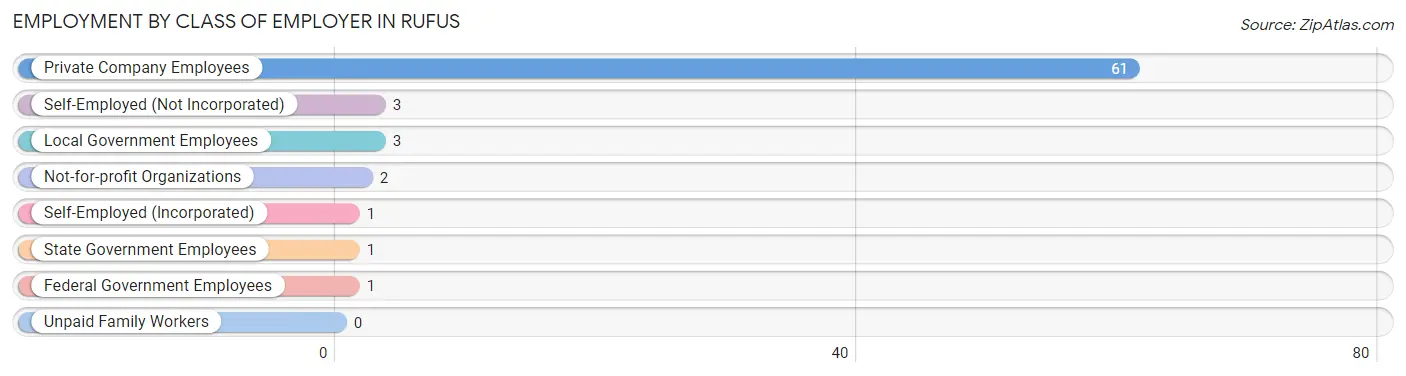
| Employer Class | # Employees | % Employees |
| Private Company Employees | 61 | 84.7% |
| Self-Employed (Incorporated) | 1 | 1.4% |
| Self-Employed (Not Incorporated) | 3 | 4.2% |
| Not-for-profit Organizations | 2 | 2.8% |
| Local Government Employees | 3 | 4.2% |
| State Government Employees | 1 | 1.4% |
| Federal Government Employees | 1 | 1.4% |
| Unpaid Family Workers | 0 | 0.0% |
| Total | 72 | 100.0% |
Employment Status by Age in Rufus
According to the labor force statistics for Rufus, out of the total population over 16 years of age (183), 44.8% or 82 individuals are in the labor force, with 6.1% or 5 of them unemployed. The age group with the highest labor force participation rate is 20 to 24 years, with 100.0% or 1 individuals in the labor force. Within the labor force, the 35 to 44 years age range has the highest percentage of unemployed individuals, with 19.2% or 5 of them being unemployed.
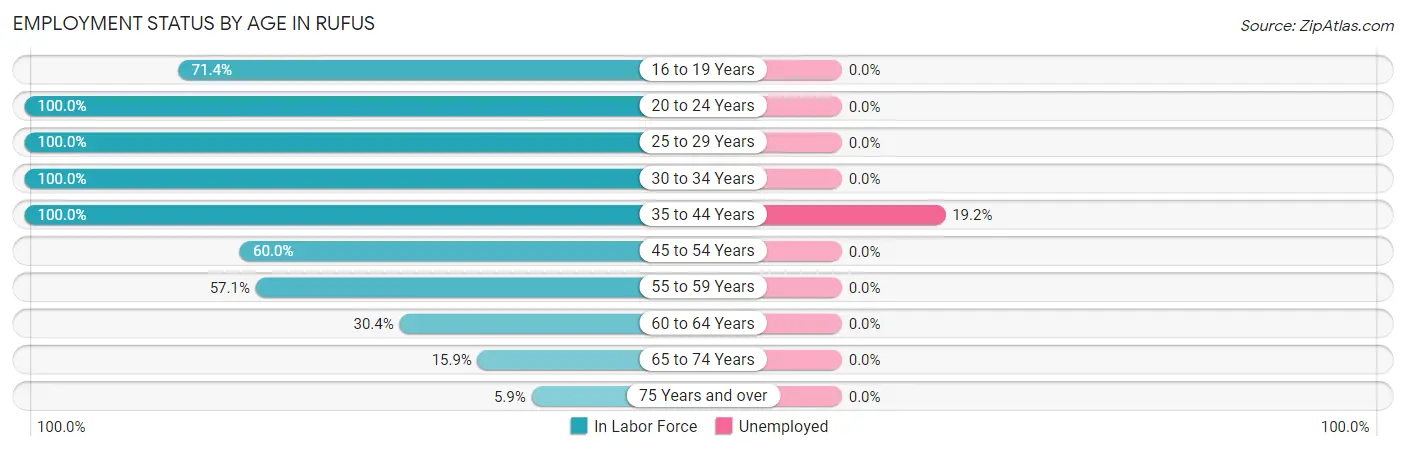
| Age Bracket | In Labor Force | Unemployed |
| 16 to 19 Years | 5 (71.4%) | 0 (0.0%) |
| 20 to 24 Years | 1 (100.0%) | 0 (0.0%) |
| 25 to 29 Years | 3 (100.0%) | 0 (0.0%) |
| 30 to 34 Years | 11 (100.0%) | 0 (0.0%) |
| 35 to 44 Years | 26 (100.0%) | 5 (19.2%) |
| 45 to 54 Years | 12 (60.0%) | 0 (0.0%) |
| 55 to 59 Years | 8 (57.1%) | 0 (0.0%) |
| 60 to 64 Years | 7 (30.4%) | 0 (0.0%) |
| 65 to 74 Years | 7 (15.9%) | 0 (0.0%) |
| 75 Years and over | 2 (5.9%) | 0 (0.0%) |
| Total | 82 (44.8%) | 5 (6.1%) |
Employment Status by Educational Attainment in Rufus
According to labor force statistics for Rufus, 69.1% of individuals (67) out of the total population between 25 and 64 years of age (97) are in the labor force, with 7.5% or 5 of them being unemployed. The group with the highest labor force participation rate are those with the educational attainment of college / associate degree, with 100.0% or 17 individuals in the labor force. Within the labor force, individuals with less than high school education have the highest percentage of unemployment, with 38.5% or 5 of them being unemployed.
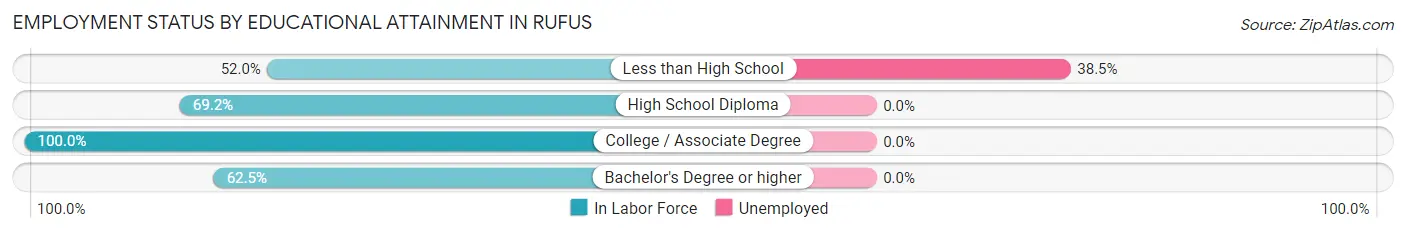
| Educational Attainment | In Labor Force | Unemployed |
| Less than High School | 13 (52.0%) | 10 (38.5%) |
| High School Diploma | 27 (69.2%) | 0 (0.0%) |
| College / Associate Degree | 17 (100.0%) | 0 (0.0%) |
| Bachelor's Degree or higher | 10 (62.5%) | 0 (0.0%) |
| Total | 67 (69.1%) | 7 (7.5%) |
Employment Occupations by Sex in Rufus
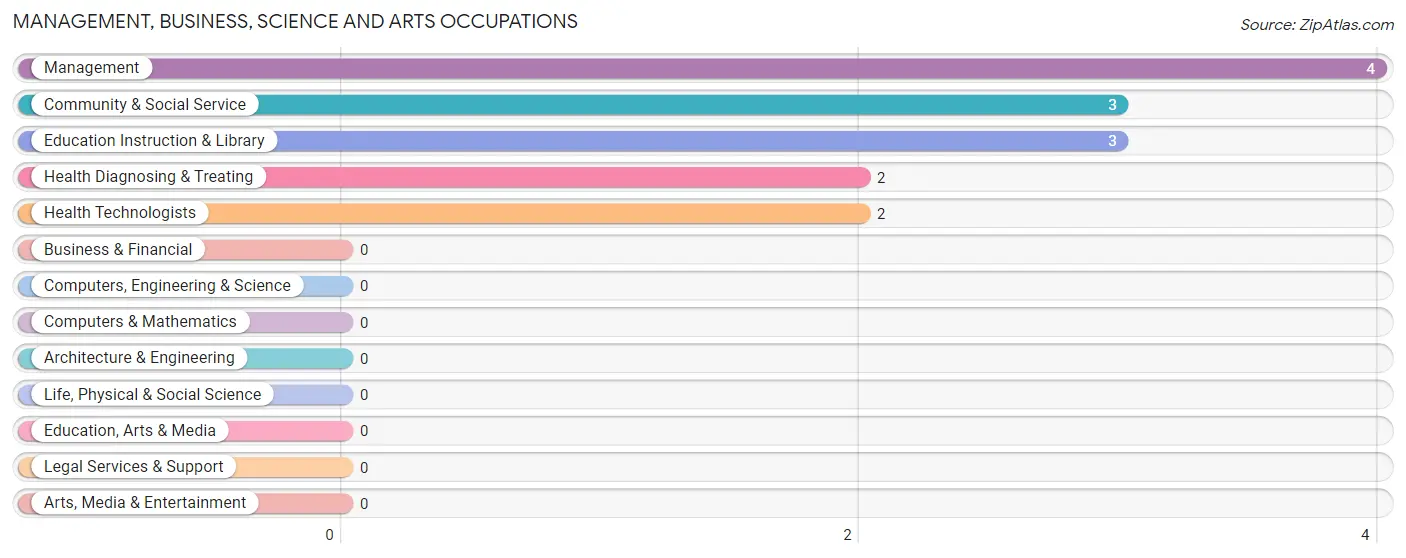
Management, Business, Science and Arts Occupations
The most common Management, Business, Science and Arts occupations in Rufus are Management (4 | 5.2%), Community & Social Service (3 | 3.9%), Education Instruction & Library (3 | 3.9%), Health Diagnosing & Treating (2 | 2.6%), and Health Technologists (2 | 2.6%).
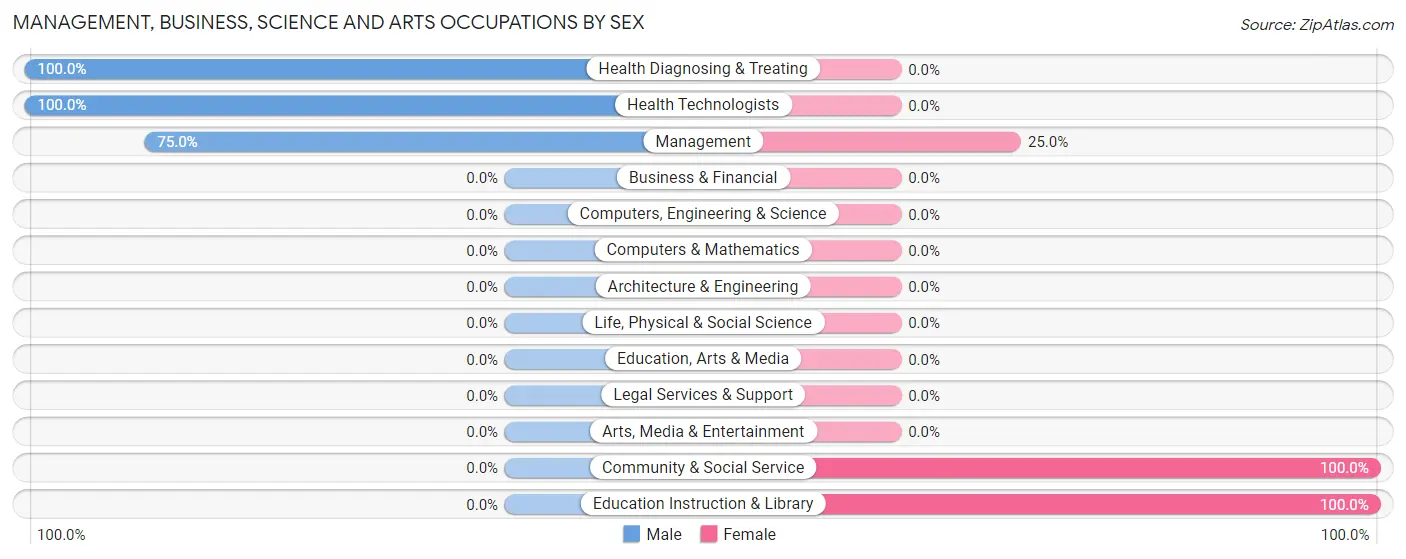
Management, Business, Science and Arts Occupations by Sex
Within the Management, Business, Science and Arts occupations in Rufus, the most male-oriented occupations are Health Diagnosing & Treating (100.0%), Health Technologists (100.0%), and Management (75.0%), while the most female-oriented occupations are Community & Social Service (100.0%), Education Instruction & Library (100.0%), and Management (25.0%).
| Occupation | Male | Female |
| Management | 3 (75.0%) | 1 (25.0%) |
| Business & Financial | 0 (0.0%) | 0 (0.0%) |
| Computers, Engineering & Science | 0 (0.0%) | 0 (0.0%) |
| Computers & Mathematics | 0 (0.0%) | 0 (0.0%) |
| Architecture & Engineering | 0 (0.0%) | 0 (0.0%) |
| Life, Physical & Social Science | 0 (0.0%) | 0 (0.0%) |
| Community & Social Service | 0 (0.0%) | 3 (100.0%) |
| Education, Arts & Media | 0 (0.0%) | 0 (0.0%) |
| Legal Services & Support | 0 (0.0%) | 0 (0.0%) |
| Education Instruction & Library | 0 (0.0%) | 3 (100.0%) |
| Arts, Media & Entertainment | 0 (0.0%) | 0 (0.0%) |
| Health Diagnosing & Treating | 2 (100.0%) | 0 (0.0%) |
| Health Technologists | 2 (100.0%) | 0 (0.0%) |
| Total (Category) | 5 (55.6%) | 4 (44.4%) |
| Total (Overall) | 48 (62.3%) | 29 (37.7%) |
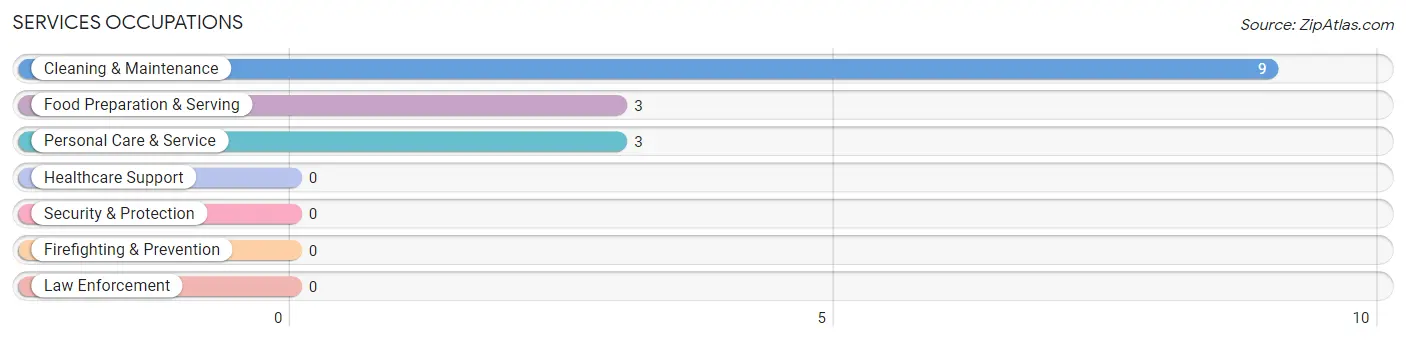
Services Occupations
The most common Services occupations in Rufus are Cleaning & Maintenance (9 | 11.7%), Food Preparation & Serving (3 | 3.9%), and Personal Care & Service (3 | 3.9%).
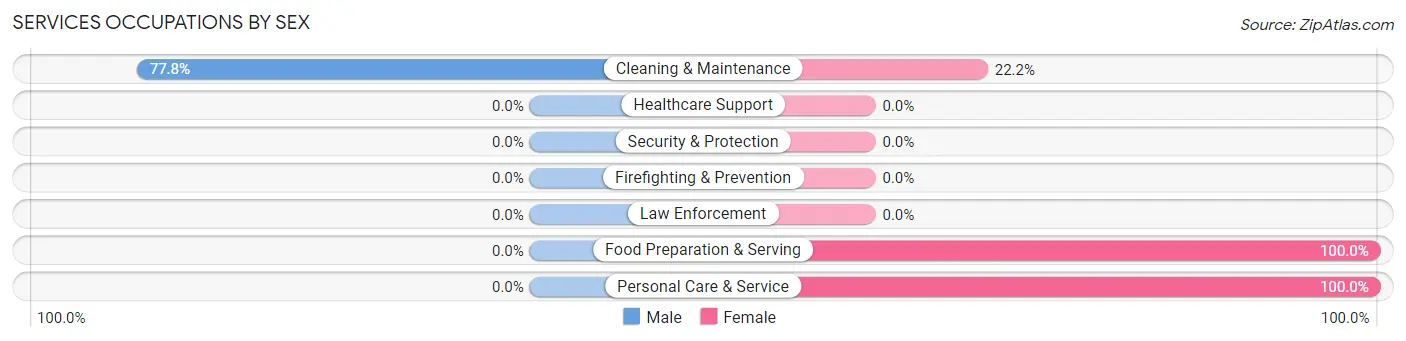
Services Occupations by Sex
| Occupation | Male | Female |
| Healthcare Support | 0 (0.0%) | 0 (0.0%) |
| Security & Protection | 0 (0.0%) | 0 (0.0%) |
| Firefighting & Prevention | 0 (0.0%) | 0 (0.0%) |
| Law Enforcement | 0 (0.0%) | 0 (0.0%) |
| Food Preparation & Serving | 0 (0.0%) | 3 (100.0%) |
| Cleaning & Maintenance | 7 (77.8%) | 2 (22.2%) |
| Personal Care & Service | 0 (0.0%) | 3 (100.0%) |
| Total (Category) | 7 (46.7%) | 8 (53.3%) |
| Total (Overall) | 48 (62.3%) | 29 (37.7%) |
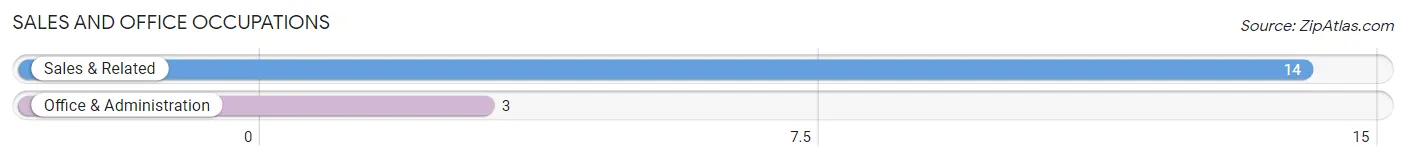
Sales and Office Occupations
The most common Sales and Office occupations in Rufus are Sales & Related (14 | 18.2%), and Office & Administration (3 | 3.9%).
Sales and Office Occupations by Sex
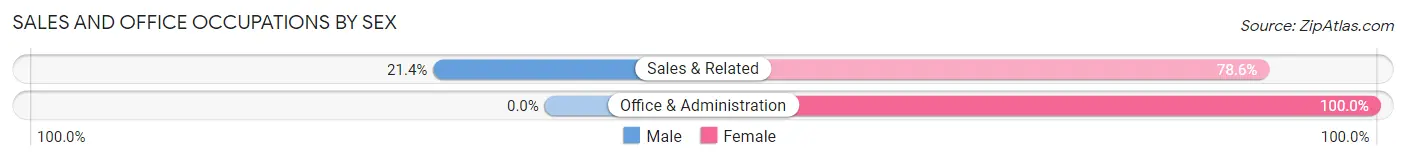
| Occupation | Male | Female |
| Sales & Related | 3 (21.4%) | 11 (78.6%) |
| Office & Administration | 0 (0.0%) | 3 (100.0%) |
| Total (Category) | 3 (17.6%) | 14 (82.4%) |
| Total (Overall) | 48 (62.3%) | 29 (37.7%) |
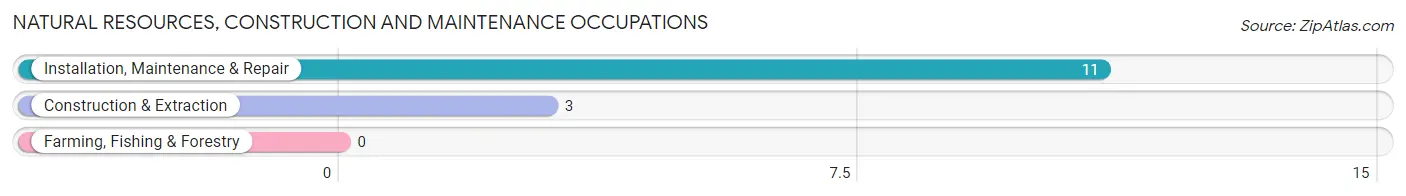
Natural Resources, Construction and Maintenance Occupations
The most common Natural Resources, Construction and Maintenance occupations in Rufus are Installation, Maintenance & Repair (11 | 14.3%), and Construction & Extraction (3 | 3.9%).
Natural Resources, Construction and Maintenance Occupations by Sex
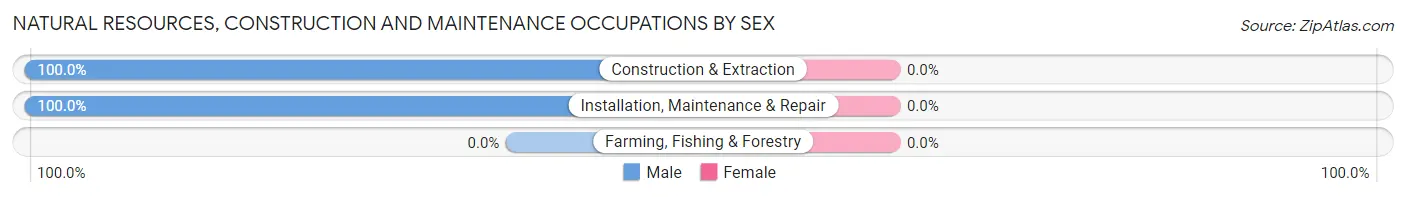
| Occupation | Male | Female |
| Farming, Fishing & Forestry | 0 (0.0%) | 0 (0.0%) |
| Construction & Extraction | 3 (100.0%) | 0 (0.0%) |
| Installation, Maintenance & Repair | 11 (100.0%) | 0 (0.0%) |
| Total (Category) | 14 (100.0%) | 0 (0.0%) |
| Total (Overall) | 48 (62.3%) | 29 (37.7%) |
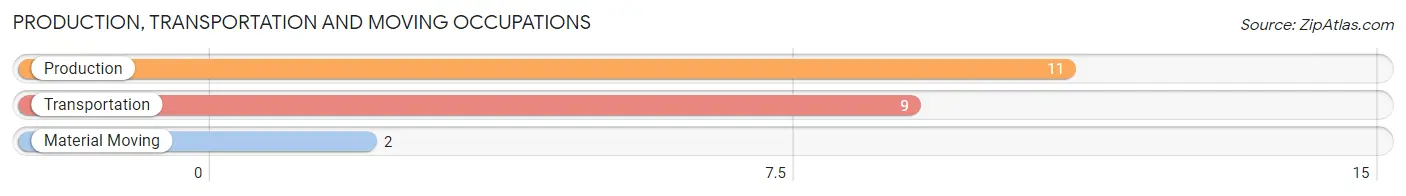
Production, Transportation and Moving Occupations
The most common Production, Transportation and Moving occupations in Rufus are Production (11 | 14.3%), Transportation (9 | 11.7%), and Material Moving (2 | 2.6%).
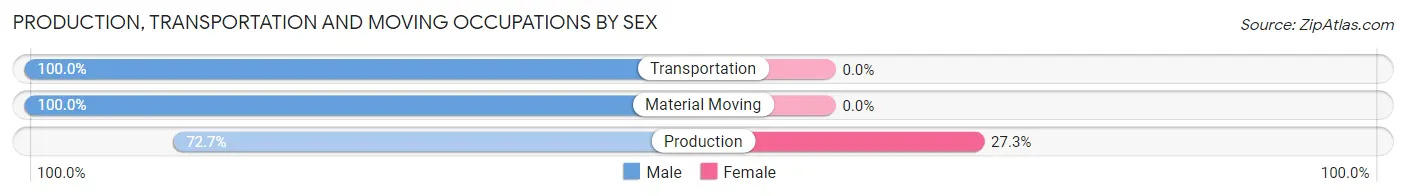
Production, Transportation and Moving Occupations by Sex
| Occupation | Male | Female |
| Production | 8 (72.7%) | 3 (27.3%) |
| Transportation | 9 (100.0%) | 0 (0.0%) |
| Material Moving | 2 (100.0%) | 0 (0.0%) |
| Total (Category) | 19 (86.4%) | 3 (13.6%) |
| Total (Overall) | 48 (62.3%) | 29 (37.7%) |
Employment Industries by Sex in Rufus
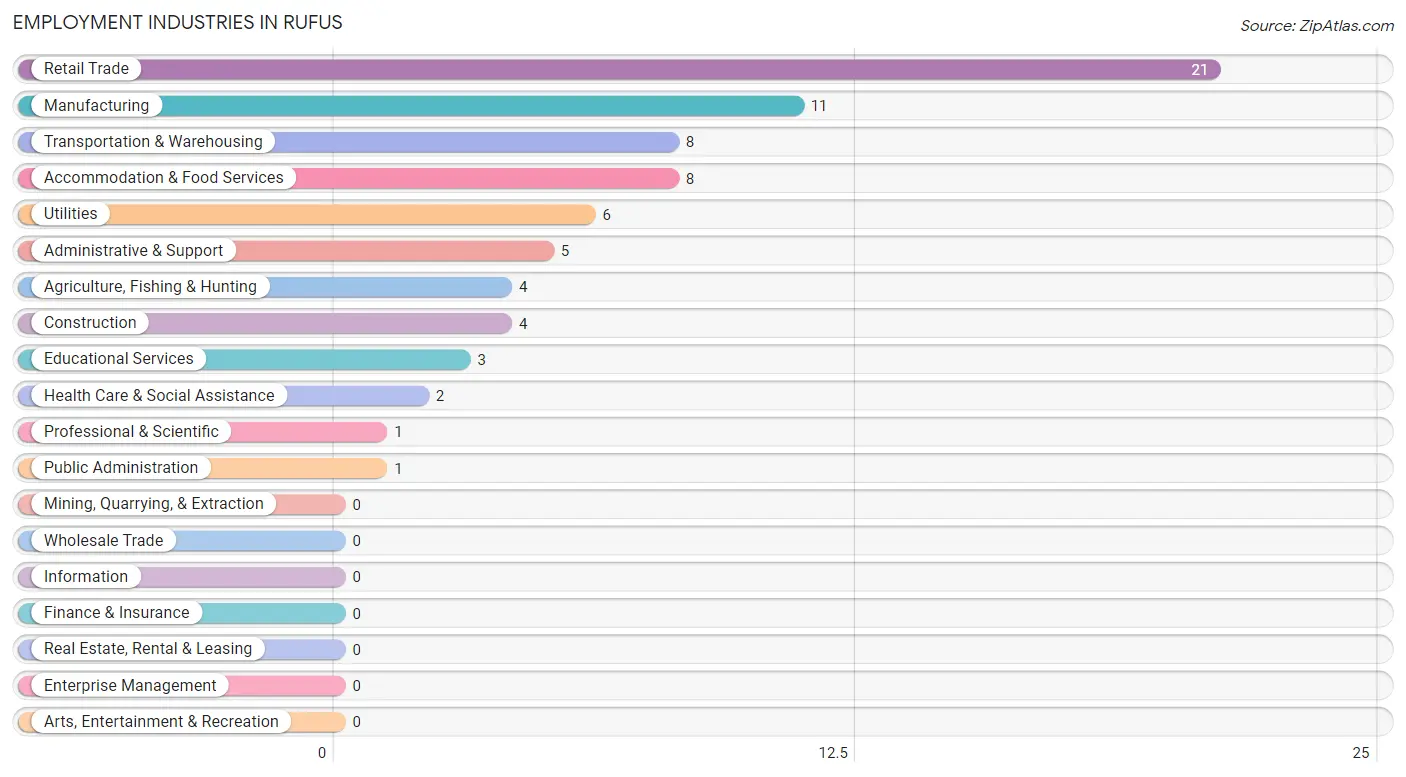
Employment Industries in Rufus
The major employment industries in Rufus include Retail Trade (21 | 27.3%), Manufacturing (11 | 14.3%), Transportation & Warehousing (8 | 10.4%), Accommodation & Food Services (8 | 10.4%), and Utilities (6 | 7.8%).
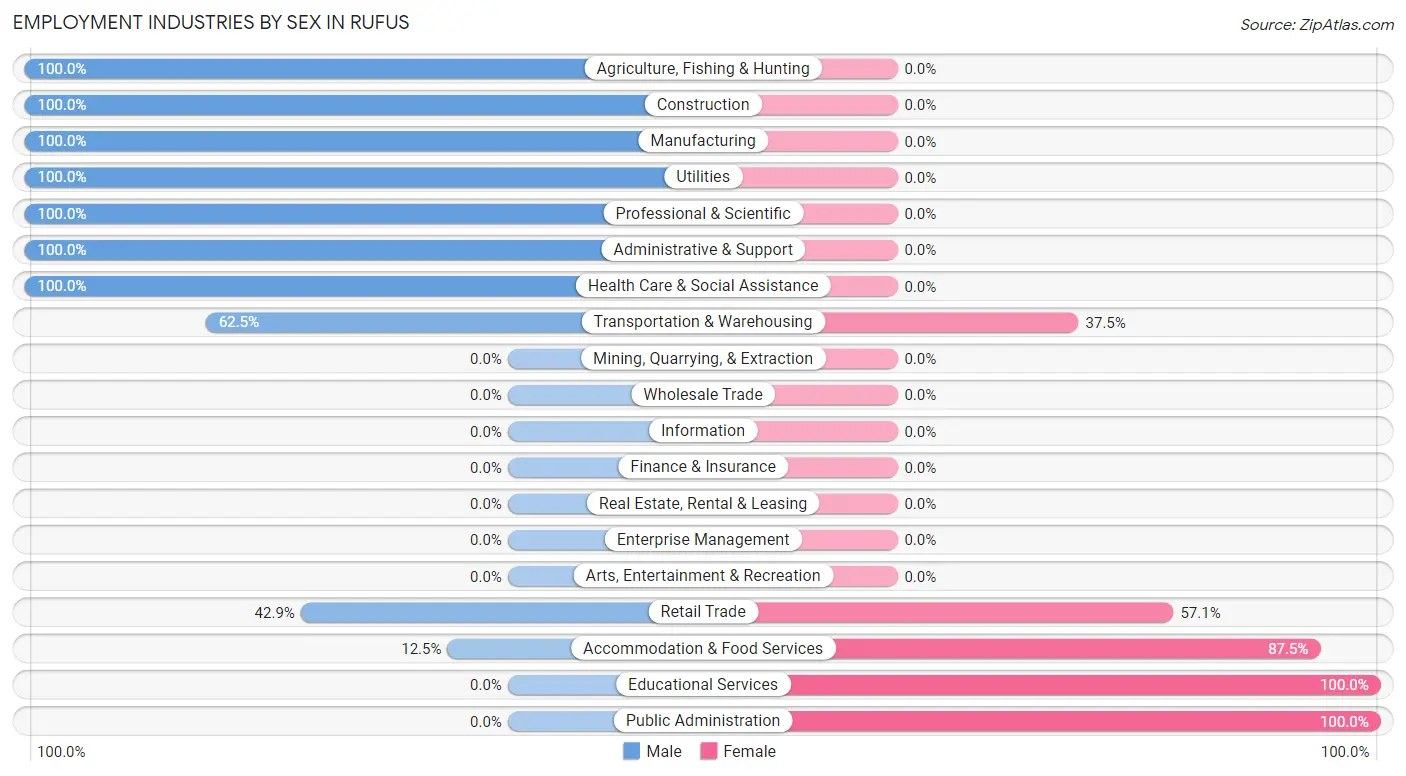
Employment Industries by Sex in Rufus
The Rufus industries that see more men than women are Agriculture, Fishing & Hunting (100.0%), Construction (100.0%), and Manufacturing (100.0%), whereas the industries that tend to have a higher number of women are Educational Services (100.0%), Public Administration (100.0%), and Accommodation & Food Services (87.5%).
| Industry | Male | Female |
| Agriculture, Fishing & Hunting | 4 (100.0%) | 0 (0.0%) |
| Mining, Quarrying, & Extraction | 0 (0.0%) | 0 (0.0%) |
| Construction | 4 (100.0%) | 0 (0.0%) |
| Manufacturing | 11 (100.0%) | 0 (0.0%) |
| Wholesale Trade | 0 (0.0%) | 0 (0.0%) |
| Retail Trade | 9 (42.9%) | 12 (57.1%) |
| Transportation & Warehousing | 5 (62.5%) | 3 (37.5%) |
| Utilities | 6 (100.0%) | 0 (0.0%) |
| Information | 0 (0.0%) | 0 (0.0%) |
| Finance & Insurance | 0 (0.0%) | 0 (0.0%) |
| Real Estate, Rental & Leasing | 0 (0.0%) | 0 (0.0%) |
| Professional & Scientific | 1 (100.0%) | 0 (0.0%) |
| Enterprise Management | 0 (0.0%) | 0 (0.0%) |
| Administrative & Support | 5 (100.0%) | 0 (0.0%) |
| Educational Services | 0 (0.0%) | 3 (100.0%) |
| Health Care & Social Assistance | 2 (100.0%) | 0 (0.0%) |
| Arts, Entertainment & Recreation | 0 (0.0%) | 0 (0.0%) |
| Accommodation & Food Services | 1 (12.5%) | 7 (87.5%) |
| Public Administration | 0 (0.0%) | 1 (100.0%) |
| Total | 48 (62.3%) | 29 (37.7%) |
Education in Rufus
School Enrollment in Rufus
The most common levels of schooling among the 42 students in Rufus are middle school (25 | 59.5%), elementary school (7 | 16.7%), and high school (7 | 16.7%).
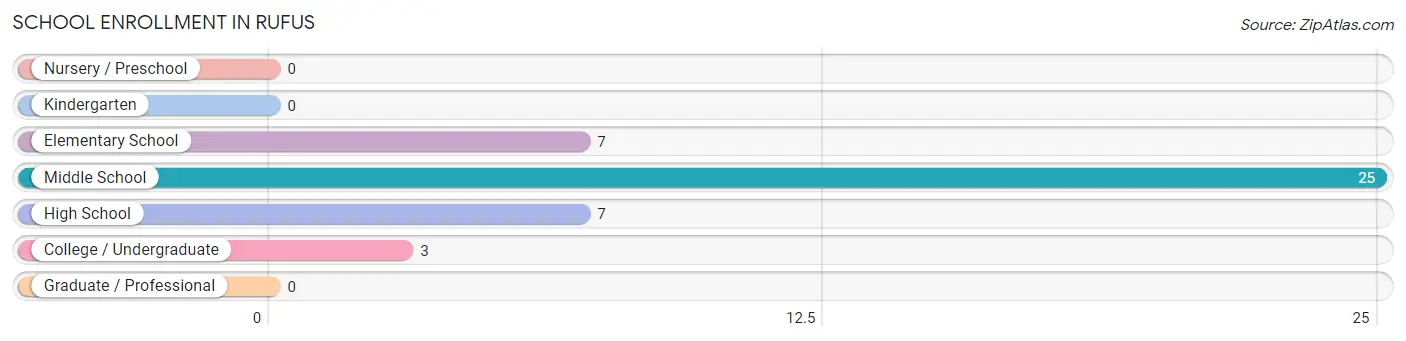
| School Level | # Students | % Students |
| Nursery / Preschool | 0 | 0.0% |
| Kindergarten | 0 | 0.0% |
| Elementary School | 7 | 16.7% |
| Middle School | 25 | 59.5% |
| High School | 7 | 16.7% |
| College / Undergraduate | 3 | 7.1% |
| Graduate / Professional | 0 | 0.0% |
| Total | 42 | 100.0% |
School Enrollment by Age by Funding Source in Rufus
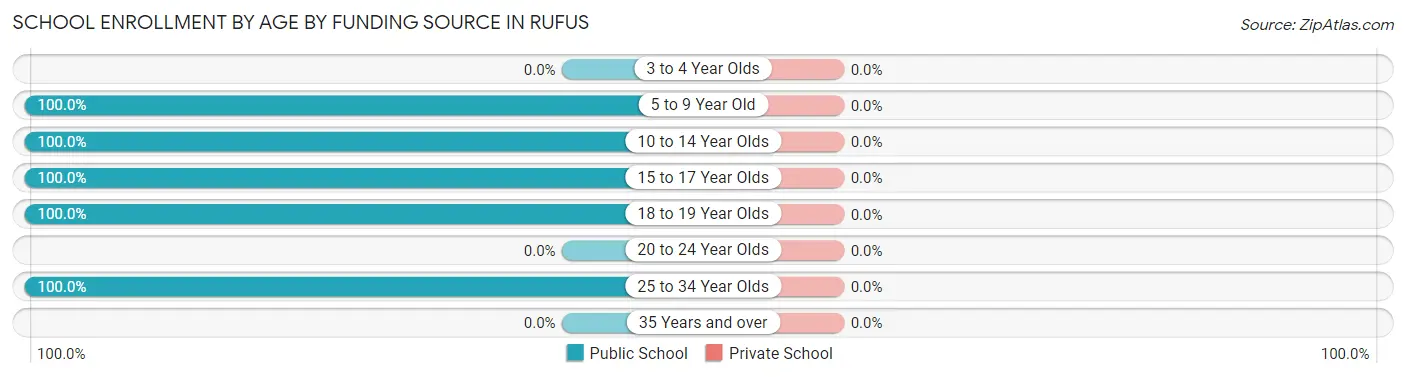
| Age Bracket | Public School | Private School |
| 3 to 4 Year Olds | 0 (0.0%) | 0 (0.0%) |
| 5 to 9 Year Old | 4 (100.0%) | 0 (0.0%) |
| 10 to 14 Year Olds | 28 (100.0%) | 0 (0.0%) |
| 15 to 17 Year Olds | 4 (100.0%) | 0 (0.0%) |
| 18 to 19 Year Olds | 3 (100.0%) | 0 (0.0%) |
| 20 to 24 Year Olds | 0 (0.0%) | 0 (0.0%) |
| 25 to 34 Year Olds | 3 (100.0%) | 0 (0.0%) |
| 35 Years and over | 0 (0.0%) | 0 (0.0%) |
| Total | 42 (100.0%) | 0 (0.0%) |
Educational Attainment by Field of Study in Rufus
Education (6 | 30.0%), engineering (5 | 25.0%), multidisciplinary studies (3 | 15.0%), literature & languages (3 | 15.0%), and business (2 | 10.0%) are the most common fields of study among 20 individuals in Rufus who have obtained a bachelor's degree or higher.
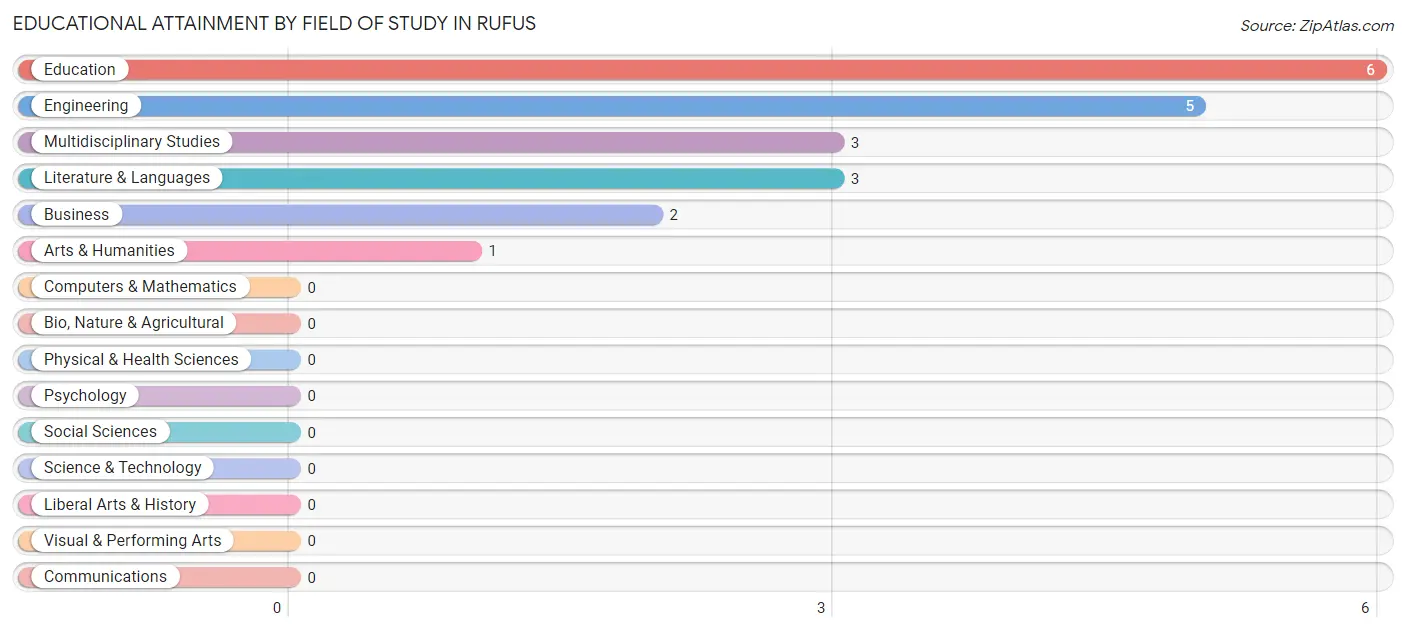
| Field of Study | # Graduates | % Graduates |
| Computers & Mathematics | 0 | 0.0% |
| Bio, Nature & Agricultural | 0 | 0.0% |
| Physical & Health Sciences | 0 | 0.0% |
| Psychology | 0 | 0.0% |
| Social Sciences | 0 | 0.0% |
| Engineering | 5 | 25.0% |
| Multidisciplinary Studies | 3 | 15.0% |
| Science & Technology | 0 | 0.0% |
| Business | 2 | 10.0% |
| Education | 6 | 30.0% |
| Literature & Languages | 3 | 15.0% |
| Liberal Arts & History | 0 | 0.0% |
| Visual & Performing Arts | 0 | 0.0% |
| Communications | 0 | 0.0% |
| Arts & Humanities | 1 | 5.0% |
| Total | 20 | 100.0% |
Transportation & Commute in Rufus
Vehicle Availability by Sex in Rufus
The most prevalent vehicle ownership categories in Rufus are males with 2 vehicles (21, accounting for 43.8%) and females with 2 vehicles (5, making up 87.5%).
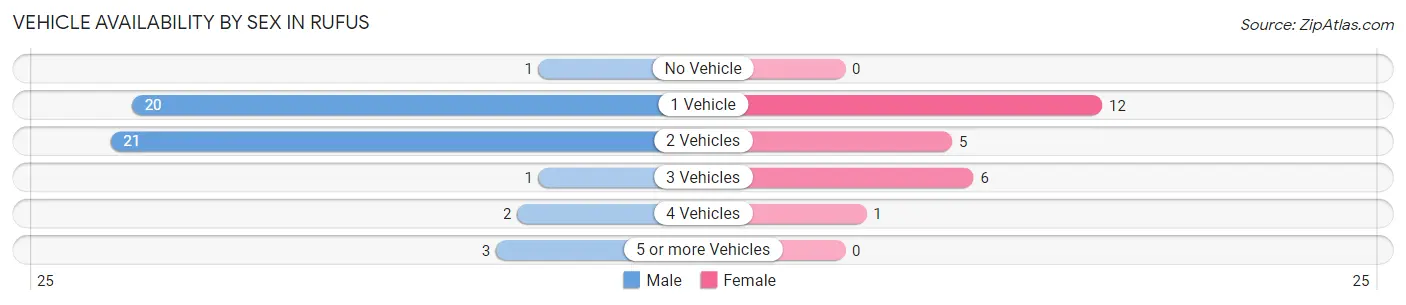
| Vehicles Available | Male | Female |
| No Vehicle | 1 (2.1%) | 0 (0.0%) |
| 1 Vehicle | 20 (41.7%) | 12 (50.0%) |
| 2 Vehicles | 21 (43.8%) | 5 (20.8%) |
| 3 Vehicles | 1 (2.1%) | 6 (25.0%) |
| 4 Vehicles | 2 (4.2%) | 1 (4.2%) |
| 5 or more Vehicles | 3 (6.2%) | 0 (0.0%) |
| Total | 48 (100.0%) | 24 (100.0%) |
Commute Time in Rufus
The most frequently occuring commute durations in Rufus are 5 to 9 minutes (22 commuters, 30.6%), 10 to 14 minutes (15 commuters, 20.8%), and less than 5 minutes (8 commuters, 11.1%).
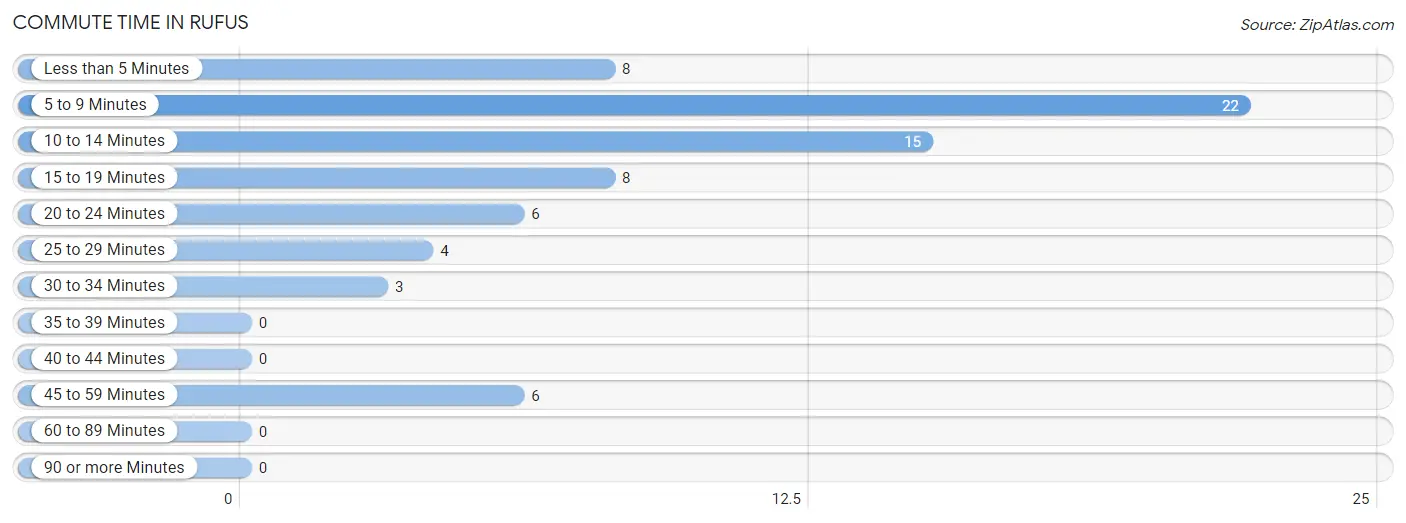
| Commute Time | # Commuters | % Commuters |
| Less than 5 Minutes | 8 | 11.1% |
| 5 to 9 Minutes | 22 | 30.6% |
| 10 to 14 Minutes | 15 | 20.8% |
| 15 to 19 Minutes | 8 | 11.1% |
| 20 to 24 Minutes | 6 | 8.3% |
| 25 to 29 Minutes | 4 | 5.6% |
| 30 to 34 Minutes | 3 | 4.2% |
| 35 to 39 Minutes | 0 | 0.0% |
| 40 to 44 Minutes | 0 | 0.0% |
| 45 to 59 Minutes | 6 | 8.3% |
| 60 to 89 Minutes | 0 | 0.0% |
| 90 or more Minutes | 0 | 0.0% |
Commute Time by Sex in Rufus
The most common commute times in Rufus are 5 to 9 minutes (22 commuters, 45.8%) for males and 10 to 14 minutes (10 commuters, 41.7%) for females.
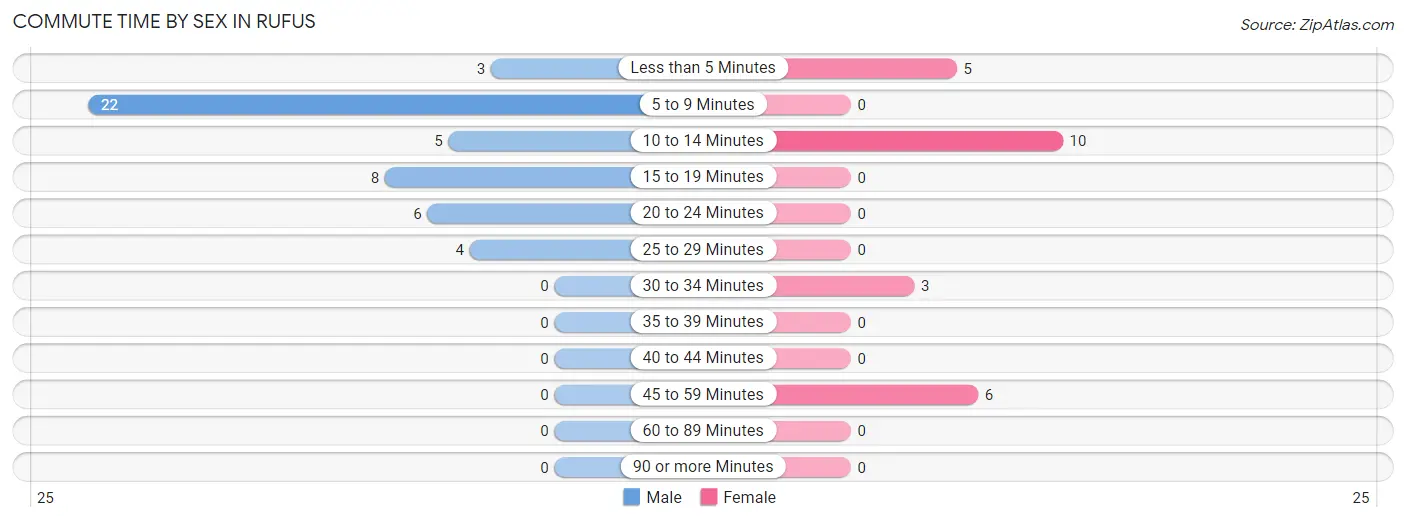
| Commute Time | Male | Female |
| Less than 5 Minutes | 3 (6.2%) | 5 (20.8%) |
| 5 to 9 Minutes | 22 (45.8%) | 0 (0.0%) |
| 10 to 14 Minutes | 5 (10.4%) | 10 (41.7%) |
| 15 to 19 Minutes | 8 (16.7%) | 0 (0.0%) |
| 20 to 24 Minutes | 6 (12.5%) | 0 (0.0%) |
| 25 to 29 Minutes | 4 (8.3%) | 0 (0.0%) |
| 30 to 34 Minutes | 0 (0.0%) | 3 (12.5%) |
| 35 to 39 Minutes | 0 (0.0%) | 0 (0.0%) |
| 40 to 44 Minutes | 0 (0.0%) | 0 (0.0%) |
| 45 to 59 Minutes | 0 (0.0%) | 6 (25.0%) |
| 60 to 89 Minutes | 0 (0.0%) | 0 (0.0%) |
| 90 or more Minutes | 0 (0.0%) | 0 (0.0%) |
Time of Departure to Work by Sex in Rufus
The most frequent times of departure to work in Rufus are 6:00 AM to 6:29 AM (24, 50.0%) for males and 7:00 AM to 7:29 AM (11, 45.8%) for females.
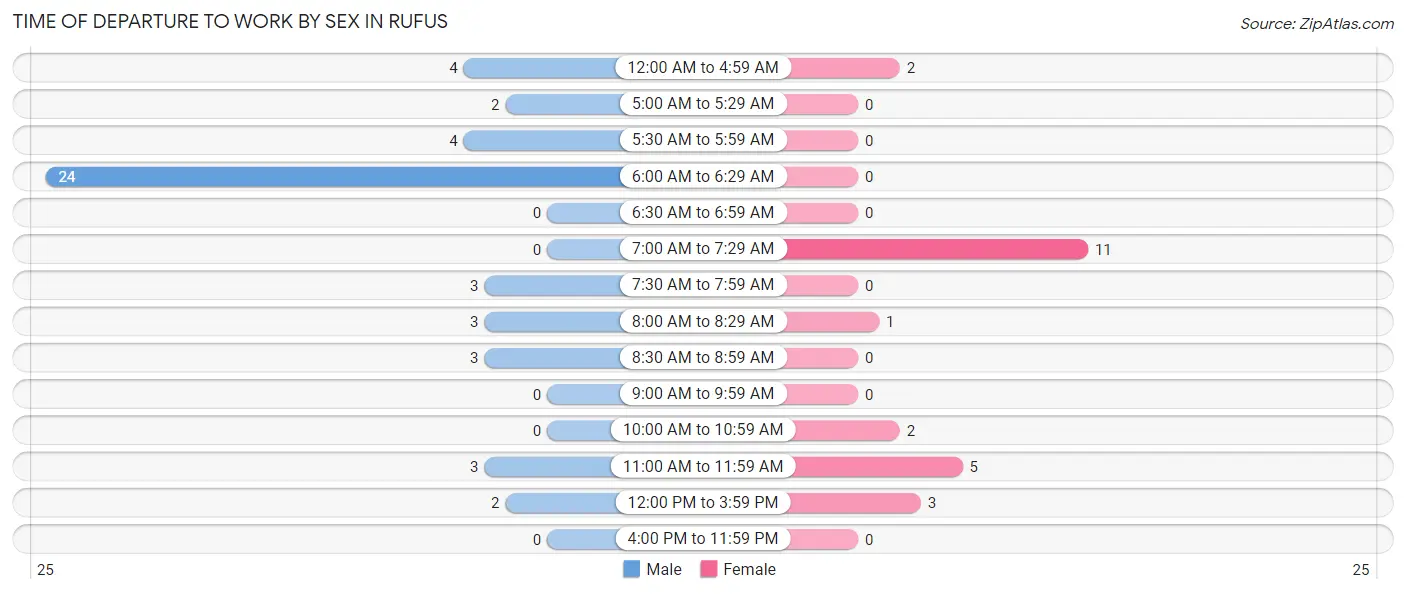
| Time of Departure | Male | Female |
| 12:00 AM to 4:59 AM | 4 (8.3%) | 2 (8.3%) |
| 5:00 AM to 5:29 AM | 2 (4.2%) | 0 (0.0%) |
| 5:30 AM to 5:59 AM | 4 (8.3%) | 0 (0.0%) |
| 6:00 AM to 6:29 AM | 24 (50.0%) | 0 (0.0%) |
| 6:30 AM to 6:59 AM | 0 (0.0%) | 0 (0.0%) |
| 7:00 AM to 7:29 AM | 0 (0.0%) | 11 (45.8%) |
| 7:30 AM to 7:59 AM | 3 (6.2%) | 0 (0.0%) |
| 8:00 AM to 8:29 AM | 3 (6.2%) | 1 (4.2%) |
| 8:30 AM to 8:59 AM | 3 (6.2%) | 0 (0.0%) |
| 9:00 AM to 9:59 AM | 0 (0.0%) | 0 (0.0%) |
| 10:00 AM to 10:59 AM | 0 (0.0%) | 2 (8.3%) |
| 11:00 AM to 11:59 AM | 3 (6.2%) | 5 (20.8%) |
| 12:00 PM to 3:59 PM | 2 (4.2%) | 3 (12.5%) |
| 4:00 PM to 11:59 PM | 0 (0.0%) | 0 (0.0%) |
| Total | 48 (100.0%) | 24 (100.0%) |
Housing Occupancy in Rufus
Occupancy by Ownership in Rufus
Of the total 117 dwellings in Rufus, owner-occupied units account for 99 (84.6%), while renter-occupied units make up 18 (15.4%).
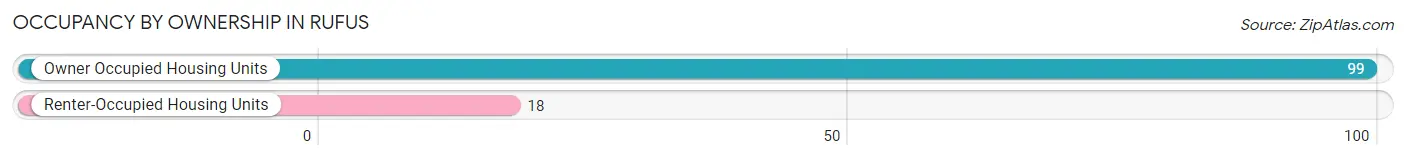
| Occupancy | # Housing Units | % Housing Units |
| Owner Occupied Housing Units | 99 | 84.6% |
| Renter-Occupied Housing Units | 18 | 15.4% |
| Total Occupied Housing Units | 117 | 100.0% |
Occupancy by Household Size in Rufus
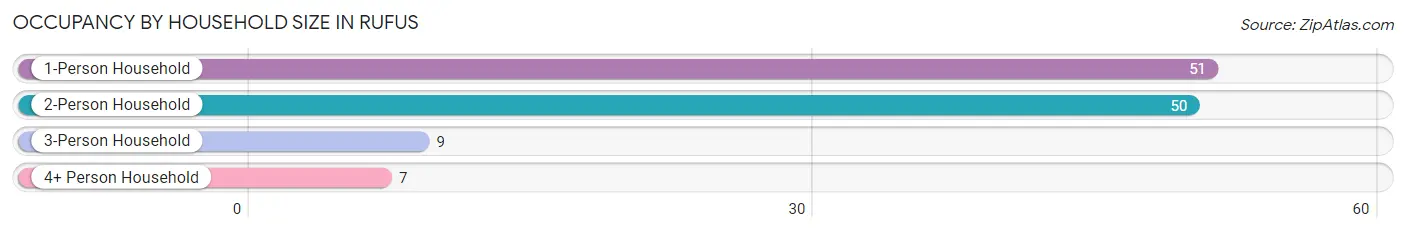
| Household Size | # Housing Units | % Housing Units |
| 1-Person Household | 51 | 43.6% |
| 2-Person Household | 50 | 42.7% |
| 3-Person Household | 9 | 7.7% |
| 4+ Person Household | 7 | 6.0% |
| Total Housing Units | 117 | 100.0% |
Occupancy by Ownership by Household Size in Rufus
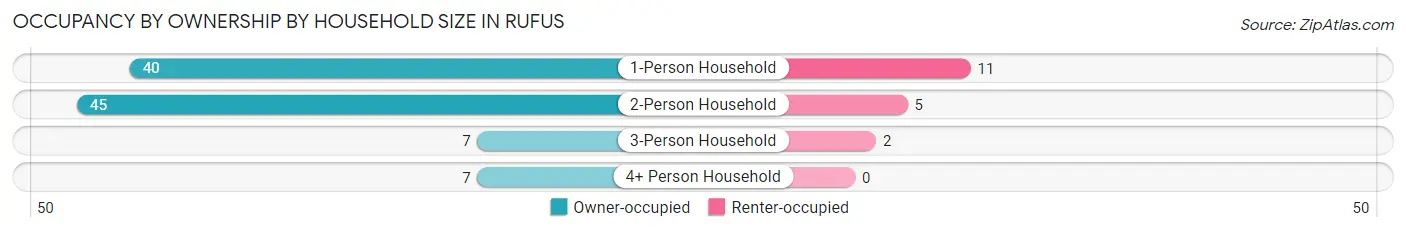
| Household Size | Owner-occupied | Renter-occupied |
| 1-Person Household | 40 (78.4%) | 11 (21.6%) |
| 2-Person Household | 45 (90.0%) | 5 (10.0%) |
| 3-Person Household | 7 (77.8%) | 2 (22.2%) |
| 4+ Person Household | 7 (100.0%) | 0 (0.0%) |
| Total Housing Units | 99 (84.6%) | 18 (15.4%) |
Occupancy by Educational Attainment in Rufus
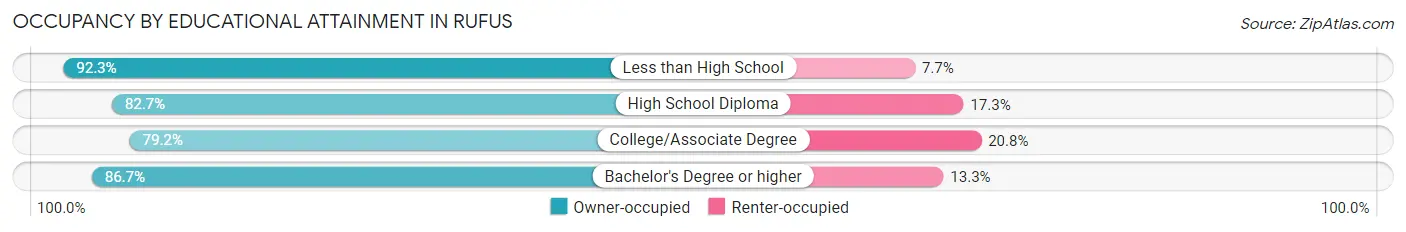
| Household Size | Owner-occupied | Renter-occupied |
| Less than High School | 24 (92.3%) | 2 (7.7%) |
| High School Diploma | 43 (82.7%) | 9 (17.3%) |
| College/Associate Degree | 19 (79.2%) | 5 (20.8%) |
| Bachelor's Degree or higher | 13 (86.7%) | 2 (13.3%) |
Occupancy by Age of Householder in Rufus
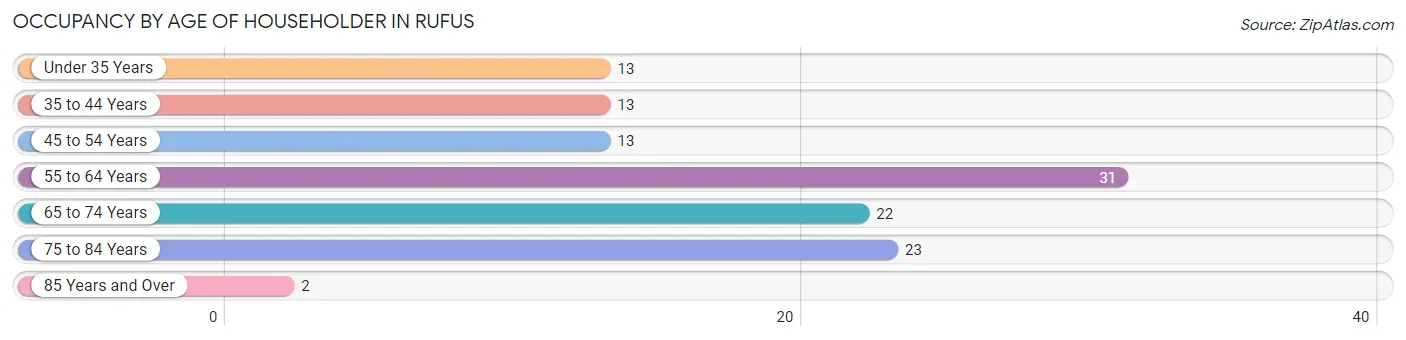
| Age Bracket | # Households | % Households |
| Under 35 Years | 13 | 11.1% |
| 35 to 44 Years | 13 | 11.1% |
| 45 to 54 Years | 13 | 11.1% |
| 55 to 64 Years | 31 | 26.5% |
| 65 to 74 Years | 22 | 18.8% |
| 75 to 84 Years | 23 | 19.7% |
| 85 Years and Over | 2 | 1.7% |
| Total | 117 | 100.0% |
Housing Finances in Rufus
Median Income by Occupancy in Rufus
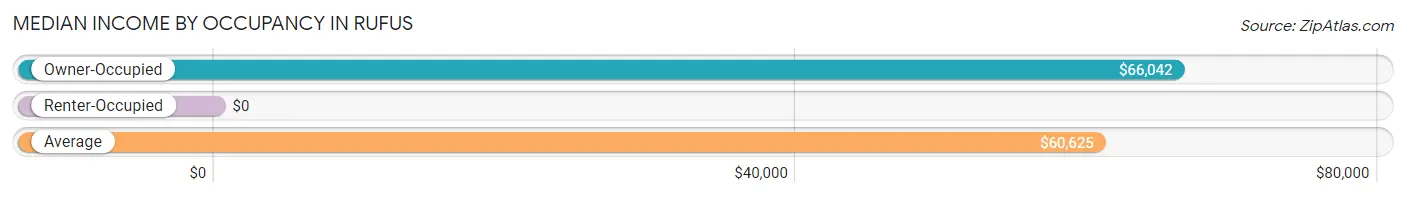
| Occupancy Type | # Households | Median Income |
| Owner-Occupied | 99 (84.6%) | $66,042 |
| Renter-Occupied | 18 (15.4%) | $0 |
| Average | 117 (100.0%) | $60,625 |
Occupancy by Householder Income Bracket in Rufus
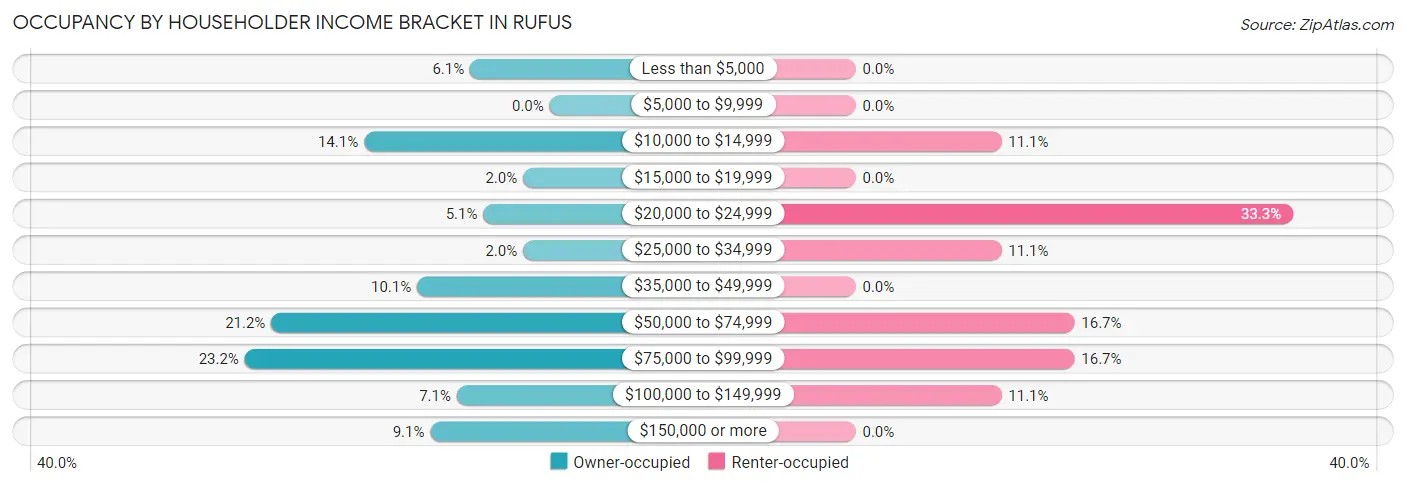
| Income Bracket | Owner-occupied | Renter-occupied |
| Less than $5,000 | 6 (6.1%) | 0 (0.0%) |
| $5,000 to $9,999 | 0 (0.0%) | 0 (0.0%) |
| $10,000 to $14,999 | 14 (14.1%) | 2 (11.1%) |
| $15,000 to $19,999 | 2 (2.0%) | 0 (0.0%) |
| $20,000 to $24,999 | 5 (5.1%) | 6 (33.3%) |
| $25,000 to $34,999 | 2 (2.0%) | 2 (11.1%) |
| $35,000 to $49,999 | 10 (10.1%) | 0 (0.0%) |
| $50,000 to $74,999 | 21 (21.2%) | 3 (16.7%) |
| $75,000 to $99,999 | 23 (23.2%) | 3 (16.7%) |
| $100,000 to $149,999 | 7 (7.1%) | 2 (11.1%) |
| $150,000 or more | 9 (9.1%) | 0 (0.0%) |
| Total | 99 (100.0%) | 18 (100.0%) |
Monthly Housing Cost Tiers in Rufus
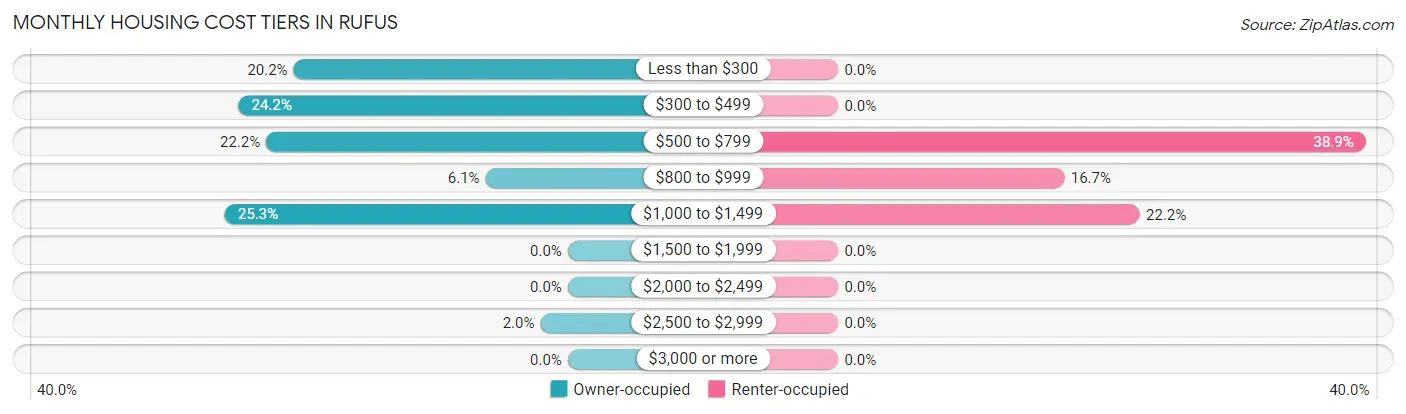
| Monthly Cost | Owner-occupied | Renter-occupied |
| Less than $300 | 20 (20.2%) | 0 (0.0%) |
| $300 to $499 | 24 (24.2%) | 0 (0.0%) |
| $500 to $799 | 22 (22.2%) | 7 (38.9%) |
| $800 to $999 | 6 (6.1%) | 3 (16.7%) |
| $1,000 to $1,499 | 25 (25.3%) | 4 (22.2%) |
| $1,500 to $1,999 | 0 (0.0%) | 0 (0.0%) |
| $2,000 to $2,499 | 0 (0.0%) | 0 (0.0%) |
| $2,500 to $2,999 | 2 (2.0%) | 0 (0.0%) |
| $3,000 or more | 0 (0.0%) | 0 (0.0%) |
| Total | 99 (100.0%) | 18 (100.0%) |
Physical Housing Characteristics in Rufus
Housing Structures in Rufus
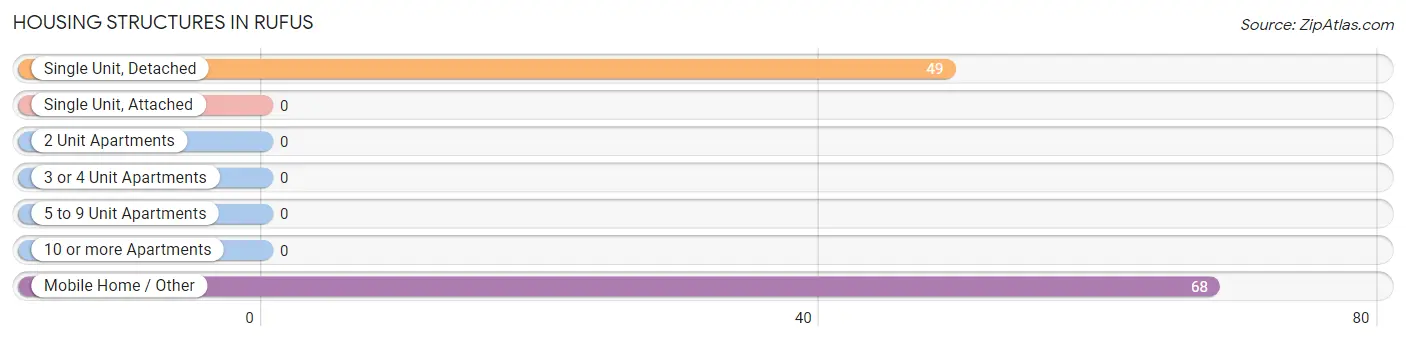
| Structure Type | # Housing Units | % Housing Units |
| Single Unit, Detached | 49 | 41.9% |
| Single Unit, Attached | 0 | 0.0% |
| 2 Unit Apartments | 0 | 0.0% |
| 3 or 4 Unit Apartments | 0 | 0.0% |
| 5 to 9 Unit Apartments | 0 | 0.0% |
| 10 or more Apartments | 0 | 0.0% |
| Mobile Home / Other | 68 | 58.1% |
| Total | 117 | 100.0% |
Housing Structures by Occupancy in Rufus
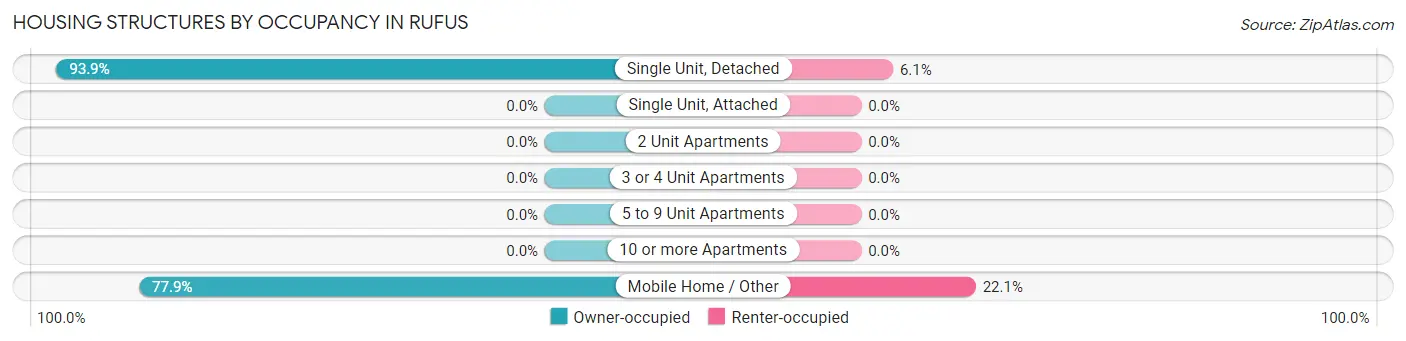
| Structure Type | Owner-occupied | Renter-occupied |
| Single Unit, Detached | 46 (93.9%) | 3 (6.1%) |
| Single Unit, Attached | 0 (0.0%) | 0 (0.0%) |
| 2 Unit Apartments | 0 (0.0%) | 0 (0.0%) |
| 3 or 4 Unit Apartments | 0 (0.0%) | 0 (0.0%) |
| 5 to 9 Unit Apartments | 0 (0.0%) | 0 (0.0%) |
| 10 or more Apartments | 0 (0.0%) | 0 (0.0%) |
| Mobile Home / Other | 53 (77.9%) | 15 (22.1%) |
| Total | 99 (84.6%) | 18 (15.4%) |
Housing Structures by Number of Rooms in Rufus
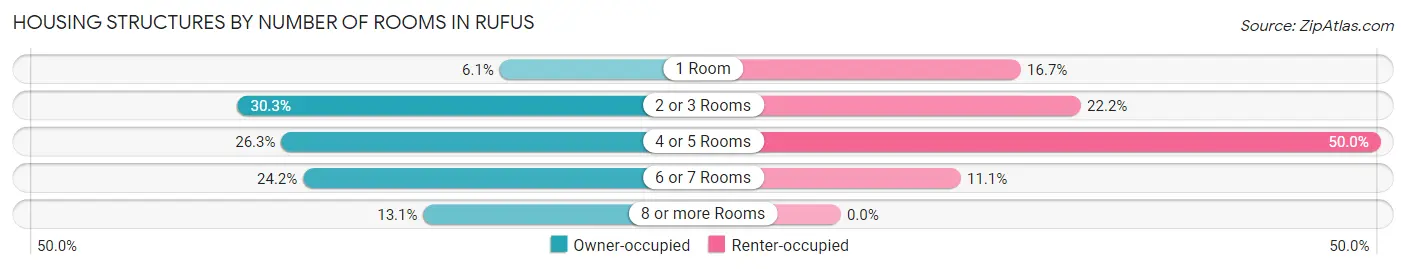
| Number of Rooms | Owner-occupied | Renter-occupied |
| 1 Room | 6 (6.1%) | 3 (16.7%) |
| 2 or 3 Rooms | 30 (30.3%) | 4 (22.2%) |
| 4 or 5 Rooms | 26 (26.3%) | 9 (50.0%) |
| 6 or 7 Rooms | 24 (24.2%) | 2 (11.1%) |
| 8 or more Rooms | 13 (13.1%) | 0 (0.0%) |
| Total | 99 (100.0%) | 18 (100.0%) |
Housing Structure by Heating Type in Rufus
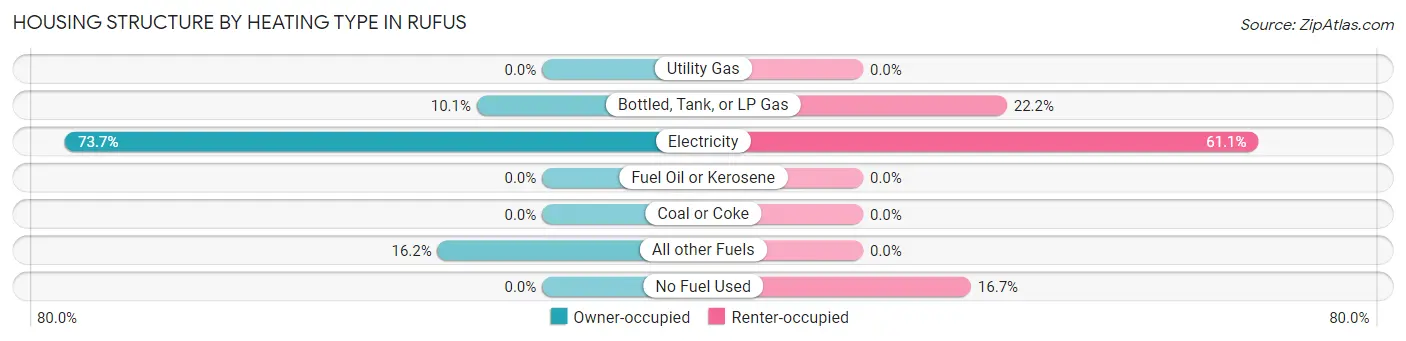
| Heating Type | Owner-occupied | Renter-occupied |
| Utility Gas | 0 (0.0%) | 0 (0.0%) |
| Bottled, Tank, or LP Gas | 10 (10.1%) | 4 (22.2%) |
| Electricity | 73 (73.7%) | 11 (61.1%) |
| Fuel Oil or Kerosene | 0 (0.0%) | 0 (0.0%) |
| Coal or Coke | 0 (0.0%) | 0 (0.0%) |
| All other Fuels | 16 (16.2%) | 0 (0.0%) |
| No Fuel Used | 0 (0.0%) | 3 (16.7%) |
| Total | 99 (100.0%) | 18 (100.0%) |
Household Vehicle Usage in Rufus
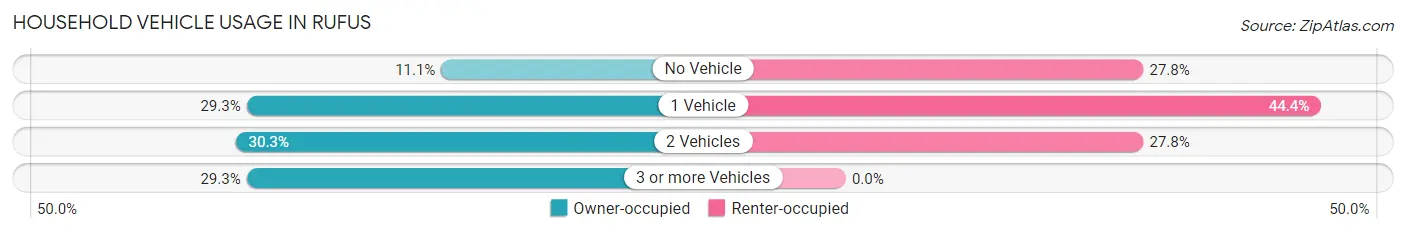
| Vehicles per Household | Owner-occupied | Renter-occupied |
| No Vehicle | 11 (11.1%) | 5 (27.8%) |
| 1 Vehicle | 29 (29.3%) | 8 (44.4%) |
| 2 Vehicles | 30 (30.3%) | 5 (27.8%) |
| 3 or more Vehicles | 29 (29.3%) | 0 (0.0%) |
| Total | 99 (100.0%) | 18 (100.0%) |
Real Estate & Mortgages in Rufus
Real Estate and Mortgage Overview in Rufus
| Characteristic | Without Mortgage | With Mortgage |
| Housing Units | 71 | 28 |
| Median Property Value | $137,500 | $195,800 |
| Median Household Income | $54,583 | $0 |
| Monthly Housing Costs | $429 | $0 |
| Real Estate Taxes | $1,176 | $0 |
Property Value by Mortgage Status in Rufus
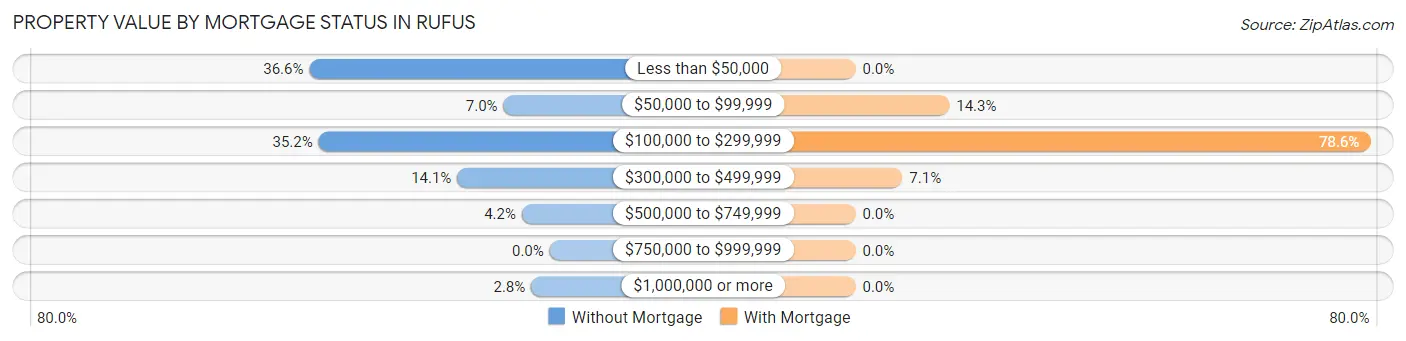
| Property Value | Without Mortgage | With Mortgage |
| Less than $50,000 | 26 (36.6%) | 0 (0.0%) |
| $50,000 to $99,999 | 5 (7.0%) | 4 (14.3%) |
| $100,000 to $299,999 | 25 (35.2%) | 22 (78.6%) |
| $300,000 to $499,999 | 10 (14.1%) | 2 (7.1%) |
| $500,000 to $749,999 | 3 (4.2%) | 0 (0.0%) |
| $750,000 to $999,999 | 0 (0.0%) | 0 (0.0%) |
| $1,000,000 or more | 2 (2.8%) | 0 (0.0%) |
| Total | 71 (100.0%) | 28 (100.0%) |
Household Income by Mortgage Status in Rufus
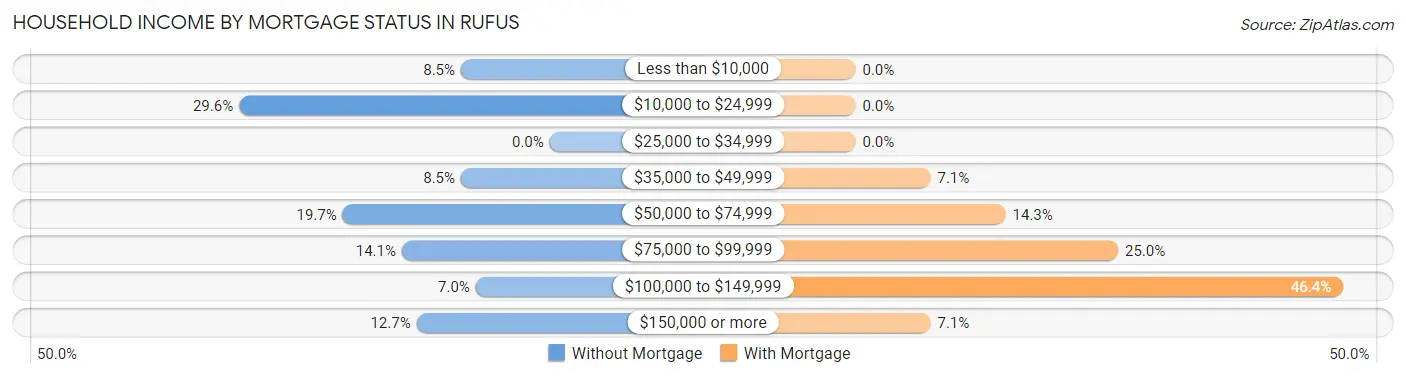
| Household Income | Without Mortgage | With Mortgage |
| Less than $10,000 | 6 (8.5%) | 0 (0.0%) |
| $10,000 to $24,999 | 21 (29.6%) | 0 (0.0%) |
| $25,000 to $34,999 | 0 (0.0%) | 0 (0.0%) |
| $35,000 to $49,999 | 6 (8.5%) | 2 (7.1%) |
| $50,000 to $74,999 | 14 (19.7%) | 4 (14.3%) |
| $75,000 to $99,999 | 10 (14.1%) | 7 (25.0%) |
| $100,000 to $149,999 | 5 (7.0%) | 13 (46.4%) |
| $150,000 or more | 9 (12.7%) | 2 (7.1%) |
| Total | 71 (100.0%) | 28 (100.0%) |
Property Value to Household Income Ratio in Rufus
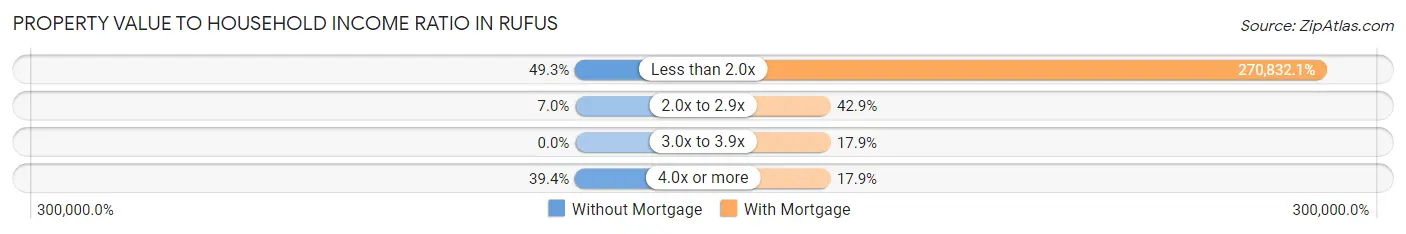
| Value-to-Income Ratio | Without Mortgage | With Mortgage |
| Less than 2.0x | 35 (49.3%) | 75,833 (270,832.1%) |
| 2.0x to 2.9x | 5 (7.0%) | 12 (42.9%) |
| 3.0x to 3.9x | 0 (0.0%) | 5 (17.9%) |
| 4.0x or more | 28 (39.4%) | 5 (17.9%) |
| Total | 71 (100.0%) | 28 (100.0%) |
Real Estate Taxes by Mortgage Status in Rufus
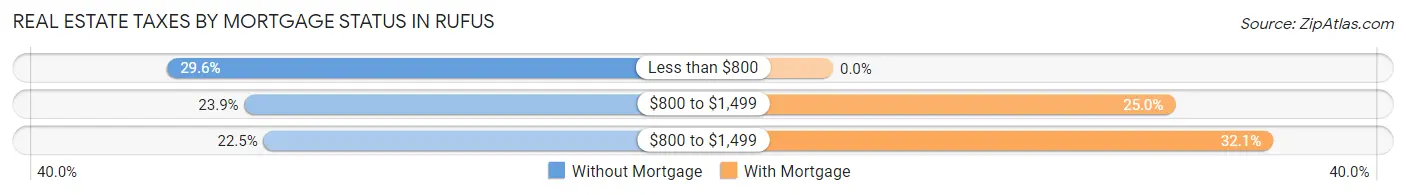
| Property Taxes | Without Mortgage | With Mortgage |
| Less than $800 | 21 (29.6%) | 0 (0.0%) |
| $800 to $1,499 | 17 (23.9%) | 7 (25.0%) |
| $800 to $1,499 | 16 (22.5%) | 9 (32.1%) |
| Total | 71 (100.0%) | 28 (100.0%) |
Health & Disability in Rufus
Health Insurance Coverage by Age in Rufus
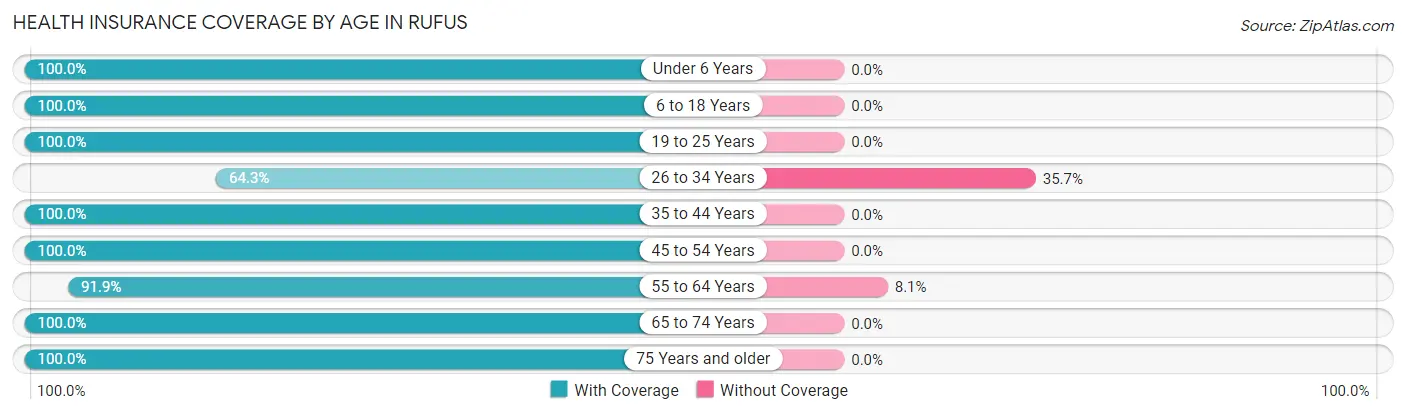
| Age Bracket | With Coverage | Without Coverage |
| Under 6 Years | 5 (100.0%) | 0 (0.0%) |
| 6 to 18 Years | 39 (100.0%) | 0 (0.0%) |
| 19 to 25 Years | 1 (100.0%) | 0 (0.0%) |
| 26 to 34 Years | 9 (64.3%) | 5 (35.7%) |
| 35 to 44 Years | 26 (100.0%) | 0 (0.0%) |
| 45 to 54 Years | 20 (100.0%) | 0 (0.0%) |
| 55 to 64 Years | 34 (91.9%) | 3 (8.1%) |
| 65 to 74 Years | 44 (100.0%) | 0 (0.0%) |
| 75 Years and older | 34 (100.0%) | 0 (0.0%) |
| Total | 212 (96.4%) | 8 (3.6%) |
Health Insurance Coverage by Citizenship Status in Rufus
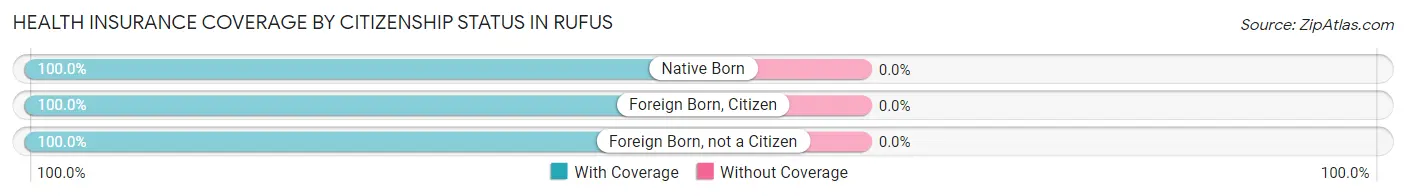
| Citizenship Status | With Coverage | Without Coverage |
| Native Born | 5 (100.0%) | 0 (0.0%) |
| Foreign Born, Citizen | 39 (100.0%) | 0 (0.0%) |
| Foreign Born, not a Citizen | 1 (100.0%) | 0 (0.0%) |
Health Insurance Coverage by Household Income in Rufus
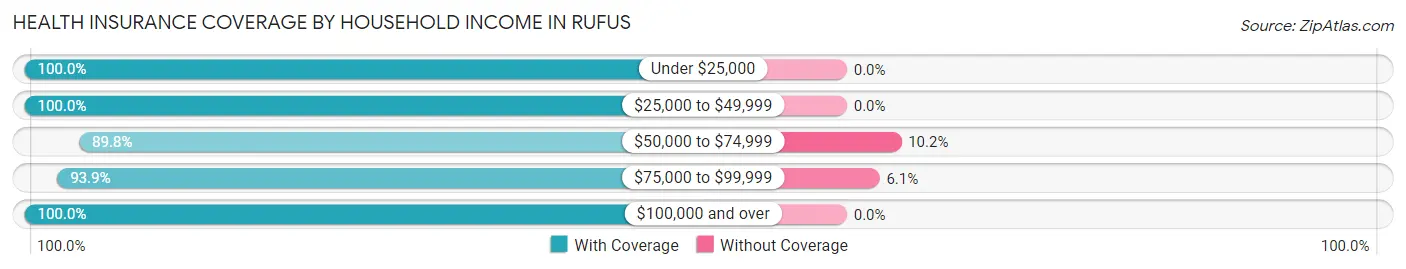
| Household Income | With Coverage | Without Coverage |
| Under $25,000 | 53 (100.0%) | 0 (0.0%) |
| $25,000 to $49,999 | 43 (100.0%) | 0 (0.0%) |
| $50,000 to $74,999 | 44 (89.8%) | 5 (10.2%) |
| $75,000 to $99,999 | 46 (93.9%) | 3 (6.1%) |
| $100,000 and over | 26 (100.0%) | 0 (0.0%) |
Public vs Private Health Insurance Coverage by Age in Rufus
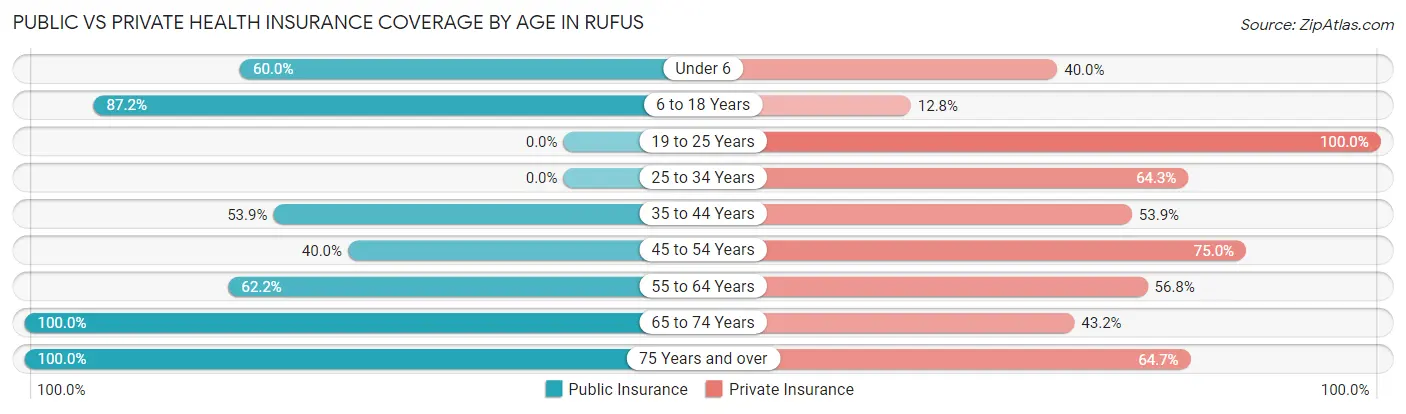
| Age Bracket | Public Insurance | Private Insurance |
| Under 6 | 3 (60.0%) | 2 (40.0%) |
| 6 to 18 Years | 34 (87.2%) | 5 (12.8%) |
| 19 to 25 Years | 0 (0.0%) | 1 (100.0%) |
| 25 to 34 Years | 0 (0.0%) | 9 (64.3%) |
| 35 to 44 Years | 14 (53.8%) | 14 (53.8%) |
| 45 to 54 Years | 8 (40.0%) | 15 (75.0%) |
| 55 to 64 Years | 23 (62.2%) | 21 (56.8%) |
| 65 to 74 Years | 44 (100.0%) | 19 (43.2%) |
| 75 Years and over | 34 (100.0%) | 22 (64.7%) |
| Total | 160 (72.7%) | 108 (49.1%) |
Disability Status by Sex by Age in Rufus

| Age Bracket | Male | Female |
| Under 5 Years | 0 (0.0%) | 0 (0.0%) |
| 5 to 17 Years | 0 (0.0%) | 0 (0.0%) |
| 18 to 34 Years | 0 (0.0%) | 0 (0.0%) |
| 35 to 64 Years | 22 (43.1%) | 12 (37.5%) |
| 65 to 74 Years | 12 (60.0%) | 10 (41.7%) |
| 75 Years and over | 5 (45.5%) | 13 (56.5%) |
Disability Class by Sex by Age in Rufus
Disability Class: Hearing Difficulty
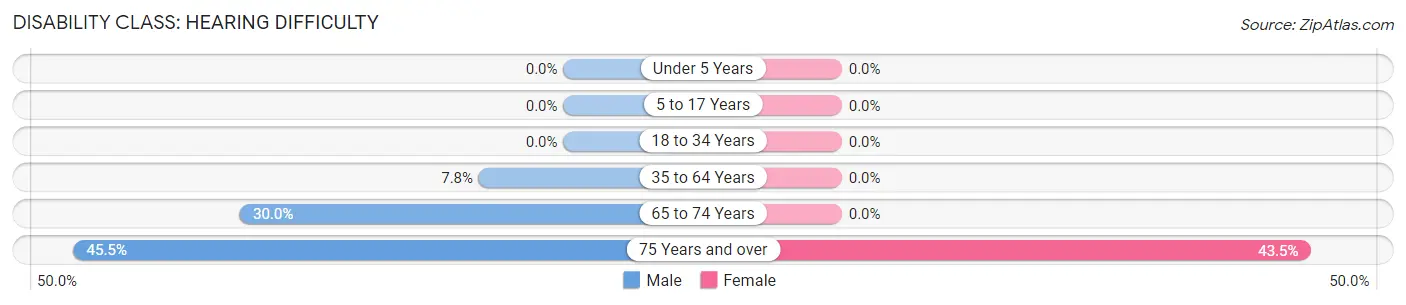
| Age Bracket | Male | Female |
| Under 5 Years | 0 (0.0%) | 0 (0.0%) |
| 5 to 17 Years | 0 (0.0%) | 0 (0.0%) |
| 18 to 34 Years | 0 (0.0%) | 0 (0.0%) |
| 35 to 64 Years | 4 (7.8%) | 0 (0.0%) |
| 65 to 74 Years | 6 (30.0%) | 0 (0.0%) |
| 75 Years and over | 5 (45.5%) | 10 (43.5%) |
Disability Class: Vision Difficulty
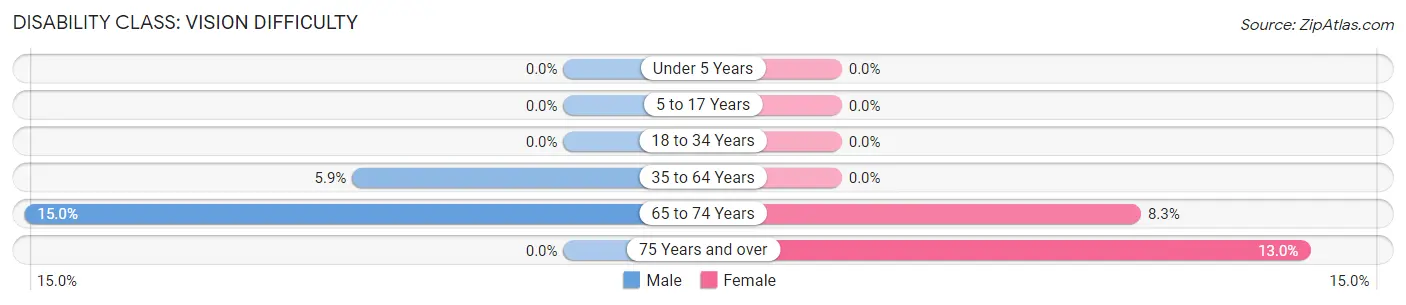
| Age Bracket | Male | Female |
| Under 5 Years | 0 (0.0%) | 0 (0.0%) |
| 5 to 17 Years | 0 (0.0%) | 0 (0.0%) |
| 18 to 34 Years | 0 (0.0%) | 0 (0.0%) |
| 35 to 64 Years | 3 (5.9%) | 0 (0.0%) |
| 65 to 74 Years | 3 (15.0%) | 2 (8.3%) |
| 75 Years and over | 0 (0.0%) | 3 (13.0%) |
Disability Class: Cognitive Difficulty
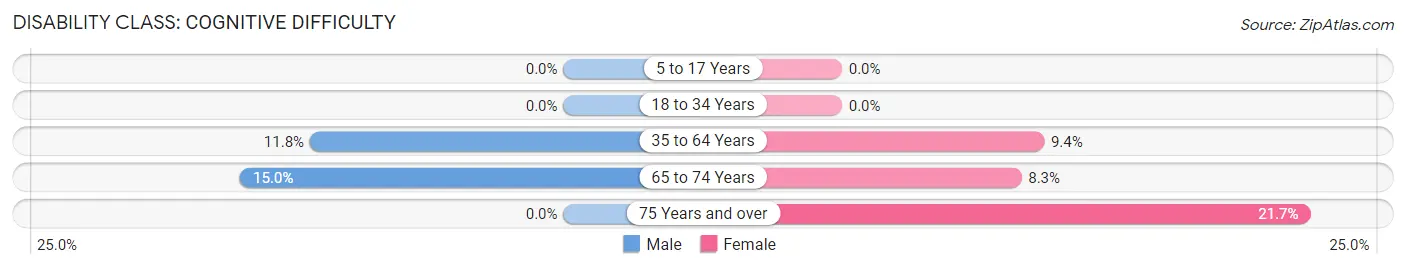
| Age Bracket | Male | Female |
| 5 to 17 Years | 0 (0.0%) | 0 (0.0%) |
| 18 to 34 Years | 0 (0.0%) | 0 (0.0%) |
| 35 to 64 Years | 6 (11.8%) | 3 (9.4%) |
| 65 to 74 Years | 3 (15.0%) | 2 (8.3%) |
| 75 Years and over | 0 (0.0%) | 5 (21.7%) |
Disability Class: Ambulatory Difficulty
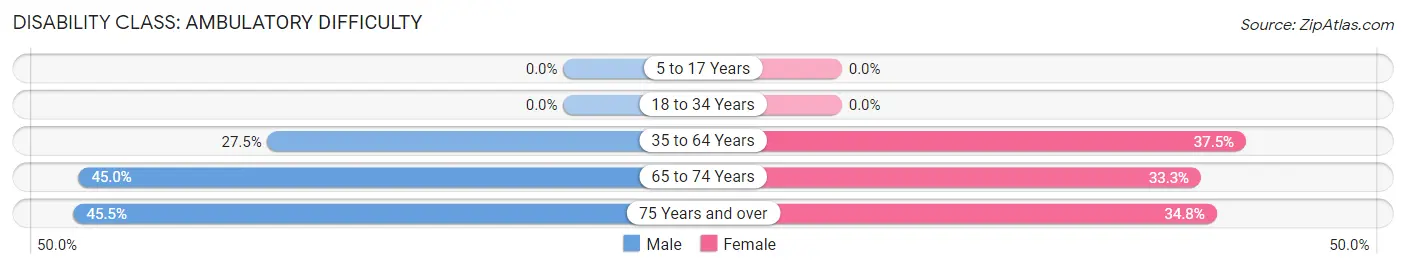
| Age Bracket | Male | Female |
| 5 to 17 Years | 0 (0.0%) | 0 (0.0%) |
| 18 to 34 Years | 0 (0.0%) | 0 (0.0%) |
| 35 to 64 Years | 14 (27.5%) | 12 (37.5%) |
| 65 to 74 Years | 9 (45.0%) | 8 (33.3%) |
| 75 Years and over | 5 (45.5%) | 8 (34.8%) |
Disability Class: Self-Care Difficulty
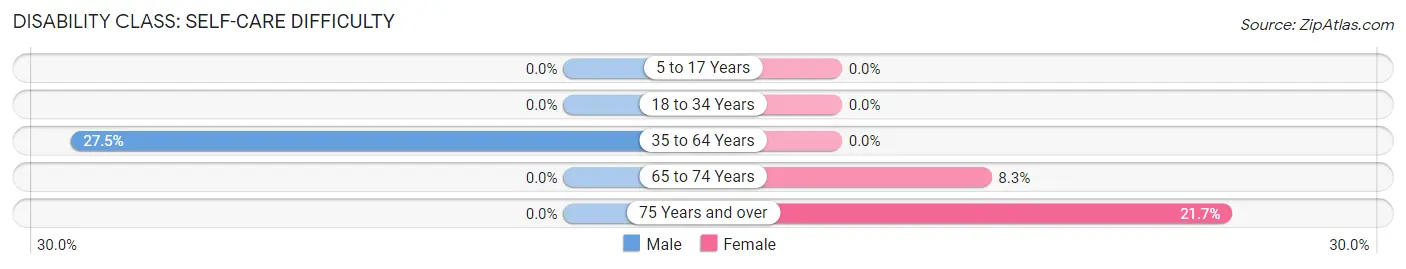
| Age Bracket | Male | Female |
| 5 to 17 Years | 0 (0.0%) | 0 (0.0%) |
| 18 to 34 Years | 0 (0.0%) | 0 (0.0%) |
| 35 to 64 Years | 14 (27.5%) | 0 (0.0%) |
| 65 to 74 Years | 0 (0.0%) | 2 (8.3%) |
| 75 Years and over | 0 (0.0%) | 5 (21.7%) |
Technology Access in Rufus
Computing Device Access in Rufus
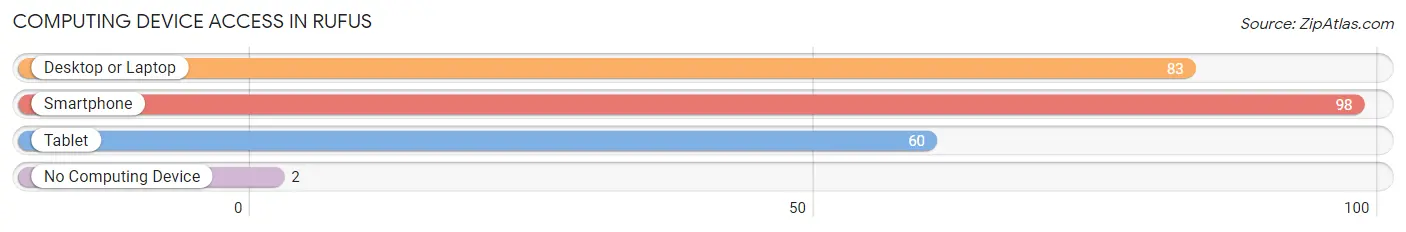
| Device Type | # Households | % Households |
| Desktop or Laptop | 83 | 70.9% |
| Smartphone | 98 | 83.8% |
| Tablet | 60 | 51.3% |
| No Computing Device | 2 | 1.7% |
| Total | 117 | 100.0% |
Internet Access in Rufus
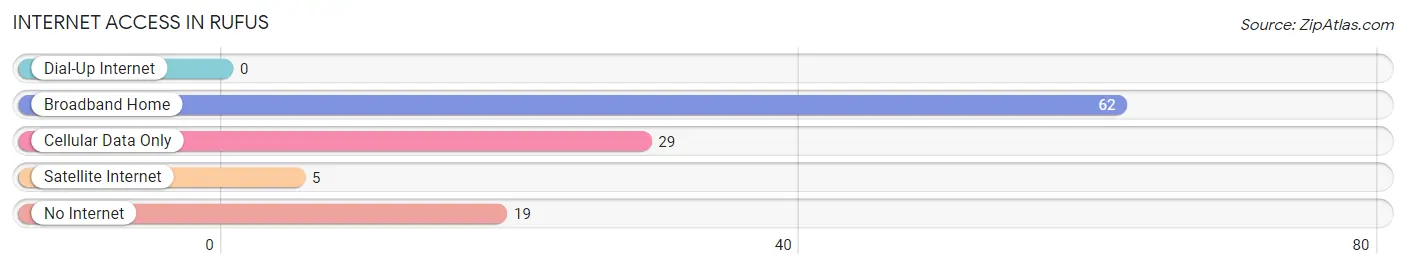
| Internet Type | # Households | % Households |
| Dial-Up Internet | 0 | 0.0% |
| Broadband Home | 62 | 53.0% |
| Cellular Data Only | 29 | 24.8% |
| Satellite Internet | 5 | 4.3% |
| No Internet | 19 | 16.2% |
| Total | 117 | 100.0% |
Rufus Summary
Rufus is a small city located in Sherman County, Oregon, United States. It is situated on the Columbia River, approximately 20 miles east of The Dalles. The city has a population of approximately 500 people, and is the smallest incorporated city in the state of Oregon.
History
Rufus was founded in 1876 by a group of settlers from the nearby town of Wasco. The settlers were looking for a place to settle and farm, and chose the area around Rufus due to its proximity to the Columbia River. The town was named after Rufus King, a prominent early settler in the area.
The town grew slowly, but steadily, and by the early 1900s, it had become a thriving agricultural community. The town was home to a number of businesses, including a general store, a blacksmith shop, a hotel, and a post office.
In the 1950s, the town began to decline as the population shifted away from rural areas and towards larger cities. By the 1970s, the town had become a virtual ghost town, with only a few residents remaining.
In the 1980s, the town began to experience a resurgence, as people began to move back to the area. The town was incorporated in 1988, and has since experienced steady growth.
Geography
Rufus is located in the Columbia River Gorge, a region of the Pacific Northwest known for its dramatic scenery and abundant outdoor recreation opportunities. The city is situated on the north bank of the Columbia River, approximately 20 miles east of The Dalles.
The city is surrounded by rolling hills and grasslands, with the Columbia River providing a stunning backdrop. The area is known for its mild climate, with temperatures rarely dropping below freezing in the winter months.
Economy
Rufus is primarily a farming and ranching community, with the majority of the population employed in the agricultural sector. The city is home to a number of small businesses, including a general store, a hardware store, and a cafe.
The city is also home to a number of tourist attractions, including the Columbia Gorge Discovery Center, the Columbia Gorge Interpretive Center, and the Columbia Gorge Express. These attractions draw visitors from all over the region, providing a boost to the local economy.
Demographics
As of the 2010 census, the population of Rufus was 498. The racial makeup of the city was 94.2% White, 0.2% African American, 0.4% Native American, 0.4% Asian, 0.2% Pacific Islander, and 4.6% from two or more races.
The median household income in Rufus was $37,500, and the median family income was $41,250. The per capita income was $17,857. About 11.2% of families and 14.2% of the population were below the poverty line, including 18.2% of those under age 18 and 8.3% of those age 65 or over.
Conclusion
Rufus is a small city located in Sherman County, Oregon, United States. It is situated on the Columbia River, approximately 20 miles east of The Dalles. The city has a population of approximately 500 people, and is the smallest incorporated city in the state of Oregon. The city was founded in 1876 by a group of settlers from the nearby town of Wasco, and has since experienced steady growth. The city is primarily a farming and ranching community, with the majority of the population employed in the agricultural sector. The city is also home to a number of tourist attractions, providing a boost to the local economy. As of the 2010 census, the population of Rufus was 498, with a median household income of $37,500.
Common Questions
What is Per Capita Income in Rufus?
Per Capita income in Rufus is $35,121.
What is the Median Family Income in Rufus?
Median Family Income in Rufus is $66,667.
What is the Median Household income in Rufus?
Median Household Income in Rufus is $60,625.
What is Income or Wage Gap in Rufus?
Income or Wage Gap in Rufus is 51.3%.
Women in Rufus earn 48.7 cents for every dollar earned by a man.
What is Family Income Deficit in Rufus?
Family Income Deficit in Rufus is $4,167.
Families that are below poverty line in Rufus earn $4,167 less on average than the poverty threshold level.
What is Inequality or Gini Index in Rufus?
Inequality or Gini Index in Rufus is 0.40.
What is the Total Population of Rufus?
Total Population of Rufus is 220.
What is the Total Male Population of Rufus?
Total Male Population of Rufus is 133.
What is the Total Female Population of Rufus?
Total Female Population of Rufus is 87.
What is the Ratio of Males per 100 Females in Rufus?
There are 152.87 Males per 100 Females in Rufus.
What is the Ratio of Females per 100 Males in Rufus?
There are 65.41 Females per 100 Males in Rufus.
What is the Median Population Age in Rufus?
Median Population Age in Rufus is 56.5 Years.
What is the Average Family Size in Rufus
Average Family Size in Rufus is 2.6 People.
What is the Average Household Size in Rufus
Average Household Size in Rufus is 1.9 People.
How Large is the Labor Force in Rufus?
There are 82 People in the Labor Forcein in Rufus.
What is the Percentage of People in the Labor Force in Rufus?
44.8% of People are in the Labor Force in Rufus.
What is the Unemployment Rate in Rufus?
Unemployment Rate in Rufus is 6.1%.