Gold Beach, OR Map & Demographics
Gold Beach Map
Gold Beach Overview
$28,959
PER CAPITA INCOME
$51,074
AVG FAMILY INCOME
$49,018
AVG HOUSEHOLD INCOME
42.5%
WAGE / INCOME GAP [ % ]
57.5¢/ $1
WAGE / INCOME GAP [ $ ]
0.41
INEQUALITY / GINI INDEX
2,533
TOTAL POPULATION
1,289
MALE POPULATION
1,244
FEMALE POPULATION
103.62
MALES / 100 FEMALES
96.51
FEMALES / 100 MALES
51.3
MEDIAN AGE
2.7
AVG FAMILY SIZE
2.2
AVG HOUSEHOLD SIZE
1,130
LABOR FORCE [ PEOPLE ]
51.6%
PERCENT IN LABOR FORCE
9.6%
UNEMPLOYMENT RATE
Gold Beach Zip Codes
Gold Beach Area Codes
Income in Gold Beach
Income Overview in Gold Beach
Per Capita Income in Gold Beach is $28,959, while median incomes of families and households are $51,074 and $49,018 respectively.
| Characteristic | Number | Measure |
| Per Capita Income | 2,533 | $28,959 |
| Median Family Income | 699 | $51,074 |
| Mean Family Income | 699 | $66,134 |
| Median Household Income | 1,137 | $49,018 |
| Mean Household Income | 1,137 | $65,648 |
| Income Deficit | 699 | $0 |
| Wage / Income Gap (%) | 2,533 | 42.54% |
| Wage / Income Gap ($) | 2,533 | 57.46¢ per $1 |
| Gini / Inequality Index | 2,533 | 0.41 |
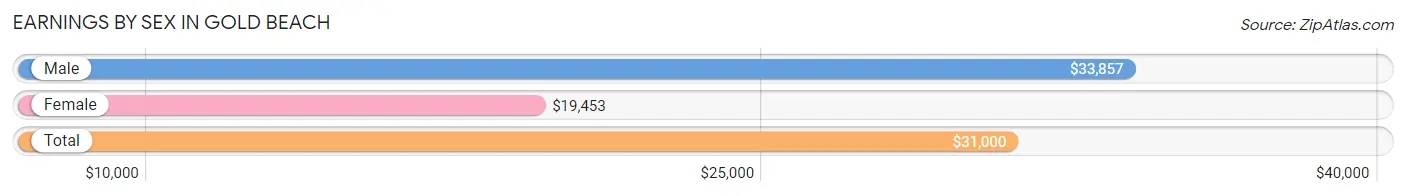
Earnings by Sex in Gold Beach
Average Earnings in Gold Beach are $31,000, $33,857 for men and $19,453 for women, a difference of 42.5%.
| Sex | Number | Average Earnings |
| Male | 624 (52.3%) | $33,857 |
| Female | 568 (47.6%) | $19,453 |
| Total | 1,192 (100.0%) | $31,000 |
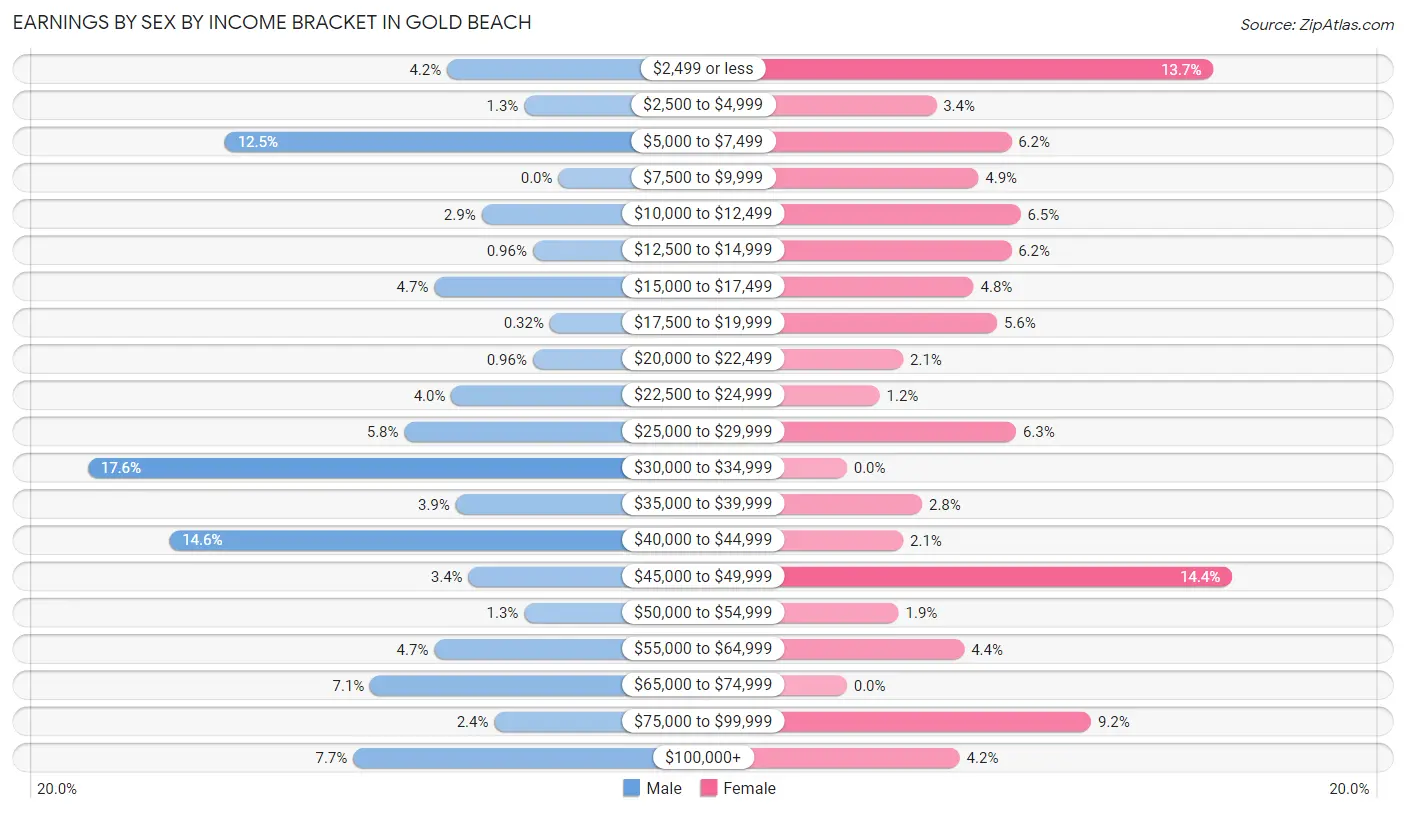
Earnings by Sex by Income Bracket in Gold Beach
The most common earnings brackets in Gold Beach are $30,000 to $34,999 for men (110 | 17.6%) and $45,000 to $49,999 for women (82 | 14.4%).
| Income | Male | Female |
| $2,499 or less | 26 (4.2%) | 78 (13.7%) |
| $2,500 to $4,999 | 8 (1.3%) | 19 (3.4%) |
| $5,000 to $7,499 | 78 (12.5%) | 35 (6.2%) |
| $7,500 to $9,999 | 0 (0.0%) | 28 (4.9%) |
| $10,000 to $12,499 | 18 (2.9%) | 37 (6.5%) |
| $12,500 to $14,999 | 6 (1.0%) | 35 (6.2%) |
| $15,000 to $17,499 | 29 (4.6%) | 27 (4.8%) |
| $17,500 to $19,999 | 2 (0.3%) | 32 (5.6%) |
| $20,000 to $22,499 | 6 (1.0%) | 12 (2.1%) |
| $22,500 to $24,999 | 25 (4.0%) | 7 (1.2%) |
| $25,000 to $29,999 | 36 (5.8%) | 36 (6.3%) |
| $30,000 to $34,999 | 110 (17.6%) | 0 (0.0%) |
| $35,000 to $39,999 | 24 (3.8%) | 16 (2.8%) |
| $40,000 to $44,999 | 91 (14.6%) | 12 (2.1%) |
| $45,000 to $49,999 | 21 (3.4%) | 82 (14.4%) |
| $50,000 to $54,999 | 8 (1.3%) | 11 (1.9%) |
| $55,000 to $64,999 | 29 (4.6%) | 25 (4.4%) |
| $65,000 to $74,999 | 44 (7.0%) | 0 (0.0%) |
| $75,000 to $99,999 | 15 (2.4%) | 52 (9.1%) |
| $100,000+ | 48 (7.7%) | 24 (4.2%) |
| Total | 624 (100.0%) | 568 (100.0%) |
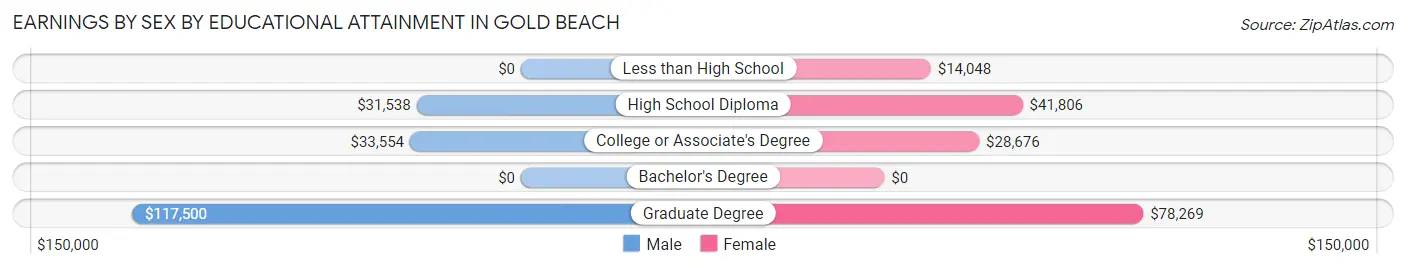
Earnings by Sex by Educational Attainment in Gold Beach
Average earnings in Gold Beach are $33,732 for men and $29,931 for women, a difference of 11.3%. Men with an educational attainment of graduate degree enjoy the highest average annual earnings of $117,500, while those with high school diploma education earn the least with $31,538. Women with an educational attainment of graduate degree earn the most with the average annual earnings of $78,269, while those with less than high school education have the smallest earnings of $14,048.
| Educational Attainment | Male Income | Female Income |
| Less than High School | - | - |
| High School Diploma | $31,538 | $41,806 |
| College or Associate's Degree | $33,554 | $28,676 |
| Bachelor's Degree | - | - |
| Graduate Degree | $117,500 | $78,269 |
| Total | $33,732 | $29,931 |
Family Income in Gold Beach
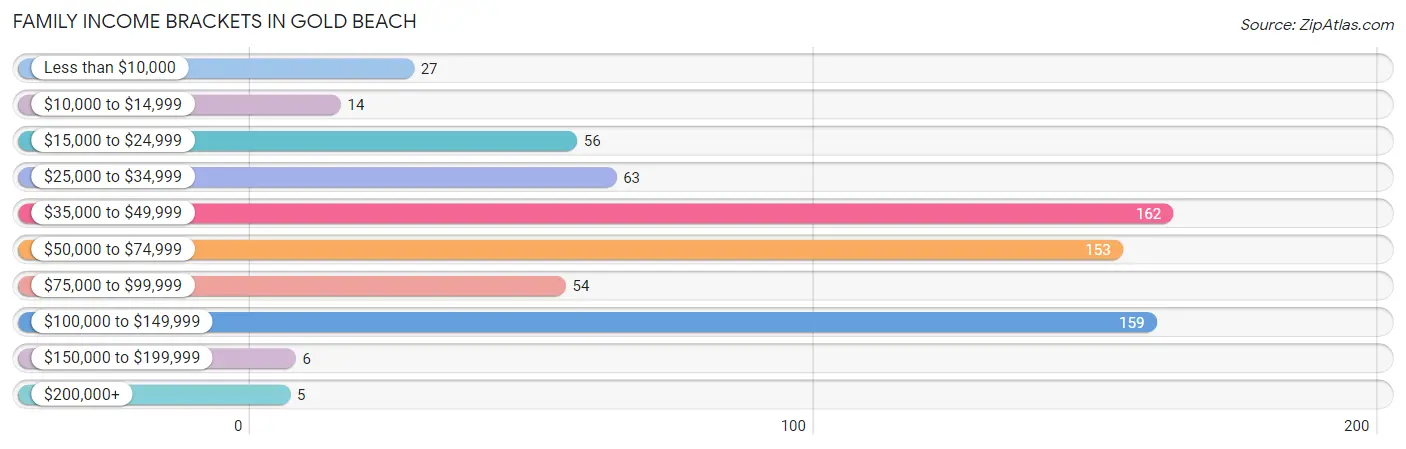
Family Income Brackets in Gold Beach
According to the Gold Beach family income data, there are 162 families falling into the $35,000 to $49,999 income range, which is the most common income bracket and makes up 23.2% of all families. Conversely, the $200,000+ income bracket is the least frequent group with only 5 families (0.7%) belonging to this category.
| Income Bracket | # Families | % Families |
| Less than $10,000 | 27 | 3.9% |
| $10,000 to $14,999 | 14 | 2.0% |
| $15,000 to $24,999 | 56 | 8.0% |
| $25,000 to $34,999 | 63 | 9.0% |
| $35,000 to $49,999 | 162 | 23.2% |
| $50,000 to $74,999 | 153 | 21.9% |
| $75,000 to $99,999 | 54 | 7.7% |
| $100,000 to $149,999 | 159 | 22.7% |
| $150,000 to $199,999 | 6 | 0.9% |
| $200,000+ | 5 | 0.7% |
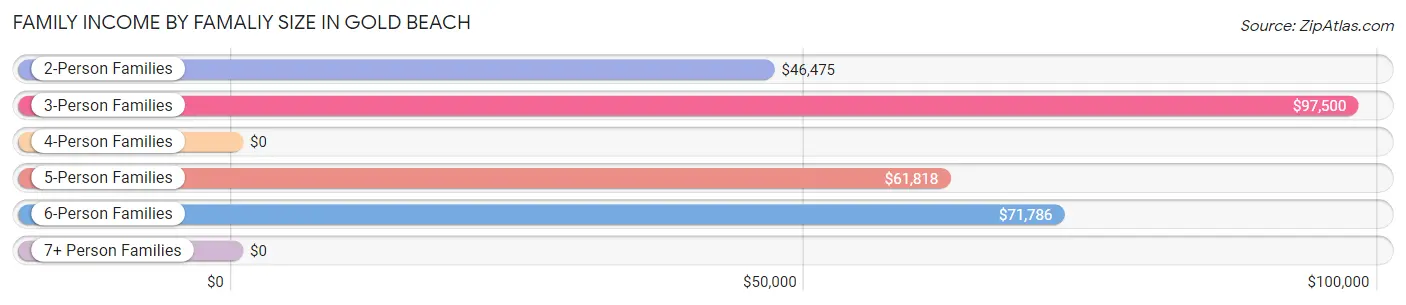
Family Income by Famaliy Size in Gold Beach
3-person families (182 | 26.0%) account for the highest median family income in Gold Beach with $97,500 per family, while 3-person families (182 | 26.0%) have the highest median income of $32,500 per family member.
| Income Bracket | # Families | Median Income |
| 2-Person Families | 404 (57.8%) | $46,475 |
| 3-Person Families | 182 (26.0%) | $97,500 |
| 4-Person Families | 29 (4.2%) | $0 |
| 5-Person Families | 50 (7.1%) | $61,818 |
| 6-Person Families | 34 (4.9%) | $71,786 |
| 7+ Person Families | 0 (0.0%) | $0 |
| Total | 699 (100.0%) | $51,074 |
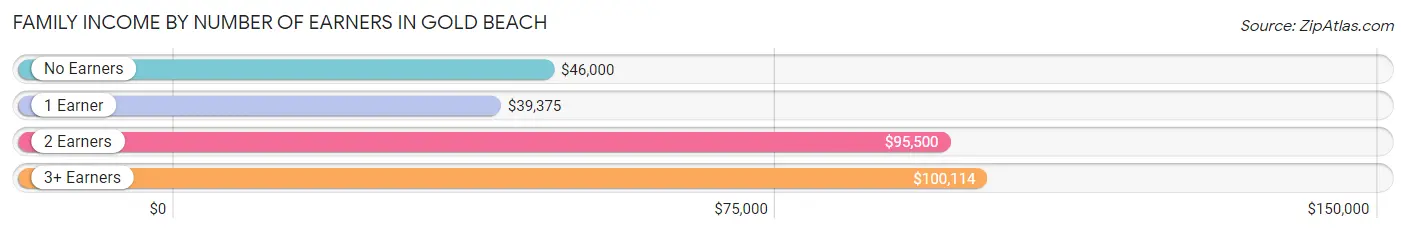
Family Income by Number of Earners in Gold Beach
The median family income in Gold Beach is $51,074, with families comprising 3+ earners (100) having the highest median family income of $100,114, while families with 1 earner (209) have the lowest median family income of $39,375, accounting for 14.3% and 29.9% of families, respectively.
| Number of Earners | # Families | Median Income |
| No Earners | 196 (28.0%) | $46,000 |
| 1 Earner | 209 (29.9%) | $39,375 |
| 2 Earners | 194 (27.8%) | $95,500 |
| 3+ Earners | 100 (14.3%) | $100,114 |
| Total | 699 (100.0%) | $51,074 |
Household Income in Gold Beach
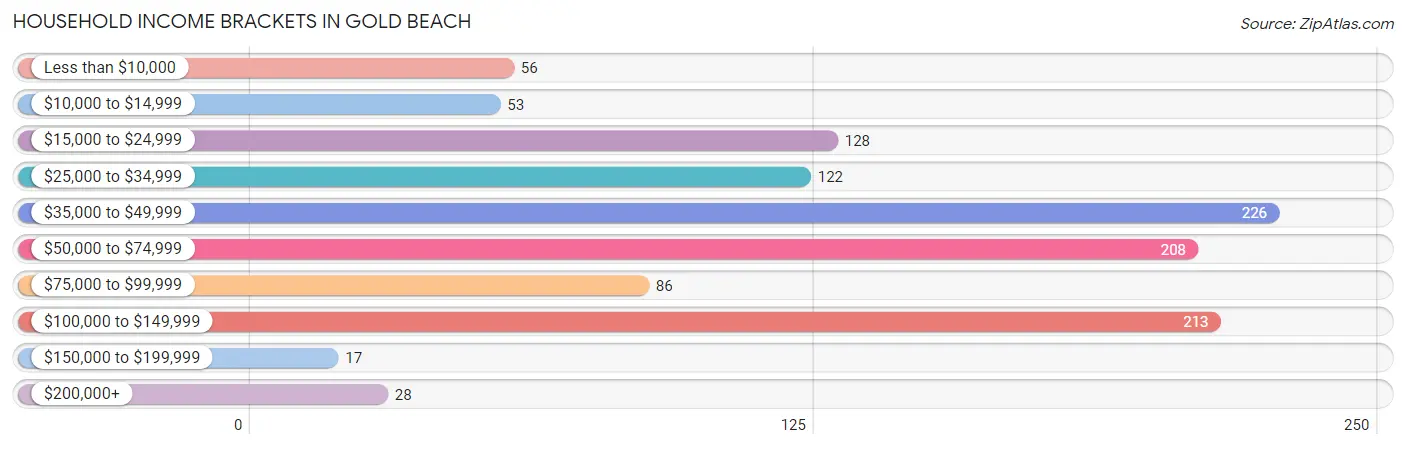
Household Income Brackets in Gold Beach
With 226 households falling in the category, the $35,000 to $49,999 income range is the most frequent in Gold Beach, accounting for 19.9% of all households. In contrast, only 17 households (1.5%) fall into the $150,000 to $199,999 income bracket, making it the least populous group.
| Income Bracket | # Households | % Households |
| Less than $10,000 | 56 | 4.9% |
| $10,000 to $14,999 | 53 | 4.7% |
| $15,000 to $24,999 | 128 | 11.3% |
| $25,000 to $34,999 | 122 | 10.7% |
| $35,000 to $49,999 | 226 | 19.9% |
| $50,000 to $74,999 | 208 | 18.3% |
| $75,000 to $99,999 | 86 | 7.6% |
| $100,000 to $149,999 | 213 | 18.7% |
| $150,000 to $199,999 | 17 | 1.5% |
| $200,000+ | 28 | 2.5% |
Household Income by Householder Age in Gold Beach
The median household income in Gold Beach is $49,018, with the highest median household income of $100,455 found in the 25 to 44 years age bracket for the primary householder. A total of 300 households (26.4%) fall into this category. Meanwhile, the 15 to 24 years age bracket for the primary householder has the lowest median household income of $0, with 43 households (3.8%) in this group.
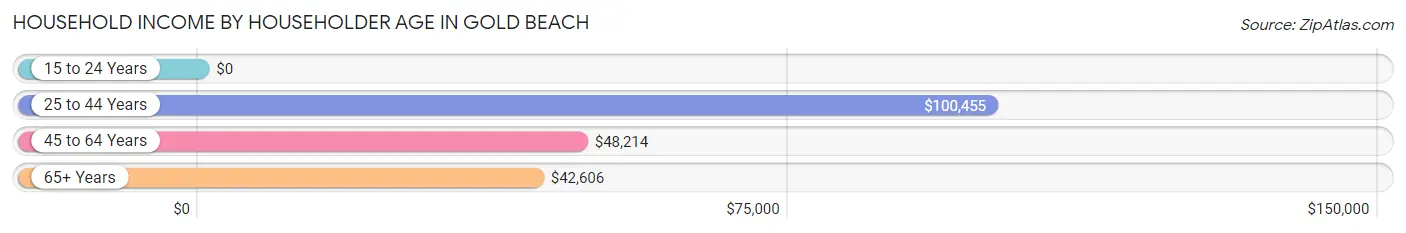
| Income Bracket | # Households | Median Income |
| 15 to 24 Years | 43 (3.8%) | $0 |
| 25 to 44 Years | 300 (26.4%) | $100,455 |
| 45 to 64 Years | 350 (30.8%) | $48,214 |
| 65+ Years | 444 (39.1%) | $42,606 |
| Total | 1,137 (100.0%) | $49,018 |
Poverty in Gold Beach
Income Below Poverty by Sex and Age in Gold Beach
With 10.0% poverty level for males and 24.4% for females among the residents of Gold Beach, 45 to 54 year old males and under 5 year old females are the most vulnerable to poverty, with 44 males (25.7%) and 34 females (100.0%) in their respective age groups living below the poverty level.
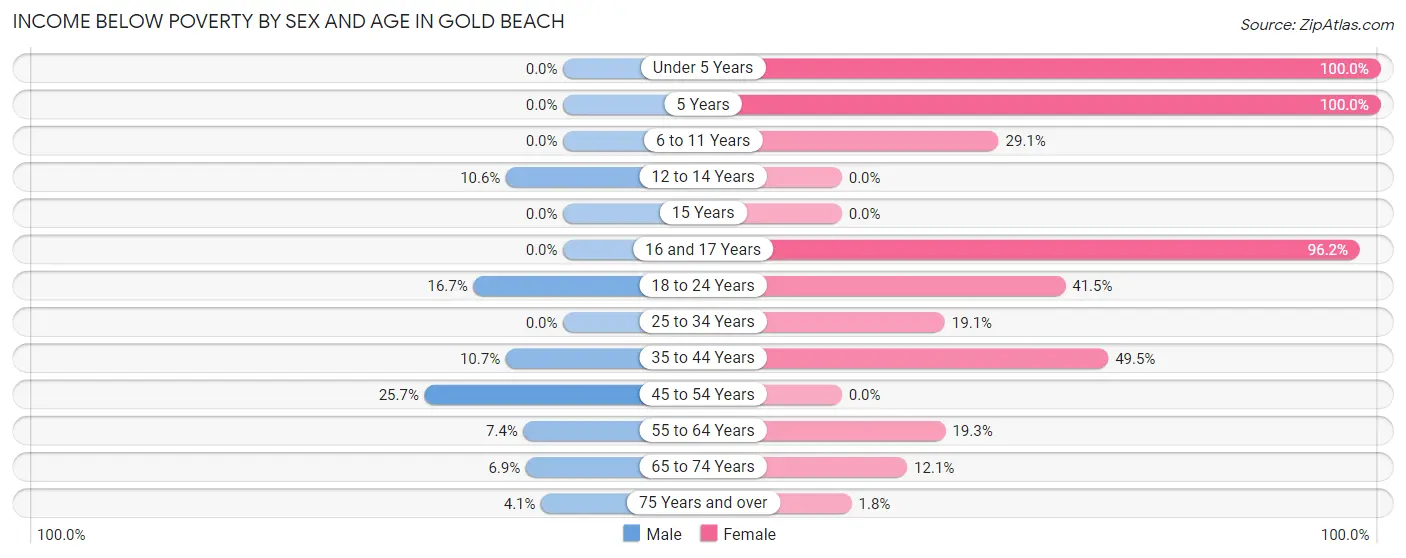
| Age Bracket | Male | Female |
| Under 5 Years | 0 (0.0%) | 34 (100.0%) |
| 5 Years | 0 (0.0%) | 7 (100.0%) |
| 6 to 11 Years | 0 (0.0%) | 23 (29.1%) |
| 12 to 14 Years | 7 (10.6%) | 0 (0.0%) |
| 15 Years | 0 (0.0%) | 0 (0.0%) |
| 16 and 17 Years | 0 (0.0%) | 50 (96.2%) |
| 18 to 24 Years | 18 (16.7%) | 39 (41.5%) |
| 25 to 34 Years | 0 (0.0%) | 31 (19.1%) |
| 35 to 44 Years | 23 (10.6%) | 45 (49.4%) |
| 45 to 54 Years | 44 (25.7%) | 0 (0.0%) |
| 55 to 64 Years | 14 (7.4%) | 36 (19.3%) |
| 65 to 74 Years | 11 (6.9%) | 33 (12.1%) |
| 75 Years and over | 6 (4.1%) | 2 (1.8%) |
| Total | 123 (10.0%) | 300 (24.4%) |
Income Above Poverty by Sex and Age in Gold Beach
According to the poverty statistics in Gold Beach, males aged under 5 years and females aged 12 to 14 years are the age groups that are most secure financially, with 100.0% of males and 100.0% of females in these age groups living above the poverty line.
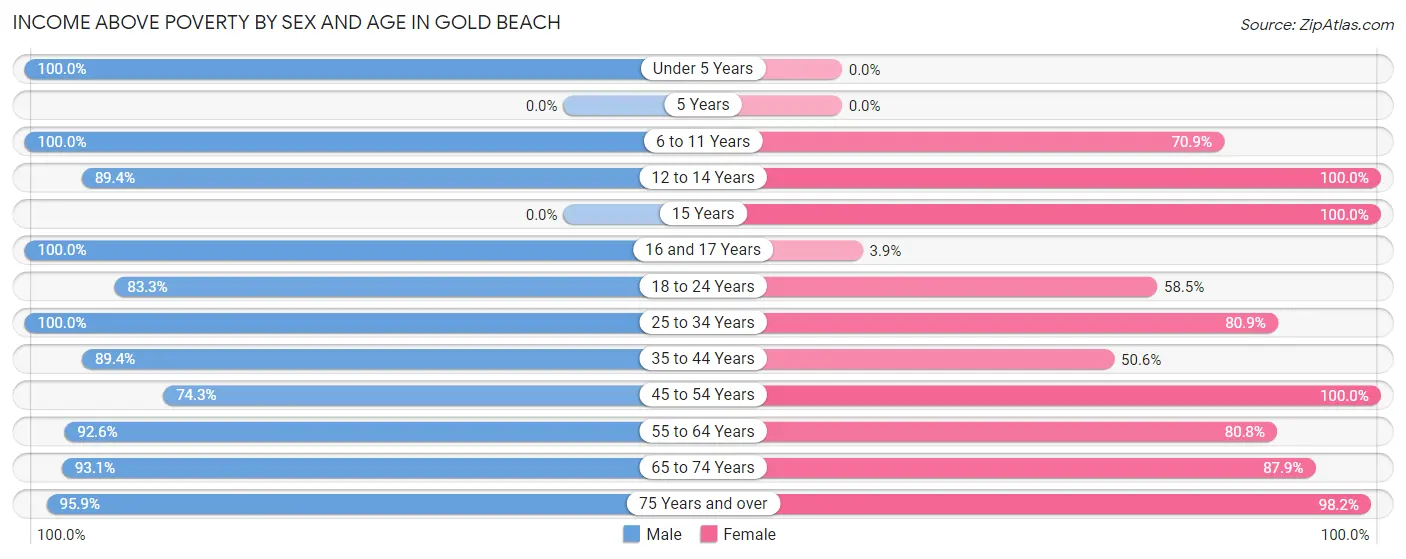
| Age Bracket | Male | Female |
| Under 5 Years | 4 (100.0%) | 0 (0.0%) |
| 5 Years | 0 (0.0%) | 0 (0.0%) |
| 6 to 11 Years | 84 (100.0%) | 56 (70.9%) |
| 12 to 14 Years | 59 (89.4%) | 23 (100.0%) |
| 15 Years | 0 (0.0%) | 3 (100.0%) |
| 16 and 17 Years | 2 (100.0%) | 2 (3.8%) |
| 18 to 24 Years | 90 (83.3%) | 55 (58.5%) |
| 25 to 34 Years | 88 (100.0%) | 131 (80.9%) |
| 35 to 44 Years | 193 (89.3%) | 46 (50.5%) |
| 45 to 54 Years | 127 (74.3%) | 114 (100.0%) |
| 55 to 64 Years | 176 (92.6%) | 151 (80.7%) |
| 65 to 74 Years | 148 (93.1%) | 239 (87.9%) |
| 75 Years and over | 141 (95.9%) | 108 (98.2%) |
| Total | 1,112 (90.0%) | 928 (75.6%) |
Income Below Poverty Among Married-Couple Families in Gold Beach
The poverty statistics for married-couple families in Gold Beach show that 4.1% or 22 of the total 542 families live below the poverty line. Families with 1 or 2 children have the highest poverty rate of 14.7%, comprising of 16 families. On the other hand, families with 3 or 4 children have the lowest poverty rate of 0.0%, which includes 0 families.
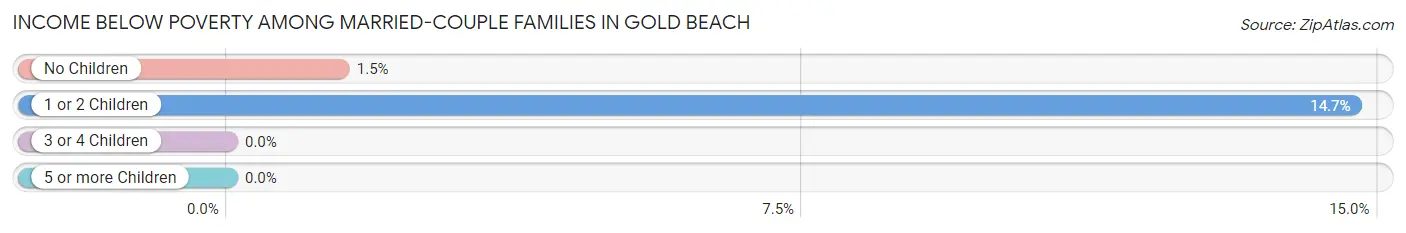
| Children | Above Poverty | Below Poverty |
| No Children | 404 (98.5%) | 6 (1.5%) |
| 1 or 2 Children | 93 (85.3%) | 16 (14.7%) |
| 3 or 4 Children | 23 (100.0%) | 0 (0.0%) |
| 5 or more Children | 0 (0.0%) | 0 (0.0%) |
| Total | 520 (95.9%) | 22 (4.1%) |
Income Below Poverty Among Single-Parent Households in Gold Beach
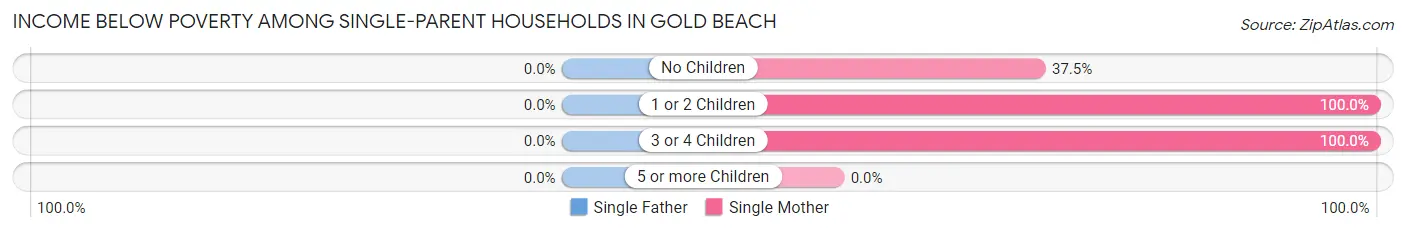
| Children | Single Father | Single Mother |
| No Children | 0 (0.0%) | 18 (37.5%) |
| 1 or 2 Children | 0 (0.0%) | 42 (100.0%) |
| 3 or 4 Children | 0 (0.0%) | 19 (100.0%) |
| 5 or more Children | 0 (0.0%) | 0 (0.0%) |
| Total | 0 (0.0%) | 79 (72.5%) |
Income Below Poverty Among Married-Couple vs Single-Parent Households in Gold Beach
The poverty data for Gold Beach shows that 22 of the married-couple family households (4.1%) and 79 of the single-parent households (50.3%) are living below the poverty level. Within the married-couple family households, those with 1 or 2 children have the highest poverty rate, with 16 households (14.7%) falling below the poverty line. Among the single-parent households, those with 1 or 2 children have the highest poverty rate, with 42 household (100.0%) living below poverty.
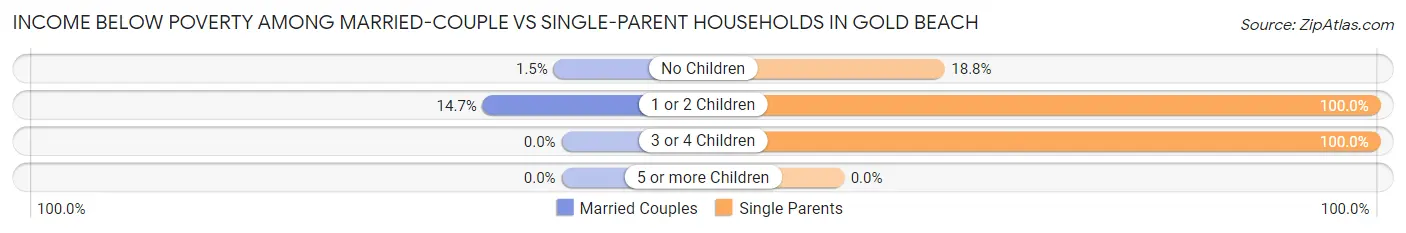
| Children | Married-Couple Families | Single-Parent Households |
| No Children | 6 (1.5%) | 18 (18.8%) |
| 1 or 2 Children | 16 (14.7%) | 42 (100.0%) |
| 3 or 4 Children | 0 (0.0%) | 19 (100.0%) |
| 5 or more Children | 0 (0.0%) | 0 (0.0%) |
| Total | 22 (4.1%) | 79 (50.3%) |
Race in Gold Beach
The most populous races in Gold Beach are White / Caucasian (2,071 | 81.8%), Two or more Races (368 | 14.5%), and Hispanic or Latino (338 | 13.3%).
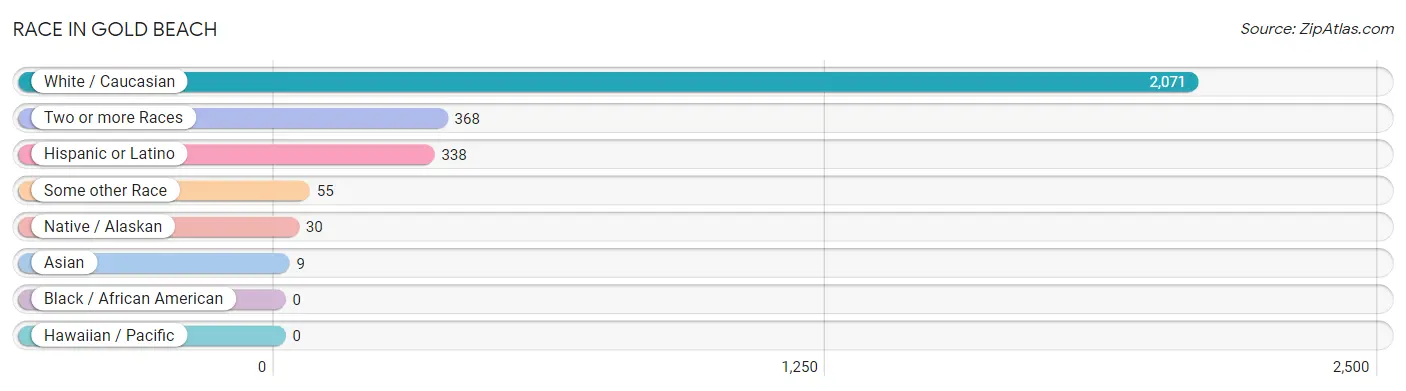
| Race | # Population | % Population |
| Asian | 9 | 0.4% |
| Black / African American | 0 | 0.0% |
| Hawaiian / Pacific | 0 | 0.0% |
| Hispanic or Latino | 338 | 13.3% |
| Native / Alaskan | 30 | 1.2% |
| White / Caucasian | 2,071 | 81.8% |
| Two or more Races | 368 | 14.5% |
| Some other Race | 55 | 2.2% |
| Total | 2,533 | 100.0% |
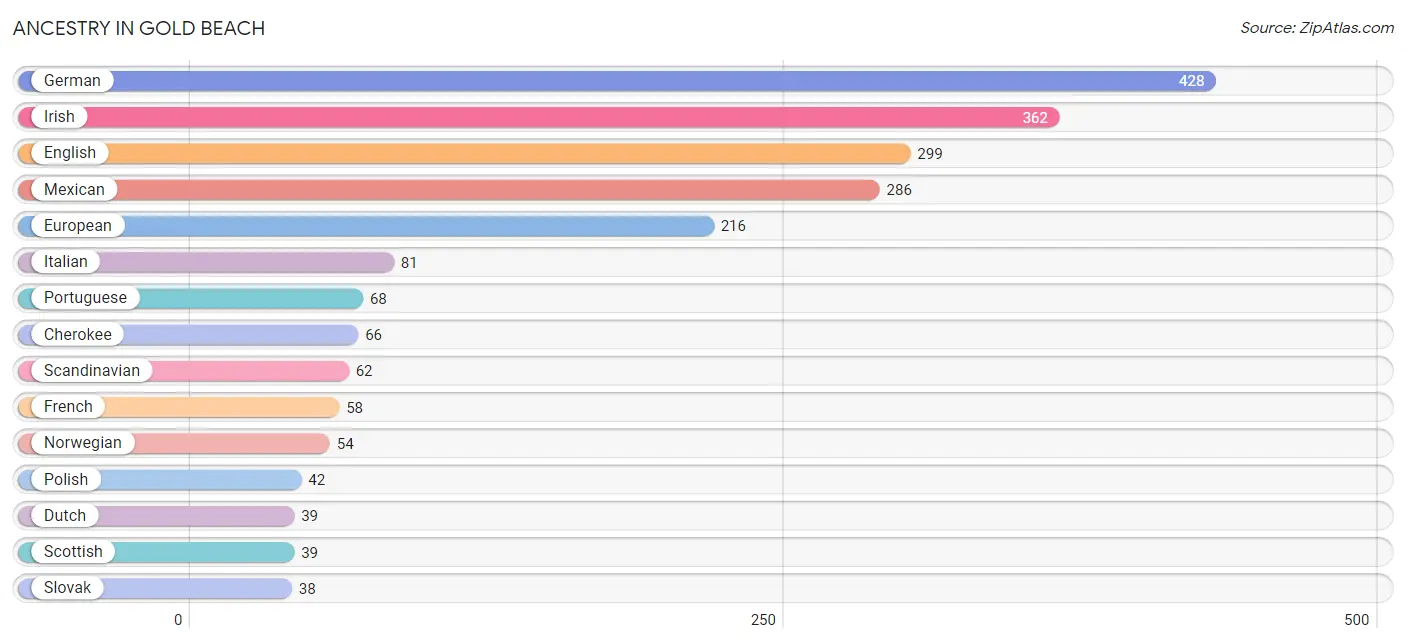
Ancestry in Gold Beach
The most populous ancestries reported in Gold Beach are German (428 | 16.9%), Irish (362 | 14.3%), English (299 | 11.8%), Mexican (286 | 11.3%), and European (216 | 8.5%), together accounting for 62.8% of all Gold Beach residents.
| Ancestry | # Population | % Population |
| American | 31 | 1.2% |
| Apache | 1 | 0.0% |
| Austrian | 14 | 0.5% |
| British | 10 | 0.4% |
| Burmese | 4 | 0.2% |
| Canadian | 18 | 0.7% |
| Central American | 5 | 0.2% |
| Central American Indian | 5 | 0.2% |
| Cherokee | 66 | 2.6% |
| Choctaw | 3 | 0.1% |
| Colombian | 15 | 0.6% |
| Czech | 7 | 0.3% |
| Danish | 20 | 0.8% |
| Dutch | 39 | 1.5% |
| English | 299 | 11.8% |
| European | 216 | 8.5% |
| French | 58 | 2.3% |
| French Canadian | 21 | 0.8% |
| German | 428 | 16.9% |
| Hungarian | 15 | 0.6% |
| Indian (Asian) | 11 | 0.4% |
| Irish | 362 | 14.3% |
| Italian | 81 | 3.2% |
| Laotian | 8 | 0.3% |
| Mexican | 286 | 11.3% |
| Mexican American Indian | 30 | 1.2% |
| Native Hawaiian | 4 | 0.2% |
| Northern European | 5 | 0.2% |
| Norwegian | 54 | 2.1% |
| Pima | 11 | 0.4% |
| Polish | 42 | 1.7% |
| Portuguese | 68 | 2.7% |
| Russian | 13 | 0.5% |
| Salvadoran | 5 | 0.2% |
| Scandinavian | 62 | 2.5% |
| Scotch-Irish | 26 | 1.0% |
| Scottish | 39 | 1.5% |
| Slavic | 14 | 0.5% |
| Slovak | 38 | 1.5% |
| South American | 15 | 0.6% |
| Spanish | 32 | 1.3% |
| Swedish | 29 | 1.1% |
| Swiss | 6 | 0.2% |
| Ukrainian | 5 | 0.2% |
| Welsh | 31 | 1.2% | View All 45 Rows |
Immigrants in Gold Beach
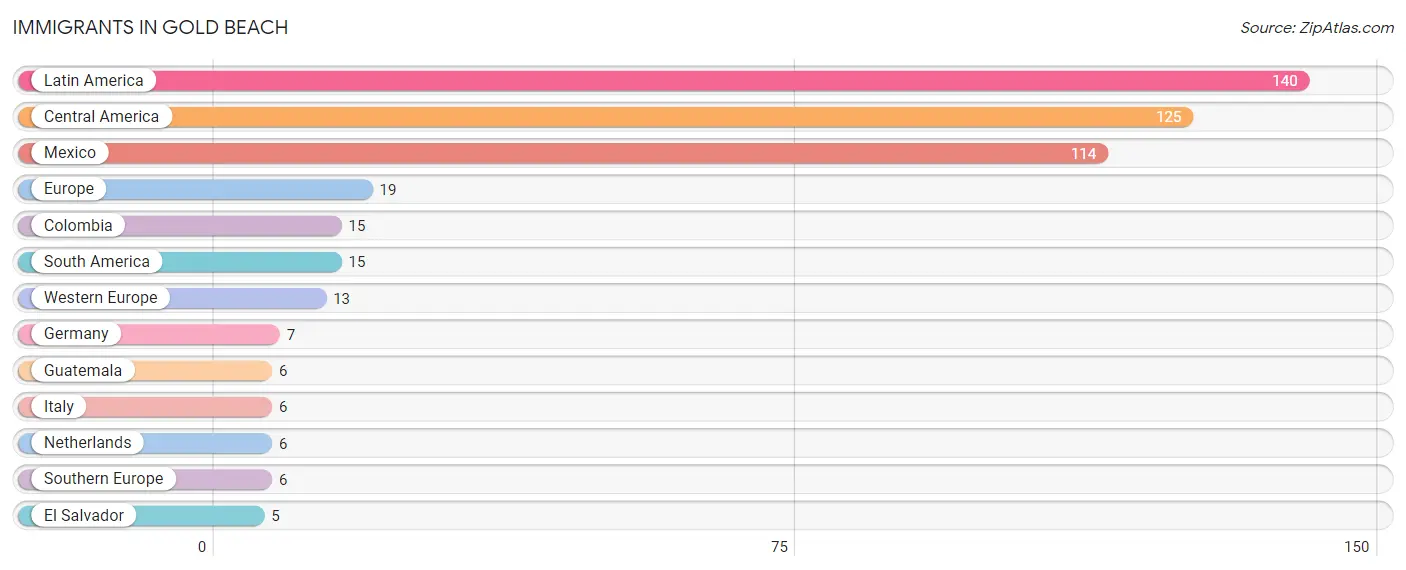
The most numerous immigrant groups reported in Gold Beach came from Latin America (140 | 5.5%), Central America (125 | 4.9%), Mexico (114 | 4.5%), Europe (19 | 0.7%), and Colombia (15 | 0.6%), together accounting for 16.3% of all Gold Beach residents.
| Immigration Origin | # Population | % Population |
| Central America | 125 | 4.9% |
| Colombia | 15 | 0.6% |
| El Salvador | 5 | 0.2% |
| Europe | 19 | 0.7% |
| Germany | 7 | 0.3% |
| Guatemala | 6 | 0.2% |
| Italy | 6 | 0.2% |
| Latin America | 140 | 5.5% |
| Mexico | 114 | 4.5% |
| Netherlands | 6 | 0.2% |
| South America | 15 | 0.6% |
| Southern Europe | 6 | 0.2% |
| Western Europe | 13 | 0.5% | View All 13 Rows |
Sex and Age in Gold Beach
Sex and Age in Gold Beach
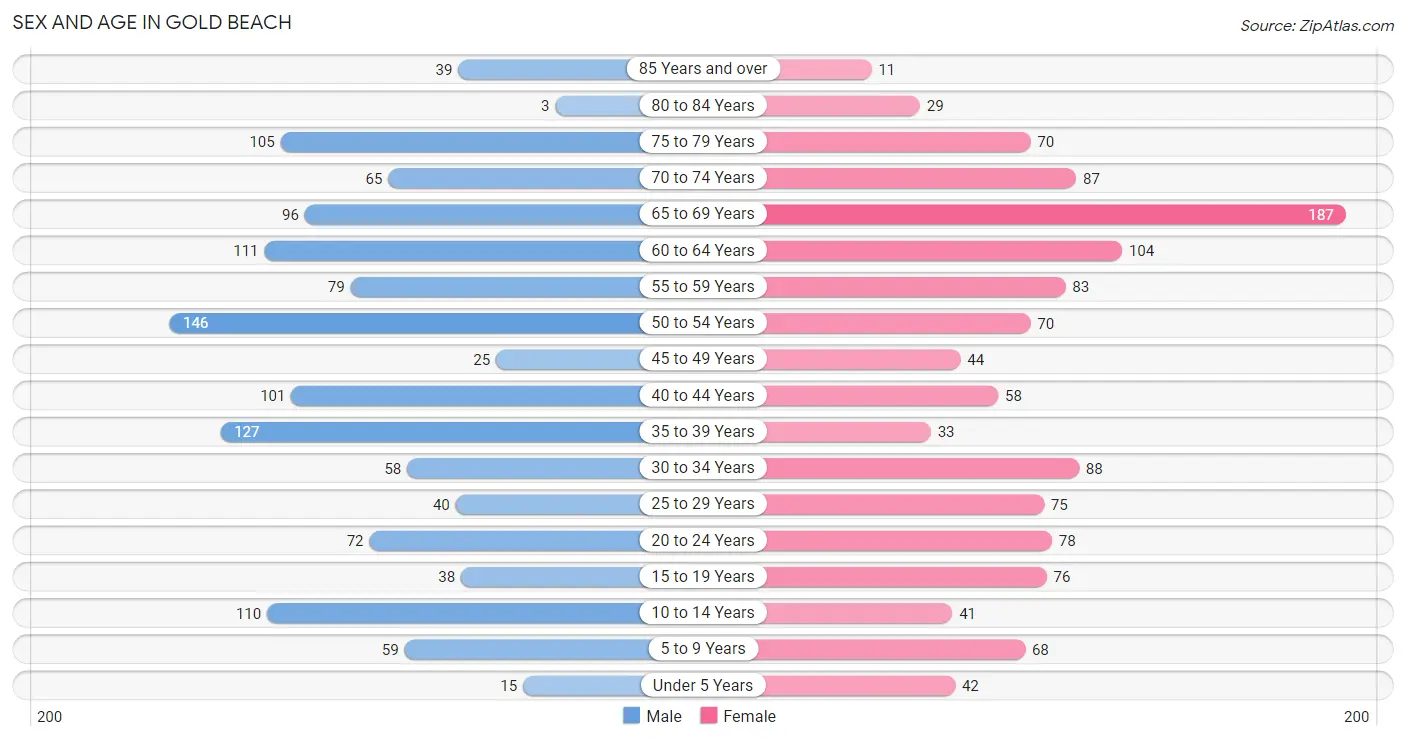
The most populous age groups in Gold Beach are 50 to 54 Years (146 | 11.3%) for men and 65 to 69 Years (187 | 15.0%) for women.
| Age Bracket | Male | Female |
| Under 5 Years | 15 (1.2%) | 42 (3.4%) |
| 5 to 9 Years | 59 (4.6%) | 68 (5.5%) |
| 10 to 14 Years | 110 (8.5%) | 41 (3.3%) |
| 15 to 19 Years | 38 (2.9%) | 76 (6.1%) |
| 20 to 24 Years | 72 (5.6%) | 78 (6.3%) |
| 25 to 29 Years | 40 (3.1%) | 75 (6.0%) |
| 30 to 34 Years | 58 (4.5%) | 88 (7.1%) |
| 35 to 39 Years | 127 (9.9%) | 33 (2.6%) |
| 40 to 44 Years | 101 (7.8%) | 58 (4.7%) |
| 45 to 49 Years | 25 (1.9%) | 44 (3.5%) |
| 50 to 54 Years | 146 (11.3%) | 70 (5.6%) |
| 55 to 59 Years | 79 (6.1%) | 83 (6.7%) |
| 60 to 64 Years | 111 (8.6%) | 104 (8.4%) |
| 65 to 69 Years | 96 (7.4%) | 187 (15.0%) |
| 70 to 74 Years | 65 (5.0%) | 87 (7.0%) |
| 75 to 79 Years | 105 (8.2%) | 70 (5.6%) |
| 80 to 84 Years | 3 (0.2%) | 29 (2.3%) |
| 85 Years and over | 39 (3.0%) | 11 (0.9%) |
| Total | 1,289 (100.0%) | 1,244 (100.0%) |
Families and Households in Gold Beach
Median Family Size in Gold Beach
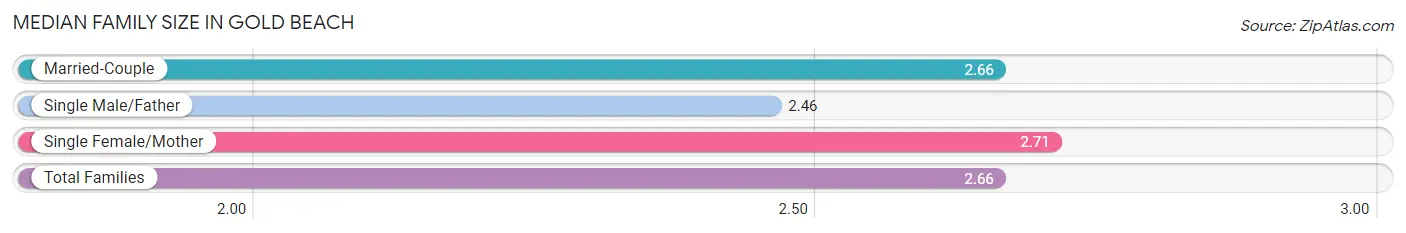
The median family size in Gold Beach is 2.66 persons per family, with single female/mother families (109 | 15.6%) accounting for the largest median family size of 2.71 persons per family. On the other hand, single male/father families (48 | 6.9%) represent the smallest median family size with 2.46 persons per family.
| Family Type | # Families | Family Size |
| Married-Couple | 542 (77.5%) | 2.66 |
| Single Male/Father | 48 (6.9%) | 2.46 |
| Single Female/Mother | 109 (15.6%) | 2.71 |
| Total Families | 699 (100.0%) | 2.66 |
Median Household Size in Gold Beach
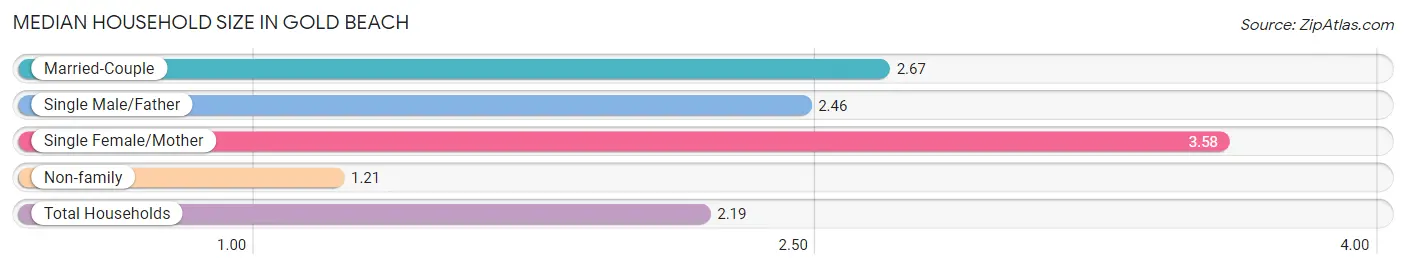
The median household size in Gold Beach is 2.19 persons per household, with single female/mother households (109 | 9.6%) accounting for the largest median household size of 3.58 persons per household. non-family households (438 | 38.5%) represent the smallest median household size with 1.21 persons per household.
| Household Type | # Households | Household Size |
| Married-Couple | 542 (47.7%) | 2.67 |
| Single Male/Father | 48 (4.2%) | 2.46 |
| Single Female/Mother | 109 (9.6%) | 3.58 |
| Non-family | 438 (38.5%) | 1.21 |
| Total Households | 1,137 (100.0%) | 2.19 |
Household Size by Marriage Status in Gold Beach
Out of a total of 1,137 households in Gold Beach, 699 (61.5%) are family households, while 438 (38.5%) are nonfamily households. The most numerous type of family households are 2-person households, comprising 392, and the most common type of nonfamily households are 1-person households, comprising 353.
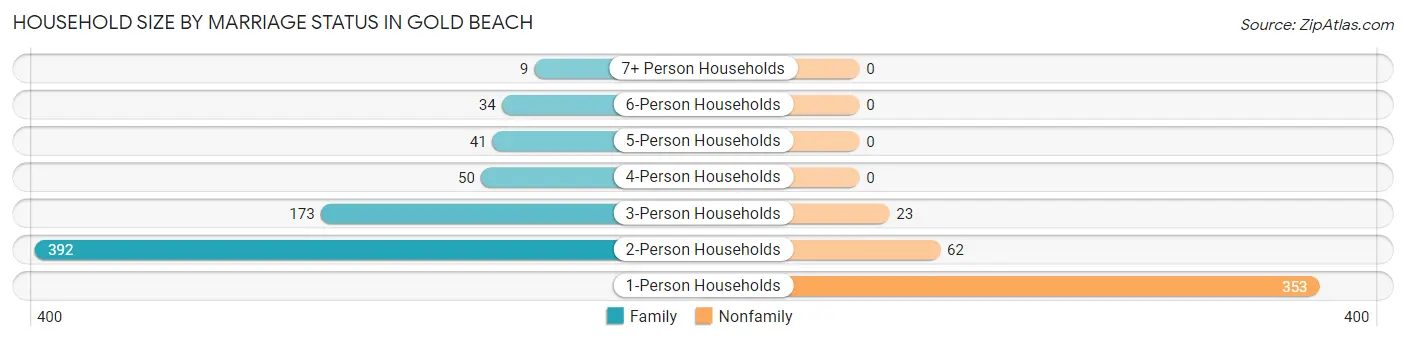
| Household Size | Family Households | Nonfamily Households |
| 1-Person Households | - | 353 (31.0%) |
| 2-Person Households | 392 (34.5%) | 62 (5.4%) |
| 3-Person Households | 173 (15.2%) | 23 (2.0%) |
| 4-Person Households | 50 (4.4%) | 0 (0.0%) |
| 5-Person Households | 41 (3.6%) | 0 (0.0%) |
| 6-Person Households | 34 (3.0%) | 0 (0.0%) |
| 7+ Person Households | 9 (0.8%) | 0 (0.0%) |
| Total | 699 (61.5%) | 438 (38.5%) |
Female Fertility in Gold Beach
Fertility by Age in Gold Beach
Average fertility rate in Gold Beach is 88.0 births per 1,000 women. Women in the age bracket of 20 to 34 years have the highest fertility rate with 166.0 births per 1,000 women. Women in the age bracket of 20 to 34 years acount for 100.0% of all women with births.
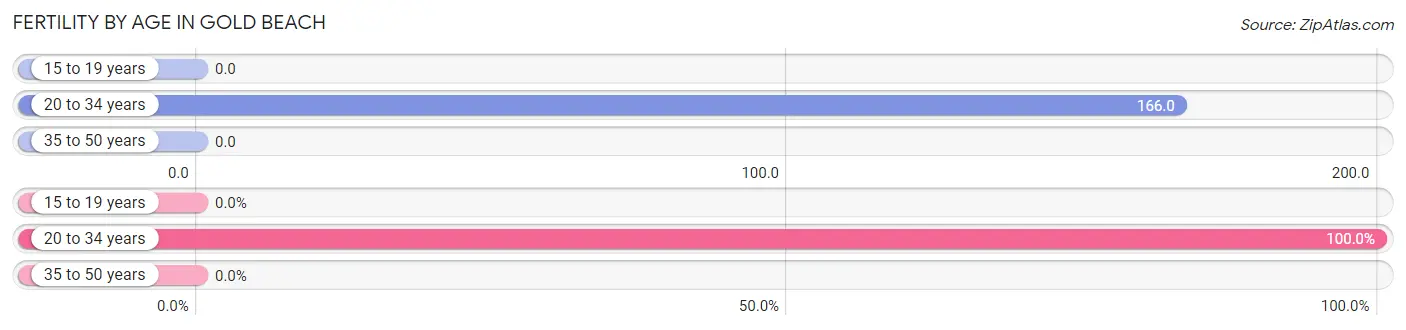
| Age Bracket | Women with Births | Births / 1,000 Women |
| 15 to 19 years | 0 (0.0%) | 0.0 |
| 20 to 34 years | 40 (100.0%) | 166.0 |
| 35 to 50 years | 0 (0.0%) | 0.0 |
| Total | 40 (100.0%) | 88.0 |
Fertility by Age by Marriage Status in Gold Beach
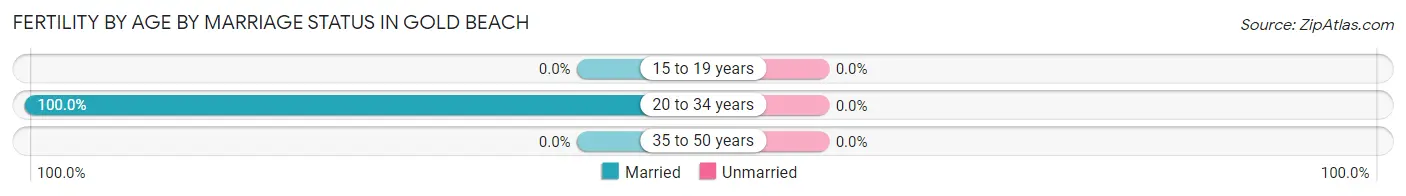
| Age Bracket | Married | Unmarried |
| 15 to 19 years | 0 (0.0%) | 0 (0.0%) |
| 20 to 34 years | 40 (100.0%) | 0 (0.0%) |
| 35 to 50 years | 0 (0.0%) | 0 (0.0%) |
| Total | 40 (100.0%) | 0 (0.0%) |
Fertility by Education in Gold Beach
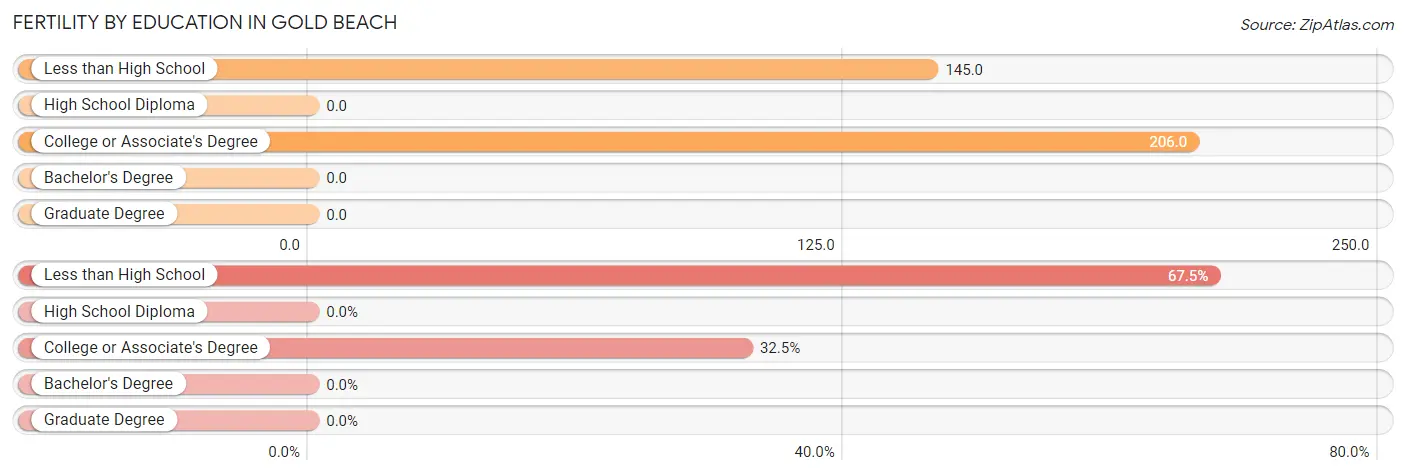
| Educational Attainment | Women with Births | Births / 1,000 Women |
| Less than High School | 27 (67.5%) | 145.0 |
| High School Diploma | 0 (0.0%) | 0.0 |
| College or Associate's Degree | 13 (32.5%) | 206.0 |
| Bachelor's Degree | 0 (0.0%) | 0.0 |
| Graduate Degree | 0 (0.0%) | 0.0 |
| Total | 40 (100.0%) | 88.0 |
Fertility by Education by Marriage Status in Gold Beach
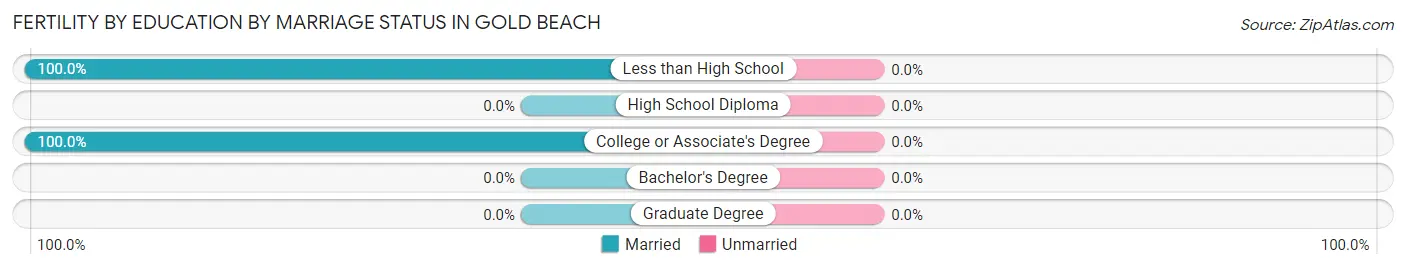
| Educational Attainment | Married | Unmarried |
| Less than High School | 27 (100.0%) | 0 (0.0%) |
| High School Diploma | 0 (0.0%) | 0 (0.0%) |
| College or Associate's Degree | 13 (100.0%) | 0 (0.0%) |
| Bachelor's Degree | 0 (0.0%) | 0 (0.0%) |
| Graduate Degree | 0 (0.0%) | 0 (0.0%) |
| Total | 40 (100.0%) | 0 (0.0%) |
Employment Characteristics in Gold Beach
Employment by Class of Employer in Gold Beach
Among the 1,017 employed individuals in Gold Beach, private company employees (526 | 51.7%), not-for-profit organizations (132 | 13.0%), and self-employed (not incorporated) (129 | 12.7%) make up the most common classes of employment.
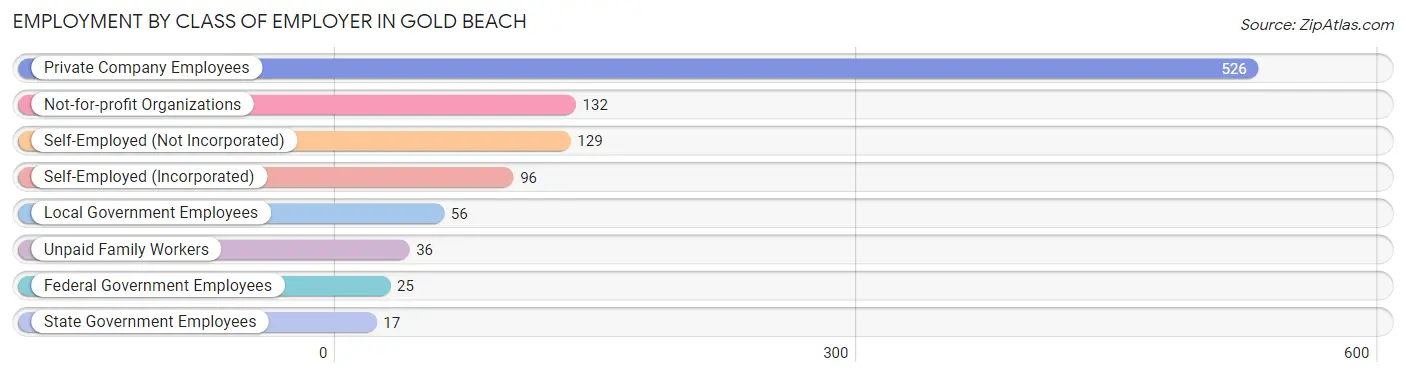
| Employer Class | # Employees | % Employees |
| Private Company Employees | 526 | 51.7% |
| Self-Employed (Incorporated) | 96 | 9.4% |
| Self-Employed (Not Incorporated) | 129 | 12.7% |
| Not-for-profit Organizations | 132 | 13.0% |
| Local Government Employees | 56 | 5.5% |
| State Government Employees | 17 | 1.7% |
| Federal Government Employees | 25 | 2.5% |
| Unpaid Family Workers | 36 | 3.5% |
| Total | 1,017 | 100.0% |
Employment Status by Age in Gold Beach
According to the labor force statistics for Gold Beach, out of the total population over 16 years of age (2,190), 51.6% or 1,130 individuals are in the labor force, with 9.6% or 108 of them unemployed. The age group with the highest labor force participation rate is 30 to 34 years, with 98.6% or 144 individuals in the labor force. Within the labor force, the 16 to 19 years age range has the highest percentage of unemployed individuals, with 42.9% or 12 of them being unemployed.
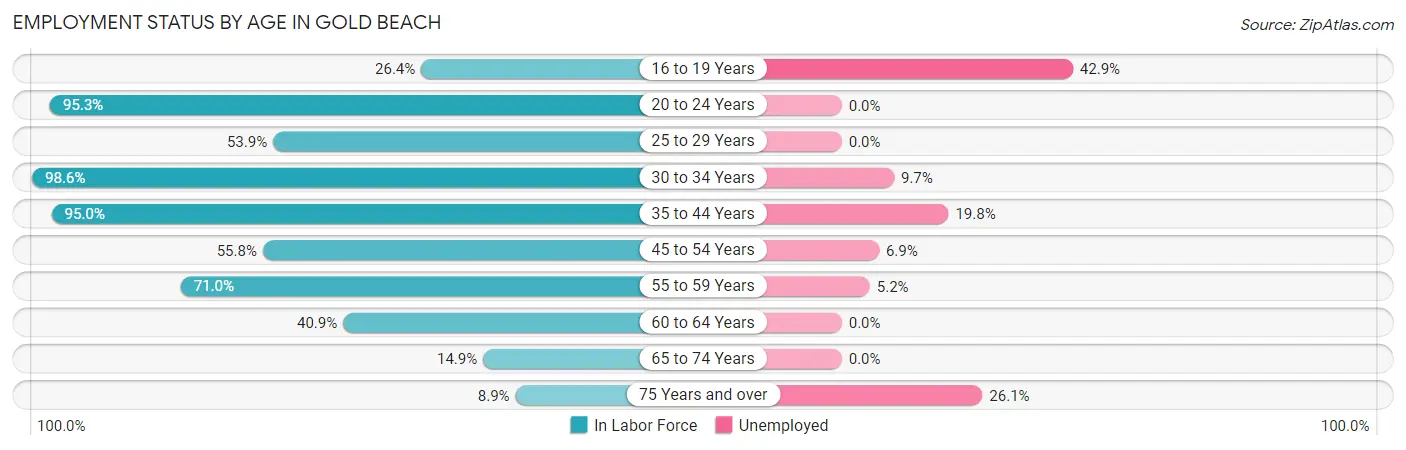
| Age Bracket | In Labor Force | Unemployed |
| 16 to 19 Years | 28 (26.4%) | 12 (42.9%) |
| 20 to 24 Years | 143 (95.3%) | 0 (0.0%) |
| 25 to 29 Years | 62 (53.9%) | 0 (0.0%) |
| 30 to 34 Years | 144 (98.6%) | 14 (9.7%) |
| 35 to 44 Years | 303 (95.0%) | 60 (19.8%) |
| 45 to 54 Years | 159 (55.8%) | 11 (6.9%) |
| 55 to 59 Years | 115 (71.0%) | 6 (5.2%) |
| 60 to 64 Years | 88 (40.9%) | 0 (0.0%) |
| 65 to 74 Years | 65 (14.9%) | 0 (0.0%) |
| 75 Years and over | 23 (8.9%) | 6 (26.1%) |
| Total | 1,130 (51.6%) | 108 (9.6%) |
Employment Status by Educational Attainment in Gold Beach
According to labor force statistics for Gold Beach, 70.1% of individuals (871) out of the total population between 25 and 64 years of age (1,242) are in the labor force, with 10.4% or 91 of them being unemployed. The group with the highest labor force participation rate are those with the educational attainment of bachelor's degree or higher, with 90.8% or 187 individuals in the labor force. Within the labor force, individuals with less than high school education have the highest percentage of unemployment, with 18.3% or 22 of them being unemployed.
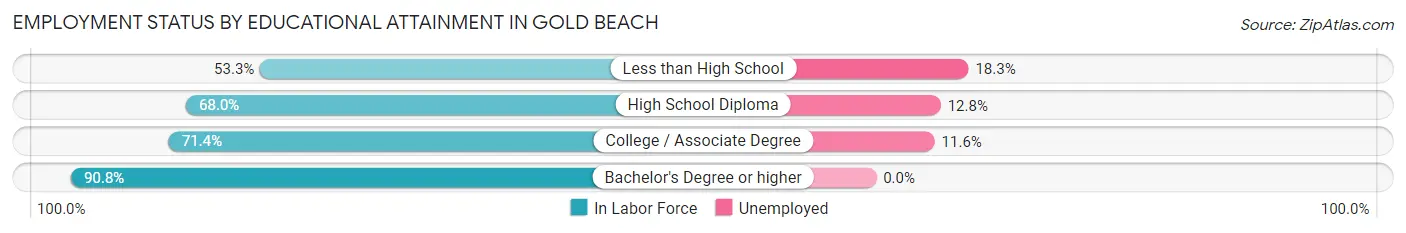
| Educational Attainment | In Labor Force | Unemployed |
| Less than High School | 120 (53.3%) | 41 (18.3%) |
| High School Diploma | 297 (68.0%) | 56 (12.8%) |
| College / Associate Degree | 267 (71.4%) | 43 (11.6%) |
| Bachelor's Degree or higher | 187 (90.8%) | 0 (0.0%) |
| Total | 871 (70.1%) | 129 (10.4%) |
Employment Occupations by Sex in Gold Beach
Management, Business, Science and Arts Occupations
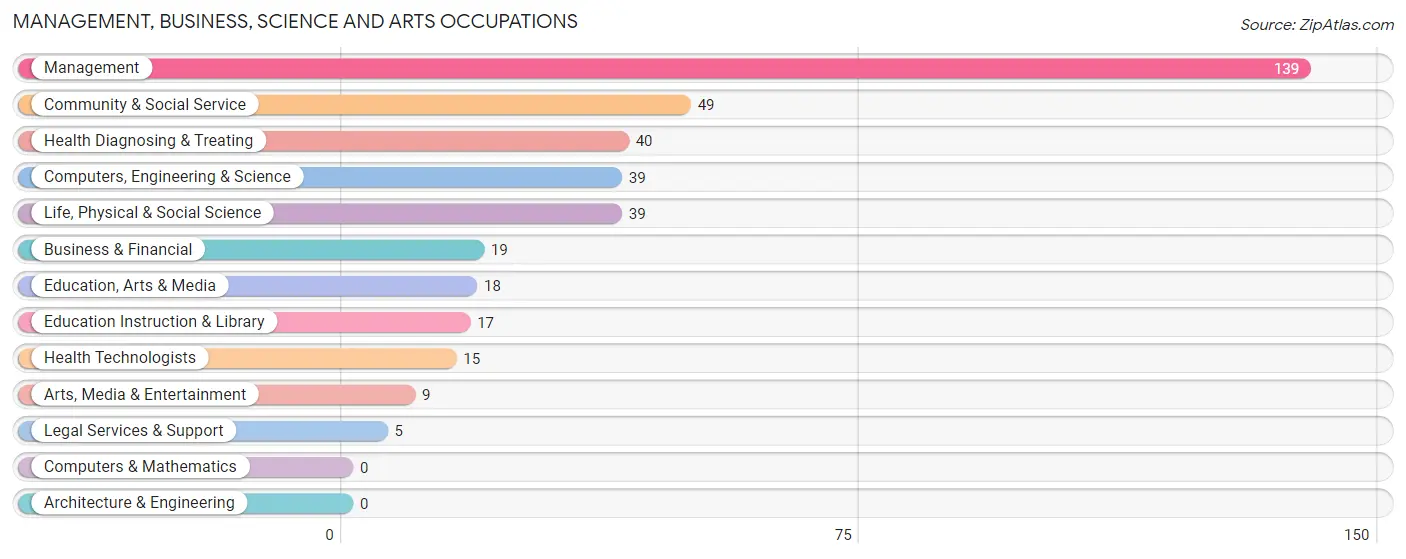
The most common Management, Business, Science and Arts occupations in Gold Beach are Management (139 | 13.6%), Community & Social Service (49 | 4.8%), Health Diagnosing & Treating (40 | 3.9%), Computers, Engineering & Science (39 | 3.8%), and Life, Physical & Social Science (39 | 3.8%).
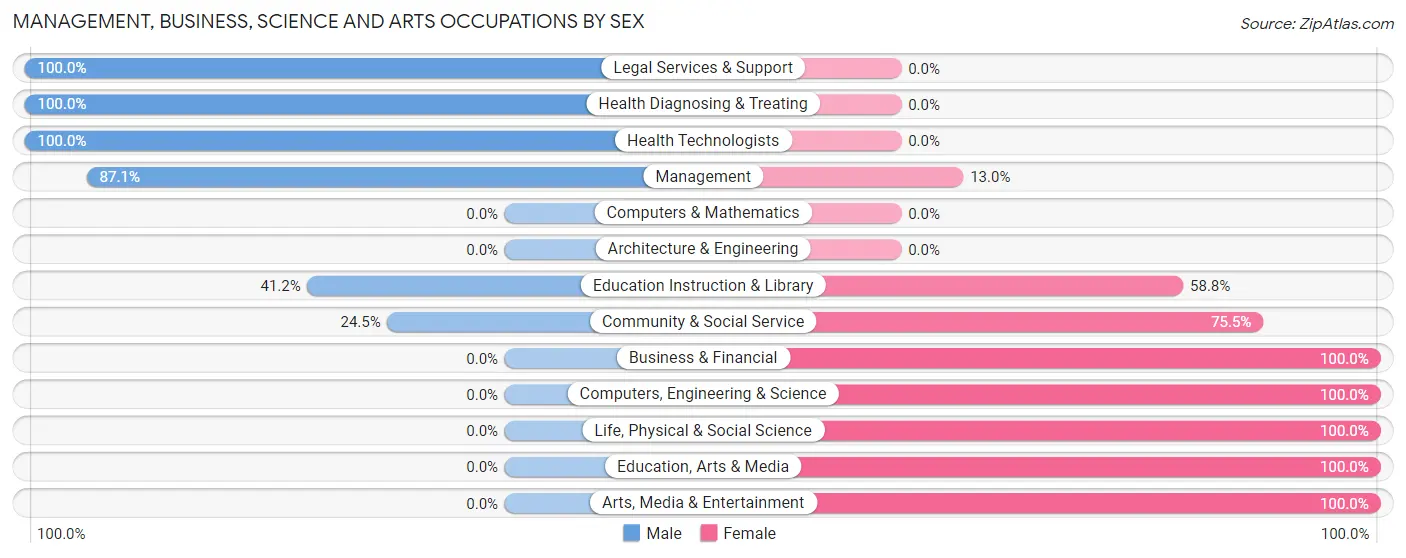
Management, Business, Science and Arts Occupations by Sex
Within the Management, Business, Science and Arts occupations in Gold Beach, the most male-oriented occupations are Legal Services & Support (100.0%), Health Diagnosing & Treating (100.0%), and Health Technologists (100.0%), while the most female-oriented occupations are Business & Financial (100.0%), Computers, Engineering & Science (100.0%), and Life, Physical & Social Science (100.0%).
| Occupation | Male | Female |
| Management | 121 (87.1%) | 18 (13.0%) |
| Business & Financial | 0 (0.0%) | 19 (100.0%) |
| Computers, Engineering & Science | 0 (0.0%) | 39 (100.0%) |
| Computers & Mathematics | 0 (0.0%) | 0 (0.0%) |
| Architecture & Engineering | 0 (0.0%) | 0 (0.0%) |
| Life, Physical & Social Science | 0 (0.0%) | 39 (100.0%) |
| Community & Social Service | 12 (24.5%) | 37 (75.5%) |
| Education, Arts & Media | 0 (0.0%) | 18 (100.0%) |
| Legal Services & Support | 5 (100.0%) | 0 (0.0%) |
| Education Instruction & Library | 7 (41.2%) | 10 (58.8%) |
| Arts, Media & Entertainment | 0 (0.0%) | 9 (100.0%) |
| Health Diagnosing & Treating | 40 (100.0%) | 0 (0.0%) |
| Health Technologists | 15 (100.0%) | 0 (0.0%) |
| Total (Category) | 173 (60.5%) | 113 (39.5%) |
| Total (Overall) | 532 (52.1%) | 489 (47.9%) |
Services Occupations
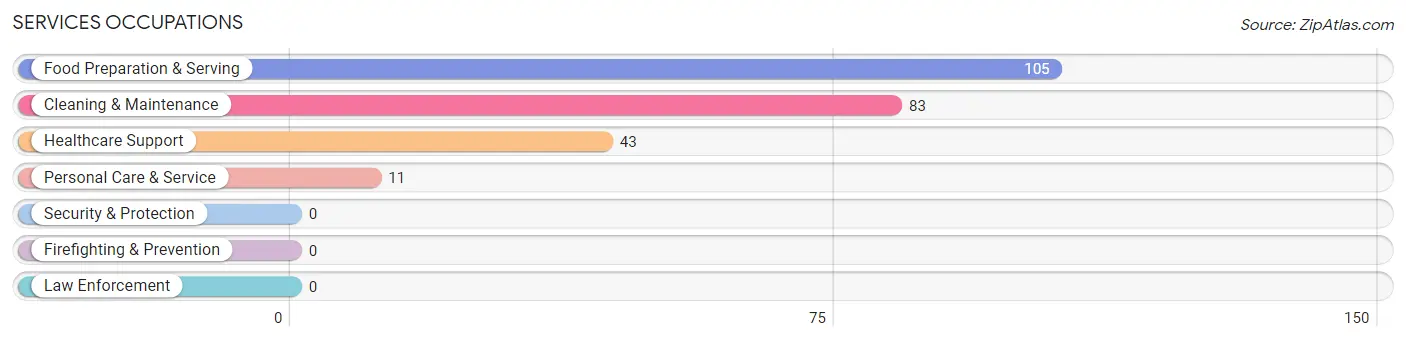
The most common Services occupations in Gold Beach are Food Preparation & Serving (105 | 10.3%), Cleaning & Maintenance (83 | 8.1%), Healthcare Support (43 | 4.2%), and Personal Care & Service (11 | 1.1%).
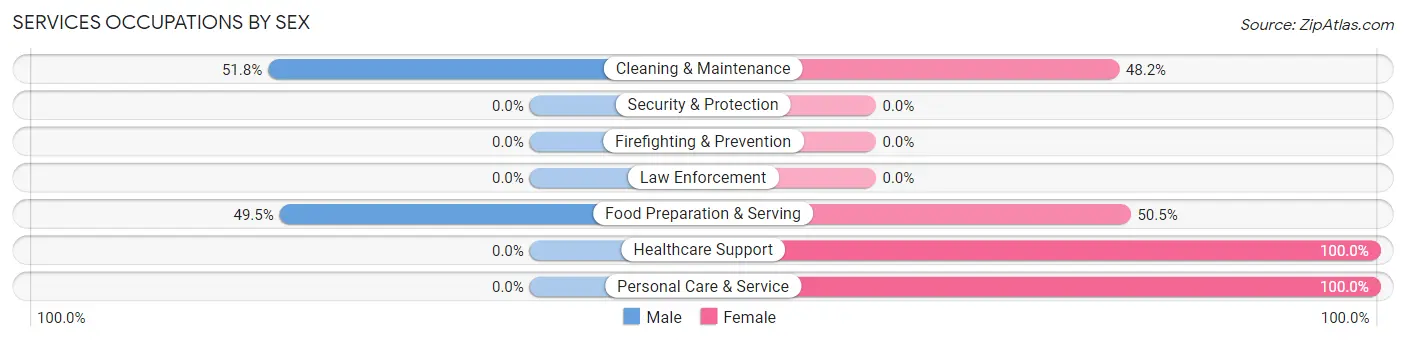
Services Occupations by Sex
Within the Services occupations in Gold Beach, the most male-oriented occupations are Cleaning & Maintenance (51.8%), and Food Preparation & Serving (49.5%), while the most female-oriented occupations are Healthcare Support (100.0%), Personal Care & Service (100.0%), and Food Preparation & Serving (50.5%).
| Occupation | Male | Female |
| Healthcare Support | 0 (0.0%) | 43 (100.0%) |
| Security & Protection | 0 (0.0%) | 0 (0.0%) |
| Firefighting & Prevention | 0 (0.0%) | 0 (0.0%) |
| Law Enforcement | 0 (0.0%) | 0 (0.0%) |
| Food Preparation & Serving | 52 (49.5%) | 53 (50.5%) |
| Cleaning & Maintenance | 43 (51.8%) | 40 (48.2%) |
| Personal Care & Service | 0 (0.0%) | 11 (100.0%) |
| Total (Category) | 95 (39.3%) | 147 (60.7%) |
| Total (Overall) | 532 (52.1%) | 489 (47.9%) |
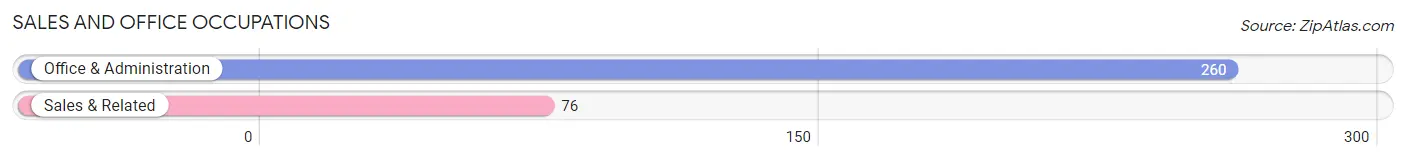
Sales and Office Occupations
The most common Sales and Office occupations in Gold Beach are Office & Administration (260 | 25.5%), and Sales & Related (76 | 7.4%).
Sales and Office Occupations by Sex
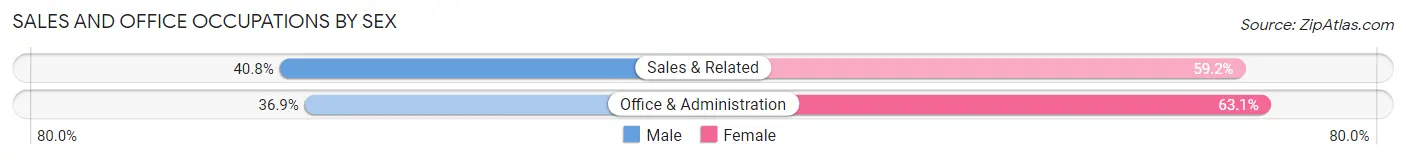
| Occupation | Male | Female |
| Sales & Related | 31 (40.8%) | 45 (59.2%) |
| Office & Administration | 96 (36.9%) | 164 (63.1%) |
| Total (Category) | 127 (37.8%) | 209 (62.2%) |
| Total (Overall) | 532 (52.1%) | 489 (47.9%) |
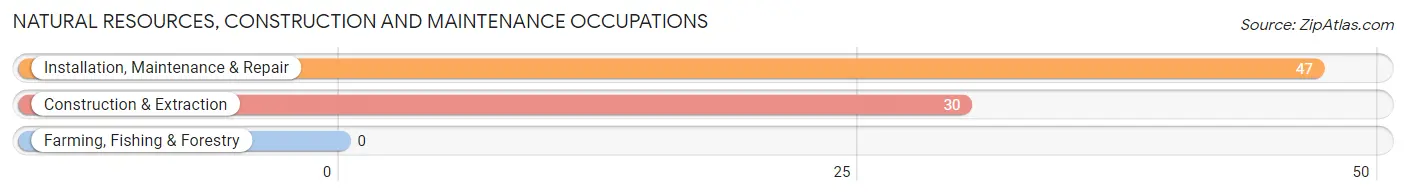
Natural Resources, Construction and Maintenance Occupations
The most common Natural Resources, Construction and Maintenance occupations in Gold Beach are Installation, Maintenance & Repair (47 | 4.6%), and Construction & Extraction (30 | 2.9%).
Natural Resources, Construction and Maintenance Occupations by Sex
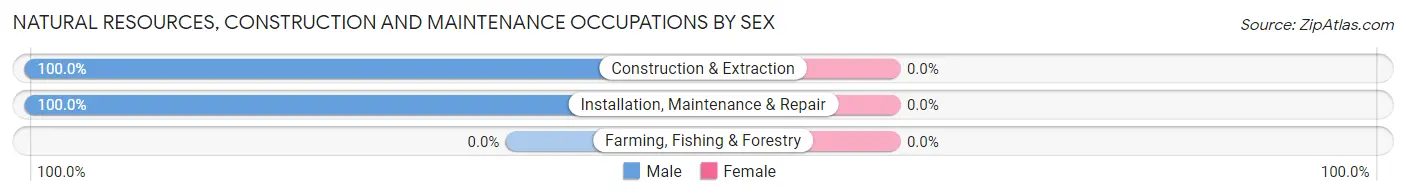
| Occupation | Male | Female |
| Farming, Fishing & Forestry | 0 (0.0%) | 0 (0.0%) |
| Construction & Extraction | 30 (100.0%) | 0 (0.0%) |
| Installation, Maintenance & Repair | 47 (100.0%) | 0 (0.0%) |
| Total (Category) | 77 (100.0%) | 0 (0.0%) |
| Total (Overall) | 532 (52.1%) | 489 (47.9%) |
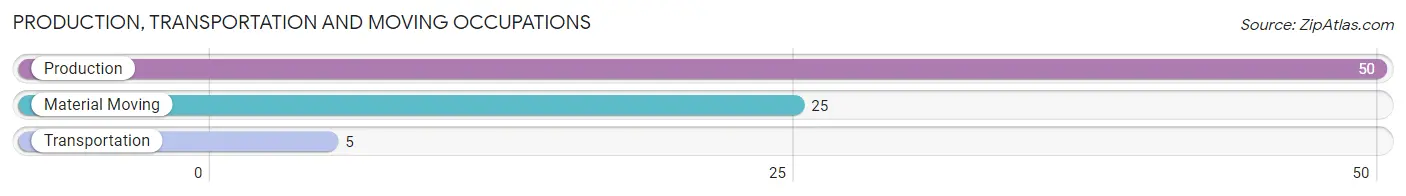
Production, Transportation and Moving Occupations
The most common Production, Transportation and Moving occupations in Gold Beach are Production (50 | 4.9%), Material Moving (25 | 2.5%), and Transportation (5 | 0.5%).
Production, Transportation and Moving Occupations by Sex
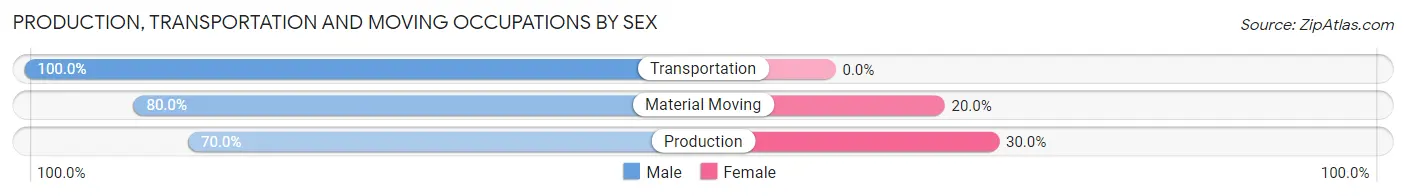
| Occupation | Male | Female |
| Production | 35 (70.0%) | 15 (30.0%) |
| Transportation | 5 (100.0%) | 0 (0.0%) |
| Material Moving | 20 (80.0%) | 5 (20.0%) |
| Total (Category) | 60 (75.0%) | 20 (25.0%) |
| Total (Overall) | 532 (52.1%) | 489 (47.9%) |
Employment Industries by Sex in Gold Beach
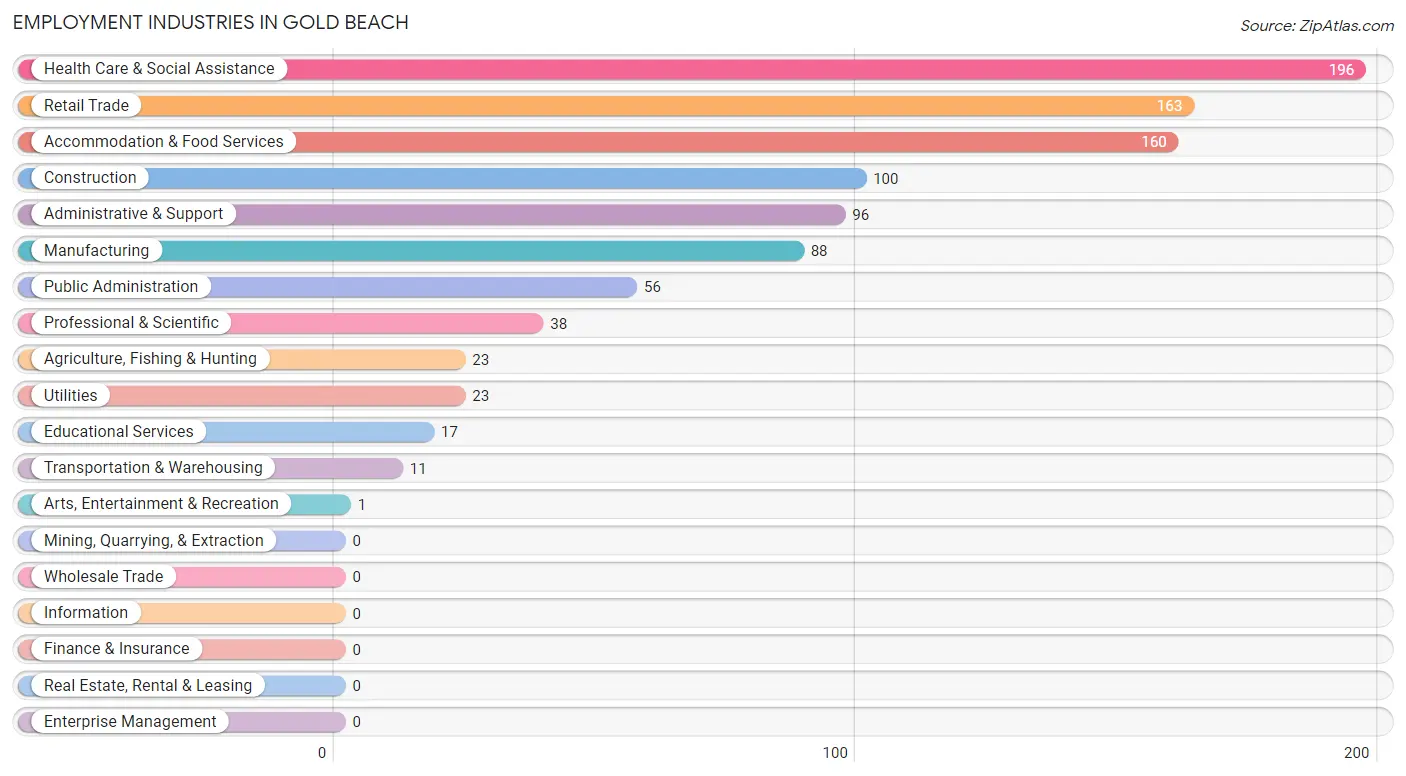
Employment Industries in Gold Beach
The major employment industries in Gold Beach include Health Care & Social Assistance (196 | 19.2%), Retail Trade (163 | 16.0%), Accommodation & Food Services (160 | 15.7%), Construction (100 | 9.8%), and Administrative & Support (96 | 9.4%).
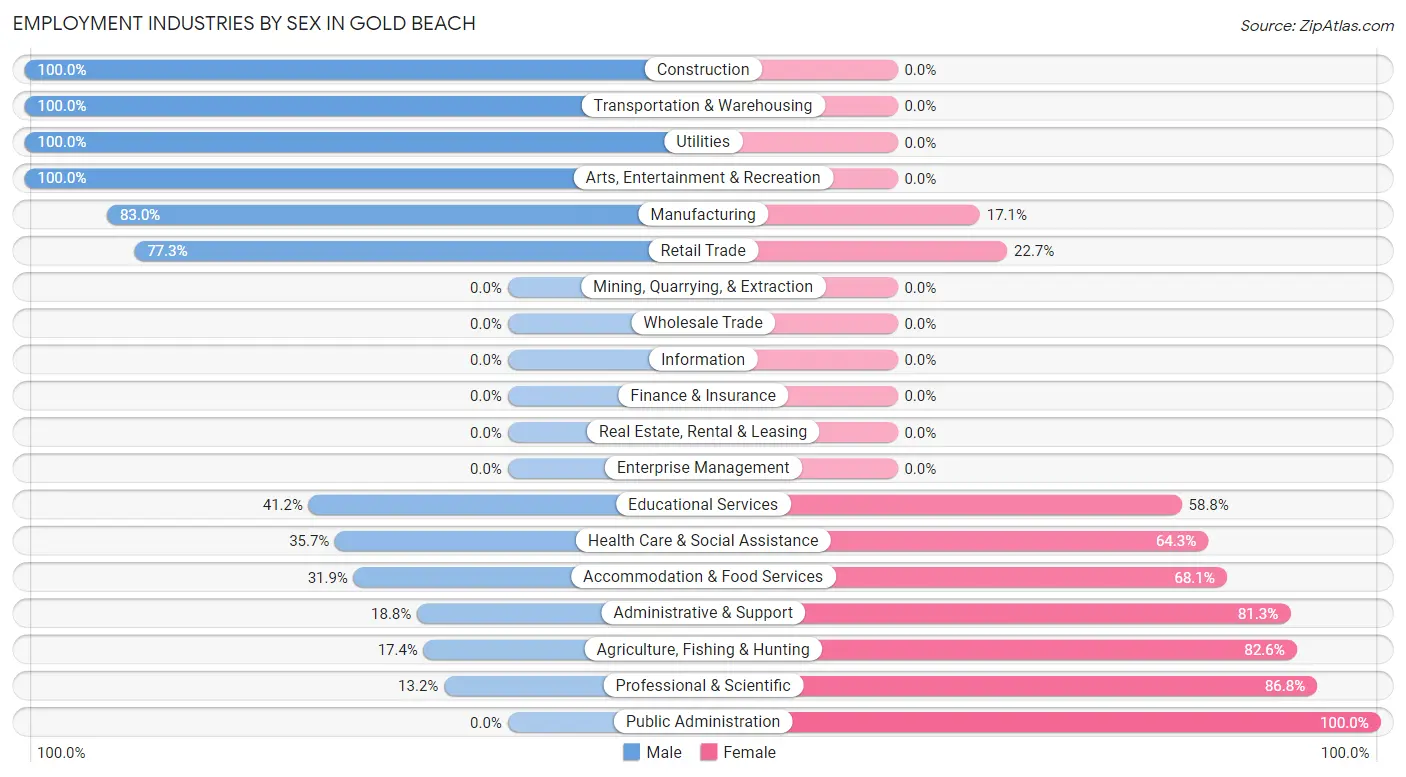
Employment Industries by Sex in Gold Beach
The Gold Beach industries that see more men than women are Construction (100.0%), Transportation & Warehousing (100.0%), and Utilities (100.0%), whereas the industries that tend to have a higher number of women are Public Administration (100.0%), Professional & Scientific (86.8%), and Agriculture, Fishing & Hunting (82.6%).
| Industry | Male | Female |
| Agriculture, Fishing & Hunting | 4 (17.4%) | 19 (82.6%) |
| Mining, Quarrying, & Extraction | 0 (0.0%) | 0 (0.0%) |
| Construction | 100 (100.0%) | 0 (0.0%) |
| Manufacturing | 73 (83.0%) | 15 (17.1%) |
| Wholesale Trade | 0 (0.0%) | 0 (0.0%) |
| Retail Trade | 126 (77.3%) | 37 (22.7%) |
| Transportation & Warehousing | 11 (100.0%) | 0 (0.0%) |
| Utilities | 23 (100.0%) | 0 (0.0%) |
| Information | 0 (0.0%) | 0 (0.0%) |
| Finance & Insurance | 0 (0.0%) | 0 (0.0%) |
| Real Estate, Rental & Leasing | 0 (0.0%) | 0 (0.0%) |
| Professional & Scientific | 5 (13.2%) | 33 (86.8%) |
| Enterprise Management | 0 (0.0%) | 0 (0.0%) |
| Administrative & Support | 18 (18.8%) | 78 (81.2%) |
| Educational Services | 7 (41.2%) | 10 (58.8%) |
| Health Care & Social Assistance | 70 (35.7%) | 126 (64.3%) |
| Arts, Entertainment & Recreation | 1 (100.0%) | 0 (0.0%) |
| Accommodation & Food Services | 51 (31.9%) | 109 (68.1%) |
| Public Administration | 0 (0.0%) | 56 (100.0%) |
| Total | 532 (52.1%) | 489 (47.9%) |
Education in Gold Beach
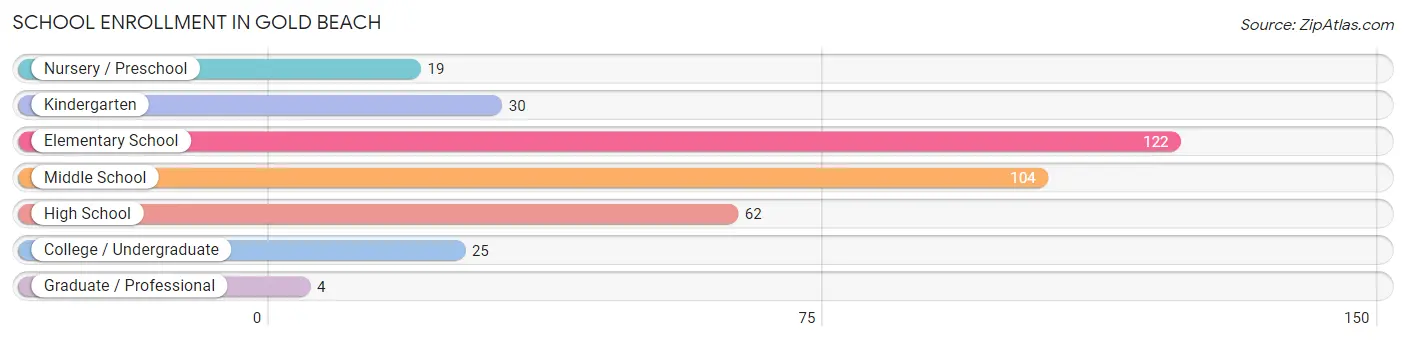
School Enrollment in Gold Beach
The most common levels of schooling among the 366 students in Gold Beach are elementary school (122 | 33.3%), middle school (104 | 28.4%), and high school (62 | 16.9%).
| School Level | # Students | % Students |
| Nursery / Preschool | 19 | 5.2% |
| Kindergarten | 30 | 8.2% |
| Elementary School | 122 | 33.3% |
| Middle School | 104 | 28.4% |
| High School | 62 | 16.9% |
| College / Undergraduate | 25 | 6.8% |
| Graduate / Professional | 4 | 1.1% |
| Total | 366 | 100.0% |
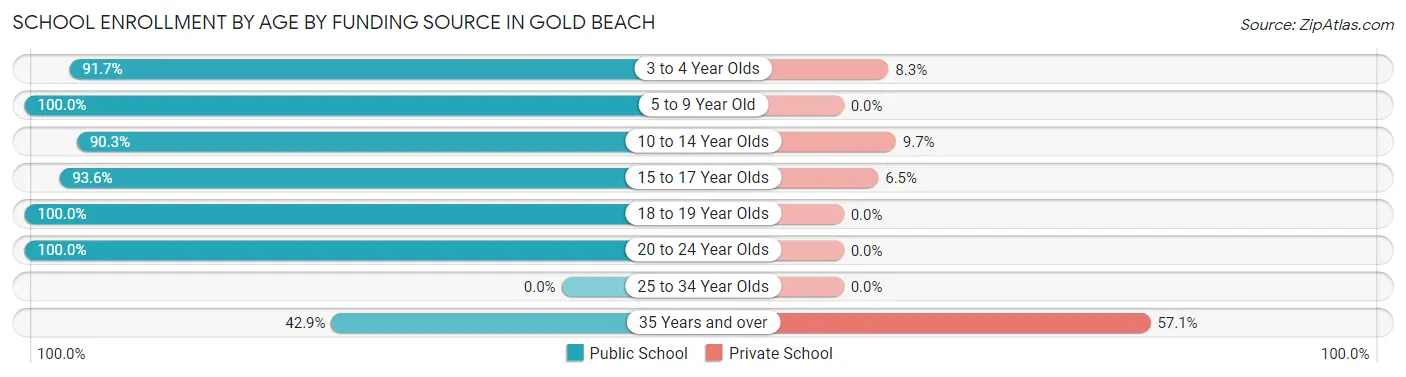
School Enrollment by Age by Funding Source in Gold Beach
Out of a total of 366 students who are enrolled in schools in Gold Beach, 23 (6.3%) attend a private institution, while the remaining 343 (93.7%) are enrolled in public schools. The age group of 35 years and over has the highest likelihood of being enrolled in private schools, with 4 (57.1% in the age bracket) enrolled. Conversely, the age group of 5 to 9 year old has the lowest likelihood of being enrolled in a private school, with 119 (100.0% in the age bracket) attending a public institution.
| Age Bracket | Public School | Private School |
| 3 to 4 Year Olds | 11 (91.7%) | 1 (8.3%) |
| 5 to 9 Year Old | 119 (100.0%) | 0 (0.0%) |
| 10 to 14 Year Olds | 130 (90.3%) | 14 (9.7%) |
| 15 to 17 Year Olds | 58 (93.5%) | 4 (6.5%) |
| 18 to 19 Year Olds | 11 (100.0%) | 0 (0.0%) |
| 20 to 24 Year Olds | 11 (100.0%) | 0 (0.0%) |
| 25 to 34 Year Olds | 0 (0.0%) | 0 (0.0%) |
| 35 Years and over | 3 (42.9%) | 4 (57.1%) |
| Total | 343 (93.7%) | 23 (6.3%) |
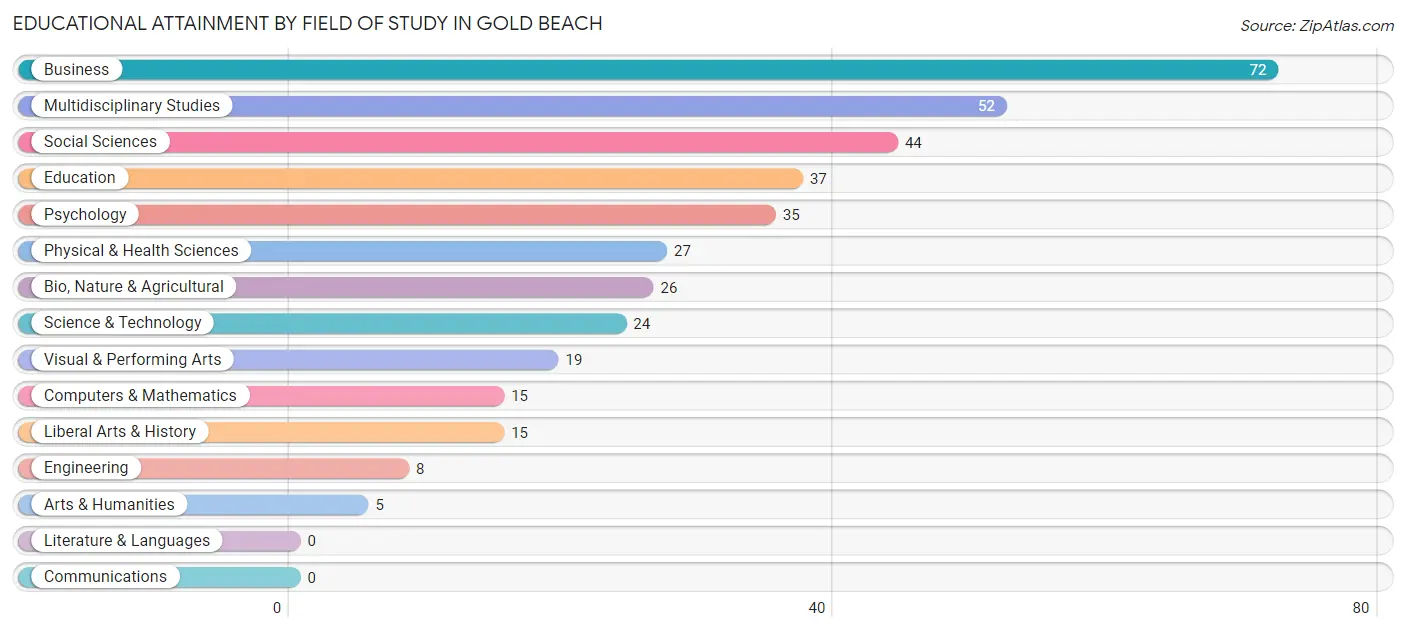
Educational Attainment by Field of Study in Gold Beach
Business (72 | 19.0%), multidisciplinary studies (52 | 13.7%), social sciences (44 | 11.6%), education (37 | 9.8%), and psychology (35 | 9.2%) are the most common fields of study among 379 individuals in Gold Beach who have obtained a bachelor's degree or higher.
| Field of Study | # Graduates | % Graduates |
| Computers & Mathematics | 15 | 4.0% |
| Bio, Nature & Agricultural | 26 | 6.9% |
| Physical & Health Sciences | 27 | 7.1% |
| Psychology | 35 | 9.2% |
| Social Sciences | 44 | 11.6% |
| Engineering | 8 | 2.1% |
| Multidisciplinary Studies | 52 | 13.7% |
| Science & Technology | 24 | 6.3% |
| Business | 72 | 19.0% |
| Education | 37 | 9.8% |
| Literature & Languages | 0 | 0.0% |
| Liberal Arts & History | 15 | 4.0% |
| Visual & Performing Arts | 19 | 5.0% |
| Communications | 0 | 0.0% |
| Arts & Humanities | 5 | 1.3% |
| Total | 379 | 100.0% |
Transportation & Commute in Gold Beach
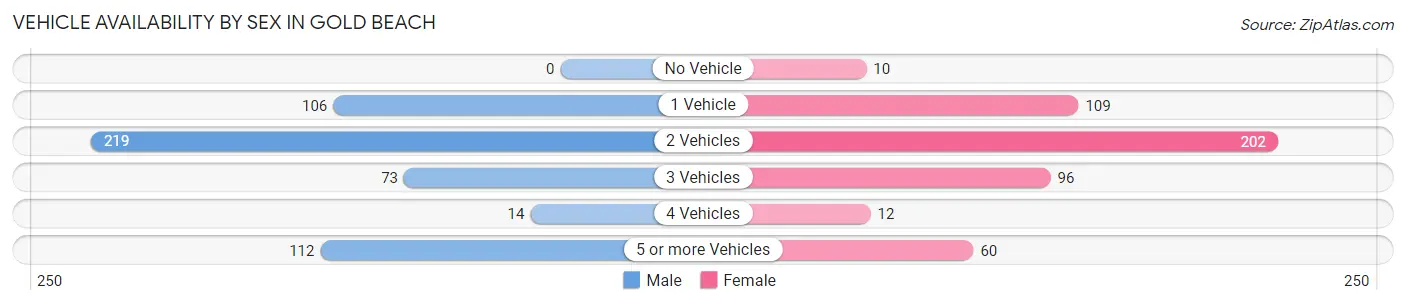
Vehicle Availability by Sex in Gold Beach
The most prevalent vehicle ownership categories in Gold Beach are males with 2 vehicles (219, accounting for 41.8%) and females with 2 vehicles (202, making up 44.8%).
| Vehicles Available | Male | Female |
| No Vehicle | 0 (0.0%) | 10 (2.0%) |
| 1 Vehicle | 106 (20.2%) | 109 (22.3%) |
| 2 Vehicles | 219 (41.8%) | 202 (41.3%) |
| 3 Vehicles | 73 (13.9%) | 96 (19.6%) |
| 4 Vehicles | 14 (2.7%) | 12 (2.5%) |
| 5 or more Vehicles | 112 (21.4%) | 60 (12.3%) |
| Total | 524 (100.0%) | 489 (100.0%) |
Commute Time in Gold Beach
The most frequently occuring commute durations in Gold Beach are 5 to 9 minutes (297 commuters, 34.5%), 10 to 14 minutes (197 commuters, 22.9%), and less than 5 minutes (147 commuters, 17.1%).
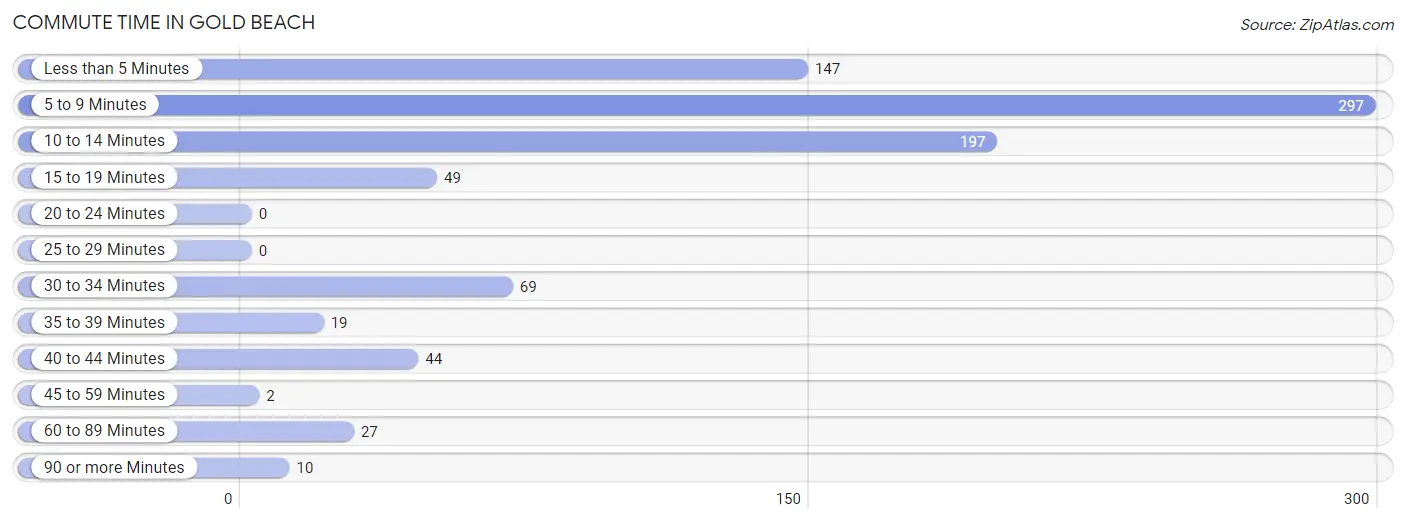
| Commute Time | # Commuters | % Commuters |
| Less than 5 Minutes | 147 | 17.1% |
| 5 to 9 Minutes | 297 | 34.5% |
| 10 to 14 Minutes | 197 | 22.9% |
| 15 to 19 Minutes | 49 | 5.7% |
| 20 to 24 Minutes | 0 | 0.0% |
| 25 to 29 Minutes | 0 | 0.0% |
| 30 to 34 Minutes | 69 | 8.0% |
| 35 to 39 Minutes | 19 | 2.2% |
| 40 to 44 Minutes | 44 | 5.1% |
| 45 to 59 Minutes | 2 | 0.2% |
| 60 to 89 Minutes | 27 | 3.1% |
| 90 or more Minutes | 10 | 1.2% |
Commute Time by Sex in Gold Beach
The most common commute times in Gold Beach are 5 to 9 minutes (145 commuters, 31.7%) for males and 5 to 9 minutes (152 commuters, 37.7%) for females.
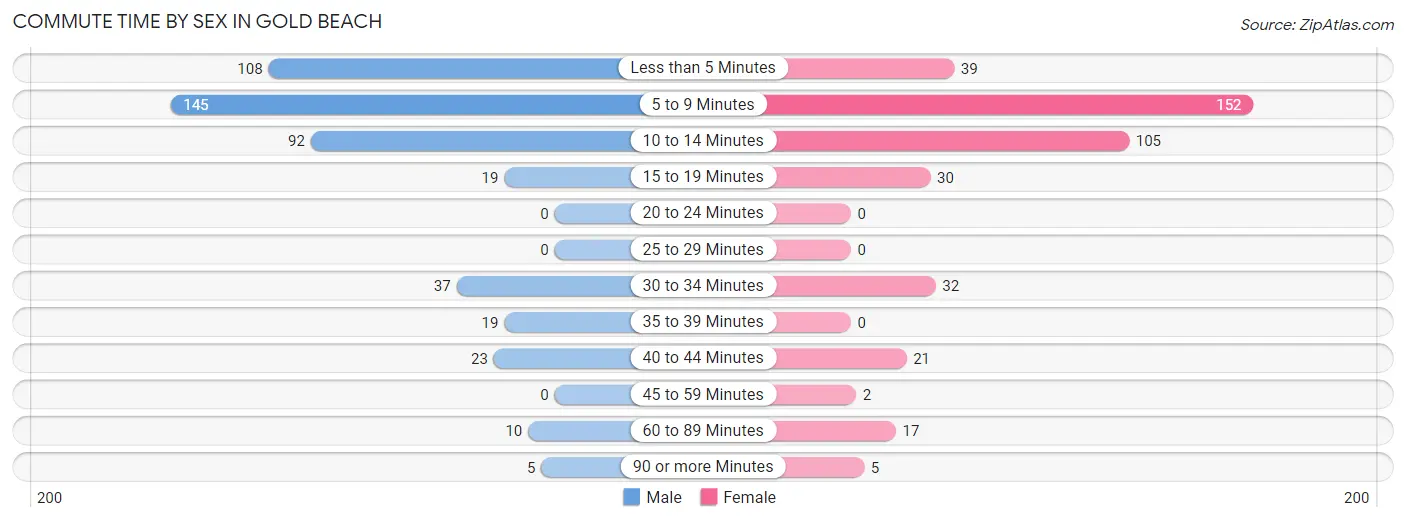
| Commute Time | Male | Female |
| Less than 5 Minutes | 108 (23.6%) | 39 (9.7%) |
| 5 to 9 Minutes | 145 (31.7%) | 152 (37.7%) |
| 10 to 14 Minutes | 92 (20.1%) | 105 (26.1%) |
| 15 to 19 Minutes | 19 (4.2%) | 30 (7.4%) |
| 20 to 24 Minutes | 0 (0.0%) | 0 (0.0%) |
| 25 to 29 Minutes | 0 (0.0%) | 0 (0.0%) |
| 30 to 34 Minutes | 37 (8.1%) | 32 (7.9%) |
| 35 to 39 Minutes | 19 (4.2%) | 0 (0.0%) |
| 40 to 44 Minutes | 23 (5.0%) | 21 (5.2%) |
| 45 to 59 Minutes | 0 (0.0%) | 2 (0.5%) |
| 60 to 89 Minutes | 10 (2.2%) | 17 (4.2%) |
| 90 or more Minutes | 5 (1.1%) | 5 (1.2%) |
Time of Departure to Work by Sex in Gold Beach
The most frequent times of departure to work in Gold Beach are 6:30 AM to 6:59 AM (67, 14.6%) for males and 7:30 AM to 7:59 AM (115, 28.5%) for females.
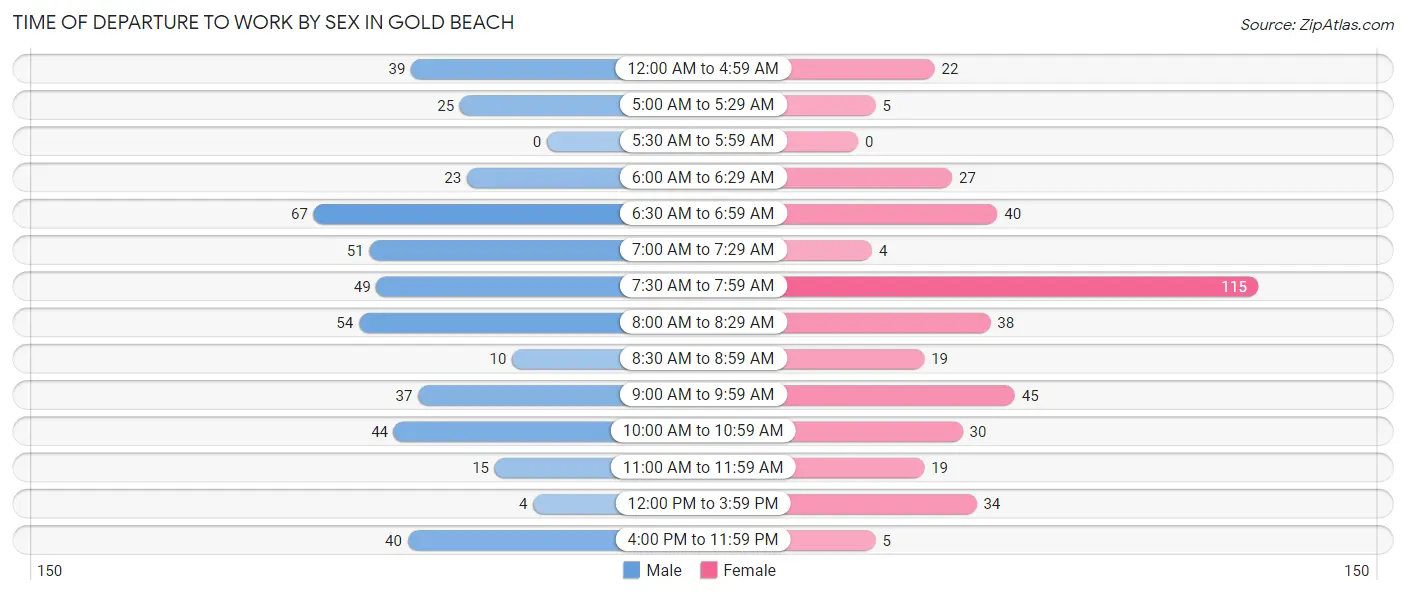
| Time of Departure | Male | Female |
| 12:00 AM to 4:59 AM | 39 (8.5%) | 22 (5.5%) |
| 5:00 AM to 5:29 AM | 25 (5.5%) | 5 (1.2%) |
| 5:30 AM to 5:59 AM | 0 (0.0%) | 0 (0.0%) |
| 6:00 AM to 6:29 AM | 23 (5.0%) | 27 (6.7%) |
| 6:30 AM to 6:59 AM | 67 (14.6%) | 40 (9.9%) |
| 7:00 AM to 7:29 AM | 51 (11.1%) | 4 (1.0%) |
| 7:30 AM to 7:59 AM | 49 (10.7%) | 115 (28.5%) |
| 8:00 AM to 8:29 AM | 54 (11.8%) | 38 (9.4%) |
| 8:30 AM to 8:59 AM | 10 (2.2%) | 19 (4.7%) |
| 9:00 AM to 9:59 AM | 37 (8.1%) | 45 (11.2%) |
| 10:00 AM to 10:59 AM | 44 (9.6%) | 30 (7.4%) |
| 11:00 AM to 11:59 AM | 15 (3.3%) | 19 (4.7%) |
| 12:00 PM to 3:59 PM | 4 (0.9%) | 34 (8.4%) |
| 4:00 PM to 11:59 PM | 40 (8.7%) | 5 (1.2%) |
| Total | 458 (100.0%) | 403 (100.0%) |
Housing Occupancy in Gold Beach
Occupancy by Ownership in Gold Beach
Of the total 1,137 dwellings in Gold Beach, owner-occupied units account for 733 (64.5%), while renter-occupied units make up 404 (35.5%).
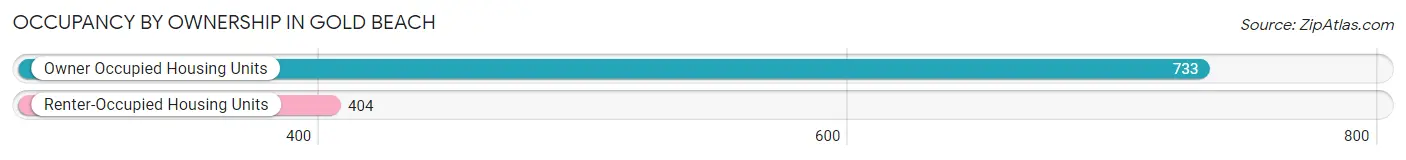
| Occupancy | # Housing Units | % Housing Units |
| Owner Occupied Housing Units | 733 | 64.5% |
| Renter-Occupied Housing Units | 404 | 35.5% |
| Total Occupied Housing Units | 1,137 | 100.0% |
Occupancy by Household Size in Gold Beach
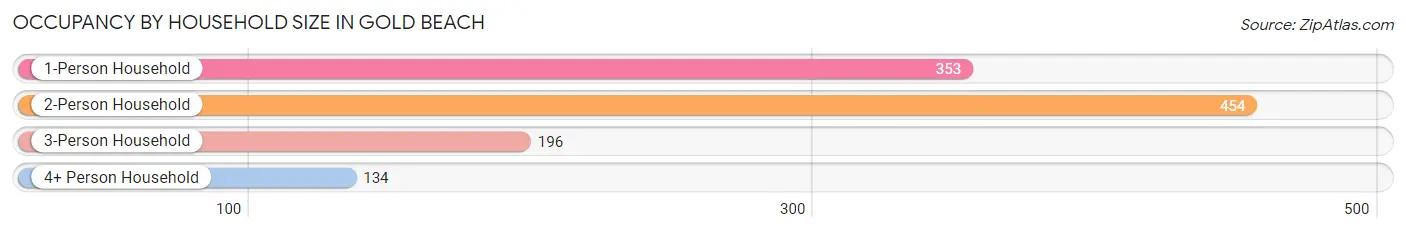
| Household Size | # Housing Units | % Housing Units |
| 1-Person Household | 353 | 31.0% |
| 2-Person Household | 454 | 39.9% |
| 3-Person Household | 196 | 17.2% |
| 4+ Person Household | 134 | 11.8% |
| Total Housing Units | 1,137 | 100.0% |
Occupancy by Ownership by Household Size in Gold Beach
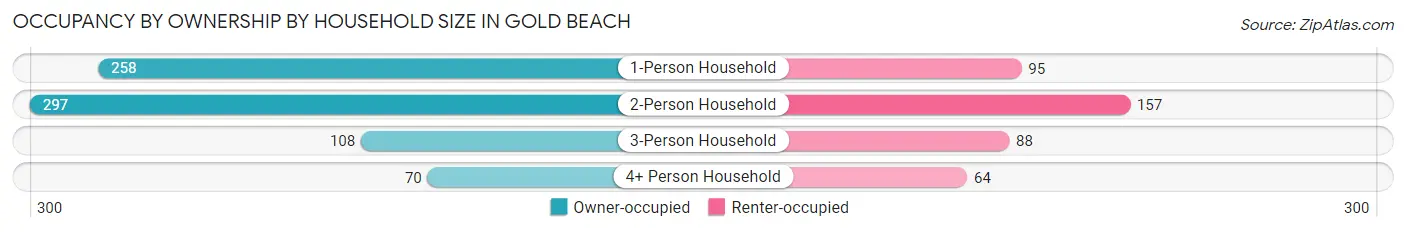
| Household Size | Owner-occupied | Renter-occupied |
| 1-Person Household | 258 (73.1%) | 95 (26.9%) |
| 2-Person Household | 297 (65.4%) | 157 (34.6%) |
| 3-Person Household | 108 (55.1%) | 88 (44.9%) |
| 4+ Person Household | 70 (52.2%) | 64 (47.8%) |
| Total Housing Units | 733 (64.5%) | 404 (35.5%) |
Occupancy by Educational Attainment in Gold Beach
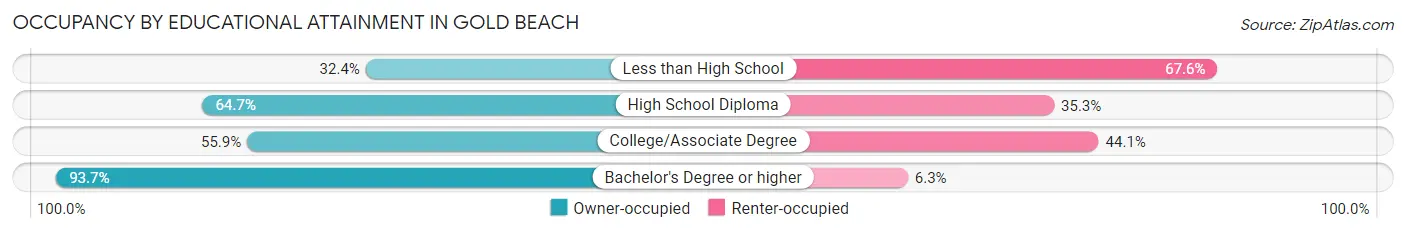
| Household Size | Owner-occupied | Renter-occupied |
| Less than High School | 34 (32.4%) | 71 (67.6%) |
| High School Diploma | 233 (64.7%) | 127 (35.3%) |
| College/Associate Degree | 242 (55.9%) | 191 (44.1%) |
| Bachelor's Degree or higher | 224 (93.7%) | 15 (6.3%) |
Occupancy by Age of Householder in Gold Beach
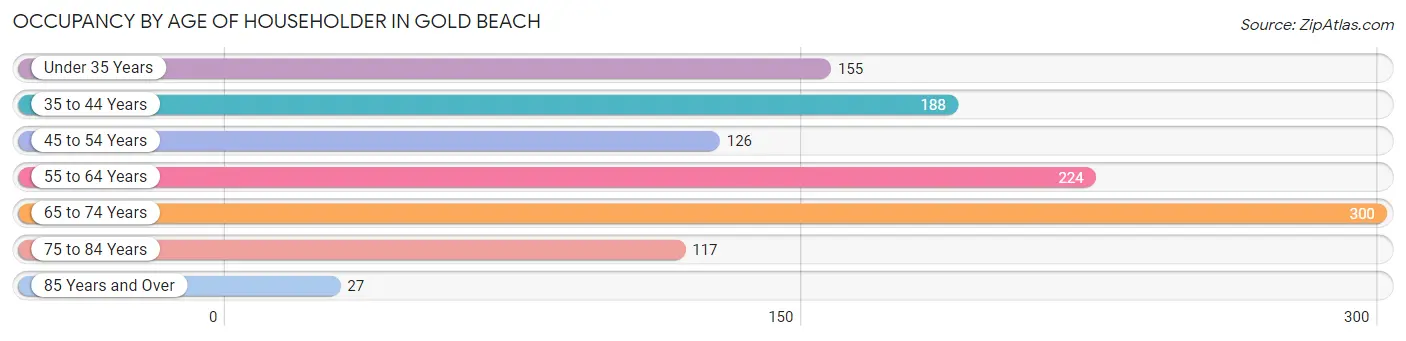
| Age Bracket | # Households | % Households |
| Under 35 Years | 155 | 13.6% |
| 35 to 44 Years | 188 | 16.5% |
| 45 to 54 Years | 126 | 11.1% |
| 55 to 64 Years | 224 | 19.7% |
| 65 to 74 Years | 300 | 26.4% |
| 75 to 84 Years | 117 | 10.3% |
| 85 Years and Over | 27 | 2.4% |
| Total | 1,137 | 100.0% |
Housing Finances in Gold Beach
Median Income by Occupancy in Gold Beach
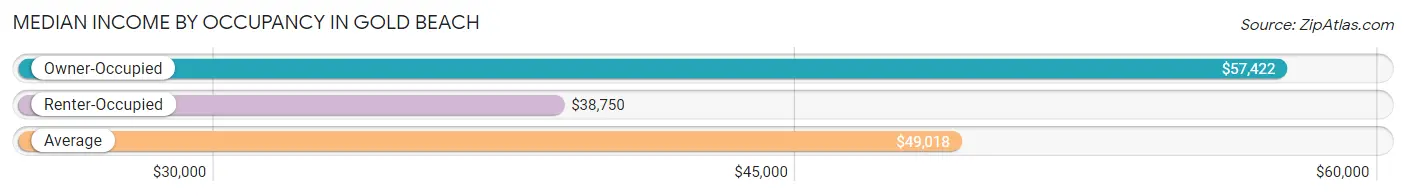
| Occupancy Type | # Households | Median Income |
| Owner-Occupied | 733 (64.5%) | $57,422 |
| Renter-Occupied | 404 (35.5%) | $38,750 |
| Average | 1,137 (100.0%) | $49,018 |
Occupancy by Householder Income Bracket in Gold Beach
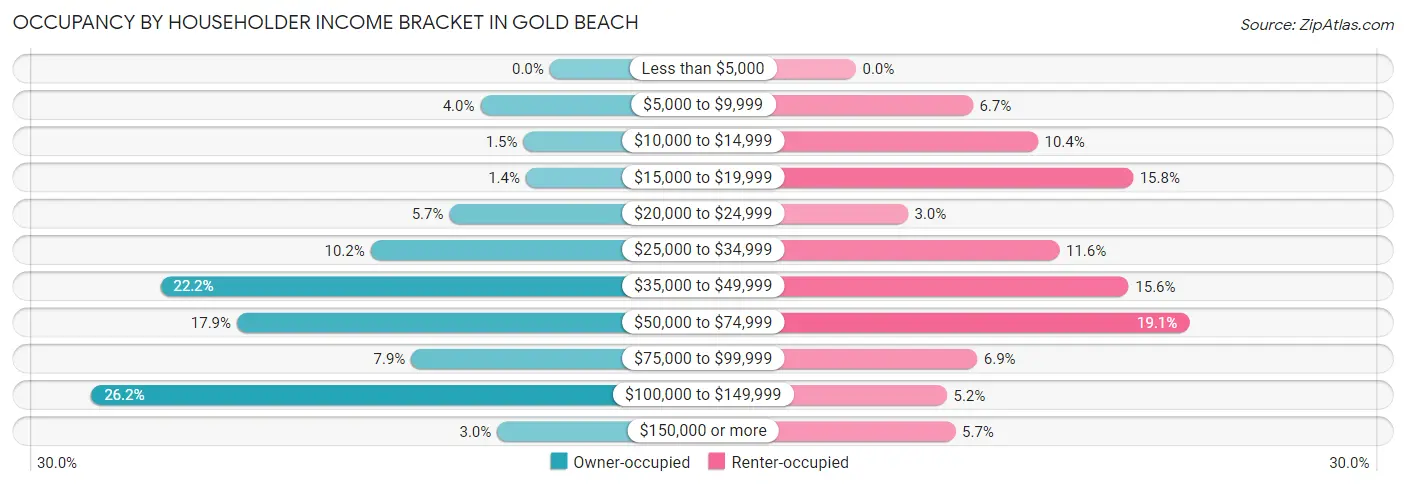
| Income Bracket | Owner-occupied | Renter-occupied |
| Less than $5,000 | 0 (0.0%) | 0 (0.0%) |
| $5,000 to $9,999 | 29 (4.0%) | 27 (6.7%) |
| $10,000 to $14,999 | 11 (1.5%) | 42 (10.4%) |
| $15,000 to $19,999 | 10 (1.4%) | 64 (15.8%) |
| $20,000 to $24,999 | 42 (5.7%) | 12 (3.0%) |
| $25,000 to $34,999 | 75 (10.2%) | 47 (11.6%) |
| $35,000 to $49,999 | 163 (22.2%) | 63 (15.6%) |
| $50,000 to $74,999 | 131 (17.9%) | 77 (19.1%) |
| $75,000 to $99,999 | 58 (7.9%) | 28 (6.9%) |
| $100,000 to $149,999 | 192 (26.2%) | 21 (5.2%) |
| $150,000 or more | 22 (3.0%) | 23 (5.7%) |
| Total | 733 (100.0%) | 404 (100.0%) |
Monthly Housing Cost Tiers in Gold Beach
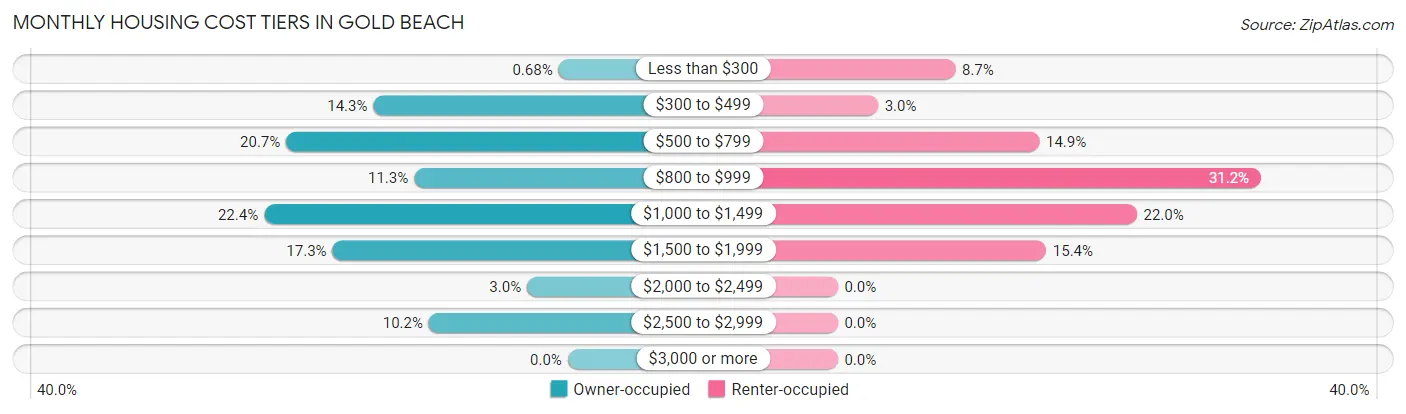
| Monthly Cost | Owner-occupied | Renter-occupied |
| Less than $300 | 5 (0.7%) | 35 (8.7%) |
| $300 to $499 | 105 (14.3%) | 12 (3.0%) |
| $500 to $799 | 152 (20.7%) | 60 (14.8%) |
| $800 to $999 | 83 (11.3%) | 126 (31.2%) |
| $1,000 to $1,499 | 164 (22.4%) | 89 (22.0%) |
| $1,500 to $1,999 | 127 (17.3%) | 62 (15.3%) |
| $2,000 to $2,499 | 22 (3.0%) | 0 (0.0%) |
| $2,500 to $2,999 | 75 (10.2%) | 0 (0.0%) |
| $3,000 or more | 0 (0.0%) | 0 (0.0%) |
| Total | 733 (100.0%) | 404 (100.0%) |
Physical Housing Characteristics in Gold Beach
Housing Structures in Gold Beach
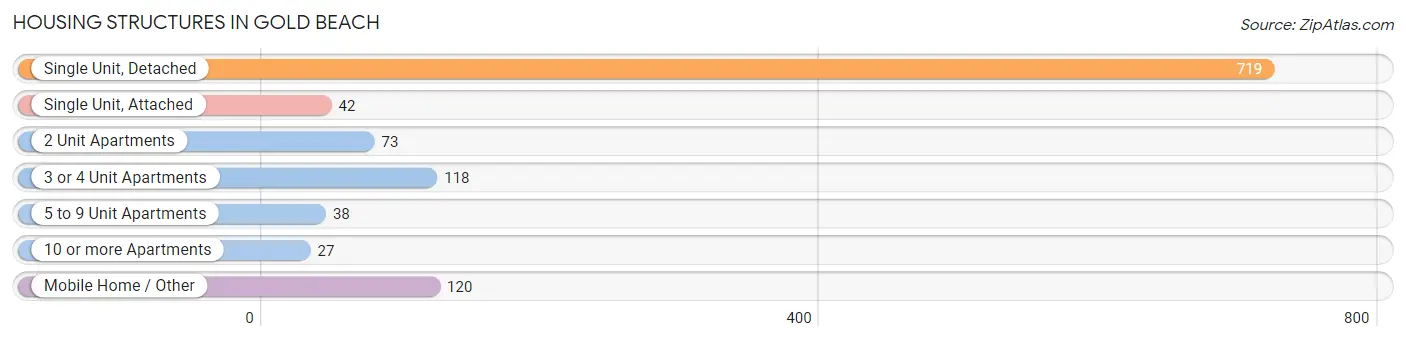
| Structure Type | # Housing Units | % Housing Units |
| Single Unit, Detached | 719 | 63.2% |
| Single Unit, Attached | 42 | 3.7% |
| 2 Unit Apartments | 73 | 6.4% |
| 3 or 4 Unit Apartments | 118 | 10.4% |
| 5 to 9 Unit Apartments | 38 | 3.3% |
| 10 or more Apartments | 27 | 2.4% |
| Mobile Home / Other | 120 | 10.5% |
| Total | 1,137 | 100.0% |
Housing Structures by Occupancy in Gold Beach
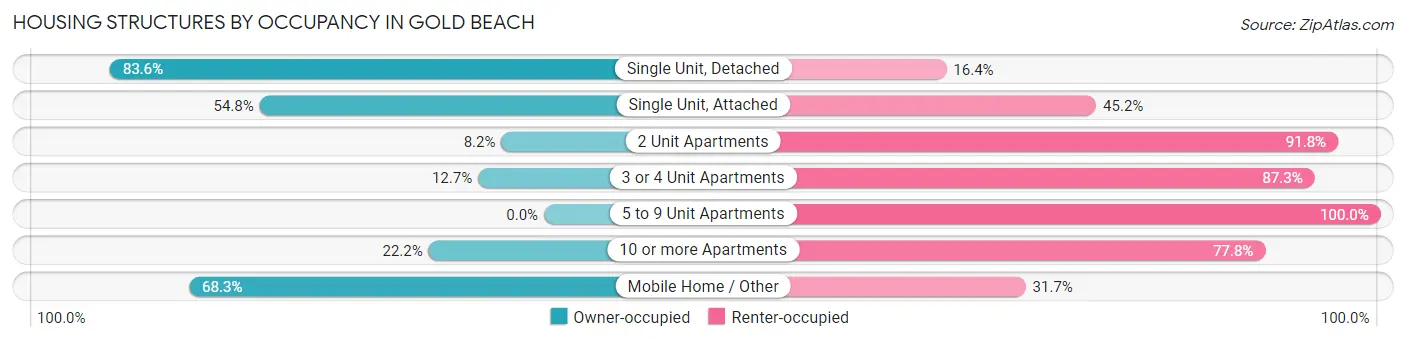
| Structure Type | Owner-occupied | Renter-occupied |
| Single Unit, Detached | 601 (83.6%) | 118 (16.4%) |
| Single Unit, Attached | 23 (54.8%) | 19 (45.2%) |
| 2 Unit Apartments | 6 (8.2%) | 67 (91.8%) |
| 3 or 4 Unit Apartments | 15 (12.7%) | 103 (87.3%) |
| 5 to 9 Unit Apartments | 0 (0.0%) | 38 (100.0%) |
| 10 or more Apartments | 6 (22.2%) | 21 (77.8%) |
| Mobile Home / Other | 82 (68.3%) | 38 (31.7%) |
| Total | 733 (64.5%) | 404 (35.5%) |
Housing Structures by Number of Rooms in Gold Beach
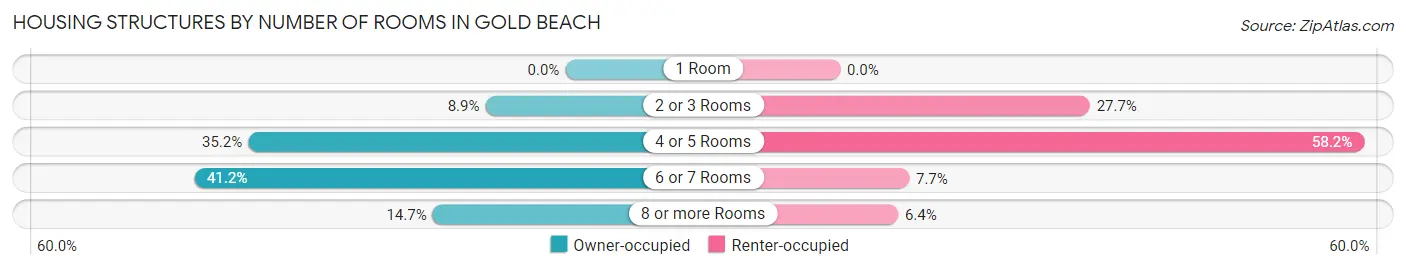
| Number of Rooms | Owner-occupied | Renter-occupied |
| 1 Room | 0 (0.0%) | 0 (0.0%) |
| 2 or 3 Rooms | 65 (8.9%) | 112 (27.7%) |
| 4 or 5 Rooms | 258 (35.2%) | 235 (58.2%) |
| 6 or 7 Rooms | 302 (41.2%) | 31 (7.7%) |
| 8 or more Rooms | 108 (14.7%) | 26 (6.4%) |
| Total | 733 (100.0%) | 404 (100.0%) |
Housing Structure by Heating Type in Gold Beach
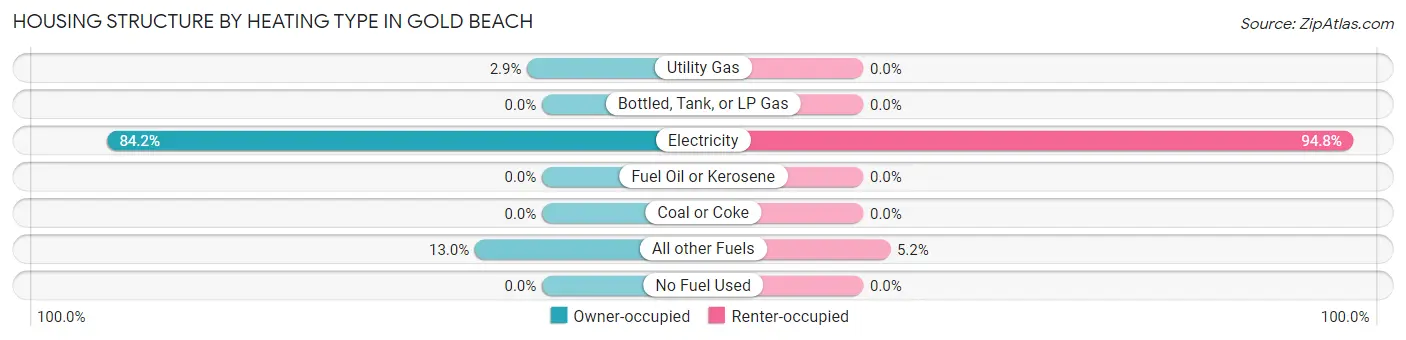
| Heating Type | Owner-occupied | Renter-occupied |
| Utility Gas | 21 (2.9%) | 0 (0.0%) |
| Bottled, Tank, or LP Gas | 0 (0.0%) | 0 (0.0%) |
| Electricity | 617 (84.2%) | 383 (94.8%) |
| Fuel Oil or Kerosene | 0 (0.0%) | 0 (0.0%) |
| Coal or Coke | 0 (0.0%) | 0 (0.0%) |
| All other Fuels | 95 (13.0%) | 21 (5.2%) |
| No Fuel Used | 0 (0.0%) | 0 (0.0%) |
| Total | 733 (100.0%) | 404 (100.0%) |
Household Vehicle Usage in Gold Beach
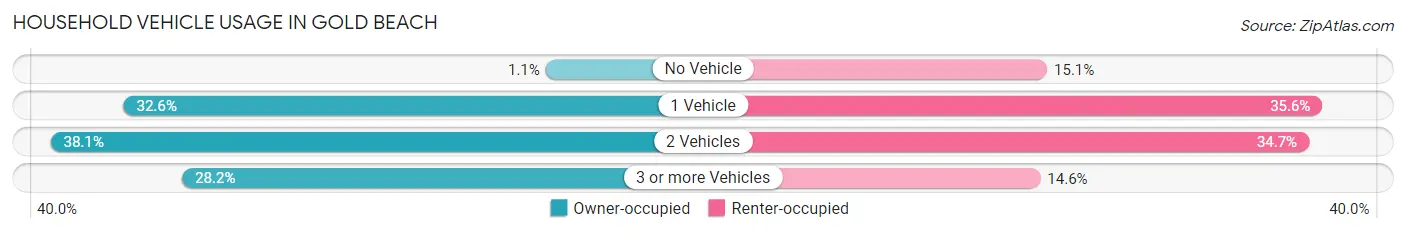
| Vehicles per Household | Owner-occupied | Renter-occupied |
| No Vehicle | 8 (1.1%) | 61 (15.1%) |
| 1 Vehicle | 239 (32.6%) | 144 (35.6%) |
| 2 Vehicles | 279 (38.1%) | 140 (34.6%) |
| 3 or more Vehicles | 207 (28.2%) | 59 (14.6%) |
| Total | 733 (100.0%) | 404 (100.0%) |
Real Estate & Mortgages in Gold Beach
Real Estate and Mortgage Overview in Gold Beach
| Characteristic | Without Mortgage | With Mortgage |
| Housing Units | 258 | 475 |
| Median Property Value | $332,300 | $353,200 |
| Median Household Income | $44,625 | $17 |
| Monthly Housing Costs | $551 | $0 |
| Real Estate Taxes | $1,592 | $5 |
Property Value by Mortgage Status in Gold Beach
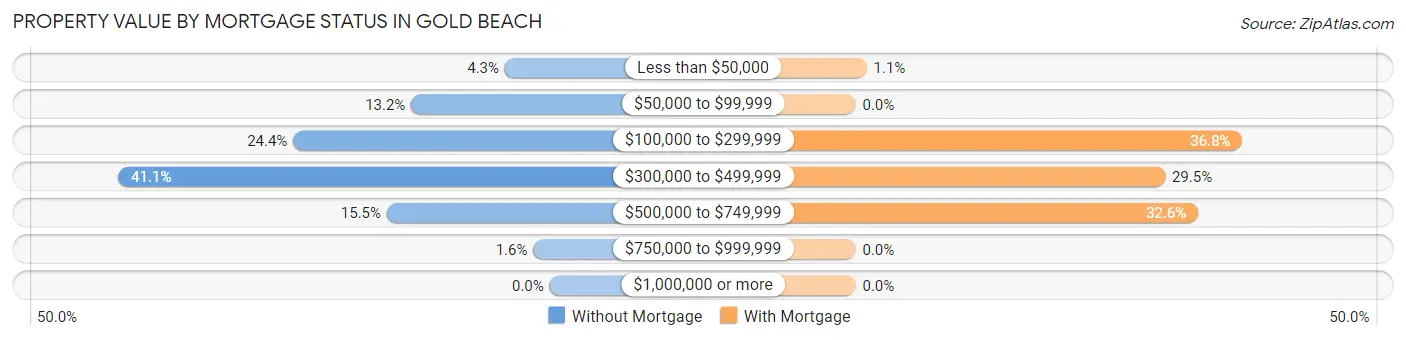
| Property Value | Without Mortgage | With Mortgage |
| Less than $50,000 | 11 (4.3%) | 5 (1.1%) |
| $50,000 to $99,999 | 34 (13.2%) | 0 (0.0%) |
| $100,000 to $299,999 | 63 (24.4%) | 175 (36.8%) |
| $300,000 to $499,999 | 106 (41.1%) | 140 (29.5%) |
| $500,000 to $749,999 | 40 (15.5%) | 155 (32.6%) |
| $750,000 to $999,999 | 4 (1.5%) | 0 (0.0%) |
| $1,000,000 or more | 0 (0.0%) | 0 (0.0%) |
| Total | 258 (100.0%) | 475 (100.0%) |
Household Income by Mortgage Status in Gold Beach
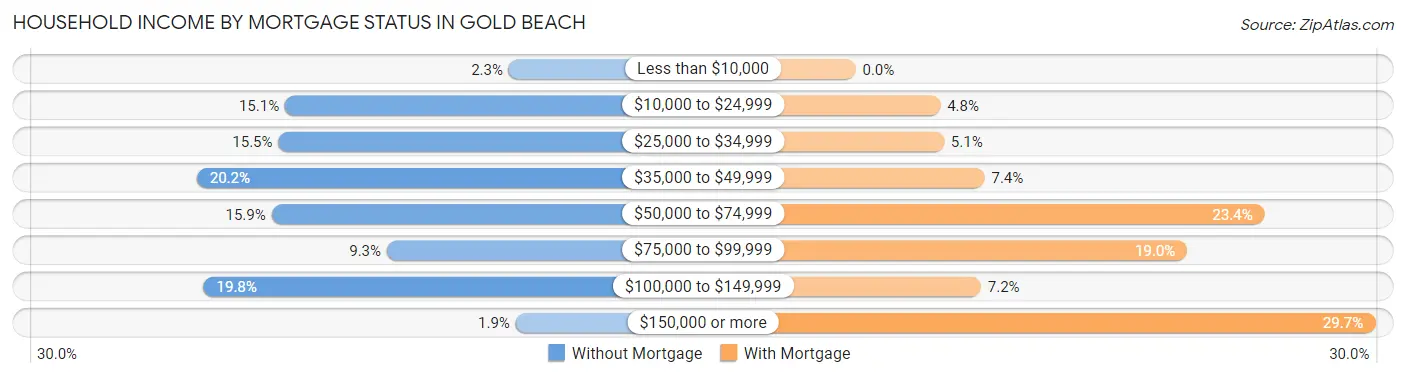
| Household Income | Without Mortgage | With Mortgage |
| Less than $10,000 | 6 (2.3%) | 0 (0.0%) |
| $10,000 to $24,999 | 39 (15.1%) | 23 (4.8%) |
| $25,000 to $34,999 | 40 (15.5%) | 24 (5.1%) |
| $35,000 to $49,999 | 52 (20.2%) | 35 (7.4%) |
| $50,000 to $74,999 | 41 (15.9%) | 111 (23.4%) |
| $75,000 to $99,999 | 24 (9.3%) | 90 (19.0%) |
| $100,000 to $149,999 | 51 (19.8%) | 34 (7.2%) |
| $150,000 or more | 5 (1.9%) | 141 (29.7%) |
| Total | 258 (100.0%) | 475 (100.0%) |
Property Value to Household Income Ratio in Gold Beach
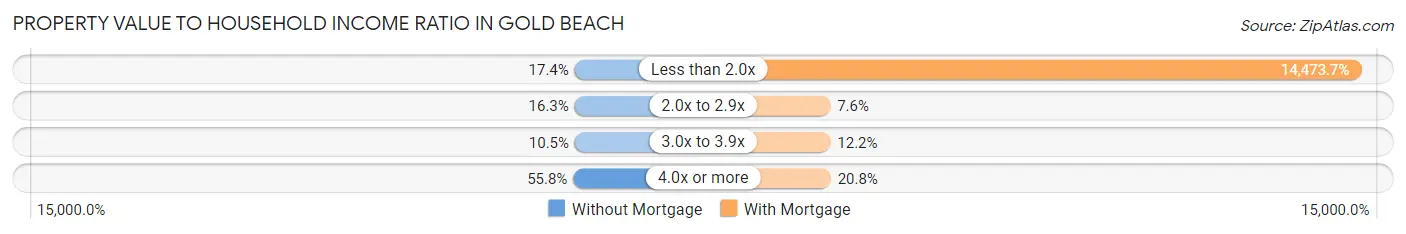
| Value-to-Income Ratio | Without Mortgage | With Mortgage |
| Less than 2.0x | 45 (17.4%) | 68,750 (14,473.7%) |
| 2.0x to 2.9x | 42 (16.3%) | 36 (7.6%) |
| 3.0x to 3.9x | 27 (10.5%) | 58 (12.2%) |
| 4.0x or more | 144 (55.8%) | 99 (20.8%) |
| Total | 258 (100.0%) | 475 (100.0%) |
Real Estate Taxes by Mortgage Status in Gold Beach
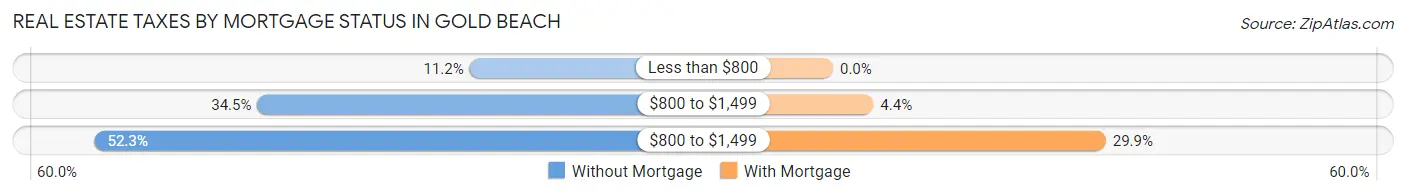
| Property Taxes | Without Mortgage | With Mortgage |
| Less than $800 | 29 (11.2%) | 0 (0.0%) |
| $800 to $1,499 | 89 (34.5%) | 21 (4.4%) |
| $800 to $1,499 | 135 (52.3%) | 142 (29.9%) |
| Total | 258 (100.0%) | 475 (100.0%) |
Health & Disability in Gold Beach
Health Insurance Coverage by Age in Gold Beach
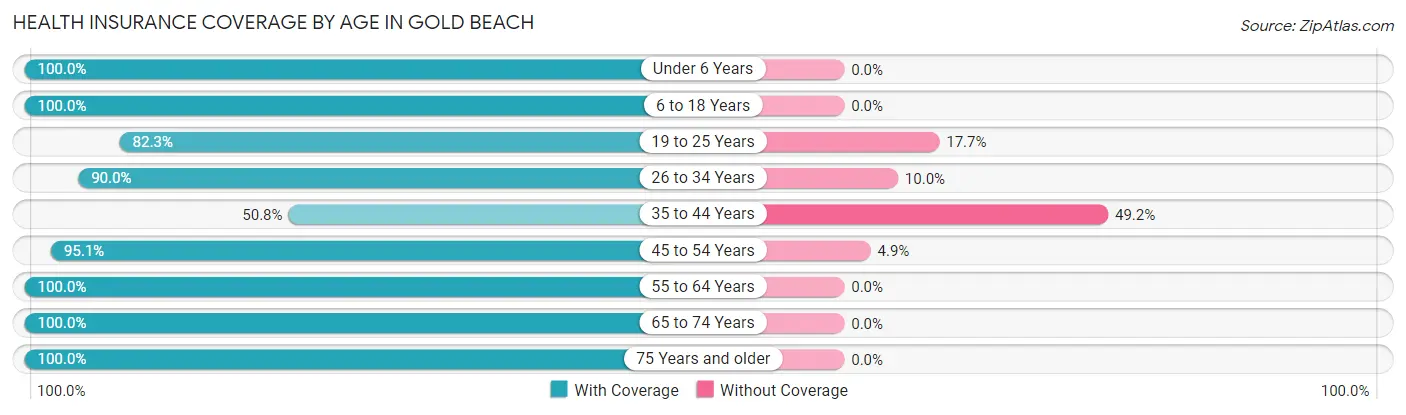
| Age Bracket | With Coverage | Without Coverage |
| Under 6 Years | 64 (100.0%) | 0 (0.0%) |
| 6 to 18 Years | 372 (100.0%) | 0 (0.0%) |
| 19 to 25 Years | 130 (82.3%) | 28 (17.7%) |
| 26 to 34 Years | 225 (90.0%) | 25 (10.0%) |
| 35 to 44 Years | 156 (50.8%) | 151 (49.2%) |
| 45 to 54 Years | 271 (95.1%) | 14 (4.9%) |
| 55 to 64 Years | 377 (100.0%) | 0 (0.0%) |
| 65 to 74 Years | 431 (100.0%) | 0 (0.0%) |
| 75 Years and older | 257 (100.0%) | 0 (0.0%) |
| Total | 2,283 (91.3%) | 218 (8.7%) |
Health Insurance Coverage by Citizenship Status in Gold Beach
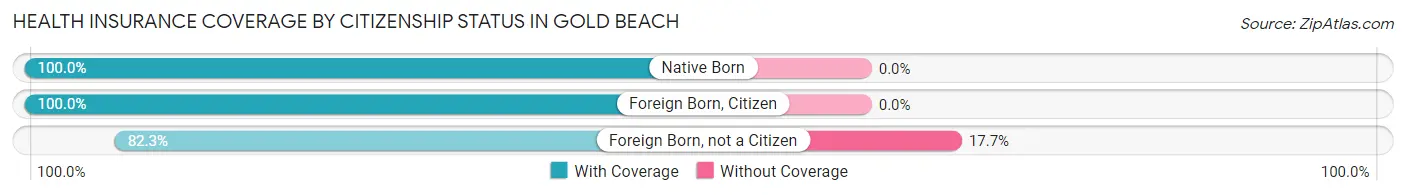
| Citizenship Status | With Coverage | Without Coverage |
| Native Born | 64 (100.0%) | 0 (0.0%) |
| Foreign Born, Citizen | 372 (100.0%) | 0 (0.0%) |
| Foreign Born, not a Citizen | 130 (82.3%) | 28 (17.7%) |
Health Insurance Coverage by Household Income in Gold Beach
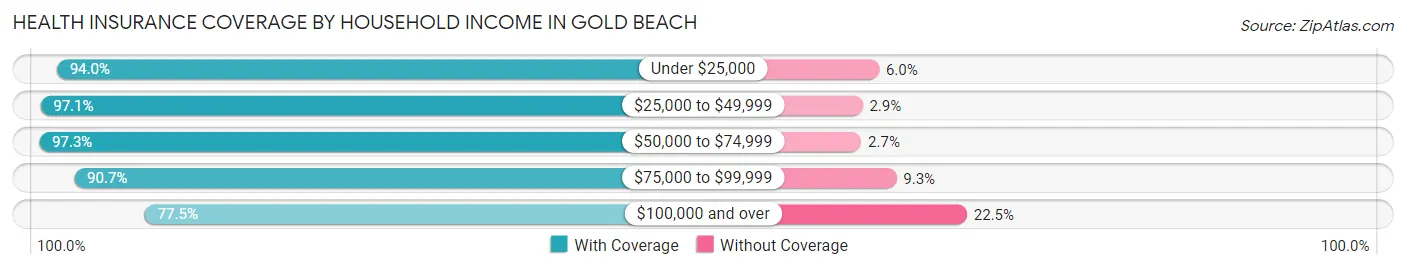
| Household Income | With Coverage | Without Coverage |
| Under $25,000 | 359 (94.0%) | 23 (6.0%) |
| $25,000 to $49,999 | 694 (97.1%) | 21 (2.9%) |
| $50,000 to $74,999 | 506 (97.3%) | 14 (2.7%) |
| $75,000 to $99,999 | 244 (90.7%) | 25 (9.3%) |
| $100,000 and over | 465 (77.5%) | 135 (22.5%) |
Public vs Private Health Insurance Coverage by Age in Gold Beach
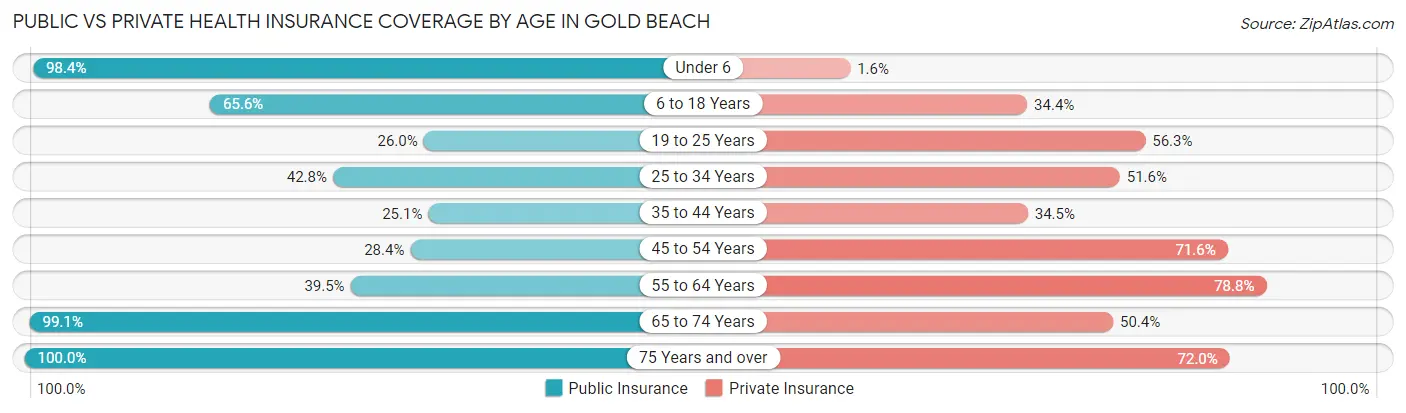
| Age Bracket | Public Insurance | Private Insurance |
| Under 6 | 63 (98.4%) | 1 (1.6%) |
| 6 to 18 Years | 244 (65.6%) | 128 (34.4%) |
| 19 to 25 Years | 41 (26.0%) | 89 (56.3%) |
| 25 to 34 Years | 107 (42.8%) | 129 (51.6%) |
| 35 to 44 Years | 77 (25.1%) | 106 (34.5%) |
| 45 to 54 Years | 81 (28.4%) | 204 (71.6%) |
| 55 to 64 Years | 149 (39.5%) | 297 (78.8%) |
| 65 to 74 Years | 427 (99.1%) | 217 (50.3%) |
| 75 Years and over | 257 (100.0%) | 185 (72.0%) |
| Total | 1,446 (57.8%) | 1,356 (54.2%) |
Disability Status by Sex by Age in Gold Beach
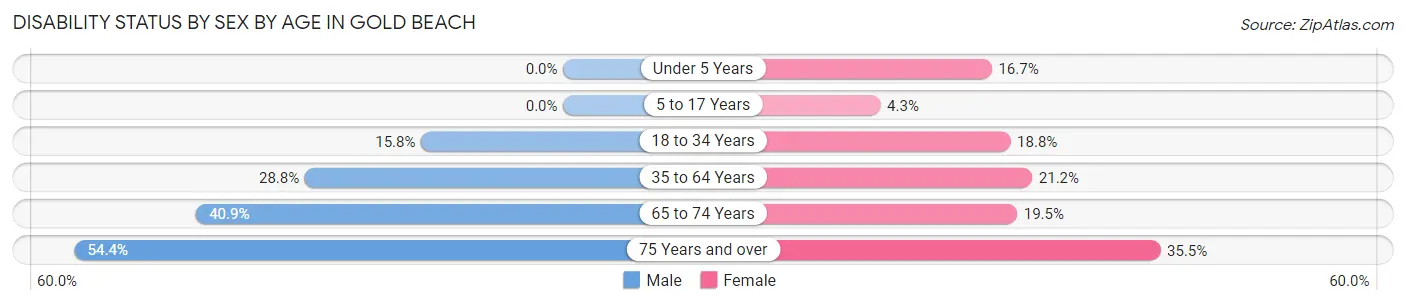
| Age Bracket | Male | Female |
| Under 5 Years | 0 (0.0%) | 7 (16.7%) |
| 5 to 17 Years | 0 (0.0%) | 7 (4.3%) |
| 18 to 34 Years | 31 (15.8%) | 48 (18.8%) |
| 35 to 64 Years | 166 (28.8%) | 83 (21.2%) |
| 65 to 74 Years | 65 (40.9%) | 53 (19.5%) |
| 75 Years and over | 80 (54.4%) | 39 (35.4%) |
Disability Class by Sex by Age in Gold Beach
Disability Class: Hearing Difficulty
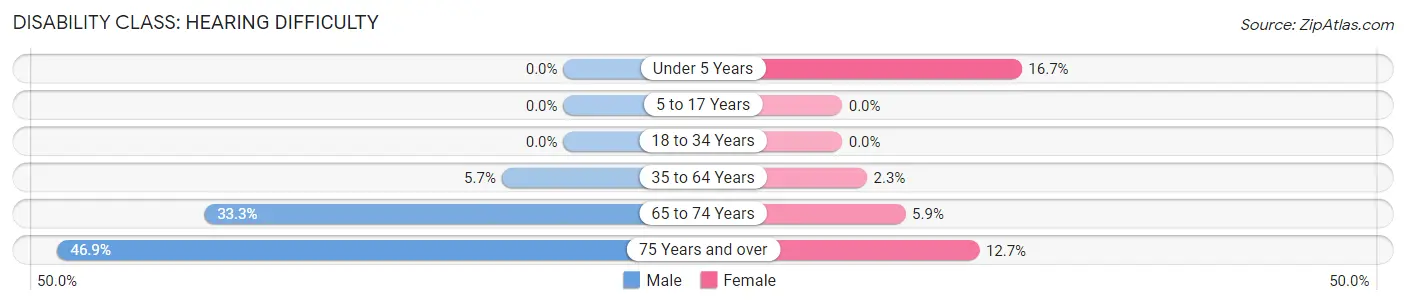
| Age Bracket | Male | Female |
| Under 5 Years | 0 (0.0%) | 7 (16.7%) |
| 5 to 17 Years | 0 (0.0%) | 0 (0.0%) |
| 18 to 34 Years | 0 (0.0%) | 0 (0.0%) |
| 35 to 64 Years | 33 (5.7%) | 9 (2.3%) |
| 65 to 74 Years | 53 (33.3%) | 16 (5.9%) |
| 75 Years and over | 69 (46.9%) | 14 (12.7%) |
Disability Class: Vision Difficulty
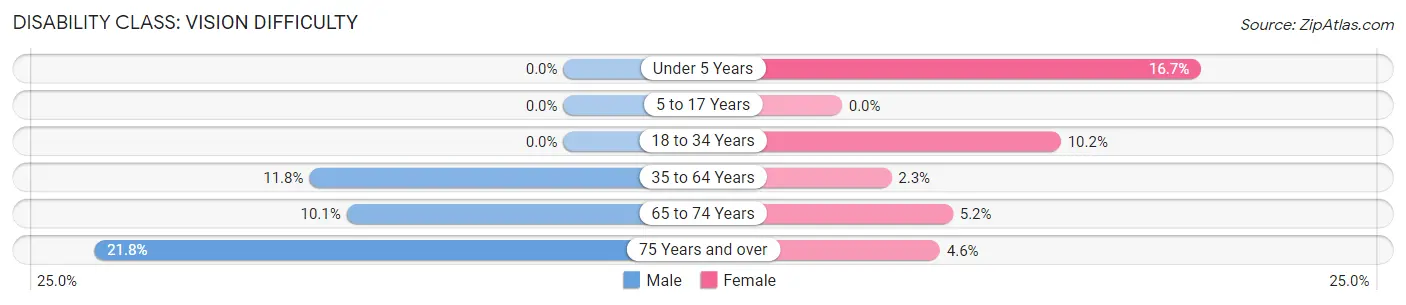
| Age Bracket | Male | Female |
| Under 5 Years | 0 (0.0%) | 7 (16.7%) |
| 5 to 17 Years | 0 (0.0%) | 0 (0.0%) |
| 18 to 34 Years | 0 (0.0%) | 26 (10.2%) |
| 35 to 64 Years | 68 (11.8%) | 9 (2.3%) |
| 65 to 74 Years | 16 (10.1%) | 14 (5.1%) |
| 75 Years and over | 32 (21.8%) | 5 (4.5%) |
Disability Class: Cognitive Difficulty
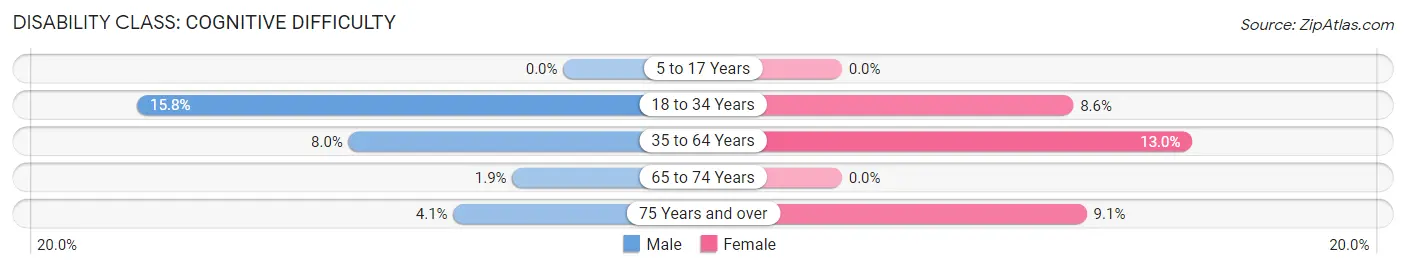
| Age Bracket | Male | Female |
| 5 to 17 Years | 0 (0.0%) | 0 (0.0%) |
| 18 to 34 Years | 31 (15.8%) | 22 (8.6%) |
| 35 to 64 Years | 46 (8.0%) | 51 (13.0%) |
| 65 to 74 Years | 3 (1.9%) | 0 (0.0%) |
| 75 Years and over | 6 (4.1%) | 10 (9.1%) |
Disability Class: Ambulatory Difficulty
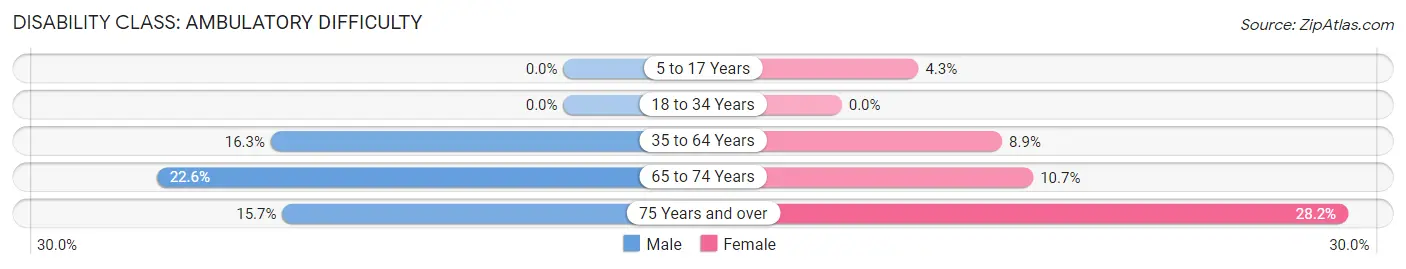
| Age Bracket | Male | Female |
| 5 to 17 Years | 0 (0.0%) | 7 (4.3%) |
| 18 to 34 Years | 0 (0.0%) | 0 (0.0%) |
| 35 to 64 Years | 94 (16.3%) | 35 (8.9%) |
| 65 to 74 Years | 36 (22.6%) | 29 (10.7%) |
| 75 Years and over | 23 (15.7%) | 31 (28.2%) |
Disability Class: Self-Care Difficulty
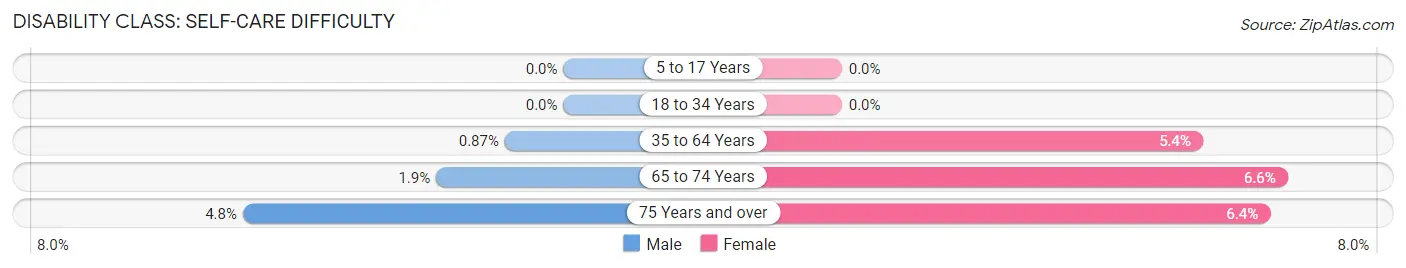
| Age Bracket | Male | Female |
| 5 to 17 Years | 0 (0.0%) | 0 (0.0%) |
| 18 to 34 Years | 0 (0.0%) | 0 (0.0%) |
| 35 to 64 Years | 5 (0.9%) | 21 (5.4%) |
| 65 to 74 Years | 3 (1.9%) | 18 (6.6%) |
| 75 Years and over | 7 (4.8%) | 7 (6.4%) |
Technology Access in Gold Beach
Computing Device Access in Gold Beach
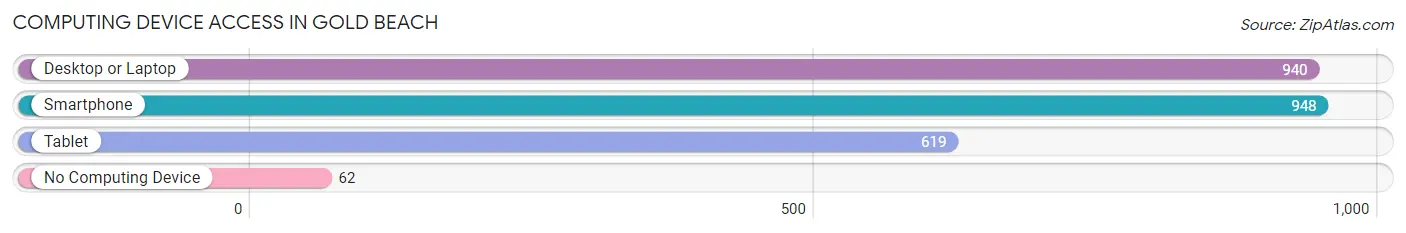
| Device Type | # Households | % Households |
| Desktop or Laptop | 940 | 82.7% |
| Smartphone | 948 | 83.4% |
| Tablet | 619 | 54.4% |
| No Computing Device | 62 | 5.4% |
| Total | 1,137 | 100.0% |
Internet Access in Gold Beach
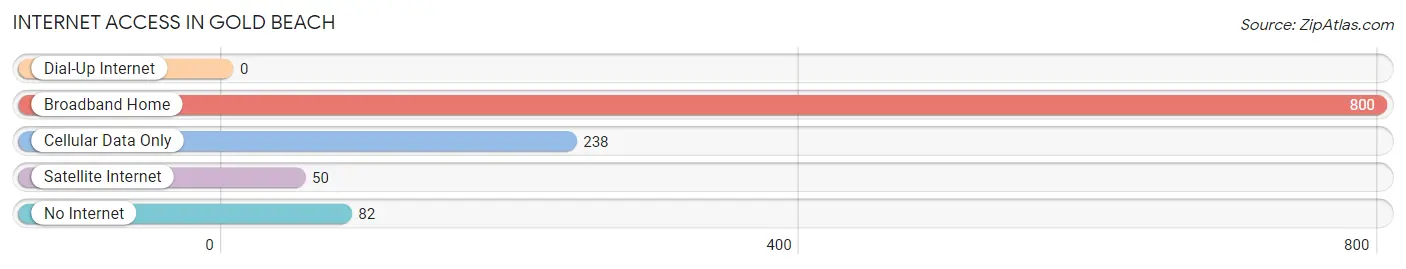
| Internet Type | # Households | % Households |
| Dial-Up Internet | 0 | 0.0% |
| Broadband Home | 800 | 70.4% |
| Cellular Data Only | 238 | 20.9% |
| Satellite Internet | 50 | 4.4% |
| No Internet | 82 | 7.2% |
| Total | 1,137 | 100.0% |
Gold Beach Summary
Gold Beach is a small city located in Curry County, Oregon, United States. It is situated on the Pacific Ocean, at the mouth of the Rogue River, approximately 80 miles (130 km) south of the Oregon-California border. The population was 2,253 at the 2010 census.
History
Gold Beach was founded in 1852 by a group of prospectors who were searching for gold in the area. The town was originally called Ellensburg, but was later renamed Gold Beach in 1859. The name was chosen to reflect the gold that was found in the nearby Rogue River.
The town was incorporated in 1891 and has since grown to become a popular tourist destination. The city is home to a number of attractions, including the Rogue River, the Oregon Coast Aquarium, and the Gold Beach Lighthouse.
Geography
Gold Beach is located at 42°37′N 124°25′W (42.619, -124.417). According to the United States Census Bureau, the city has a total area of 2.2 square miles (5.7 km2), all of it land.
The city is situated on the Pacific Ocean, at the mouth of the Rogue River. The city is surrounded by the Rogue River-Siskiyou National Forest.
Economy
Gold Beach is a popular tourist destination, and the city's economy is largely based on tourism. The city is home to a number of attractions, including the Rogue River, the Oregon Coast Aquarium, and the Gold Beach Lighthouse.
The city is also home to a number of businesses, including restaurants, hotels, and retail stores. The city is also home to a number of fishing and hunting guides, as well as charter boat services.
Demographics
As of the census of 2010, there were 2,253 people, 1,039 households, and 590 families residing in the city. The population density was 1,018.2 people per square mile (392.7/km2). There were 1,179 housing units at an average density of 531.3 per square mile (205.3/km2). The racial makeup of the city was 94.2% White, 0.3% African American, 1.2% Native American, 0.7% Asian, 0.1% Pacific Islander, 0.7% from other races, and 2.9% from two or more races. Hispanic or Latino of any race were 3.2% of the population.
There were 1,039 households, out of which 20.2% had children under the age of 18 living with them, 44.2% were married couples living together, 10.2% had a female householder with no husband present, and 40.7% were non-families. 34.2% of all households were made up of individuals, and 16.2% had someone living alone who was 65 years of age or older. The average household size was 2.17 and the average family size was 2.76.
In the city, the population was spread out, with 19.2% under the age of 18, 6.2% from 18 to 24, 21.2% from 25 to 44, 29.2% from 45 to 64, and 24.2% who were 65 years of age or older. The median age was 46 years. For every 100 females, there were 94.2 males. For every 100 females age 18 and over, there were 91.2 males.
The median income for a household in the city was $30,938, and the median income for a family was $37,813. Males had a median income of $30,000 versus $21,250 for females. The per capita income for the city was $18,945. About 10.2% of families and 13.2% of the population were below the poverty line, including 18.2% of those under age 18 and 8.2% of those age 65 or over.
Common Questions
What is Per Capita Income in Gold Beach?
Per Capita income in Gold Beach is $28,959.
What is the Median Family Income in Gold Beach?
Median Family Income in Gold Beach is $51,074.
What is the Median Household income in Gold Beach?
Median Household Income in Gold Beach is $49,018.
What is Income or Wage Gap in Gold Beach?
Income or Wage Gap in Gold Beach is 42.5%.
Women in Gold Beach earn 57.5 cents for every dollar earned by a man.
What is Inequality or Gini Index in Gold Beach?
Inequality or Gini Index in Gold Beach is 0.41.
What is the Total Population of Gold Beach?
Total Population of Gold Beach is 2,533.
What is the Total Male Population of Gold Beach?
Total Male Population of Gold Beach is 1,289.
What is the Total Female Population of Gold Beach?
Total Female Population of Gold Beach is 1,244.
What is the Ratio of Males per 100 Females in Gold Beach?
There are 103.62 Males per 100 Females in Gold Beach.
What is the Ratio of Females per 100 Males in Gold Beach?
There are 96.51 Females per 100 Males in Gold Beach.
What is the Median Population Age in Gold Beach?
Median Population Age in Gold Beach is 51.3 Years.
What is the Average Family Size in Gold Beach
Average Family Size in Gold Beach is 2.7 People.
What is the Average Household Size in Gold Beach
Average Household Size in Gold Beach is 2.2 People.
How Large is the Labor Force in Gold Beach?
There are 1,130 People in the Labor Forcein in Gold Beach.
What is the Percentage of People in the Labor Force in Gold Beach?
51.6% of People are in the Labor Force in Gold Beach.
What is the Unemployment Rate in Gold Beach?
Unemployment Rate in Gold Beach is 9.6%.