White City, OR Map & Demographics
White City Map
White City Overview
$22,264
PER CAPITA INCOME
$67,891
AVG FAMILY INCOME
$57,385
AVG HOUSEHOLD INCOME
26.3%
WAGE / INCOME GAP [ % ]
73.7¢/ $1
WAGE / INCOME GAP [ $ ]
0.42
INEQUALITY / GINI INDEX
11,123
TOTAL POPULATION
6,224
MALE POPULATION
4,899
FEMALE POPULATION
127.05
MALES / 100 FEMALES
78.71
FEMALES / 100 MALES
33.3
MEDIAN AGE
3.8
AVG FAMILY SIZE
3.2
AVG HOUSEHOLD SIZE
4,884
LABOR FORCE [ PEOPLE ]
59.3%
PERCENT IN LABOR FORCE
5.2%
UNEMPLOYMENT RATE
White City Zip Codes
White City Area Codes
Income in White City
Income Overview in White City
Per Capita Income in White City is $22,264, while median incomes of families and households are $67,891 and $57,385 respectively.
| Characteristic | Number | Measure |
| Per Capita Income | 11,123 | $22,264 |
| Median Family Income | 2,281 | $67,891 |
| Mean Family Income | 2,281 | $80,595 |
| Median Household Income | 3,284 | $57,385 |
| Mean Household Income | 3,284 | $72,075 |
| Income Deficit | 2,281 | $0 |
| Wage / Income Gap (%) | 11,123 | 26.33% |
| Wage / Income Gap ($) | 11,123 | 73.67¢ per $1 |
| Gini / Inequality Index | 11,123 | 0.42 |
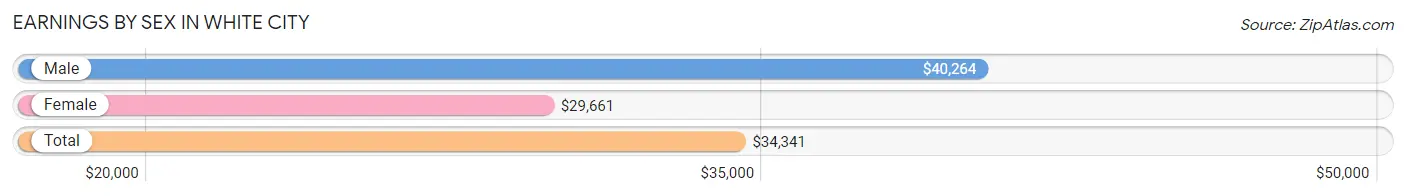
Earnings by Sex in White City
Average Earnings in White City are $34,341, $40,264 for men and $29,661 for women, a difference of 26.3%.
| Sex | Number | Average Earnings |
| Male | 2,905 (57.0%) | $40,264 |
| Female | 2,194 (43.0%) | $29,661 |
| Total | 5,099 (100.0%) | $34,341 |
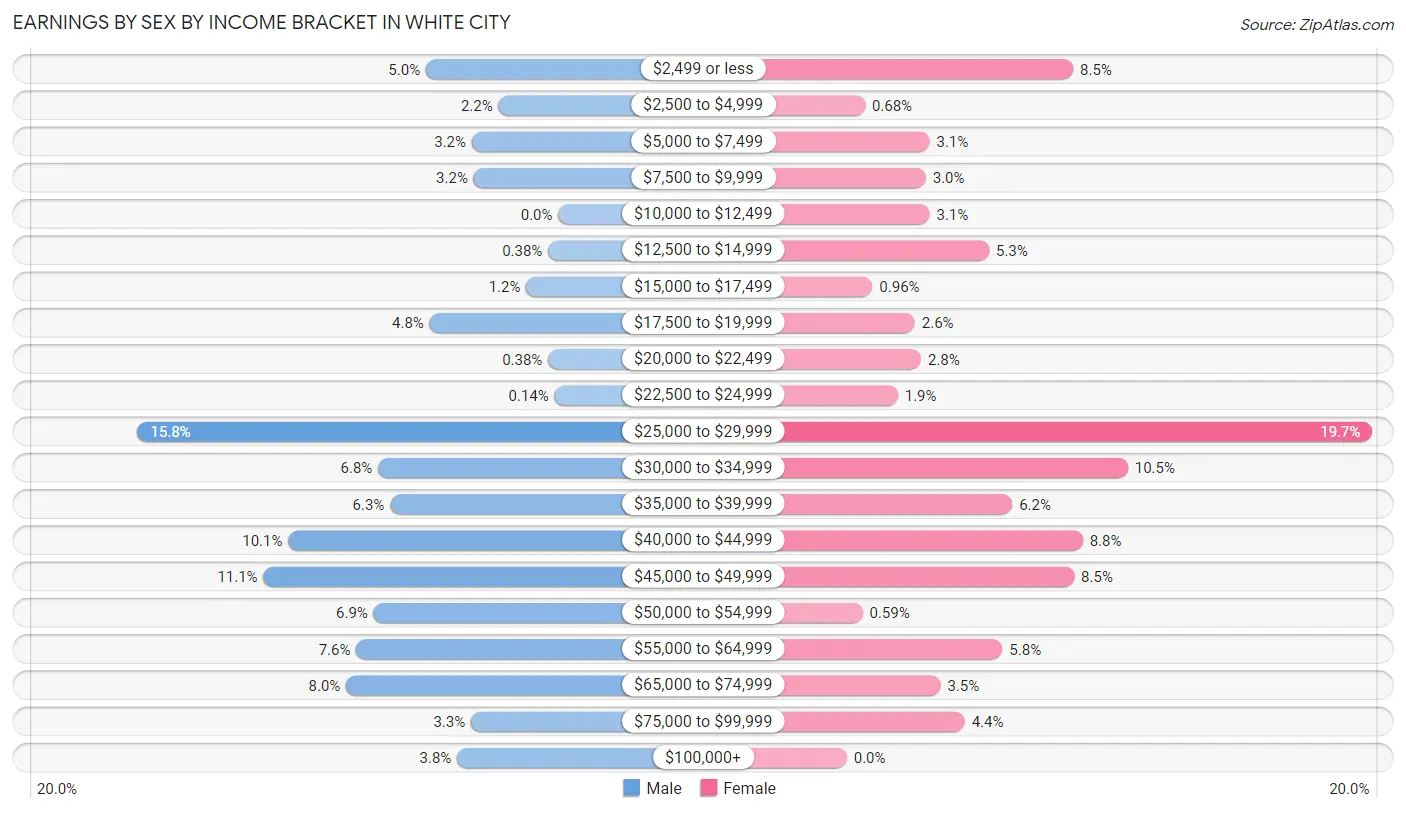
Earnings by Sex by Income Bracket in White City
The most common earnings brackets in White City are $25,000 to $29,999 for men (458 | 15.8%) and $25,000 to $29,999 for women (432 | 19.7%).
| Income | Male | Female |
| $2,499 or less | 144 (5.0%) | 186 (8.5%) |
| $2,500 to $4,999 | 65 (2.2%) | 15 (0.7%) |
| $5,000 to $7,499 | 94 (3.2%) | 68 (3.1%) |
| $7,500 to $9,999 | 92 (3.2%) | 65 (3.0%) |
| $10,000 to $12,499 | 0 (0.0%) | 68 (3.1%) |
| $12,500 to $14,999 | 11 (0.4%) | 117 (5.3%) |
| $15,000 to $17,499 | 35 (1.2%) | 21 (1.0%) |
| $17,500 to $19,999 | 140 (4.8%) | 56 (2.5%) |
| $20,000 to $22,499 | 11 (0.4%) | 61 (2.8%) |
| $22,500 to $24,999 | 4 (0.1%) | 42 (1.9%) |
| $25,000 to $29,999 | 458 (15.8%) | 432 (19.7%) |
| $30,000 to $34,999 | 196 (6.8%) | 231 (10.5%) |
| $35,000 to $39,999 | 183 (6.3%) | 136 (6.2%) |
| $40,000 to $44,999 | 294 (10.1%) | 194 (8.8%) |
| $45,000 to $49,999 | 321 (11.1%) | 187 (8.5%) |
| $50,000 to $54,999 | 201 (6.9%) | 13 (0.6%) |
| $55,000 to $64,999 | 220 (7.6%) | 128 (5.8%) |
| $65,000 to $74,999 | 231 (8.0%) | 77 (3.5%) |
| $75,000 to $99,999 | 95 (3.3%) | 97 (4.4%) |
| $100,000+ | 110 (3.8%) | 0 (0.0%) |
| Total | 2,905 (100.0%) | 2,194 (100.0%) |
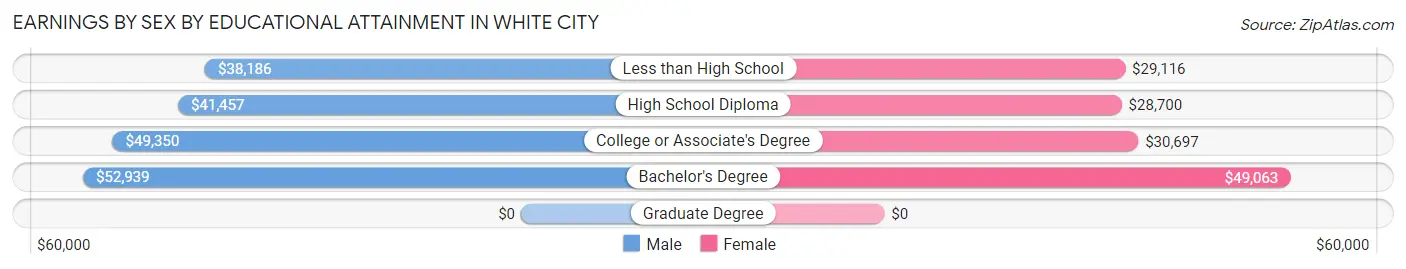
Earnings by Sex by Educational Attainment in White City
Average earnings in White City are $42,924 for men and $29,995 for women, a difference of 30.1%. Men with an educational attainment of bachelor's degree enjoy the highest average annual earnings of $52,939, while those with less than high school education earn the least with $38,186. Women with an educational attainment of bachelor's degree earn the most with the average annual earnings of $49,063, while those with high school diploma education have the smallest earnings of $28,700.
| Educational Attainment | Male Income | Female Income |
| Less than High School | $38,186 | $29,116 |
| High School Diploma | $41,457 | $28,700 |
| College or Associate's Degree | $49,350 | $30,697 |
| Bachelor's Degree | $52,939 | $49,063 |
| Graduate Degree | - | - |
| Total | $42,924 | $29,995 |
Family Income in White City
Family Income Brackets in White City
According to the White City family income data, there are 397 families falling into the $35,000 to $49,999 income range, which is the most common income bracket and makes up 17.4% of all families. Conversely, the $10,000 to $14,999 income bracket is the least frequent group with only 14 families (0.6%) belonging to this category.
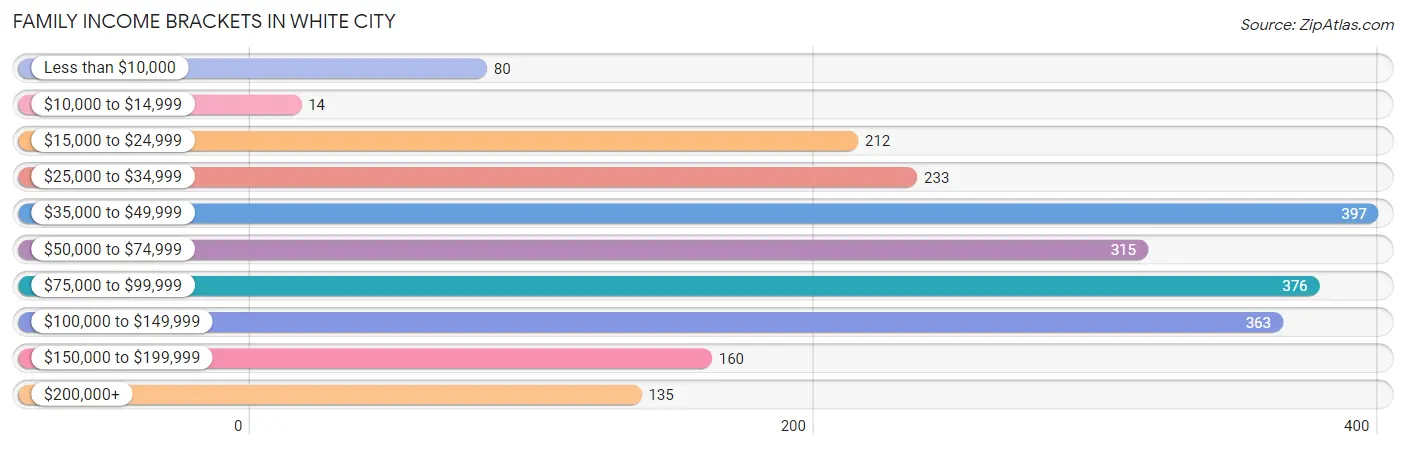
| Income Bracket | # Families | % Families |
| Less than $10,000 | 80 | 3.5% |
| $10,000 to $14,999 | 14 | 0.6% |
| $15,000 to $24,999 | 212 | 9.3% |
| $25,000 to $34,999 | 233 | 10.2% |
| $35,000 to $49,999 | 397 | 17.4% |
| $50,000 to $74,999 | 315 | 13.8% |
| $75,000 to $99,999 | 376 | 16.5% |
| $100,000 to $149,999 | 363 | 15.9% |
| $150,000 to $199,999 | 160 | 7.0% |
| $200,000+ | 135 | 5.9% |
Family Income by Famaliy Size in White City
7+ person families (126 | 5.5%) account for the highest median family income in White City with $232,432 per family, while 2-person families (580 | 25.4%) have the highest median income of $36,188 per family member.
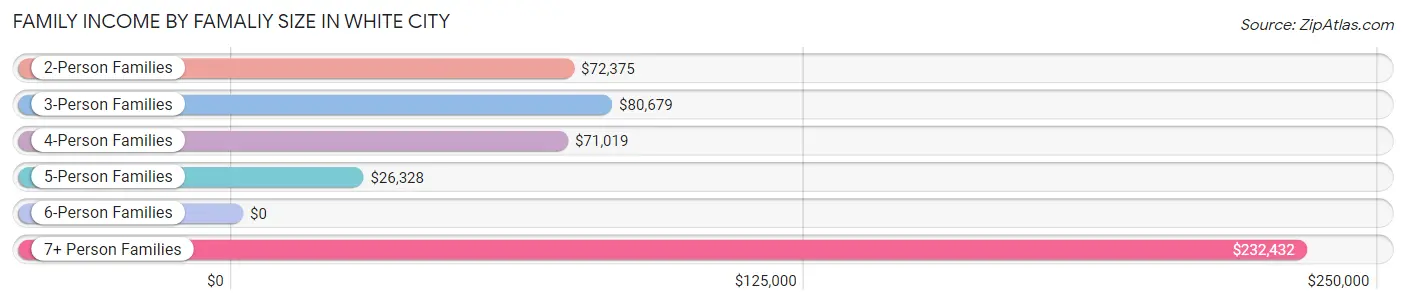
| Income Bracket | # Families | Median Income |
| 2-Person Families | 580 (25.4%) | $72,375 |
| 3-Person Families | 489 (21.4%) | $80,679 |
| 4-Person Families | 642 (28.1%) | $71,019 |
| 5-Person Families | 331 (14.5%) | $26,328 |
| 6-Person Families | 113 (5.0%) | $0 |
| 7+ Person Families | 126 (5.5%) | $232,432 |
| Total | 2,281 (100.0%) | $67,891 |
Family Income by Number of Earners in White City
The median family income in White City is $67,891, with families comprising 3+ earners (526) having the highest median family income of $125,000, while families with no earners (270) have the lowest median family income of $21,988, accounting for 23.1% and 11.8% of families, respectively.
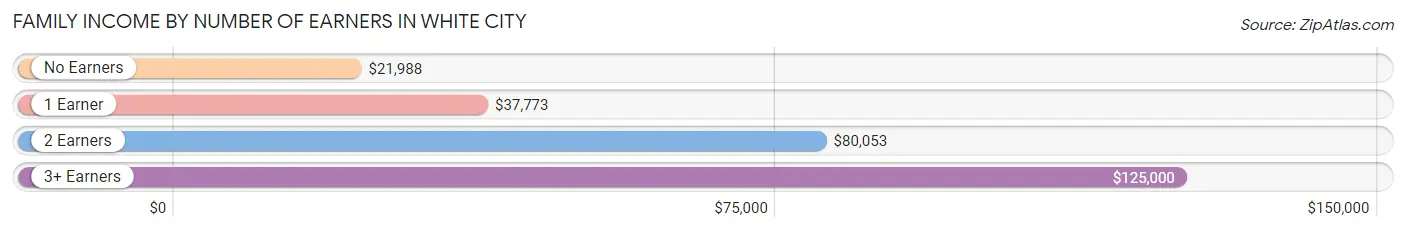
| Number of Earners | # Families | Median Income |
| No Earners | 270 (11.8%) | $21,988 |
| 1 Earner | 667 (29.2%) | $37,773 |
| 2 Earners | 818 (35.9%) | $80,053 |
| 3+ Earners | 526 (23.1%) | $125,000 |
| Total | 2,281 (100.0%) | $67,891 |
Household Income in White City
Household Income Brackets in White City
With 644 households falling in the category, the $50,000 to $74,999 income range is the most frequent in White City, accounting for 19.6% of all households. In contrast, only 144 households (4.4%) fall into the $200,000+ income bracket, making it the least populous group.
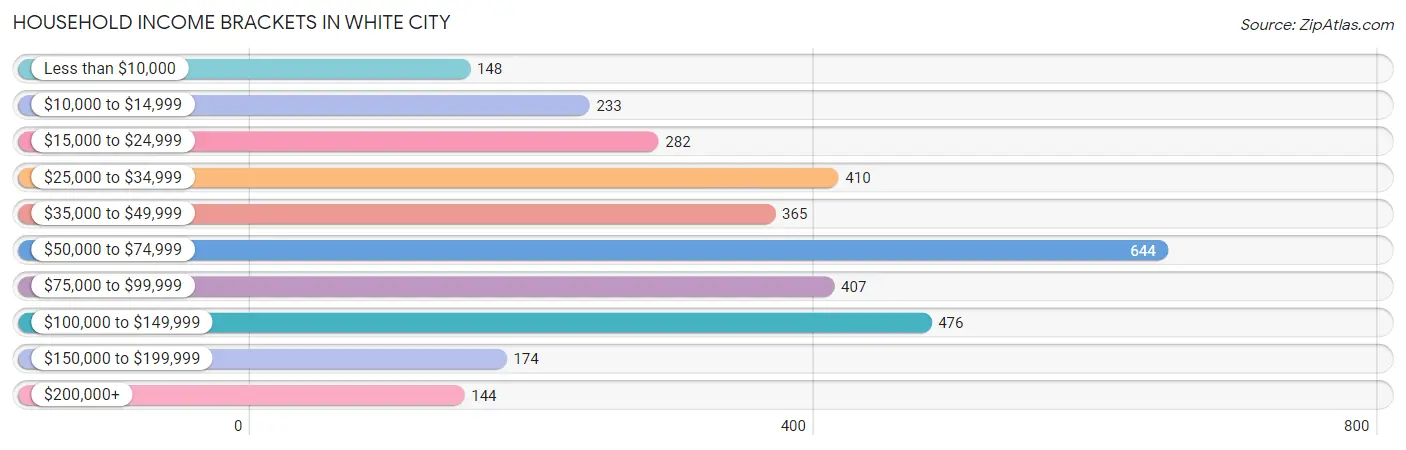
| Income Bracket | # Households | % Households |
| Less than $10,000 | 148 | 4.5% |
| $10,000 to $14,999 | 233 | 7.1% |
| $15,000 to $24,999 | 282 | 8.6% |
| $25,000 to $34,999 | 410 | 12.5% |
| $35,000 to $49,999 | 365 | 11.1% |
| $50,000 to $74,999 | 644 | 19.6% |
| $75,000 to $99,999 | 407 | 12.4% |
| $100,000 to $149,999 | 476 | 14.5% |
| $150,000 to $199,999 | 174 | 5.3% |
| $200,000+ | 144 | 4.4% |
Household Income by Householder Age in White City
The median household income in White City is $57,385, with the highest median household income of $71,783 found in the 25 to 44 years age bracket for the primary householder. A total of 1,237 households (37.7%) fall into this category. Meanwhile, the 65+ years age bracket for the primary householder has the lowest median household income of $34,583, with 672 households (20.5%) in this group.
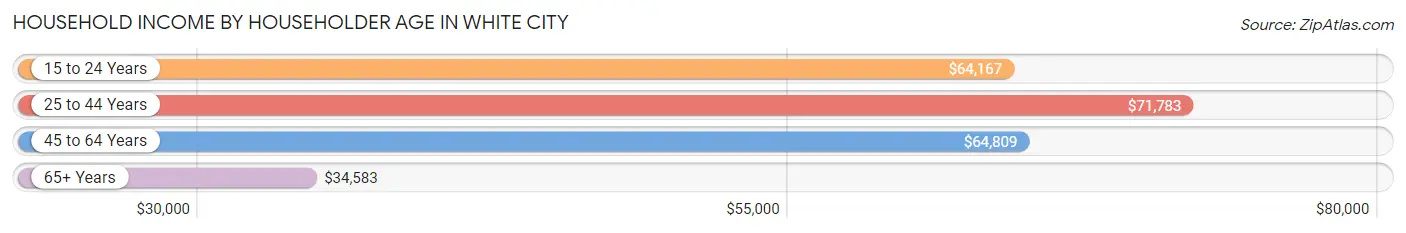
| Income Bracket | # Households | Median Income |
| 15 to 24 Years | 66 (2.0%) | $64,167 |
| 25 to 44 Years | 1,237 (37.7%) | $71,783 |
| 45 to 64 Years | 1,309 (39.9%) | $64,809 |
| 65+ Years | 672 (20.5%) | $34,583 |
| Total | 3,284 (100.0%) | $57,385 |
Poverty in White City
Income Below Poverty by Sex and Age in White City
With 32.4% poverty level for males and 22.5% for females among the residents of White City, 5 year old males and 15 year old females are the most vulnerable to poverty, with 9 males (100.0%) and 85 females (89.5%) in their respective age groups living below the poverty level.
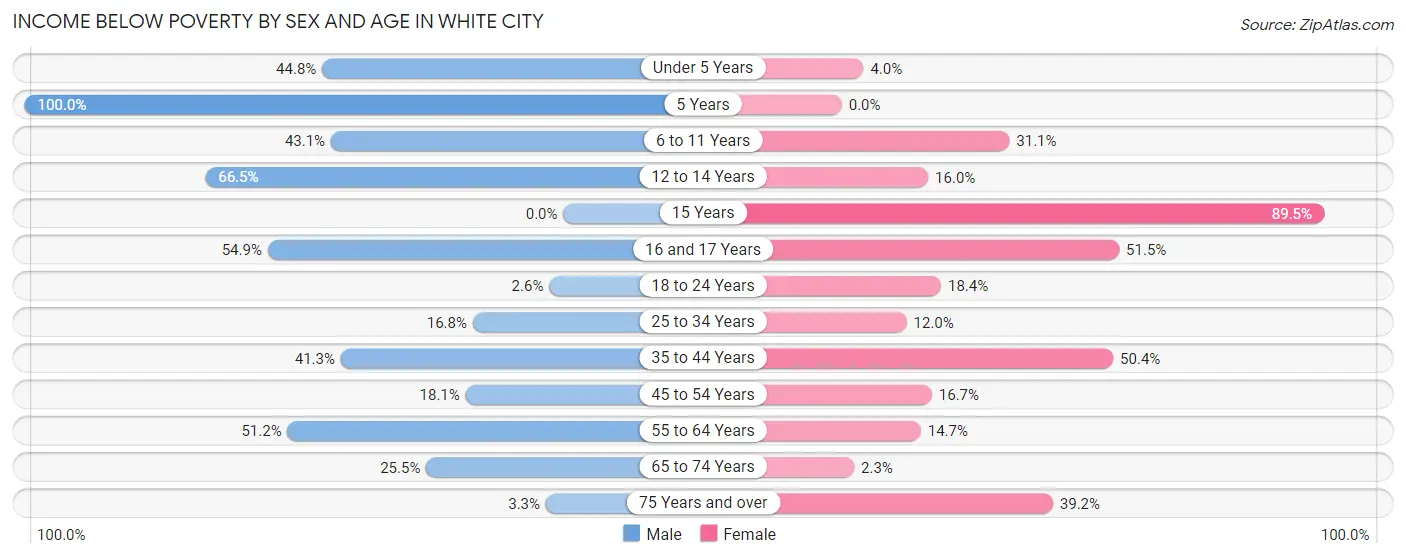
| Age Bracket | Male | Female |
| Under 5 Years | 304 (44.8%) | 17 (4.0%) |
| 5 Years | 9 (100.0%) | 0 (0.0%) |
| 6 to 11 Years | 352 (43.1%) | 144 (31.1%) |
| 12 to 14 Years | 103 (66.4%) | 25 (16.0%) |
| 15 Years | 0 (0.0%) | 85 (89.5%) |
| 16 and 17 Years | 107 (54.9%) | 87 (51.5%) |
| 18 to 24 Years | 12 (2.6%) | 70 (18.4%) |
| 25 to 34 Years | 141 (16.8%) | 124 (12.0%) |
| 35 to 44 Years | 335 (41.3%) | 275 (50.4%) |
| 45 to 54 Years | 131 (18.1%) | 100 (16.7%) |
| 55 to 64 Years | 385 (51.2%) | 54 (14.7%) |
| 65 to 74 Years | 128 (25.5%) | 8 (2.3%) |
| 75 Years and over | 8 (3.3%) | 105 (39.2%) |
| Total | 2,015 (32.4%) | 1,094 (22.5%) |
Income Above Poverty by Sex and Age in White City
According to the poverty statistics in White City, males aged 15 years and females aged 5 years are the age groups that are most secure financially, with 100.0% of males and 100.0% of females in these age groups living above the poverty line.
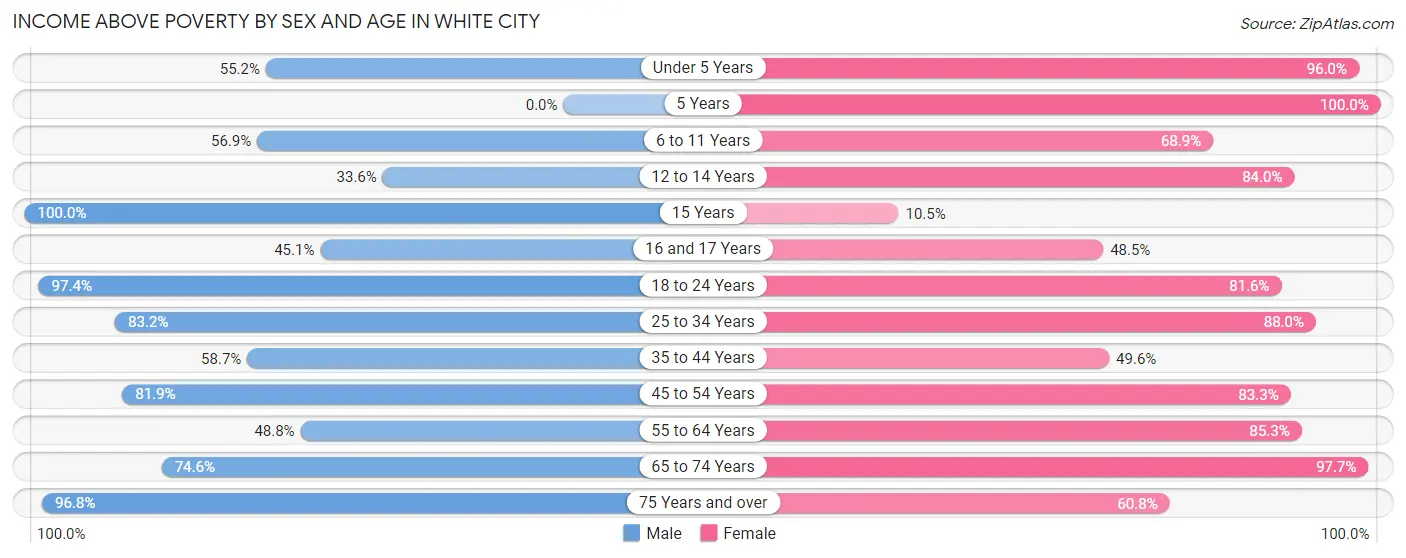
| Age Bracket | Male | Female |
| Under 5 Years | 375 (55.2%) | 405 (96.0%) |
| 5 Years | 0 (0.0%) | 20 (100.0%) |
| 6 to 11 Years | 464 (56.9%) | 319 (68.9%) |
| 12 to 14 Years | 52 (33.6%) | 131 (84.0%) |
| 15 Years | 30 (100.0%) | 10 (10.5%) |
| 16 and 17 Years | 88 (45.1%) | 82 (48.5%) |
| 18 to 24 Years | 446 (97.4%) | 310 (81.6%) |
| 25 to 34 Years | 698 (83.2%) | 907 (88.0%) |
| 35 to 44 Years | 476 (58.7%) | 271 (49.6%) |
| 45 to 54 Years | 591 (81.9%) | 498 (83.3%) |
| 55 to 64 Years | 367 (48.8%) | 314 (85.3%) |
| 65 to 74 Years | 375 (74.6%) | 342 (97.7%) |
| 75 Years and over | 238 (96.8%) | 163 (60.8%) |
| Total | 4,200 (67.6%) | 3,772 (77.5%) |
Income Below Poverty Among Married-Couple Families in White City
The poverty statistics for married-couple families in White City show that 16.8% or 286 of the total 1,699 families live below the poverty line. Families with 3 or 4 children have the highest poverty rate of 73.7%, comprising of 286 families. On the other hand, families with no children have the lowest poverty rate of 0.0%, which includes 0 families.
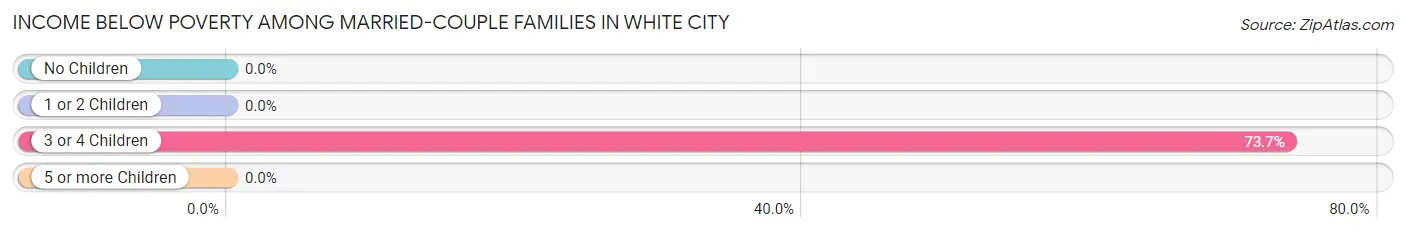
| Children | Above Poverty | Below Poverty |
| No Children | 745 (100.0%) | 0 (0.0%) |
| 1 or 2 Children | 566 (100.0%) | 0 (0.0%) |
| 3 or 4 Children | 102 (26.3%) | 286 (73.7%) |
| 5 or more Children | 0 (0.0%) | 0 (0.0%) |
| Total | 1,413 (83.2%) | 286 (16.8%) |
Income Below Poverty Among Single-Parent Households in White City
According to the poverty data in White City, 2.8% or 8 single-father households and 31.0% or 92 single-mother households are living below the poverty line. Among single-father households, those with 1 or 2 children have the highest poverty rate, with 8 households (6.4%) experiencing poverty. Likewise, among single-mother households, those with 1 or 2 children have the highest poverty rate, with 69 households (62.7%) falling below the poverty line.
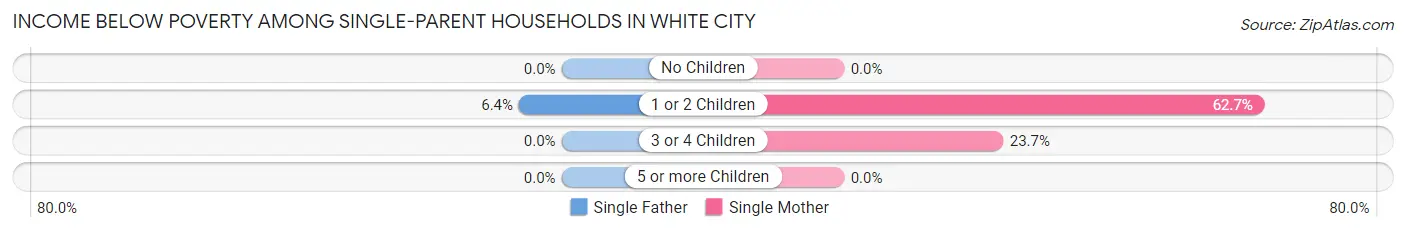
| Children | Single Father | Single Mother |
| No Children | 0 (0.0%) | 0 (0.0%) |
| 1 or 2 Children | 8 (6.4%) | 69 (62.7%) |
| 3 or 4 Children | 0 (0.0%) | 23 (23.7%) |
| 5 or more Children | 0 (0.0%) | 0 (0.0%) |
| Total | 8 (2.8%) | 92 (31.0%) |
Income Below Poverty Among Married-Couple vs Single-Parent Households in White City
The poverty data for White City shows that 286 of the married-couple family households (16.8%) and 100 of the single-parent households (17.2%) are living below the poverty level. Within the married-couple family households, those with 3 or 4 children have the highest poverty rate, with 286 households (73.7%) falling below the poverty line. Among the single-parent households, those with 1 or 2 children have the highest poverty rate, with 77 household (32.6%) living below poverty.
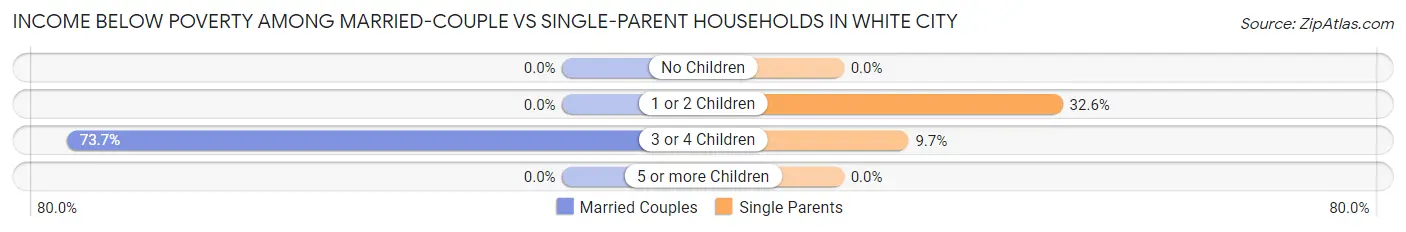
| Children | Married-Couple Families | Single-Parent Households |
| No Children | 0 (0.0%) | 0 (0.0%) |
| 1 or 2 Children | 0 (0.0%) | 77 (32.6%) |
| 3 or 4 Children | 286 (73.7%) | 23 (9.7%) |
| 5 or more Children | 0 (0.0%) | 0 (0.0%) |
| Total | 286 (16.8%) | 100 (17.2%) |
Race in White City
The most populous races in White City are White / Caucasian (8,176 | 73.5%), Hispanic or Latino (4,461 | 40.1%), and Some other Race (1,949 | 17.5%).
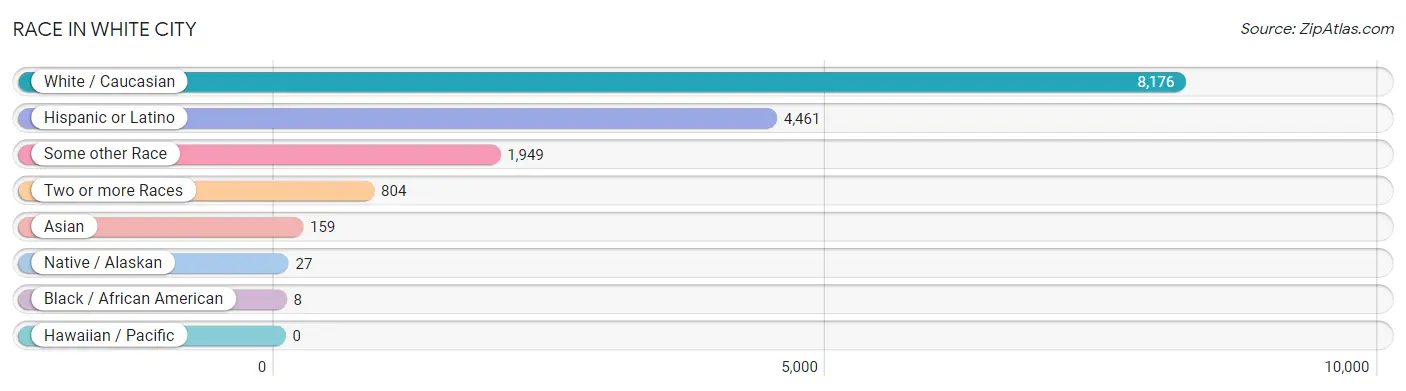
| Race | # Population | % Population |
| Asian | 159 | 1.4% |
| Black / African American | 8 | 0.1% |
| Hawaiian / Pacific | 0 | 0.0% |
| Hispanic or Latino | 4,461 | 40.1% |
| Native / Alaskan | 27 | 0.2% |
| White / Caucasian | 8,176 | 73.5% |
| Two or more Races | 804 | 7.2% |
| Some other Race | 1,949 | 17.5% |
| Total | 11,123 | 100.0% |
Ancestry in White City
The most populous ancestries reported in White City are Mexican (4,373 | 39.3%), German (1,238 | 11.1%), English (668 | 6.0%), Scottish (572 | 5.1%), and Irish (452 | 4.1%), together accounting for 65.6% of all White City residents.
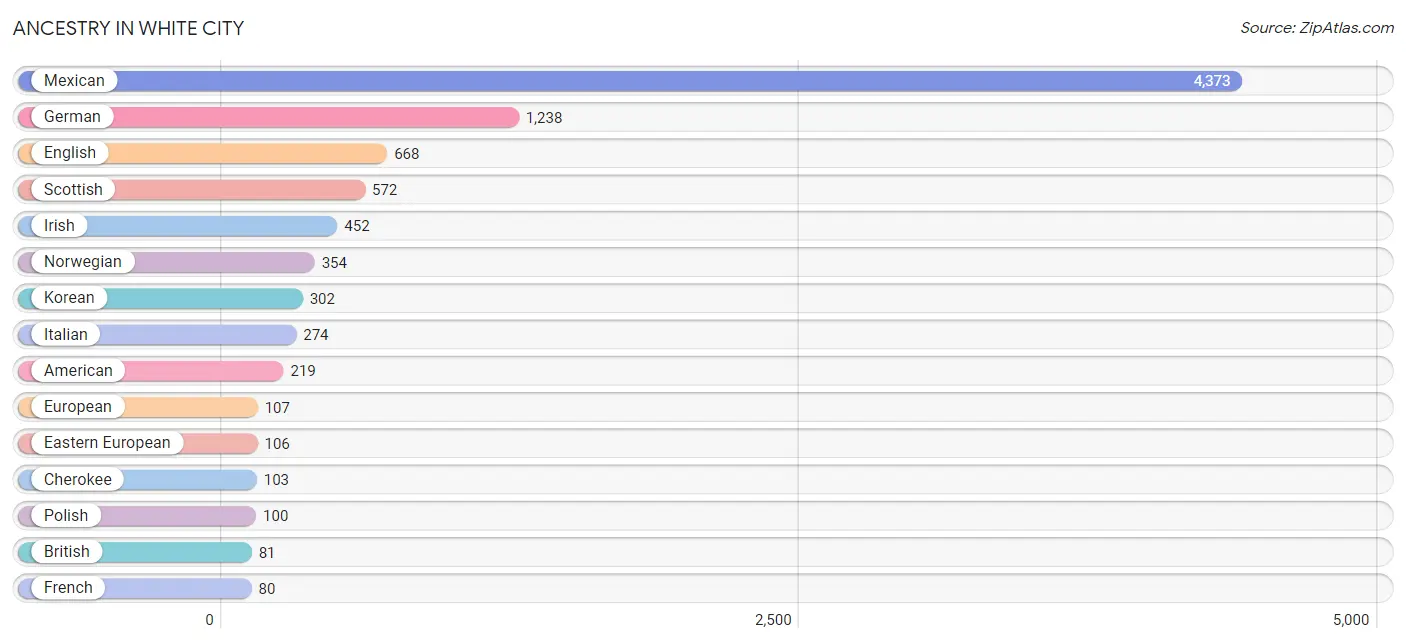
| Ancestry | # Population | % Population |
| American | 219 | 2.0% |
| Bhutanese | 12 | 0.1% |
| Blackfeet | 20 | 0.2% |
| British | 81 | 0.7% |
| Burmese | 79 | 0.7% |
| Canadian | 58 | 0.5% |
| Celtic | 9 | 0.1% |
| Cherokee | 103 | 0.9% |
| Croatian | 30 | 0.3% |
| Czech | 54 | 0.5% |
| Danish | 8 | 0.1% |
| Eastern European | 106 | 0.9% |
| Ecuadorian | 16 | 0.1% |
| English | 668 | 6.0% |
| European | 107 | 1.0% |
| Finnish | 15 | 0.1% |
| French | 80 | 0.7% |
| German | 1,238 | 11.1% |
| Hungarian | 29 | 0.3% |
| Icelander | 20 | 0.2% |
| Indian (Asian) | 21 | 0.2% |
| Irish | 452 | 4.1% |
| Italian | 274 | 2.5% |
| Korean | 302 | 2.7% |
| Lithuanian | 13 | 0.1% |
| Mexican | 4,373 | 39.3% |
| Mexican American Indian | 49 | 0.4% |
| Native Hawaiian | 23 | 0.2% |
| Norwegian | 354 | 3.2% |
| Polish | 100 | 0.9% |
| Portuguese | 27 | 0.2% |
| Russian | 9 | 0.1% |
| Scotch-Irish | 55 | 0.5% |
| Scottish | 572 | 5.1% |
| South American | 16 | 0.1% |
| Spaniard | 25 | 0.2% |
| Spanish | 35 | 0.3% |
| Sri Lankan | 10 | 0.1% |
| Swedish | 78 | 0.7% |
| Swiss | 13 | 0.1% |
| Welsh | 56 | 0.5% | View All 41 Rows |
Immigrants in White City
The most numerous immigrant groups reported in White City came from Latin America (1,219 | 11.0%), Central America (1,203 | 10.8%), Mexico (1,203 | 10.8%), Asia (123 | 1.1%), and South Eastern Asia (123 | 1.1%), together accounting for 34.8% of all White City residents.
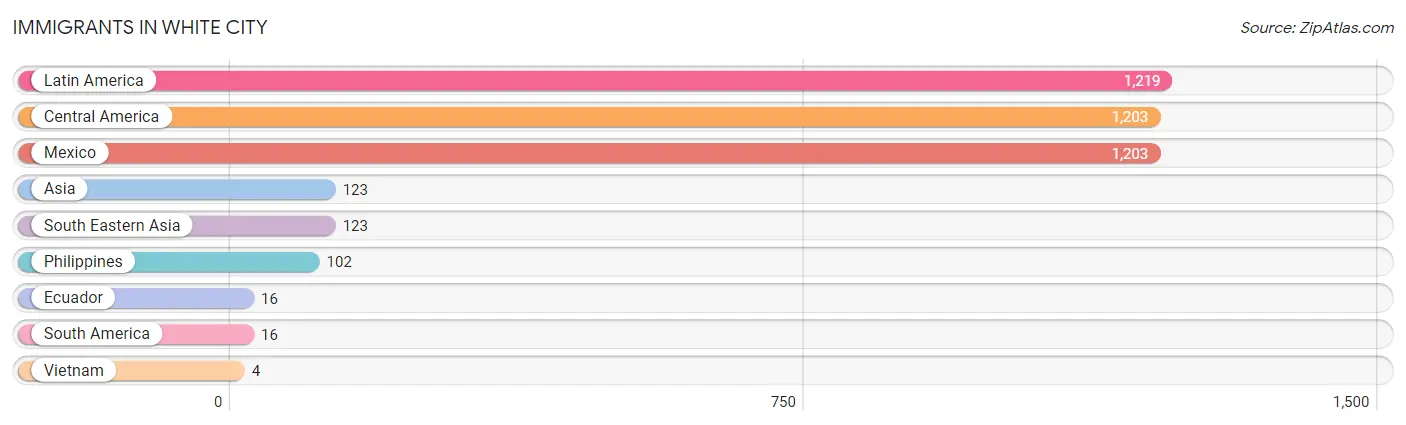
| Immigration Origin | # Population | % Population |
| Asia | 123 | 1.1% |
| Central America | 1,203 | 10.8% |
| Ecuador | 16 | 0.1% |
| Latin America | 1,219 | 11.0% |
| Mexico | 1,203 | 10.8% |
| Philippines | 102 | 0.9% |
| South America | 16 | 0.1% |
| South Eastern Asia | 123 | 1.1% |
| Vietnam | 4 | 0.0% | View All 9 Rows |
Sex and Age in White City
Sex and Age in White City
The most populous age groups in White City are Under 5 Years (679 | 10.9%) for men and 25 to 29 Years (525 | 10.7%) for women.
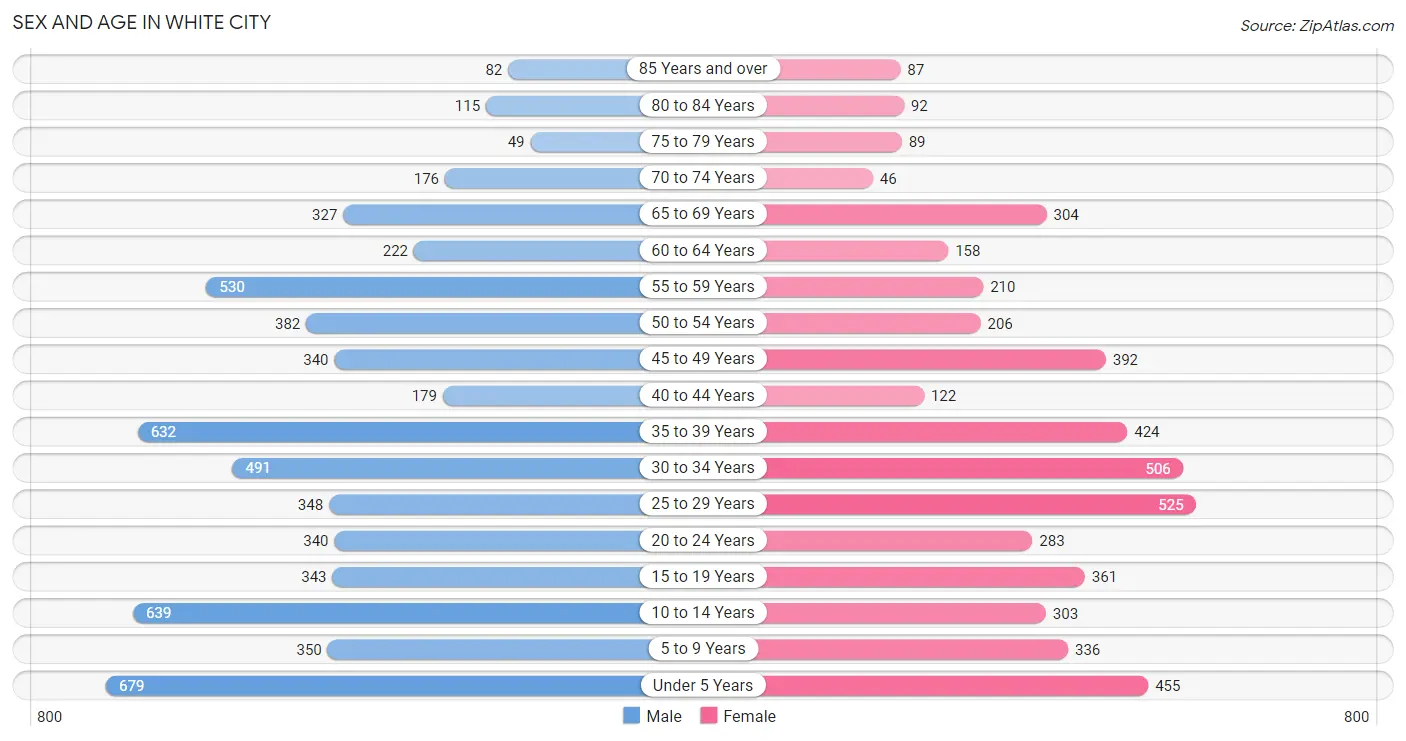
| Age Bracket | Male | Female |
| Under 5 Years | 679 (10.9%) | 455 (9.3%) |
| 5 to 9 Years | 350 (5.6%) | 336 (6.9%) |
| 10 to 14 Years | 639 (10.3%) | 303 (6.2%) |
| 15 to 19 Years | 343 (5.5%) | 361 (7.4%) |
| 20 to 24 Years | 340 (5.5%) | 283 (5.8%) |
| 25 to 29 Years | 348 (5.6%) | 525 (10.7%) |
| 30 to 34 Years | 491 (7.9%) | 506 (10.3%) |
| 35 to 39 Years | 632 (10.2%) | 424 (8.6%) |
| 40 to 44 Years | 179 (2.9%) | 122 (2.5%) |
| 45 to 49 Years | 340 (5.5%) | 392 (8.0%) |
| 50 to 54 Years | 382 (6.1%) | 206 (4.2%) |
| 55 to 59 Years | 530 (8.5%) | 210 (4.3%) |
| 60 to 64 Years | 222 (3.6%) | 158 (3.2%) |
| 65 to 69 Years | 327 (5.2%) | 304 (6.2%) |
| 70 to 74 Years | 176 (2.8%) | 46 (0.9%) |
| 75 to 79 Years | 49 (0.8%) | 89 (1.8%) |
| 80 to 84 Years | 115 (1.8%) | 92 (1.9%) |
| 85 Years and over | 82 (1.3%) | 87 (1.8%) |
| Total | 6,224 (100.0%) | 4,899 (100.0%) |
Families and Households in White City
Median Family Size in White City
The median family size in White City is 3.79 persons per family, with single male/father families (285 | 12.5%) accounting for the largest median family size of 3.94 persons per family. On the other hand, married-couple families (1,699 | 74.5%) represent the smallest median family size with 3.76 persons per family.
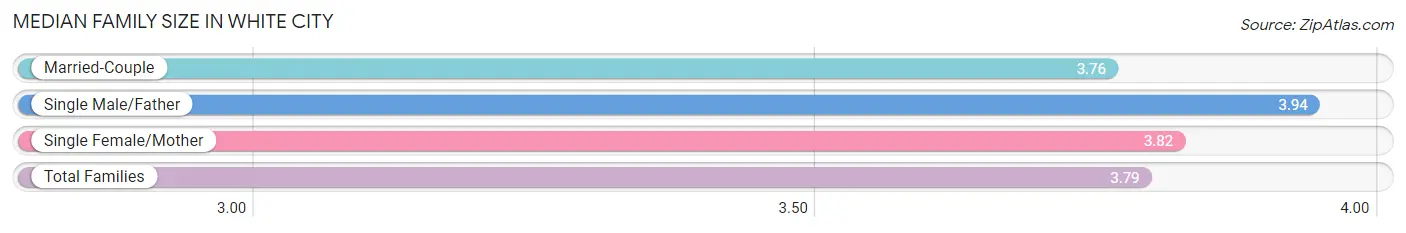
| Family Type | # Families | Family Size |
| Married-Couple | 1,699 (74.5%) | 3.76 |
| Single Male/Father | 285 (12.5%) | 3.94 |
| Single Female/Mother | 297 (13.0%) | 3.82 |
| Total Families | 2,281 (100.0%) | 3.79 |
Median Household Size in White City
The median household size in White City is 3.21 persons per household, with single male/father households (285 | 8.7%) accounting for the largest median household size of 4.89 persons per household. non-family households (1,003 | 30.5%) represent the smallest median household size with 1.30 persons per household.
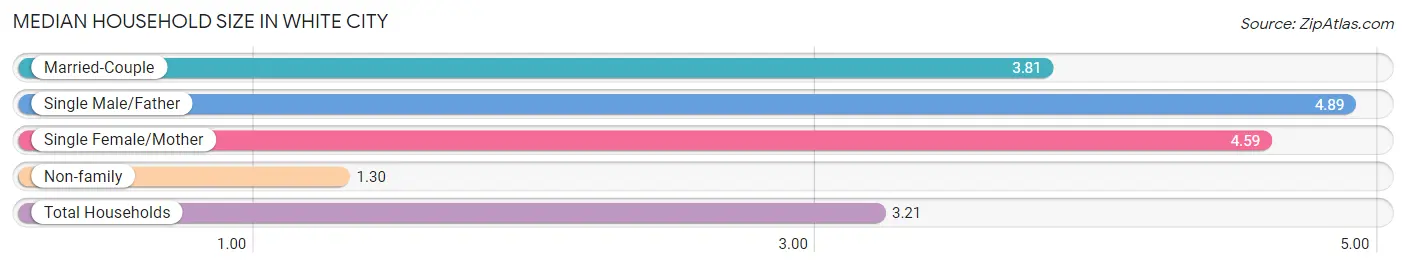
| Household Type | # Households | Household Size |
| Married-Couple | 1,699 (51.7%) | 3.81 |
| Single Male/Father | 285 (8.7%) | 4.89 |
| Single Female/Mother | 297 (9.0%) | 4.59 |
| Non-family | 1,003 (30.5%) | 1.30 |
| Total Households | 3,284 (100.0%) | 3.21 |
Household Size by Marriage Status in White City
Out of a total of 3,284 households in White City, 2,281 (69.5%) are family households, while 1,003 (30.5%) are nonfamily households. The most numerous type of family households are 2-person households, comprising 516, and the most common type of nonfamily households are 1-person households, comprising 794.
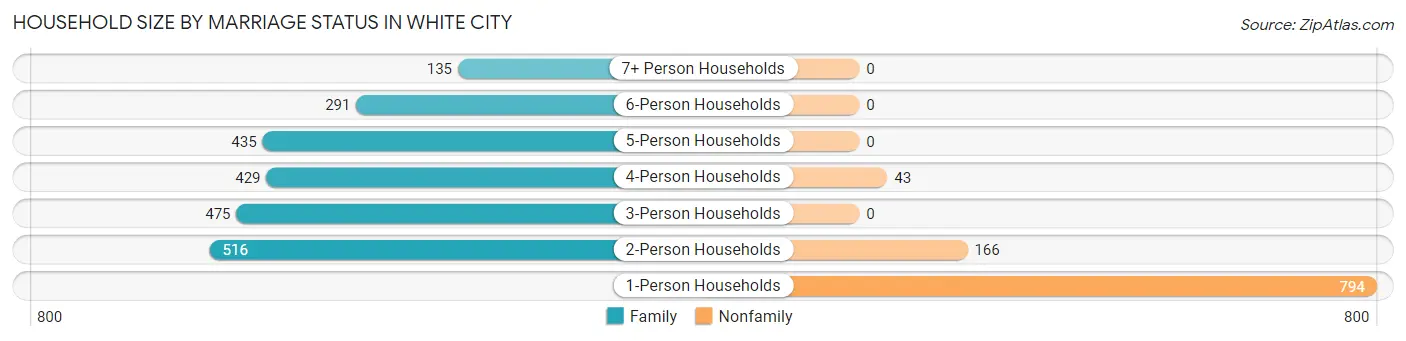
| Household Size | Family Households | Nonfamily Households |
| 1-Person Households | - | 794 (24.2%) |
| 2-Person Households | 516 (15.7%) | 166 (5.1%) |
| 3-Person Households | 475 (14.5%) | 0 (0.0%) |
| 4-Person Households | 429 (13.1%) | 43 (1.3%) |
| 5-Person Households | 435 (13.3%) | 0 (0.0%) |
| 6-Person Households | 291 (8.9%) | 0 (0.0%) |
| 7+ Person Households | 135 (4.1%) | 0 (0.0%) |
| Total | 2,281 (69.5%) | 1,003 (30.5%) |
Female Fertility in White City
Fertility by Age in White City
Average fertility rate in White City is 78.0 births per 1,000 women. Women in the age bracket of 20 to 34 years have the highest fertility rate with 136.0 births per 1,000 women. Women in the age bracket of 20 to 34 years acount for 87.7% of all women with births.
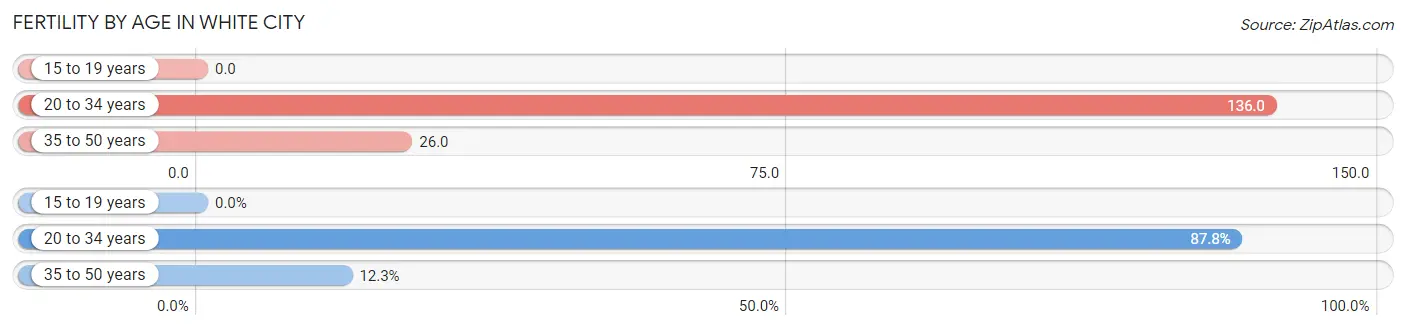
| Age Bracket | Women with Births | Births / 1,000 Women |
| 15 to 19 years | 0 (0.0%) | 0.0 |
| 20 to 34 years | 179 (87.7%) | 136.0 |
| 35 to 50 years | 25 (12.2%) | 26.0 |
| Total | 204 (100.0%) | 78.0 |
Fertility by Age by Marriage Status in White City
75.5% of women with births (204) in White City are married. The highest percentage of unmarried women with births falls into 20 to 34 years age bracket with 27.9% of them unmarried at the time of birth, while the lowest percentage of unmarried women with births belong to 35 to 50 years age bracket with 0.0% of them unmarried.
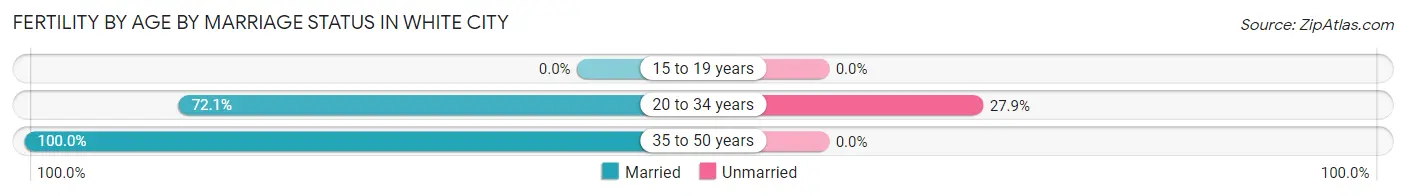
| Age Bracket | Married | Unmarried |
| 15 to 19 years | 0 (0.0%) | 0 (0.0%) |
| 20 to 34 years | 129 (72.1%) | 50 (27.9%) |
| 35 to 50 years | 25 (100.0%) | 0 (0.0%) |
| Total | 154 (75.5%) | 50 (24.5%) |
Fertility by Education in White City
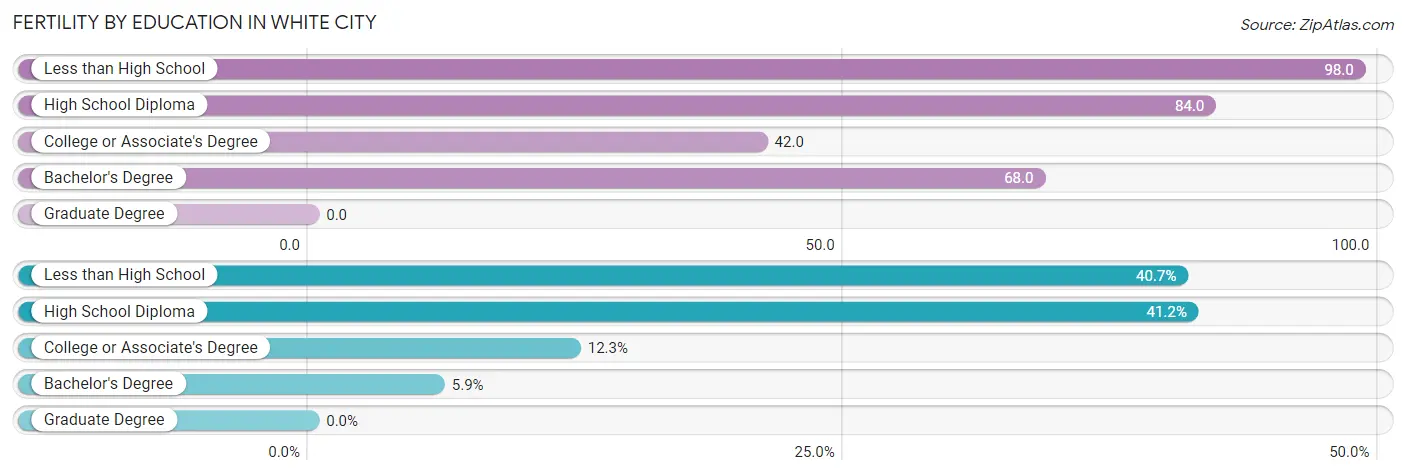
| Educational Attainment | Women with Births | Births / 1,000 Women |
| Less than High School | 83 (40.7%) | 98.0 |
| High School Diploma | 84 (41.2%) | 84.0 |
| College or Associate's Degree | 25 (12.2%) | 42.0 |
| Bachelor's Degree | 12 (5.9%) | 68.0 |
| Graduate Degree | 0 (0.0%) | 0.0 |
| Total | 204 (100.0%) | 78.0 |
Fertility by Education by Marriage Status in White City
24.5% of women with births in White City are unmarried. Women with the educational attainment of college or associate's degree are most likely to be married with 100.0% of them married at childbirth, while women with the educational attainment of high school diploma are least likely to be married with 48.8% of them unmarried at childbirth.
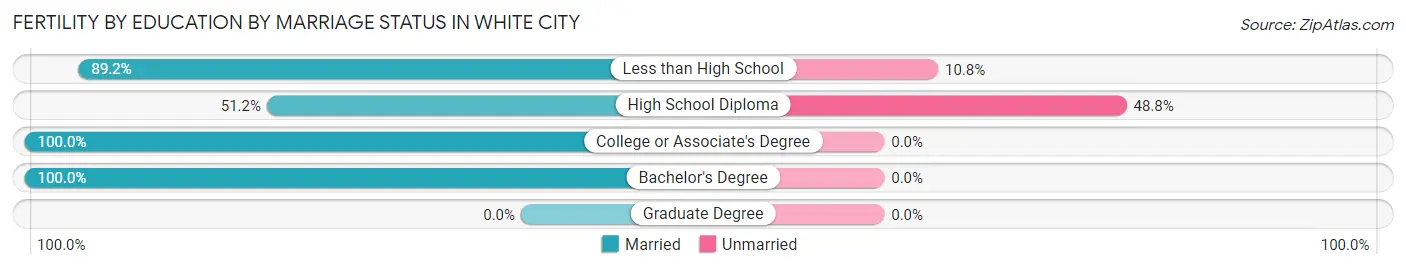
| Educational Attainment | Married | Unmarried |
| Less than High School | 74 (89.2%) | 9 (10.8%) |
| High School Diploma | 43 (51.2%) | 41 (48.8%) |
| College or Associate's Degree | 25 (100.0%) | 0 (0.0%) |
| Bachelor's Degree | 12 (100.0%) | 0 (0.0%) |
| Graduate Degree | 0 (0.0%) | 0 (0.0%) |
| Total | 154 (75.5%) | 50 (24.5%) |
Employment Characteristics in White City
Employment by Class of Employer in White City
Among the 4,616 employed individuals in White City, private company employees (3,509 | 76.0%), self-employed (not incorporated) (300 | 6.5%), and not-for-profit organizations (279 | 6.0%) make up the most common classes of employment.
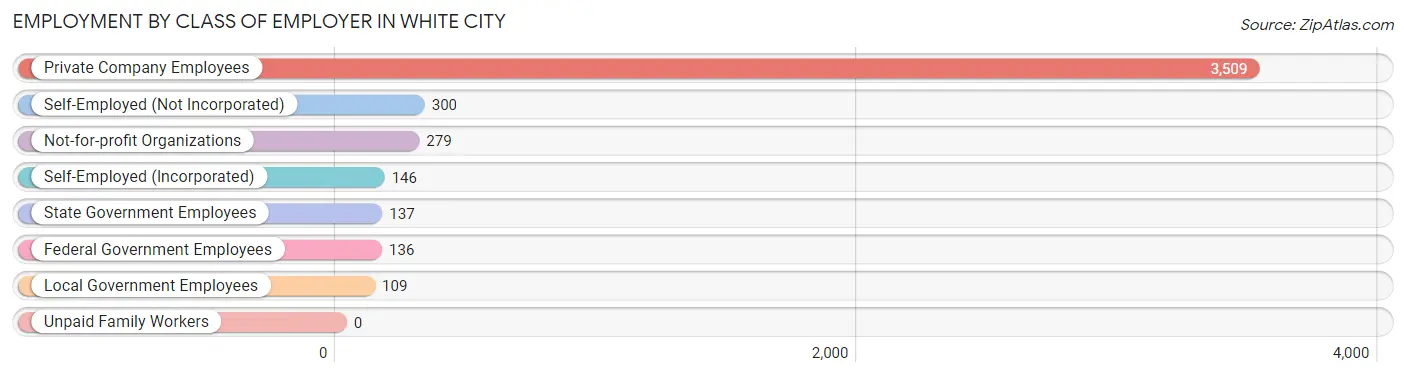
| Employer Class | # Employees | % Employees |
| Private Company Employees | 3,509 | 76.0% |
| Self-Employed (Incorporated) | 146 | 3.2% |
| Self-Employed (Not Incorporated) | 300 | 6.5% |
| Not-for-profit Organizations | 279 | 6.0% |
| Local Government Employees | 109 | 2.4% |
| State Government Employees | 137 | 3.0% |
| Federal Government Employees | 136 | 2.9% |
| Unpaid Family Workers | 0 | 0.0% |
| Total | 4,616 | 100.0% |
Employment Status by Age in White City
According to the labor force statistics for White City, out of the total population over 16 years of age (8,236), 59.3% or 4,884 individuals are in the labor force, with 5.2% or 254 of them unemployed. The age group with the highest labor force participation rate is 30 to 34 years, with 88.0% or 877 individuals in the labor force. Within the labor force, the 65 to 74 years age range has the highest percentage of unemployed individuals, with 19.4% or 35 of them being unemployed.
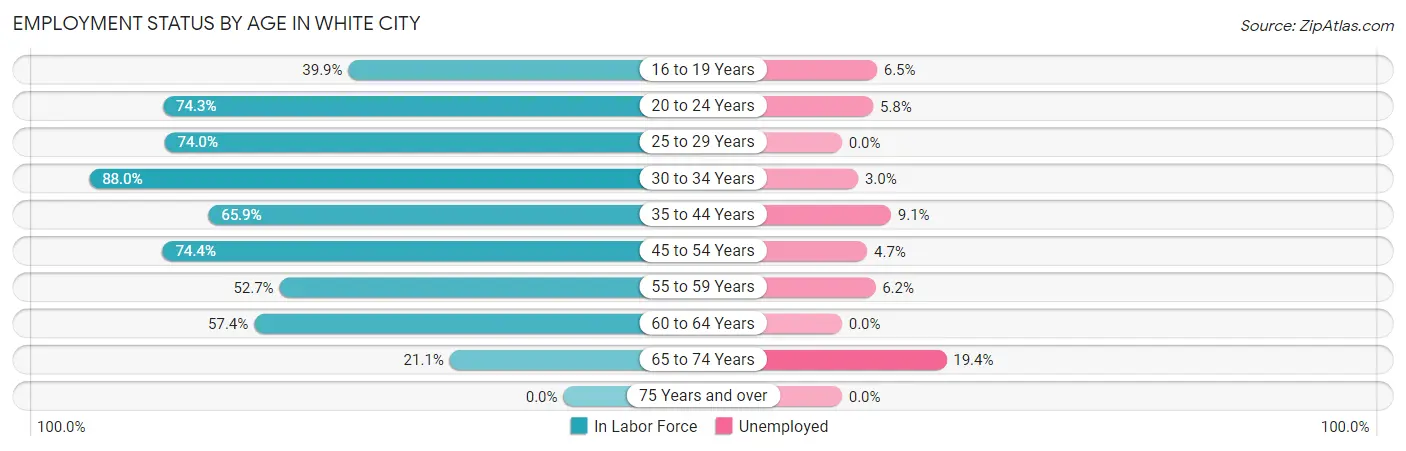
| Age Bracket | In Labor Force | Unemployed |
| 16 to 19 Years | 231 (39.9%) | 15 (6.5%) |
| 20 to 24 Years | 463 (74.3%) | 27 (5.8%) |
| 25 to 29 Years | 646 (74.0%) | 0 (0.0%) |
| 30 to 34 Years | 877 (88.0%) | 26 (3.0%) |
| 35 to 44 Years | 894 (65.9%) | 81 (9.1%) |
| 45 to 54 Years | 982 (74.4%) | 46 (4.7%) |
| 55 to 59 Years | 390 (52.7%) | 24 (6.2%) |
| 60 to 64 Years | 218 (57.4%) | 0 (0.0%) |
| 65 to 74 Years | 180 (21.1%) | 35 (19.4%) |
| 75 Years and over | 0 (0.0%) | 0 (0.0%) |
| Total | 4,884 (59.3%) | 254 (5.2%) |
Employment Status by Educational Attainment in White City
According to labor force statistics for White City, 70.7% of individuals (4,007) out of the total population between 25 and 64 years of age (5,667) are in the labor force, with 4.4% or 176 of them being unemployed. The group with the highest labor force participation rate are those with the educational attainment of college / associate degree, with 87.8% or 1,205 individuals in the labor force. Within the labor force, individuals with high school diploma education have the highest percentage of unemployment, with 5.2% or 81 of them being unemployed.
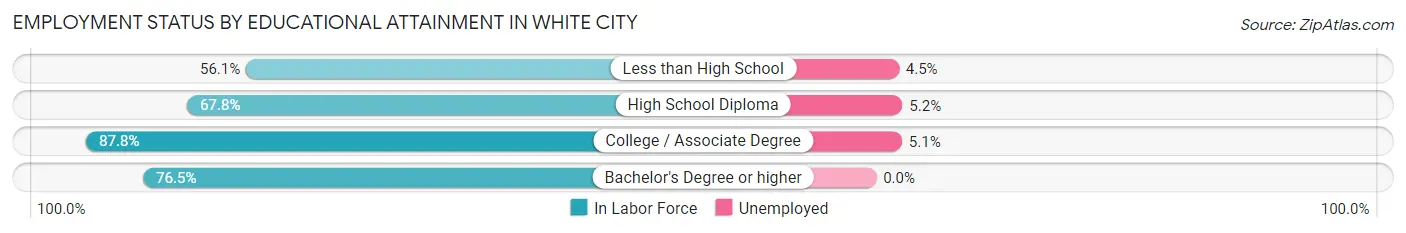
| Educational Attainment | In Labor Force | Unemployed |
| Less than High School | 781 (56.1%) | 63 (4.5%) |
| High School Diploma | 1,549 (67.8%) | 119 (5.2%) |
| College / Associate Degree | 1,205 (87.8%) | 70 (5.1%) |
| Bachelor's Degree or higher | 471 (76.5%) | 0 (0.0%) |
| Total | 4,007 (70.7%) | 249 (4.4%) |
Employment Occupations by Sex in White City
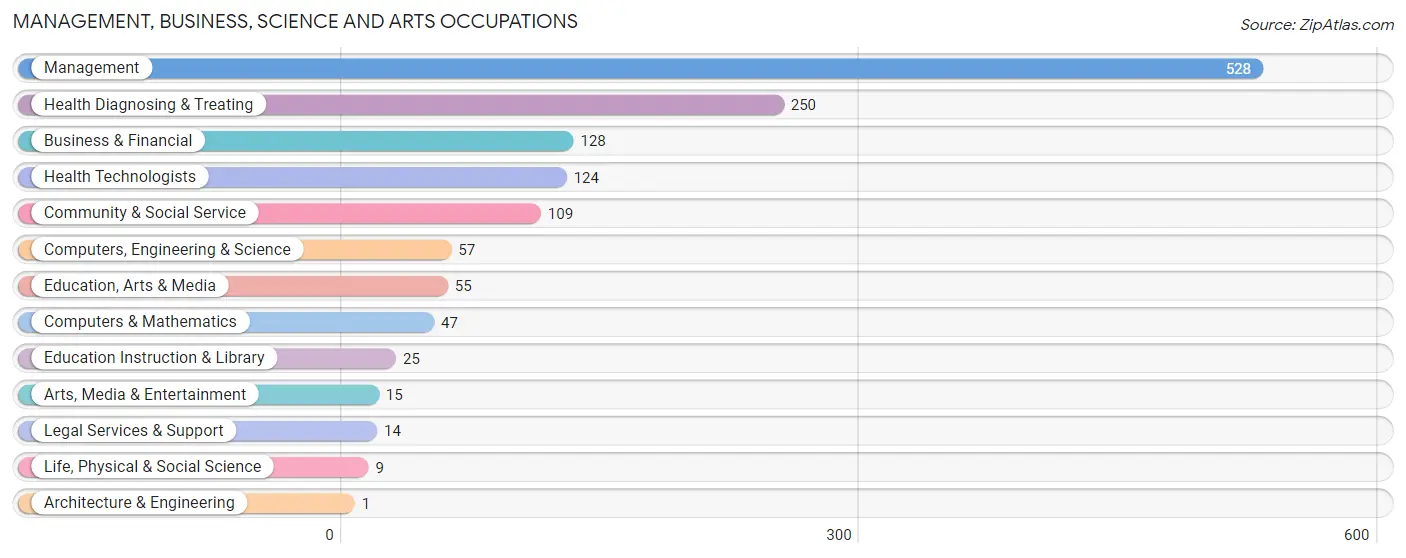
Management, Business, Science and Arts Occupations
The most common Management, Business, Science and Arts occupations in White City are Management (528 | 11.5%), Health Diagnosing & Treating (250 | 5.4%), Business & Financial (128 | 2.8%), Health Technologists (124 | 2.7%), and Community & Social Service (109 | 2.4%).
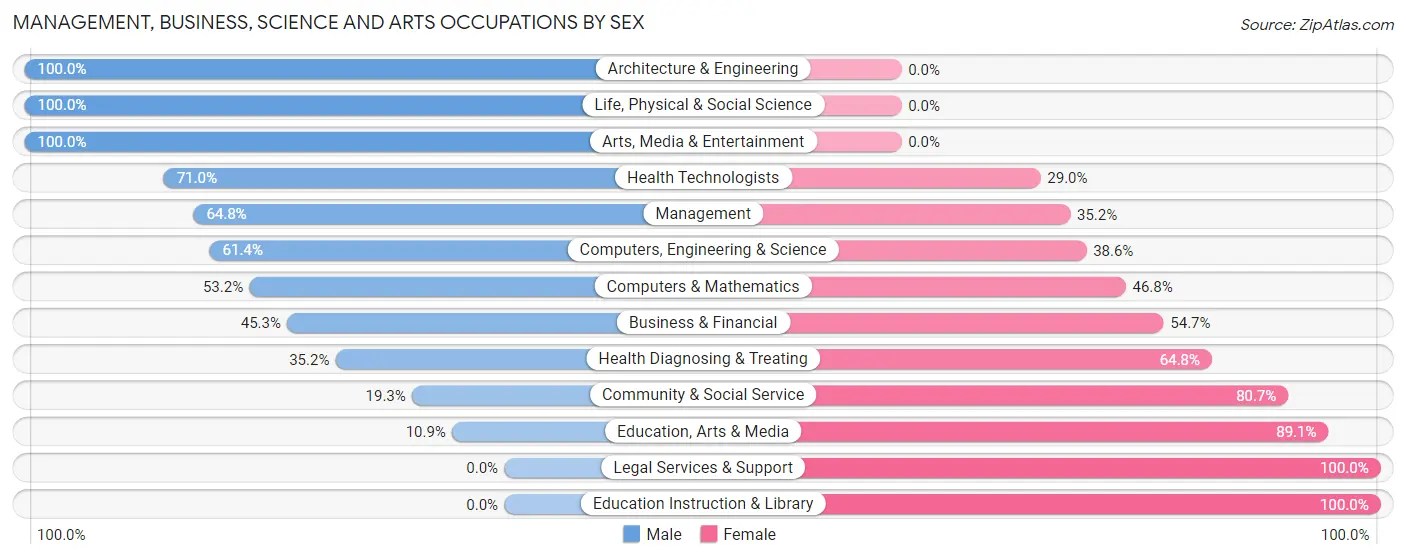
Management, Business, Science and Arts Occupations by Sex
Within the Management, Business, Science and Arts occupations in White City, the most male-oriented occupations are Architecture & Engineering (100.0%), Life, Physical & Social Science (100.0%), and Arts, Media & Entertainment (100.0%), while the most female-oriented occupations are Legal Services & Support (100.0%), Education Instruction & Library (100.0%), and Education, Arts & Media (89.1%).
| Occupation | Male | Female |
| Management | 342 (64.8%) | 186 (35.2%) |
| Business & Financial | 58 (45.3%) | 70 (54.7%) |
| Computers, Engineering & Science | 35 (61.4%) | 22 (38.6%) |
| Computers & Mathematics | 25 (53.2%) | 22 (46.8%) |
| Architecture & Engineering | 1 (100.0%) | 0 (0.0%) |
| Life, Physical & Social Science | 9 (100.0%) | 0 (0.0%) |
| Community & Social Service | 21 (19.3%) | 88 (80.7%) |
| Education, Arts & Media | 6 (10.9%) | 49 (89.1%) |
| Legal Services & Support | 0 (0.0%) | 14 (100.0%) |
| Education Instruction & Library | 0 (0.0%) | 25 (100.0%) |
| Arts, Media & Entertainment | 15 (100.0%) | 0 (0.0%) |
| Health Diagnosing & Treating | 88 (35.2%) | 162 (64.8%) |
| Health Technologists | 88 (71.0%) | 36 (29.0%) |
| Total (Category) | 544 (50.7%) | 528 (49.2%) |
| Total (Overall) | 2,676 (58.1%) | 1,933 (41.9%) |
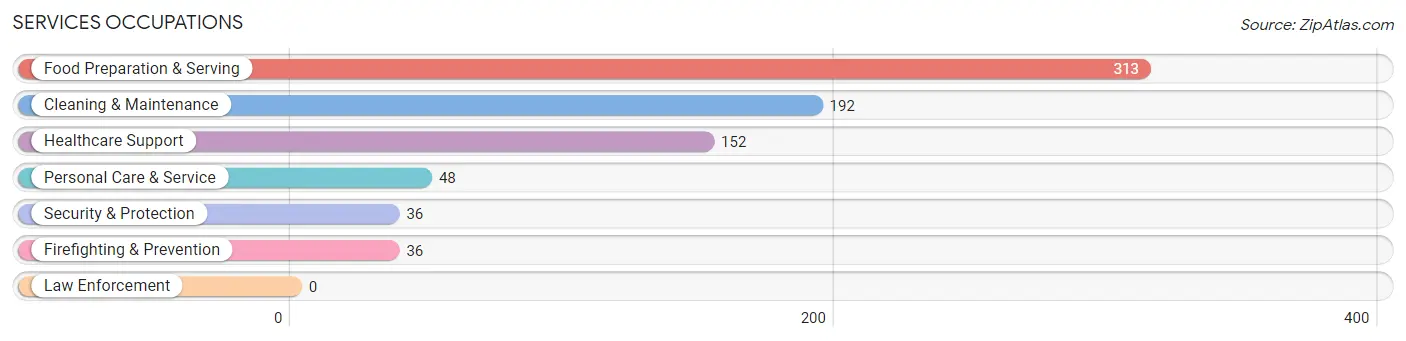
Services Occupations
The most common Services occupations in White City are Food Preparation & Serving (313 | 6.8%), Cleaning & Maintenance (192 | 4.2%), Healthcare Support (152 | 3.3%), Personal Care & Service (48 | 1.0%), and Security & Protection (36 | 0.8%).
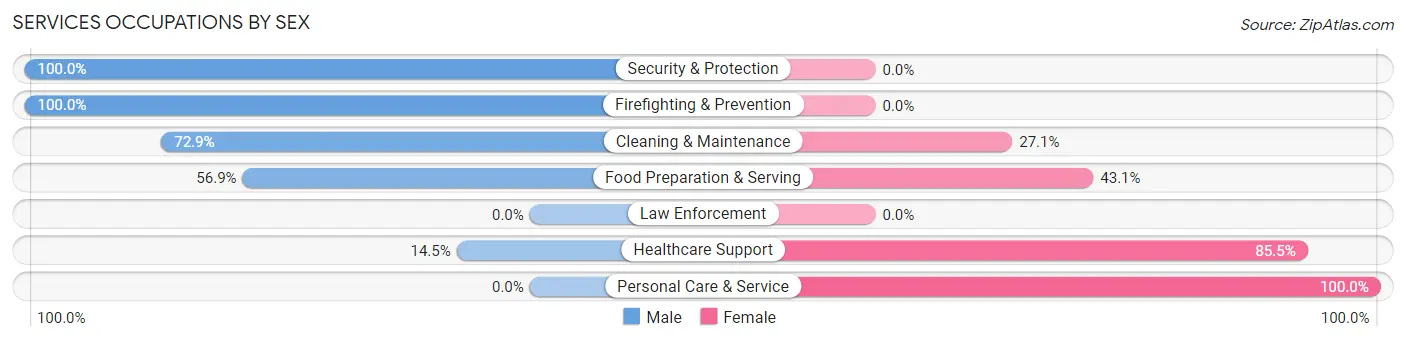
Services Occupations by Sex
Within the Services occupations in White City, the most male-oriented occupations are Security & Protection (100.0%), Firefighting & Prevention (100.0%), and Cleaning & Maintenance (72.9%), while the most female-oriented occupations are Personal Care & Service (100.0%), Healthcare Support (85.5%), and Food Preparation & Serving (43.1%).
| Occupation | Male | Female |
| Healthcare Support | 22 (14.5%) | 130 (85.5%) |
| Security & Protection | 36 (100.0%) | 0 (0.0%) |
| Firefighting & Prevention | 36 (100.0%) | 0 (0.0%) |
| Law Enforcement | 0 (0.0%) | 0 (0.0%) |
| Food Preparation & Serving | 178 (56.9%) | 135 (43.1%) |
| Cleaning & Maintenance | 140 (72.9%) | 52 (27.1%) |
| Personal Care & Service | 0 (0.0%) | 48 (100.0%) |
| Total (Category) | 376 (50.7%) | 365 (49.3%) |
| Total (Overall) | 2,676 (58.1%) | 1,933 (41.9%) |
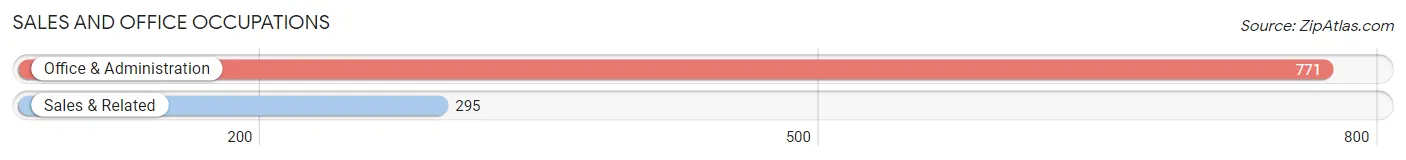
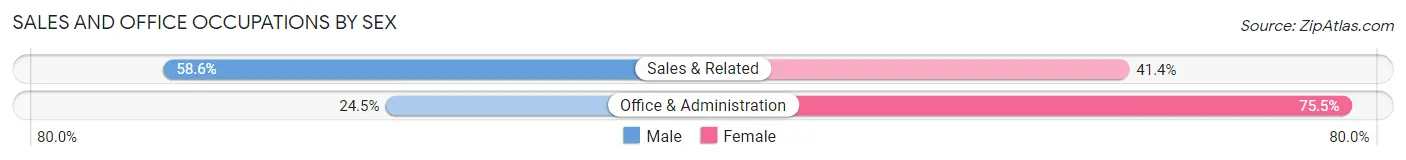
Sales and Office Occupations
The most common Sales and Office occupations in White City are Office & Administration (771 | 16.7%), and Sales & Related (295 | 6.4%).
Sales and Office Occupations by Sex
| Occupation | Male | Female |
| Sales & Related | 173 (58.6%) | 122 (41.4%) |
| Office & Administration | 189 (24.5%) | 582 (75.5%) |
| Total (Category) | 362 (34.0%) | 704 (66.0%) |
| Total (Overall) | 2,676 (58.1%) | 1,933 (41.9%) |
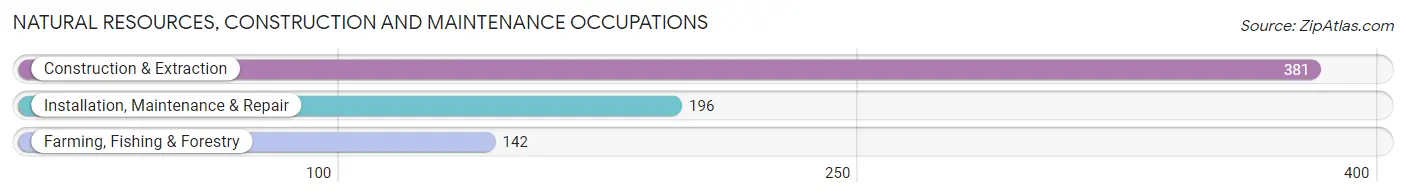
Natural Resources, Construction and Maintenance Occupations
The most common Natural Resources, Construction and Maintenance occupations in White City are Construction & Extraction (381 | 8.3%), Installation, Maintenance & Repair (196 | 4.3%), and Farming, Fishing & Forestry (142 | 3.1%).
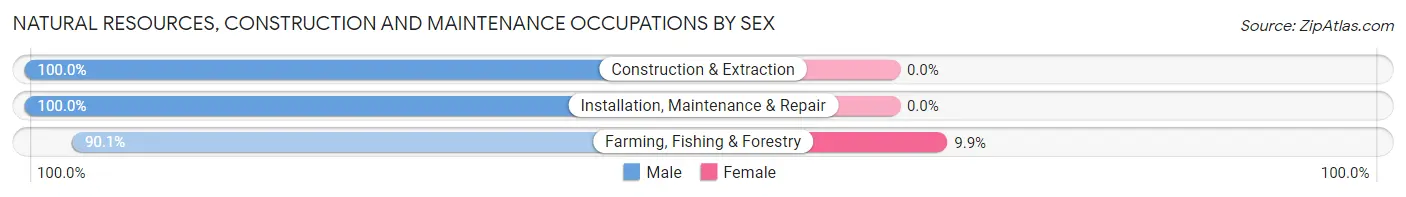
Natural Resources, Construction and Maintenance Occupations by Sex
| Occupation | Male | Female |
| Farming, Fishing & Forestry | 128 (90.1%) | 14 (9.9%) |
| Construction & Extraction | 381 (100.0%) | 0 (0.0%) |
| Installation, Maintenance & Repair | 196 (100.0%) | 0 (0.0%) |
| Total (Category) | 705 (98.1%) | 14 (1.9%) |
| Total (Overall) | 2,676 (58.1%) | 1,933 (41.9%) |
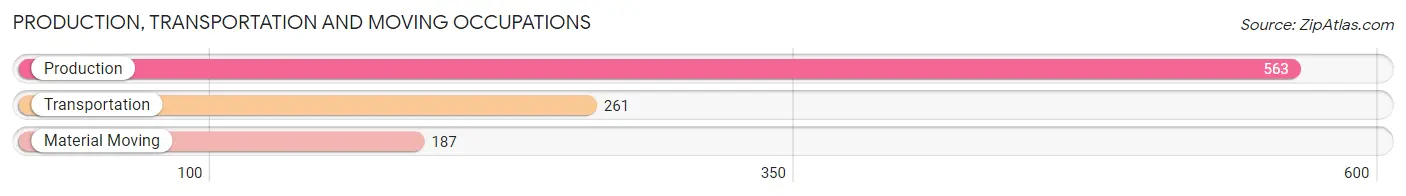
Production, Transportation and Moving Occupations
The most common Production, Transportation and Moving occupations in White City are Production (563 | 12.2%), Transportation (261 | 5.7%), and Material Moving (187 | 4.1%).
Production, Transportation and Moving Occupations by Sex
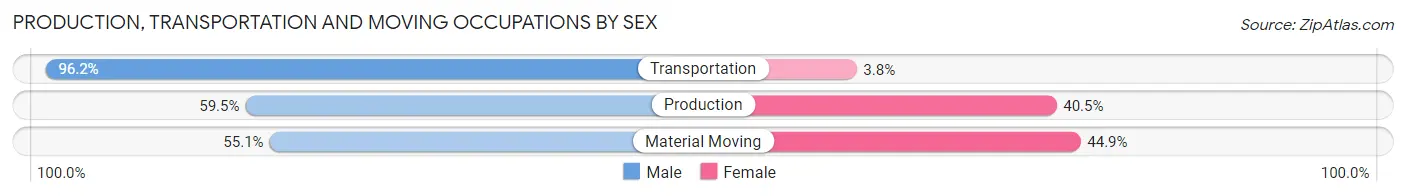
| Occupation | Male | Female |
| Production | 335 (59.5%) | 228 (40.5%) |
| Transportation | 251 (96.2%) | 10 (3.8%) |
| Material Moving | 103 (55.1%) | 84 (44.9%) |
| Total (Category) | 689 (68.1%) | 322 (31.9%) |
| Total (Overall) | 2,676 (58.1%) | 1,933 (41.9%) |
Employment Industries by Sex in White City
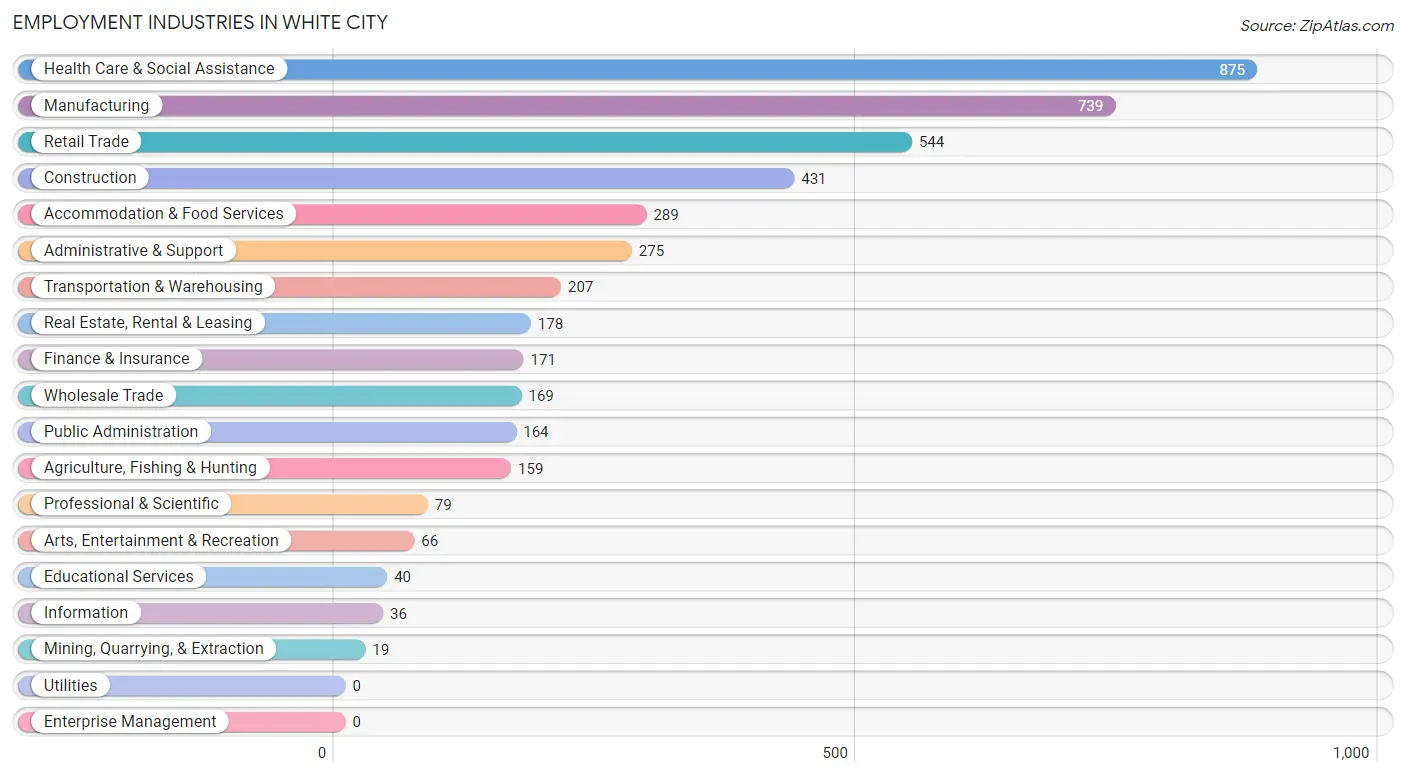
Employment Industries in White City
The major employment industries in White City include Health Care & Social Assistance (875 | 19.0%), Manufacturing (739 | 16.0%), Retail Trade (544 | 11.8%), Construction (431 | 9.3%), and Accommodation & Food Services (289 | 6.3%).
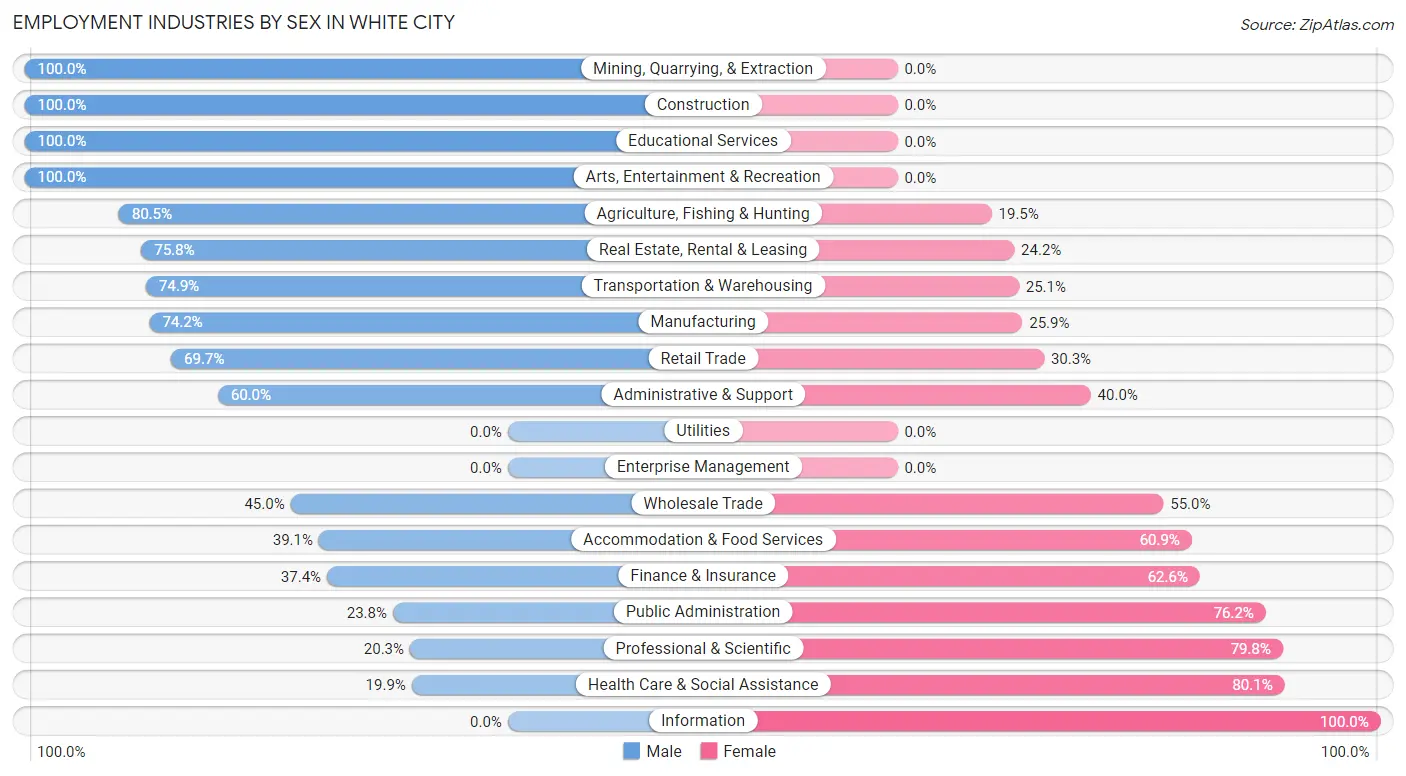
Employment Industries by Sex in White City
The White City industries that see more men than women are Mining, Quarrying, & Extraction (100.0%), Construction (100.0%), and Educational Services (100.0%), whereas the industries that tend to have a higher number of women are Information (100.0%), Health Care & Social Assistance (80.1%), and Professional & Scientific (79.7%).
| Industry | Male | Female |
| Agriculture, Fishing & Hunting | 128 (80.5%) | 31 (19.5%) |
| Mining, Quarrying, & Extraction | 19 (100.0%) | 0 (0.0%) |
| Construction | 431 (100.0%) | 0 (0.0%) |
| Manufacturing | 548 (74.2%) | 191 (25.9%) |
| Wholesale Trade | 76 (45.0%) | 93 (55.0%) |
| Retail Trade | 379 (69.7%) | 165 (30.3%) |
| Transportation & Warehousing | 155 (74.9%) | 52 (25.1%) |
| Utilities | 0 (0.0%) | 0 (0.0%) |
| Information | 0 (0.0%) | 36 (100.0%) |
| Finance & Insurance | 64 (37.4%) | 107 (62.6%) |
| Real Estate, Rental & Leasing | 135 (75.8%) | 43 (24.2%) |
| Professional & Scientific | 16 (20.3%) | 63 (79.7%) |
| Enterprise Management | 0 (0.0%) | 0 (0.0%) |
| Administrative & Support | 165 (60.0%) | 110 (40.0%) |
| Educational Services | 40 (100.0%) | 0 (0.0%) |
| Health Care & Social Assistance | 174 (19.9%) | 701 (80.1%) |
| Arts, Entertainment & Recreation | 66 (100.0%) | 0 (0.0%) |
| Accommodation & Food Services | 113 (39.1%) | 176 (60.9%) |
| Public Administration | 39 (23.8%) | 125 (76.2%) |
| Total | 2,676 (58.1%) | 1,933 (41.9%) |
Education in White City
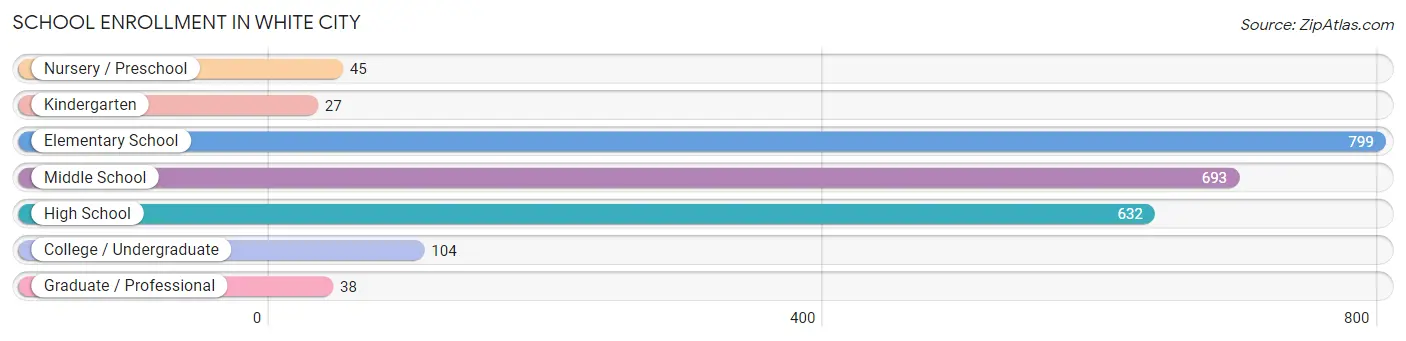
School Enrollment in White City
The most common levels of schooling among the 2,338 students in White City are elementary school (799 | 34.2%), middle school (693 | 29.6%), and high school (632 | 27.0%).
| School Level | # Students | % Students |
| Nursery / Preschool | 45 | 1.9% |
| Kindergarten | 27 | 1.1% |
| Elementary School | 799 | 34.2% |
| Middle School | 693 | 29.6% |
| High School | 632 | 27.0% |
| College / Undergraduate | 104 | 4.4% |
| Graduate / Professional | 38 | 1.6% |
| Total | 2,338 | 100.0% |
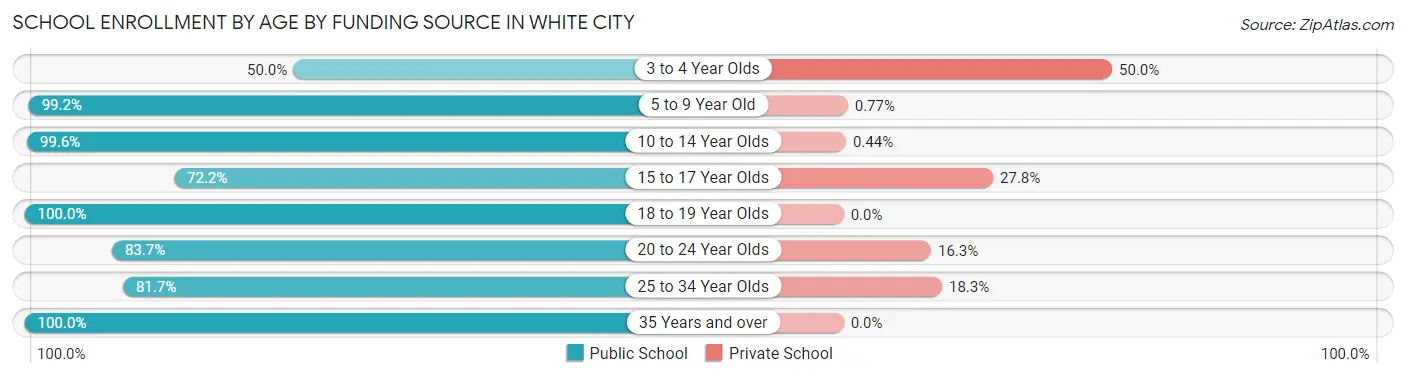
School Enrollment by Age by Funding Source in White City
Out of a total of 2,338 students who are enrolled in schools in White City, 171 (7.3%) attend a private institution, while the remaining 2,167 (92.7%) are enrolled in public schools. The age group of 3 to 4 year olds has the highest likelihood of being enrolled in private schools, with 18 (50.0% in the age bracket) enrolled. Conversely, the age group of 18 to 19 year olds has the lowest likelihood of being enrolled in a private school, with 141 (100.0% in the age bracket) attending a public institution.
| Age Bracket | Public School | Private School |
| 3 to 4 Year Olds | 18 (50.0%) | 18 (50.0%) |
| 5 to 9 Year Old | 647 (99.2%) | 5 (0.8%) |
| 10 to 14 Year Olds | 913 (99.6%) | 4 (0.4%) |
| 15 to 17 Year Olds | 324 (72.2%) | 125 (27.8%) |
| 18 to 19 Year Olds | 141 (100.0%) | 0 (0.0%) |
| 20 to 24 Year Olds | 36 (83.7%) | 7 (16.3%) |
| 25 to 34 Year Olds | 49 (81.7%) | 11 (18.3%) |
| 35 Years and over | 40 (100.0%) | 0 (0.0%) |
| Total | 2,167 (92.7%) | 171 (7.3%) |
Educational Attainment by Field of Study in White City
Business (313 | 39.4%), social sciences (123 | 15.5%), engineering (72 | 9.1%), education (60 | 7.5%), and communications (40 | 5.0%) are the most common fields of study among 795 individuals in White City who have obtained a bachelor's degree or higher.
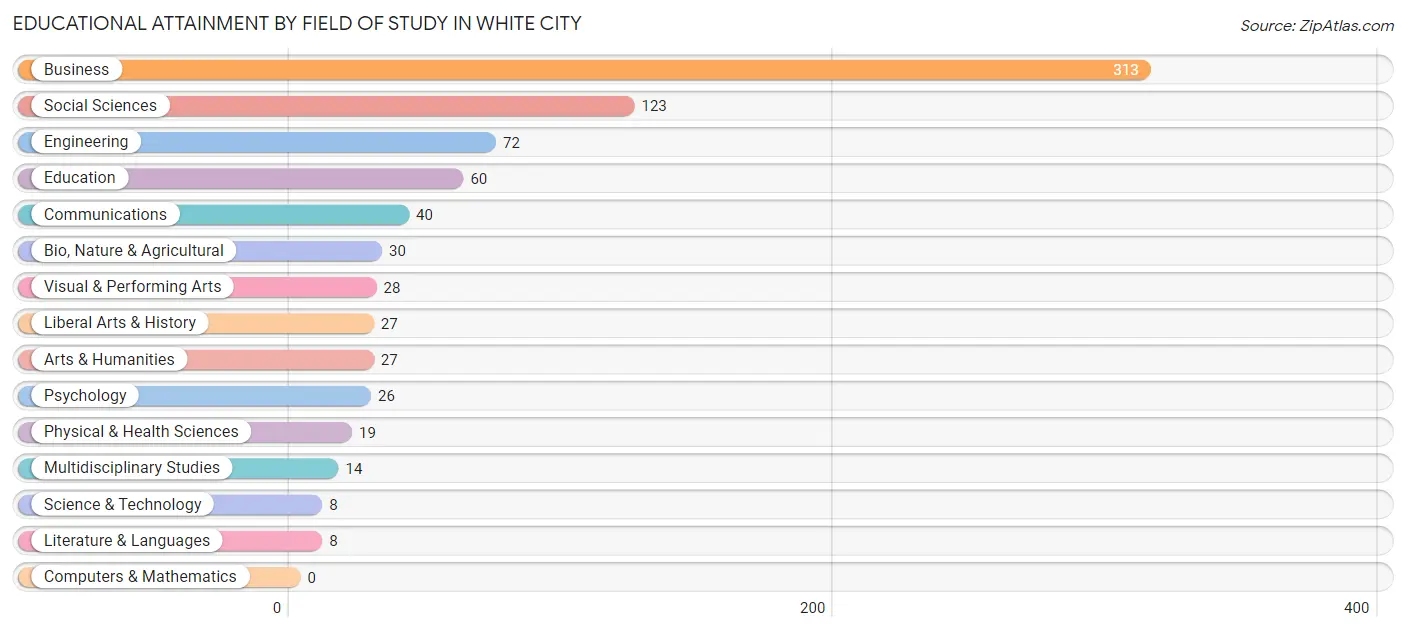
| Field of Study | # Graduates | % Graduates |
| Computers & Mathematics | 0 | 0.0% |
| Bio, Nature & Agricultural | 30 | 3.8% |
| Physical & Health Sciences | 19 | 2.4% |
| Psychology | 26 | 3.3% |
| Social Sciences | 123 | 15.5% |
| Engineering | 72 | 9.1% |
| Multidisciplinary Studies | 14 | 1.8% |
| Science & Technology | 8 | 1.0% |
| Business | 313 | 39.4% |
| Education | 60 | 7.5% |
| Literature & Languages | 8 | 1.0% |
| Liberal Arts & History | 27 | 3.4% |
| Visual & Performing Arts | 28 | 3.5% |
| Communications | 40 | 5.0% |
| Arts & Humanities | 27 | 3.4% |
| Total | 795 | 100.0% |
Transportation & Commute in White City
Vehicle Availability by Sex in White City
The most prevalent vehicle ownership categories in White City are males with 2 vehicles (1,024, accounting for 38.6%) and females with 2 vehicles (574, making up 53.0%).
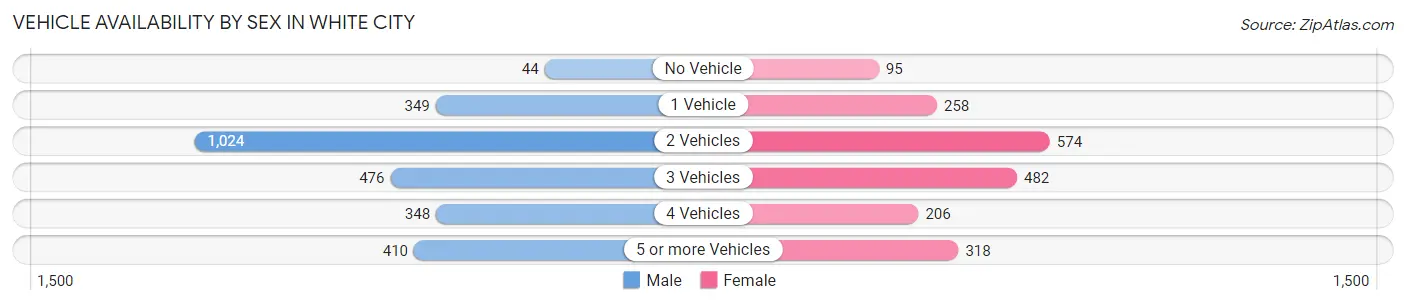
| Vehicles Available | Male | Female |
| No Vehicle | 44 (1.7%) | 95 (4.9%) |
| 1 Vehicle | 349 (13.2%) | 258 (13.4%) |
| 2 Vehicles | 1,024 (38.6%) | 574 (29.7%) |
| 3 Vehicles | 476 (18.0%) | 482 (24.9%) |
| 4 Vehicles | 348 (13.1%) | 206 (10.7%) |
| 5 or more Vehicles | 410 (15.5%) | 318 (16.5%) |
| Total | 2,651 (100.0%) | 1,933 (100.0%) |
Commute Time in White City
The most frequently occuring commute durations in White City are 20 to 24 minutes (809 commuters, 18.7%), 10 to 14 minutes (788 commuters, 18.2%), and 15 to 19 minutes (623 commuters, 14.4%).
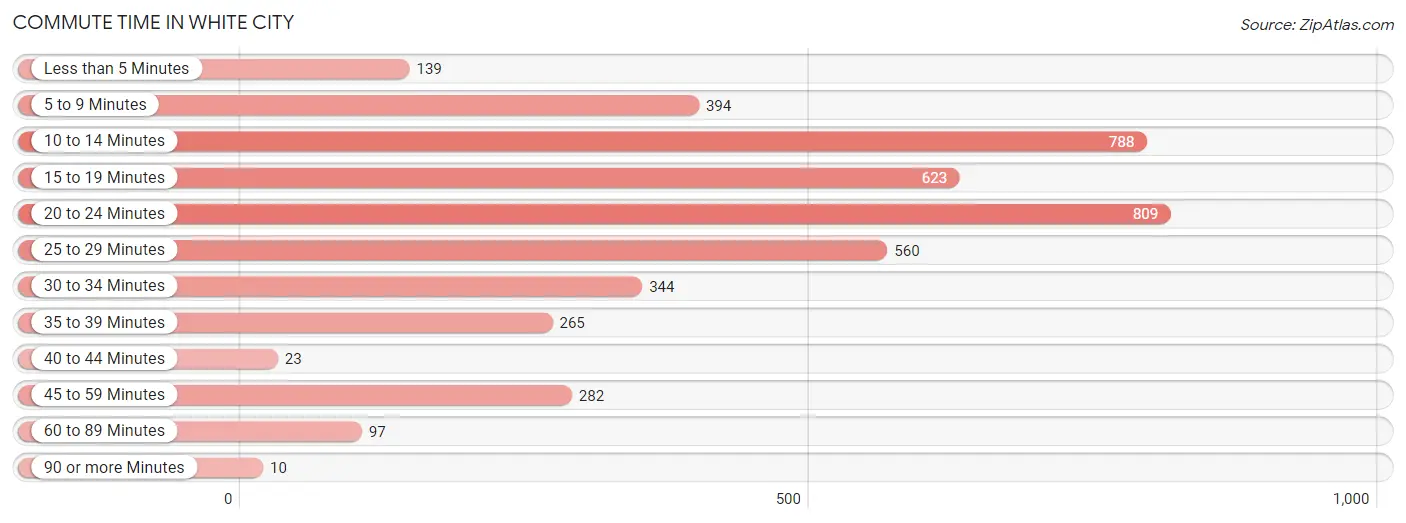
| Commute Time | # Commuters | % Commuters |
| Less than 5 Minutes | 139 | 3.2% |
| 5 to 9 Minutes | 394 | 9.1% |
| 10 to 14 Minutes | 788 | 18.2% |
| 15 to 19 Minutes | 623 | 14.4% |
| 20 to 24 Minutes | 809 | 18.7% |
| 25 to 29 Minutes | 560 | 12.9% |
| 30 to 34 Minutes | 344 | 7.9% |
| 35 to 39 Minutes | 265 | 6.1% |
| 40 to 44 Minutes | 23 | 0.5% |
| 45 to 59 Minutes | 282 | 6.5% |
| 60 to 89 Minutes | 97 | 2.2% |
| 90 or more Minutes | 10 | 0.2% |
Commute Time by Sex in White City
The most common commute times in White City are 10 to 14 minutes (628 commuters, 24.8%) for males and 25 to 29 minutes (461 commuters, 25.5%) for females.
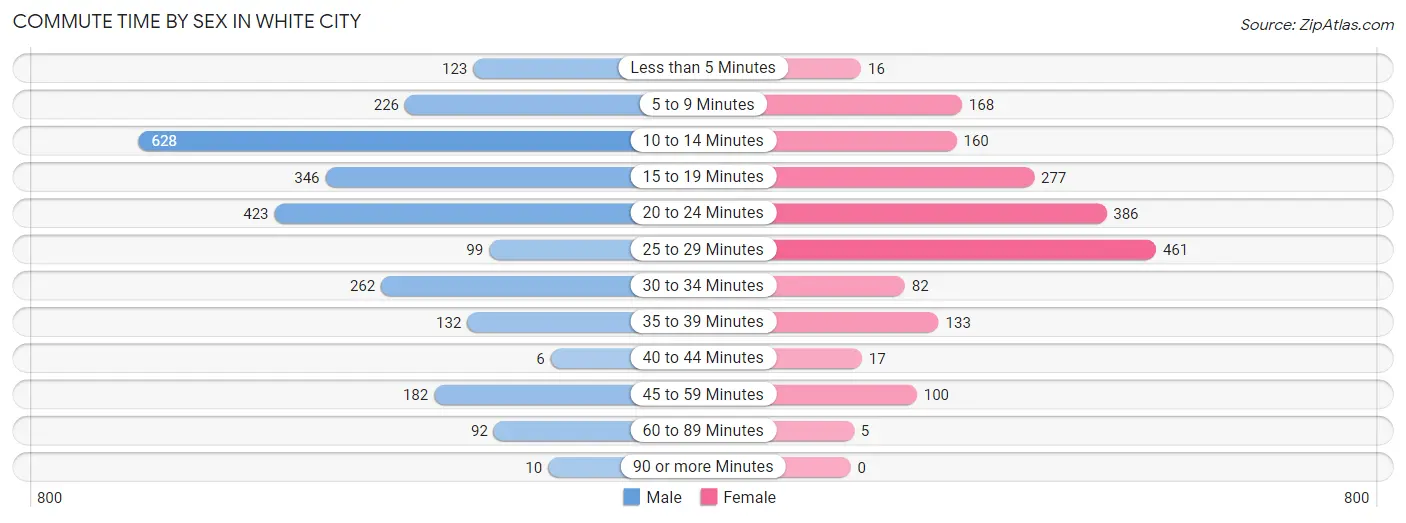
| Commute Time | Male | Female |
| Less than 5 Minutes | 123 (4.9%) | 16 (0.9%) |
| 5 to 9 Minutes | 226 (8.9%) | 168 (9.3%) |
| 10 to 14 Minutes | 628 (24.8%) | 160 (8.9%) |
| 15 to 19 Minutes | 346 (13.7%) | 277 (15.3%) |
| 20 to 24 Minutes | 423 (16.7%) | 386 (21.4%) |
| 25 to 29 Minutes | 99 (3.9%) | 461 (25.5%) |
| 30 to 34 Minutes | 262 (10.4%) | 82 (4.5%) |
| 35 to 39 Minutes | 132 (5.2%) | 133 (7.4%) |
| 40 to 44 Minutes | 6 (0.2%) | 17 (0.9%) |
| 45 to 59 Minutes | 182 (7.2%) | 100 (5.5%) |
| 60 to 89 Minutes | 92 (3.6%) | 5 (0.3%) |
| 90 or more Minutes | 10 (0.4%) | 0 (0.0%) |
Time of Departure to Work by Sex in White City
The most frequent times of departure to work in White City are 6:30 AM to 6:59 AM (396, 15.7%) for males and 7:00 AM to 7:29 AM (564, 31.2%) for females.
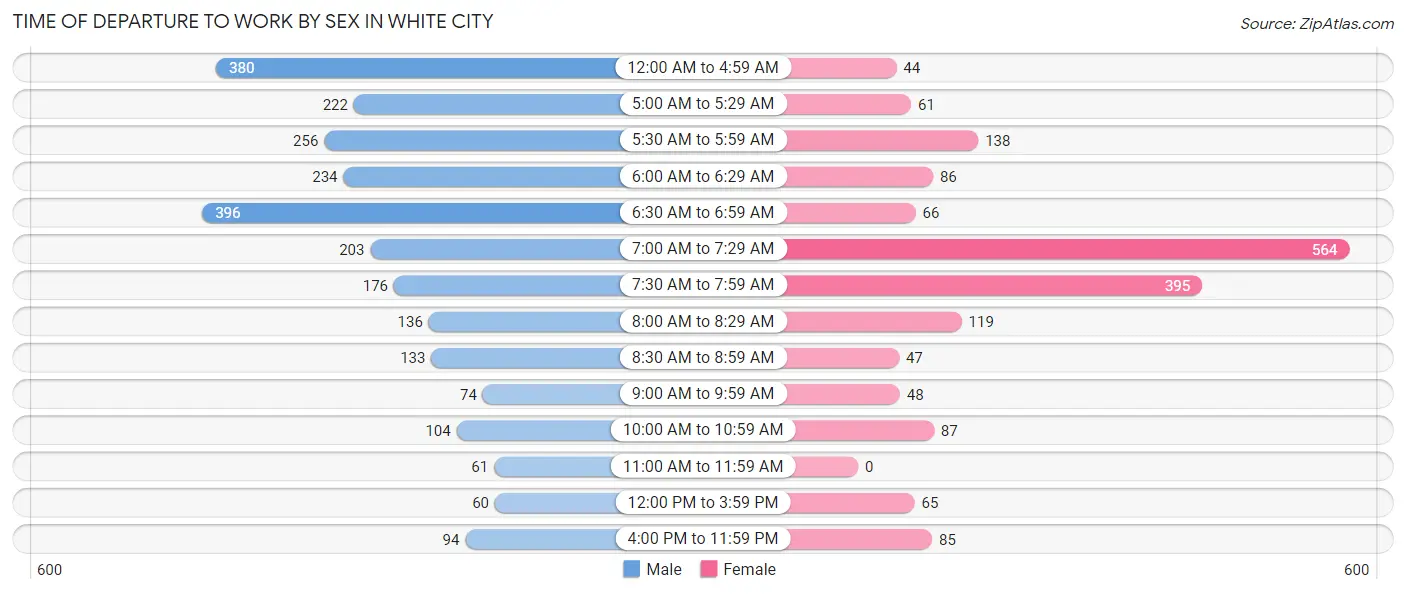
| Time of Departure | Male | Female |
| 12:00 AM to 4:59 AM | 380 (15.0%) | 44 (2.4%) |
| 5:00 AM to 5:29 AM | 222 (8.8%) | 61 (3.4%) |
| 5:30 AM to 5:59 AM | 256 (10.1%) | 138 (7.6%) |
| 6:00 AM to 6:29 AM | 234 (9.2%) | 86 (4.8%) |
| 6:30 AM to 6:59 AM | 396 (15.7%) | 66 (3.7%) |
| 7:00 AM to 7:29 AM | 203 (8.0%) | 564 (31.2%) |
| 7:30 AM to 7:59 AM | 176 (7.0%) | 395 (21.9%) |
| 8:00 AM to 8:29 AM | 136 (5.4%) | 119 (6.6%) |
| 8:30 AM to 8:59 AM | 133 (5.3%) | 47 (2.6%) |
| 9:00 AM to 9:59 AM | 74 (2.9%) | 48 (2.7%) |
| 10:00 AM to 10:59 AM | 104 (4.1%) | 87 (4.8%) |
| 11:00 AM to 11:59 AM | 61 (2.4%) | 0 (0.0%) |
| 12:00 PM to 3:59 PM | 60 (2.4%) | 65 (3.6%) |
| 4:00 PM to 11:59 PM | 94 (3.7%) | 85 (4.7%) |
| Total | 2,529 (100.0%) | 1,805 (100.0%) |
Housing Occupancy in White City
Occupancy by Ownership in White City
Of the total 3,284 dwellings in White City, owner-occupied units account for 2,798 (85.2%), while renter-occupied units make up 486 (14.8%).
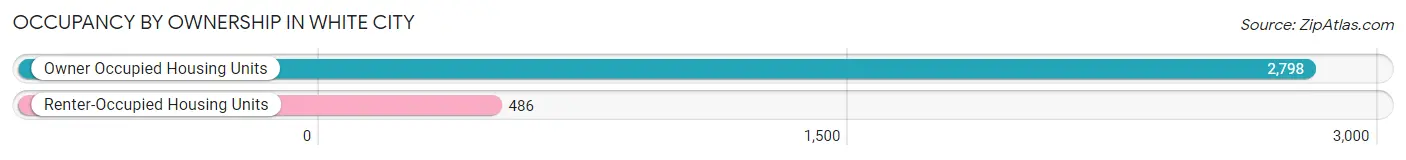
| Occupancy | # Housing Units | % Housing Units |
| Owner Occupied Housing Units | 2,798 | 85.2% |
| Renter-Occupied Housing Units | 486 | 14.8% |
| Total Occupied Housing Units | 3,284 | 100.0% |
Occupancy by Household Size in White City
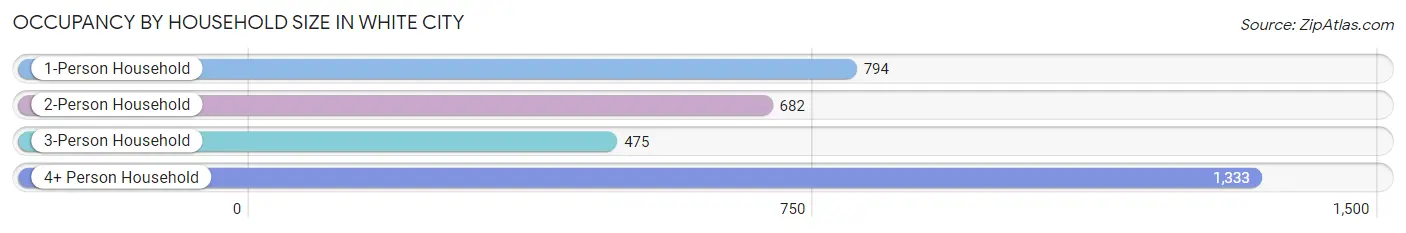
| Household Size | # Housing Units | % Housing Units |
| 1-Person Household | 794 | 24.2% |
| 2-Person Household | 682 | 20.8% |
| 3-Person Household | 475 | 14.5% |
| 4+ Person Household | 1,333 | 40.6% |
| Total Housing Units | 3,284 | 100.0% |
Occupancy by Ownership by Household Size in White City
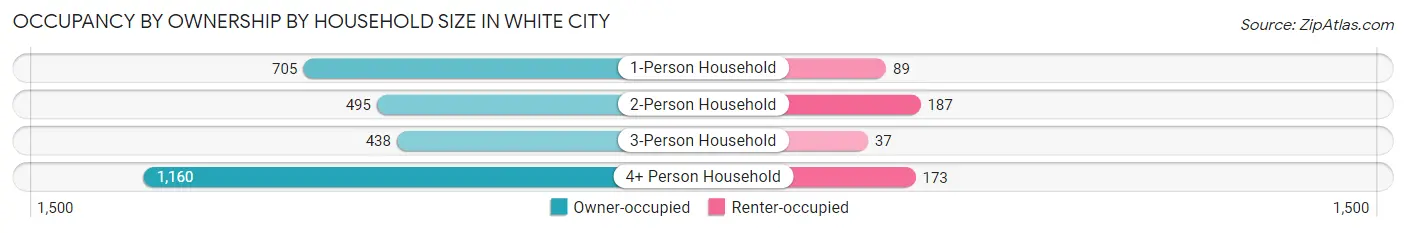
| Household Size | Owner-occupied | Renter-occupied |
| 1-Person Household | 705 (88.8%) | 89 (11.2%) |
| 2-Person Household | 495 (72.6%) | 187 (27.4%) |
| 3-Person Household | 438 (92.2%) | 37 (7.8%) |
| 4+ Person Household | 1,160 (87.0%) | 173 (13.0%) |
| Total Housing Units | 2,798 (85.2%) | 486 (14.8%) |
Occupancy by Educational Attainment in White City
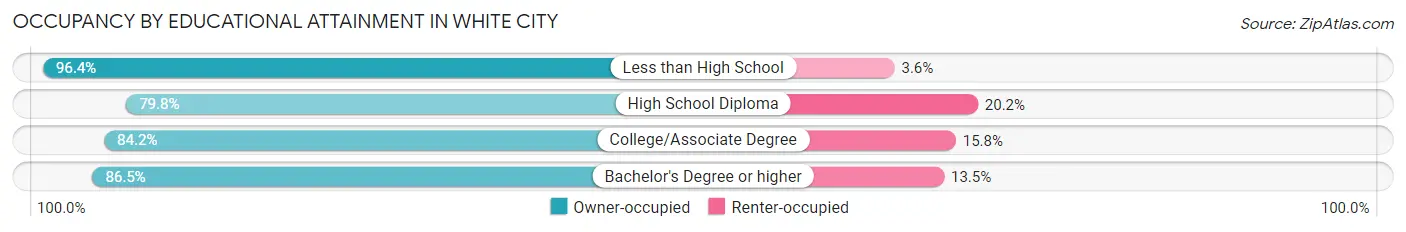
| Household Size | Owner-occupied | Renter-occupied |
| Less than High School | 609 (96.4%) | 23 (3.6%) |
| High School Diploma | 970 (79.8%) | 245 (20.2%) |
| College/Associate Degree | 891 (84.2%) | 167 (15.8%) |
| Bachelor's Degree or higher | 328 (86.5%) | 51 (13.5%) |
Occupancy by Age of Householder in White City
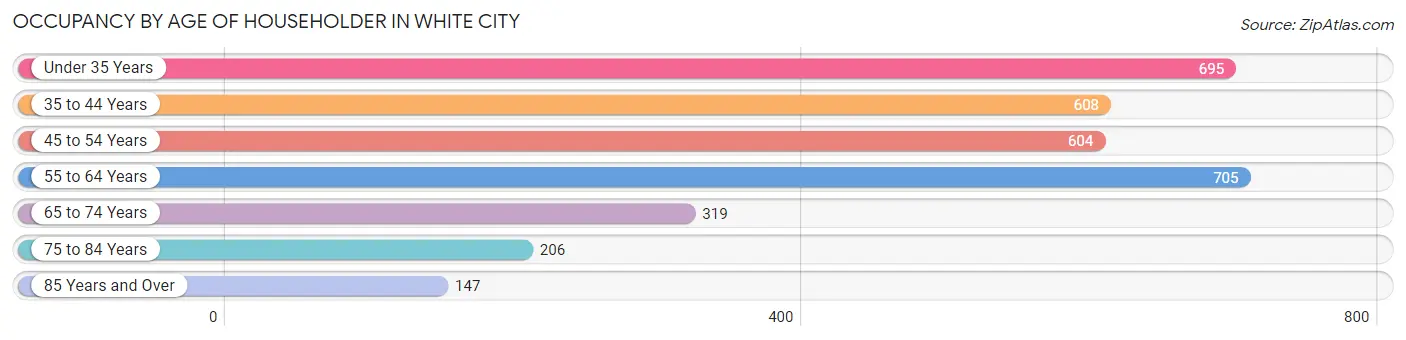
| Age Bracket | # Households | % Households |
| Under 35 Years | 695 | 21.2% |
| 35 to 44 Years | 608 | 18.5% |
| 45 to 54 Years | 604 | 18.4% |
| 55 to 64 Years | 705 | 21.5% |
| 65 to 74 Years | 319 | 9.7% |
| 75 to 84 Years | 206 | 6.3% |
| 85 Years and Over | 147 | 4.5% |
| Total | 3,284 | 100.0% |
Housing Finances in White City
Median Income by Occupancy in White City
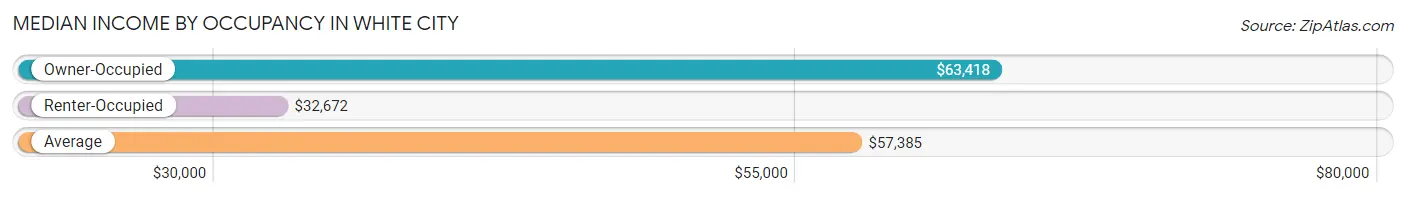
| Occupancy Type | # Households | Median Income |
| Owner-Occupied | 2,798 (85.2%) | $63,418 |
| Renter-Occupied | 486 (14.8%) | $32,672 |
| Average | 3,284 (100.0%) | $57,385 |
Occupancy by Householder Income Bracket in White City
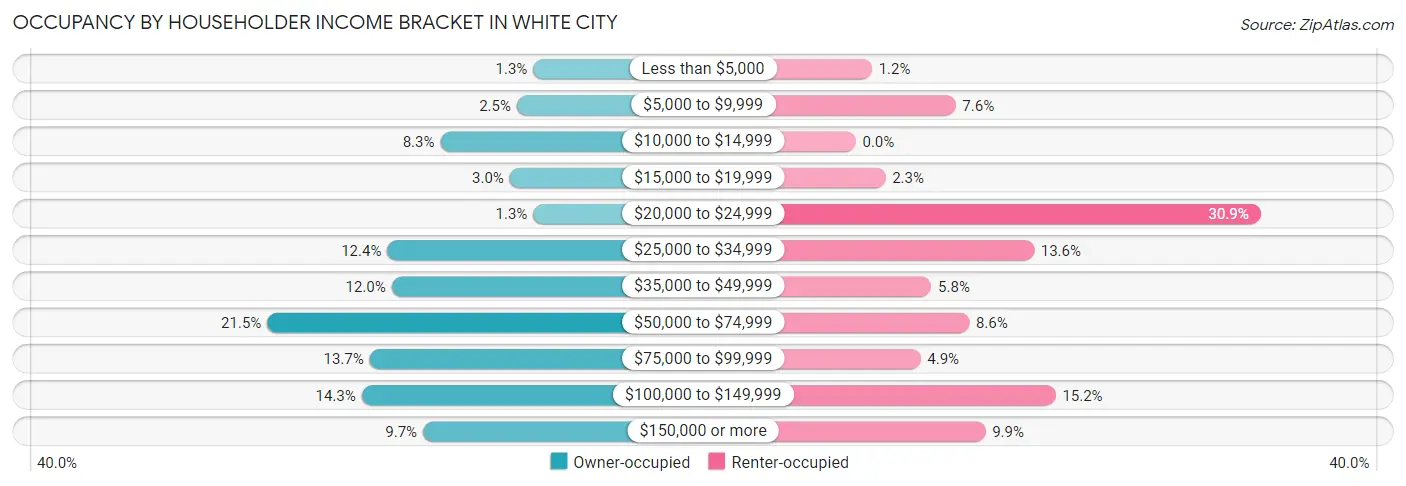
| Income Bracket | Owner-occupied | Renter-occupied |
| Less than $5,000 | 35 (1.3%) | 6 (1.2%) |
| $5,000 to $9,999 | 70 (2.5%) | 37 (7.6%) |
| $10,000 to $14,999 | 233 (8.3%) | 0 (0.0%) |
| $15,000 to $19,999 | 85 (3.0%) | 11 (2.3%) |
| $20,000 to $24,999 | 35 (1.3%) | 150 (30.9%) |
| $25,000 to $34,999 | 346 (12.4%) | 66 (13.6%) |
| $35,000 to $49,999 | 337 (12.0%) | 28 (5.8%) |
| $50,000 to $74,999 | 602 (21.5%) | 42 (8.6%) |
| $75,000 to $99,999 | 384 (13.7%) | 24 (4.9%) |
| $100,000 to $149,999 | 401 (14.3%) | 74 (15.2%) |
| $150,000 or more | 270 (9.7%) | 48 (9.9%) |
| Total | 2,798 (100.0%) | 486 (100.0%) |
Monthly Housing Cost Tiers in White City
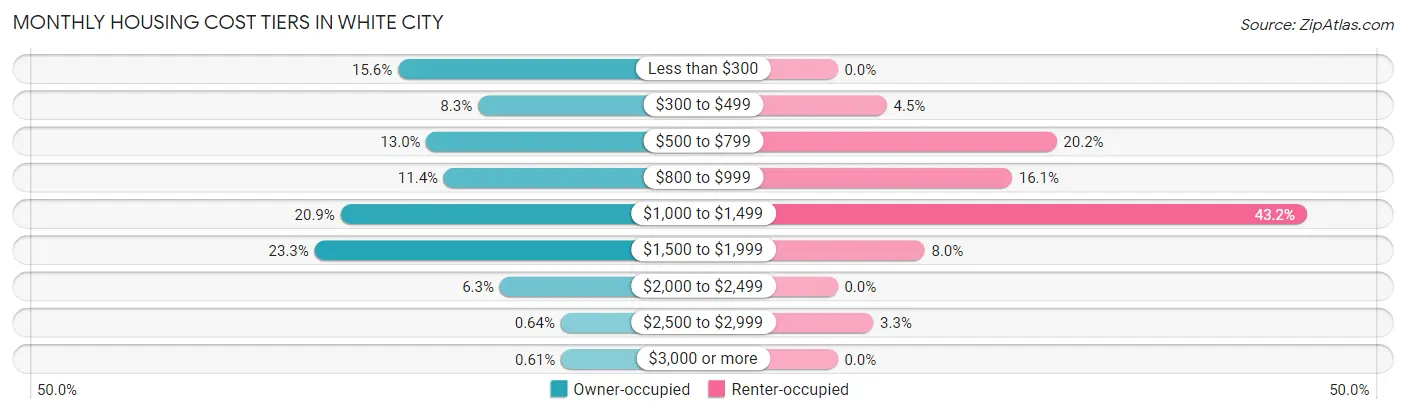
| Monthly Cost | Owner-occupied | Renter-occupied |
| Less than $300 | 437 (15.6%) | 0 (0.0%) |
| $300 to $499 | 231 (8.3%) | 22 (4.5%) |
| $500 to $799 | 364 (13.0%) | 98 (20.2%) |
| $800 to $999 | 319 (11.4%) | 78 (16.1%) |
| $1,000 to $1,499 | 585 (20.9%) | 210 (43.2%) |
| $1,500 to $1,999 | 652 (23.3%) | 39 (8.0%) |
| $2,000 to $2,499 | 175 (6.2%) | 0 (0.0%) |
| $2,500 to $2,999 | 18 (0.6%) | 16 (3.3%) |
| $3,000 or more | 17 (0.6%) | 0 (0.0%) |
| Total | 2,798 (100.0%) | 486 (100.0%) |
Physical Housing Characteristics in White City
Housing Structures in White City
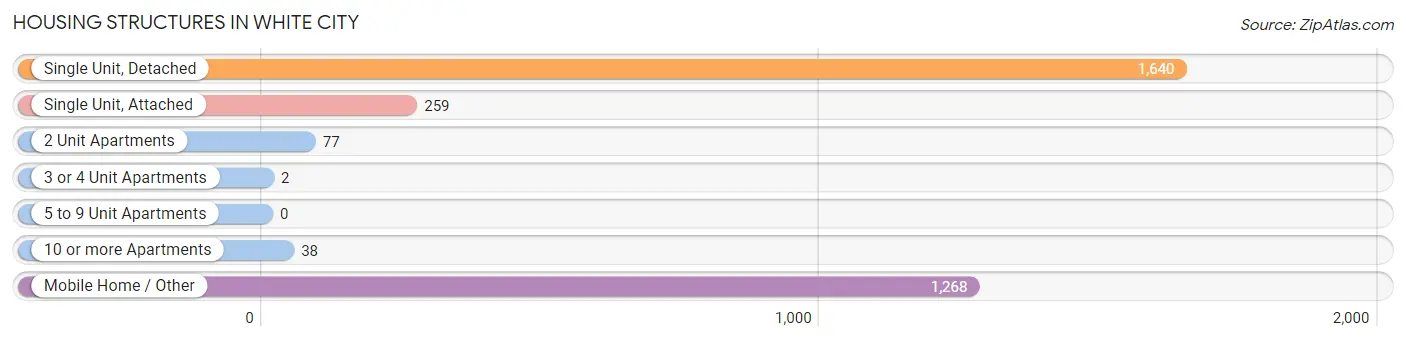
| Structure Type | # Housing Units | % Housing Units |
| Single Unit, Detached | 1,640 | 49.9% |
| Single Unit, Attached | 259 | 7.9% |
| 2 Unit Apartments | 77 | 2.3% |
| 3 or 4 Unit Apartments | 2 | 0.1% |
| 5 to 9 Unit Apartments | 0 | 0.0% |
| 10 or more Apartments | 38 | 1.2% |
| Mobile Home / Other | 1,268 | 38.6% |
| Total | 3,284 | 100.0% |
Housing Structures by Occupancy in White City
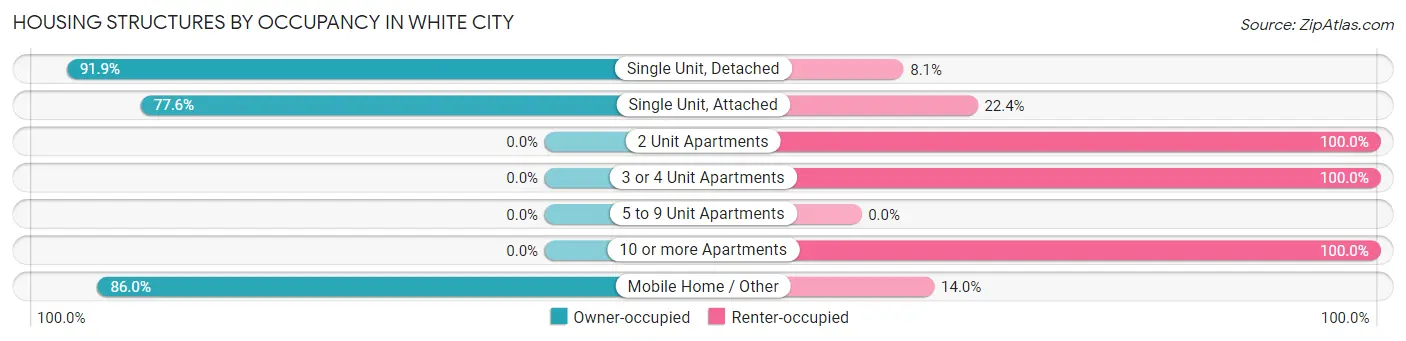
| Structure Type | Owner-occupied | Renter-occupied |
| Single Unit, Detached | 1,507 (91.9%) | 133 (8.1%) |
| Single Unit, Attached | 201 (77.6%) | 58 (22.4%) |
| 2 Unit Apartments | 0 (0.0%) | 77 (100.0%) |
| 3 or 4 Unit Apartments | 0 (0.0%) | 2 (100.0%) |
| 5 to 9 Unit Apartments | 0 (0.0%) | 0 (0.0%) |
| 10 or more Apartments | 0 (0.0%) | 38 (100.0%) |
| Mobile Home / Other | 1,090 (86.0%) | 178 (14.0%) |
| Total | 2,798 (85.2%) | 486 (14.8%) |
Housing Structures by Number of Rooms in White City
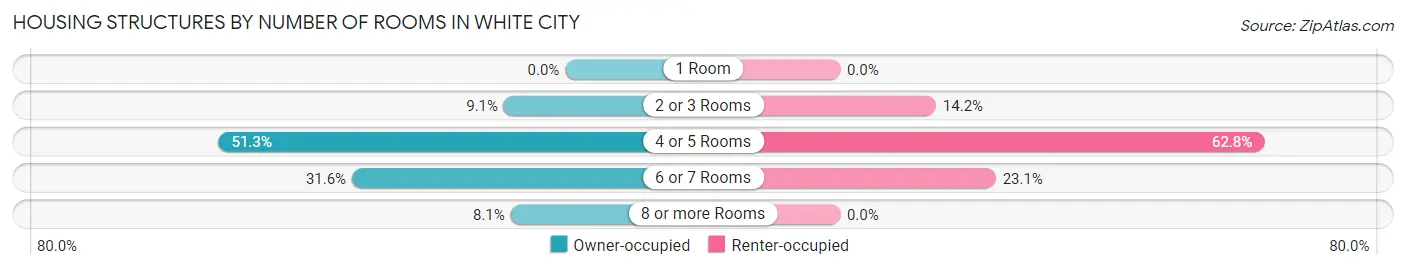
| Number of Rooms | Owner-occupied | Renter-occupied |
| 1 Room | 0 (0.0%) | 0 (0.0%) |
| 2 or 3 Rooms | 254 (9.1%) | 69 (14.2%) |
| 4 or 5 Rooms | 1,435 (51.3%) | 305 (62.8%) |
| 6 or 7 Rooms | 883 (31.6%) | 112 (23.1%) |
| 8 or more Rooms | 226 (8.1%) | 0 (0.0%) |
| Total | 2,798 (100.0%) | 486 (100.0%) |
Housing Structure by Heating Type in White City
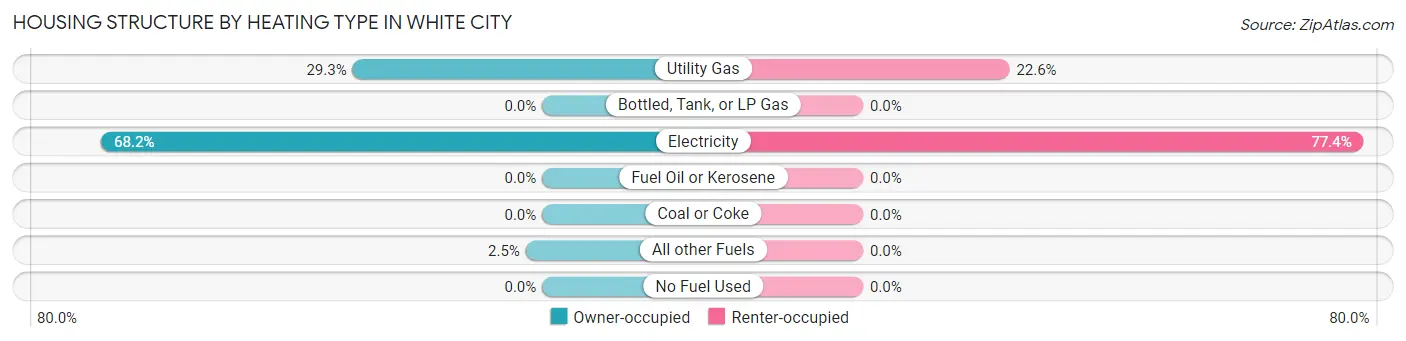
| Heating Type | Owner-occupied | Renter-occupied |
| Utility Gas | 820 (29.3%) | 110 (22.6%) |
| Bottled, Tank, or LP Gas | 0 (0.0%) | 0 (0.0%) |
| Electricity | 1,907 (68.2%) | 376 (77.4%) |
| Fuel Oil or Kerosene | 0 (0.0%) | 0 (0.0%) |
| Coal or Coke | 0 (0.0%) | 0 (0.0%) |
| All other Fuels | 71 (2.5%) | 0 (0.0%) |
| No Fuel Used | 0 (0.0%) | 0 (0.0%) |
| Total | 2,798 (100.0%) | 486 (100.0%) |
Household Vehicle Usage in White City
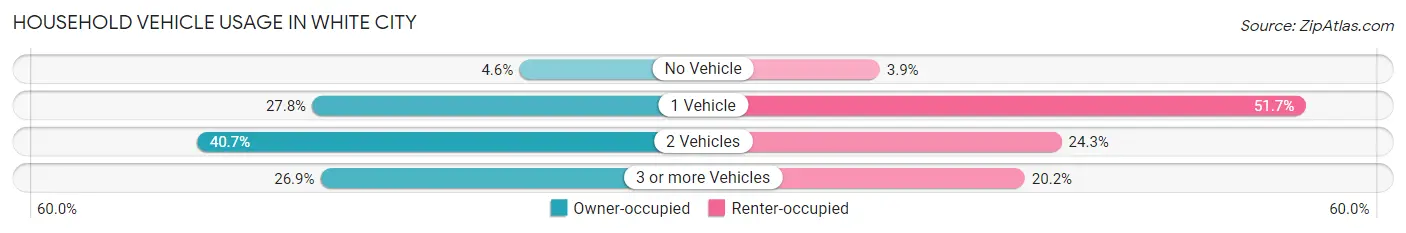
| Vehicles per Household | Owner-occupied | Renter-occupied |
| No Vehicle | 129 (4.6%) | 19 (3.9%) |
| 1 Vehicle | 778 (27.8%) | 251 (51.6%) |
| 2 Vehicles | 1,139 (40.7%) | 118 (24.3%) |
| 3 or more Vehicles | 752 (26.9%) | 98 (20.2%) |
| Total | 2,798 (100.0%) | 486 (100.0%) |
Real Estate & Mortgages in White City
Real Estate and Mortgage Overview in White City
| Characteristic | Without Mortgage | With Mortgage |
| Housing Units | 1,123 | 1,675 |
| Median Property Value | - | - |
| Median Household Income | $27,385 | $270 |
| Monthly Housing Costs | $401 | $17 |
| Real Estate Taxes | $199 | $0 |
Property Value by Mortgage Status in White City
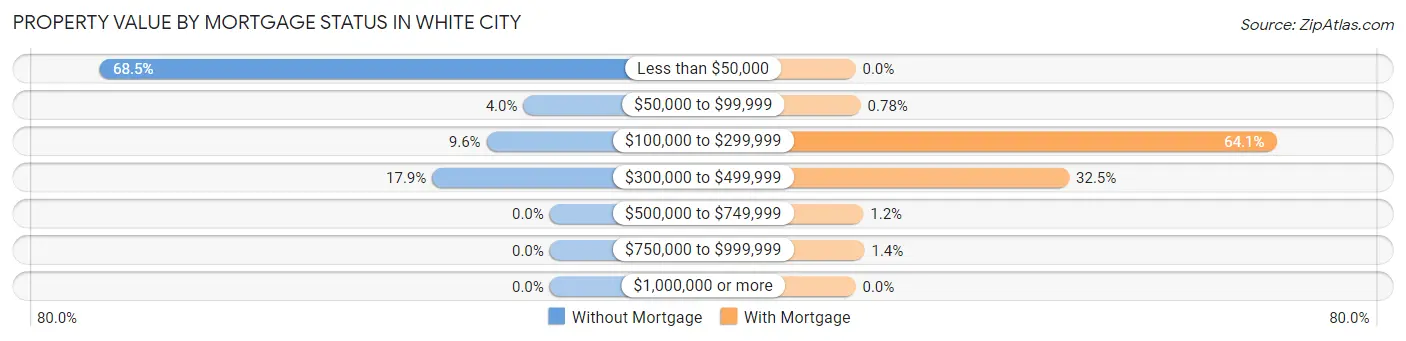
| Property Value | Without Mortgage | With Mortgage |
| Less than $50,000 | 769 (68.5%) | 0 (0.0%) |
| $50,000 to $99,999 | 45 (4.0%) | 13 (0.8%) |
| $100,000 to $299,999 | 108 (9.6%) | 1,074 (64.1%) |
| $300,000 to $499,999 | 201 (17.9%) | 545 (32.5%) |
| $500,000 to $749,999 | 0 (0.0%) | 20 (1.2%) |
| $750,000 to $999,999 | 0 (0.0%) | 23 (1.4%) |
| $1,000,000 or more | 0 (0.0%) | 0 (0.0%) |
| Total | 1,123 (100.0%) | 1,675 (100.0%) |
Household Income by Mortgage Status in White City
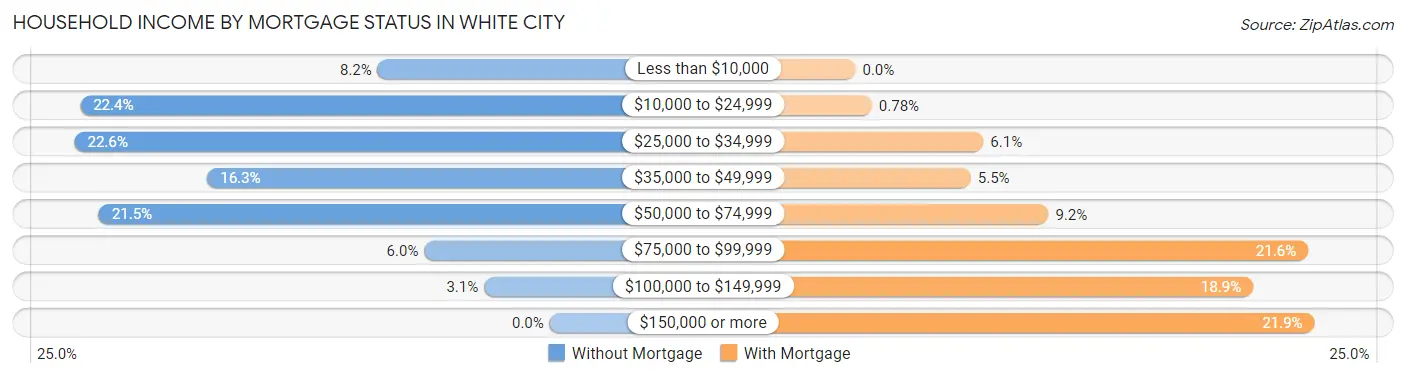
| Household Income | Without Mortgage | With Mortgage |
| Less than $10,000 | 92 (8.2%) | 0 (0.0%) |
| $10,000 to $24,999 | 251 (22.4%) | 13 (0.8%) |
| $25,000 to $34,999 | 254 (22.6%) | 102 (6.1%) |
| $35,000 to $49,999 | 183 (16.3%) | 92 (5.5%) |
| $50,000 to $74,999 | 241 (21.5%) | 154 (9.2%) |
| $75,000 to $99,999 | 67 (6.0%) | 361 (21.5%) |
| $100,000 to $149,999 | 35 (3.1%) | 317 (18.9%) |
| $150,000 or more | 0 (0.0%) | 366 (21.8%) |
| Total | 1,123 (100.0%) | 1,675 (100.0%) |
Property Value to Household Income Ratio in White City
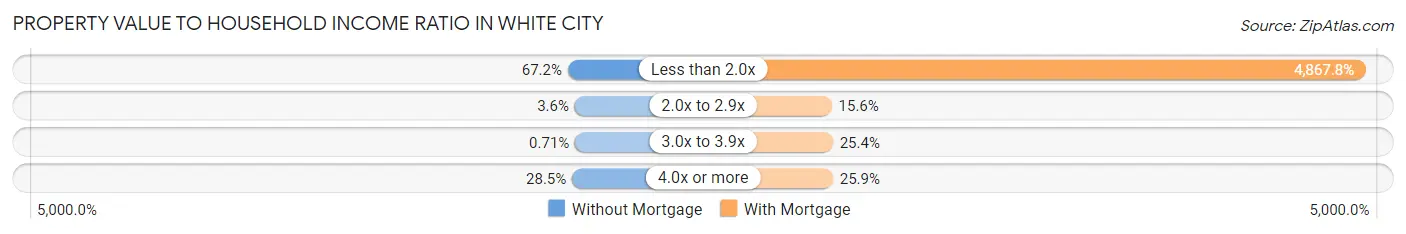
| Value-to-Income Ratio | Without Mortgage | With Mortgage |
| Less than 2.0x | 755 (67.2%) | 81,536 (4,867.8%) |
| 2.0x to 2.9x | 40 (3.6%) | 261 (15.6%) |
| 3.0x to 3.9x | 8 (0.7%) | 425 (25.4%) |
| 4.0x or more | 320 (28.5%) | 434 (25.9%) |
| Total | 1,123 (100.0%) | 1,675 (100.0%) |
Real Estate Taxes by Mortgage Status in White City
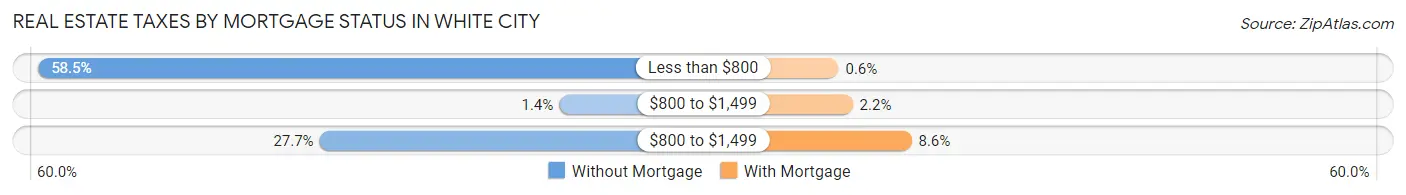
| Property Taxes | Without Mortgage | With Mortgage |
| Less than $800 | 657 (58.5%) | 10 (0.6%) |
| $800 to $1,499 | 16 (1.4%) | 36 (2.1%) |
| $800 to $1,499 | 311 (27.7%) | 144 (8.6%) |
| Total | 1,123 (100.0%) | 1,675 (100.0%) |
Health & Disability in White City
Health Insurance Coverage by Age in White City
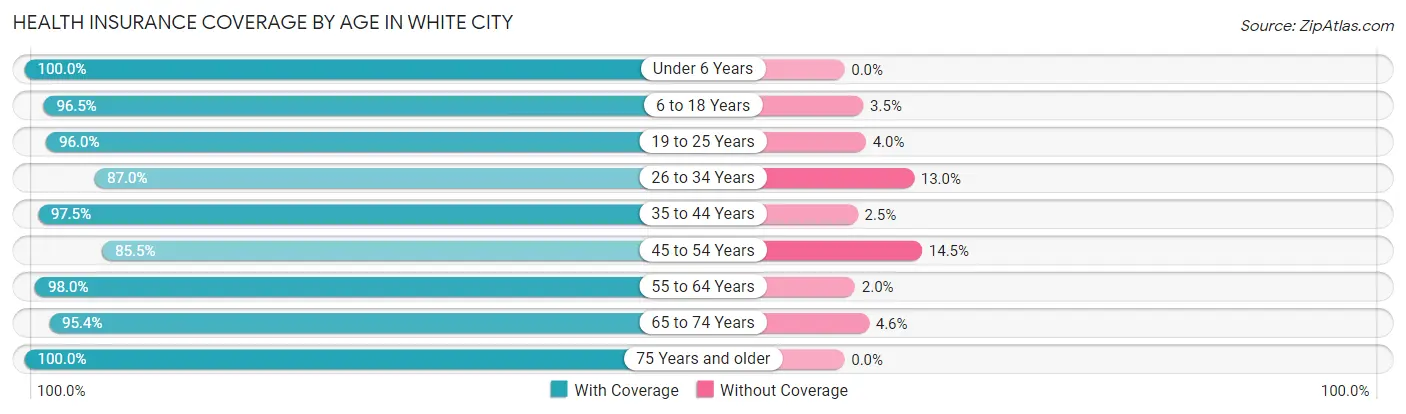
| Age Bracket | With Coverage | Without Coverage |
| Under 6 Years | 1,163 (100.0%) | 0 (0.0%) |
| 6 to 18 Years | 2,192 (96.5%) | 80 (3.5%) |
| 19 to 25 Years | 912 (96.0%) | 38 (4.0%) |
| 26 to 34 Years | 1,370 (87.0%) | 204 (13.0%) |
| 35 to 44 Years | 1,305 (97.5%) | 33 (2.5%) |
| 45 to 54 Years | 1,129 (85.5%) | 191 (14.5%) |
| 55 to 64 Years | 1,098 (98.0%) | 22 (2.0%) |
| 65 to 74 Years | 814 (95.4%) | 39 (4.6%) |
| 75 Years and older | 514 (100.0%) | 0 (0.0%) |
| Total | 10,497 (94.5%) | 607 (5.5%) |
Health Insurance Coverage by Citizenship Status in White City
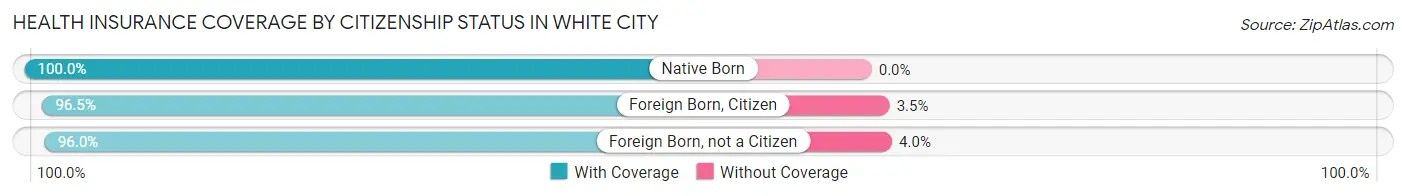
| Citizenship Status | With Coverage | Without Coverage |
| Native Born | 1,163 (100.0%) | 0 (0.0%) |
| Foreign Born, Citizen | 2,192 (96.5%) | 80 (3.5%) |
| Foreign Born, not a Citizen | 912 (96.0%) | 38 (4.0%) |
Health Insurance Coverage by Household Income in White City
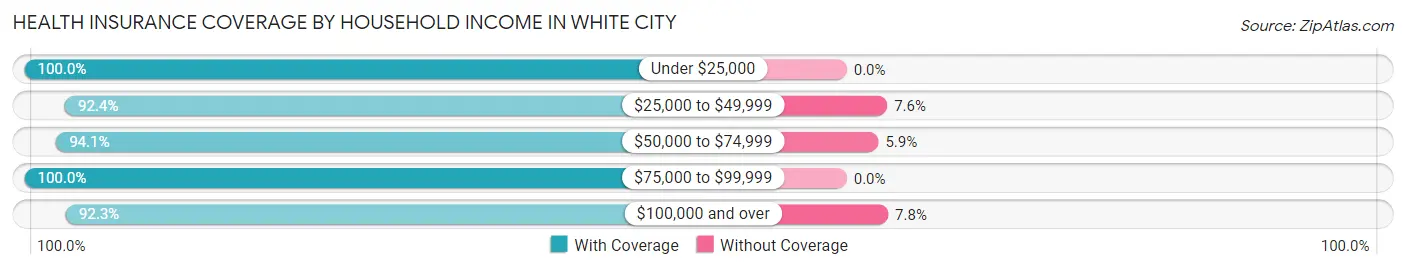
| Household Income | With Coverage | Without Coverage |
| Under $25,000 | 1,655 (100.0%) | 0 (0.0%) |
| $25,000 to $49,999 | 1,891 (92.4%) | 155 (7.6%) |
| $50,000 to $74,999 | 2,125 (94.1%) | 134 (5.9%) |
| $75,000 to $99,999 | 1,059 (100.0%) | 0 (0.0%) |
| $100,000 and over | 3,236 (92.2%) | 272 (7.7%) |
Public vs Private Health Insurance Coverage by Age in White City
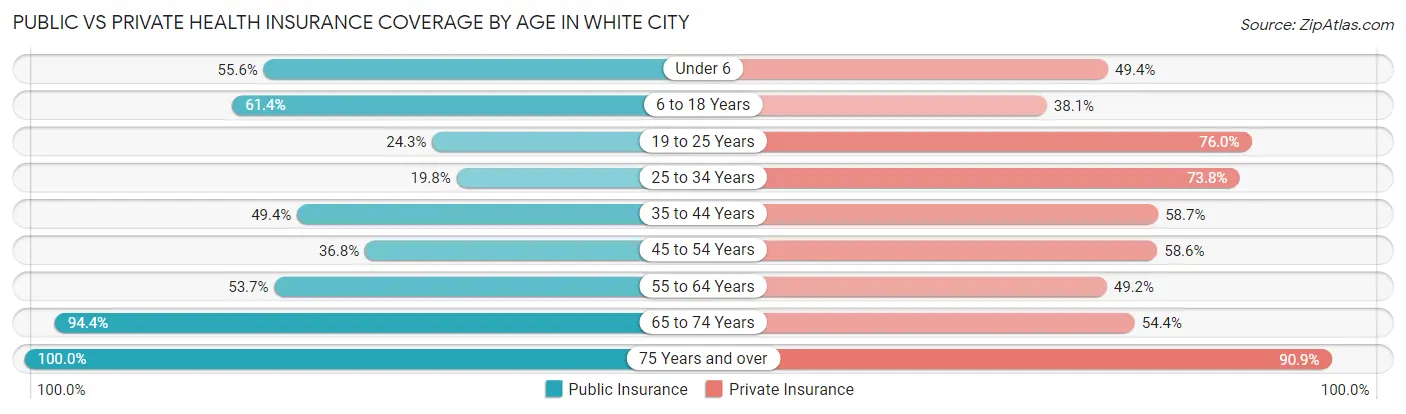
| Age Bracket | Public Insurance | Private Insurance |
| Under 6 | 647 (55.6%) | 575 (49.4%) |
| 6 to 18 Years | 1,396 (61.4%) | 865 (38.1%) |
| 19 to 25 Years | 231 (24.3%) | 722 (76.0%) |
| 25 to 34 Years | 312 (19.8%) | 1,161 (73.8%) |
| 35 to 44 Years | 661 (49.4%) | 786 (58.7%) |
| 45 to 54 Years | 486 (36.8%) | 773 (58.6%) |
| 55 to 64 Years | 601 (53.7%) | 551 (49.2%) |
| 65 to 74 Years | 805 (94.4%) | 464 (54.4%) |
| 75 Years and over | 514 (100.0%) | 467 (90.9%) |
| Total | 5,653 (50.9%) | 6,364 (57.3%) |
Disability Status by Sex by Age in White City
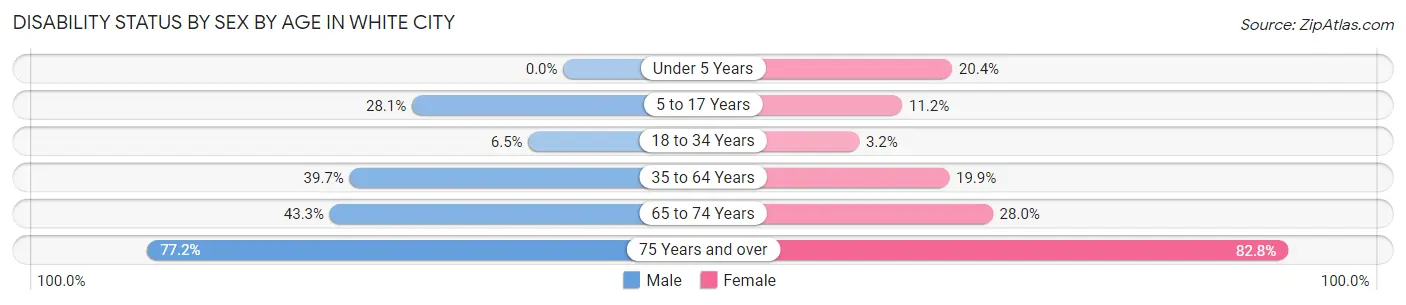
| Age Bracket | Male | Female |
| Under 5 Years | 0 (0.0%) | 93 (20.4%) |
| 5 to 17 Years | 341 (28.1%) | 101 (11.2%) |
| 18 to 34 Years | 84 (6.5%) | 45 (3.2%) |
| 35 to 64 Years | 899 (39.7%) | 301 (19.9%) |
| 65 to 74 Years | 218 (43.3%) | 98 (28.0%) |
| 75 Years and over | 190 (77.2%) | 222 (82.8%) |
Disability Class by Sex by Age in White City
Disability Class: Hearing Difficulty
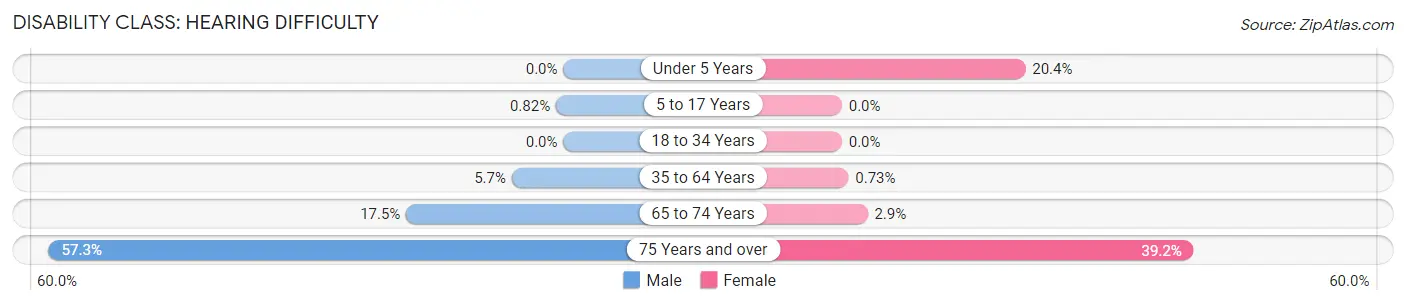
| Age Bracket | Male | Female |
| Under 5 Years | 0 (0.0%) | 93 (20.4%) |
| 5 to 17 Years | 10 (0.8%) | 0 (0.0%) |
| 18 to 34 Years | 0 (0.0%) | 0 (0.0%) |
| 35 to 64 Years | 130 (5.7%) | 11 (0.7%) |
| 65 to 74 Years | 88 (17.5%) | 10 (2.9%) |
| 75 Years and over | 141 (57.3%) | 105 (39.2%) |
Disability Class: Vision Difficulty
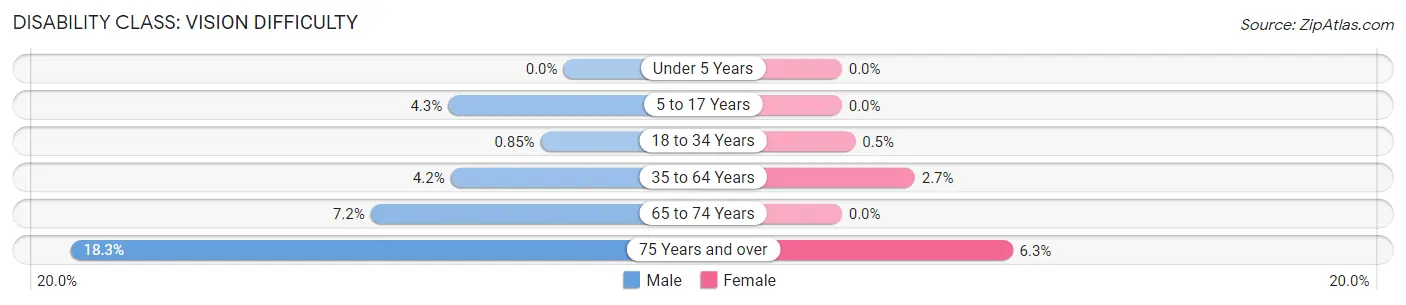
| Age Bracket | Male | Female |
| Under 5 Years | 0 (0.0%) | 0 (0.0%) |
| 5 to 17 Years | 52 (4.3%) | 0 (0.0%) |
| 18 to 34 Years | 11 (0.9%) | 7 (0.5%) |
| 35 to 64 Years | 95 (4.2%) | 41 (2.7%) |
| 65 to 74 Years | 36 (7.2%) | 0 (0.0%) |
| 75 Years and over | 45 (18.3%) | 17 (6.3%) |
Disability Class: Cognitive Difficulty
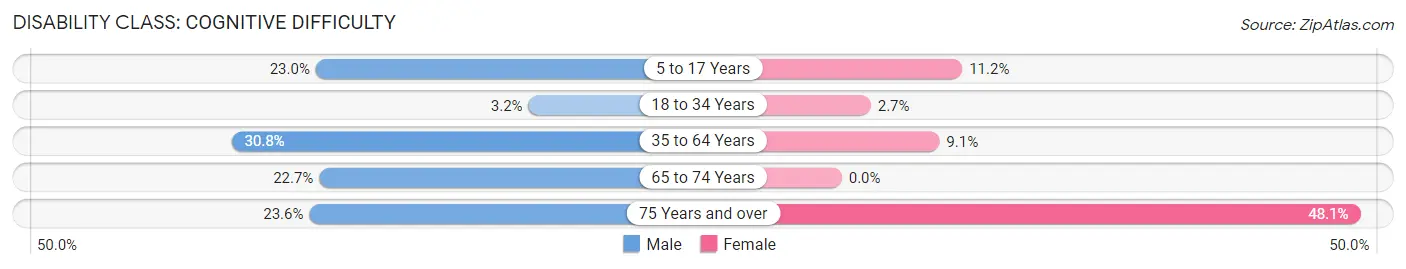
| Age Bracket | Male | Female |
| 5 to 17 Years | 279 (23.0%) | 101 (11.2%) |
| 18 to 34 Years | 42 (3.2%) | 38 (2.7%) |
| 35 to 64 Years | 698 (30.8%) | 137 (9.1%) |
| 65 to 74 Years | 114 (22.7%) | 0 (0.0%) |
| 75 Years and over | 58 (23.6%) | 129 (48.1%) |
Disability Class: Ambulatory Difficulty
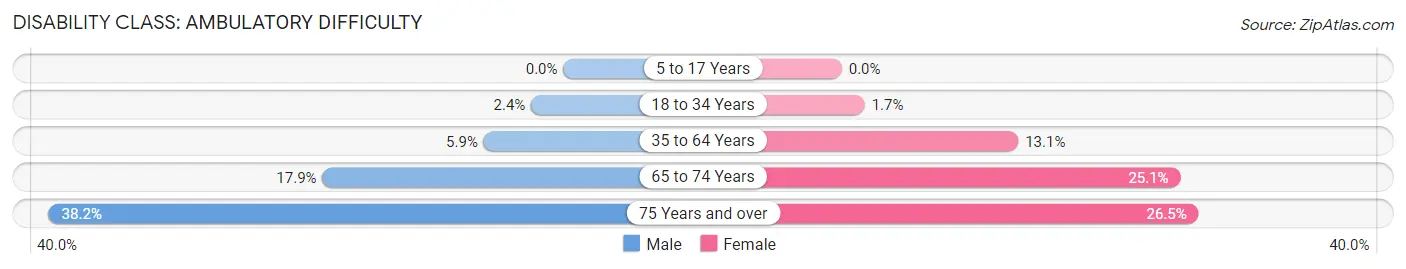
| Age Bracket | Male | Female |
| 5 to 17 Years | 0 (0.0%) | 0 (0.0%) |
| 18 to 34 Years | 31 (2.4%) | 24 (1.7%) |
| 35 to 64 Years | 134 (5.9%) | 198 (13.1%) |
| 65 to 74 Years | 90 (17.9%) | 88 (25.1%) |
| 75 Years and over | 94 (38.2%) | 71 (26.5%) |
Disability Class: Self-Care Difficulty
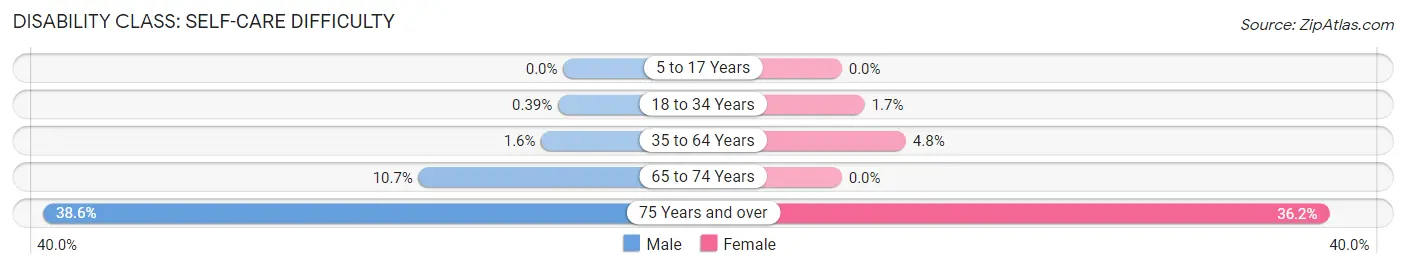
| Age Bracket | Male | Female |
| 5 to 17 Years | 0 (0.0%) | 0 (0.0%) |
| 18 to 34 Years | 5 (0.4%) | 24 (1.7%) |
| 35 to 64 Years | 37 (1.6%) | 72 (4.8%) |
| 65 to 74 Years | 54 (10.7%) | 0 (0.0%) |
| 75 Years and over | 95 (38.6%) | 97 (36.2%) |
Technology Access in White City
Computing Device Access in White City
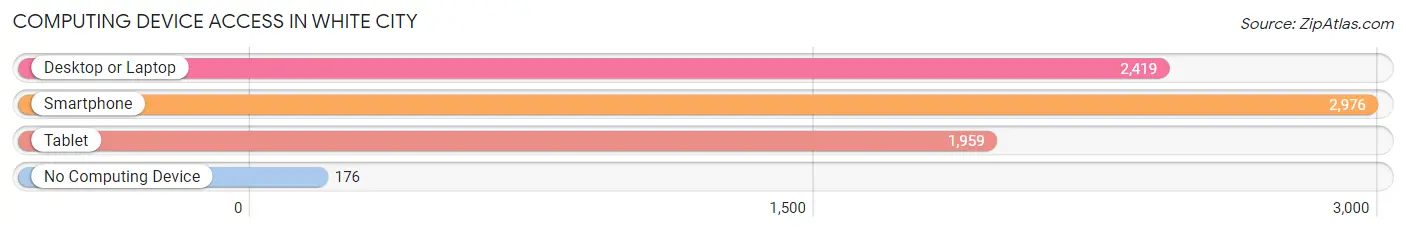
| Device Type | # Households | % Households |
| Desktop or Laptop | 2,419 | 73.7% |
| Smartphone | 2,976 | 90.6% |
| Tablet | 1,959 | 59.7% |
| No Computing Device | 176 | 5.4% |
| Total | 3,284 | 100.0% |
Internet Access in White City
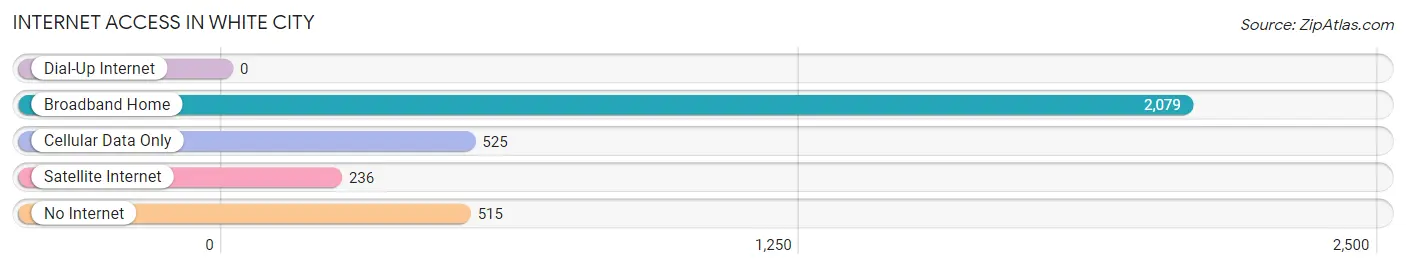
| Internet Type | # Households | % Households |
| Dial-Up Internet | 0 | 0.0% |
| Broadband Home | 2,079 | 63.3% |
| Cellular Data Only | 525 | 16.0% |
| Satellite Internet | 236 | 7.2% |
| No Internet | 515 | 15.7% |
| Total | 3,284 | 100.0% |
White City Summary
White City is a small unincorporated community located in Jackson County, Oregon, United States. It is situated in the Rogue Valley, approximately 10 miles north of Medford. The population of White City was 8,466 at the 2010 census.
History
White City was founded in the late 1800s by settlers from the Midwest. The town was originally called "White City" because of the white-painted buildings that lined the main street. The town was incorporated in 1912 and was the first incorporated city in Jackson County.
In the early 1900s, White City was a thriving agricultural community. The town was home to a number of farms, orchards, and dairies. The town also had a number of businesses, including a bank, a hotel, a general store, and a post office.
In the 1950s, White City began to experience a population boom as people moved to the area to take advantage of the growing timber industry. The town was also home to a number of military bases, including Camp White, which was used as a training facility for the U.S. Army during World War II.
In the late 1960s, White City began to experience a decline in population as the timber industry began to decline. The town was also affected by the closure of Camp White in the 1970s.
Geography
White City is located in the Rogue Valley, approximately 10 miles north of Medford. The town is situated at an elevation of 1,845 feet above sea level. The town is surrounded by rolling hills and is located near the Rogue River.
The climate in White City is mild and temperate. The average high temperature in the summer is around 85 degrees Fahrenheit, and the average low temperature in the winter is around 40 degrees Fahrenheit.
Economy
White City's economy is largely based on agriculture and timber. The town is home to a number of farms, orchards, and dairies. The town is also home to a number of timber companies, including Weyerhaeuser and Roseburg Forest Products.
The town is also home to a number of businesses, including a bank, a hotel, a general store, and a post office. The town is also home to a number of manufacturing companies, including a paper mill and a plastics factory.
Demographics
As of the 2010 census, White City had a population of 8,466. The racial makeup of the town was 87.3% White, 1.2% African American, 0.7% Native American, 0.7% Asian, 0.2% Pacific Islander, 6.3% from other races, and 3.8% from two or more races. Hispanic or Latino of any race were 11.2% of the population.
The median income for a household in White City was $37,917, and the median income for a family was $45,938. The per capita income for the town was $19,945. About 11.2% of families and 14.3% of the population were below the poverty line, including 19.2% of those under age 18 and 8.2% of those age 65 or over.
Common Questions
What is Per Capita Income in White City?
Per Capita income in White City is $22,264.
What is the Median Family Income in White City?
Median Family Income in White City is $67,891.
What is the Median Household income in White City?
Median Household Income in White City is $57,385.
What is Income or Wage Gap in White City?
Income or Wage Gap in White City is 26.3%.
Women in White City earn 73.7 cents for every dollar earned by a man.
What is Inequality or Gini Index in White City?
Inequality or Gini Index in White City is 0.42.
What is the Total Population of White City?
Total Population of White City is 11,123.
What is the Total Male Population of White City?
Total Male Population of White City is 6,224.
What is the Total Female Population of White City?
Total Female Population of White City is 4,899.
What is the Ratio of Males per 100 Females in White City?
There are 127.05 Males per 100 Females in White City.
What is the Ratio of Females per 100 Males in White City?
There are 78.71 Females per 100 Males in White City.
What is the Median Population Age in White City?
Median Population Age in White City is 33.3 Years.
What is the Average Family Size in White City
Average Family Size in White City is 3.8 People.
What is the Average Household Size in White City
Average Household Size in White City is 3.2 People.
How Large is the Labor Force in White City?
There are 4,884 People in the Labor Forcein in White City.
What is the Percentage of People in the Labor Force in White City?
59.3% of People are in the Labor Force in White City.
What is the Unemployment Rate in White City?
Unemployment Rate in White City is 5.2%.