Dayton, OR Map & Demographics
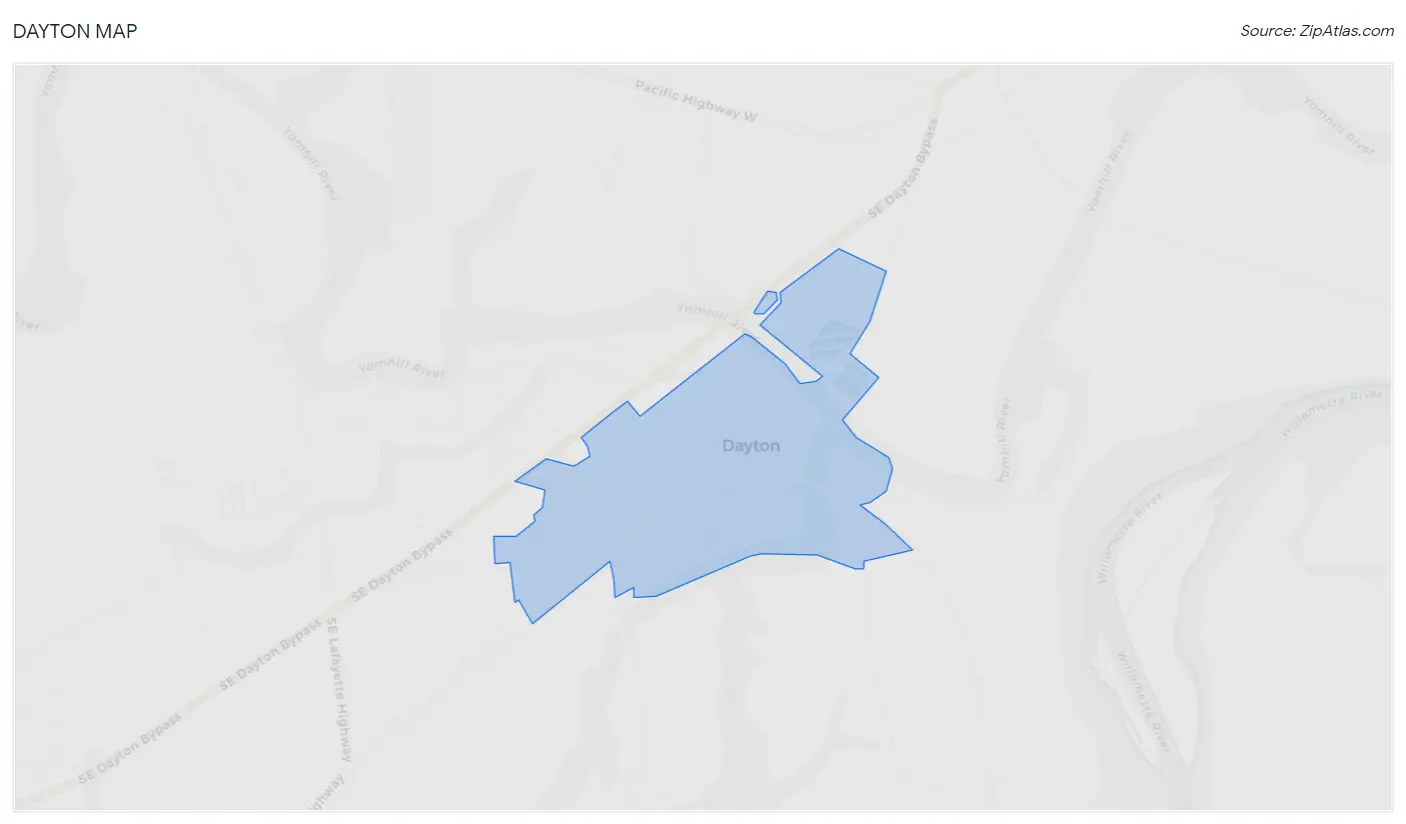
Dayton Map
Dayton Overview
$25,262
PER CAPITA INCOME
$75,110
AVG FAMILY INCOME
$76,014
AVG HOUSEHOLD INCOME
34.9%
WAGE / INCOME GAP [ % ]
65.1¢/ $1
WAGE / INCOME GAP [ $ ]
0.33
INEQUALITY / GINI INDEX
2,677
TOTAL POPULATION
1,376
MALE POPULATION
1,301
FEMALE POPULATION
105.76
MALES / 100 FEMALES
94.55
FEMALES / 100 MALES
37.4
MEDIAN AGE
3.8
AVG FAMILY SIZE
3.7
AVG HOUSEHOLD SIZE
1,195
LABOR FORCE [ PEOPLE ]
56.6%
PERCENT IN LABOR FORCE
15.7%
UNEMPLOYMENT RATE
Dayton Zip Codes
Income in Dayton
Income Overview in Dayton
Per Capita Income in Dayton is $25,262, while median incomes of families and households are $75,110 and $76,014 respectively.
| Characteristic | Number | Measure |
| Per Capita Income | 2,677 | $25,262 |
| Median Family Income | 633 | $75,110 |
| Mean Family Income | 633 | $87,874 |
| Median Household Income | 722 | $76,014 |
| Mean Household Income | 722 | $87,618 |
| Income Deficit | 633 | $0 |
| Wage / Income Gap (%) | 2,677 | 34.85% |
| Wage / Income Gap ($) | 2,677 | 65.15¢ per $1 |
| Gini / Inequality Index | 2,677 | 0.33 |
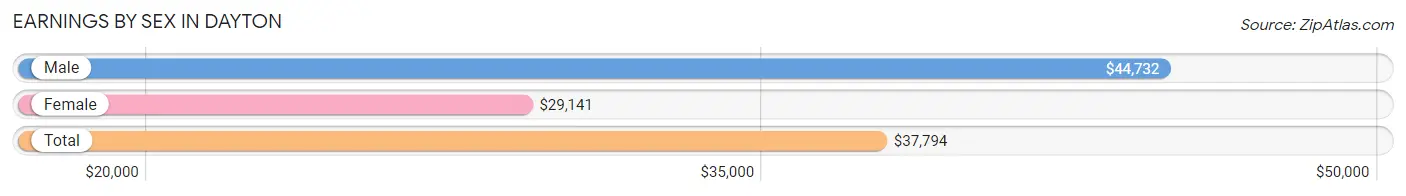
Earnings by Sex in Dayton
Average Earnings in Dayton are $37,794, $44,732 for men and $29,141 for women, a difference of 34.8%.
| Sex | Number | Average Earnings |
| Male | 705 (57.0%) | $44,732 |
| Female | 533 (43.0%) | $29,141 |
| Total | 1,238 (100.0%) | $37,794 |
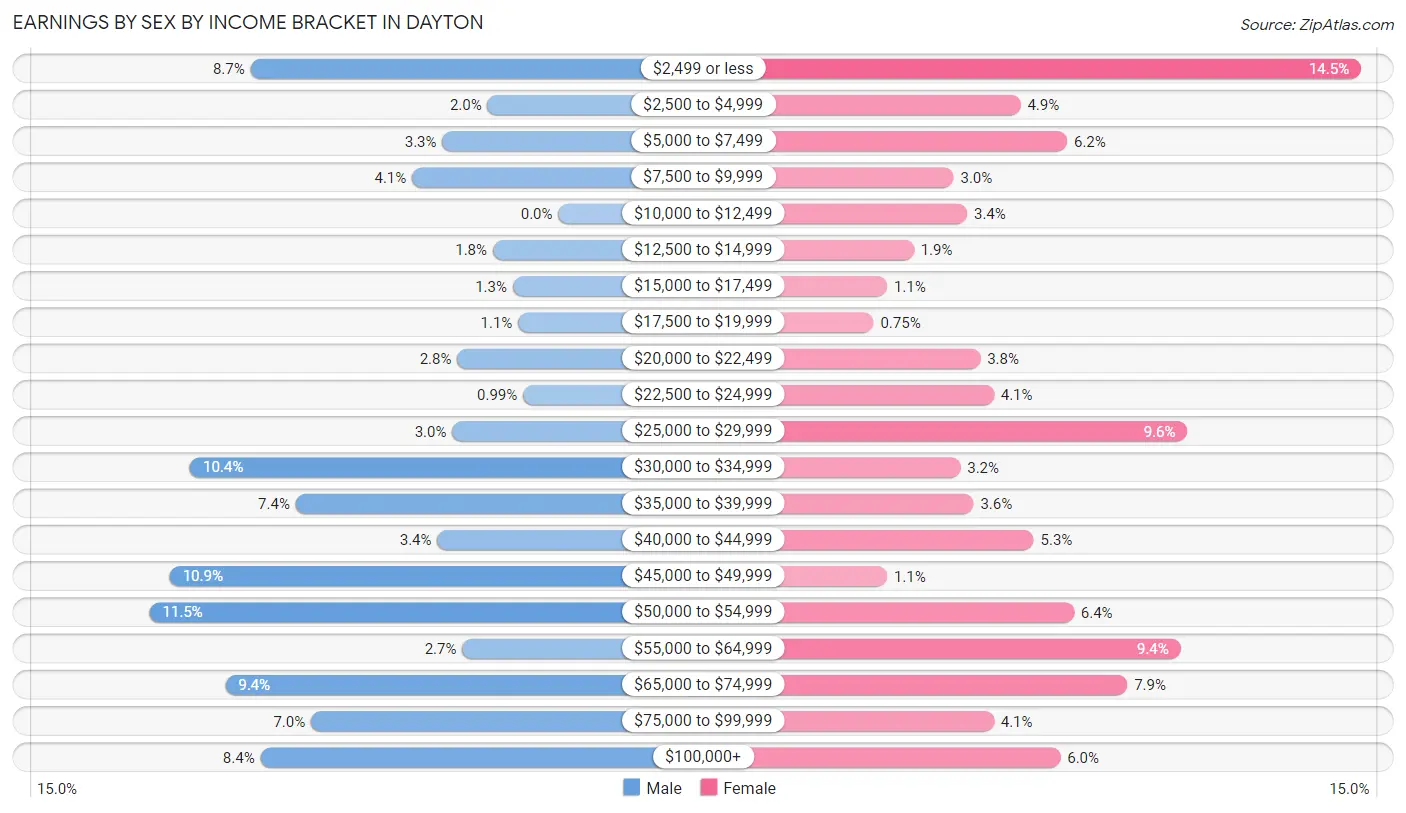
Earnings by Sex by Income Bracket in Dayton
The most common earnings brackets in Dayton are $50,000 to $54,999 for men (81 | 11.5%) and $2,499 or less for women (77 | 14.4%).
| Income | Male | Female |
| $2,499 or less | 61 (8.6%) | 77 (14.4%) |
| $2,500 to $4,999 | 14 (2.0%) | 26 (4.9%) |
| $5,000 to $7,499 | 23 (3.3%) | 33 (6.2%) |
| $7,500 to $9,999 | 29 (4.1%) | 16 (3.0%) |
| $10,000 to $12,499 | 0 (0.0%) | 18 (3.4%) |
| $12,500 to $14,999 | 13 (1.8%) | 10 (1.9%) |
| $15,000 to $17,499 | 9 (1.3%) | 6 (1.1%) |
| $17,500 to $19,999 | 8 (1.1%) | 4 (0.7%) |
| $20,000 to $22,499 | 20 (2.8%) | 20 (3.7%) |
| $22,500 to $24,999 | 7 (1.0%) | 22 (4.1%) |
| $25,000 to $29,999 | 21 (3.0%) | 51 (9.6%) |
| $30,000 to $34,999 | 73 (10.3%) | 17 (3.2%) |
| $35,000 to $39,999 | 52 (7.4%) | 19 (3.6%) |
| $40,000 to $44,999 | 24 (3.4%) | 28 (5.2%) |
| $45,000 to $49,999 | 77 (10.9%) | 6 (1.1%) |
| $50,000 to $54,999 | 81 (11.5%) | 34 (6.4%) |
| $55,000 to $64,999 | 19 (2.7%) | 50 (9.4%) |
| $65,000 to $74,999 | 66 (9.4%) | 42 (7.9%) |
| $75,000 to $99,999 | 49 (7.0%) | 22 (4.1%) |
| $100,000+ | 59 (8.4%) | 32 (6.0%) |
| Total | 705 (100.0%) | 533 (100.0%) |
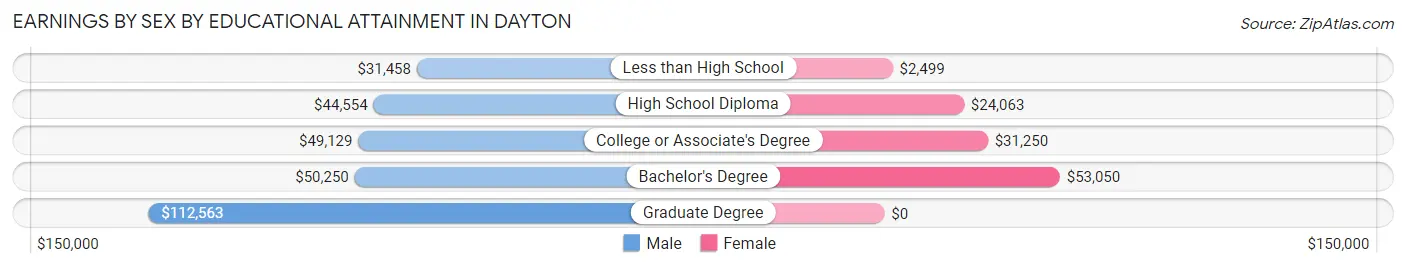
Earnings by Sex by Educational Attainment in Dayton
Average earnings in Dayton are $48,654 for men and $33,594 for women, a difference of 30.9%. Men with an educational attainment of graduate degree enjoy the highest average annual earnings of $112,563, while those with less than high school education earn the least with $31,458. Women with an educational attainment of bachelor's degree earn the most with the average annual earnings of $53,050, while those with less than high school education have the smallest earnings of $2,499.
| Educational Attainment | Male Income | Female Income |
| Less than High School | $31,458 | $2,499 |
| High School Diploma | $44,554 | $24,063 |
| College or Associate's Degree | $49,129 | $31,250 |
| Bachelor's Degree | $50,250 | $53,050 |
| Graduate Degree | $112,563 | $0 |
| Total | $48,654 | $33,594 |
Family Income in Dayton
Family Income Brackets in Dayton
According to the Dayton family income data, there are 173 families falling into the $50,000 to $74,999 income range, which is the most common income bracket and makes up 27.3% of all families. Conversely, the $10,000 to $14,999 income bracket is the least frequent group with only 7 families (1.1%) belonging to this category.
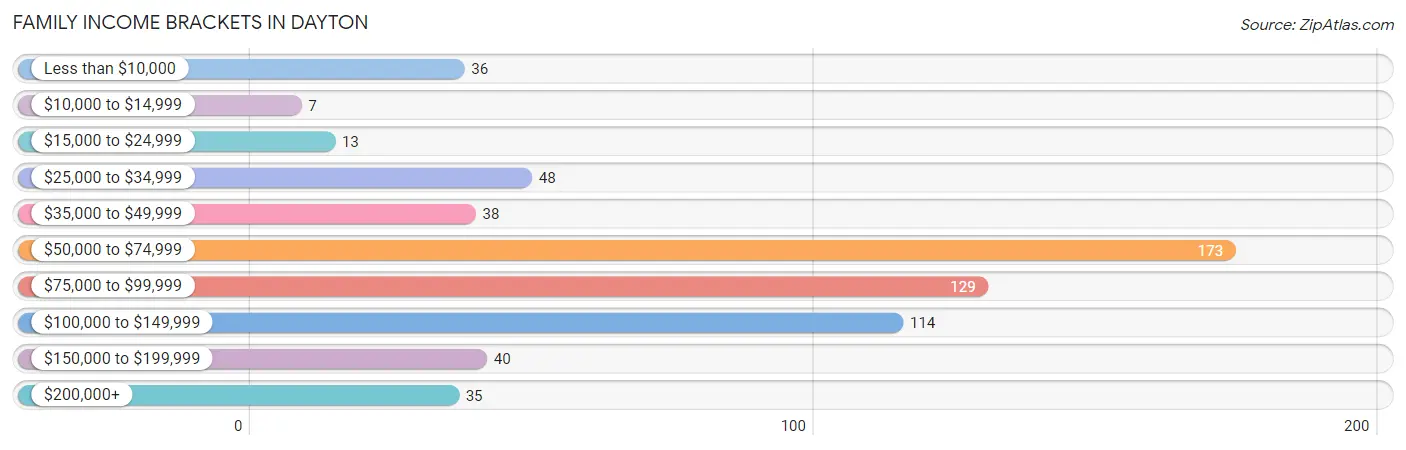
| Income Bracket | # Families | % Families |
| Less than $10,000 | 36 | 5.7% |
| $10,000 to $14,999 | 7 | 1.1% |
| $15,000 to $24,999 | 13 | 2.1% |
| $25,000 to $34,999 | 48 | 7.6% |
| $35,000 to $49,999 | 38 | 6.0% |
| $50,000 to $74,999 | 173 | 27.3% |
| $75,000 to $99,999 | 129 | 20.4% |
| $100,000 to $149,999 | 114 | 18.0% |
| $150,000 to $199,999 | 40 | 6.3% |
| $200,000+ | 35 | 5.5% |
Family Income by Famaliy Size in Dayton
3-person families (117 | 18.5%) account for the highest median family income in Dayton with $96,509 per family, while 2-person families (234 | 37.0%) have the highest median income of $37,944 per family member.
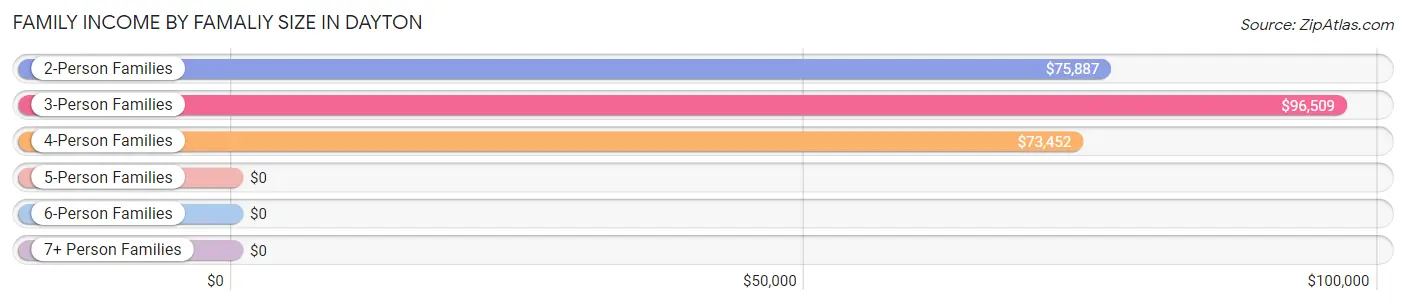
| Income Bracket | # Families | Median Income |
| 2-Person Families | 234 (37.0%) | $75,887 |
| 3-Person Families | 117 (18.5%) | $96,509 |
| 4-Person Families | 158 (25.0%) | $73,452 |
| 5-Person Families | 91 (14.4%) | $0 |
| 6-Person Families | 33 (5.2%) | $0 |
| 7+ Person Families | 0 (0.0%) | $0 |
| Total | 633 (100.0%) | $75,110 |
Family Income by Number of Earners in Dayton
The median family income in Dayton is $75,110, with families comprising 3+ earners (101) having the highest median family income of $106,705, while families with 1 earner (187) have the lowest median family income of $57,708, accounting for 16.0% and 29.5% of families, respectively.
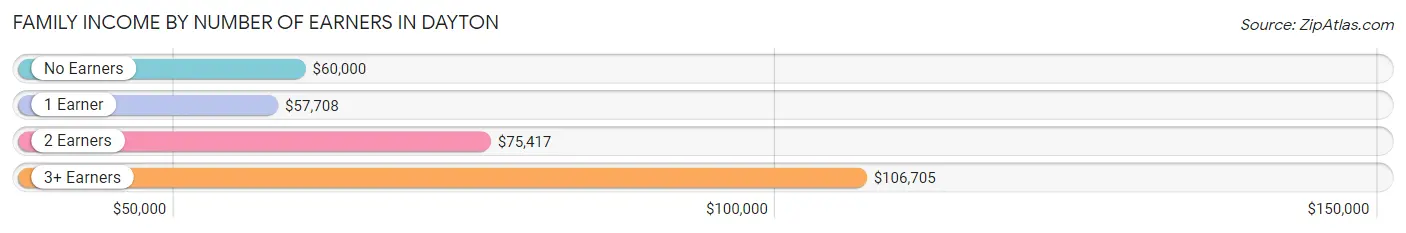
| Number of Earners | # Families | Median Income |
| No Earners | 94 (14.8%) | $60,000 |
| 1 Earner | 187 (29.5%) | $57,708 |
| 2 Earners | 251 (39.7%) | $75,417 |
| 3+ Earners | 101 (16.0%) | $106,705 |
| Total | 633 (100.0%) | $75,110 |
Household Income in Dayton
Household Income Brackets in Dayton
With 171 households falling in the category, the $50,000 to $74,999 income range is the most frequent in Dayton, accounting for 23.7% of all households. In contrast, only 11 households (1.5%) fall into the $15,000 to $24,999 income bracket, making it the least populous group.
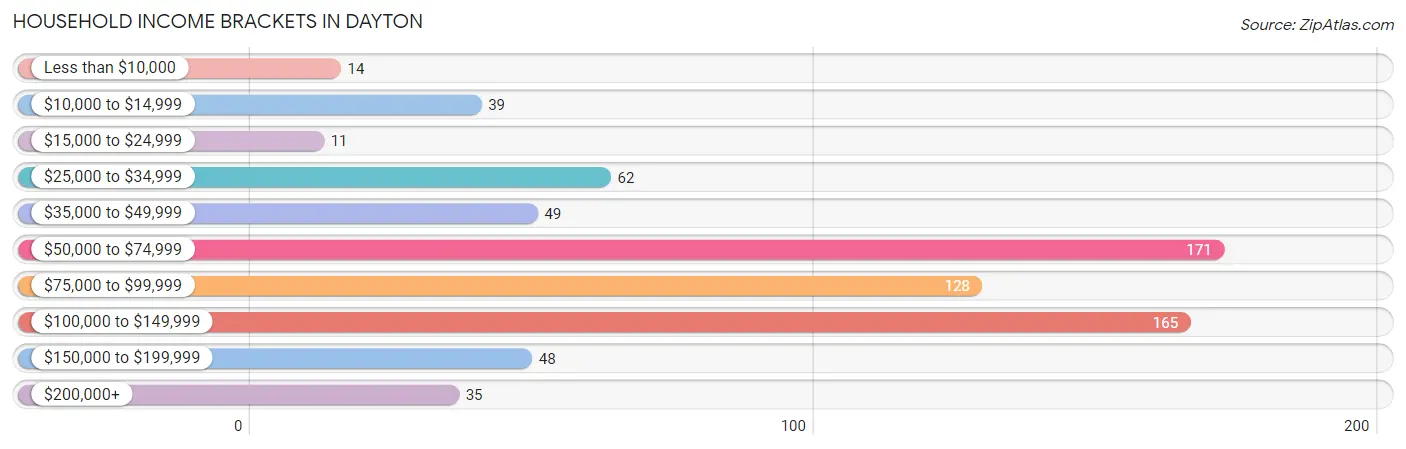
| Income Bracket | # Households | % Households |
| Less than $10,000 | 14 | 1.9% |
| $10,000 to $14,999 | 39 | 5.4% |
| $15,000 to $24,999 | 11 | 1.5% |
| $25,000 to $34,999 | 62 | 8.6% |
| $35,000 to $49,999 | 49 | 6.8% |
| $50,000 to $74,999 | 171 | 23.7% |
| $75,000 to $99,999 | 128 | 17.7% |
| $100,000 to $149,999 | 165 | 22.9% |
| $150,000 to $199,999 | 48 | 6.6% |
| $200,000+ | 35 | 4.8% |
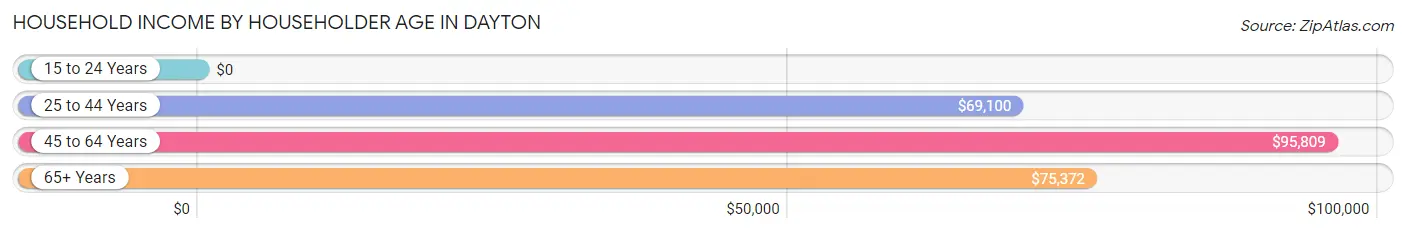
Household Income by Householder Age in Dayton
The median household income in Dayton is $76,014, with the highest median household income of $95,809 found in the 45 to 64 years age bracket for the primary householder. A total of 293 households (40.6%) fall into this category.
| Income Bracket | # Households | Median Income |
| 15 to 24 Years | 0 (0.0%) | $0 |
| 25 to 44 Years | 200 (27.7%) | $69,100 |
| 45 to 64 Years | 293 (40.6%) | $95,809 |
| 65+ Years | 229 (31.7%) | $75,372 |
| Total | 722 (100.0%) | $76,014 |
Poverty in Dayton
Income Below Poverty by Sex and Age in Dayton
With 20.0% poverty level for males and 21.8% for females among the residents of Dayton, 15 year old males and 5 year old females are the most vulnerable to poverty, with 28 males (75.7%) and 29 females (63.0%) in their respective age groups living below the poverty level.
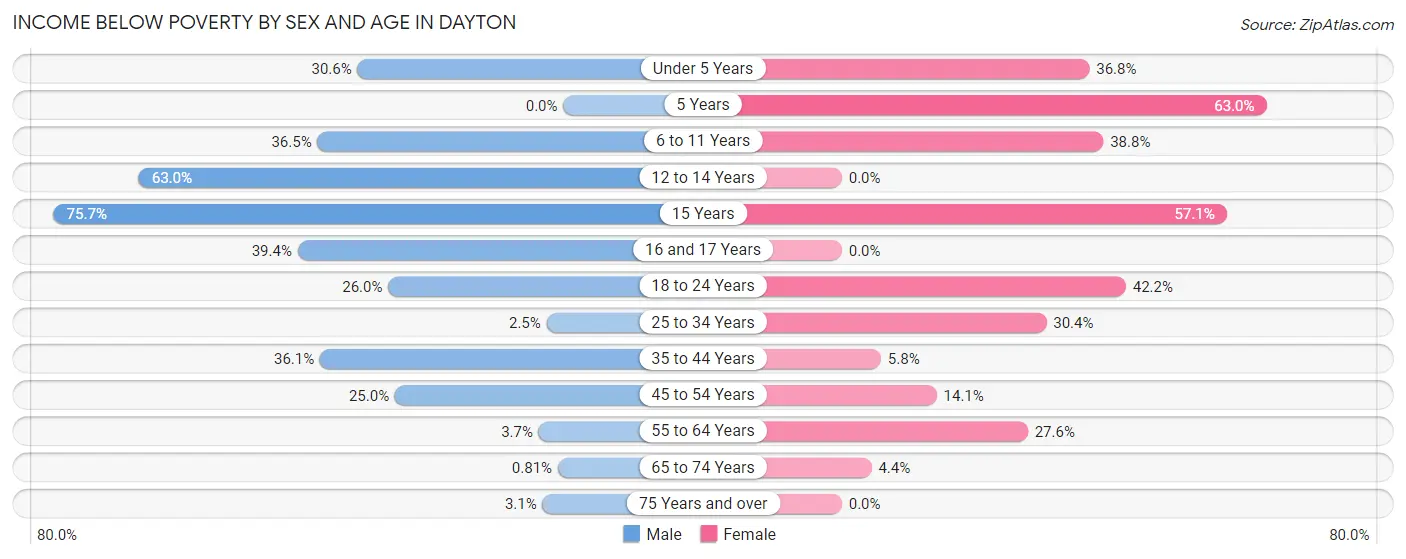
| Age Bracket | Male | Female |
| Under 5 Years | 22 (30.6%) | 43 (36.7%) |
| 5 Years | 0 (0.0%) | 29 (63.0%) |
| 6 to 11 Years | 23 (36.5%) | 33 (38.8%) |
| 12 to 14 Years | 29 (63.0%) | 0 (0.0%) |
| 15 Years | 28 (75.7%) | 8 (57.1%) |
| 16 and 17 Years | 28 (39.4%) | 0 (0.0%) |
| 18 to 24 Years | 39 (26.0%) | 35 (42.2%) |
| 25 to 34 Years | 5 (2.5%) | 51 (30.4%) |
| 35 to 44 Years | 43 (36.1%) | 5 (5.8%) |
| 45 to 54 Years | 47 (25.0%) | 29 (14.1%) |
| 55 to 64 Years | 5 (3.6%) | 45 (27.6%) |
| 65 to 74 Years | 1 (0.8%) | 6 (4.4%) |
| 75 Years and over | 5 (3.1%) | 0 (0.0%) |
| Total | 275 (20.0%) | 284 (21.8%) |
Income Above Poverty by Sex and Age in Dayton
According to the poverty statistics in Dayton, males aged 5 years and females aged 12 to 14 years are the age groups that are most secure financially, with 100.0% of males and 100.0% of females in these age groups living above the poverty line.
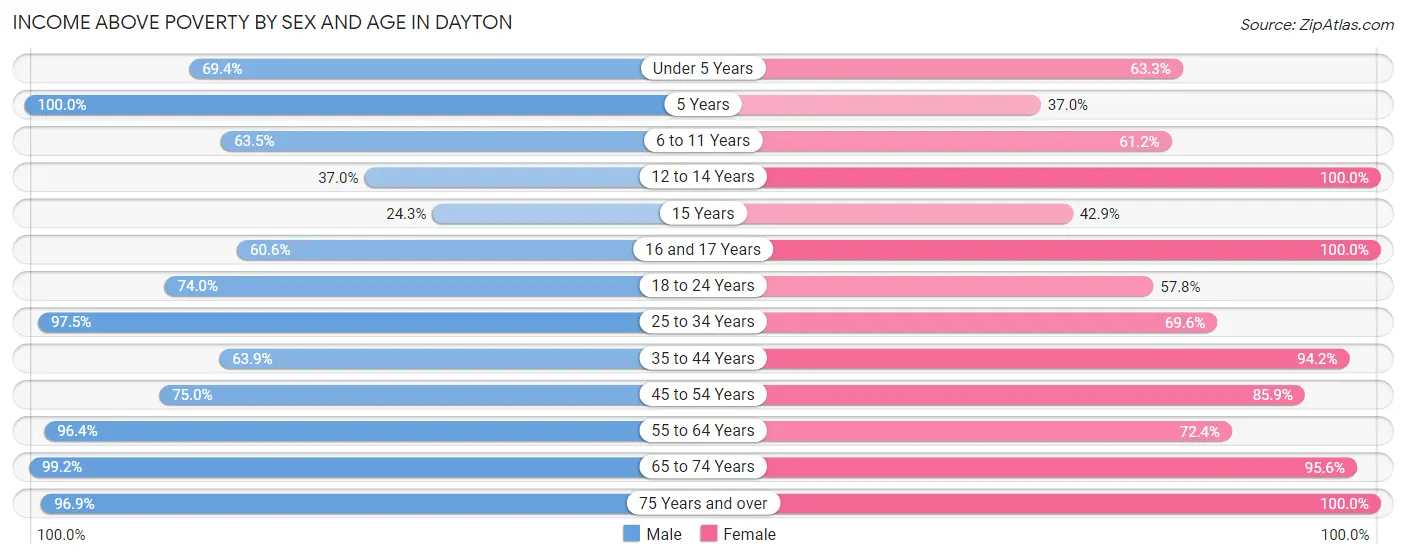
| Age Bracket | Male | Female |
| Under 5 Years | 50 (69.4%) | 74 (63.2%) |
| 5 Years | 5 (100.0%) | 17 (37.0%) |
| 6 to 11 Years | 40 (63.5%) | 52 (61.2%) |
| 12 to 14 Years | 17 (37.0%) | 81 (100.0%) |
| 15 Years | 9 (24.3%) | 6 (42.9%) |
| 16 and 17 Years | 43 (60.6%) | 35 (100.0%) |
| 18 to 24 Years | 111 (74.0%) | 48 (57.8%) |
| 25 to 34 Years | 197 (97.5%) | 117 (69.6%) |
| 35 to 44 Years | 76 (63.9%) | 81 (94.2%) |
| 45 to 54 Years | 141 (75.0%) | 177 (85.9%) |
| 55 to 64 Years | 132 (96.4%) | 118 (72.4%) |
| 65 to 74 Years | 123 (99.2%) | 130 (95.6%) |
| 75 Years and over | 157 (96.9%) | 81 (100.0%) |
| Total | 1,101 (80.0%) | 1,017 (78.2%) |
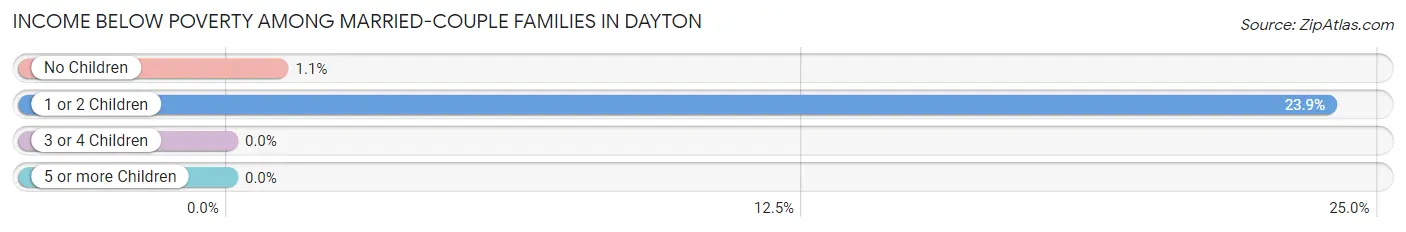
Income Below Poverty Among Married-Couple Families in Dayton
The poverty statistics for married-couple families in Dayton show that 8.0% or 36 of the total 451 families live below the poverty line. Families with 1 or 2 children have the highest poverty rate of 23.9%, comprising of 33 families. On the other hand, families with 3 or 4 children have the lowest poverty rate of 0.0%, which includes 0 families.
| Children | Above Poverty | Below Poverty |
| No Children | 270 (98.9%) | 3 (1.1%) |
| 1 or 2 Children | 105 (76.1%) | 33 (23.9%) |
| 3 or 4 Children | 40 (100.0%) | 0 (0.0%) |
| 5 or more Children | 0 (0.0%) | 0 (0.0%) |
| Total | 415 (92.0%) | 36 (8.0%) |
Income Below Poverty Among Single-Parent Households in Dayton
According to the poverty data in Dayton, 38.0% or 27 single-father households and 13.5% or 15 single-mother households are living below the poverty line. Among single-father households, those with 5 or more children have the highest poverty rate, with 27 households (100.0%) experiencing poverty. Likewise, among single-mother households, those with 3 or 4 children have the highest poverty rate, with 9 households (100.0%) falling below the poverty line.
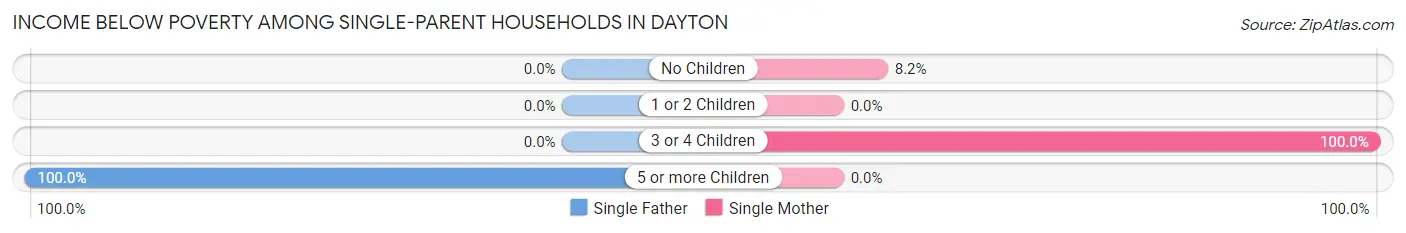
| Children | Single Father | Single Mother |
| No Children | 0 (0.0%) | 6 (8.2%) |
| 1 or 2 Children | 0 (0.0%) | 0 (0.0%) |
| 3 or 4 Children | 0 (0.0%) | 9 (100.0%) |
| 5 or more Children | 27 (100.0%) | 0 (0.0%) |
| Total | 27 (38.0%) | 15 (13.5%) |
Income Below Poverty Among Married-Couple vs Single-Parent Households in Dayton
The poverty data for Dayton shows that 36 of the married-couple family households (8.0%) and 42 of the single-parent households (23.1%) are living below the poverty level. Within the married-couple family households, those with 1 or 2 children have the highest poverty rate, with 33 households (23.9%) falling below the poverty line. Among the single-parent households, those with 5 or more children have the highest poverty rate, with 27 household (100.0%) living below poverty.
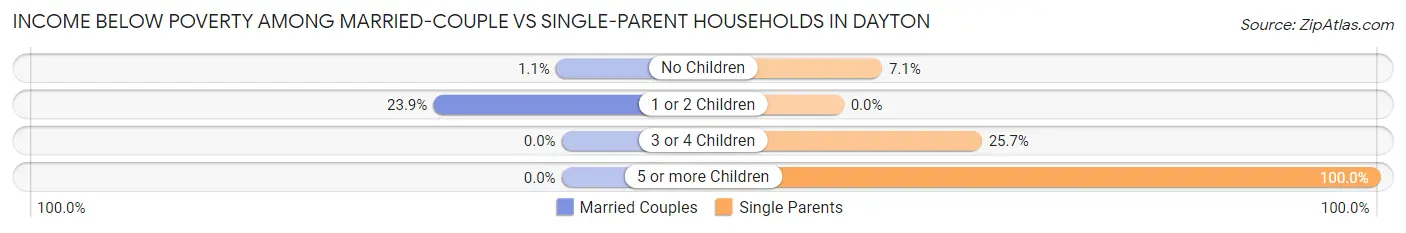
| Children | Married-Couple Families | Single-Parent Households |
| No Children | 3 (1.1%) | 6 (7.1%) |
| 1 or 2 Children | 33 (23.9%) | 0 (0.0%) |
| 3 or 4 Children | 0 (0.0%) | 9 (25.7%) |
| 5 or more Children | 0 (0.0%) | 27 (100.0%) |
| Total | 36 (8.0%) | 42 (23.1%) |
Race in Dayton
The most populous races in Dayton are White / Caucasian (1,878 | 70.2%), Hispanic or Latino (1,090 | 40.7%), and Two or more Races (496 | 18.5%).
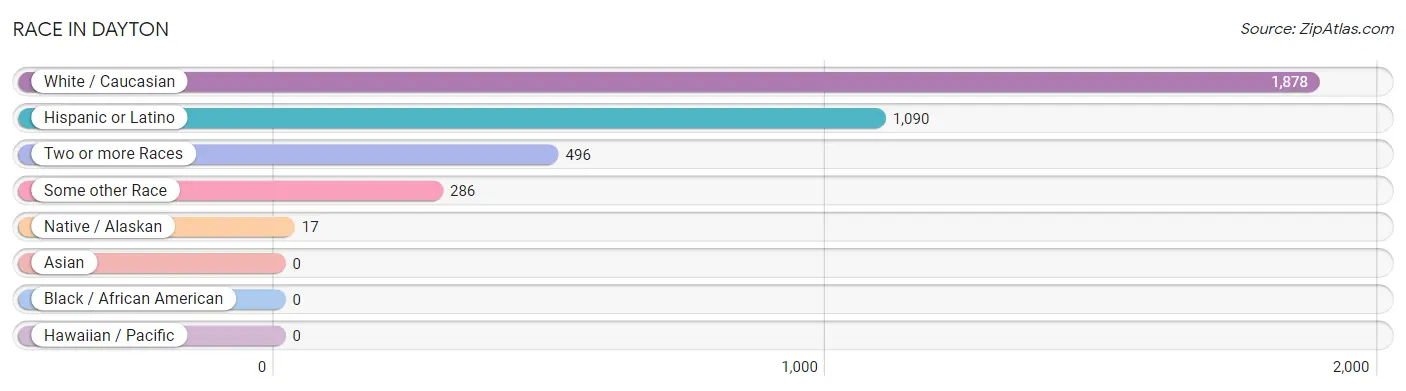
| Race | # Population | % Population |
| Asian | 0 | 0.0% |
| Black / African American | 0 | 0.0% |
| Hawaiian / Pacific | 0 | 0.0% |
| Hispanic or Latino | 1,090 | 40.7% |
| Native / Alaskan | 17 | 0.6% |
| White / Caucasian | 1,878 | 70.2% |
| Two or more Races | 496 | 18.5% |
| Some other Race | 286 | 10.7% |
| Total | 2,677 | 100.0% |
Ancestry in Dayton
The most populous ancestries reported in Dayton are Mexican (1,058 | 39.5%), German (264 | 9.9%), English (261 | 9.8%), Irish (174 | 6.5%), and Scottish (163 | 6.1%), together accounting for 71.7% of all Dayton residents.
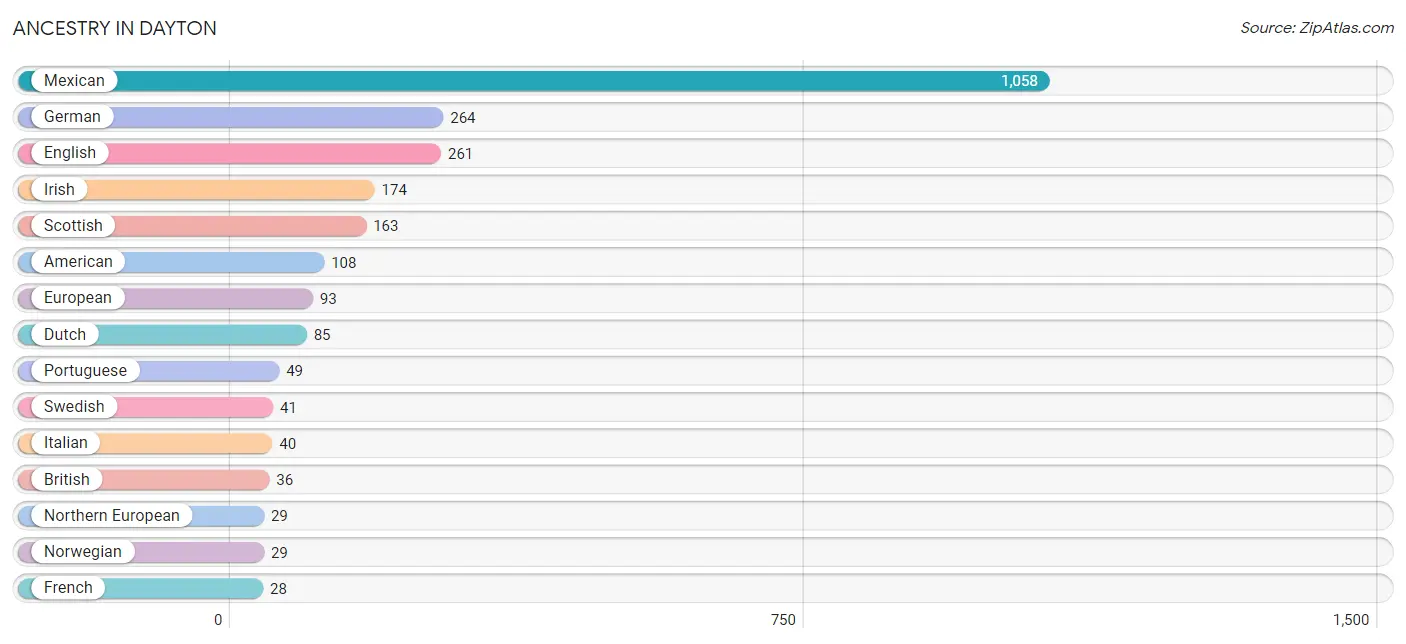
| Ancestry | # Population | % Population |
| American | 108 | 4.0% |
| Arab | 14 | 0.5% |
| British | 36 | 1.3% |
| Canadian | 6 | 0.2% |
| Central American | 21 | 0.8% |
| Central American Indian | 17 | 0.6% |
| Croatian | 3 | 0.1% |
| Delaware | 13 | 0.5% |
| Dutch | 85 | 3.2% |
| English | 261 | 9.8% |
| European | 93 | 3.5% |
| Finnish | 3 | 0.1% |
| French | 28 | 1.1% |
| German | 264 | 9.9% |
| Greek | 2 | 0.1% |
| Irish | 174 | 6.5% |
| Iroquois | 13 | 0.5% |
| Italian | 40 | 1.5% |
| Mexican | 1,058 | 39.5% |
| Northern European | 29 | 1.1% |
| Norwegian | 29 | 1.1% |
| Portuguese | 49 | 1.8% |
| Romanian | 5 | 0.2% |
| Russian | 4 | 0.2% |
| Salvadoran | 21 | 0.8% |
| Scandinavian | 14 | 0.5% |
| Scotch-Irish | 13 | 0.5% |
| Scottish | 163 | 6.1% |
| Spanish | 11 | 0.4% |
| Swedish | 41 | 1.5% | View All 30 Rows |
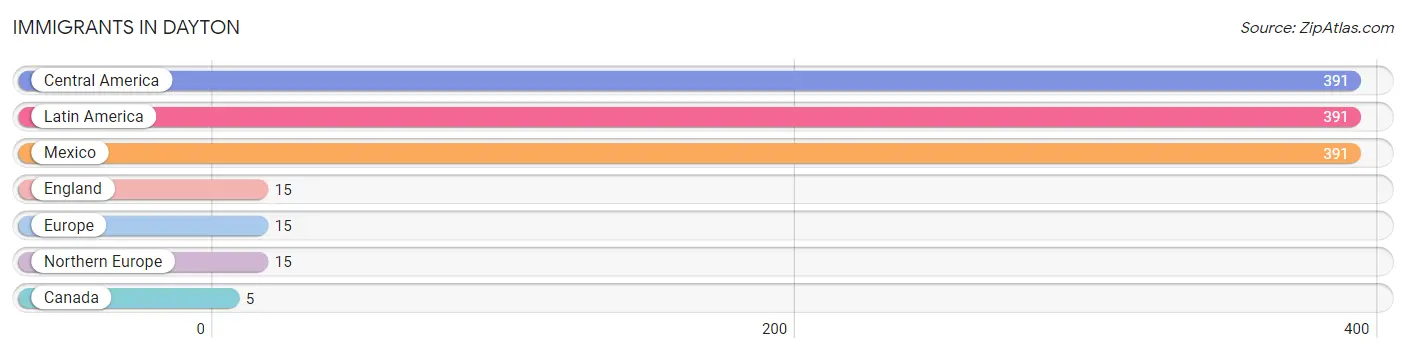
Immigrants in Dayton
The most numerous immigrant groups reported in Dayton came from Central America (391 | 14.6%), Latin America (391 | 14.6%), Mexico (391 | 14.6%), England (15 | 0.6%), and Europe (15 | 0.6%), together accounting for 45.0% of all Dayton residents.
| Immigration Origin | # Population | % Population |
| Canada | 5 | 0.2% |
| Central America | 391 | 14.6% |
| England | 15 | 0.6% |
| Europe | 15 | 0.6% |
| Latin America | 391 | 14.6% |
| Mexico | 391 | 14.6% |
| Northern Europe | 15 | 0.6% | View All 7 Rows |
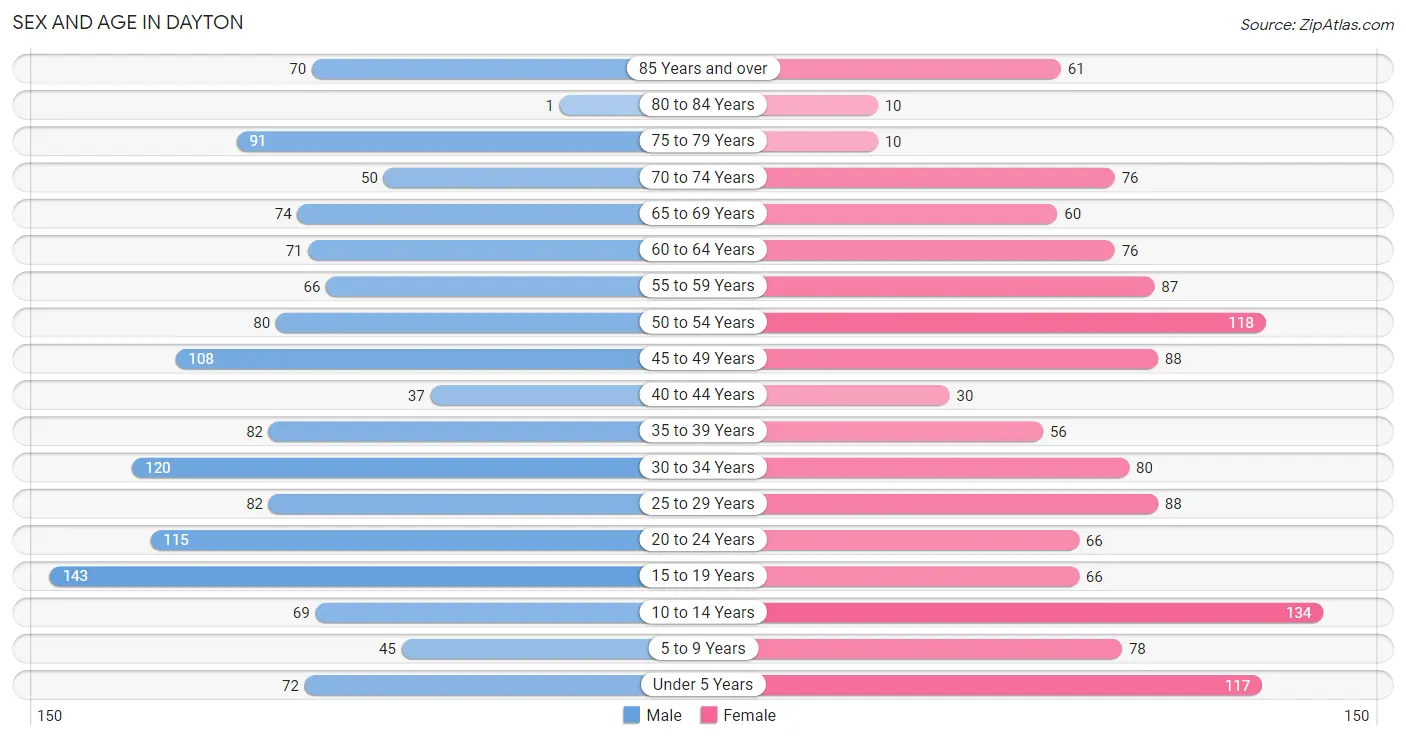
Sex and Age in Dayton
Sex and Age in Dayton
The most populous age groups in Dayton are 15 to 19 Years (143 | 10.4%) for men and 10 to 14 Years (134 | 10.3%) for women.
| Age Bracket | Male | Female |
| Under 5 Years | 72 (5.2%) | 117 (9.0%) |
| 5 to 9 Years | 45 (3.3%) | 78 (6.0%) |
| 10 to 14 Years | 69 (5.0%) | 134 (10.3%) |
| 15 to 19 Years | 143 (10.4%) | 66 (5.1%) |
| 20 to 24 Years | 115 (8.4%) | 66 (5.1%) |
| 25 to 29 Years | 82 (6.0%) | 88 (6.8%) |
| 30 to 34 Years | 120 (8.7%) | 80 (6.1%) |
| 35 to 39 Years | 82 (6.0%) | 56 (4.3%) |
| 40 to 44 Years | 37 (2.7%) | 30 (2.3%) |
| 45 to 49 Years | 108 (7.9%) | 88 (6.8%) |
| 50 to 54 Years | 80 (5.8%) | 118 (9.1%) |
| 55 to 59 Years | 66 (4.8%) | 87 (6.7%) |
| 60 to 64 Years | 71 (5.2%) | 76 (5.8%) |
| 65 to 69 Years | 74 (5.4%) | 60 (4.6%) |
| 70 to 74 Years | 50 (3.6%) | 76 (5.8%) |
| 75 to 79 Years | 91 (6.6%) | 10 (0.8%) |
| 80 to 84 Years | 1 (0.1%) | 10 (0.8%) |
| 85 Years and over | 70 (5.1%) | 61 (4.7%) |
| Total | 1,376 (100.0%) | 1,301 (100.0%) |
Families and Households in Dayton
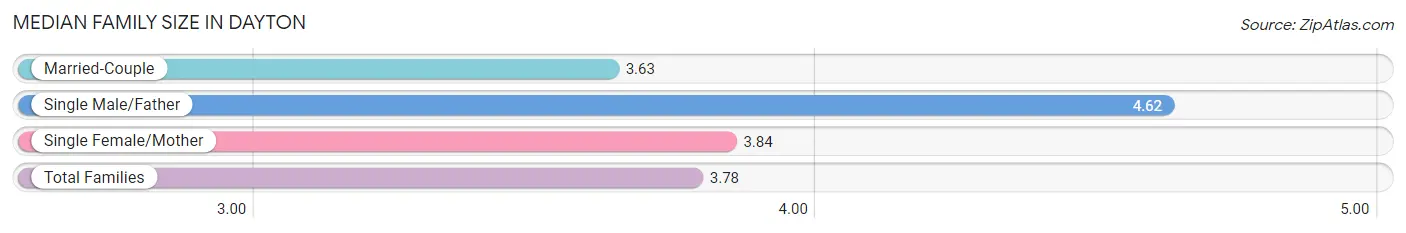
Median Family Size in Dayton
The median family size in Dayton is 3.78 persons per family, with single male/father families (71 | 11.2%) accounting for the largest median family size of 4.62 persons per family. On the other hand, married-couple families (451 | 71.3%) represent the smallest median family size with 3.63 persons per family.
| Family Type | # Families | Family Size |
| Married-Couple | 451 (71.3%) | 3.63 |
| Single Male/Father | 71 (11.2%) | 4.62 |
| Single Female/Mother | 111 (17.5%) | 3.84 |
| Total Families | 633 (100.0%) | 3.78 |
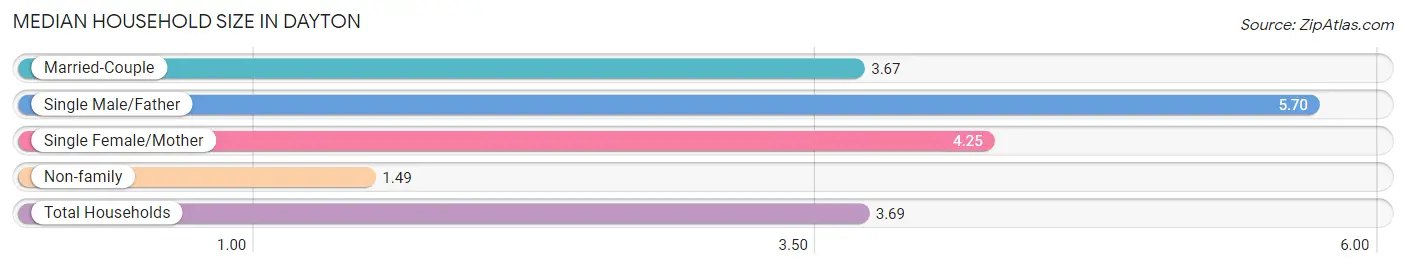
Median Household Size in Dayton
The median household size in Dayton is 3.69 persons per household, with single male/father households (71 | 9.8%) accounting for the largest median household size of 5.7 persons per household. non-family households (89 | 12.3%) represent the smallest median household size with 1.49 persons per household.
| Household Type | # Households | Household Size |
| Married-Couple | 451 (62.5%) | 3.67 |
| Single Male/Father | 71 (9.8%) | 5.70 |
| Single Female/Mother | 111 (15.4%) | 4.25 |
| Non-family | 89 (12.3%) | 1.49 |
| Total Households | 722 (100.0%) | 3.69 |
Household Size by Marriage Status in Dayton
Out of a total of 722 households in Dayton, 633 (87.7%) are family households, while 89 (12.3%) are nonfamily households. The most numerous type of family households are 2-person households, comprising 232, and the most common type of nonfamily households are 1-person households, comprising 57.
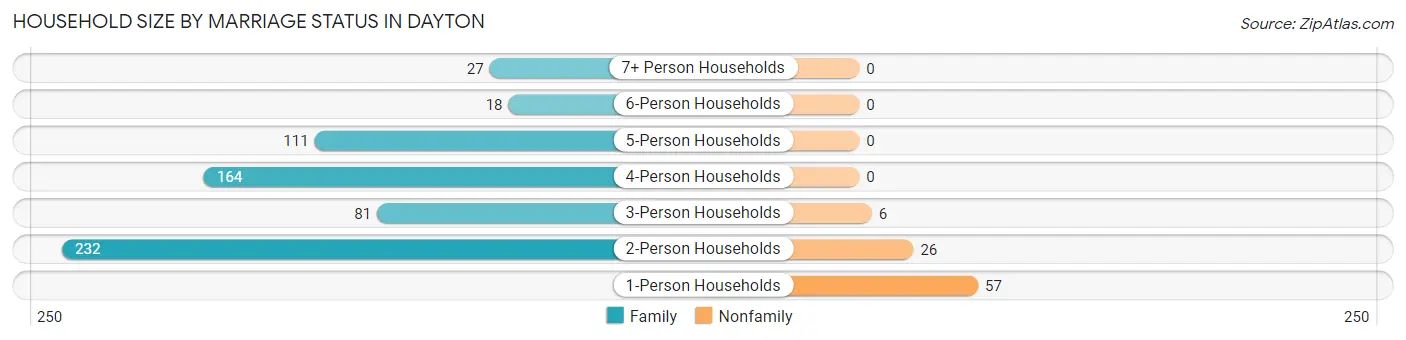
| Household Size | Family Households | Nonfamily Households |
| 1-Person Households | - | 57 (7.9%) |
| 2-Person Households | 232 (32.1%) | 26 (3.6%) |
| 3-Person Households | 81 (11.2%) | 6 (0.8%) |
| 4-Person Households | 164 (22.7%) | 0 (0.0%) |
| 5-Person Households | 111 (15.4%) | 0 (0.0%) |
| 6-Person Households | 18 (2.5%) | 0 (0.0%) |
| 7+ Person Households | 27 (3.7%) | 0 (0.0%) |
| Total | 633 (87.7%) | 89 (12.3%) |
Female Fertility in Dayton
Fertility by Age in Dayton
Average fertility rate in Dayton is 159.0 births per 1,000 women. Women in the age bracket of 20 to 34 years have the highest fertility rate with 321.0 births per 1,000 women. Women in the age bracket of 20 to 34 years acount for 93.8% of all women with births.
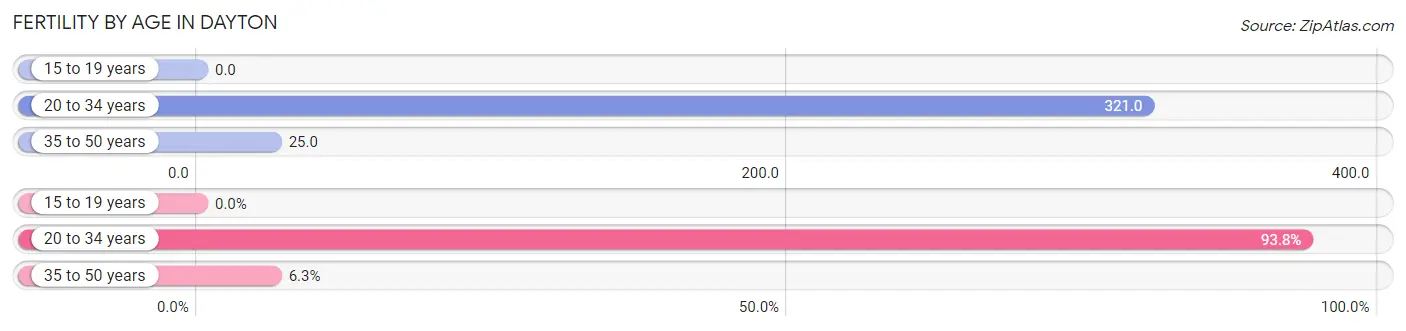
| Age Bracket | Women with Births | Births / 1,000 Women |
| 15 to 19 years | 0 (0.0%) | 0.0 |
| 20 to 34 years | 75 (93.8%) | 321.0 |
| 35 to 50 years | 5 (6.2%) | 25.0 |
| Total | 80 (100.0%) | 159.0 |
Fertility by Age by Marriage Status in Dayton
26.3% of women with births (80) in Dayton are married. The highest percentage of unmarried women with births falls into 20 to 34 years age bracket with 78.7% of them unmarried at the time of birth, while the lowest percentage of unmarried women with births belong to 35 to 50 years age bracket with 0.0% of them unmarried.
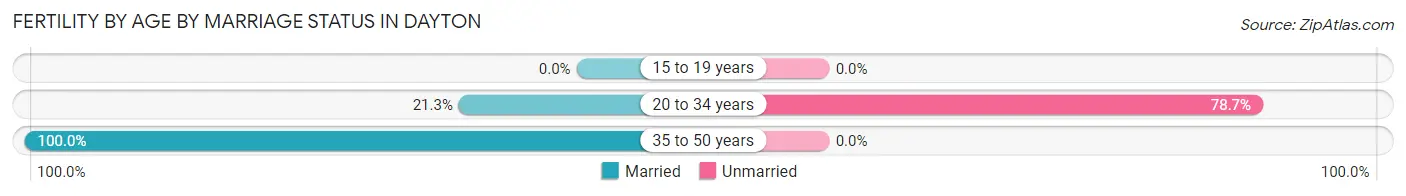
| Age Bracket | Married | Unmarried |
| 15 to 19 years | 0 (0.0%) | 0 (0.0%) |
| 20 to 34 years | 16 (21.3%) | 59 (78.7%) |
| 35 to 50 years | 5 (100.0%) | 0 (0.0%) |
| Total | 21 (26.3%) | 59 (73.8%) |
Fertility by Education in Dayton
Average fertility rate in Dayton is 159.0 births per 1,000 women. Women with the education attainment of graduate degree have the highest fertility rate of 263.0 births per 1,000 women, while women with the education attainment of college or associate's degree have the lowest fertility at 42.0 births per 1,000 women. Women with the education attainment of less than high school represent 43.8% of all women with births.
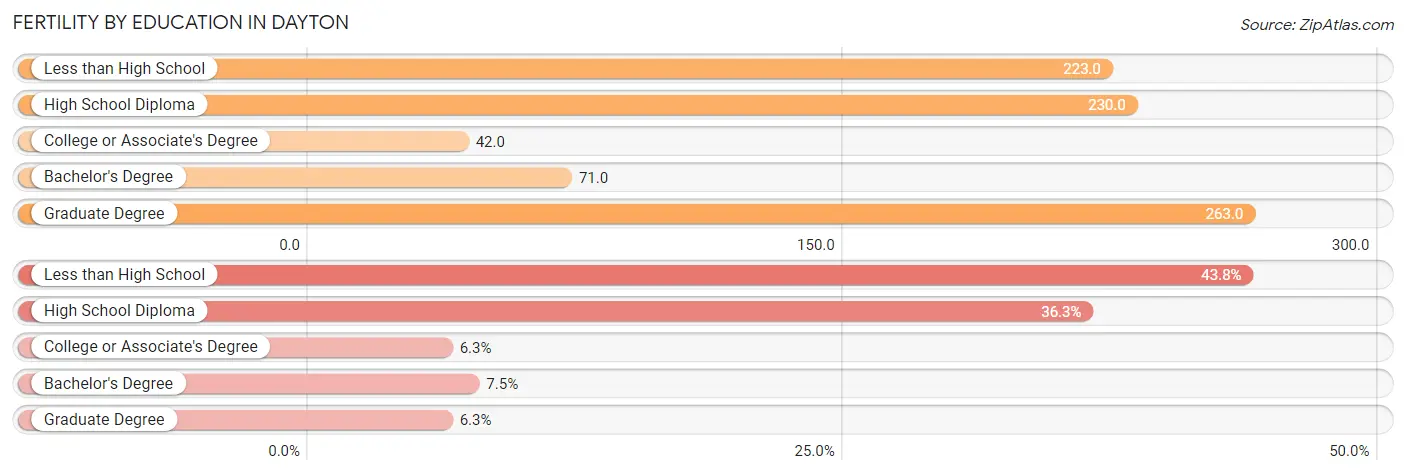
| Educational Attainment | Women with Births | Births / 1,000 Women |
| Less than High School | 35 (43.8%) | 223.0 |
| High School Diploma | 29 (36.2%) | 230.0 |
| College or Associate's Degree | 5 (6.2%) | 42.0 |
| Bachelor's Degree | 6 (7.5%) | 71.0 |
| Graduate Degree | 5 (6.2%) | 263.0 |
| Total | 80 (100.0%) | 159.0 |
Fertility by Education by Marriage Status in Dayton
73.8% of women with births in Dayton are unmarried. Women with the educational attainment of college or associate's degree are most likely to be married with 100.0% of them married at childbirth, while women with the educational attainment of less than high school are least likely to be married with 100.0% of them unmarried at childbirth.
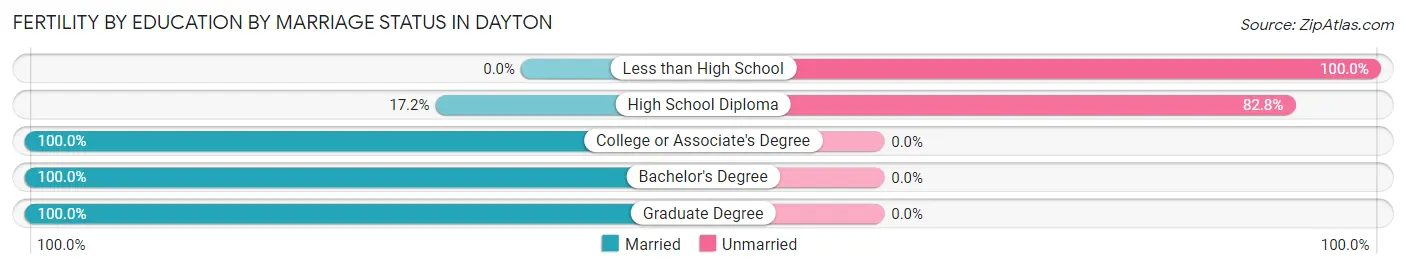
| Educational Attainment | Married | Unmarried |
| Less than High School | 0 (0.0%) | 35 (100.0%) |
| High School Diploma | 5 (17.2%) | 24 (82.8%) |
| College or Associate's Degree | 5 (100.0%) | 0 (0.0%) |
| Bachelor's Degree | 6 (100.0%) | 0 (0.0%) |
| Graduate Degree | 5 (100.0%) | 0 (0.0%) |
| Total | 21 (26.3%) | 59 (73.8%) |
Employment Characteristics in Dayton
Employment by Class of Employer in Dayton
Among the 996 employed individuals in Dayton, private company employees (634 | 63.6%), state government employees (92 | 9.2%), and not-for-profit organizations (75 | 7.5%) make up the most common classes of employment.
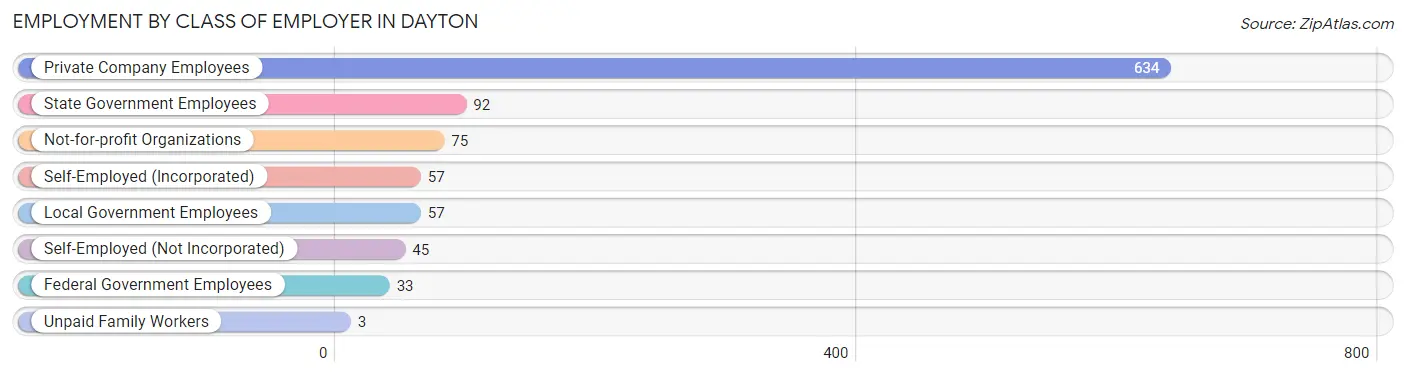
| Employer Class | # Employees | % Employees |
| Private Company Employees | 634 | 63.6% |
| Self-Employed (Incorporated) | 57 | 5.7% |
| Self-Employed (Not Incorporated) | 45 | 4.5% |
| Not-for-profit Organizations | 75 | 7.5% |
| Local Government Employees | 57 | 5.7% |
| State Government Employees | 92 | 9.2% |
| Federal Government Employees | 33 | 3.3% |
| Unpaid Family Workers | 3 | 0.3% |
| Total | 996 | 100.0% |
Employment Status by Age in Dayton
According to the labor force statistics for Dayton, out of the total population over 16 years of age (2,111), 56.6% or 1,195 individuals are in the labor force, with 15.7% or 188 of them unemployed. The age group with the highest labor force participation rate is 30 to 34 years, with 83.5% or 167 individuals in the labor force. Within the labor force, the 35 to 44 years age range has the highest percentage of unemployed individuals, with 44.8% or 73 of them being unemployed.
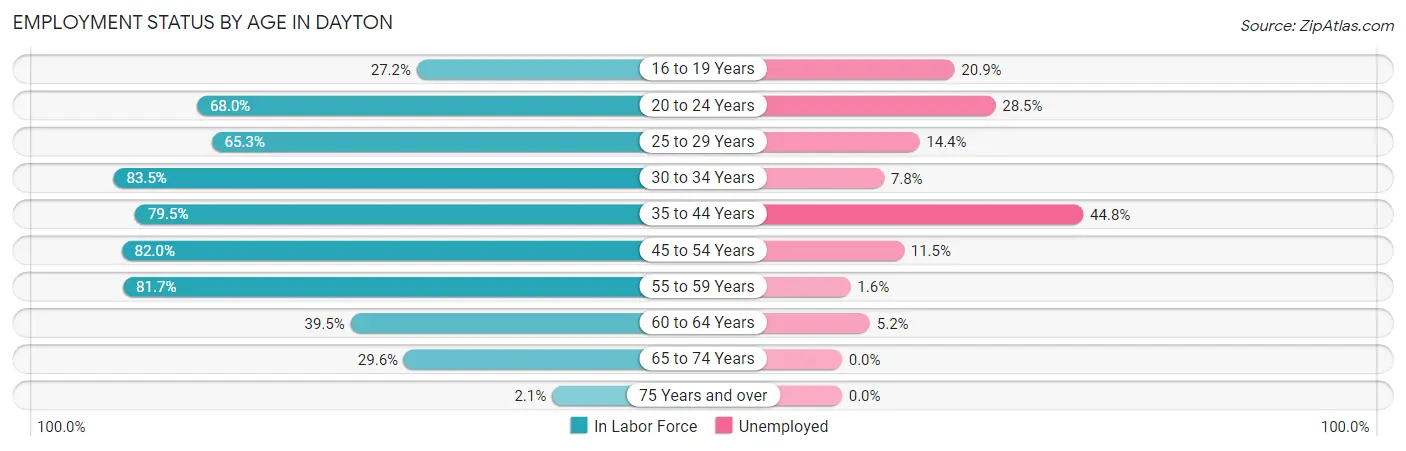
| Age Bracket | In Labor Force | Unemployed |
| 16 to 19 Years | 43 (27.2%) | 9 (20.9%) |
| 20 to 24 Years | 123 (68.0%) | 35 (28.5%) |
| 25 to 29 Years | 111 (65.3%) | 16 (14.4%) |
| 30 to 34 Years | 167 (83.5%) | 13 (7.8%) |
| 35 to 44 Years | 163 (79.5%) | 73 (44.8%) |
| 45 to 54 Years | 323 (82.0%) | 37 (11.5%) |
| 55 to 59 Years | 125 (81.7%) | 2 (1.6%) |
| 60 to 64 Years | 58 (39.5%) | 3 (5.2%) |
| 65 to 74 Years | 77 (29.6%) | 0 (0.0%) |
| 75 Years and over | 5 (2.1%) | 0 (0.0%) |
| Total | 1,195 (56.6%) | 188 (15.7%) |
Employment Status by Educational Attainment in Dayton
According to labor force statistics for Dayton, 74.6% of individuals (947) out of the total population between 25 and 64 years of age (1,269) are in the labor force, with 15.2% or 144 of them being unemployed. The group with the highest labor force participation rate are those with the educational attainment of bachelor's degree or higher, with 88.6% or 287 individuals in the labor force. Within the labor force, individuals with less than high school education have the highest percentage of unemployment, with 36.0% or 36 of them being unemployed.
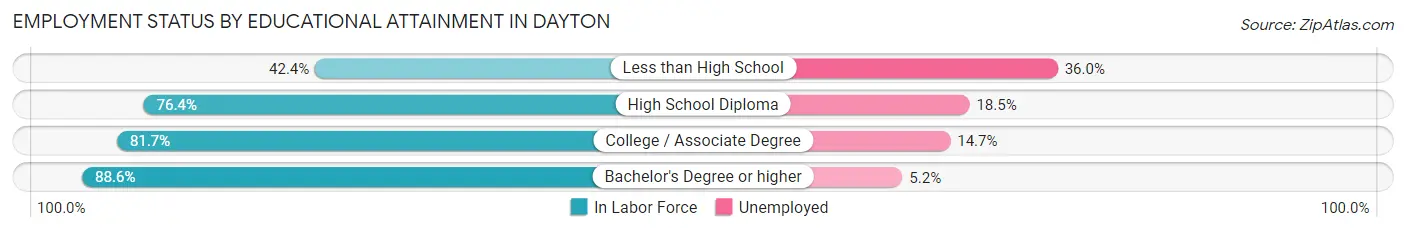
| Educational Attainment | In Labor Force | Unemployed |
| Less than High School | 100 (42.4%) | 85 (36.0%) |
| High School Diploma | 275 (76.4%) | 67 (18.5%) |
| College / Associate Degree | 285 (81.7%) | 51 (14.7%) |
| Bachelor's Degree or higher | 287 (88.6%) | 17 (5.2%) |
| Total | 947 (74.6%) | 193 (15.2%) |
Employment Occupations by Sex in Dayton
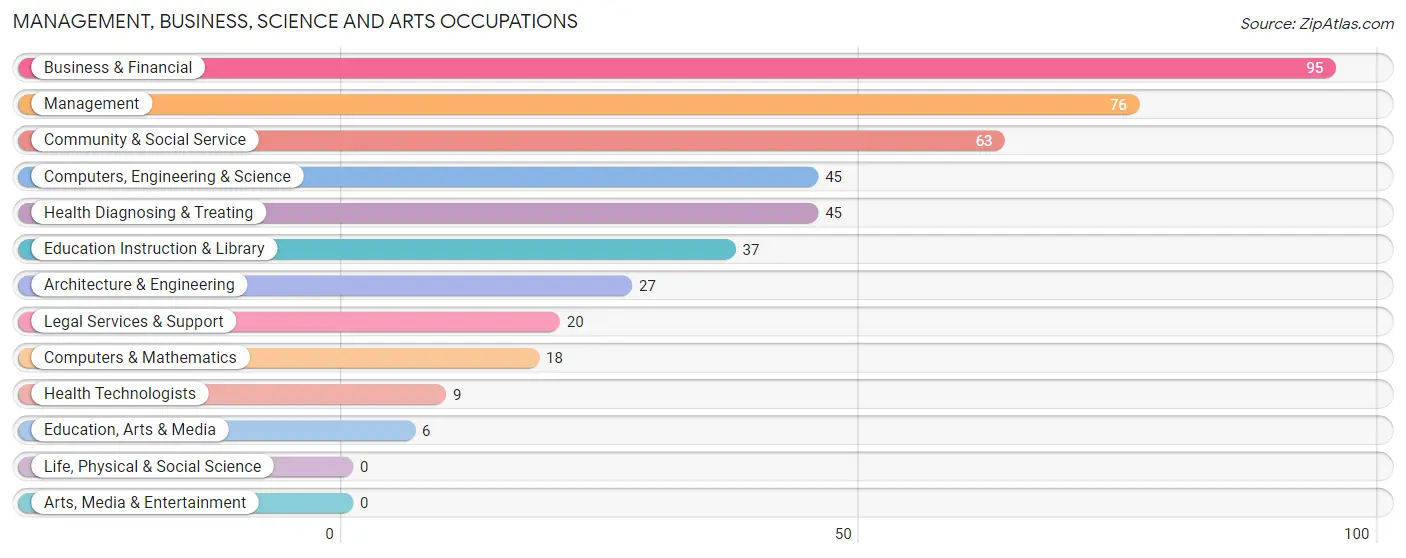
Management, Business, Science and Arts Occupations
The most common Management, Business, Science and Arts occupations in Dayton are Business & Financial (95 | 9.4%), Management (76 | 7.5%), Community & Social Service (63 | 6.3%), Computers, Engineering & Science (45 | 4.5%), and Health Diagnosing & Treating (45 | 4.5%).
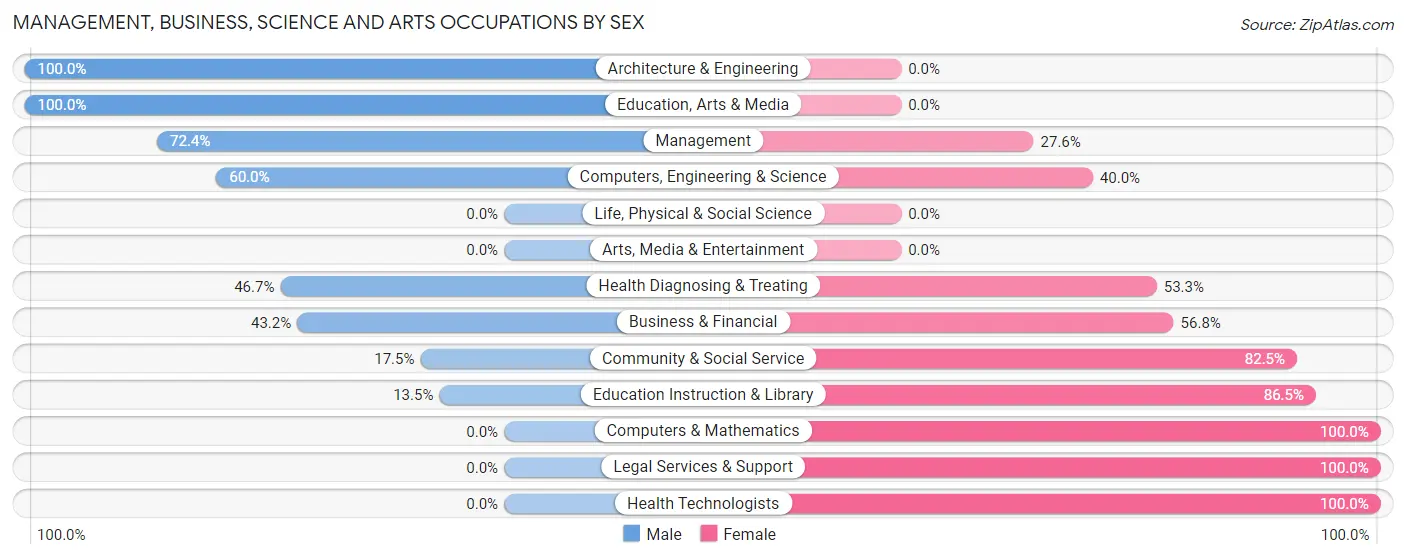
Management, Business, Science and Arts Occupations by Sex
Within the Management, Business, Science and Arts occupations in Dayton, the most male-oriented occupations are Architecture & Engineering (100.0%), Education, Arts & Media (100.0%), and Management (72.4%), while the most female-oriented occupations are Computers & Mathematics (100.0%), Legal Services & Support (100.0%), and Health Technologists (100.0%).
| Occupation | Male | Female |
| Management | 55 (72.4%) | 21 (27.6%) |
| Business & Financial | 41 (43.2%) | 54 (56.8%) |
| Computers, Engineering & Science | 27 (60.0%) | 18 (40.0%) |
| Computers & Mathematics | 0 (0.0%) | 18 (100.0%) |
| Architecture & Engineering | 27 (100.0%) | 0 (0.0%) |
| Life, Physical & Social Science | 0 (0.0%) | 0 (0.0%) |
| Community & Social Service | 11 (17.5%) | 52 (82.5%) |
| Education, Arts & Media | 6 (100.0%) | 0 (0.0%) |
| Legal Services & Support | 0 (0.0%) | 20 (100.0%) |
| Education Instruction & Library | 5 (13.5%) | 32 (86.5%) |
| Arts, Media & Entertainment | 0 (0.0%) | 0 (0.0%) |
| Health Diagnosing & Treating | 21 (46.7%) | 24 (53.3%) |
| Health Technologists | 0 (0.0%) | 9 (100.0%) |
| Total (Category) | 155 (47.8%) | 169 (52.2%) |
| Total (Overall) | 564 (56.0%) | 443 (44.0%) |
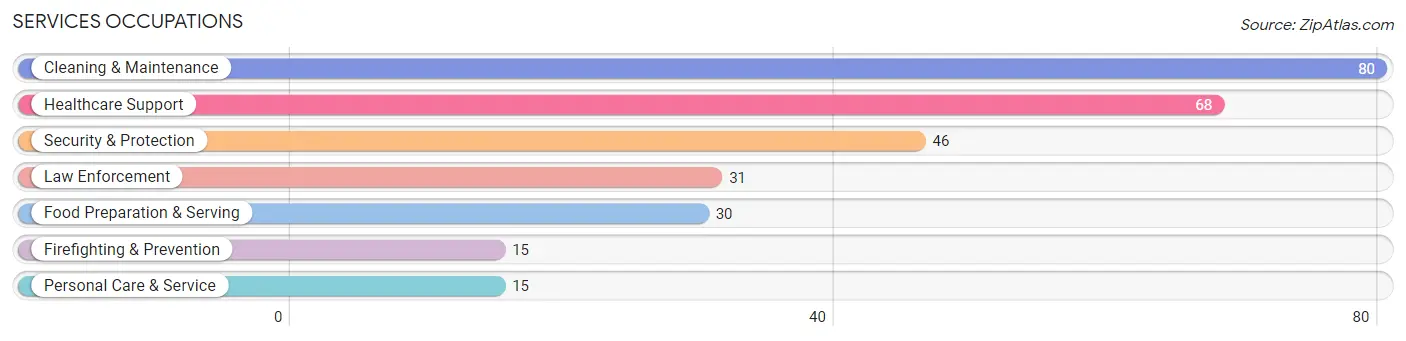
Services Occupations
The most common Services occupations in Dayton are Cleaning & Maintenance (80 | 7.9%), Healthcare Support (68 | 6.8%), Security & Protection (46 | 4.6%), Law Enforcement (31 | 3.1%), and Food Preparation & Serving (30 | 3.0%).
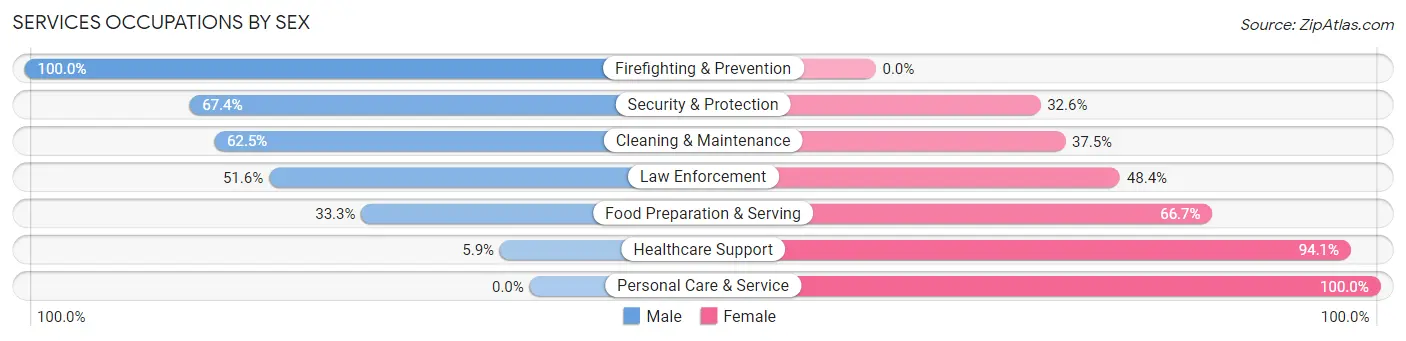
Services Occupations by Sex
Within the Services occupations in Dayton, the most male-oriented occupations are Firefighting & Prevention (100.0%), Security & Protection (67.4%), and Cleaning & Maintenance (62.5%), while the most female-oriented occupations are Personal Care & Service (100.0%), Healthcare Support (94.1%), and Food Preparation & Serving (66.7%).
| Occupation | Male | Female |
| Healthcare Support | 4 (5.9%) | 64 (94.1%) |
| Security & Protection | 31 (67.4%) | 15 (32.6%) |
| Firefighting & Prevention | 15 (100.0%) | 0 (0.0%) |
| Law Enforcement | 16 (51.6%) | 15 (48.4%) |
| Food Preparation & Serving | 10 (33.3%) | 20 (66.7%) |
| Cleaning & Maintenance | 50 (62.5%) | 30 (37.5%) |
| Personal Care & Service | 0 (0.0%) | 15 (100.0%) |
| Total (Category) | 95 (39.8%) | 144 (60.3%) |
| Total (Overall) | 564 (56.0%) | 443 (44.0%) |
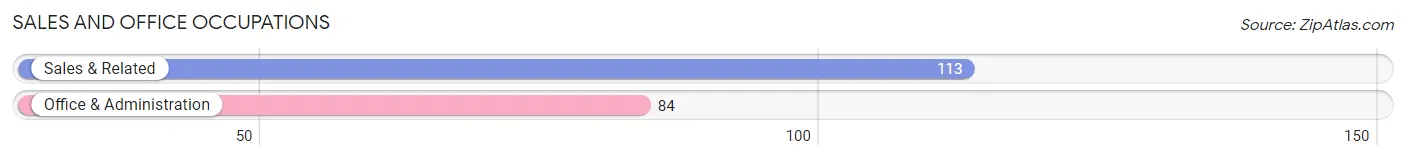
Sales and Office Occupations
The most common Sales and Office occupations in Dayton are Sales & Related (113 | 11.2%), and Office & Administration (84 | 8.3%).
Sales and Office Occupations by Sex
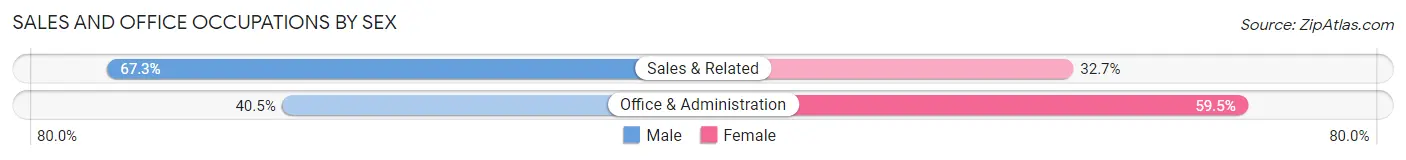
| Occupation | Male | Female |
| Sales & Related | 76 (67.3%) | 37 (32.7%) |
| Office & Administration | 34 (40.5%) | 50 (59.5%) |
| Total (Category) | 110 (55.8%) | 87 (44.2%) |
| Total (Overall) | 564 (56.0%) | 443 (44.0%) |
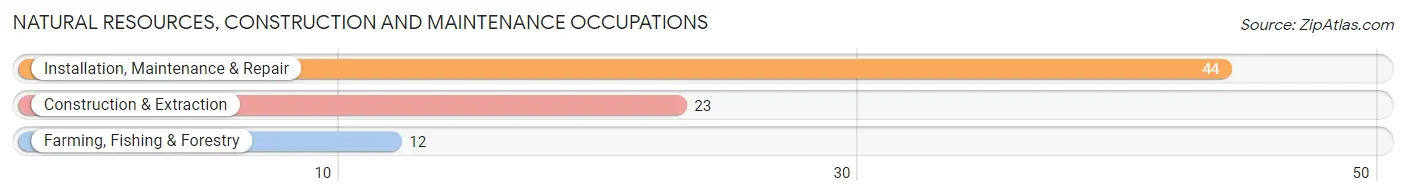
Natural Resources, Construction and Maintenance Occupations
The most common Natural Resources, Construction and Maintenance occupations in Dayton are Installation, Maintenance & Repair (44 | 4.4%), Construction & Extraction (23 | 2.3%), and Farming, Fishing & Forestry (12 | 1.2%).
Natural Resources, Construction and Maintenance Occupations by Sex
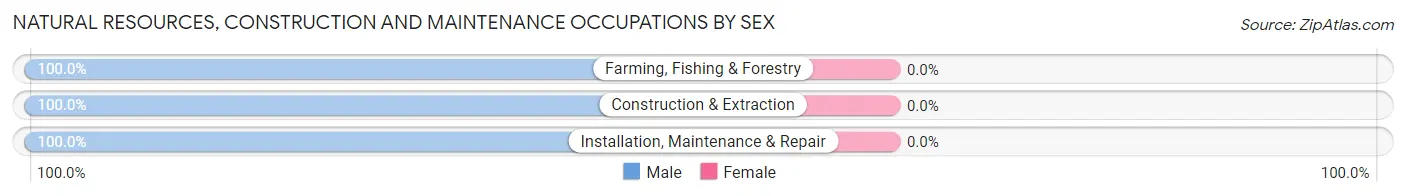
| Occupation | Male | Female |
| Farming, Fishing & Forestry | 12 (100.0%) | 0 (0.0%) |
| Construction & Extraction | 23 (100.0%) | 0 (0.0%) |
| Installation, Maintenance & Repair | 44 (100.0%) | 0 (0.0%) |
| Total (Category) | 79 (100.0%) | 0 (0.0%) |
| Total (Overall) | 564 (56.0%) | 443 (44.0%) |
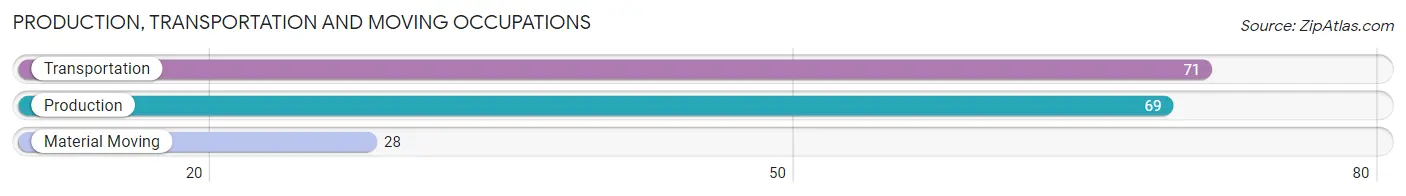
Production, Transportation and Moving Occupations
The most common Production, Transportation and Moving occupations in Dayton are Transportation (71 | 7.0%), Production (69 | 6.9%), and Material Moving (28 | 2.8%).
Production, Transportation and Moving Occupations by Sex
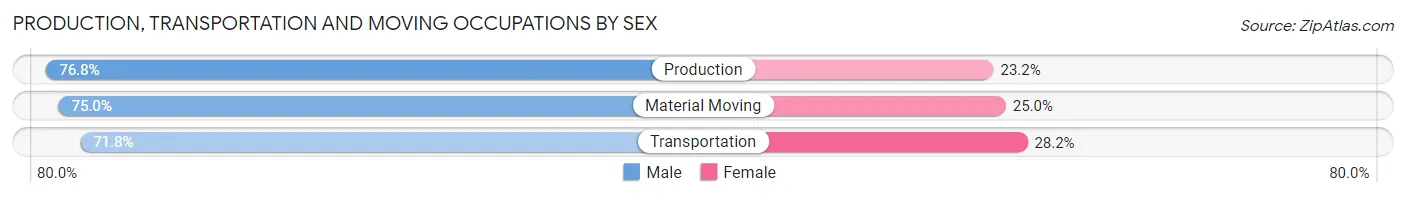
| Occupation | Male | Female |
| Production | 53 (76.8%) | 16 (23.2%) |
| Transportation | 51 (71.8%) | 20 (28.2%) |
| Material Moving | 21 (75.0%) | 7 (25.0%) |
| Total (Category) | 125 (74.4%) | 43 (25.6%) |
| Total (Overall) | 564 (56.0%) | 443 (44.0%) |
Employment Industries by Sex in Dayton
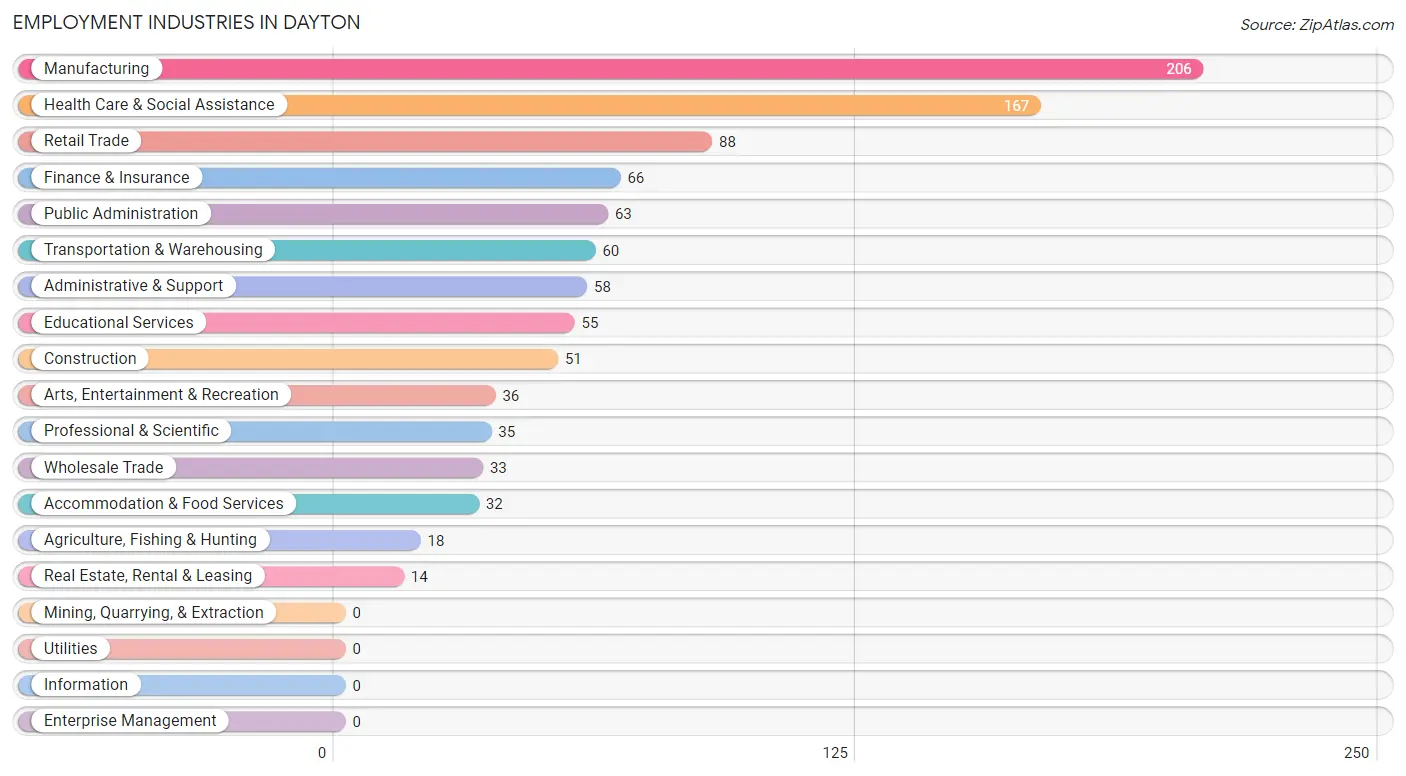
Employment Industries in Dayton
The major employment industries in Dayton include Manufacturing (206 | 20.5%), Health Care & Social Assistance (167 | 16.6%), Retail Trade (88 | 8.7%), Finance & Insurance (66 | 6.6%), and Public Administration (63 | 6.3%).
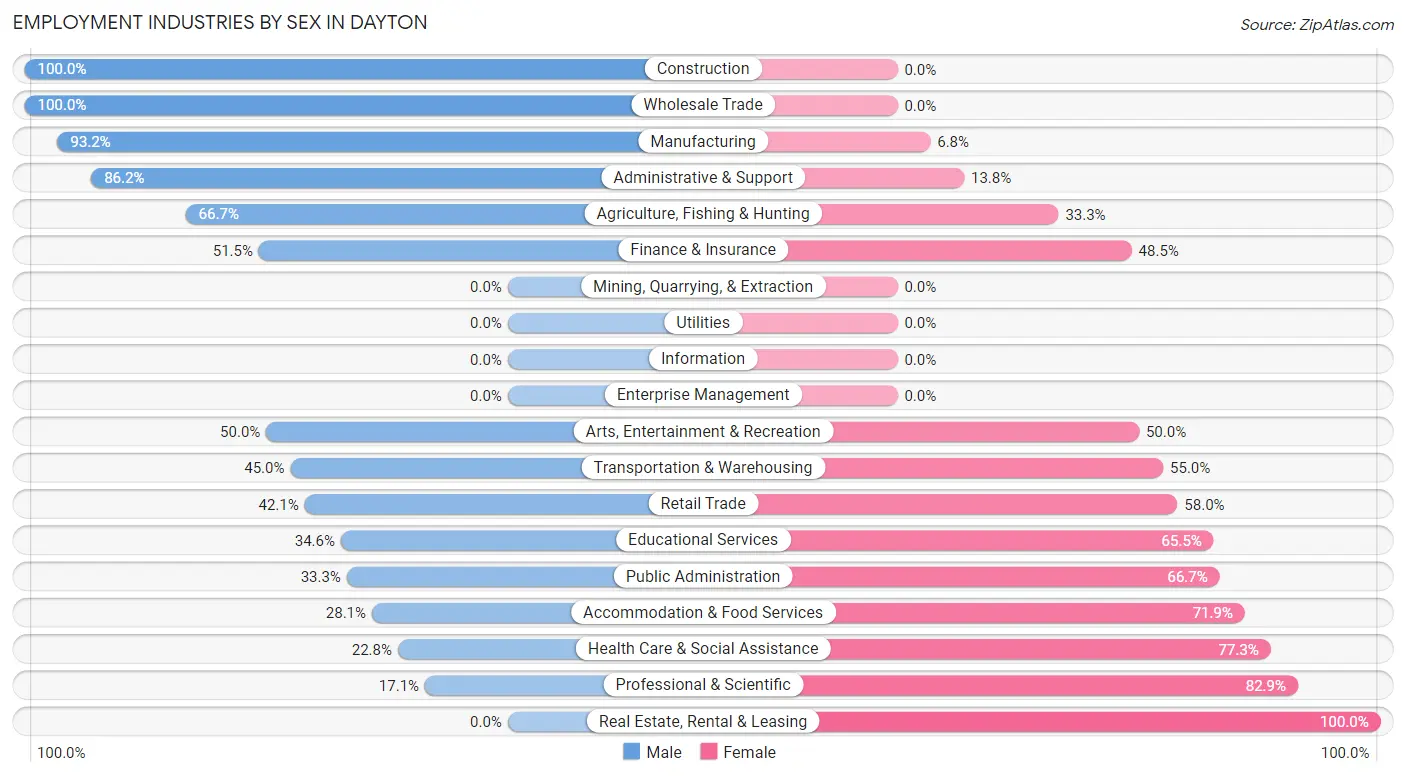
Employment Industries by Sex in Dayton
The Dayton industries that see more men than women are Construction (100.0%), Wholesale Trade (100.0%), and Manufacturing (93.2%), whereas the industries that tend to have a higher number of women are Real Estate, Rental & Leasing (100.0%), Professional & Scientific (82.9%), and Health Care & Social Assistance (77.2%).
| Industry | Male | Female |
| Agriculture, Fishing & Hunting | 12 (66.7%) | 6 (33.3%) |
| Mining, Quarrying, & Extraction | 0 (0.0%) | 0 (0.0%) |
| Construction | 51 (100.0%) | 0 (0.0%) |
| Manufacturing | 192 (93.2%) | 14 (6.8%) |
| Wholesale Trade | 33 (100.0%) | 0 (0.0%) |
| Retail Trade | 37 (42.0%) | 51 (58.0%) |
| Transportation & Warehousing | 27 (45.0%) | 33 (55.0%) |
| Utilities | 0 (0.0%) | 0 (0.0%) |
| Information | 0 (0.0%) | 0 (0.0%) |
| Finance & Insurance | 34 (51.5%) | 32 (48.5%) |
| Real Estate, Rental & Leasing | 0 (0.0%) | 14 (100.0%) |
| Professional & Scientific | 6 (17.1%) | 29 (82.9%) |
| Enterprise Management | 0 (0.0%) | 0 (0.0%) |
| Administrative & Support | 50 (86.2%) | 8 (13.8%) |
| Educational Services | 19 (34.5%) | 36 (65.4%) |
| Health Care & Social Assistance | 38 (22.8%) | 129 (77.2%) |
| Arts, Entertainment & Recreation | 18 (50.0%) | 18 (50.0%) |
| Accommodation & Food Services | 9 (28.1%) | 23 (71.9%) |
| Public Administration | 21 (33.3%) | 42 (66.7%) |
| Total | 564 (56.0%) | 443 (44.0%) |
Education in Dayton
School Enrollment in Dayton
The most common levels of schooling among the 646 students in Dayton are high school (232 | 35.9%), elementary school (133 | 20.6%), and college / undergraduate (106 | 16.4%).
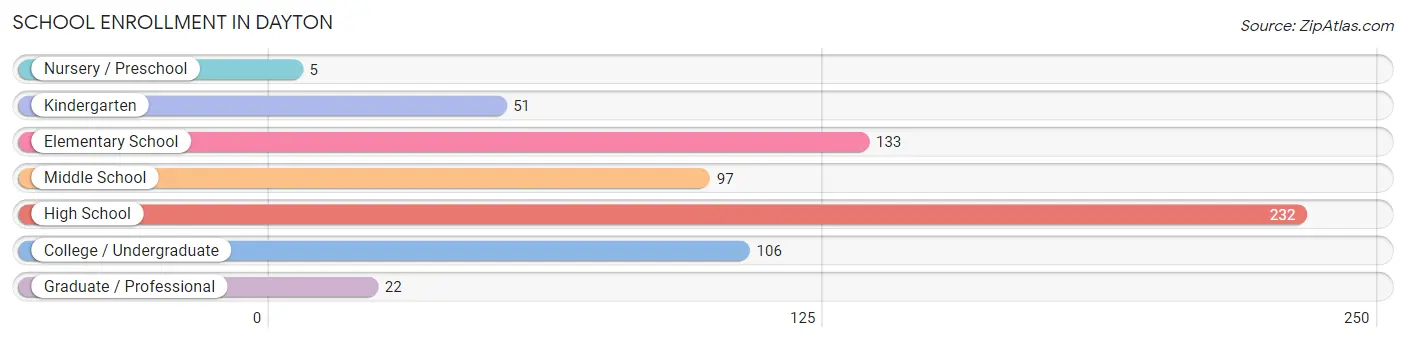
| School Level | # Students | % Students |
| Nursery / Preschool | 5 | 0.8% |
| Kindergarten | 51 | 7.9% |
| Elementary School | 133 | 20.6% |
| Middle School | 97 | 15.0% |
| High School | 232 | 35.9% |
| College / Undergraduate | 106 | 16.4% |
| Graduate / Professional | 22 | 3.4% |
| Total | 646 | 100.0% |
School Enrollment by Age by Funding Source in Dayton
Out of a total of 646 students who are enrolled in schools in Dayton, 15 (2.3%) attend a private institution, while the remaining 631 (97.7%) are enrolled in public schools. The age group of 5 to 9 year old has the highest likelihood of being enrolled in private schools, with 11 (8.9% in the age bracket) enrolled. Conversely, the age group of 3 to 4 year olds has the lowest likelihood of being enrolled in a private school, with 29 (100.0% in the age bracket) attending a public institution.
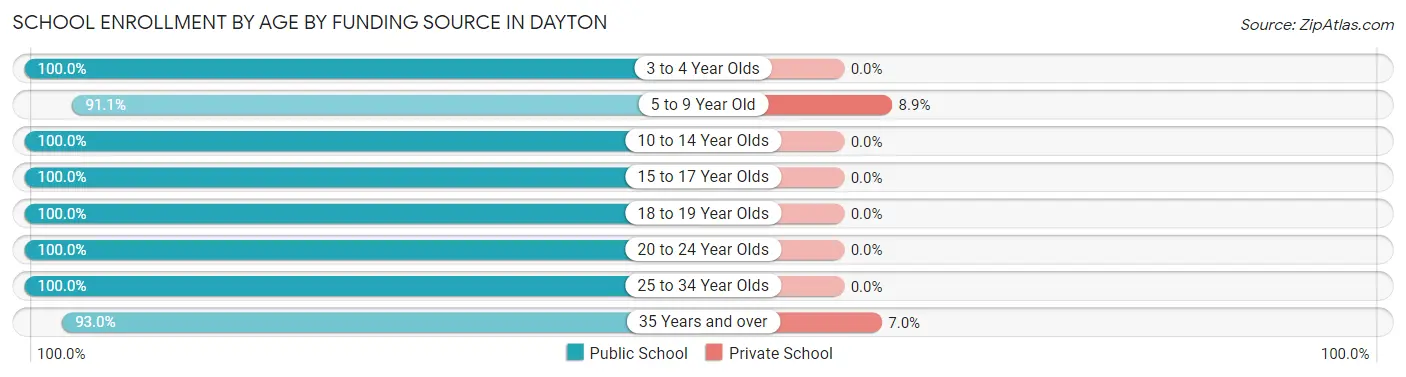
| Age Bracket | Public School | Private School |
| 3 to 4 Year Olds | 29 (100.0%) | 0 (0.0%) |
| 5 to 9 Year Old | 112 (91.1%) | 11 (8.9%) |
| 10 to 14 Year Olds | 174 (100.0%) | 0 (0.0%) |
| 15 to 17 Year Olds | 157 (100.0%) | 0 (0.0%) |
| 18 to 19 Year Olds | 49 (100.0%) | 0 (0.0%) |
| 20 to 24 Year Olds | 11 (100.0%) | 0 (0.0%) |
| 25 to 34 Year Olds | 46 (100.0%) | 0 (0.0%) |
| 35 Years and over | 53 (93.0%) | 4 (7.0%) |
| Total | 631 (97.7%) | 15 (2.3%) |
Educational Attainment by Field of Study in Dayton
Business (77 | 16.8%), social sciences (74 | 16.1%), education (67 | 14.6%), liberal arts & history (54 | 11.8%), and science & technology (47 | 10.2%) are the most common fields of study among 459 individuals in Dayton who have obtained a bachelor's degree or higher.
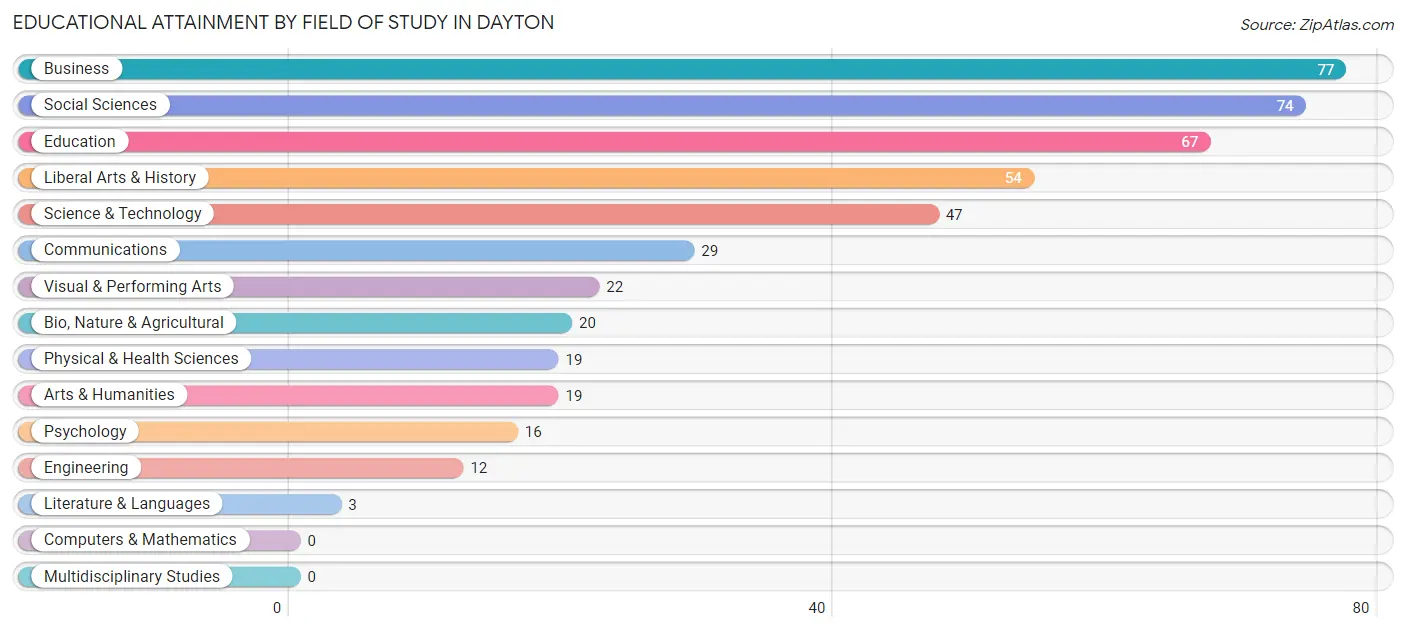
| Field of Study | # Graduates | % Graduates |
| Computers & Mathematics | 0 | 0.0% |
| Bio, Nature & Agricultural | 20 | 4.4% |
| Physical & Health Sciences | 19 | 4.1% |
| Psychology | 16 | 3.5% |
| Social Sciences | 74 | 16.1% |
| Engineering | 12 | 2.6% |
| Multidisciplinary Studies | 0 | 0.0% |
| Science & Technology | 47 | 10.2% |
| Business | 77 | 16.8% |
| Education | 67 | 14.6% |
| Literature & Languages | 3 | 0.6% |
| Liberal Arts & History | 54 | 11.8% |
| Visual & Performing Arts | 22 | 4.8% |
| Communications | 29 | 6.3% |
| Arts & Humanities | 19 | 4.1% |
| Total | 459 | 100.0% |
Transportation & Commute in Dayton
Vehicle Availability by Sex in Dayton
The most prevalent vehicle ownership categories in Dayton are males with 3 vehicles (163, accounting for 29.2%) and females with 3 vehicles (152, making up 37.2%).
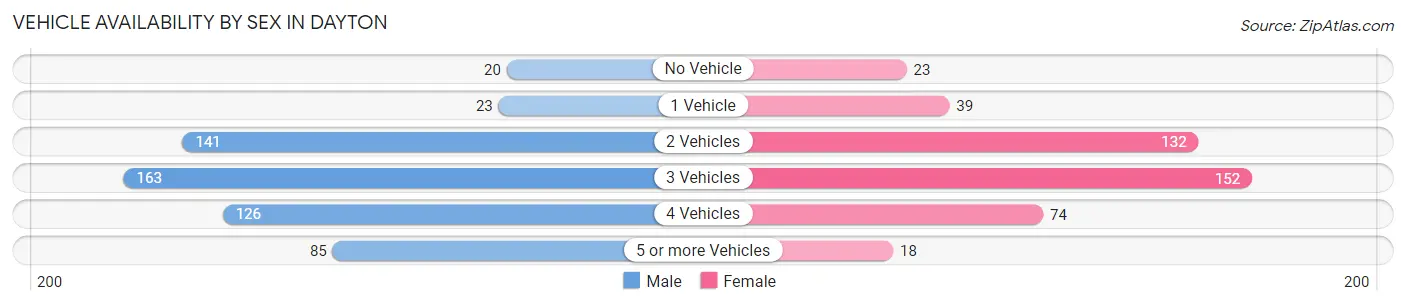
| Vehicles Available | Male | Female |
| No Vehicle | 20 (3.6%) | 23 (5.2%) |
| 1 Vehicle | 23 (4.1%) | 39 (8.9%) |
| 2 Vehicles | 141 (25.3%) | 132 (30.1%) |
| 3 Vehicles | 163 (29.2%) | 152 (34.7%) |
| 4 Vehicles | 126 (22.6%) | 74 (16.9%) |
| 5 or more Vehicles | 85 (15.2%) | 18 (4.1%) |
| Total | 558 (100.0%) | 438 (100.0%) |
Commute Time in Dayton
The most frequently occuring commute durations in Dayton are 10 to 14 minutes (165 commuters, 20.1%), 15 to 19 minutes (162 commuters, 19.7%), and 60 to 89 minutes (116 commuters, 14.1%).
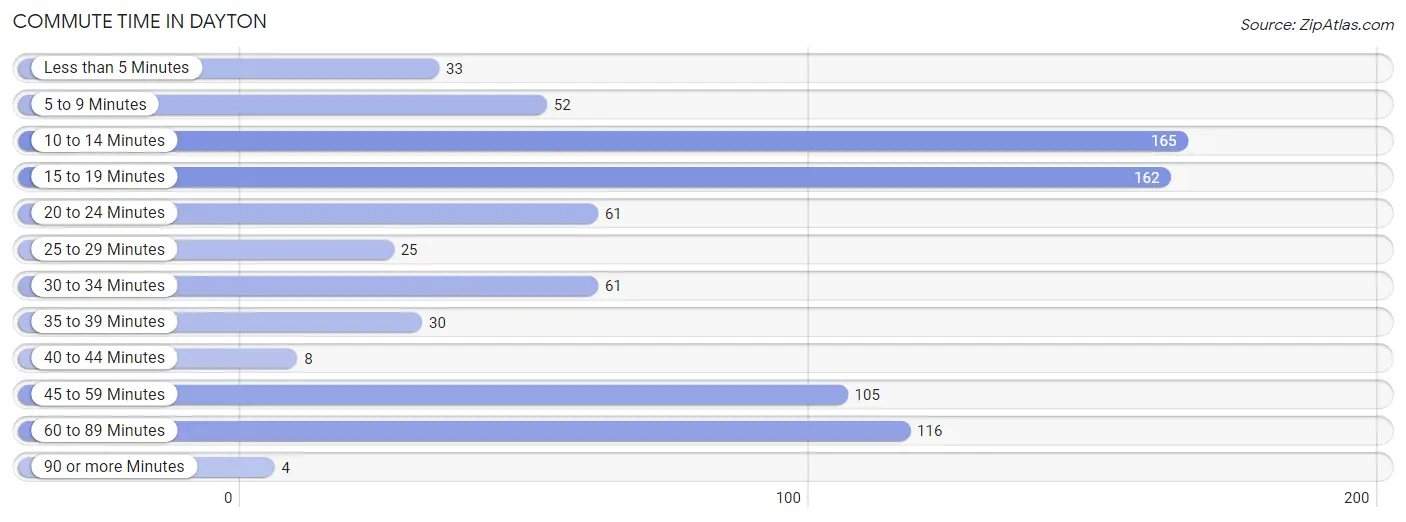
| Commute Time | # Commuters | % Commuters |
| Less than 5 Minutes | 33 | 4.0% |
| 5 to 9 Minutes | 52 | 6.3% |
| 10 to 14 Minutes | 165 | 20.1% |
| 15 to 19 Minutes | 162 | 19.7% |
| 20 to 24 Minutes | 61 | 7.4% |
| 25 to 29 Minutes | 25 | 3.0% |
| 30 to 34 Minutes | 61 | 7.4% |
| 35 to 39 Minutes | 30 | 3.6% |
| 40 to 44 Minutes | 8 | 1.0% |
| 45 to 59 Minutes | 105 | 12.8% |
| 60 to 89 Minutes | 116 | 14.1% |
| 90 or more Minutes | 4 | 0.5% |
Commute Time by Sex in Dayton
The most common commute times in Dayton are 10 to 14 minutes (131 commuters, 27.0%) for males and 15 to 19 minutes (99 commuters, 29.4%) for females.
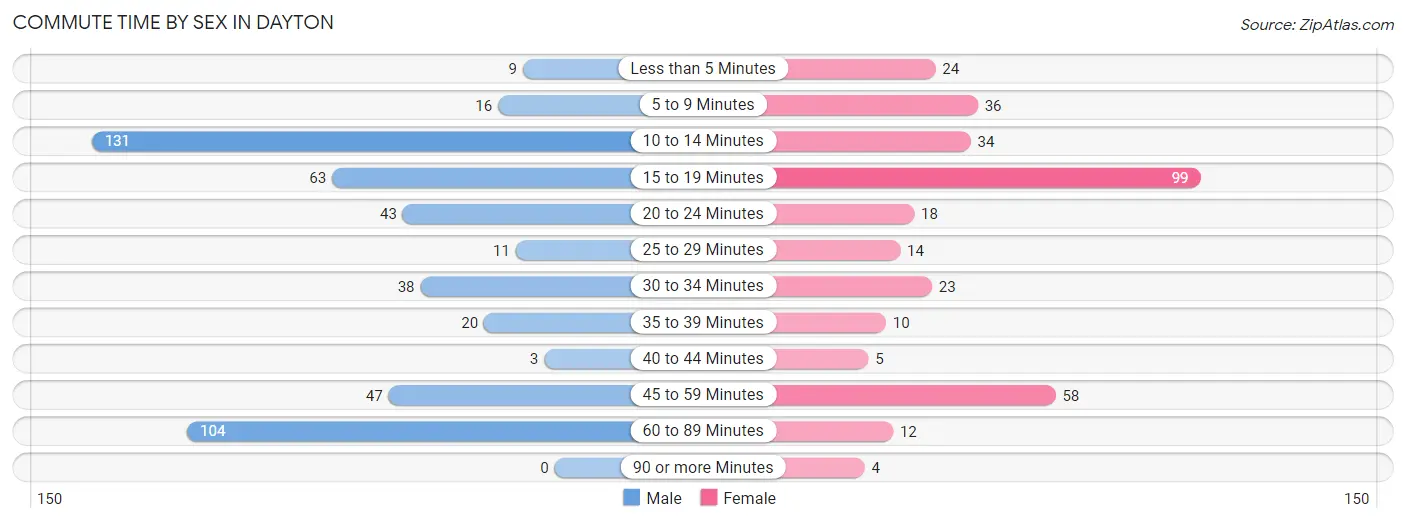
| Commute Time | Male | Female |
| Less than 5 Minutes | 9 (1.9%) | 24 (7.1%) |
| 5 to 9 Minutes | 16 (3.3%) | 36 (10.7%) |
| 10 to 14 Minutes | 131 (27.0%) | 34 (10.1%) |
| 15 to 19 Minutes | 63 (13.0%) | 99 (29.4%) |
| 20 to 24 Minutes | 43 (8.9%) | 18 (5.3%) |
| 25 to 29 Minutes | 11 (2.3%) | 14 (4.2%) |
| 30 to 34 Minutes | 38 (7.8%) | 23 (6.8%) |
| 35 to 39 Minutes | 20 (4.1%) | 10 (3.0%) |
| 40 to 44 Minutes | 3 (0.6%) | 5 (1.5%) |
| 45 to 59 Minutes | 47 (9.7%) | 58 (17.2%) |
| 60 to 89 Minutes | 104 (21.4%) | 12 (3.6%) |
| 90 or more Minutes | 0 (0.0%) | 4 (1.2%) |
Time of Departure to Work by Sex in Dayton
The most frequent times of departure to work in Dayton are 12:00 AM to 4:59 AM (87, 17.9%) for males and 7:30 AM to 7:59 AM (80, 23.7%) for females.
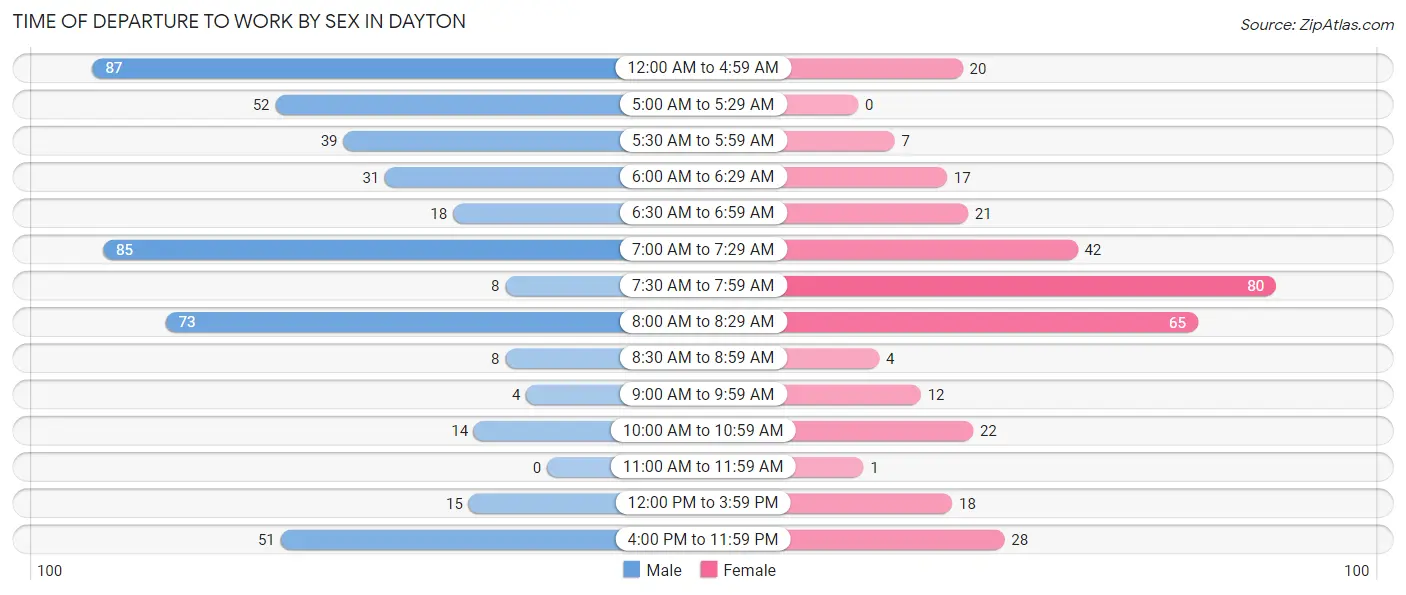
| Time of Departure | Male | Female |
| 12:00 AM to 4:59 AM | 87 (17.9%) | 20 (5.9%) |
| 5:00 AM to 5:29 AM | 52 (10.7%) | 0 (0.0%) |
| 5:30 AM to 5:59 AM | 39 (8.0%) | 7 (2.1%) |
| 6:00 AM to 6:29 AM | 31 (6.4%) | 17 (5.0%) |
| 6:30 AM to 6:59 AM | 18 (3.7%) | 21 (6.2%) |
| 7:00 AM to 7:29 AM | 85 (17.5%) | 42 (12.5%) |
| 7:30 AM to 7:59 AM | 8 (1.7%) | 80 (23.7%) |
| 8:00 AM to 8:29 AM | 73 (15.0%) | 65 (19.3%) |
| 8:30 AM to 8:59 AM | 8 (1.7%) | 4 (1.2%) |
| 9:00 AM to 9:59 AM | 4 (0.8%) | 12 (3.6%) |
| 10:00 AM to 10:59 AM | 14 (2.9%) | 22 (6.5%) |
| 11:00 AM to 11:59 AM | 0 (0.0%) | 1 (0.3%) |
| 12:00 PM to 3:59 PM | 15 (3.1%) | 18 (5.3%) |
| 4:00 PM to 11:59 PM | 51 (10.5%) | 28 (8.3%) |
| Total | 485 (100.0%) | 337 (100.0%) |
Housing Occupancy in Dayton
Occupancy by Ownership in Dayton
Of the total 722 dwellings in Dayton, owner-occupied units account for 571 (79.1%), while renter-occupied units make up 151 (20.9%).
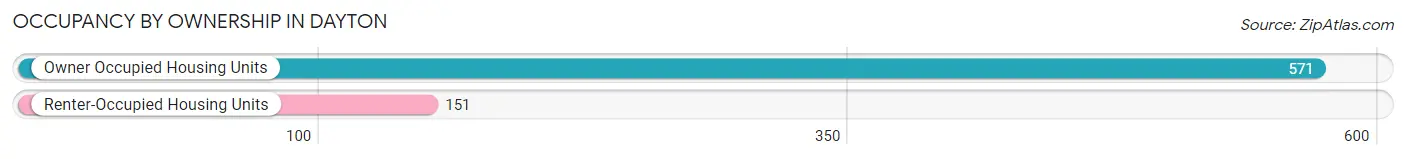
| Occupancy | # Housing Units | % Housing Units |
| Owner Occupied Housing Units | 571 | 79.1% |
| Renter-Occupied Housing Units | 151 | 20.9% |
| Total Occupied Housing Units | 722 | 100.0% |
Occupancy by Household Size in Dayton
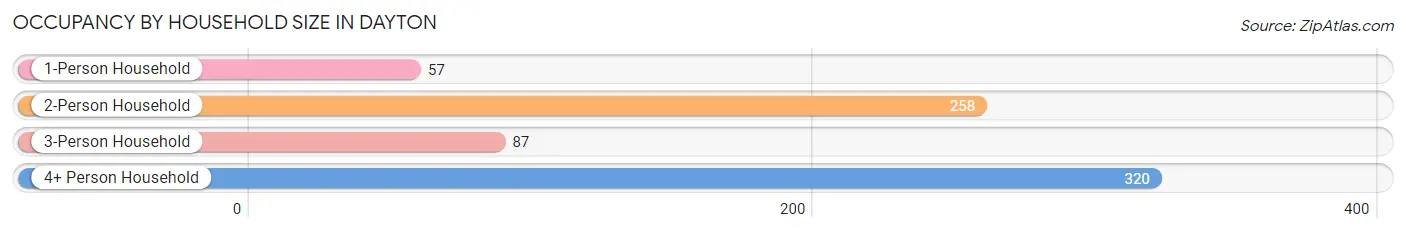
| Household Size | # Housing Units | % Housing Units |
| 1-Person Household | 57 | 7.9% |
| 2-Person Household | 258 | 35.7% |
| 3-Person Household | 87 | 12.0% |
| 4+ Person Household | 320 | 44.3% |
| Total Housing Units | 722 | 100.0% |
Occupancy by Ownership by Household Size in Dayton
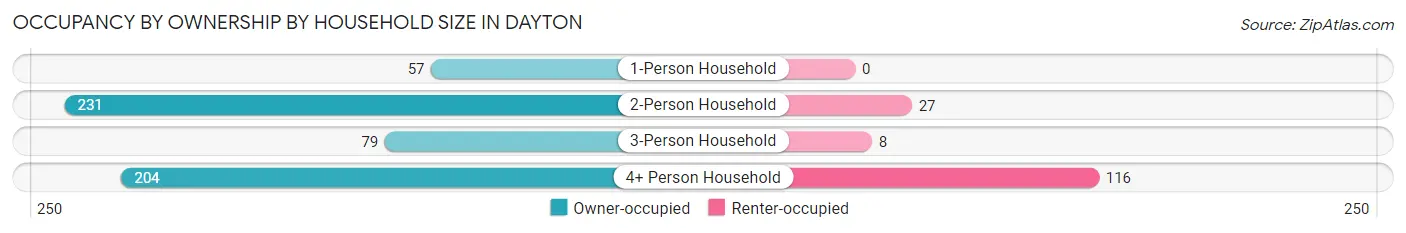
| Household Size | Owner-occupied | Renter-occupied |
| 1-Person Household | 57 (100.0%) | 0 (0.0%) |
| 2-Person Household | 231 (89.5%) | 27 (10.5%) |
| 3-Person Household | 79 (90.8%) | 8 (9.2%) |
| 4+ Person Household | 204 (63.7%) | 116 (36.2%) |
| Total Housing Units | 571 (79.1%) | 151 (20.9%) |
Occupancy by Educational Attainment in Dayton
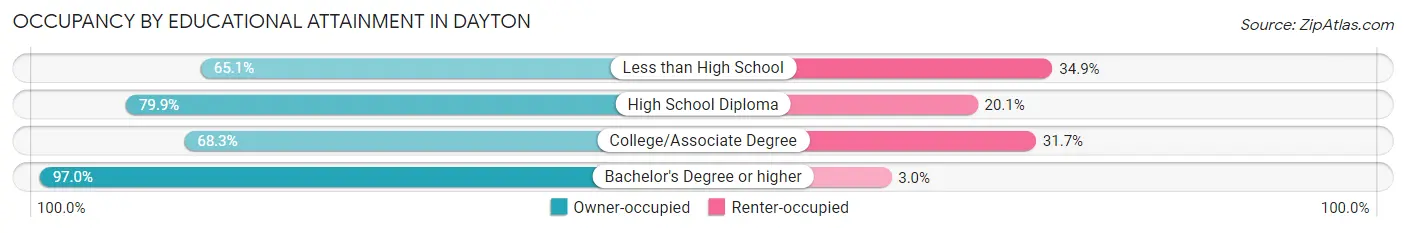
| Household Size | Owner-occupied | Renter-occupied |
| Less than High School | 54 (65.1%) | 29 (34.9%) |
| High School Diploma | 159 (79.9%) | 40 (20.1%) |
| College/Associate Degree | 164 (68.3%) | 76 (31.7%) |
| Bachelor's Degree or higher | 194 (97.0%) | 6 (3.0%) |
Occupancy by Age of Householder in Dayton
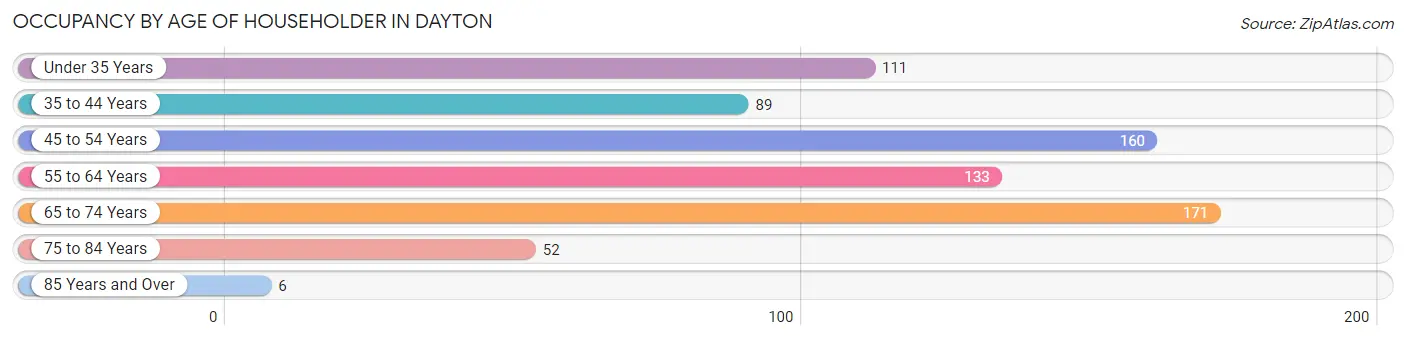
| Age Bracket | # Households | % Households |
| Under 35 Years | 111 | 15.4% |
| 35 to 44 Years | 89 | 12.3% |
| 45 to 54 Years | 160 | 22.2% |
| 55 to 64 Years | 133 | 18.4% |
| 65 to 74 Years | 171 | 23.7% |
| 75 to 84 Years | 52 | 7.2% |
| 85 Years and Over | 6 | 0.8% |
| Total | 722 | 100.0% |
Housing Finances in Dayton
Median Income by Occupancy in Dayton
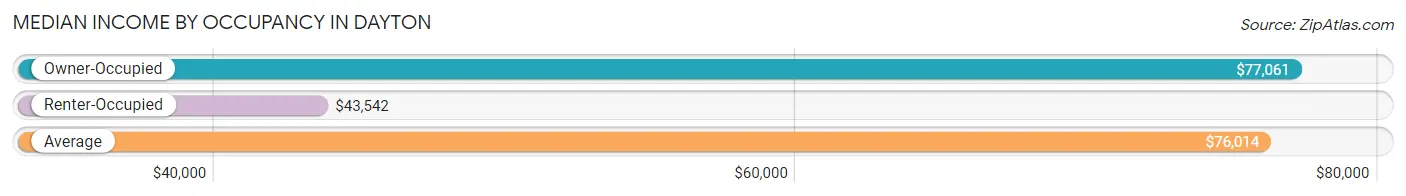
| Occupancy Type | # Households | Median Income |
| Owner-Occupied | 571 (79.1%) | $77,061 |
| Renter-Occupied | 151 (20.9%) | $43,542 |
| Average | 722 (100.0%) | $76,014 |
Occupancy by Householder Income Bracket in Dayton
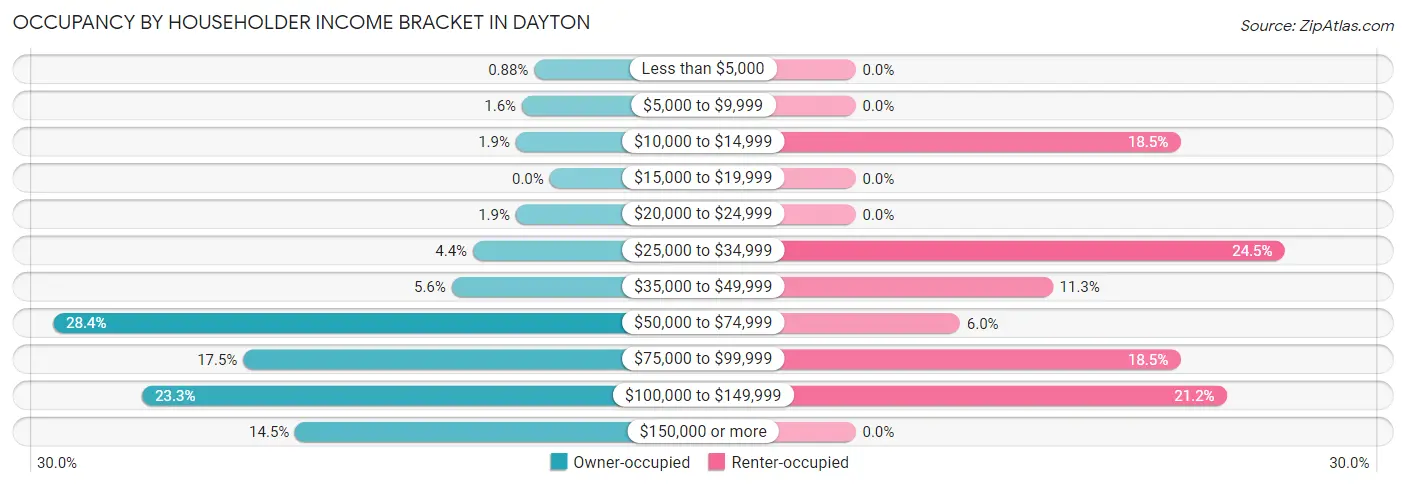
| Income Bracket | Owner-occupied | Renter-occupied |
| Less than $5,000 | 5 (0.9%) | 0 (0.0%) |
| $5,000 to $9,999 | 9 (1.6%) | 0 (0.0%) |
| $10,000 to $14,999 | 11 (1.9%) | 28 (18.5%) |
| $15,000 to $19,999 | 0 (0.0%) | 0 (0.0%) |
| $20,000 to $24,999 | 11 (1.9%) | 0 (0.0%) |
| $25,000 to $34,999 | 25 (4.4%) | 37 (24.5%) |
| $35,000 to $49,999 | 32 (5.6%) | 17 (11.3%) |
| $50,000 to $74,999 | 162 (28.4%) | 9 (6.0%) |
| $75,000 to $99,999 | 100 (17.5%) | 28 (18.5%) |
| $100,000 to $149,999 | 133 (23.3%) | 32 (21.2%) |
| $150,000 or more | 83 (14.5%) | 0 (0.0%) |
| Total | 571 (100.0%) | 151 (100.0%) |
Monthly Housing Cost Tiers in Dayton
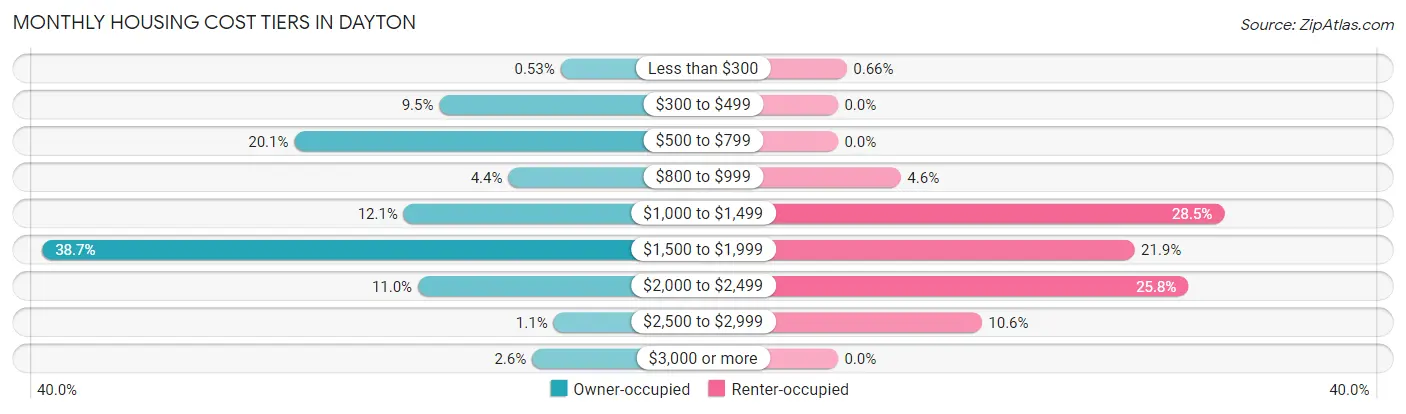
| Monthly Cost | Owner-occupied | Renter-occupied |
| Less than $300 | 3 (0.5%) | 1 (0.7%) |
| $300 to $499 | 54 (9.5%) | 0 (0.0%) |
| $500 to $799 | 115 (20.1%) | 0 (0.0%) |
| $800 to $999 | 25 (4.4%) | 7 (4.6%) |
| $1,000 to $1,499 | 69 (12.1%) | 43 (28.5%) |
| $1,500 to $1,999 | 221 (38.7%) | 33 (21.8%) |
| $2,000 to $2,499 | 63 (11.0%) | 39 (25.8%) |
| $2,500 to $2,999 | 6 (1.1%) | 16 (10.6%) |
| $3,000 or more | 15 (2.6%) | 0 (0.0%) |
| Total | 571 (100.0%) | 151 (100.0%) |
Physical Housing Characteristics in Dayton
Housing Structures in Dayton
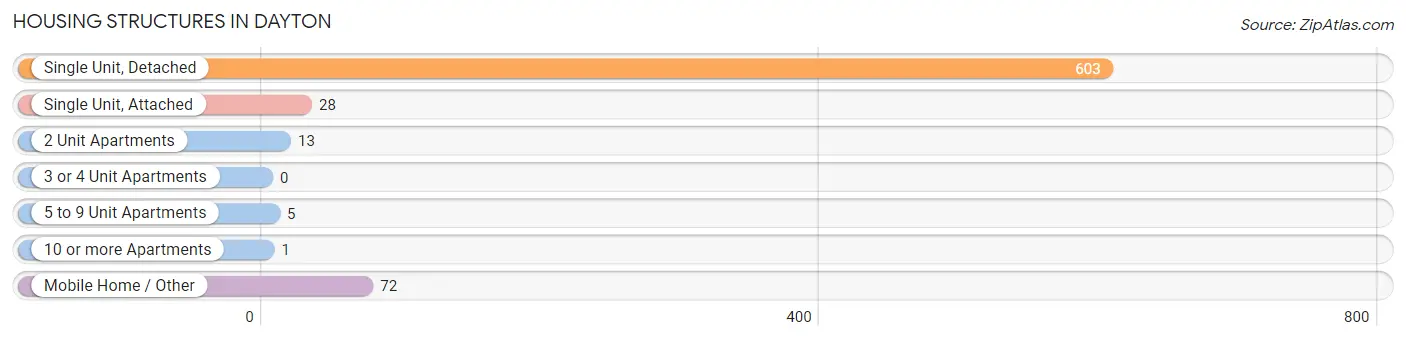
| Structure Type | # Housing Units | % Housing Units |
| Single Unit, Detached | 603 | 83.5% |
| Single Unit, Attached | 28 | 3.9% |
| 2 Unit Apartments | 13 | 1.8% |
| 3 or 4 Unit Apartments | 0 | 0.0% |
| 5 to 9 Unit Apartments | 5 | 0.7% |
| 10 or more Apartments | 1 | 0.1% |
| Mobile Home / Other | 72 | 10.0% |
| Total | 722 | 100.0% |
Housing Structures by Occupancy in Dayton
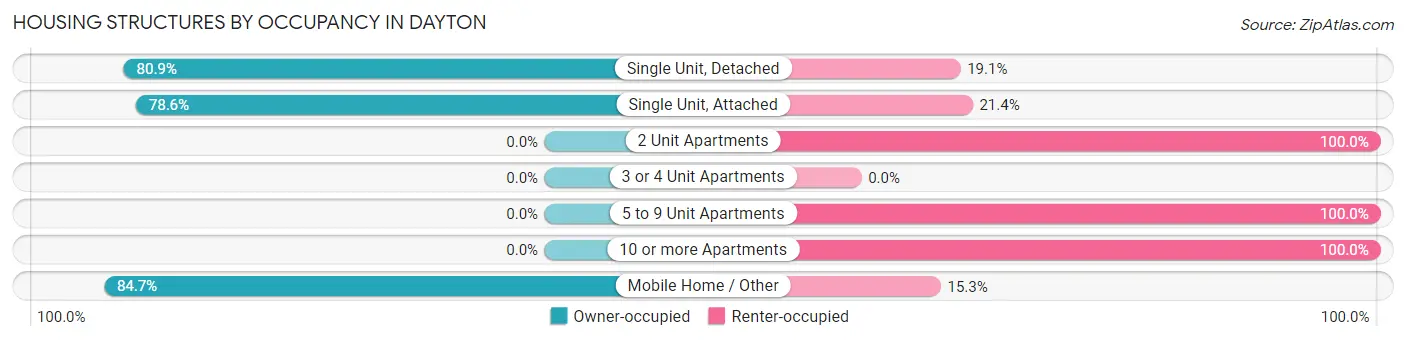
| Structure Type | Owner-occupied | Renter-occupied |
| Single Unit, Detached | 488 (80.9%) | 115 (19.1%) |
| Single Unit, Attached | 22 (78.6%) | 6 (21.4%) |
| 2 Unit Apartments | 0 (0.0%) | 13 (100.0%) |
| 3 or 4 Unit Apartments | 0 (0.0%) | 0 (0.0%) |
| 5 to 9 Unit Apartments | 0 (0.0%) | 5 (100.0%) |
| 10 or more Apartments | 0 (0.0%) | 1 (100.0%) |
| Mobile Home / Other | 61 (84.7%) | 11 (15.3%) |
| Total | 571 (79.1%) | 151 (20.9%) |
Housing Structures by Number of Rooms in Dayton
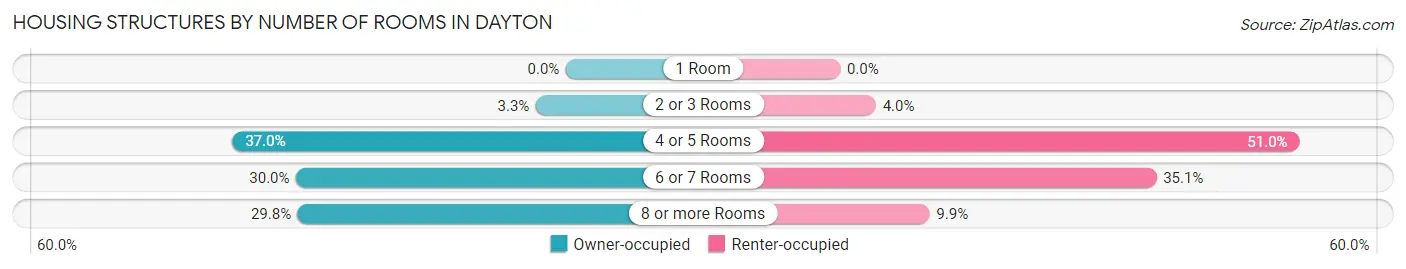
| Number of Rooms | Owner-occupied | Renter-occupied |
| 1 Room | 0 (0.0%) | 0 (0.0%) |
| 2 or 3 Rooms | 19 (3.3%) | 6 (4.0%) |
| 4 or 5 Rooms | 211 (36.9%) | 77 (51.0%) |
| 6 or 7 Rooms | 171 (29.9%) | 53 (35.1%) |
| 8 or more Rooms | 170 (29.8%) | 15 (9.9%) |
| Total | 571 (100.0%) | 151 (100.0%) |
Housing Structure by Heating Type in Dayton
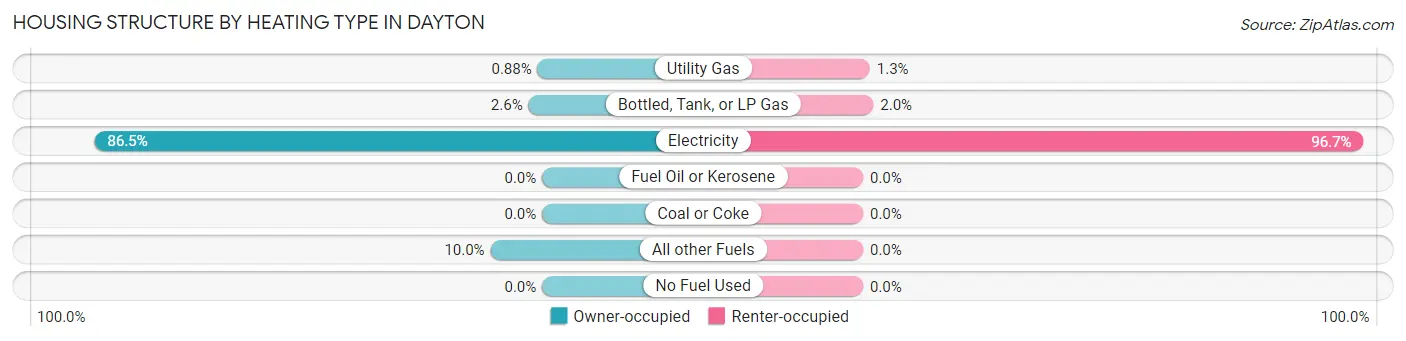
| Heating Type | Owner-occupied | Renter-occupied |
| Utility Gas | 5 (0.9%) | 2 (1.3%) |
| Bottled, Tank, or LP Gas | 15 (2.6%) | 3 (2.0%) |
| Electricity | 494 (86.5%) | 146 (96.7%) |
| Fuel Oil or Kerosene | 0 (0.0%) | 0 (0.0%) |
| Coal or Coke | 0 (0.0%) | 0 (0.0%) |
| All other Fuels | 57 (10.0%) | 0 (0.0%) |
| No Fuel Used | 0 (0.0%) | 0 (0.0%) |
| Total | 571 (100.0%) | 151 (100.0%) |
Household Vehicle Usage in Dayton
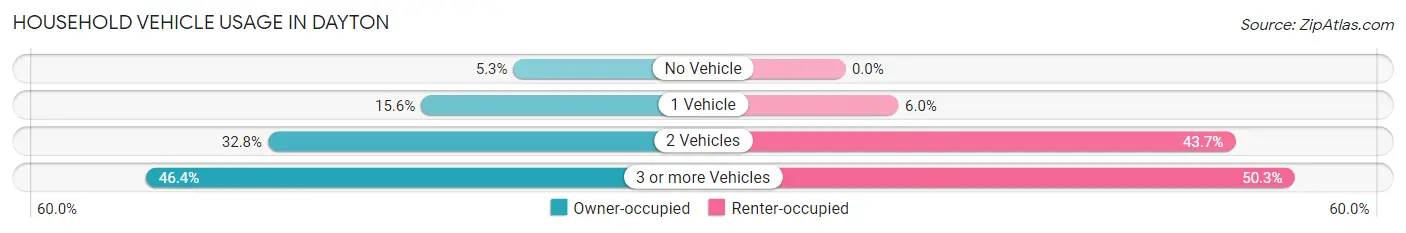
| Vehicles per Household | Owner-occupied | Renter-occupied |
| No Vehicle | 30 (5.2%) | 0 (0.0%) |
| 1 Vehicle | 89 (15.6%) | 9 (6.0%) |
| 2 Vehicles | 187 (32.8%) | 66 (43.7%) |
| 3 or more Vehicles | 265 (46.4%) | 76 (50.3%) |
| Total | 571 (100.0%) | 151 (100.0%) |
Real Estate & Mortgages in Dayton
Real Estate and Mortgage Overview in Dayton
| Characteristic | Without Mortgage | With Mortgage |
| Housing Units | 206 | 365 |
| Median Property Value | $256,800 | $341,000 |
| Median Household Income | $76,048 | $72 |
| Monthly Housing Costs | $636 | $15 |
| Real Estate Taxes | $2,410 | $6 |
Property Value by Mortgage Status in Dayton
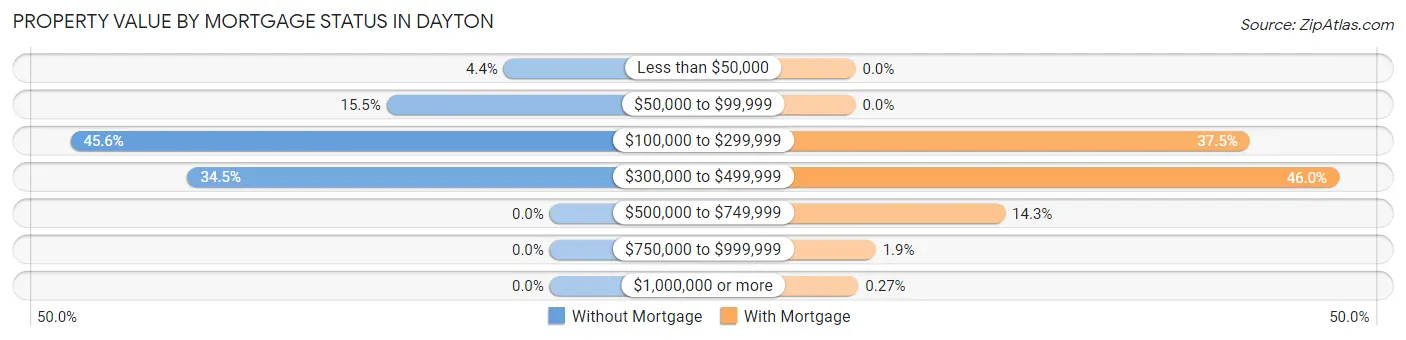
| Property Value | Without Mortgage | With Mortgage |
| Less than $50,000 | 9 (4.4%) | 0 (0.0%) |
| $50,000 to $99,999 | 32 (15.5%) | 0 (0.0%) |
| $100,000 to $299,999 | 94 (45.6%) | 137 (37.5%) |
| $300,000 to $499,999 | 71 (34.5%) | 168 (46.0%) |
| $500,000 to $749,999 | 0 (0.0%) | 52 (14.2%) |
| $750,000 to $999,999 | 0 (0.0%) | 7 (1.9%) |
| $1,000,000 or more | 0 (0.0%) | 1 (0.3%) |
| Total | 206 (100.0%) | 365 (100.0%) |
Household Income by Mortgage Status in Dayton
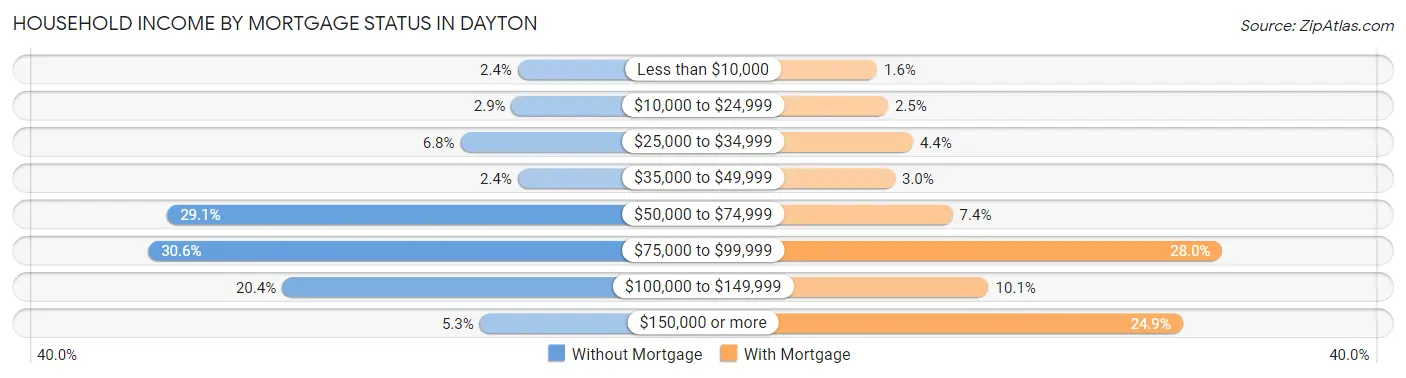
| Household Income | Without Mortgage | With Mortgage |
| Less than $10,000 | 5 (2.4%) | 6 (1.6%) |
| $10,000 to $24,999 | 6 (2.9%) | 9 (2.5%) |
| $25,000 to $34,999 | 14 (6.8%) | 16 (4.4%) |
| $35,000 to $49,999 | 5 (2.4%) | 11 (3.0%) |
| $50,000 to $74,999 | 60 (29.1%) | 27 (7.4%) |
| $75,000 to $99,999 | 63 (30.6%) | 102 (28.0%) |
| $100,000 to $149,999 | 42 (20.4%) | 37 (10.1%) |
| $150,000 or more | 11 (5.3%) | 91 (24.9%) |
| Total | 206 (100.0%) | 365 (100.0%) |
Property Value to Household Income Ratio in Dayton
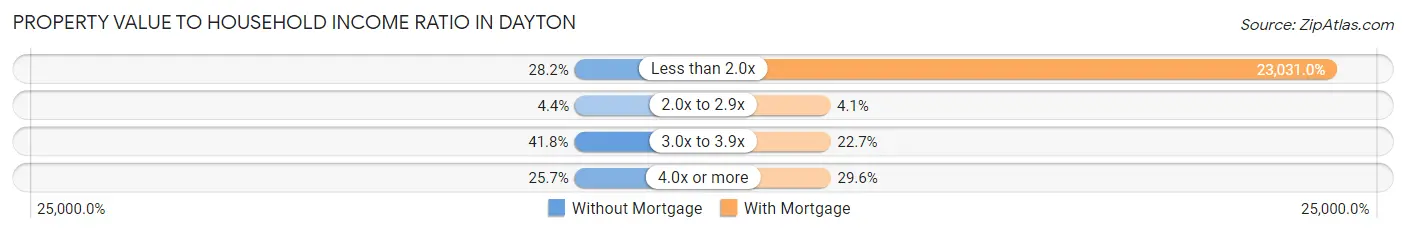
| Value-to-Income Ratio | Without Mortgage | With Mortgage |
| Less than 2.0x | 58 (28.2%) | 84,063 (23,031.0%) |
| 2.0x to 2.9x | 9 (4.4%) | 15 (4.1%) |
| 3.0x to 3.9x | 86 (41.7%) | 83 (22.7%) |
| 4.0x or more | 53 (25.7%) | 108 (29.6%) |
| Total | 206 (100.0%) | 365 (100.0%) |
Real Estate Taxes by Mortgage Status in Dayton
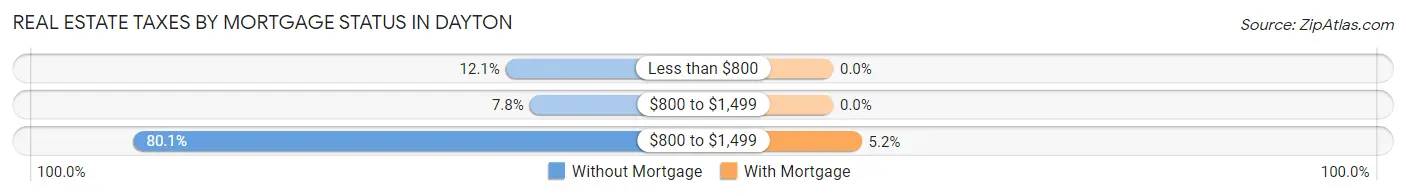
| Property Taxes | Without Mortgage | With Mortgage |
| Less than $800 | 25 (12.1%) | 0 (0.0%) |
| $800 to $1,499 | 16 (7.8%) | 0 (0.0%) |
| $800 to $1,499 | 165 (80.1%) | 19 (5.2%) |
| Total | 206 (100.0%) | 365 (100.0%) |
Health & Disability in Dayton
Health Insurance Coverage by Age in Dayton
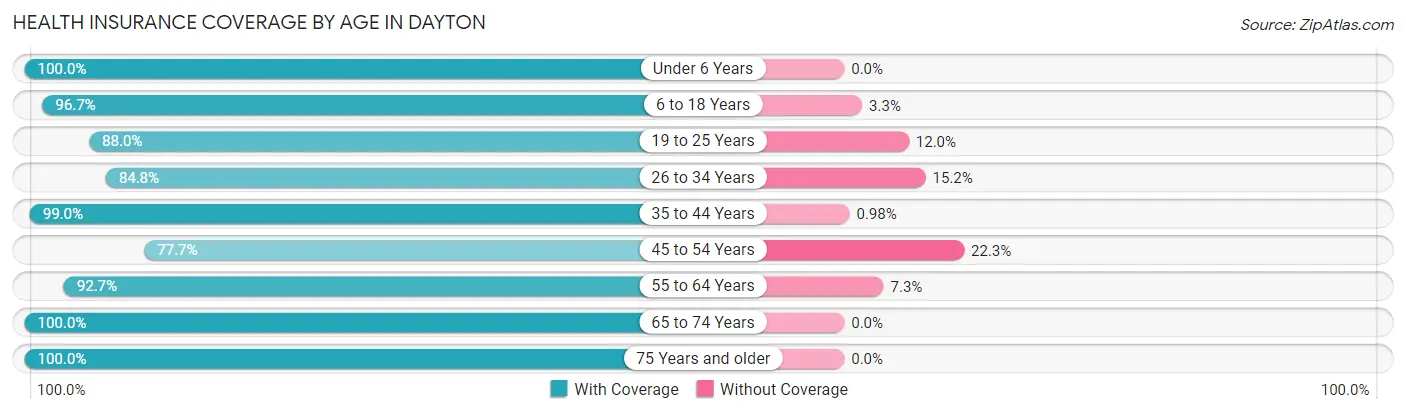
| Age Bracket | With Coverage | Without Coverage |
| Under 6 Years | 240 (100.0%) | 0 (0.0%) |
| 6 to 18 Years | 436 (96.7%) | 15 (3.3%) |
| 19 to 25 Years | 241 (88.0%) | 33 (12.0%) |
| 26 to 34 Years | 263 (84.8%) | 47 (15.2%) |
| 35 to 44 Years | 203 (99.0%) | 2 (1.0%) |
| 45 to 54 Years | 306 (77.7%) | 88 (22.3%) |
| 55 to 64 Years | 278 (92.7%) | 22 (7.3%) |
| 65 to 74 Years | 260 (100.0%) | 0 (0.0%) |
| 75 Years and older | 243 (100.0%) | 0 (0.0%) |
| Total | 2,470 (92.3%) | 207 (7.7%) |
Health Insurance Coverage by Citizenship Status in Dayton
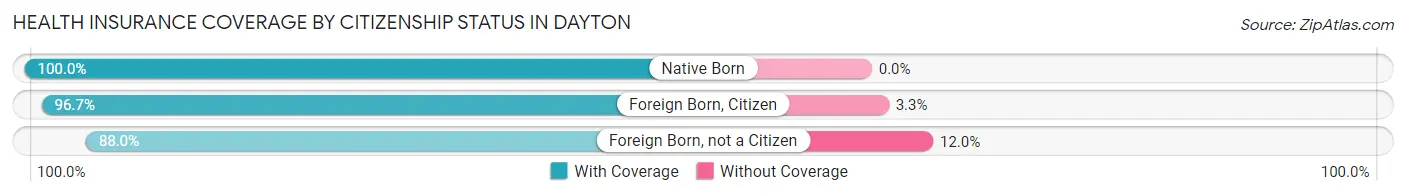
| Citizenship Status | With Coverage | Without Coverage |
| Native Born | 240 (100.0%) | 0 (0.0%) |
| Foreign Born, Citizen | 436 (96.7%) | 15 (3.3%) |
| Foreign Born, not a Citizen | 241 (88.0%) | 33 (12.0%) |
Health Insurance Coverage by Household Income in Dayton
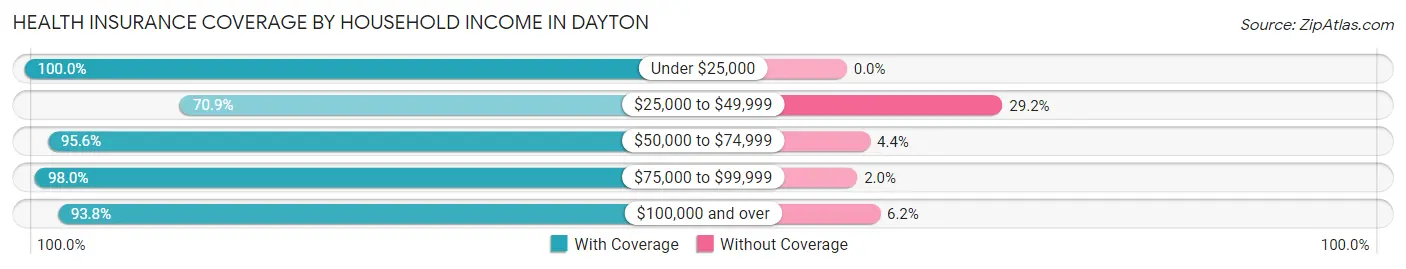
| Household Income | With Coverage | Without Coverage |
| Under $25,000 | 356 (100.0%) | 0 (0.0%) |
| $25,000 to $49,999 | 282 (70.9%) | 116 (29.1%) |
| $50,000 to $74,999 | 658 (95.6%) | 30 (4.4%) |
| $75,000 to $99,999 | 351 (98.0%) | 7 (2.0%) |
| $100,000 and over | 813 (93.8%) | 54 (6.2%) |
Public vs Private Health Insurance Coverage by Age in Dayton
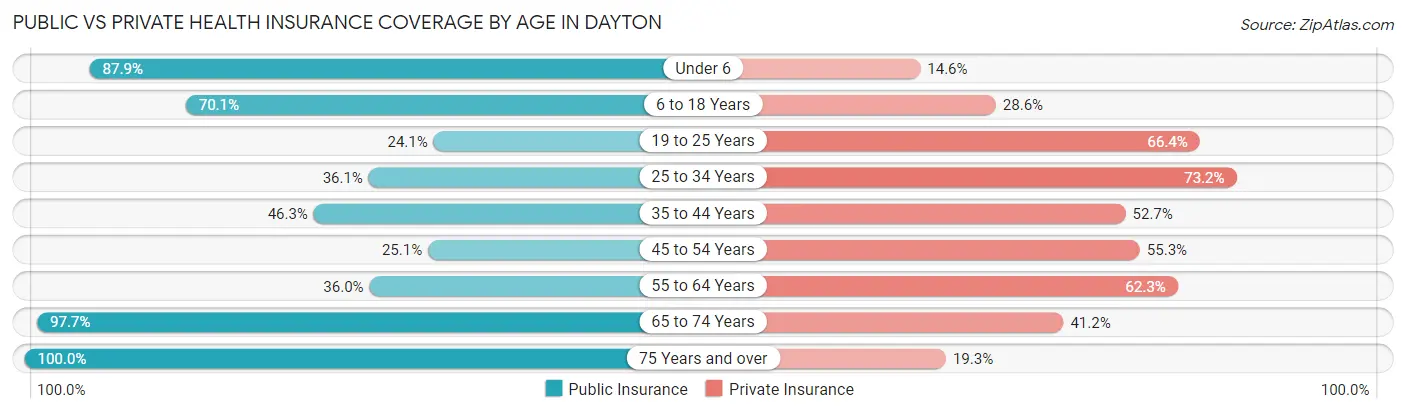
| Age Bracket | Public Insurance | Private Insurance |
| Under 6 | 211 (87.9%) | 35 (14.6%) |
| 6 to 18 Years | 316 (70.1%) | 129 (28.6%) |
| 19 to 25 Years | 66 (24.1%) | 182 (66.4%) |
| 25 to 34 Years | 112 (36.1%) | 227 (73.2%) |
| 35 to 44 Years | 95 (46.3%) | 108 (52.7%) |
| 45 to 54 Years | 99 (25.1%) | 218 (55.3%) |
| 55 to 64 Years | 108 (36.0%) | 187 (62.3%) |
| 65 to 74 Years | 254 (97.7%) | 107 (41.1%) |
| 75 Years and over | 243 (100.0%) | 47 (19.3%) |
| Total | 1,504 (56.2%) | 1,240 (46.3%) |
Disability Status by Sex by Age in Dayton
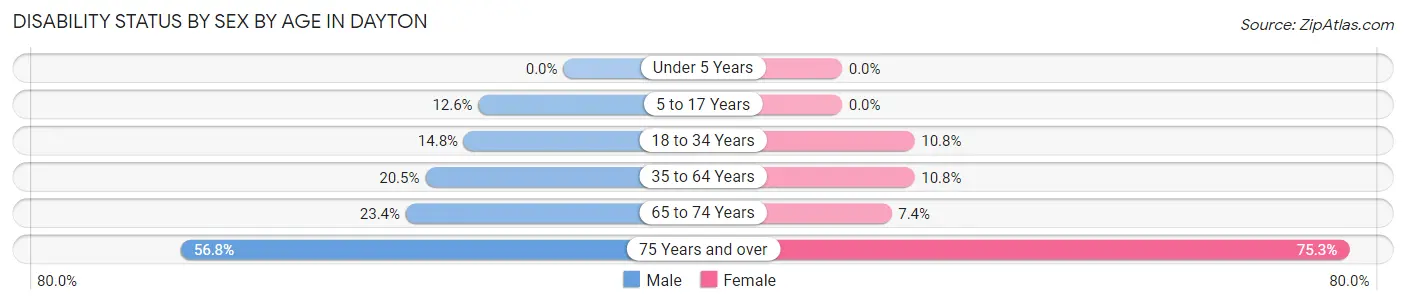
| Age Bracket | Male | Female |
| Under 5 Years | 0 (0.0%) | 0 (0.0%) |
| 5 to 17 Years | 28 (12.6%) | 0 (0.0%) |
| 18 to 34 Years | 52 (14.8%) | 27 (10.8%) |
| 35 to 64 Years | 91 (20.5%) | 49 (10.8%) |
| 65 to 74 Years | 29 (23.4%) | 10 (7.3%) |
| 75 Years and over | 92 (56.8%) | 61 (75.3%) |
Disability Class by Sex by Age in Dayton
Disability Class: Hearing Difficulty
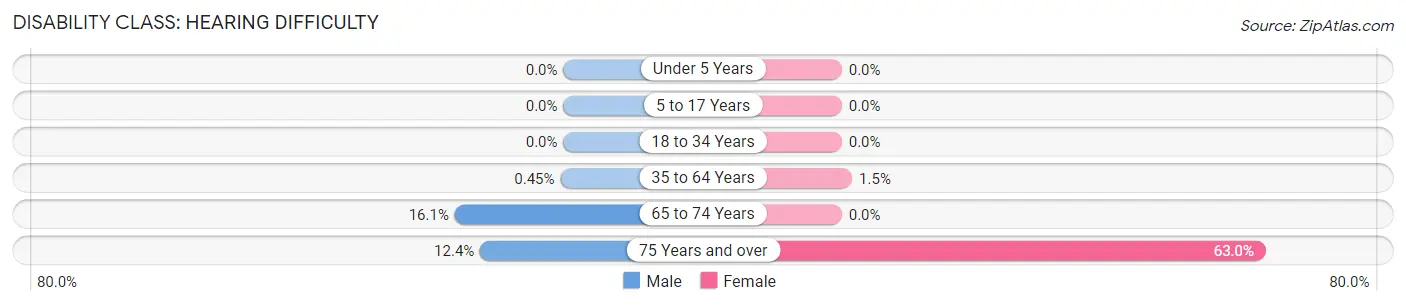
| Age Bracket | Male | Female |
| Under 5 Years | 0 (0.0%) | 0 (0.0%) |
| 5 to 17 Years | 0 (0.0%) | 0 (0.0%) |
| 18 to 34 Years | 0 (0.0%) | 0 (0.0%) |
| 35 to 64 Years | 2 (0.4%) | 7 (1.5%) |
| 65 to 74 Years | 20 (16.1%) | 0 (0.0%) |
| 75 Years and over | 20 (12.3%) | 51 (63.0%) |
Disability Class: Vision Difficulty
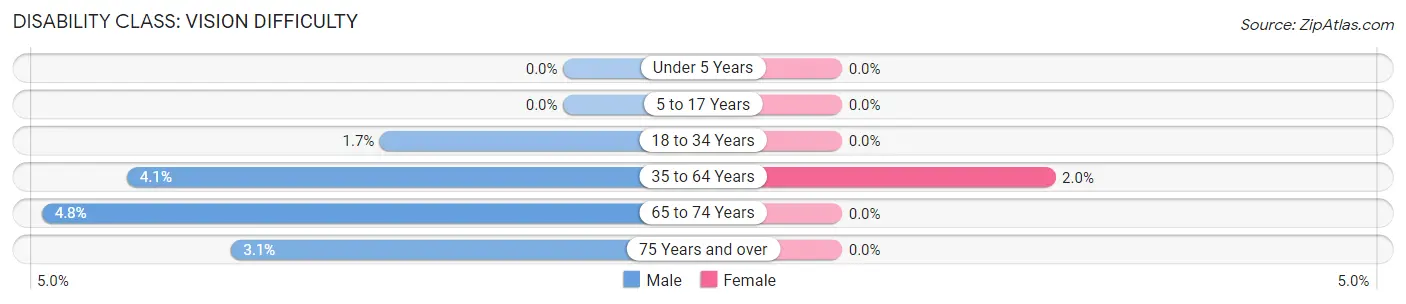
| Age Bracket | Male | Female |
| Under 5 Years | 0 (0.0%) | 0 (0.0%) |
| 5 to 17 Years | 0 (0.0%) | 0 (0.0%) |
| 18 to 34 Years | 6 (1.7%) | 0 (0.0%) |
| 35 to 64 Years | 18 (4.1%) | 9 (2.0%) |
| 65 to 74 Years | 6 (4.8%) | 0 (0.0%) |
| 75 Years and over | 5 (3.1%) | 0 (0.0%) |
Disability Class: Cognitive Difficulty
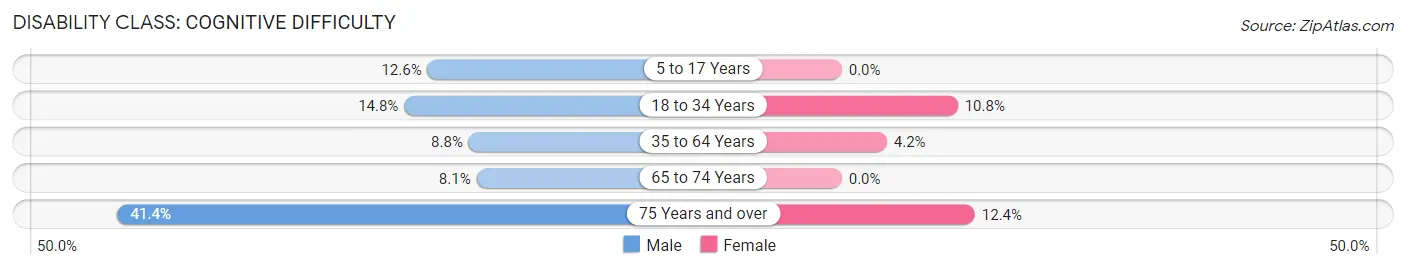
| Age Bracket | Male | Female |
| 5 to 17 Years | 28 (12.6%) | 0 (0.0%) |
| 18 to 34 Years | 52 (14.8%) | 27 (10.8%) |
| 35 to 64 Years | 39 (8.8%) | 19 (4.2%) |
| 65 to 74 Years | 10 (8.1%) | 0 (0.0%) |
| 75 Years and over | 67 (41.4%) | 10 (12.3%) |
Disability Class: Ambulatory Difficulty
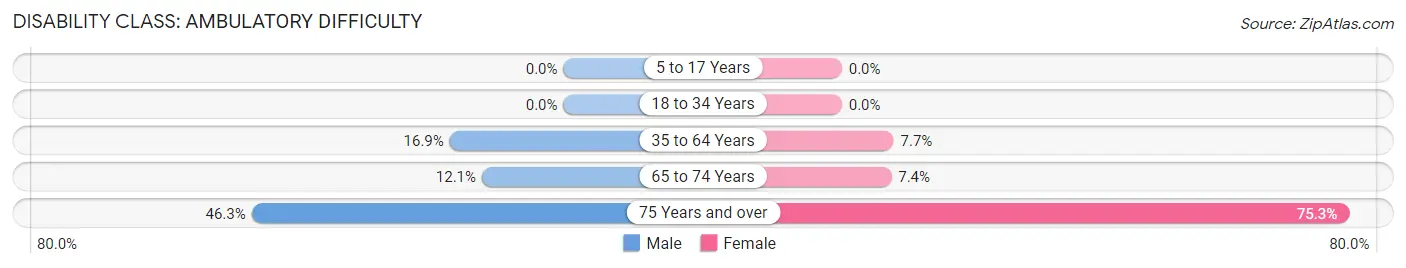
| Age Bracket | Male | Female |
| 5 to 17 Years | 0 (0.0%) | 0 (0.0%) |
| 18 to 34 Years | 0 (0.0%) | 0 (0.0%) |
| 35 to 64 Years | 75 (16.9%) | 35 (7.7%) |
| 65 to 74 Years | 15 (12.1%) | 10 (7.3%) |
| 75 Years and over | 75 (46.3%) | 61 (75.3%) |
Disability Class: Self-Care Difficulty
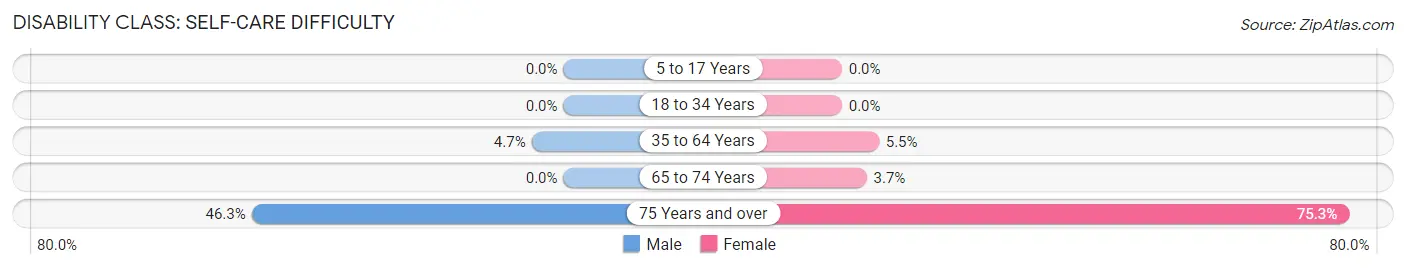
| Age Bracket | Male | Female |
| 5 to 17 Years | 0 (0.0%) | 0 (0.0%) |
| 18 to 34 Years | 0 (0.0%) | 0 (0.0%) |
| 35 to 64 Years | 21 (4.7%) | 25 (5.5%) |
| 65 to 74 Years | 0 (0.0%) | 5 (3.7%) |
| 75 Years and over | 75 (46.3%) | 61 (75.3%) |
Technology Access in Dayton
Computing Device Access in Dayton
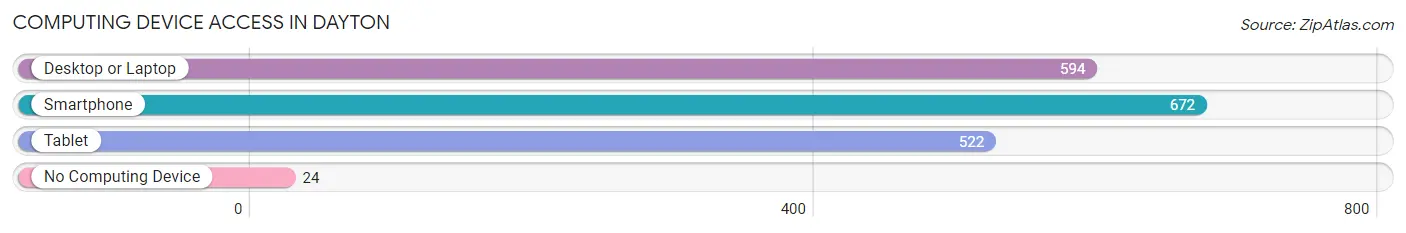
| Device Type | # Households | % Households |
| Desktop or Laptop | 594 | 82.3% |
| Smartphone | 672 | 93.1% |
| Tablet | 522 | 72.3% |
| No Computing Device | 24 | 3.3% |
| Total | 722 | 100.0% |
Internet Access in Dayton
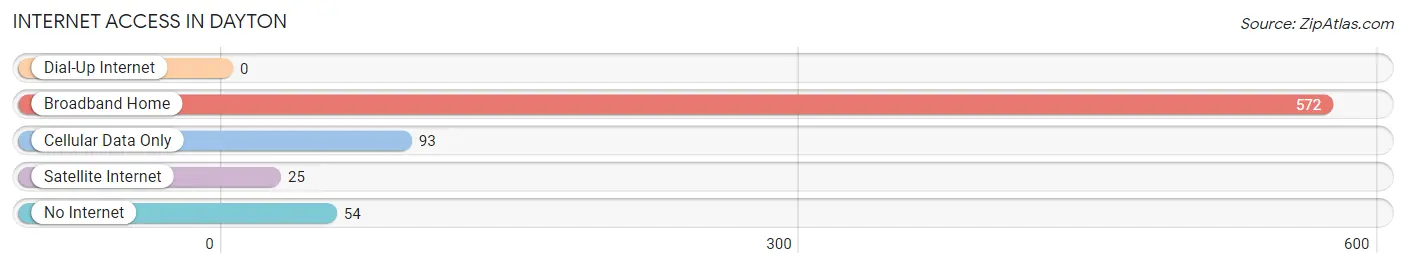
| Internet Type | # Households | % Households |
| Dial-Up Internet | 0 | 0.0% |
| Broadband Home | 572 | 79.2% |
| Cellular Data Only | 93 | 12.9% |
| Satellite Internet | 25 | 3.5% |
| No Internet | 54 | 7.5% |
| Total | 722 | 100.0% |
Dayton Summary
Dayton, Oregon is a small city located in Yamhill County, Oregon, United States. It is situated in the Willamette Valley, approximately 25 miles southwest of Portland. The city has a population of 2,521 as of the 2010 census.
History
Dayton was founded in 1848 by William H. Gray, who named the city after his hometown of Dayton, Ohio. The city was incorporated in 1881 and was the first city in Yamhill County. The city was originally a farming community, but in the late 19th century, it became a center for the timber industry. The city was also home to a number of sawmills and lumber mills.
Geography
Dayton is located in the Willamette Valley, approximately 25 miles southwest of Portland. The city is situated on the banks of the Yamhill River, which flows through the city. The city is surrounded by rolling hills and is located in the foothills of the Coast Range. The city has a total area of 1.3 square miles, all of which is land.
Economy
Dayton’s economy is largely based on agriculture and timber. The city is home to a number of wineries and vineyards, as well as a number of farms and ranches. The city is also home to a number of small businesses, including restaurants, retail stores, and service providers.
Demographics
As of the 2010 census, Dayton had a population of 2,521. The racial makeup of the city was 94.2% White, 0.7% African American, 0.7% Native American, 0.7% Asian, 0.2% Pacific Islander, 1.2% from other races, and 2.1% from two or more races. Hispanic or Latino of any race were 4.2% of the population.
The median income for a household in the city was $41,250, and the median income for a family was $50,000. The per capita income for the city was $20,945. About 11.2% of families and 14.2% of the population were below the poverty line, including 18.2% of those under age 18 and 8.2% of those age 65 or over.
Conclusion
Dayton, Oregon is a small city located in Yamhill County, Oregon, United States. It is situated in the Willamette Valley, approximately 25 miles southwest of Portland. The city has a population of 2,521 as of the 2010 census. The city’s economy is largely based on agriculture and timber, and it is home to a number of wineries and vineyards, as well as a number of small businesses. The median income for a household in the city was $41,250, and the median income for a family was $50,000. About 11.2% of families and 14.2% of the population were below the poverty line.
Common Questions
What is Per Capita Income in Dayton?
Per Capita income in Dayton is $25,262.
What is the Median Family Income in Dayton?
Median Family Income in Dayton is $75,110.
What is the Median Household income in Dayton?
Median Household Income in Dayton is $76,014.
What is Income or Wage Gap in Dayton?
Income or Wage Gap in Dayton is 34.9%.
Women in Dayton earn 65.1 cents for every dollar earned by a man.
What is Inequality or Gini Index in Dayton?
Inequality or Gini Index in Dayton is 0.33.
What is the Total Population of Dayton?
Total Population of Dayton is 2,677.
What is the Total Male Population of Dayton?
Total Male Population of Dayton is 1,376.
What is the Total Female Population of Dayton?
Total Female Population of Dayton is 1,301.
What is the Ratio of Males per 100 Females in Dayton?
There are 105.76 Males per 100 Females in Dayton.
What is the Ratio of Females per 100 Males in Dayton?
There are 94.55 Females per 100 Males in Dayton.
What is the Median Population Age in Dayton?
Median Population Age in Dayton is 37.4 Years.
What is the Average Family Size in Dayton
Average Family Size in Dayton is 3.8 People.
What is the Average Household Size in Dayton
Average Household Size in Dayton is 3.7 People.
How Large is the Labor Force in Dayton?
There are 1,195 People in the Labor Forcein in Dayton.
What is the Percentage of People in the Labor Force in Dayton?
56.6% of People are in the Labor Force in Dayton.
What is the Unemployment Rate in Dayton?
Unemployment Rate in Dayton is 15.7%.