Wooster, OH Map & Demographics
Wooster Map
Wooster Overview
$32,296
PER CAPITA INCOME
$82,139
AVG FAMILY INCOME
$61,608
AVG HOUSEHOLD INCOME
46.8%
WAGE / INCOME GAP [ % ]
53.2¢/ $1
WAGE / INCOME GAP [ $ ]
0.42
INEQUALITY / GINI INDEX
27,021
TOTAL POPULATION
12,566
MALE POPULATION
14,455
FEMALE POPULATION
86.93
MALES / 100 FEMALES
115.03
FEMALES / 100 MALES
38.7
MEDIAN AGE
2.8
AVG FAMILY SIZE
2.2
AVG HOUSEHOLD SIZE
14,219
LABOR FORCE [ PEOPLE ]
62.3%
PERCENT IN LABOR FORCE
4.6%
UNEMPLOYMENT RATE
Wooster Zip Codes
Income in Wooster
Income Overview in Wooster
Per Capita Income in Wooster is $32,296, while median incomes of families and households are $82,139 and $61,608 respectively.
| Characteristic | Number | Measure |
| Per Capita Income | 27,021 | $32,296 |
| Median Family Income | 6,163 | $82,139 |
| Mean Family Income | 6,163 | $99,094 |
| Median Household Income | 10,969 | $61,608 |
| Mean Household Income | 10,969 | $77,960 |
| Income Deficit | 6,163 | $0 |
| Wage / Income Gap (%) | 27,021 | 46.78% |
| Wage / Income Gap ($) | 27,021 | 53.22¢ per $1 |
| Gini / Inequality Index | 27,021 | 0.42 |
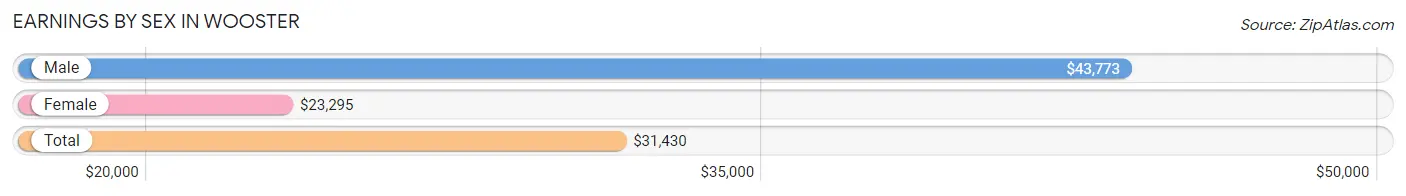
Earnings by Sex in Wooster
Average Earnings in Wooster are $31,430, $43,773 for men and $23,295 for women, a difference of 46.8%.
| Sex | Number | Average Earnings |
| Male | 7,645 (49.5%) | $43,773 |
| Female | 7,791 (50.5%) | $23,295 |
| Total | 15,436 (100.0%) | $31,430 |
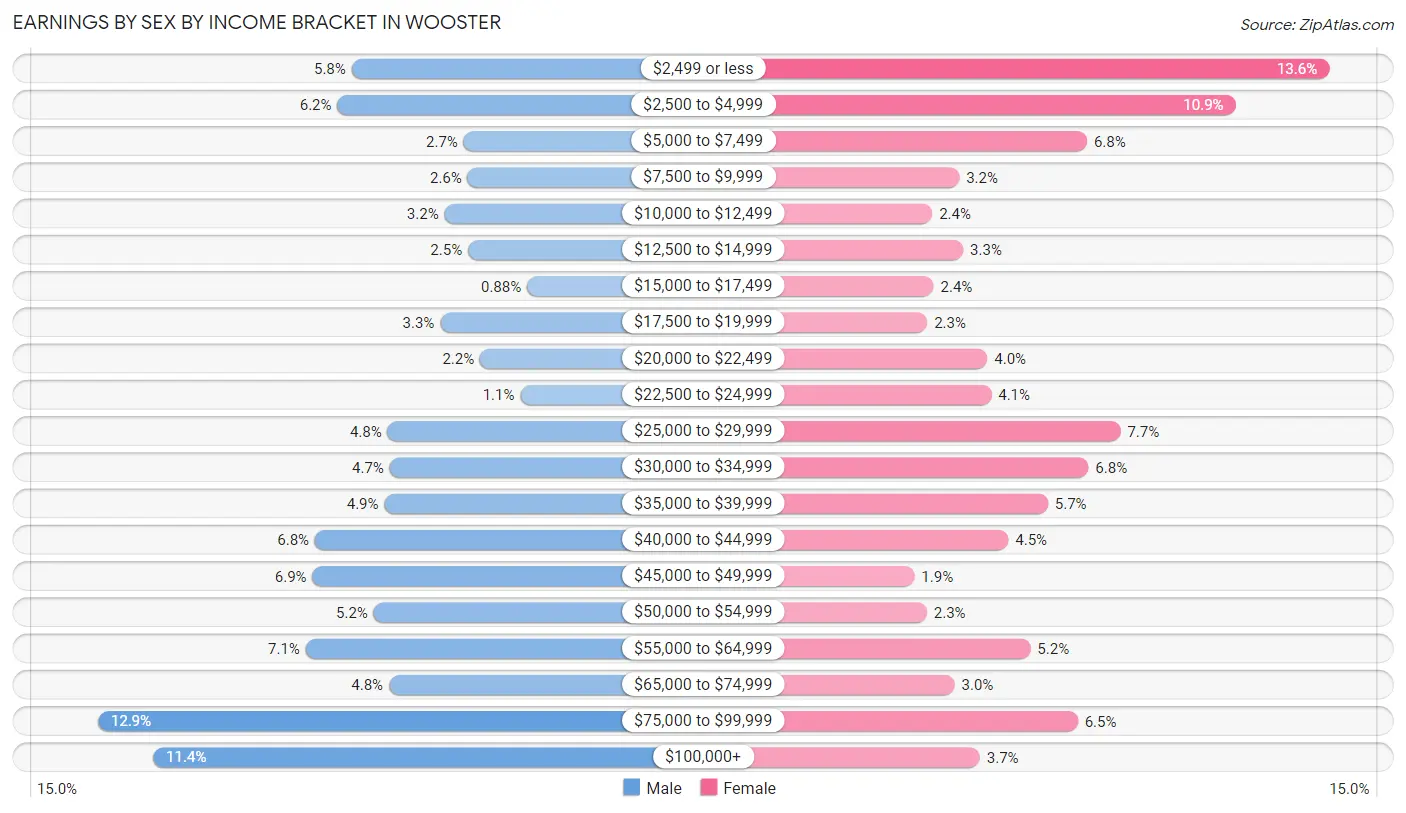
Earnings by Sex by Income Bracket in Wooster
The most common earnings brackets in Wooster are $75,000 to $99,999 for men (989 | 12.9%) and $2,499 or less for women (1,056 | 13.6%).
| Income | Male | Female |
| $2,499 or less | 444 (5.8%) | 1,056 (13.6%) |
| $2,500 to $4,999 | 475 (6.2%) | 851 (10.9%) |
| $5,000 to $7,499 | 203 (2.7%) | 526 (6.8%) |
| $7,500 to $9,999 | 195 (2.5%) | 246 (3.2%) |
| $10,000 to $12,499 | 245 (3.2%) | 187 (2.4%) |
| $12,500 to $14,999 | 194 (2.5%) | 255 (3.3%) |
| $15,000 to $17,499 | 67 (0.9%) | 190 (2.4%) |
| $17,500 to $19,999 | 254 (3.3%) | 176 (2.3%) |
| $20,000 to $22,499 | 168 (2.2%) | 308 (4.0%) |
| $22,500 to $24,999 | 82 (1.1%) | 316 (4.1%) |
| $25,000 to $29,999 | 367 (4.8%) | 599 (7.7%) |
| $30,000 to $34,999 | 362 (4.7%) | 529 (6.8%) |
| $35,000 to $39,999 | 374 (4.9%) | 440 (5.7%) |
| $40,000 to $44,999 | 523 (6.8%) | 354 (4.5%) |
| $45,000 to $49,999 | 528 (6.9%) | 148 (1.9%) |
| $50,000 to $54,999 | 397 (5.2%) | 175 (2.2%) |
| $55,000 to $64,999 | 543 (7.1%) | 402 (5.2%) |
| $65,000 to $74,999 | 364 (4.8%) | 236 (3.0%) |
| $75,000 to $99,999 | 989 (12.9%) | 506 (6.5%) |
| $100,000+ | 871 (11.4%) | 291 (3.7%) |
| Total | 7,645 (100.0%) | 7,791 (100.0%) |
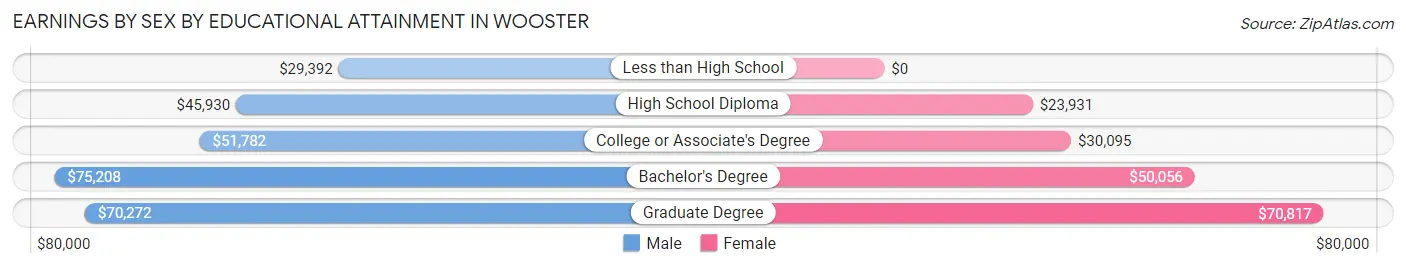
Earnings by Sex by Educational Attainment in Wooster
Average earnings in Wooster are $51,414 for men and $31,291 for women, a difference of 39.1%. Men with an educational attainment of bachelor's degree enjoy the highest average annual earnings of $75,208, while those with less than high school education earn the least with $29,392. Women with an educational attainment of graduate degree earn the most with the average annual earnings of $70,817, while those with high school diploma education have the smallest earnings of $23,931.
| Educational Attainment | Male Income | Female Income |
| Less than High School | $29,392 | $0 |
| High School Diploma | $45,930 | $23,931 |
| College or Associate's Degree | $51,782 | $30,095 |
| Bachelor's Degree | $75,208 | $50,056 |
| Graduate Degree | $70,272 | $70,817 |
| Total | $51,414 | $31,291 |
Family Income in Wooster
Family Income Brackets in Wooster
According to the Wooster family income data, there are 1,467 families falling into the $100,000 to $149,999 income range, which is the most common income bracket and makes up 23.8% of all families. Conversely, the $10,000 to $14,999 income bracket is the least frequent group with only 55 families (0.9%) belonging to this category.
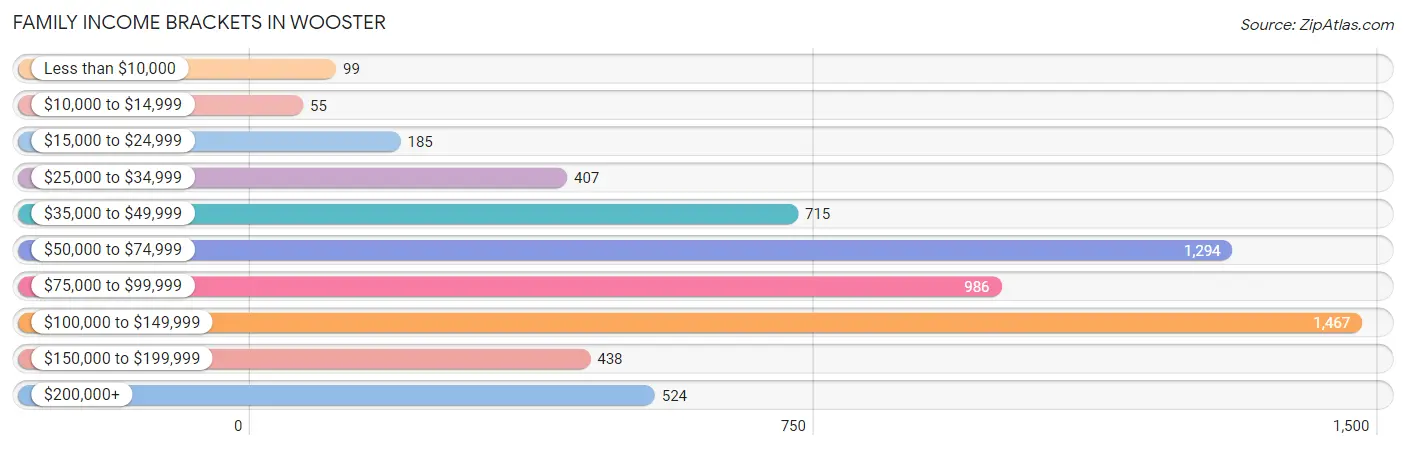
| Income Bracket | # Families | % Families |
| Less than $10,000 | 99 | 1.6% |
| $10,000 to $14,999 | 55 | 0.9% |
| $15,000 to $24,999 | 185 | 3.0% |
| $25,000 to $34,999 | 407 | 6.6% |
| $35,000 to $49,999 | 715 | 11.6% |
| $50,000 to $74,999 | 1,294 | 21.0% |
| $75,000 to $99,999 | 986 | 16.0% |
| $100,000 to $149,999 | 1,467 | 23.8% |
| $150,000 to $199,999 | 438 | 7.1% |
| $200,000+ | 524 | 8.5% |
Family Income by Famaliy Size in Wooster
4-person families (812 | 13.2%) account for the highest median family income in Wooster with $95,610 per family, while 2-person families (3,360 | 54.5%) have the highest median income of $40,514 per family member.
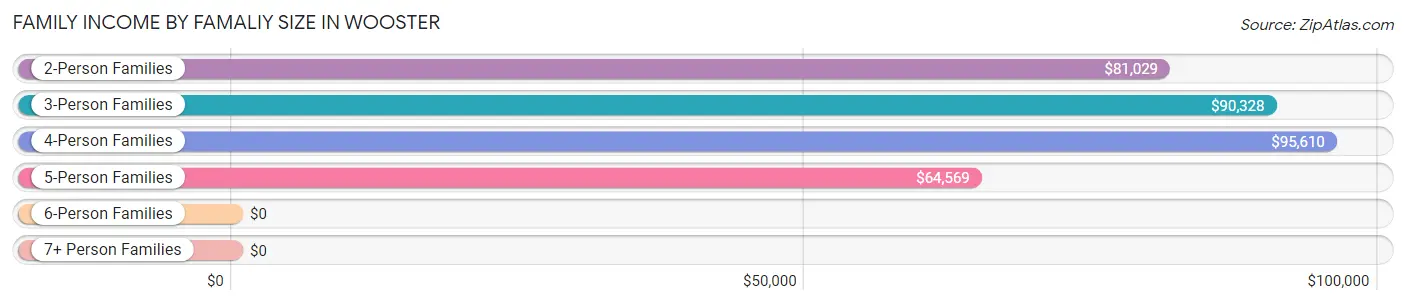
| Income Bracket | # Families | Median Income |
| 2-Person Families | 3,360 (54.5%) | $81,029 |
| 3-Person Families | 1,336 (21.7%) | $90,328 |
| 4-Person Families | 812 (13.2%) | $95,610 |
| 5-Person Families | 449 (7.3%) | $64,569 |
| 6-Person Families | 170 (2.8%) | $0 |
| 7+ Person Families | 36 (0.6%) | $0 |
| Total | 6,163 (100.0%) | $82,139 |
Family Income by Number of Earners in Wooster
The median family income in Wooster is $82,139, with families comprising 3+ earners (590) having the highest median family income of $129,130, while families with no earners (945) have the lowest median family income of $56,028, accounting for 9.6% and 15.3% of families, respectively.
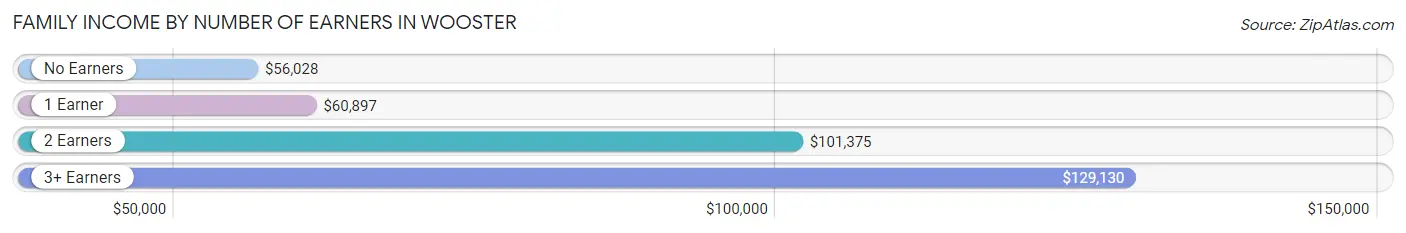
| Number of Earners | # Families | Median Income |
| No Earners | 945 (15.3%) | $56,028 |
| 1 Earner | 2,100 (34.1%) | $60,897 |
| 2 Earners | 2,528 (41.0%) | $101,375 |
| 3+ Earners | 590 (9.6%) | $129,130 |
| Total | 6,163 (100.0%) | $82,139 |
Household Income in Wooster
Household Income Brackets in Wooster
With 1,952 households falling in the category, the $50,000 to $74,999 income range is the most frequent in Wooster, accounting for 17.8% of all households. In contrast, only 450 households (4.1%) fall into the less than $10,000 income bracket, making it the least populous group.
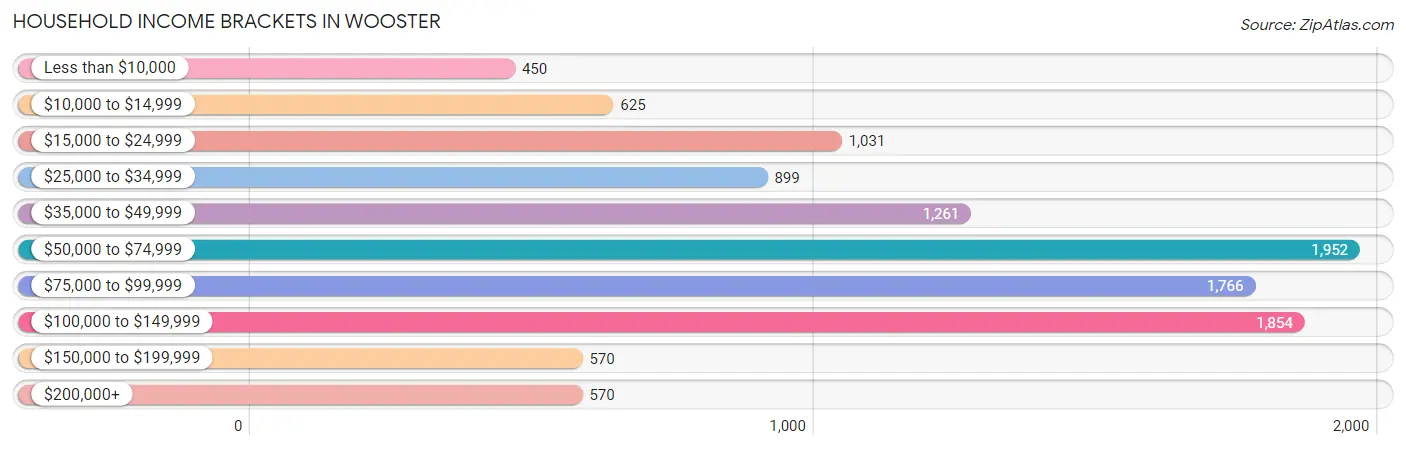
| Income Bracket | # Households | % Households |
| Less than $10,000 | 450 | 4.1% |
| $10,000 to $14,999 | 625 | 5.7% |
| $15,000 to $24,999 | 1,031 | 9.4% |
| $25,000 to $34,999 | 899 | 8.2% |
| $35,000 to $49,999 | 1,261 | 11.5% |
| $50,000 to $74,999 | 1,952 | 17.8% |
| $75,000 to $99,999 | 1,766 | 16.1% |
| $100,000 to $149,999 | 1,854 | 16.9% |
| $150,000 to $199,999 | 570 | 5.2% |
| $200,000+ | 570 | 5.2% |
Household Income by Householder Age in Wooster
The median household income in Wooster is $61,608, with the highest median household income of $79,360 found in the 45 to 64 years age bracket for the primary householder. A total of 3,767 households (34.3%) fall into this category. Meanwhile, the 15 to 24 years age bracket for the primary householder has the lowest median household income of $45,375, with 471 households (4.3%) in this group.
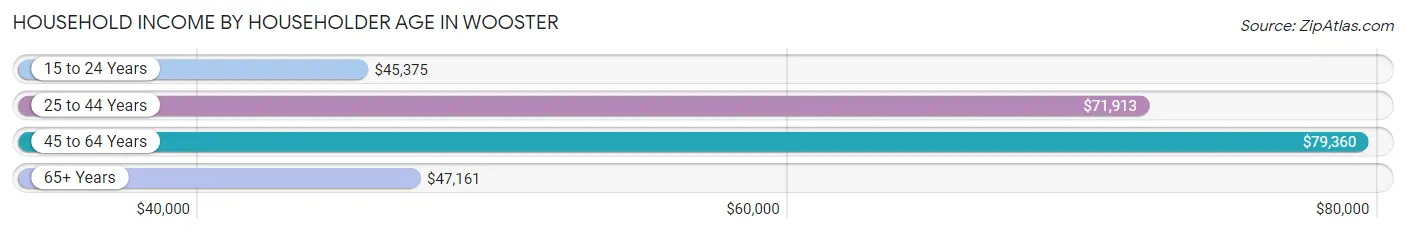
| Income Bracket | # Households | Median Income |
| 15 to 24 Years | 471 (4.3%) | $45,375 |
| 25 to 44 Years | 3,232 (29.5%) | $71,913 |
| 45 to 64 Years | 3,767 (34.3%) | $79,360 |
| 65+ Years | 3,499 (31.9%) | $47,161 |
| Total | 10,969 (100.0%) | $61,608 |
Poverty in Wooster
Income Below Poverty by Sex and Age in Wooster
With 9.3% poverty level for males and 12.1% for females among the residents of Wooster, 12 to 14 year old males and 5 year old females are the most vulnerable to poverty, with 60 males (16.8%) and 16 females (50.0%) in their respective age groups living below the poverty level.
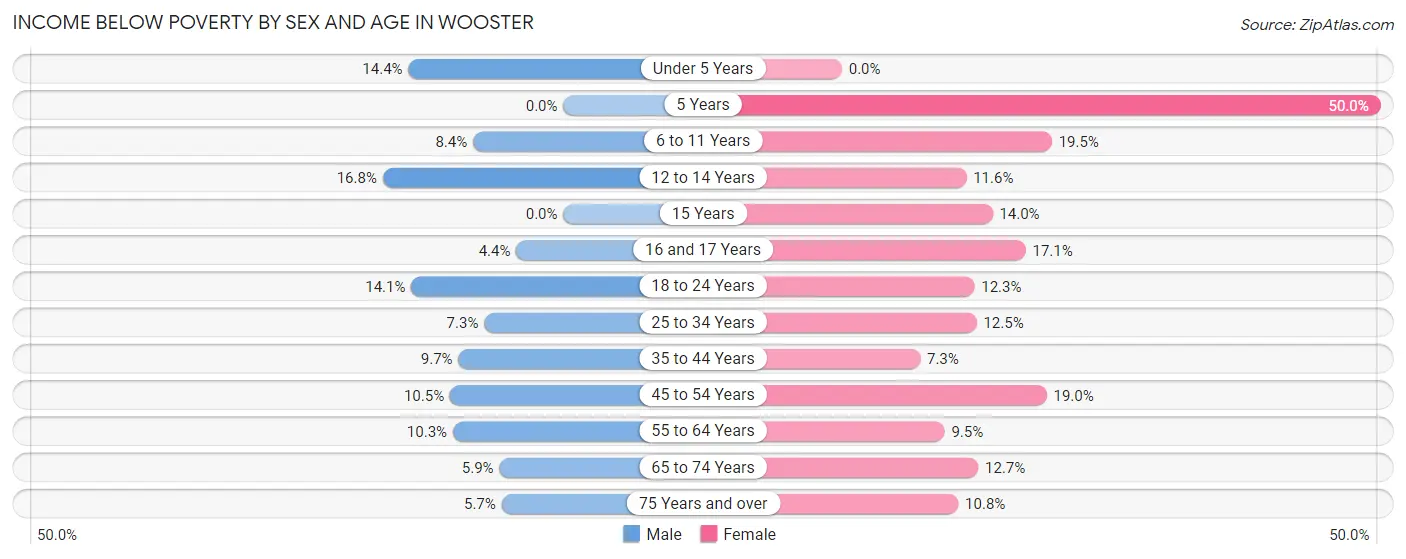
| Age Bracket | Male | Female |
| Under 5 Years | 87 (14.4%) | 0 (0.0%) |
| 5 Years | 0 (0.0%) | 16 (50.0%) |
| 6 to 11 Years | 55 (8.4%) | 141 (19.5%) |
| 12 to 14 Years | 60 (16.8%) | 55 (11.6%) |
| 15 Years | 0 (0.0%) | 46 (14.0%) |
| 16 and 17 Years | 15 (4.4%) | 37 (17.1%) |
| 18 to 24 Years | 138 (14.1%) | 76 (12.3%) |
| 25 to 34 Years | 115 (7.3%) | 191 (12.5%) |
| 35 to 44 Years | 136 (9.7%) | 105 (7.3%) |
| 45 to 54 Years | 155 (10.5%) | 326 (19.0%) |
| 55 to 64 Years | 180 (10.2%) | 151 (9.5%) |
| 65 to 74 Years | 65 (5.9%) | 219 (12.7%) |
| 75 Years and over | 50 (5.7%) | 135 (10.8%) |
| Total | 1,056 (9.3%) | 1,498 (12.1%) |
Income Above Poverty by Sex and Age in Wooster
According to the poverty statistics in Wooster, males aged 5 years and females aged under 5 years are the age groups that are most secure financially, with 100.0% of males and 100.0% of females in these age groups living above the poverty line.
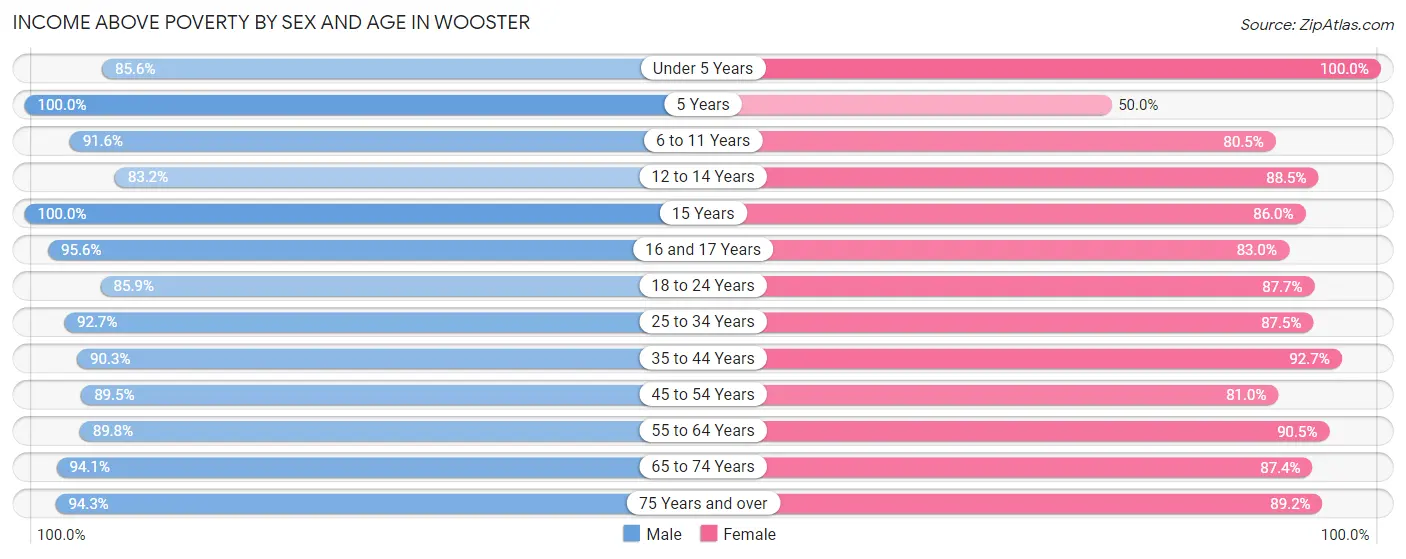
| Age Bracket | Male | Female |
| Under 5 Years | 518 (85.6%) | 692 (100.0%) |
| 5 Years | 138 (100.0%) | 16 (50.0%) |
| 6 to 11 Years | 601 (91.6%) | 583 (80.5%) |
| 12 to 14 Years | 298 (83.2%) | 421 (88.4%) |
| 15 Years | 101 (100.0%) | 283 (86.0%) |
| 16 and 17 Years | 328 (95.6%) | 180 (83.0%) |
| 18 to 24 Years | 840 (85.9%) | 542 (87.7%) |
| 25 to 34 Years | 1,451 (92.7%) | 1,337 (87.5%) |
| 35 to 44 Years | 1,260 (90.3%) | 1,341 (92.7%) |
| 45 to 54 Years | 1,319 (89.5%) | 1,390 (81.0%) |
| 55 to 64 Years | 1,576 (89.7%) | 1,434 (90.5%) |
| 65 to 74 Years | 1,032 (94.1%) | 1,512 (87.4%) |
| 75 Years and over | 822 (94.3%) | 1,115 (89.2%) |
| Total | 10,284 (90.7%) | 10,846 (87.9%) |
Income Below Poverty Among Married-Couple Families in Wooster
The poverty statistics for married-couple families in Wooster show that 1.3% or 59 of the total 4,699 families live below the poverty line. Families with no children have the highest poverty rate of 1.5%, comprising of 43 families. On the other hand, families with 3 or 4 children have the lowest poverty rate of 0.0%, which includes 0 families.
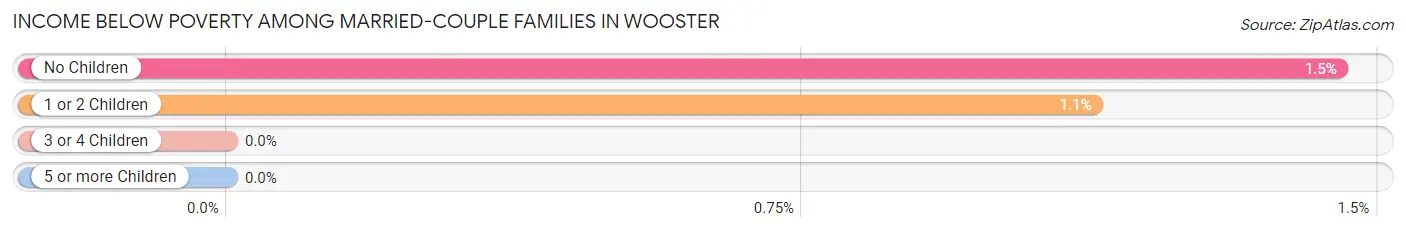
| Children | Above Poverty | Below Poverty |
| No Children | 2,914 (98.6%) | 43 (1.5%) |
| 1 or 2 Children | 1,398 (98.9%) | 16 (1.1%) |
| 3 or 4 Children | 292 (100.0%) | 0 (0.0%) |
| 5 or more Children | 36 (100.0%) | 0 (0.0%) |
| Total | 4,640 (98.7%) | 59 (1.3%) |
Income Below Poverty Among Single-Parent Households in Wooster
According to the poverty data in Wooster, 8.9% or 45 single-father households and 23.7% or 227 single-mother households are living below the poverty line. Among single-father households, those with 3 or 4 children have the highest poverty rate, with 30 households (29.4%) experiencing poverty. Likewise, among single-mother households, those with 1 or 2 children have the highest poverty rate, with 211 households (34.4%) falling below the poverty line.
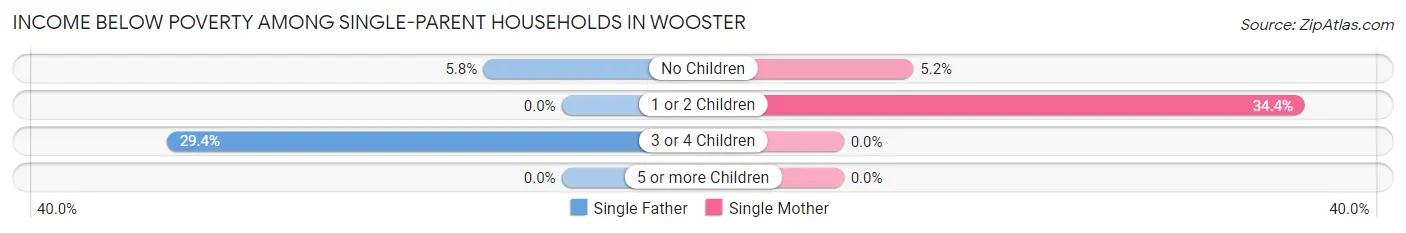
| Children | Single Father | Single Mother |
| No Children | 15 (5.8%) | 16 (5.2%) |
| 1 or 2 Children | 0 (0.0%) | 211 (34.4%) |
| 3 or 4 Children | 30 (29.4%) | 0 (0.0%) |
| 5 or more Children | 0 (0.0%) | 0 (0.0%) |
| Total | 45 (8.9%) | 227 (23.7%) |
Income Below Poverty Among Married-Couple vs Single-Parent Households in Wooster
The poverty data for Wooster shows that 59 of the married-couple family households (1.3%) and 272 of the single-parent households (18.6%) are living below the poverty level. Within the married-couple family households, those with no children have the highest poverty rate, with 43 households (1.5%) falling below the poverty line. Among the single-parent households, those with 1 or 2 children have the highest poverty rate, with 211 household (27.7%) living below poverty.
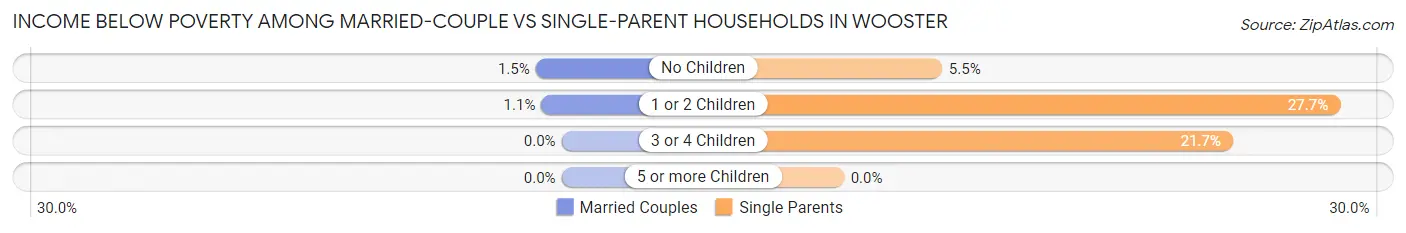
| Children | Married-Couple Families | Single-Parent Households |
| No Children | 43 (1.5%) | 31 (5.5%) |
| 1 or 2 Children | 16 (1.1%) | 211 (27.7%) |
| 3 or 4 Children | 0 (0.0%) | 30 (21.7%) |
| 5 or more Children | 0 (0.0%) | 0 (0.0%) |
| Total | 59 (1.3%) | 272 (18.6%) |
Race in Wooster
The most populous races in Wooster are White / Caucasian (24,032 | 88.9%), Two or more Races (1,374 | 5.1%), and Black / African American (841 | 3.1%).
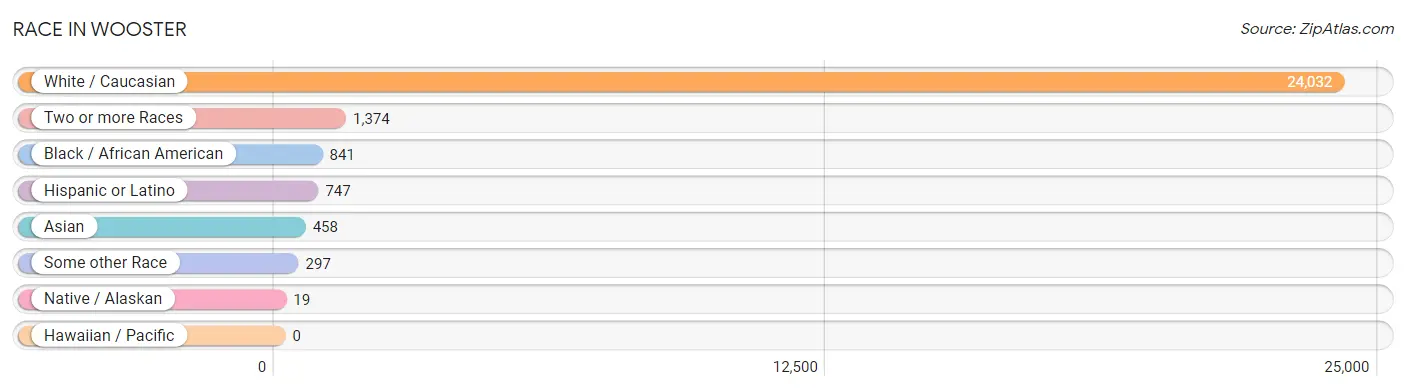
| Race | # Population | % Population |
| Asian | 458 | 1.7% |
| Black / African American | 841 | 3.1% |
| Hawaiian / Pacific | 0 | 0.0% |
| Hispanic or Latino | 747 | 2.8% |
| Native / Alaskan | 19 | 0.1% |
| White / Caucasian | 24,032 | 88.9% |
| Two or more Races | 1,374 | 5.1% |
| Some other Race | 297 | 1.1% |
| Total | 27,021 | 100.0% |
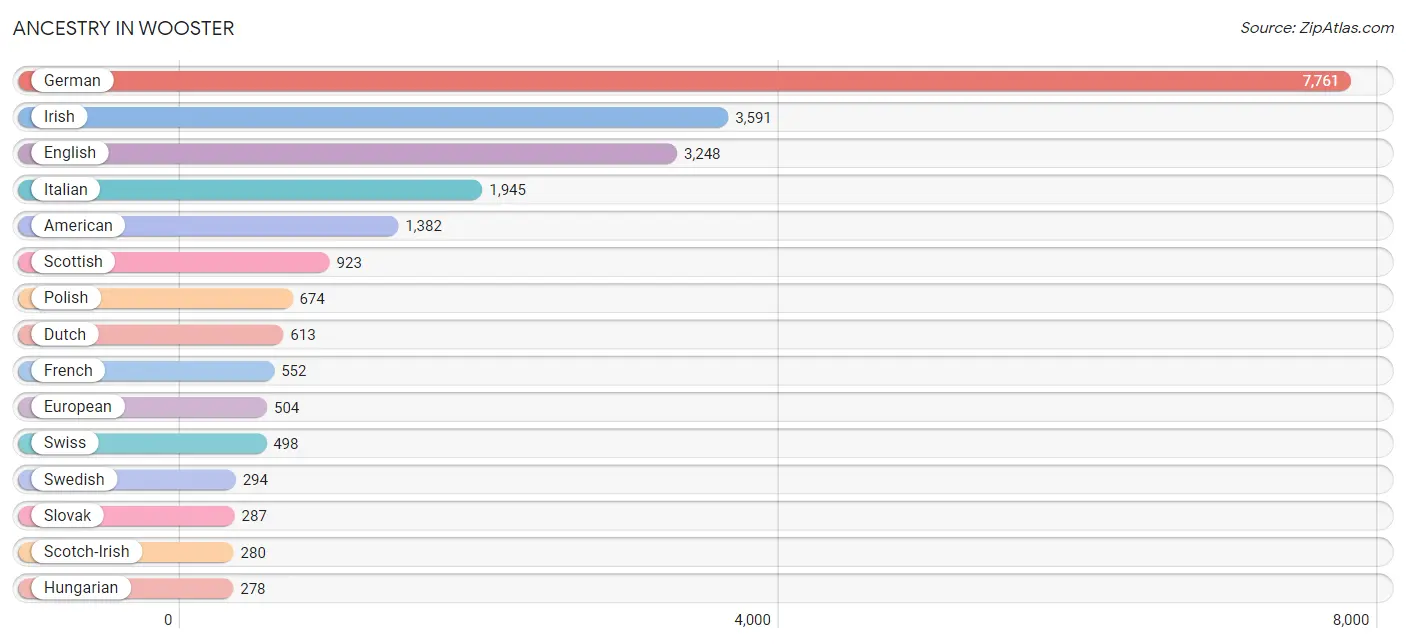
Ancestry in Wooster
The most populous ancestries reported in Wooster are German (7,761 | 28.7%), Irish (3,591 | 13.3%), English (3,248 | 12.0%), Italian (1,945 | 7.2%), and American (1,382 | 5.1%), together accounting for 66.3% of all Wooster residents.
| Ancestry | # Population | % Population |
| African | 41 | 0.2% |
| American | 1,382 | 5.1% |
| Arab | 91 | 0.3% |
| Australian | 80 | 0.3% |
| Austrian | 108 | 0.4% |
| Belgian | 31 | 0.1% |
| Bhutanese | 15 | 0.1% |
| Blackfeet | 13 | 0.1% |
| Brazilian | 96 | 0.4% |
| British | 175 | 0.6% |
| Burmese | 32 | 0.1% |
| Cambodian | 10 | 0.0% |
| Canadian | 18 | 0.1% |
| Cape Verdean | 5 | 0.0% |
| Central American | 94 | 0.4% |
| Cherokee | 68 | 0.3% |
| Chickasaw | 4 | 0.0% |
| Colombian | 147 | 0.5% |
| Cree | 5 | 0.0% |
| Croatian | 35 | 0.1% |
| Czech | 165 | 0.6% |
| Czechoslovakian | 7 | 0.0% |
| Danish | 95 | 0.4% |
| Dutch | 613 | 2.3% |
| Eastern European | 96 | 0.4% |
| English | 3,248 | 12.0% |
| Ethiopian | 76 | 0.3% |
| European | 504 | 1.9% |
| Finnish | 11 | 0.0% |
| French | 552 | 2.0% |
| French Canadian | 98 | 0.4% |
| German | 7,761 | 28.7% |
| Ghanaian | 25 | 0.1% |
| Greek | 92 | 0.3% |
| Guamanian / Chamorro | 10 | 0.0% |
| Guatemalan | 52 | 0.2% |
| Hungarian | 278 | 1.0% |
| Indian (Asian) | 70 | 0.3% |
| Iranian | 20 | 0.1% |
| Irish | 3,591 | 13.3% |
| Italian | 1,945 | 7.2% |
| Jamaican | 9 | 0.0% |
| Japanese | 85 | 0.3% |
| Kenyan | 13 | 0.1% |
| Korean | 200 | 0.7% |
| Laotian | 24 | 0.1% |
| Lebanese | 12 | 0.0% |
| Lithuanian | 55 | 0.2% |
| Mexican | 215 | 0.8% |
| Moroccan | 70 | 0.3% |
| Navajo | 7 | 0.0% |
| Nigerian | 28 | 0.1% |
| Northern European | 71 | 0.3% |
| Norwegian | 63 | 0.2% |
| Panamanian | 42 | 0.2% |
| Pennsylvania German | 63 | 0.2% |
| Polish | 674 | 2.5% |
| Portuguese | 9 | 0.0% |
| Puerto Rican | 245 | 0.9% |
| Romanian | 63 | 0.2% |
| Russian | 34 | 0.1% |
| Scandinavian | 94 | 0.4% |
| Scotch-Irish | 280 | 1.0% |
| Scottish | 923 | 3.4% |
| Serbian | 78 | 0.3% |
| Slovak | 287 | 1.1% |
| Slovene | 72 | 0.3% |
| South American | 183 | 0.7% |
| Spaniard | 1 | 0.0% |
| Sri Lankan | 21 | 0.1% |
| Subsaharan African | 187 | 0.7% |
| Sudanese | 29 | 0.1% |
| Swedish | 294 | 1.1% |
| Swiss | 498 | 1.8% |
| Thai | 70 | 0.3% |
| Ukrainian | 32 | 0.1% |
| Uruguayan | 36 | 0.1% |
| Welsh | 145 | 0.5% | View All 78 Rows |
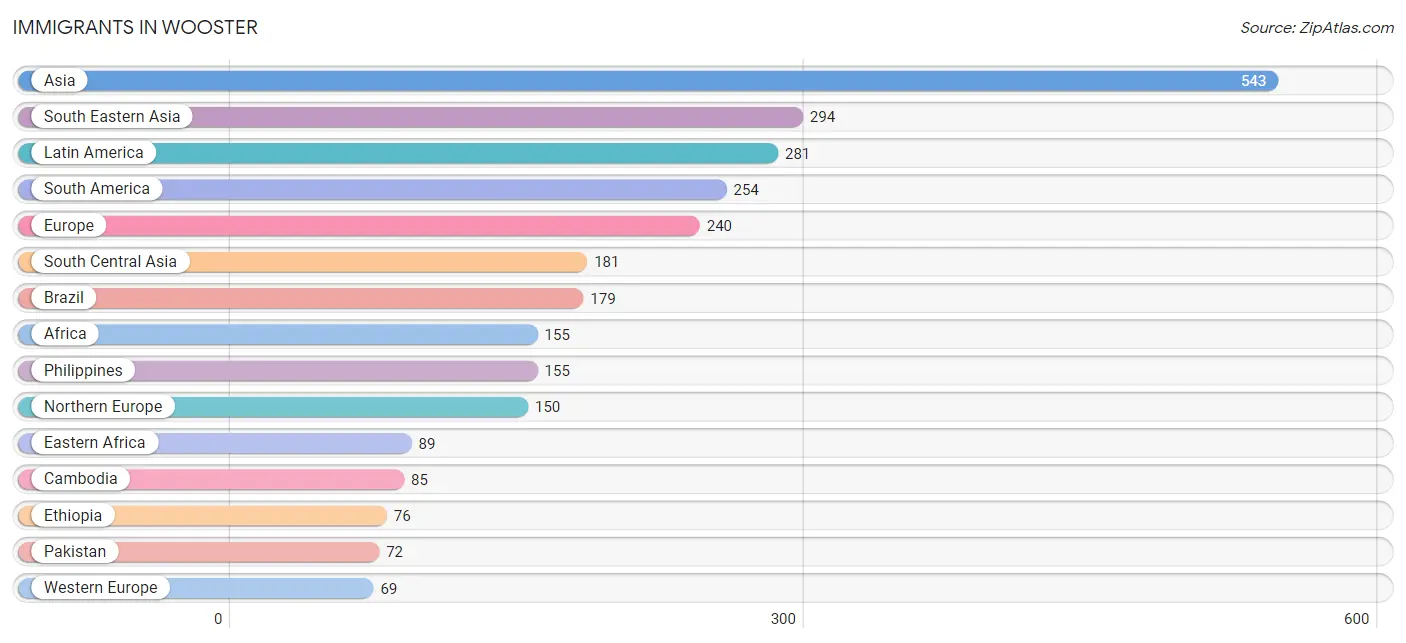
Immigrants in Wooster
The most numerous immigrant groups reported in Wooster came from Asia (543 | 2.0%), South Eastern Asia (294 | 1.1%), Latin America (281 | 1.0%), South America (254 | 0.9%), and Europe (240 | 0.9%), together accounting for 6.0% of all Wooster residents.
| Immigration Origin | # Population | % Population |
| Africa | 155 | 0.6% |
| Asia | 543 | 2.0% |
| Australia | 25 | 0.1% |
| Austria | 15 | 0.1% |
| Brazil | 179 | 0.7% |
| Cambodia | 85 | 0.3% |
| Canada | 52 | 0.2% |
| Central America | 27 | 0.1% |
| China | 39 | 0.1% |
| Colombia | 58 | 0.2% |
| Eastern Africa | 89 | 0.3% |
| Eastern Asia | 55 | 0.2% |
| Eastern Europe | 20 | 0.1% |
| El Salvador | 21 | 0.1% |
| England | 61 | 0.2% |
| Ethiopia | 76 | 0.3% |
| Europe | 240 | 0.9% |
| France | 15 | 0.1% |
| Germany | 39 | 0.1% |
| Guatemala | 6 | 0.0% |
| India | 59 | 0.2% |
| Indonesia | 24 | 0.1% |
| Iran | 16 | 0.1% |
| Kenya | 13 | 0.1% |
| Korea | 6 | 0.0% |
| Latin America | 281 | 1.0% |
| Morocco | 9 | 0.0% |
| Nigeria | 28 | 0.1% |
| Northern Africa | 38 | 0.1% |
| Northern Europe | 150 | 0.6% |
| Oceania | 30 | 0.1% |
| Pakistan | 72 | 0.3% |
| Philippines | 155 | 0.6% |
| Romania | 13 | 0.1% |
| Scotland | 62 | 0.2% |
| South America | 254 | 0.9% |
| South Central Asia | 181 | 0.7% |
| South Eastern Asia | 294 | 1.1% |
| Southern Europe | 1 | 0.0% |
| Spain | 1 | 0.0% |
| Sri Lanka | 34 | 0.1% |
| Sudan | 29 | 0.1% |
| Thailand | 9 | 0.0% |
| Ukraine | 7 | 0.0% |
| Uruguay | 17 | 0.1% |
| Vietnam | 21 | 0.1% |
| Western Africa | 28 | 0.1% |
| Western Asia | 13 | 0.1% |
| Western Europe | 69 | 0.3% | View All 49 Rows |
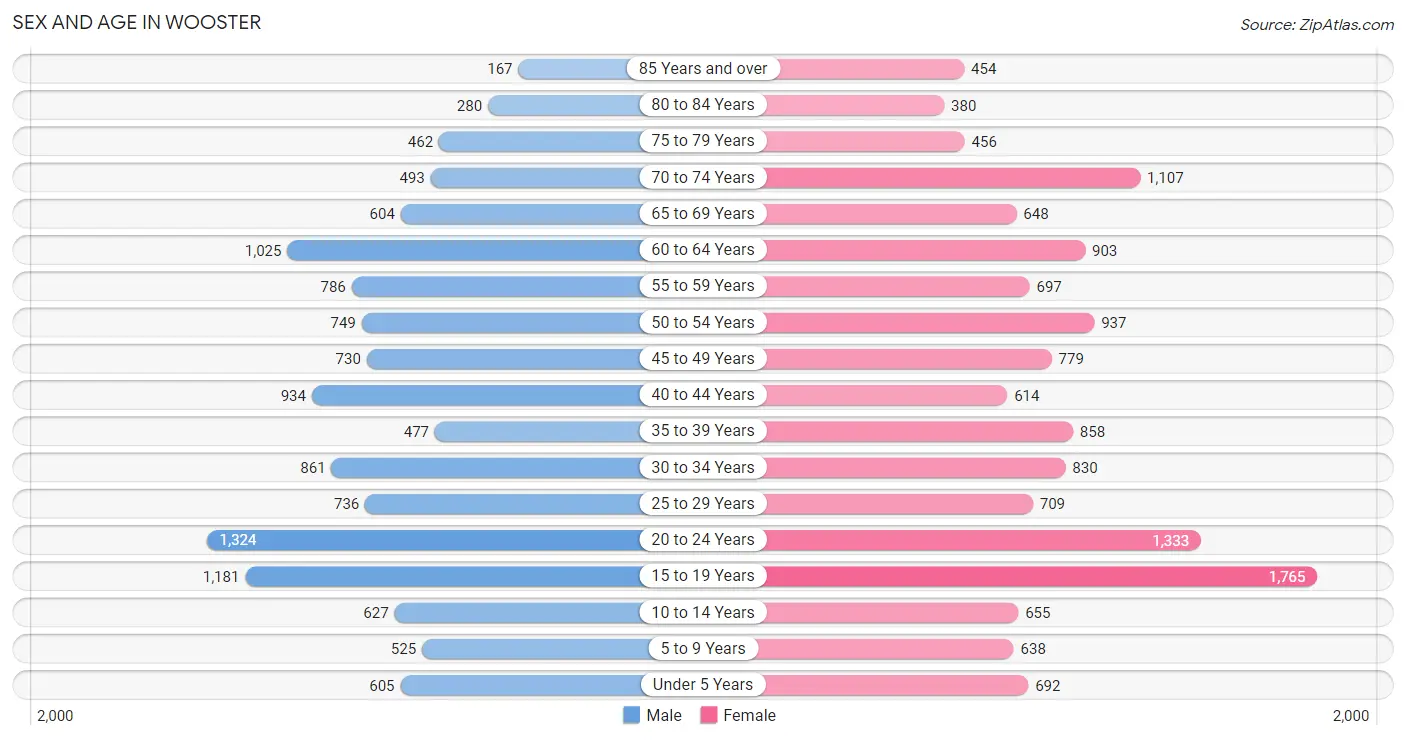
Sex and Age in Wooster
Sex and Age in Wooster
The most populous age groups in Wooster are 20 to 24 Years (1,324 | 10.5%) for men and 15 to 19 Years (1,765 | 12.2%) for women.
| Age Bracket | Male | Female |
| Under 5 Years | 605 (4.8%) | 692 (4.8%) |
| 5 to 9 Years | 525 (4.2%) | 638 (4.4%) |
| 10 to 14 Years | 627 (5.0%) | 655 (4.5%) |
| 15 to 19 Years | 1,181 (9.4%) | 1,765 (12.2%) |
| 20 to 24 Years | 1,324 (10.5%) | 1,333 (9.2%) |
| 25 to 29 Years | 736 (5.9%) | 709 (4.9%) |
| 30 to 34 Years | 861 (6.9%) | 830 (5.7%) |
| 35 to 39 Years | 477 (3.8%) | 858 (5.9%) |
| 40 to 44 Years | 934 (7.4%) | 614 (4.3%) |
| 45 to 49 Years | 730 (5.8%) | 779 (5.4%) |
| 50 to 54 Years | 749 (6.0%) | 937 (6.5%) |
| 55 to 59 Years | 786 (6.2%) | 697 (4.8%) |
| 60 to 64 Years | 1,025 (8.2%) | 903 (6.2%) |
| 65 to 69 Years | 604 (4.8%) | 648 (4.5%) |
| 70 to 74 Years | 493 (3.9%) | 1,107 (7.7%) |
| 75 to 79 Years | 462 (3.7%) | 456 (3.2%) |
| 80 to 84 Years | 280 (2.2%) | 380 (2.6%) |
| 85 Years and over | 167 (1.3%) | 454 (3.1%) |
| Total | 12,566 (100.0%) | 14,455 (100.0%) |
Families and Households in Wooster
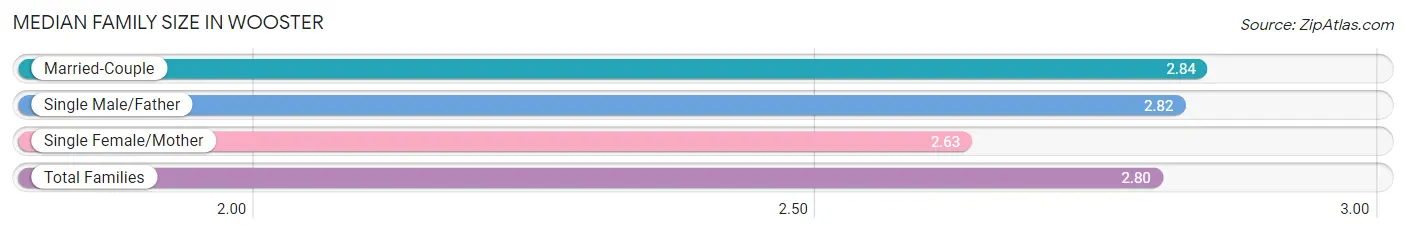
Median Family Size in Wooster
The median family size in Wooster is 2.80 persons per family, with married-couple families (4,699 | 76.2%) accounting for the largest median family size of 2.84 persons per family. On the other hand, single female/mother families (958 | 15.5%) represent the smallest median family size with 2.63 persons per family.
| Family Type | # Families | Family Size |
| Married-Couple | 4,699 (76.2%) | 2.84 |
| Single Male/Father | 506 (8.2%) | 2.82 |
| Single Female/Mother | 958 (15.5%) | 2.63 |
| Total Families | 6,163 (100.0%) | 2.80 |
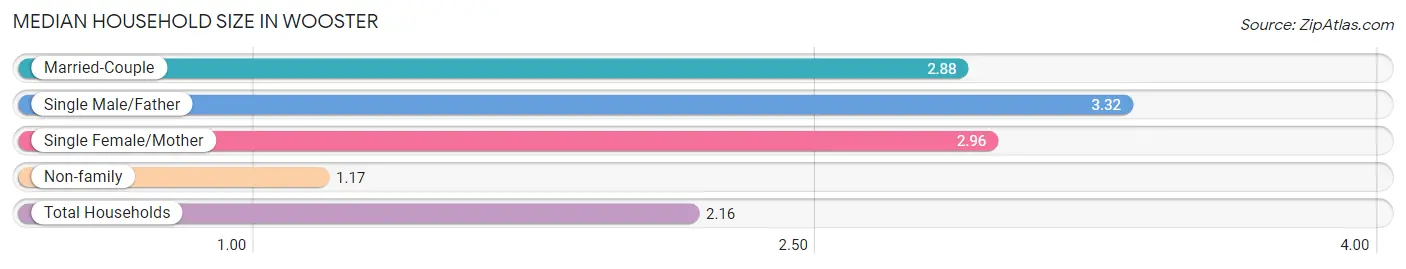
Median Household Size in Wooster
The median household size in Wooster is 2.16 persons per household, with single male/father households (506 | 4.6%) accounting for the largest median household size of 3.32 persons per household. non-family households (4,806 | 43.8%) represent the smallest median household size with 1.17 persons per household.
| Household Type | # Households | Household Size |
| Married-Couple | 4,699 (42.8%) | 2.88 |
| Single Male/Father | 506 (4.6%) | 3.32 |
| Single Female/Mother | 958 (8.7%) | 2.96 |
| Non-family | 4,806 (43.8%) | 1.17 |
| Total Households | 10,969 (100.0%) | 2.16 |
Household Size by Marriage Status in Wooster
Out of a total of 10,969 households in Wooster, 6,163 (56.2%) are family households, while 4,806 (43.8%) are nonfamily households. The most numerous type of family households are 2-person households, comprising 3,028, and the most common type of nonfamily households are 1-person households, comprising 4,141.
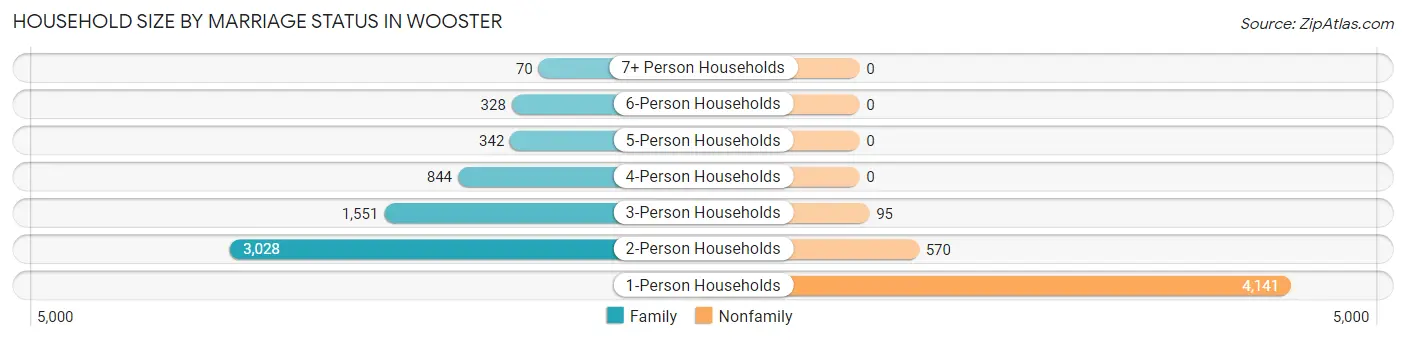
| Household Size | Family Households | Nonfamily Households |
| 1-Person Households | - | 4,141 (37.8%) |
| 2-Person Households | 3,028 (27.6%) | 570 (5.2%) |
| 3-Person Households | 1,551 (14.1%) | 95 (0.9%) |
| 4-Person Households | 844 (7.7%) | 0 (0.0%) |
| 5-Person Households | 342 (3.1%) | 0 (0.0%) |
| 6-Person Households | 328 (3.0%) | 0 (0.0%) |
| 7+ Person Households | 70 (0.6%) | 0 (0.0%) |
| Total | 6,163 (56.2%) | 4,806 (43.8%) |
Female Fertility in Wooster
Fertility by Age in Wooster
Average fertility rate in Wooster is 65.0 births per 1,000 women. Women in the age bracket of 20 to 34 years have the highest fertility rate with 129.0 births per 1,000 women. Women in the age bracket of 20 to 34 years acount for 81.5% of all women with births.
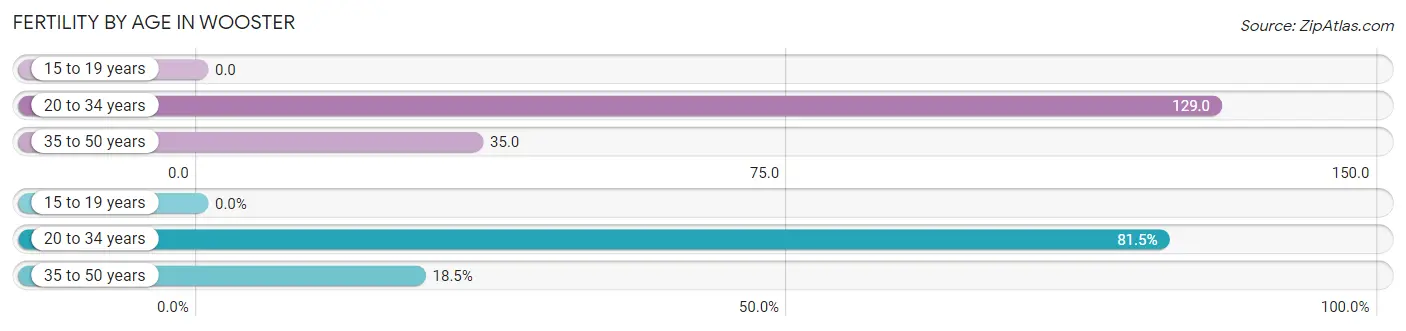
| Age Bracket | Women with Births | Births / 1,000 Women |
| 15 to 19 years | 0 (0.0%) | 0.0 |
| 20 to 34 years | 371 (81.5%) | 129.0 |
| 35 to 50 years | 84 (18.5%) | 35.0 |
| Total | 455 (100.0%) | 65.0 |
Fertility by Age by Marriage Status in Wooster
64.0% of women with births (455) in Wooster are married. The highest percentage of unmarried women with births falls into 20 to 34 years age bracket with 36.1% of them unmarried at the time of birth, while the lowest percentage of unmarried women with births belong to 35 to 50 years age bracket with 35.7% of them unmarried.
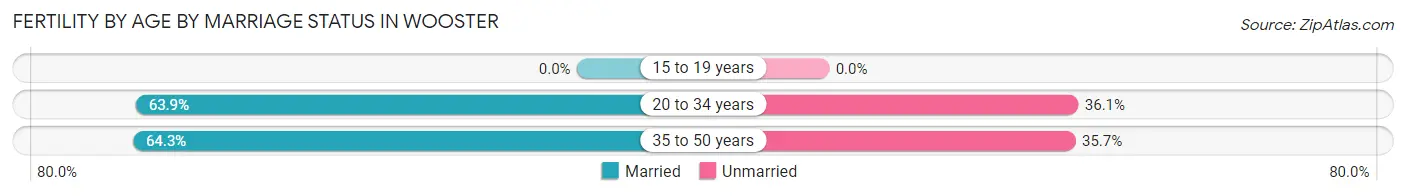
| Age Bracket | Married | Unmarried |
| 15 to 19 years | 0 (0.0%) | 0 (0.0%) |
| 20 to 34 years | 237 (63.9%) | 134 (36.1%) |
| 35 to 50 years | 54 (64.3%) | 30 (35.7%) |
| Total | 291 (64.0%) | 164 (36.0%) |
Fertility by Education in Wooster
Average fertility rate in Wooster is 65.0 births per 1,000 women. Women with the education attainment of high school diploma have the highest fertility rate of 110.0 births per 1,000 women, while women with the education attainment of college or associate's degree have the lowest fertility at 28.0 births per 1,000 women. Women with the education attainment of high school diploma represent 50.3% of all women with births.
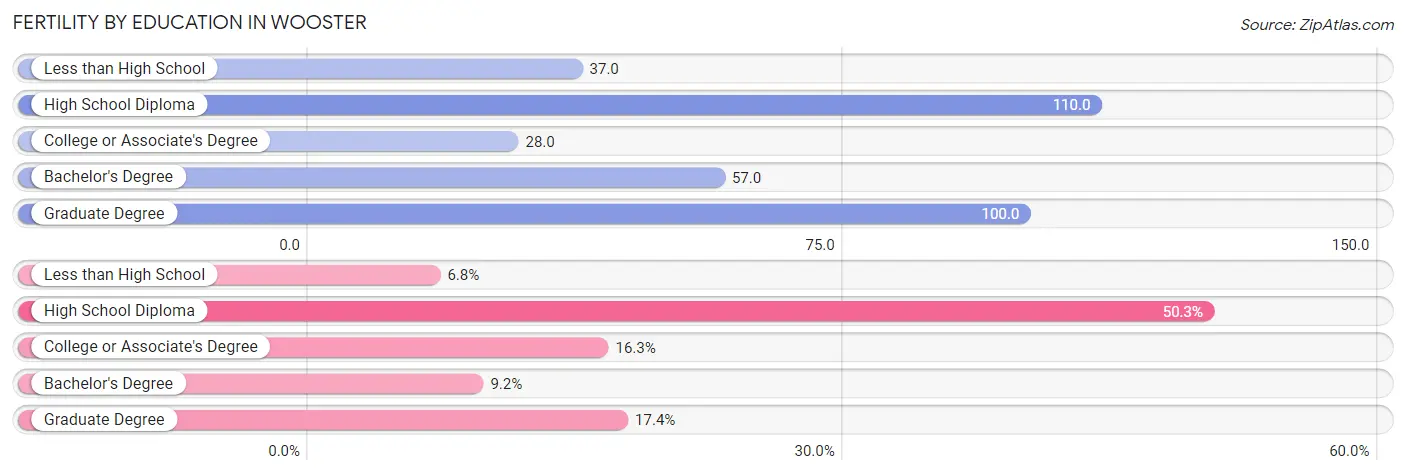
| Educational Attainment | Women with Births | Births / 1,000 Women |
| Less than High School | 31 (6.8%) | 37.0 |
| High School Diploma | 229 (50.3%) | 110.0 |
| College or Associate's Degree | 74 (16.3%) | 28.0 |
| Bachelor's Degree | 42 (9.2%) | 57.0 |
| Graduate Degree | 79 (17.4%) | 100.0 |
| Total | 455 (100.0%) | 65.0 |
Fertility by Education by Marriage Status in Wooster
36.0% of women with births in Wooster are unmarried. Women with the educational attainment of bachelor's degree are most likely to be married with 100.0% of them married at childbirth, while women with the educational attainment of less than high school are least likely to be married with 100.0% of them unmarried at childbirth.
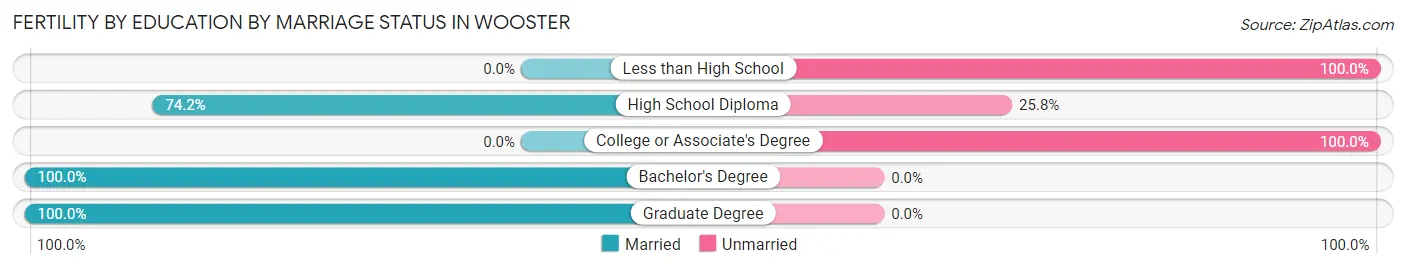
| Educational Attainment | Married | Unmarried |
| Less than High School | 0 (0.0%) | 31 (100.0%) |
| High School Diploma | 170 (74.2%) | 59 (25.8%) |
| College or Associate's Degree | 0 (0.0%) | 74 (100.0%) |
| Bachelor's Degree | 42 (100.0%) | 0 (0.0%) |
| Graduate Degree | 79 (100.0%) | 0 (0.0%) |
| Total | 291 (64.0%) | 164 (36.0%) |
Employment Characteristics in Wooster
Employment by Class of Employer in Wooster
Among the 12,956 employed individuals in Wooster, private company employees (8,540 | 65.9%), not-for-profit organizations (1,518 | 11.7%), and local government employees (1,096 | 8.5%) make up the most common classes of employment.
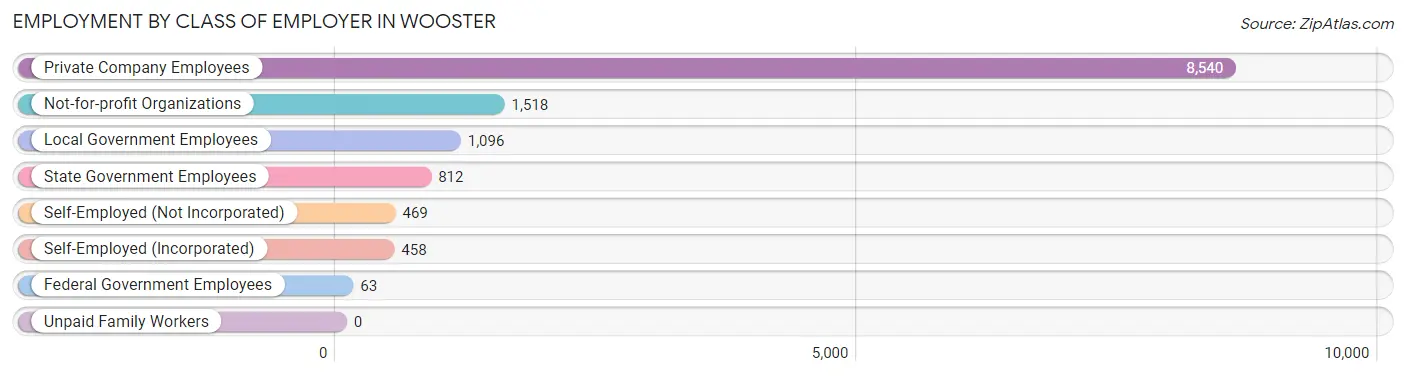
| Employer Class | # Employees | % Employees |
| Private Company Employees | 8,540 | 65.9% |
| Self-Employed (Incorporated) | 458 | 3.5% |
| Self-Employed (Not Incorporated) | 469 | 3.6% |
| Not-for-profit Organizations | 1,518 | 11.7% |
| Local Government Employees | 1,096 | 8.5% |
| State Government Employees | 812 | 6.3% |
| Federal Government Employees | 63 | 0.5% |
| Unpaid Family Workers | 0 | 0.0% |
| Total | 12,956 | 100.0% |
Employment Status by Age in Wooster
According to the labor force statistics for Wooster, out of the total population over 16 years of age (22,823), 62.3% or 14,219 individuals are in the labor force, with 4.6% or 654 of them unemployed. The age group with the highest labor force participation rate is 25 to 29 years, with 89.1% or 1,287 individuals in the labor force. Within the labor force, the 16 to 19 years age range has the highest percentage of unemployed individuals, with 15.0% or 228 of them being unemployed.
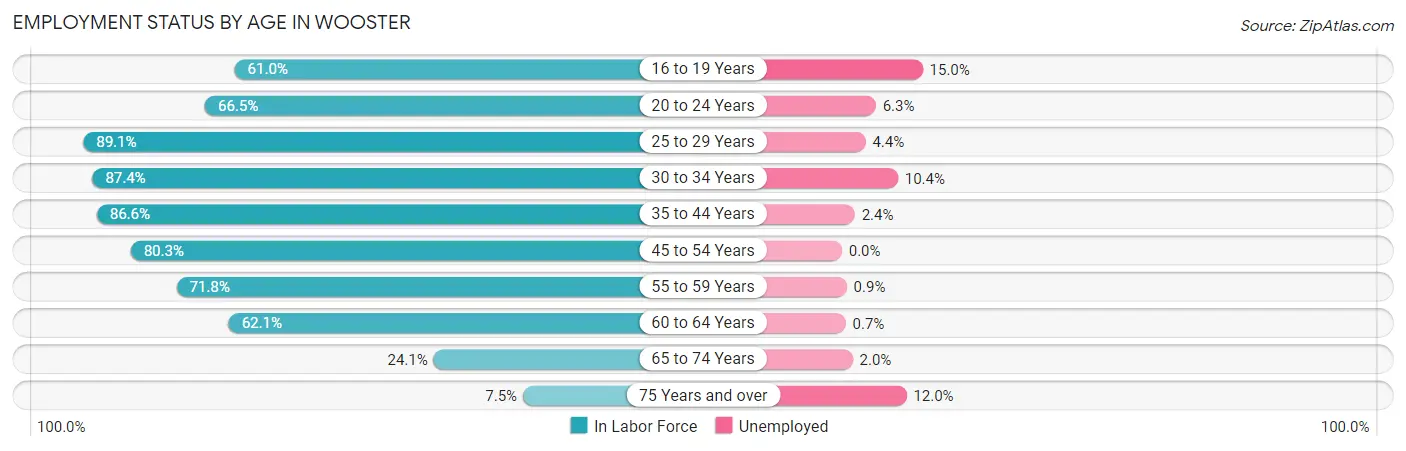
| Age Bracket | In Labor Force | Unemployed |
| 16 to 19 Years | 1,519 (61.0%) | 228 (15.0%) |
| 20 to 24 Years | 1,767 (66.5%) | 111 (6.3%) |
| 25 to 29 Years | 1,287 (89.1%) | 57 (4.4%) |
| 30 to 34 Years | 1,478 (87.4%) | 154 (10.4%) |
| 35 to 44 Years | 2,497 (86.6%) | 60 (2.4%) |
| 45 to 54 Years | 2,566 (80.3%) | 0 (0.0%) |
| 55 to 59 Years | 1,065 (71.8%) | 10 (0.9%) |
| 60 to 64 Years | 1,197 (62.1%) | 8 (0.7%) |
| 65 to 74 Years | 687 (24.1%) | 14 (2.0%) |
| 75 Years and over | 165 (7.5%) | 20 (12.0%) |
| Total | 14,219 (62.3%) | 654 (4.6%) |
Employment Status by Educational Attainment in Wooster
According to labor force statistics for Wooster, 79.9% of individuals (10,087) out of the total population between 25 and 64 years of age (12,625) are in the labor force, with 2.9% or 293 of them being unemployed. The group with the highest labor force participation rate are those with the educational attainment of bachelor's degree or higher, with 86.7% or 3,721 individuals in the labor force. Within the labor force, individuals with less than high school education have the highest percentage of unemployment, with 13.0% or 39 of them being unemployed.
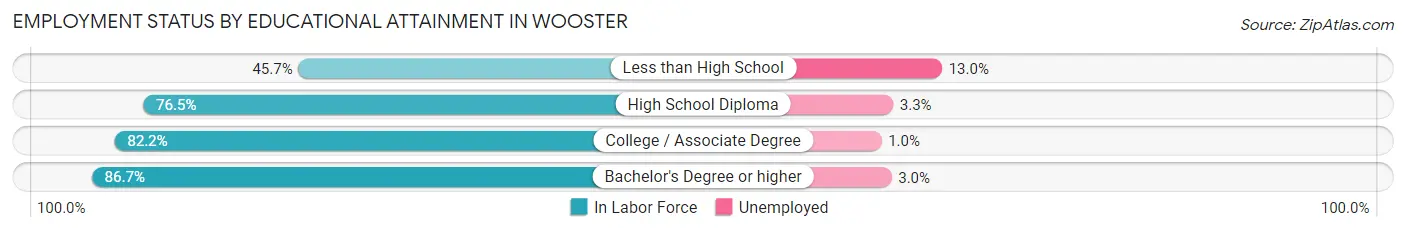
| Educational Attainment | In Labor Force | Unemployed |
| Less than High School | 301 (45.7%) | 86 (13.0%) |
| High School Diploma | 3,224 (76.5%) | 139 (3.3%) |
| College / Associate Degree | 2,844 (82.2%) | 35 (1.0%) |
| Bachelor's Degree or higher | 3,721 (86.7%) | 129 (3.0%) |
| Total | 10,087 (79.9%) | 366 (2.9%) |
Employment Occupations by Sex in Wooster
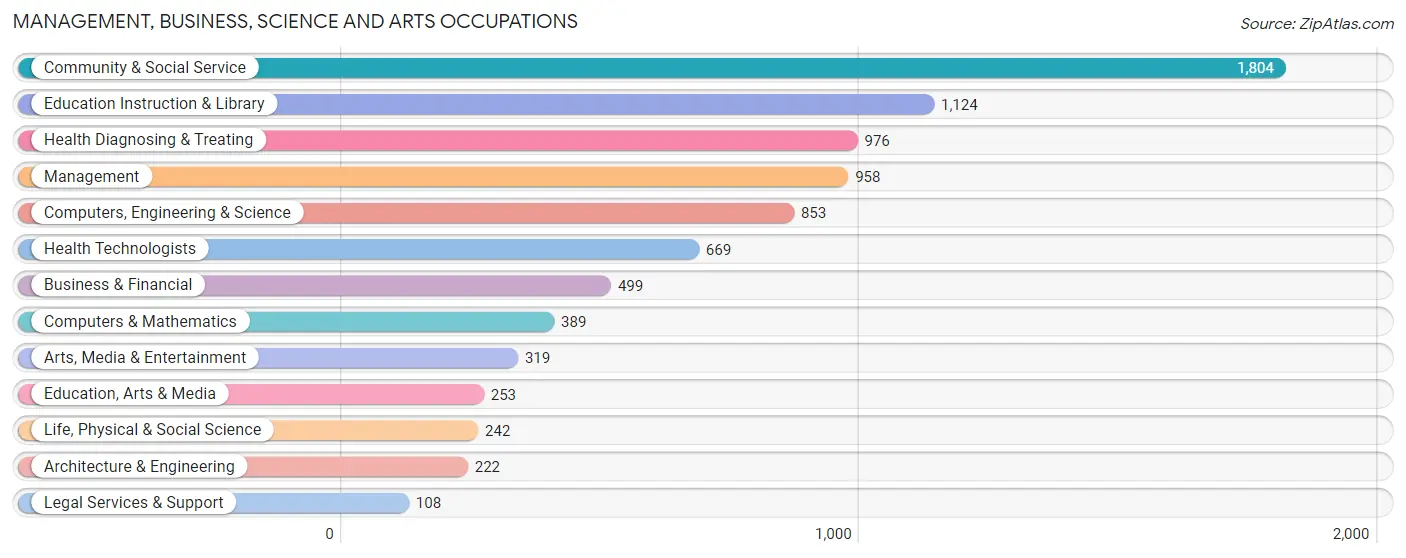
Management, Business, Science and Arts Occupations
The most common Management, Business, Science and Arts occupations in Wooster are Community & Social Service (1,804 | 13.3%), Education Instruction & Library (1,124 | 8.3%), Health Diagnosing & Treating (976 | 7.2%), Management (958 | 7.1%), and Computers, Engineering & Science (853 | 6.3%).
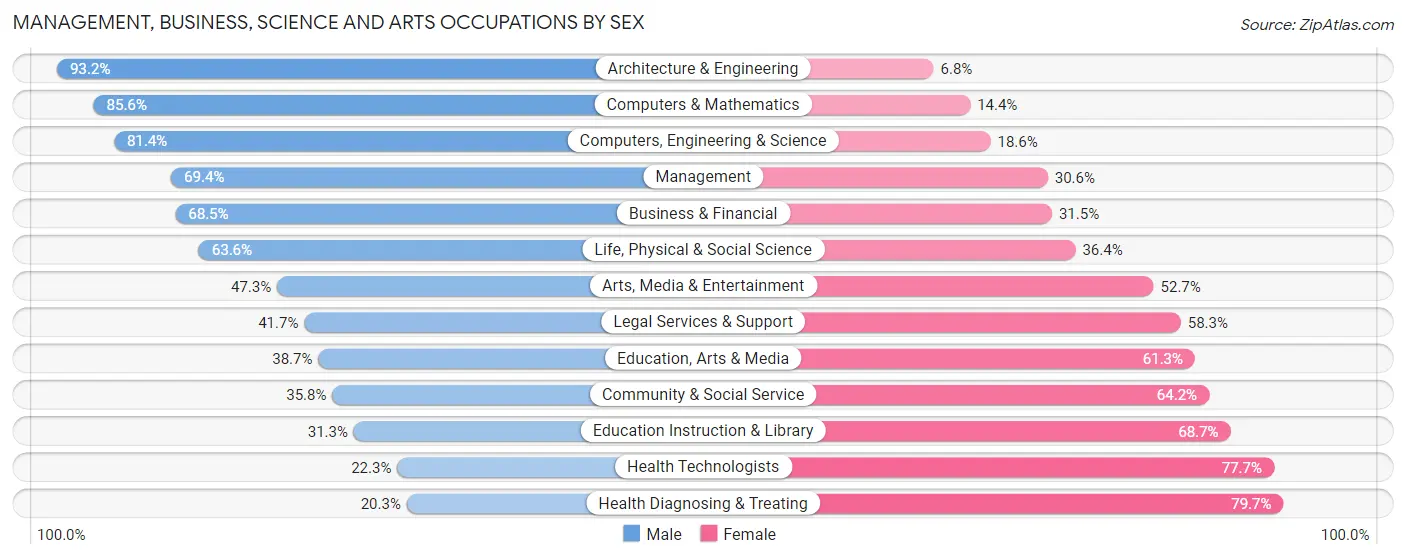
Management, Business, Science and Arts Occupations by Sex
Within the Management, Business, Science and Arts occupations in Wooster, the most male-oriented occupations are Architecture & Engineering (93.2%), Computers & Mathematics (85.6%), and Computers, Engineering & Science (81.4%), while the most female-oriented occupations are Health Diagnosing & Treating (79.7%), Health Technologists (77.7%), and Education Instruction & Library (68.7%).
| Occupation | Male | Female |
| Management | 665 (69.4%) | 293 (30.6%) |
| Business & Financial | 342 (68.5%) | 157 (31.5%) |
| Computers, Engineering & Science | 694 (81.4%) | 159 (18.6%) |
| Computers & Mathematics | 333 (85.6%) | 56 (14.4%) |
| Architecture & Engineering | 207 (93.2%) | 15 (6.8%) |
| Life, Physical & Social Science | 154 (63.6%) | 88 (36.4%) |
| Community & Social Service | 646 (35.8%) | 1,158 (64.2%) |
| Education, Arts & Media | 98 (38.7%) | 155 (61.3%) |
| Legal Services & Support | 45 (41.7%) | 63 (58.3%) |
| Education Instruction & Library | 352 (31.3%) | 772 (68.7%) |
| Arts, Media & Entertainment | 151 (47.3%) | 168 (52.7%) |
| Health Diagnosing & Treating | 198 (20.3%) | 778 (79.7%) |
| Health Technologists | 149 (22.3%) | 520 (77.7%) |
| Total (Category) | 2,545 (50.0%) | 2,545 (50.0%) |
| Total (Overall) | 6,719 (49.5%) | 6,850 (50.5%) |
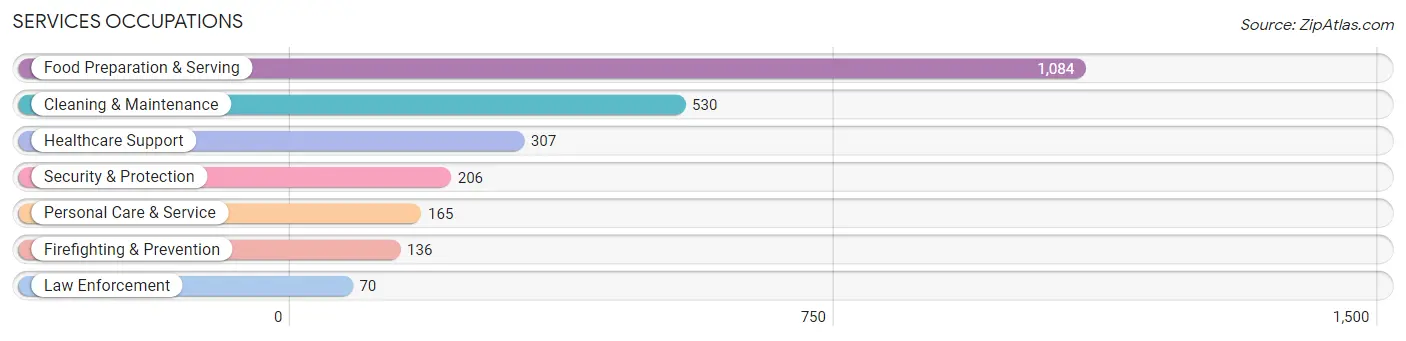
Services Occupations
The most common Services occupations in Wooster are Food Preparation & Serving (1,084 | 8.0%), Cleaning & Maintenance (530 | 3.9%), Healthcare Support (307 | 2.3%), Security & Protection (206 | 1.5%), and Personal Care & Service (165 | 1.2%).
Services Occupations by Sex
Within the Services occupations in Wooster, the most male-oriented occupations are Firefighting & Prevention (93.4%), Security & Protection (87.9%), and Law Enforcement (77.1%), while the most female-oriented occupations are Personal Care & Service (96.4%), Healthcare Support (82.4%), and Food Preparation & Serving (66.4%).

| Occupation | Male | Female |
| Healthcare Support | 54 (17.6%) | 253 (82.4%) |
| Security & Protection | 181 (87.9%) | 25 (12.1%) |
| Firefighting & Prevention | 127 (93.4%) | 9 (6.6%) |
| Law Enforcement | 54 (77.1%) | 16 (22.9%) |
| Food Preparation & Serving | 364 (33.6%) | 720 (66.4%) |
| Cleaning & Maintenance | 280 (52.8%) | 250 (47.2%) |
| Personal Care & Service | 6 (3.6%) | 159 (96.4%) |
| Total (Category) | 885 (38.6%) | 1,407 (61.4%) |
| Total (Overall) | 6,719 (49.5%) | 6,850 (50.5%) |
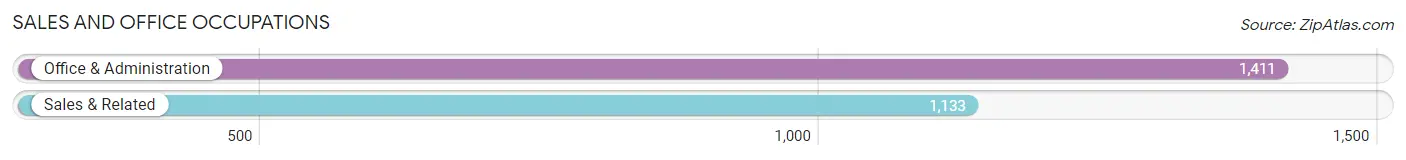
Sales and Office Occupations
The most common Sales and Office occupations in Wooster are Office & Administration (1,411 | 10.4%), and Sales & Related (1,133 | 8.4%).
Sales and Office Occupations by Sex
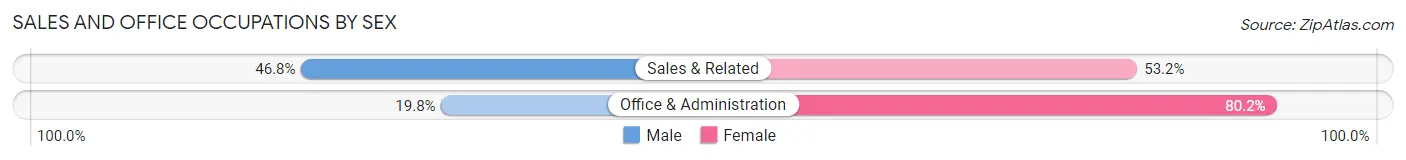
| Occupation | Male | Female |
| Sales & Related | 530 (46.8%) | 603 (53.2%) |
| Office & Administration | 280 (19.8%) | 1,131 (80.2%) |
| Total (Category) | 810 (31.8%) | 1,734 (68.2%) |
| Total (Overall) | 6,719 (49.5%) | 6,850 (50.5%) |
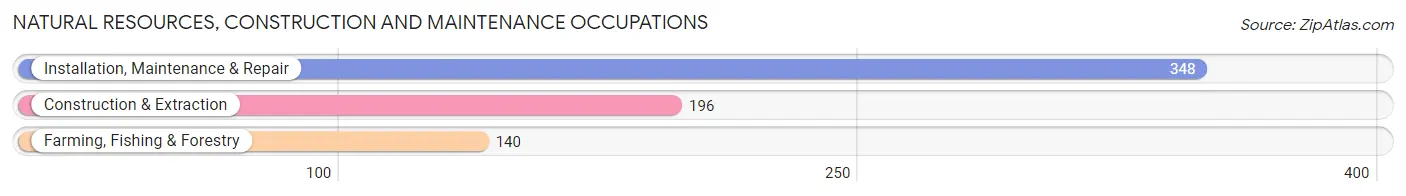
Natural Resources, Construction and Maintenance Occupations
The most common Natural Resources, Construction and Maintenance occupations in Wooster are Installation, Maintenance & Repair (348 | 2.6%), Construction & Extraction (196 | 1.4%), and Farming, Fishing & Forestry (140 | 1.0%).
Natural Resources, Construction and Maintenance Occupations by Sex
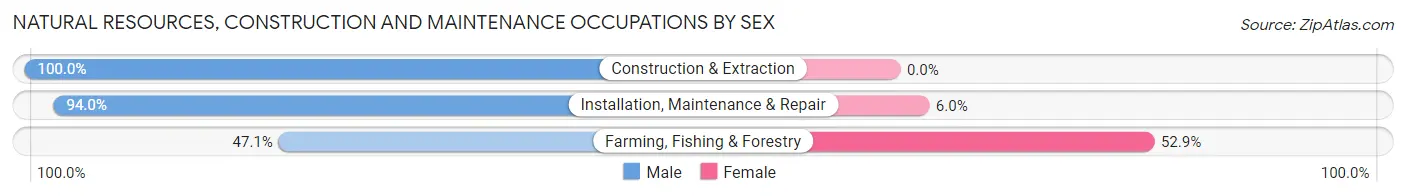
| Occupation | Male | Female |
| Farming, Fishing & Forestry | 66 (47.1%) | 74 (52.9%) |
| Construction & Extraction | 196 (100.0%) | 0 (0.0%) |
| Installation, Maintenance & Repair | 327 (94.0%) | 21 (6.0%) |
| Total (Category) | 589 (86.1%) | 95 (13.9%) |
| Total (Overall) | 6,719 (49.5%) | 6,850 (50.5%) |
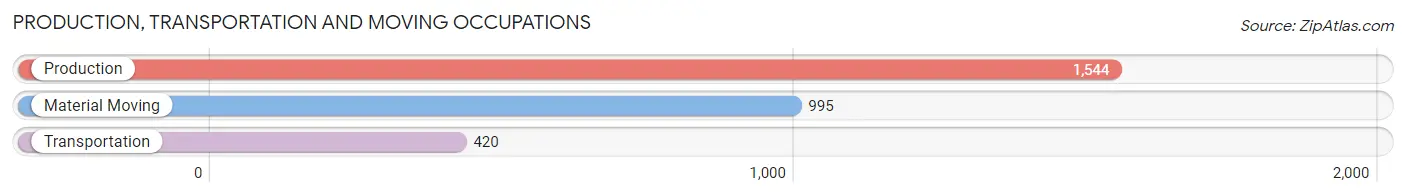
Production, Transportation and Moving Occupations
The most common Production, Transportation and Moving occupations in Wooster are Production (1,544 | 11.4%), Material Moving (995 | 7.3%), and Transportation (420 | 3.1%).
Production, Transportation and Moving Occupations by Sex
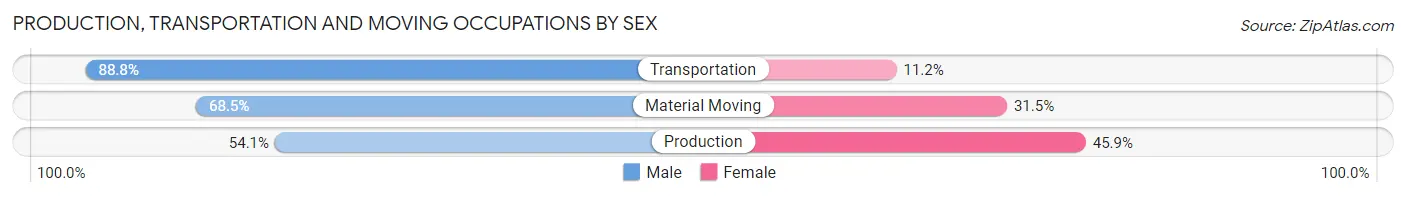
| Occupation | Male | Female |
| Production | 835 (54.1%) | 709 (45.9%) |
| Transportation | 373 (88.8%) | 47 (11.2%) |
| Material Moving | 682 (68.5%) | 313 (31.5%) |
| Total (Category) | 1,890 (63.9%) | 1,069 (36.1%) |
| Total (Overall) | 6,719 (49.5%) | 6,850 (50.5%) |
Employment Industries by Sex in Wooster
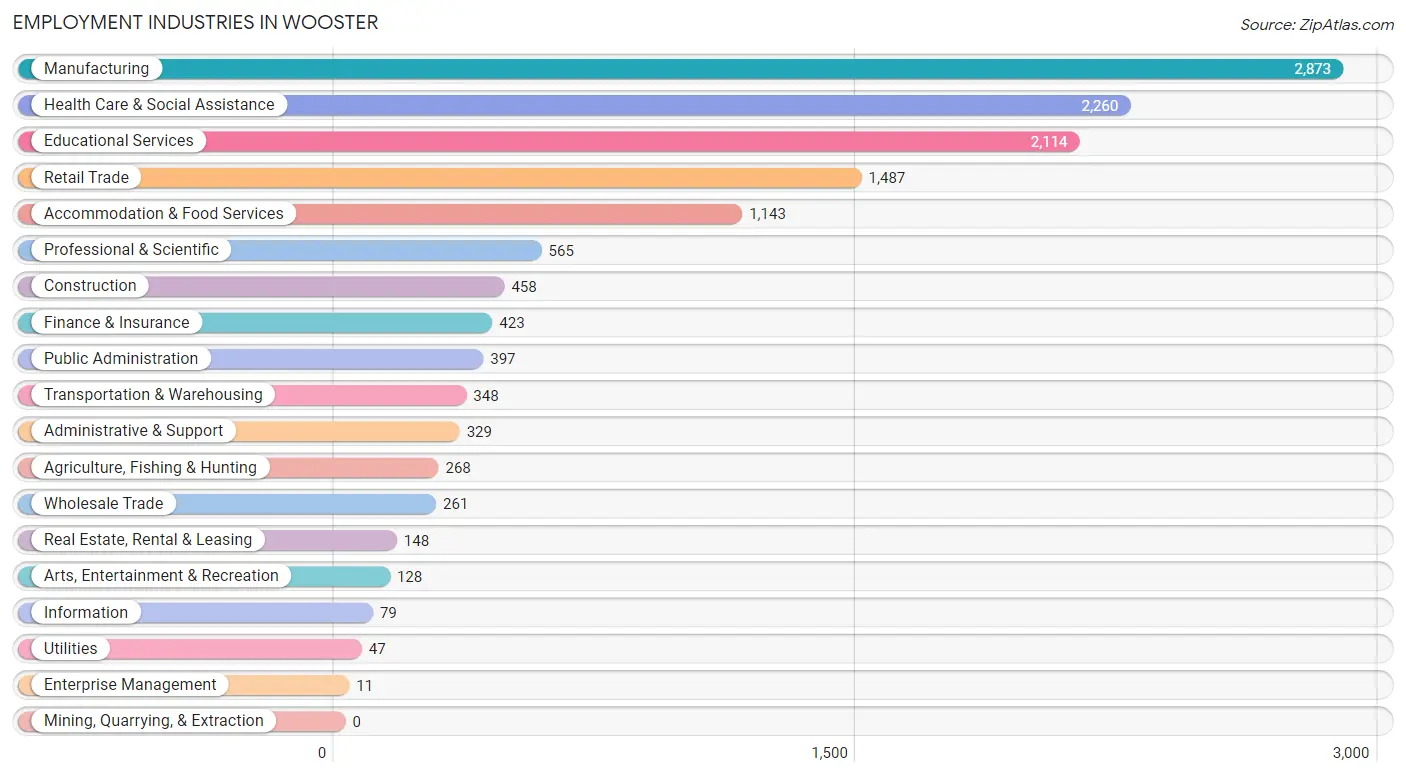
Employment Industries in Wooster
The major employment industries in Wooster include Manufacturing (2,873 | 21.2%), Health Care & Social Assistance (2,260 | 16.7%), Educational Services (2,114 | 15.6%), Retail Trade (1,487 | 11.0%), and Accommodation & Food Services (1,143 | 8.4%).
Employment Industries by Sex in Wooster
The Wooster industries that see more men than women are Utilities (100.0%), Enterprise Management (100.0%), and Construction (84.5%), whereas the industries that tend to have a higher number of women are Health Care & Social Assistance (76.7%), Accommodation & Food Services (71.5%), and Educational Services (66.7%).
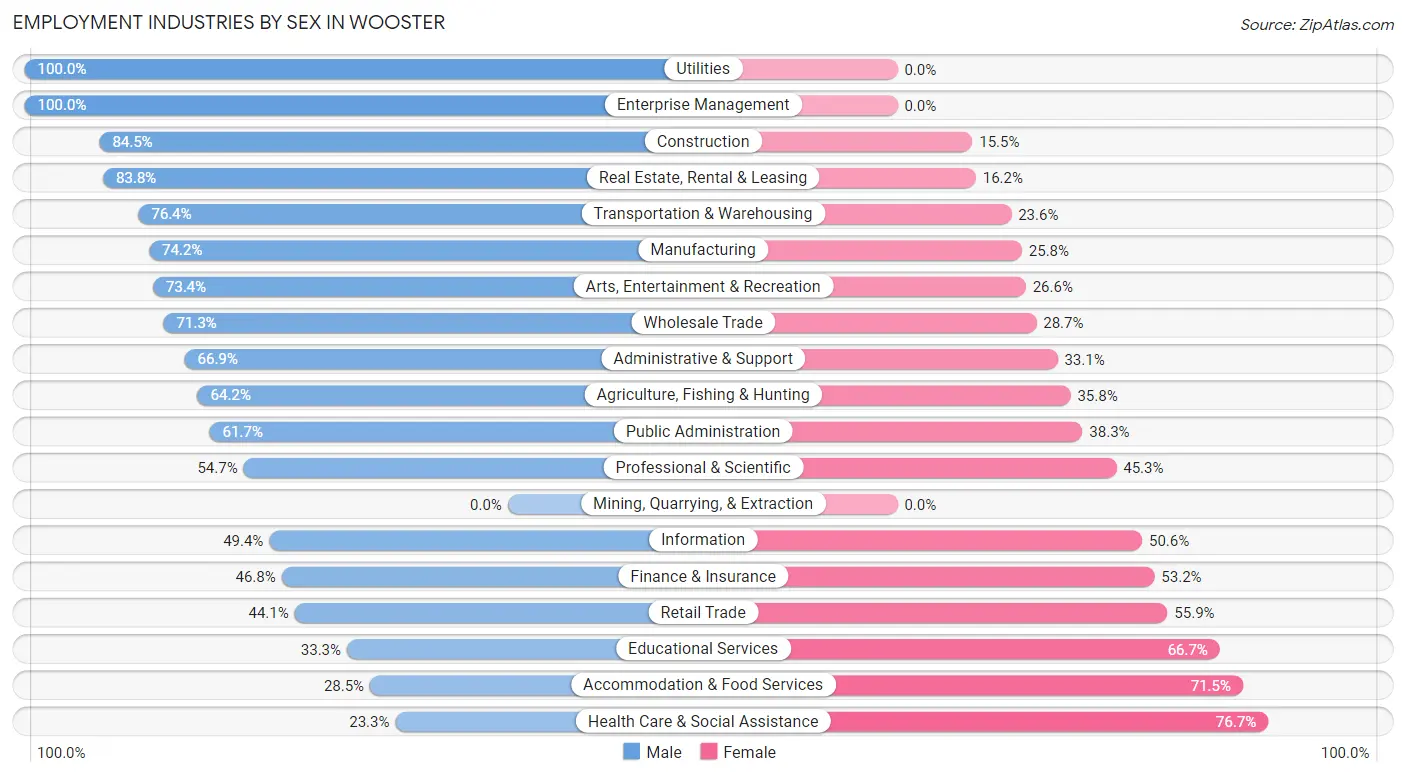
| Industry | Male | Female |
| Agriculture, Fishing & Hunting | 172 (64.2%) | 96 (35.8%) |
| Mining, Quarrying, & Extraction | 0 (0.0%) | 0 (0.0%) |
| Construction | 387 (84.5%) | 71 (15.5%) |
| Manufacturing | 2,133 (74.2%) | 740 (25.8%) |
| Wholesale Trade | 186 (71.3%) | 75 (28.7%) |
| Retail Trade | 656 (44.1%) | 831 (55.9%) |
| Transportation & Warehousing | 266 (76.4%) | 82 (23.6%) |
| Utilities | 47 (100.0%) | 0 (0.0%) |
| Information | 39 (49.4%) | 40 (50.6%) |
| Finance & Insurance | 198 (46.8%) | 225 (53.2%) |
| Real Estate, Rental & Leasing | 124 (83.8%) | 24 (16.2%) |
| Professional & Scientific | 309 (54.7%) | 256 (45.3%) |
| Enterprise Management | 11 (100.0%) | 0 (0.0%) |
| Administrative & Support | 220 (66.9%) | 109 (33.1%) |
| Educational Services | 704 (33.3%) | 1,410 (66.7%) |
| Health Care & Social Assistance | 526 (23.3%) | 1,734 (76.7%) |
| Arts, Entertainment & Recreation | 94 (73.4%) | 34 (26.6%) |
| Accommodation & Food Services | 326 (28.5%) | 817 (71.5%) |
| Public Administration | 245 (61.7%) | 152 (38.3%) |
| Total | 6,719 (49.5%) | 6,850 (50.5%) |
Education in Wooster
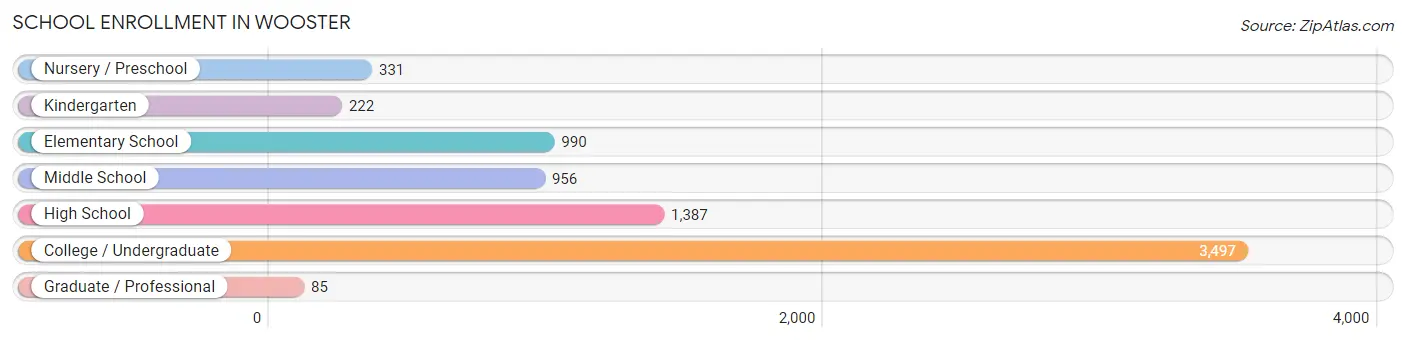
School Enrollment in Wooster
The most common levels of schooling among the 7,468 students in Wooster are college / undergraduate (3,497 | 46.8%), high school (1,387 | 18.6%), and elementary school (990 | 13.3%).
| School Level | # Students | % Students |
| Nursery / Preschool | 331 | 4.4% |
| Kindergarten | 222 | 3.0% |
| Elementary School | 990 | 13.3% |
| Middle School | 956 | 12.8% |
| High School | 1,387 | 18.6% |
| College / Undergraduate | 3,497 | 46.8% |
| Graduate / Professional | 85 | 1.1% |
| Total | 7,468 | 100.0% |
School Enrollment by Age by Funding Source in Wooster
Out of a total of 7,468 students who are enrolled in schools in Wooster, 2,800 (37.5%) attend a private institution, while the remaining 4,668 (62.5%) are enrolled in public schools. The age group of 20 to 24 year olds has the highest likelihood of being enrolled in private schools, with 1,135 (68.4% in the age bracket) enrolled. Conversely, the age group of 10 to 14 year olds has the lowest likelihood of being enrolled in a private school, with 1,207 (95.6% in the age bracket) attending a public institution.
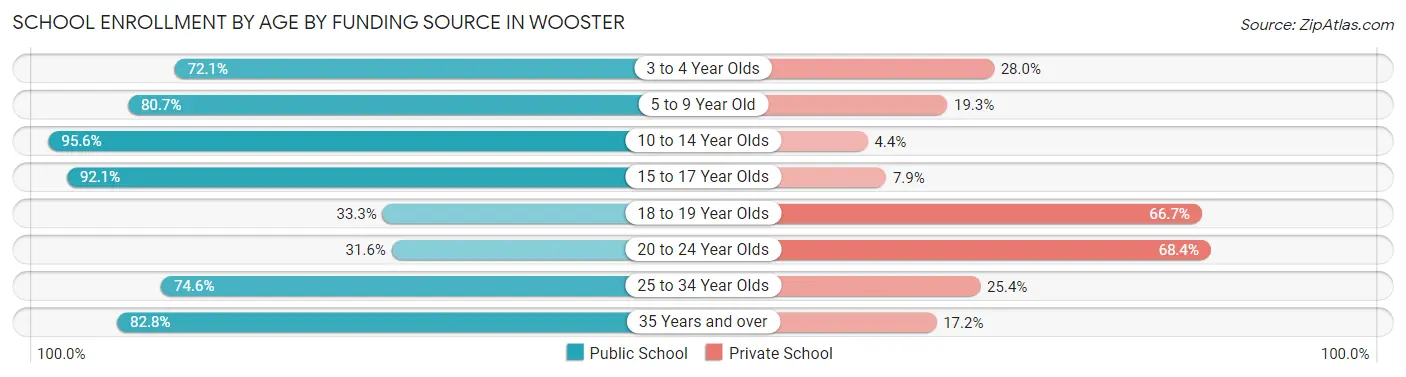
| Age Bracket | Public School | Private School |
| 3 to 4 Year Olds | 165 (72.1%) | 64 (28.0%) |
| 5 to 9 Year Old | 939 (80.7%) | 224 (19.3%) |
| 10 to 14 Year Olds | 1,207 (95.6%) | 56 (4.4%) |
| 15 to 17 Year Olds | 970 (92.1%) | 83 (7.9%) |
| 18 to 19 Year Olds | 583 (33.3%) | 1,166 (66.7%) |
| 20 to 24 Year Olds | 525 (31.6%) | 1,135 (68.4%) |
| 25 to 34 Year Olds | 132 (74.6%) | 45 (25.4%) |
| 35 Years and over | 144 (82.8%) | 30 (17.2%) |
| Total | 4,668 (62.5%) | 2,800 (37.5%) |
Educational Attainment by Field of Study in Wooster
Business (815 | 13.6%), education (731 | 12.2%), science & technology (654 | 10.9%), social sciences (528 | 8.8%), and bio, nature & agricultural (506 | 8.5%) are the most common fields of study among 5,988 individuals in Wooster who have obtained a bachelor's degree or higher.
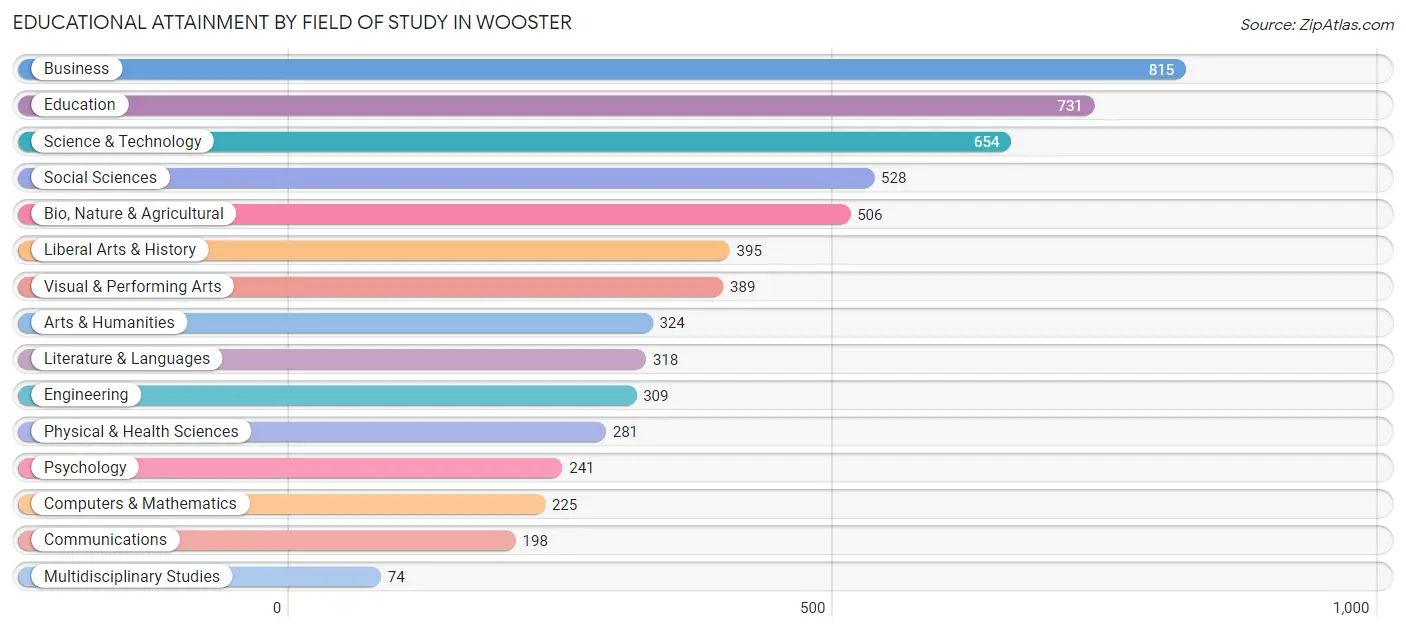
| Field of Study | # Graduates | % Graduates |
| Computers & Mathematics | 225 | 3.8% |
| Bio, Nature & Agricultural | 506 | 8.5% |
| Physical & Health Sciences | 281 | 4.7% |
| Psychology | 241 | 4.0% |
| Social Sciences | 528 | 8.8% |
| Engineering | 309 | 5.2% |
| Multidisciplinary Studies | 74 | 1.2% |
| Science & Technology | 654 | 10.9% |
| Business | 815 | 13.6% |
| Education | 731 | 12.2% |
| Literature & Languages | 318 | 5.3% |
| Liberal Arts & History | 395 | 6.6% |
| Visual & Performing Arts | 389 | 6.5% |
| Communications | 198 | 3.3% |
| Arts & Humanities | 324 | 5.4% |
| Total | 5,988 | 100.0% |
Transportation & Commute in Wooster
Vehicle Availability by Sex in Wooster
The most prevalent vehicle ownership categories in Wooster are males with 2 vehicles (3,041, accounting for 49.6%) and females with 2 vehicles (2,733, making up 54.8%).
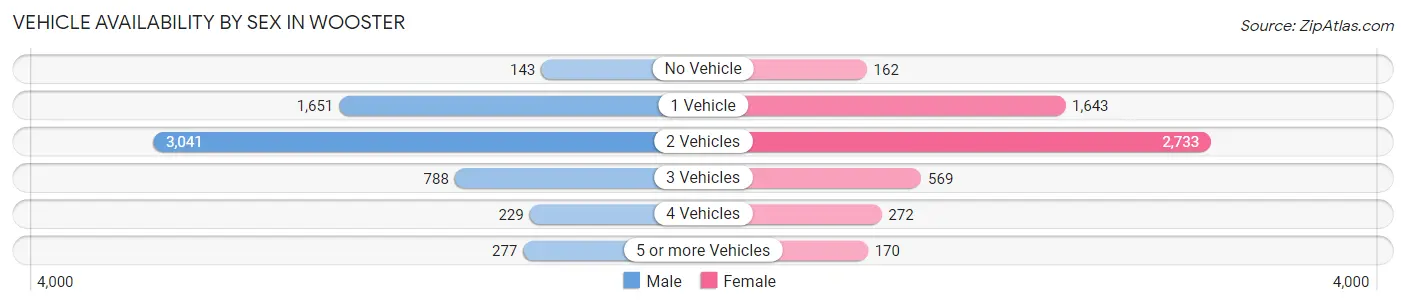
| Vehicles Available | Male | Female |
| No Vehicle | 143 (2.3%) | 162 (2.9%) |
| 1 Vehicle | 1,651 (26.9%) | 1,643 (29.6%) |
| 2 Vehicles | 3,041 (49.6%) | 2,733 (49.2%) |
| 3 Vehicles | 788 (12.9%) | 569 (10.2%) |
| 4 Vehicles | 229 (3.7%) | 272 (4.9%) |
| 5 or more Vehicles | 277 (4.5%) | 170 (3.1%) |
| Total | 6,129 (100.0%) | 5,549 (100.0%) |
Commute Time in Wooster
The most frequently occuring commute durations in Wooster are 5 to 9 minutes (3,371 commuters, 28.1%), 10 to 14 minutes (3,364 commuters, 28.1%), and less than 5 minutes (1,048 commuters, 8.7%).
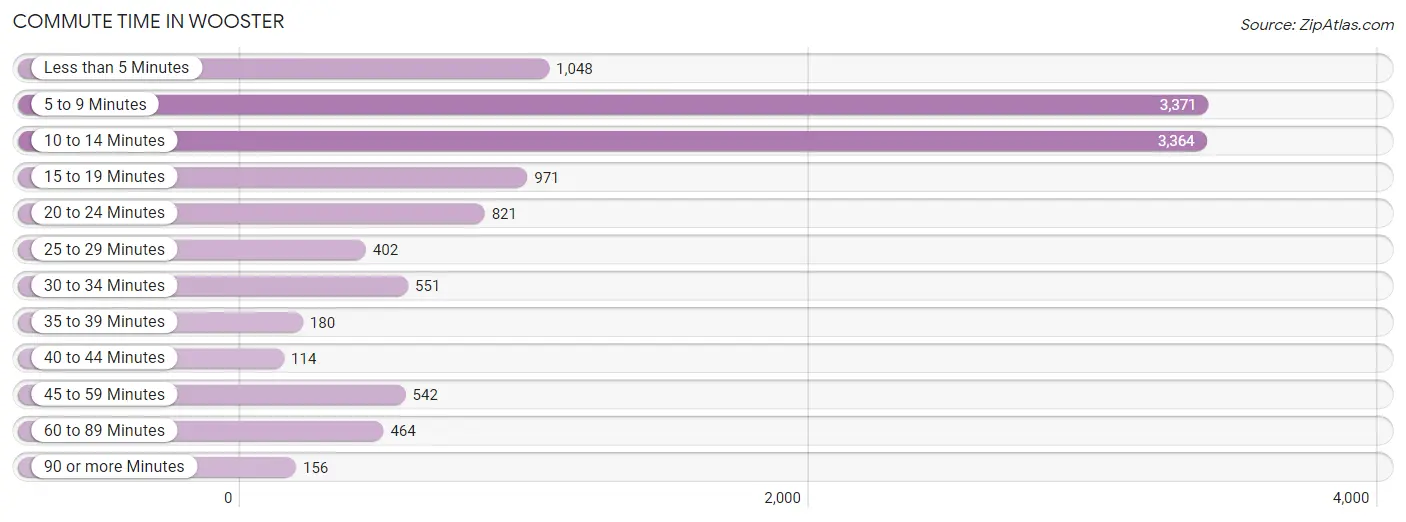
| Commute Time | # Commuters | % Commuters |
| Less than 5 Minutes | 1,048 | 8.7% |
| 5 to 9 Minutes | 3,371 | 28.1% |
| 10 to 14 Minutes | 3,364 | 28.1% |
| 15 to 19 Minutes | 971 | 8.1% |
| 20 to 24 Minutes | 821 | 6.9% |
| 25 to 29 Minutes | 402 | 3.4% |
| 30 to 34 Minutes | 551 | 4.6% |
| 35 to 39 Minutes | 180 | 1.5% |
| 40 to 44 Minutes | 114 | 0.9% |
| 45 to 59 Minutes | 542 | 4.5% |
| 60 to 89 Minutes | 464 | 3.9% |
| 90 or more Minutes | 156 | 1.3% |
Commute Time by Sex in Wooster
The most common commute times in Wooster are 5 to 9 minutes (1,633 commuters, 27.6%) for males and 10 to 14 minutes (1,776 commuters, 29.3%) for females.
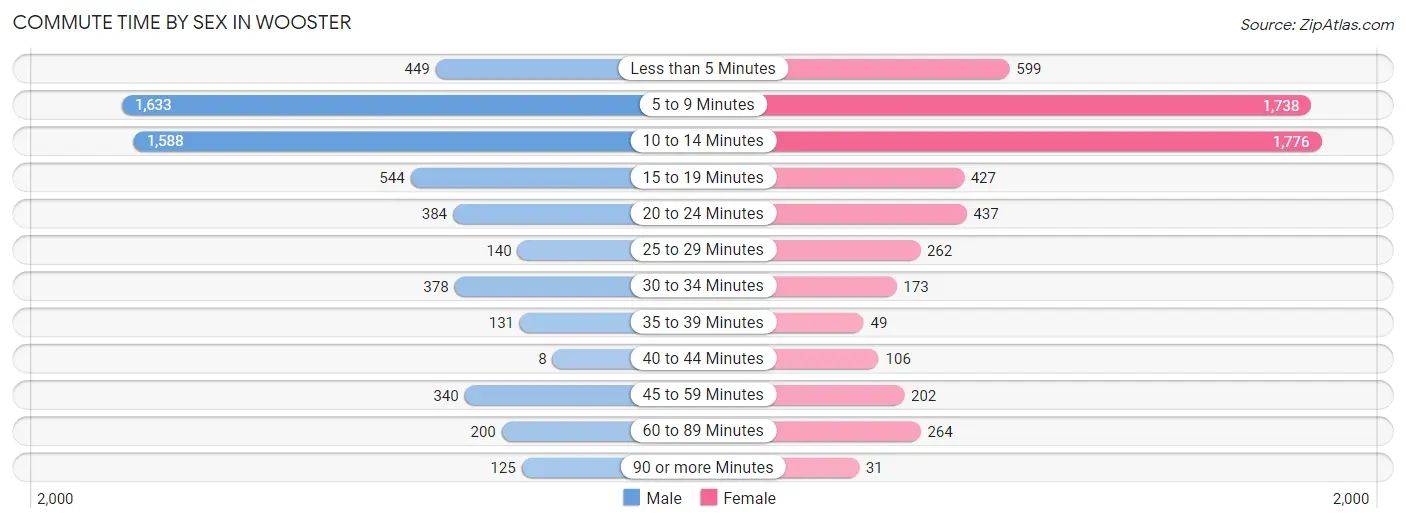
| Commute Time | Male | Female |
| Less than 5 Minutes | 449 (7.6%) | 599 (9.9%) |
| 5 to 9 Minutes | 1,633 (27.6%) | 1,738 (28.7%) |
| 10 to 14 Minutes | 1,588 (26.8%) | 1,776 (29.3%) |
| 15 to 19 Minutes | 544 (9.2%) | 427 (7.0%) |
| 20 to 24 Minutes | 384 (6.5%) | 437 (7.2%) |
| 25 to 29 Minutes | 140 (2.4%) | 262 (4.3%) |
| 30 to 34 Minutes | 378 (6.4%) | 173 (2.9%) |
| 35 to 39 Minutes | 131 (2.2%) | 49 (0.8%) |
| 40 to 44 Minutes | 8 (0.1%) | 106 (1.8%) |
| 45 to 59 Minutes | 340 (5.7%) | 202 (3.3%) |
| 60 to 89 Minutes | 200 (3.4%) | 264 (4.3%) |
| 90 or more Minutes | 125 (2.1%) | 31 (0.5%) |
Time of Departure to Work by Sex in Wooster
The most frequent times of departure to work in Wooster are 7:00 AM to 7:29 AM (1,035, 17.5%) for males and 7:30 AM to 7:59 AM (1,066, 17.6%) for females.
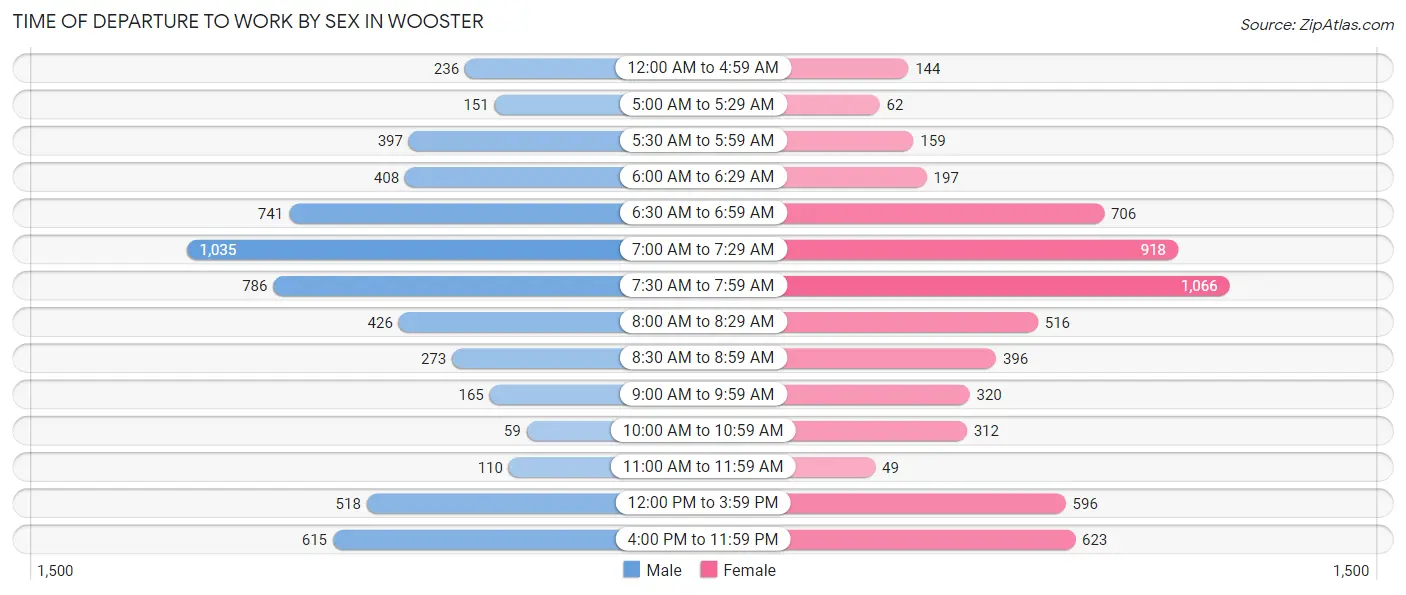
| Time of Departure | Male | Female |
| 12:00 AM to 4:59 AM | 236 (4.0%) | 144 (2.4%) |
| 5:00 AM to 5:29 AM | 151 (2.5%) | 62 (1.0%) |
| 5:30 AM to 5:59 AM | 397 (6.7%) | 159 (2.6%) |
| 6:00 AM to 6:29 AM | 408 (6.9%) | 197 (3.3%) |
| 6:30 AM to 6:59 AM | 741 (12.5%) | 706 (11.6%) |
| 7:00 AM to 7:29 AM | 1,035 (17.5%) | 918 (15.1%) |
| 7:30 AM to 7:59 AM | 786 (13.3%) | 1,066 (17.6%) |
| 8:00 AM to 8:29 AM | 426 (7.2%) | 516 (8.5%) |
| 8:30 AM to 8:59 AM | 273 (4.6%) | 396 (6.5%) |
| 9:00 AM to 9:59 AM | 165 (2.8%) | 320 (5.3%) |
| 10:00 AM to 10:59 AM | 59 (1.0%) | 312 (5.1%) |
| 11:00 AM to 11:59 AM | 110 (1.9%) | 49 (0.8%) |
| 12:00 PM to 3:59 PM | 518 (8.7%) | 596 (9.8%) |
| 4:00 PM to 11:59 PM | 615 (10.4%) | 623 (10.3%) |
| Total | 5,920 (100.0%) | 6,064 (100.0%) |
Housing Occupancy in Wooster
Occupancy by Ownership in Wooster
Of the total 10,969 dwellings in Wooster, owner-occupied units account for 6,746 (61.5%), while renter-occupied units make up 4,223 (38.5%).
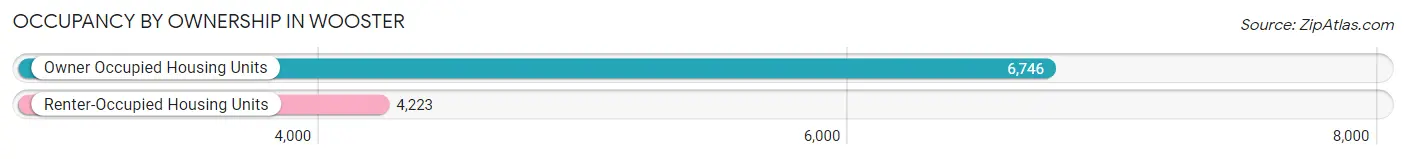
| Occupancy | # Housing Units | % Housing Units |
| Owner Occupied Housing Units | 6,746 | 61.5% |
| Renter-Occupied Housing Units | 4,223 | 38.5% |
| Total Occupied Housing Units | 10,969 | 100.0% |
Occupancy by Household Size in Wooster
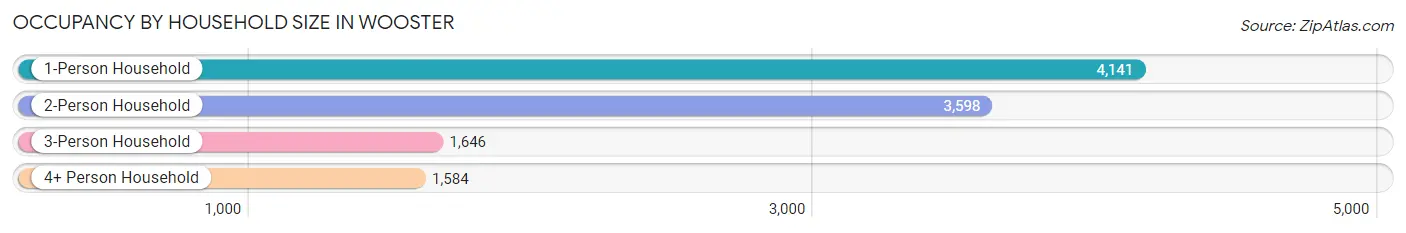
| Household Size | # Housing Units | % Housing Units |
| 1-Person Household | 4,141 | 37.8% |
| 2-Person Household | 3,598 | 32.8% |
| 3-Person Household | 1,646 | 15.0% |
| 4+ Person Household | 1,584 | 14.4% |
| Total Housing Units | 10,969 | 100.0% |
Occupancy by Ownership by Household Size in Wooster
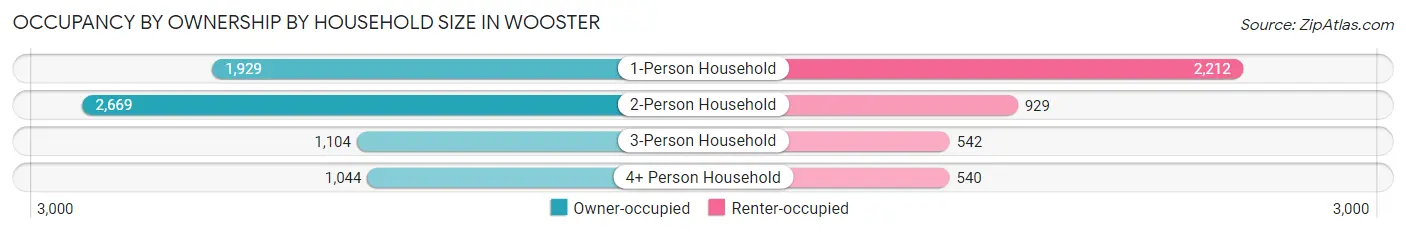
| Household Size | Owner-occupied | Renter-occupied |
| 1-Person Household | 1,929 (46.6%) | 2,212 (53.4%) |
| 2-Person Household | 2,669 (74.2%) | 929 (25.8%) |
| 3-Person Household | 1,104 (67.1%) | 542 (32.9%) |
| 4+ Person Household | 1,044 (65.9%) | 540 (34.1%) |
| Total Housing Units | 6,746 (61.5%) | 4,223 (38.5%) |
Occupancy by Educational Attainment in Wooster
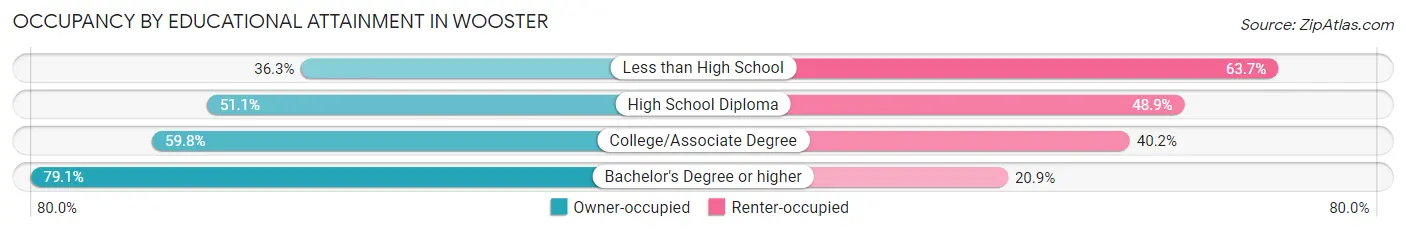
| Household Size | Owner-occupied | Renter-occupied |
| Less than High School | 169 (36.3%) | 297 (63.7%) |
| High School Diploma | 2,139 (51.1%) | 2,046 (48.9%) |
| College/Associate Degree | 1,729 (59.8%) | 1,164 (40.2%) |
| Bachelor's Degree or higher | 2,709 (79.1%) | 716 (20.9%) |
Occupancy by Age of Householder in Wooster
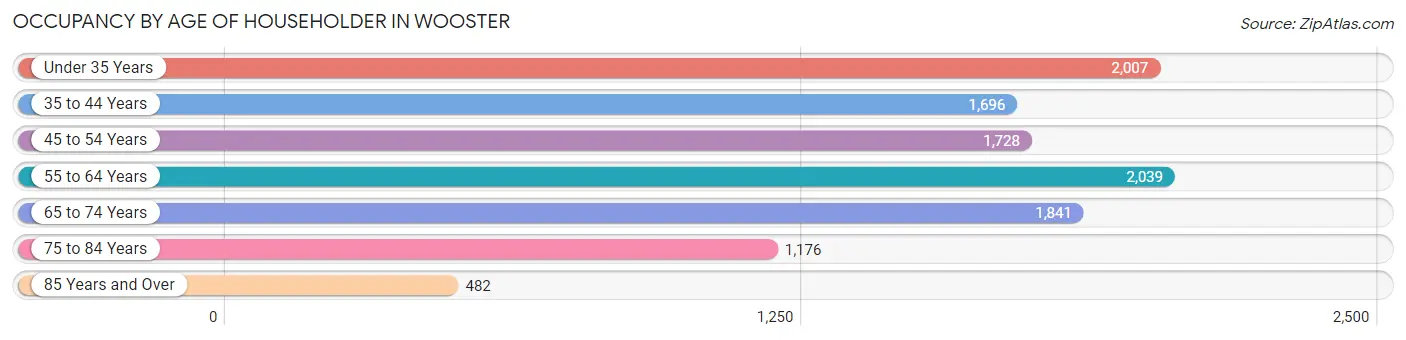
| Age Bracket | # Households | % Households |
| Under 35 Years | 2,007 | 18.3% |
| 35 to 44 Years | 1,696 | 15.5% |
| 45 to 54 Years | 1,728 | 15.8% |
| 55 to 64 Years | 2,039 | 18.6% |
| 65 to 74 Years | 1,841 | 16.8% |
| 75 to 84 Years | 1,176 | 10.7% |
| 85 Years and Over | 482 | 4.4% |
| Total | 10,969 | 100.0% |
Housing Finances in Wooster
Median Income by Occupancy in Wooster
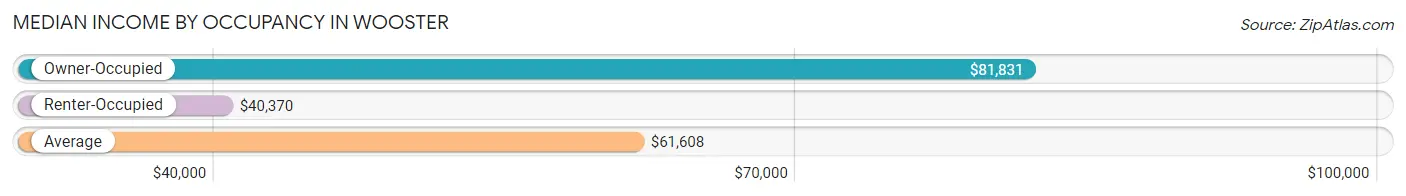
| Occupancy Type | # Households | Median Income |
| Owner-Occupied | 6,746 (61.5%) | $81,831 |
| Renter-Occupied | 4,223 (38.5%) | $40,370 |
| Average | 10,969 (100.0%) | $61,608 |
Occupancy by Householder Income Bracket in Wooster
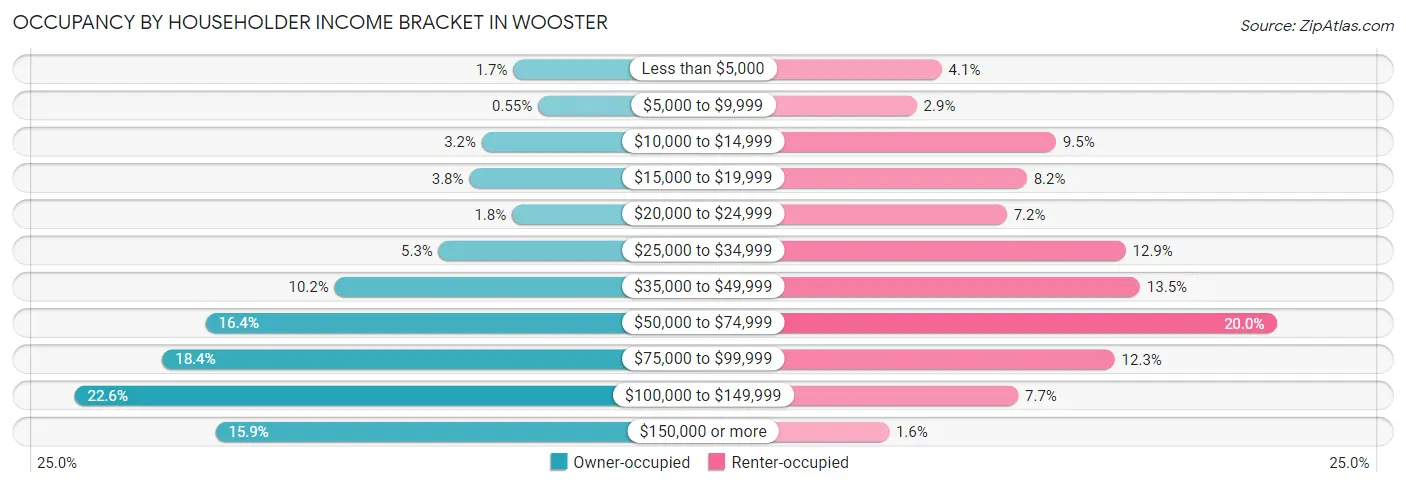
| Income Bracket | Owner-occupied | Renter-occupied |
| Less than $5,000 | 117 (1.7%) | 173 (4.1%) |
| $5,000 to $9,999 | 37 (0.5%) | 123 (2.9%) |
| $10,000 to $14,999 | 218 (3.2%) | 403 (9.5%) |
| $15,000 to $19,999 | 258 (3.8%) | 344 (8.2%) |
| $20,000 to $24,999 | 121 (1.8%) | 304 (7.2%) |
| $25,000 to $34,999 | 356 (5.3%) | 543 (12.9%) |
| $35,000 to $49,999 | 691 (10.2%) | 572 (13.5%) |
| $50,000 to $74,999 | 1,105 (16.4%) | 846 (20.0%) |
| $75,000 to $99,999 | 1,244 (18.4%) | 521 (12.3%) |
| $100,000 to $149,999 | 1,526 (22.6%) | 327 (7.7%) |
| $150,000 or more | 1,073 (15.9%) | 67 (1.6%) |
| Total | 6,746 (100.0%) | 4,223 (100.0%) |
Monthly Housing Cost Tiers in Wooster
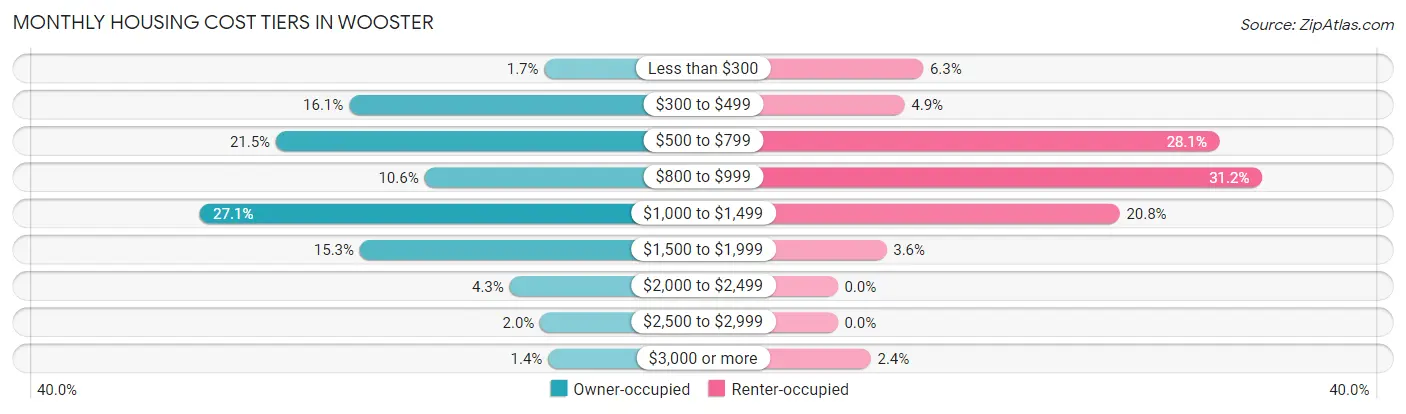
| Monthly Cost | Owner-occupied | Renter-occupied |
| Less than $300 | 116 (1.7%) | 266 (6.3%) |
| $300 to $499 | 1,086 (16.1%) | 208 (4.9%) |
| $500 to $799 | 1,450 (21.5%) | 1,186 (28.1%) |
| $800 to $999 | 712 (10.5%) | 1,318 (31.2%) |
| $1,000 to $1,499 | 1,826 (27.1%) | 877 (20.8%) |
| $1,500 to $1,999 | 1,033 (15.3%) | 152 (3.6%) |
| $2,000 to $2,499 | 289 (4.3%) | 0 (0.0%) |
| $2,500 to $2,999 | 137 (2.0%) | 0 (0.0%) |
| $3,000 or more | 97 (1.4%) | 103 (2.4%) |
| Total | 6,746 (100.0%) | 4,223 (100.0%) |
Physical Housing Characteristics in Wooster
Housing Structures in Wooster
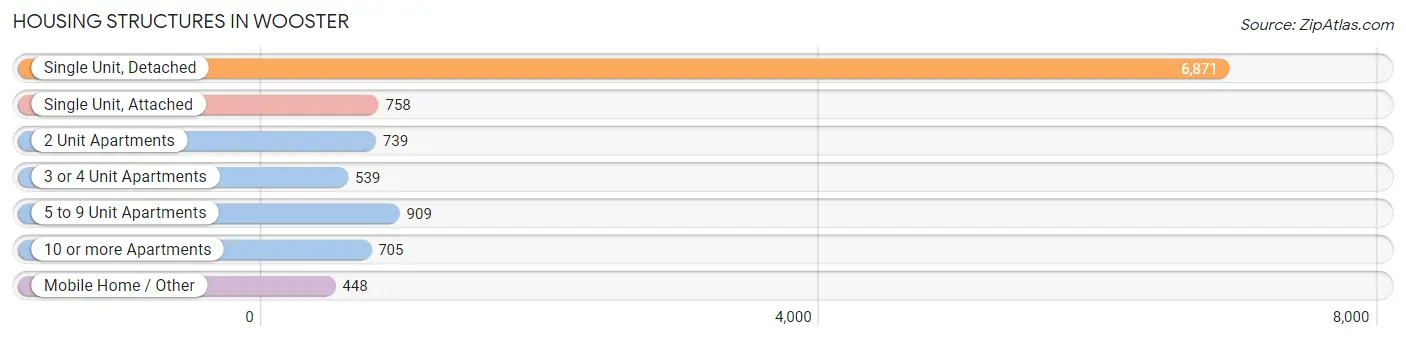
| Structure Type | # Housing Units | % Housing Units |
| Single Unit, Detached | 6,871 | 62.6% |
| Single Unit, Attached | 758 | 6.9% |
| 2 Unit Apartments | 739 | 6.7% |
| 3 or 4 Unit Apartments | 539 | 4.9% |
| 5 to 9 Unit Apartments | 909 | 8.3% |
| 10 or more Apartments | 705 | 6.4% |
| Mobile Home / Other | 448 | 4.1% |
| Total | 10,969 | 100.0% |
Housing Structures by Occupancy in Wooster
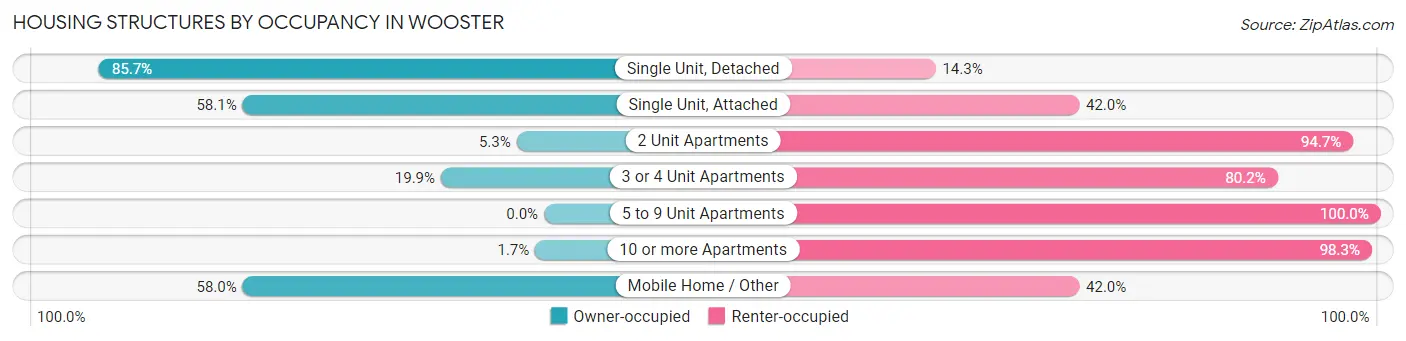
| Structure Type | Owner-occupied | Renter-occupied |
| Single Unit, Detached | 5,888 (85.7%) | 983 (14.3%) |
| Single Unit, Attached | 440 (58.1%) | 318 (41.9%) |
| 2 Unit Apartments | 39 (5.3%) | 700 (94.7%) |
| 3 or 4 Unit Apartments | 107 (19.9%) | 432 (80.1%) |
| 5 to 9 Unit Apartments | 0 (0.0%) | 909 (100.0%) |
| 10 or more Apartments | 12 (1.7%) | 693 (98.3%) |
| Mobile Home / Other | 260 (58.0%) | 188 (42.0%) |
| Total | 6,746 (61.5%) | 4,223 (38.5%) |
Housing Structures by Number of Rooms in Wooster
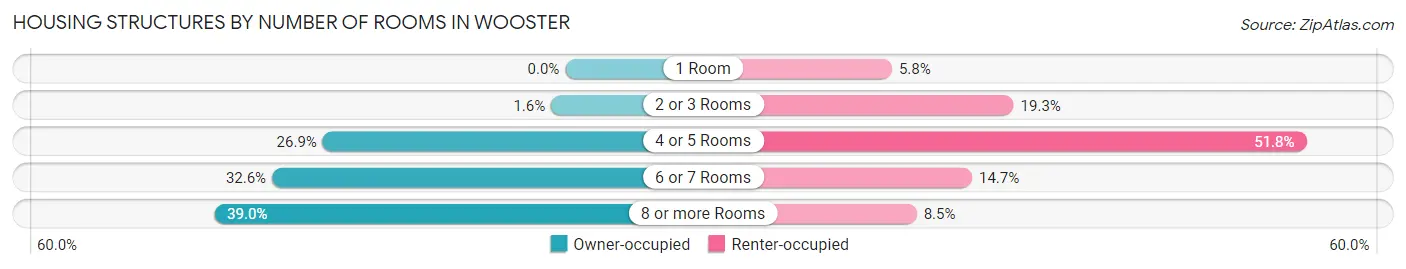
| Number of Rooms | Owner-occupied | Renter-occupied |
| 1 Room | 0 (0.0%) | 244 (5.8%) |
| 2 or 3 Rooms | 106 (1.6%) | 814 (19.3%) |
| 4 or 5 Rooms | 1,816 (26.9%) | 2,186 (51.8%) |
| 6 or 7 Rooms | 2,196 (32.6%) | 619 (14.7%) |
| 8 or more Rooms | 2,628 (39.0%) | 360 (8.5%) |
| Total | 6,746 (100.0%) | 4,223 (100.0%) |
Housing Structure by Heating Type in Wooster
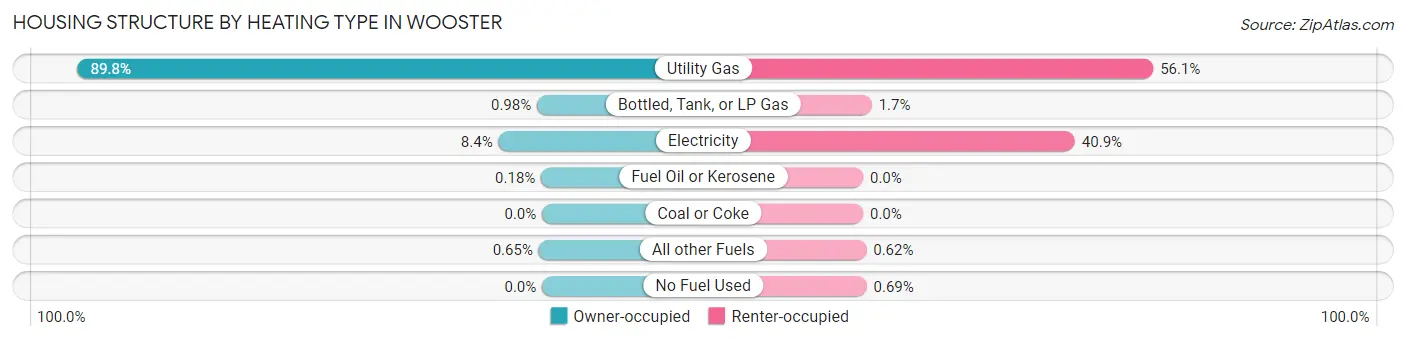
| Heating Type | Owner-occupied | Renter-occupied |
| Utility Gas | 6,055 (89.8%) | 2,368 (56.1%) |
| Bottled, Tank, or LP Gas | 66 (1.0%) | 71 (1.7%) |
| Electricity | 569 (8.4%) | 1,729 (40.9%) |
| Fuel Oil or Kerosene | 12 (0.2%) | 0 (0.0%) |
| Coal or Coke | 0 (0.0%) | 0 (0.0%) |
| All other Fuels | 44 (0.6%) | 26 (0.6%) |
| No Fuel Used | 0 (0.0%) | 29 (0.7%) |
| Total | 6,746 (100.0%) | 4,223 (100.0%) |
Household Vehicle Usage in Wooster
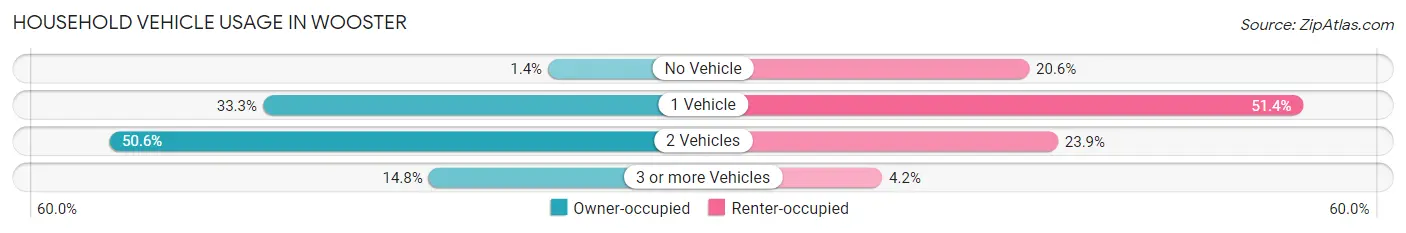
| Vehicles per Household | Owner-occupied | Renter-occupied |
| No Vehicle | 93 (1.4%) | 871 (20.6%) |
| 1 Vehicle | 2,248 (33.3%) | 2,169 (51.4%) |
| 2 Vehicles | 3,410 (50.5%) | 1,007 (23.8%) |
| 3 or more Vehicles | 995 (14.7%) | 176 (4.2%) |
| Total | 6,746 (100.0%) | 4,223 (100.0%) |
Real Estate & Mortgages in Wooster
Real Estate and Mortgage Overview in Wooster
| Characteristic | Without Mortgage | With Mortgage |
| Housing Units | 2,811 | 3,935 |
| Median Property Value | $178,600 | $190,200 |
| Median Household Income | $60,058 | $786 |
| Monthly Housing Costs | $545 | $97 |
| Real Estate Taxes | $2,353 | $58 |
Property Value by Mortgage Status in Wooster
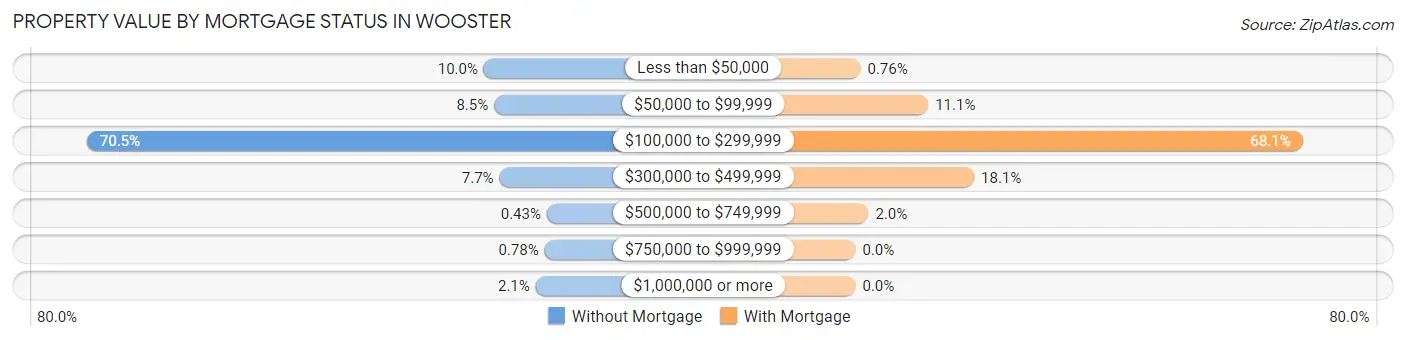
| Property Value | Without Mortgage | With Mortgage |
| Less than $50,000 | 282 (10.0%) | 30 (0.8%) |
| $50,000 to $99,999 | 238 (8.5%) | 436 (11.1%) |
| $100,000 to $299,999 | 1,982 (70.5%) | 2,680 (68.1%) |
| $300,000 to $499,999 | 215 (7.6%) | 711 (18.1%) |
| $500,000 to $749,999 | 12 (0.4%) | 78 (2.0%) |
| $750,000 to $999,999 | 22 (0.8%) | 0 (0.0%) |
| $1,000,000 or more | 60 (2.1%) | 0 (0.0%) |
| Total | 2,811 (100.0%) | 3,935 (100.0%) |
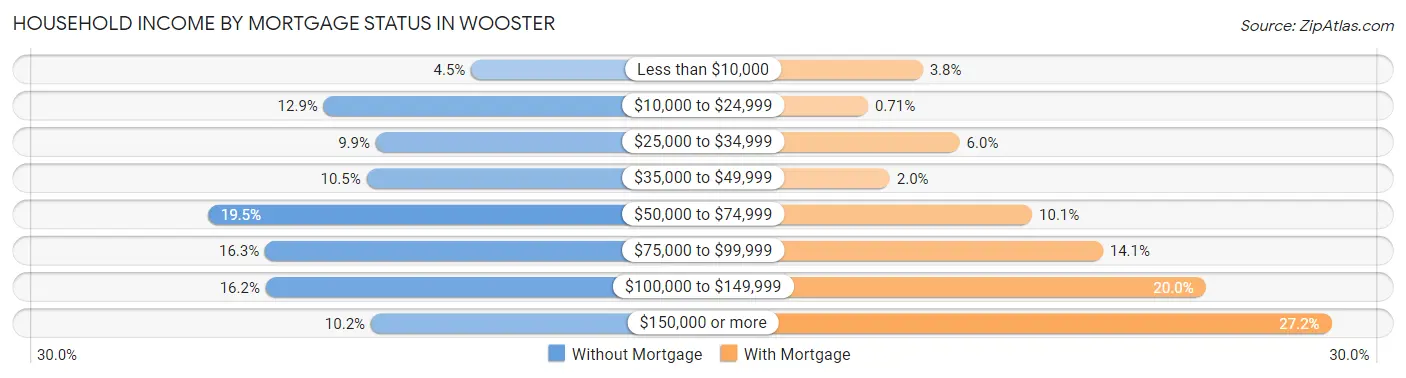
Household Income by Mortgage Status in Wooster
| Household Income | Without Mortgage | With Mortgage |
| Less than $10,000 | 126 (4.5%) | 151 (3.8%) |
| $10,000 to $24,999 | 363 (12.9%) | 28 (0.7%) |
| $25,000 to $34,999 | 279 (9.9%) | 234 (5.9%) |
| $35,000 to $49,999 | 294 (10.5%) | 77 (2.0%) |
| $50,000 to $74,999 | 549 (19.5%) | 397 (10.1%) |
| $75,000 to $99,999 | 457 (16.3%) | 556 (14.1%) |
| $100,000 to $149,999 | 456 (16.2%) | 787 (20.0%) |
| $150,000 or more | 287 (10.2%) | 1,070 (27.2%) |
| Total | 2,811 (100.0%) | 3,935 (100.0%) |
Property Value to Household Income Ratio in Wooster
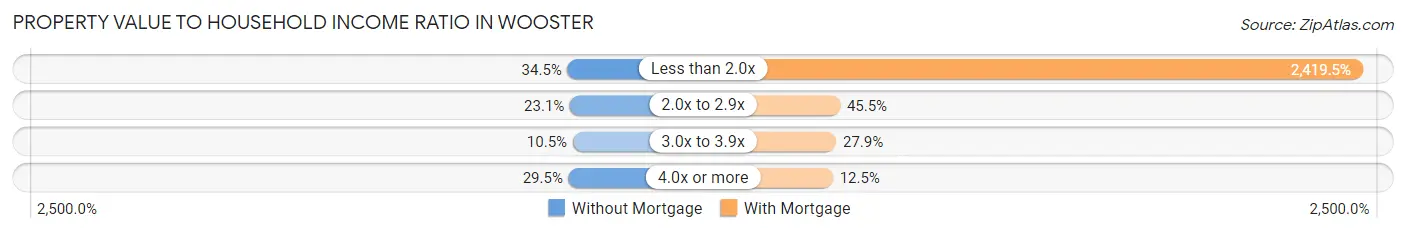
| Value-to-Income Ratio | Without Mortgage | With Mortgage |
| Less than 2.0x | 969 (34.5%) | 95,206 (2,419.5%) |
| 2.0x to 2.9x | 648 (23.1%) | 1,790 (45.5%) |
| 3.0x to 3.9x | 296 (10.5%) | 1,097 (27.9%) |
| 4.0x or more | 829 (29.5%) | 493 (12.5%) |
| Total | 2,811 (100.0%) | 3,935 (100.0%) |
Real Estate Taxes by Mortgage Status in Wooster
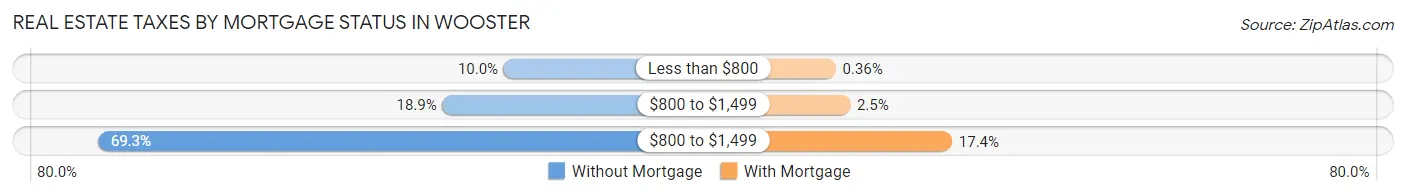
| Property Taxes | Without Mortgage | With Mortgage |
| Less than $800 | 280 (10.0%) | 14 (0.4%) |
| $800 to $1,499 | 532 (18.9%) | 97 (2.5%) |
| $800 to $1,499 | 1,948 (69.3%) | 683 (17.4%) |
| Total | 2,811 (100.0%) | 3,935 (100.0%) |
Health & Disability in Wooster
Health Insurance Coverage by Age in Wooster
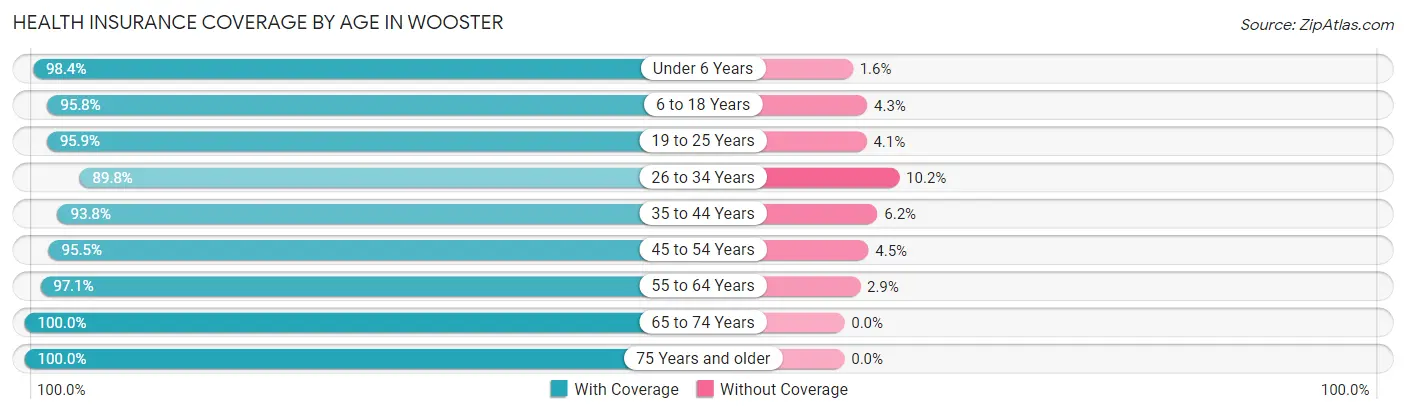
| Age Bracket | With Coverage | Without Coverage |
| Under 6 Years | 1,444 (98.4%) | 23 (1.6%) |
| 6 to 18 Years | 3,718 (95.8%) | 165 (4.3%) |
| 19 to 25 Years | 4,044 (95.9%) | 174 (4.1%) |
| 26 to 34 Years | 2,518 (89.8%) | 287 (10.2%) |
| 35 to 44 Years | 2,667 (93.8%) | 175 (6.2%) |
| 45 to 54 Years | 3,047 (95.5%) | 143 (4.5%) |
| 55 to 64 Years | 3,243 (97.1%) | 98 (2.9%) |
| 65 to 74 Years | 2,828 (100.0%) | 0 (0.0%) |
| 75 Years and older | 2,122 (100.0%) | 0 (0.0%) |
| Total | 25,631 (96.0%) | 1,065 (4.0%) |
Health Insurance Coverage by Citizenship Status in Wooster
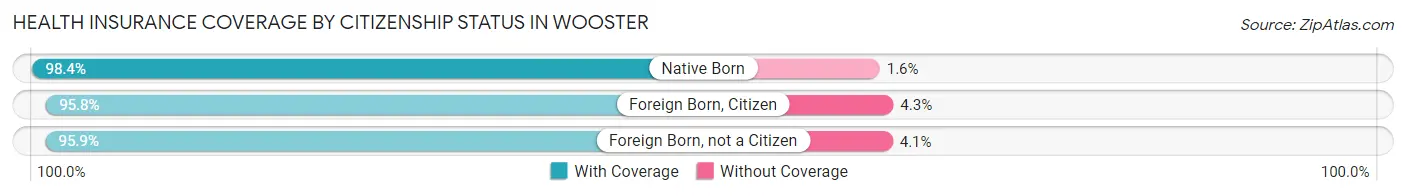
| Citizenship Status | With Coverage | Without Coverage |
| Native Born | 1,444 (98.4%) | 23 (1.6%) |
| Foreign Born, Citizen | 3,718 (95.8%) | 165 (4.3%) |
| Foreign Born, not a Citizen | 4,044 (95.9%) | 174 (4.1%) |
Health Insurance Coverage by Household Income in Wooster
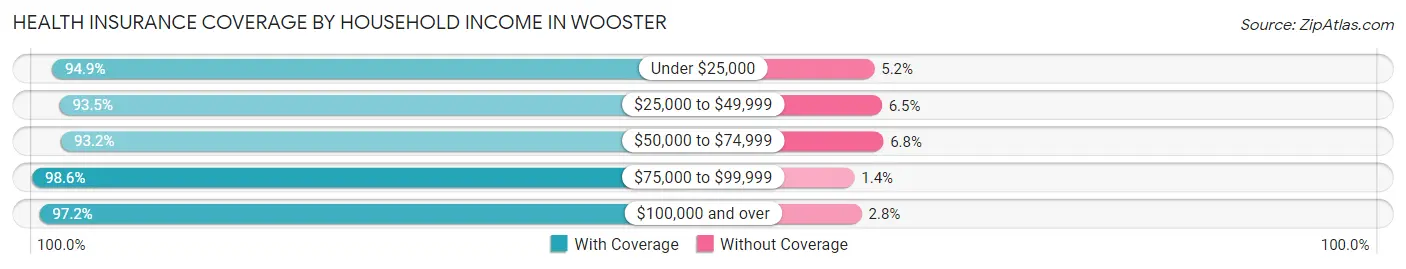
| Household Income | With Coverage | Without Coverage |
| Under $25,000 | 2,374 (94.9%) | 129 (5.1%) |
| $25,000 to $49,999 | 3,687 (93.5%) | 258 (6.5%) |
| $50,000 to $74,999 | 4,253 (93.2%) | 312 (6.8%) |
| $75,000 to $99,999 | 4,277 (98.6%) | 61 (1.4%) |
| $100,000 and over | 8,074 (97.2%) | 231 (2.8%) |
Public vs Private Health Insurance Coverage by Age in Wooster
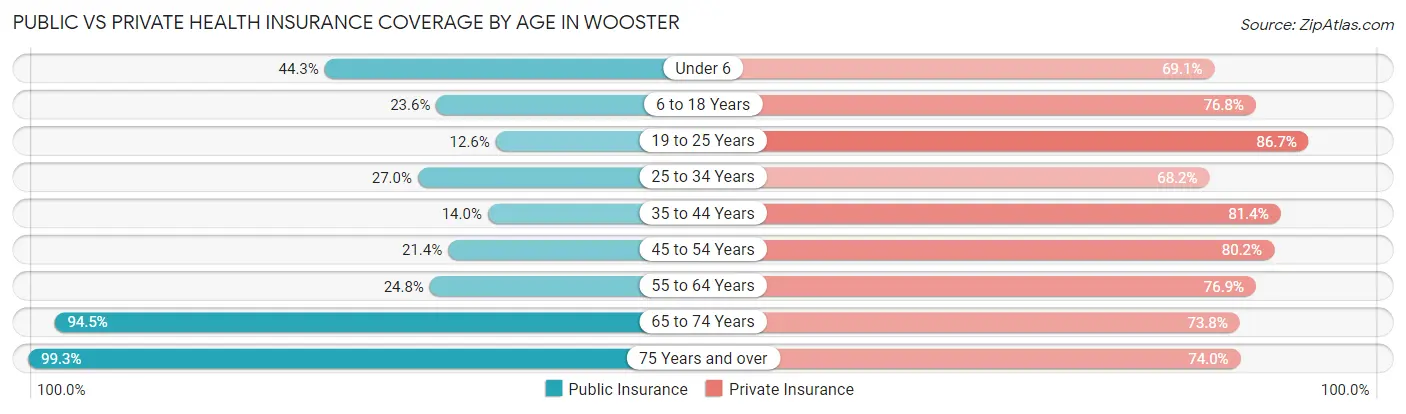
| Age Bracket | Public Insurance | Private Insurance |
| Under 6 | 650 (44.3%) | 1,014 (69.1%) |
| 6 to 18 Years | 916 (23.6%) | 2,983 (76.8%) |
| 19 to 25 Years | 530 (12.6%) | 3,655 (86.7%) |
| 25 to 34 Years | 758 (27.0%) | 1,913 (68.2%) |
| 35 to 44 Years | 399 (14.0%) | 2,314 (81.4%) |
| 45 to 54 Years | 683 (21.4%) | 2,558 (80.2%) |
| 55 to 64 Years | 829 (24.8%) | 2,568 (76.9%) |
| 65 to 74 Years | 2,671 (94.5%) | 2,088 (73.8%) |
| 75 Years and over | 2,108 (99.3%) | 1,570 (74.0%) |
| Total | 9,544 (35.7%) | 20,663 (77.4%) |
Disability Status by Sex by Age in Wooster
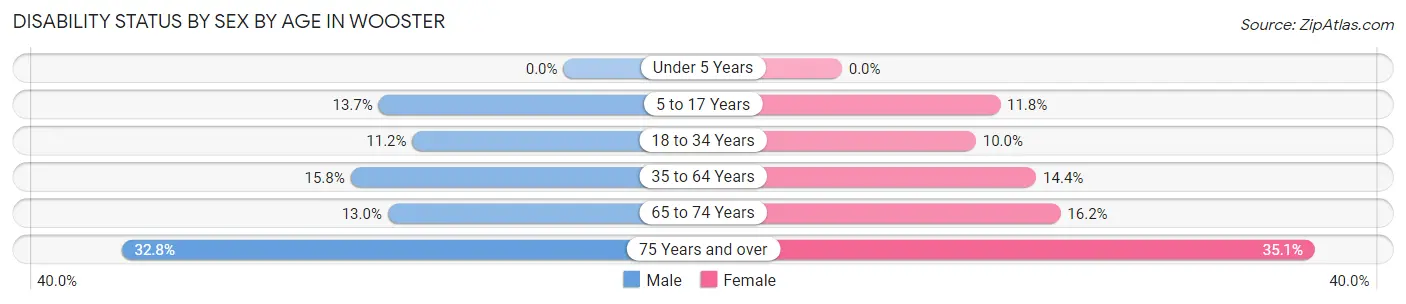
| Age Bracket | Male | Female |
| Under 5 Years | 0 (0.0%) | 0 (0.0%) |
| 5 to 17 Years | 223 (13.7%) | 216 (11.7%) |
| 18 to 34 Years | 397 (11.2%) | 405 (10.0%) |
| 35 to 64 Years | 731 (15.8%) | 685 (14.4%) |
| 65 to 74 Years | 143 (13.0%) | 281 (16.2%) |
| 75 Years and over | 286 (32.8%) | 439 (35.1%) |
Disability Class by Sex by Age in Wooster
Disability Class: Hearing Difficulty
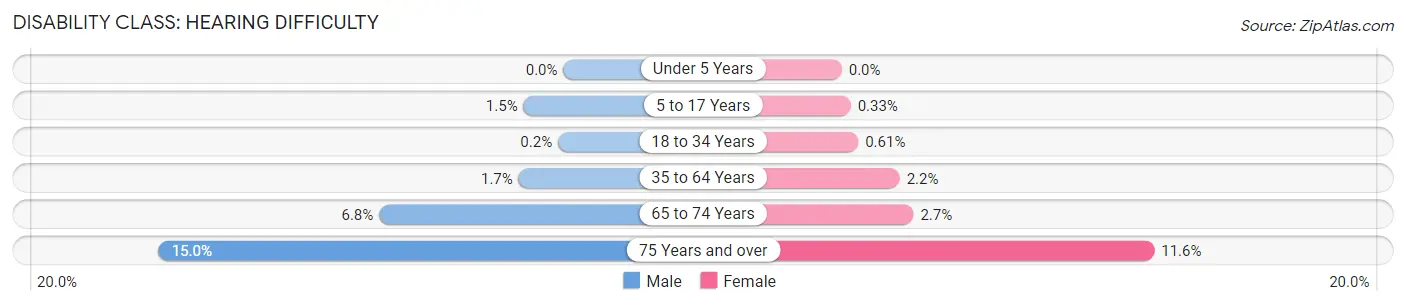
| Age Bracket | Male | Female |
| Under 5 Years | 0 (0.0%) | 0 (0.0%) |
| 5 to 17 Years | 24 (1.5%) | 6 (0.3%) |
| 18 to 34 Years | 7 (0.2%) | 25 (0.6%) |
| 35 to 64 Years | 77 (1.7%) | 102 (2.1%) |
| 65 to 74 Years | 75 (6.8%) | 46 (2.7%) |
| 75 Years and over | 131 (15.0%) | 145 (11.6%) |
Disability Class: Vision Difficulty
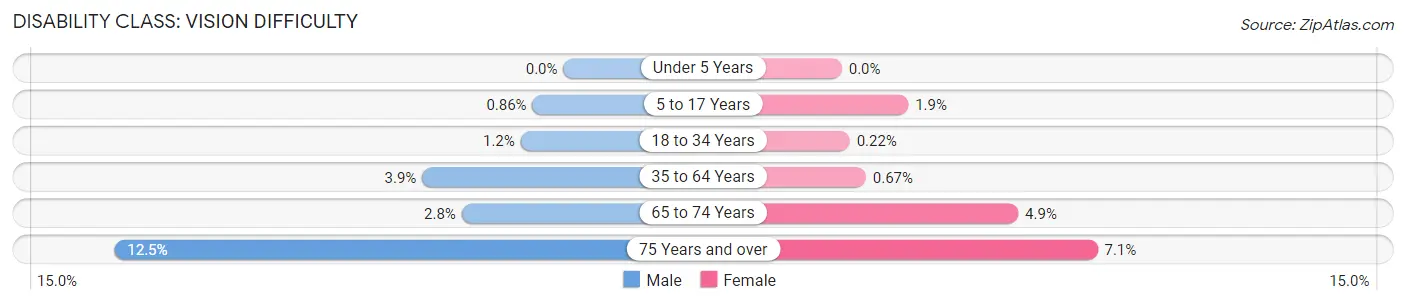
| Age Bracket | Male | Female |
| Under 5 Years | 0 (0.0%) | 0 (0.0%) |
| 5 to 17 Years | 14 (0.9%) | 34 (1.8%) |
| 18 to 34 Years | 42 (1.2%) | 9 (0.2%) |
| 35 to 64 Years | 182 (3.9%) | 32 (0.7%) |
| 65 to 74 Years | 31 (2.8%) | 85 (4.9%) |
| 75 Years and over | 109 (12.5%) | 89 (7.1%) |
Disability Class: Cognitive Difficulty
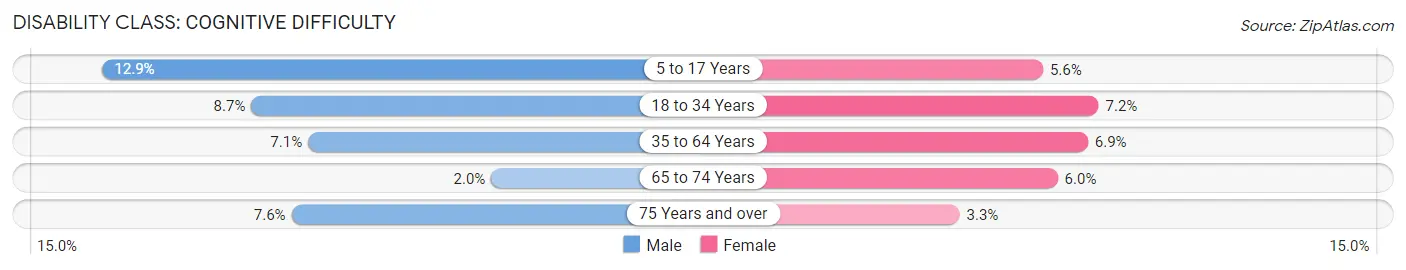
| Age Bracket | Male | Female |
| 5 to 17 Years | 209 (12.9%) | 103 (5.6%) |
| 18 to 34 Years | 308 (8.7%) | 291 (7.1%) |
| 35 to 64 Years | 329 (7.1%) | 325 (6.9%) |
| 65 to 74 Years | 22 (2.0%) | 104 (6.0%) |
| 75 Years and over | 66 (7.6%) | 41 (3.3%) |
Disability Class: Ambulatory Difficulty
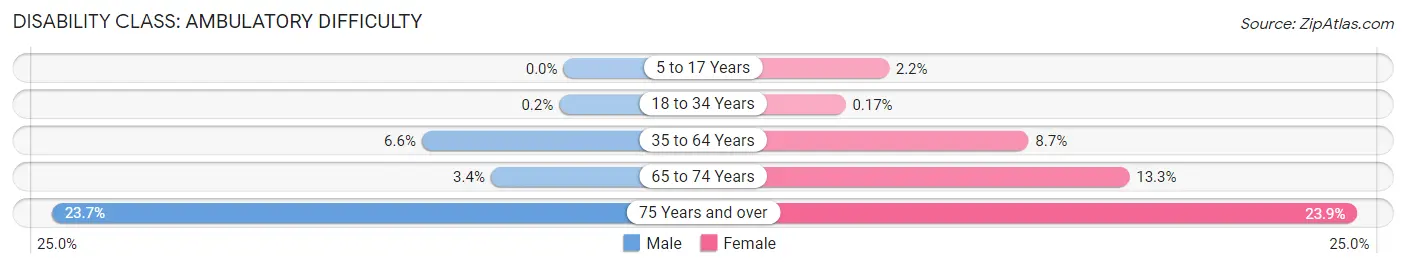
| Age Bracket | Male | Female |
| 5 to 17 Years | 0 (0.0%) | 40 (2.2%) |
| 18 to 34 Years | 7 (0.2%) | 7 (0.2%) |
| 35 to 64 Years | 304 (6.6%) | 411 (8.7%) |
| 65 to 74 Years | 37 (3.4%) | 231 (13.3%) |
| 75 Years and over | 207 (23.7%) | 299 (23.9%) |
Disability Class: Self-Care Difficulty
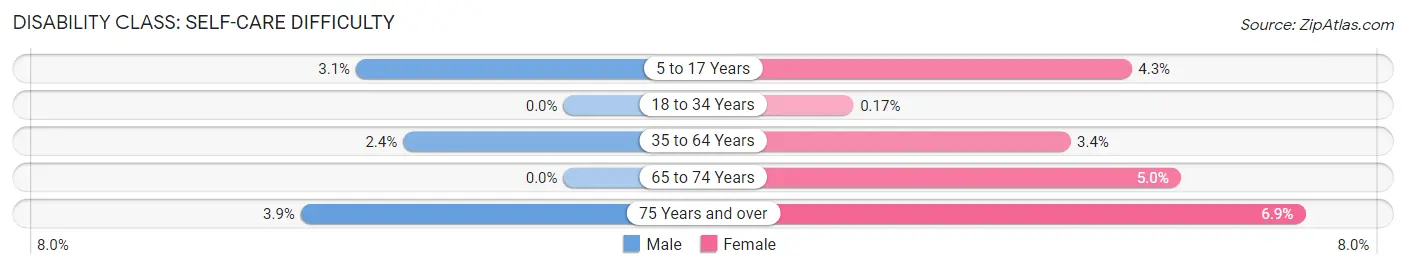
| Age Bracket | Male | Female |
| 5 to 17 Years | 50 (3.1%) | 79 (4.3%) |
| 18 to 34 Years | 0 (0.0%) | 7 (0.2%) |
| 35 to 64 Years | 110 (2.4%) | 161 (3.4%) |
| 65 to 74 Years | 0 (0.0%) | 87 (5.0%) |
| 75 Years and over | 34 (3.9%) | 86 (6.9%) |
Technology Access in Wooster
Computing Device Access in Wooster
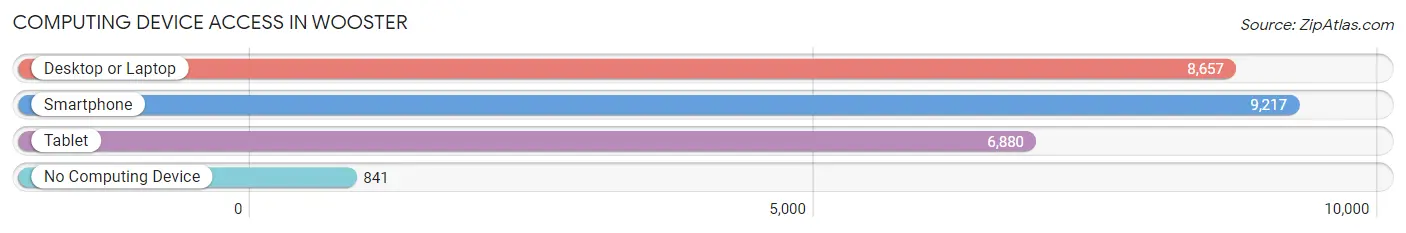
| Device Type | # Households | % Households |
| Desktop or Laptop | 8,657 | 78.9% |
| Smartphone | 9,217 | 84.0% |
| Tablet | 6,880 | 62.7% |
| No Computing Device | 841 | 7.7% |
| Total | 10,969 | 100.0% |
Internet Access in Wooster
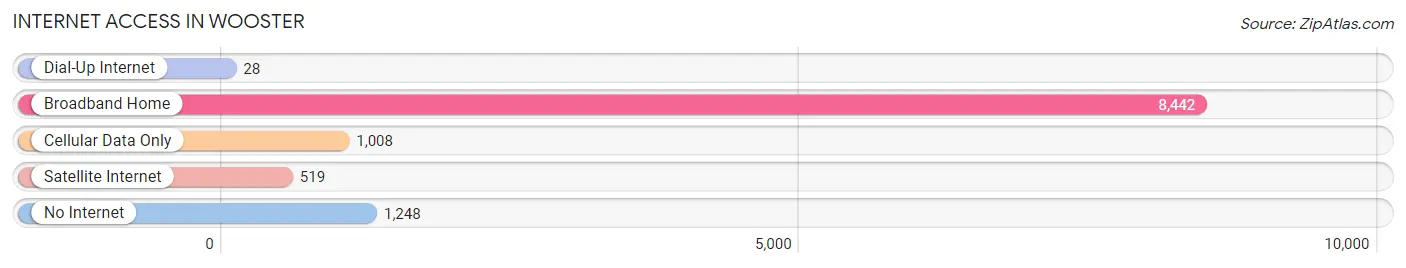
| Internet Type | # Households | % Households |
| Dial-Up Internet | 28 | 0.3% |
| Broadband Home | 8,442 | 77.0% |
| Cellular Data Only | 1,008 | 9.2% |
| Satellite Internet | 519 | 4.7% |
| No Internet | 1,248 | 11.4% |
| Total | 10,969 | 100.0% |
Wooster Summary
Wooster, Ohio is a city located in Wayne County in the state of Ohio. It is the county seat of Wayne County and is located approximately 50 miles southwest of Cleveland. The city has a population of approximately 26,000 people and is the home of the College of Wooster.
History
Wooster was founded in 1808 by John Bever, a Revolutionary War veteran. The city was named after David Wooster, a general in the Revolutionary War. The city was incorporated in 1817 and was the first county seat of Wayne County.
In the early 19th century, Wooster was a major stop on the Underground Railroad. The city was also a major center for the abolitionist movement. In 1835, the first anti-slavery society in Ohio was formed in Wooster.
Geography
Wooster is located in the northeastern part of Ohio, approximately 50 miles southwest of Cleveland. The city is situated in the rolling hills of the Allegheny Plateau. The city is located on the banks of the Killbuck Creek, a tributary of the Tuscarawas River.
The city has a total area of 8.7 square miles, of which 8.6 square miles is land and 0.1 square miles is water. The city is located at an elevation of 1,068 feet above sea level.
Economy
Wooster’s economy is largely based on agriculture and manufacturing. The city is home to several large agricultural companies, including The J.M. Smucker Company, which produces jams and jellies, and The Wooster Brush Company, which produces paint brushes and other painting supplies.
Wooster is also home to several manufacturing companies, including The Wooster Motor Company, which produces automotive parts, and The Wooster Foundry, which produces cast iron products.
Demographics
As of the 2010 census, the population of Wooster was 26,119. The racial makeup of the city was 90.2% White, 4.3% African American, 0.4% Native American, 1.2% Asian, 0.1% Pacific Islander, 1.7% from other races, and 2.1% from two or more races. Hispanic or Latino of any race were 4.2% of the population.
The median income for a household in Wooster was $41,945, and the median income for a family was $51,945. The per capita income for the city was $20,945. About 11.2% of families and 14.2% of the population were below the poverty line, including 19.2% of those under age 18 and 8.2% of those age 65 or over.
Common Questions
What is Per Capita Income in Wooster?
Per Capita income in Wooster is $32,296.
What is the Median Family Income in Wooster?
Median Family Income in Wooster is $82,139.
What is the Median Household income in Wooster?
Median Household Income in Wooster is $61,608.
What is Income or Wage Gap in Wooster?
Income or Wage Gap in Wooster is 46.8%.
Women in Wooster earn 53.2 cents for every dollar earned by a man.
What is Inequality or Gini Index in Wooster?
Inequality or Gini Index in Wooster is 0.42.
What is the Total Population of Wooster?
Total Population of Wooster is 27,021.
What is the Total Male Population of Wooster?
Total Male Population of Wooster is 12,566.
What is the Total Female Population of Wooster?
Total Female Population of Wooster is 14,455.
What is the Ratio of Males per 100 Females in Wooster?
There are 86.93 Males per 100 Females in Wooster.
What is the Ratio of Females per 100 Males in Wooster?
There are 115.03 Females per 100 Males in Wooster.
What is the Median Population Age in Wooster?
Median Population Age in Wooster is 38.7 Years.
What is the Average Family Size in Wooster
Average Family Size in Wooster is 2.8 People.
What is the Average Household Size in Wooster
Average Household Size in Wooster is 2.2 People.
How Large is the Labor Force in Wooster?
There are 14,219 People in the Labor Forcein in Wooster.
What is the Percentage of People in the Labor Force in Wooster?
62.3% of People are in the Labor Force in Wooster.
What is the Unemployment Rate in Wooster?
Unemployment Rate in Wooster is 4.6%.