Canton, OH Map & Demographics
Canton Map
Canton Overview
$22,649
PER CAPITA INCOME
$48,791
AVG FAMILY INCOME
$37,627
AVG HOUSEHOLD INCOME
15.9%
WAGE / INCOME GAP [ % ]
84.1¢/ $1
WAGE / INCOME GAP [ $ ]
$11,589
FAMILY INCOME DEFICIT
0.46
INEQUALITY / GINI INDEX
70,589
TOTAL POPULATION
34,330
MALE POPULATION
36,259
FEMALE POPULATION
94.68
MALES / 100 FEMALES
105.62
FEMALES / 100 MALES
36.1
MEDIAN AGE
3.0
AVG FAMILY SIZE
2.2
AVG HOUSEHOLD SIZE
31,887
LABOR FORCE [ PEOPLE ]
58.2%
PERCENT IN LABOR FORCE
9.0%
UNEMPLOYMENT RATE
Income in Canton
Income Overview in Canton
Per Capita Income in Canton is $22,649, while median incomes of families and households are $48,791 and $37,627 respectively.
| Characteristic | Number | Measure |
| Per Capita Income | 70,589 | $22,649 |
| Median Family Income | 15,954 | $48,791 |
| Mean Family Income | 15,954 | $61,395 |
| Median Household Income | 30,466 | $37,627 |
| Mean Household Income | 30,466 | $50,838 |
| Income Deficit | 15,954 | $11,589 |
| Wage / Income Gap (%) | 70,589 | 15.91% |
| Wage / Income Gap ($) | 70,589 | 84.09¢ per $1 |
| Gini / Inequality Index | 70,589 | 0.46 |
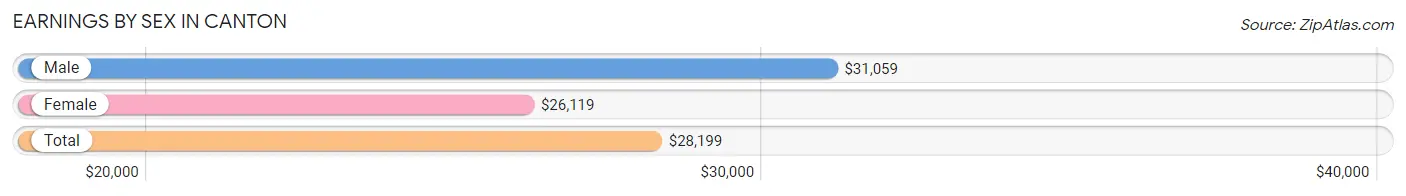
Earnings by Sex in Canton
Average Earnings in Canton are $28,199, $31,059 for men and $26,119 for women, a difference of 15.9%.
| Sex | Number | Average Earnings |
| Male | 16,306 (48.6%) | $31,059 |
| Female | 17,235 (51.4%) | $26,119 |
| Total | 33,541 (100.0%) | $28,199 |
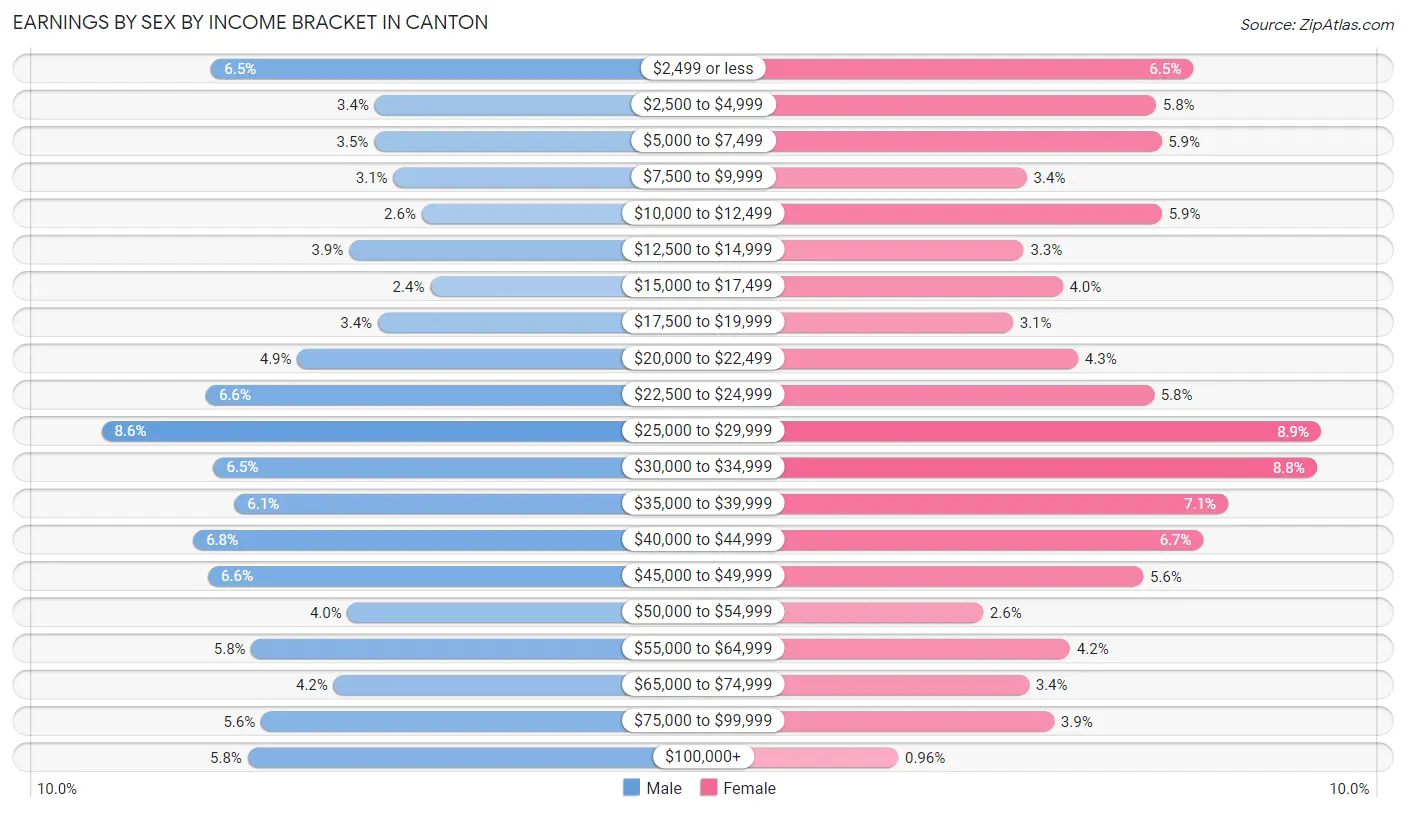
Earnings by Sex by Income Bracket in Canton
The most common earnings brackets in Canton are $25,000 to $29,999 for men (1,395 | 8.6%) and $25,000 to $29,999 for women (1,531 | 8.9%).
| Income | Male | Female |
| $2,499 or less | 1,060 (6.5%) | 1,118 (6.5%) |
| $2,500 to $4,999 | 561 (3.4%) | 998 (5.8%) |
| $5,000 to $7,499 | 562 (3.5%) | 1,015 (5.9%) |
| $7,500 to $9,999 | 504 (3.1%) | 580 (3.4%) |
| $10,000 to $12,499 | 417 (2.6%) | 1,017 (5.9%) |
| $12,500 to $14,999 | 640 (3.9%) | 570 (3.3%) |
| $15,000 to $17,499 | 391 (2.4%) | 697 (4.0%) |
| $17,500 to $19,999 | 551 (3.4%) | 536 (3.1%) |
| $20,000 to $22,499 | 797 (4.9%) | 746 (4.3%) |
| $22,500 to $24,999 | 1,076 (6.6%) | 991 (5.8%) |
| $25,000 to $29,999 | 1,395 (8.6%) | 1,531 (8.9%) |
| $30,000 to $34,999 | 1,053 (6.5%) | 1,516 (8.8%) |
| $35,000 to $39,999 | 989 (6.1%) | 1,230 (7.1%) |
| $40,000 to $44,999 | 1,115 (6.8%) | 1,152 (6.7%) |
| $45,000 to $49,999 | 1,069 (6.6%) | 956 (5.6%) |
| $50,000 to $54,999 | 644 (4.0%) | 439 (2.5%) |
| $55,000 to $64,999 | 938 (5.8%) | 721 (4.2%) |
| $65,000 to $74,999 | 687 (4.2%) | 588 (3.4%) |
| $75,000 to $99,999 | 908 (5.6%) | 669 (3.9%) |
| $100,000+ | 949 (5.8%) | 165 (1.0%) |
| Total | 16,306 (100.0%) | 17,235 (100.0%) |
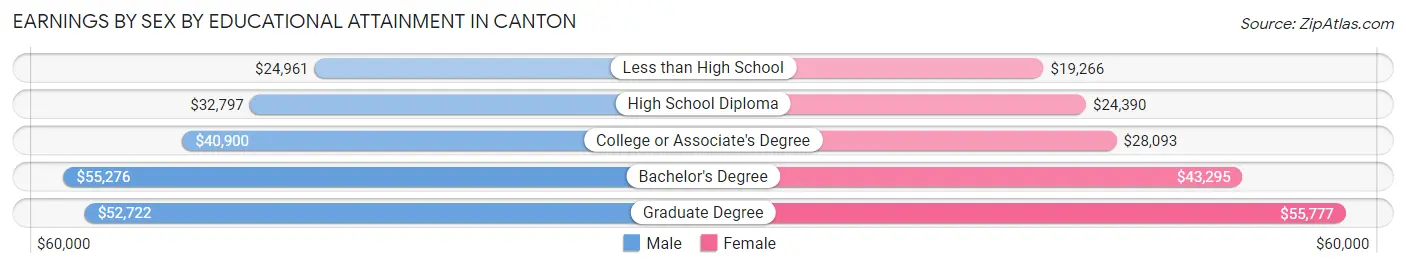
Earnings by Sex by Educational Attainment in Canton
Average earnings in Canton are $36,092 for men and $29,300 for women, a difference of 18.8%. Men with an educational attainment of bachelor's degree enjoy the highest average annual earnings of $55,276, while those with less than high school education earn the least with $24,961. Women with an educational attainment of graduate degree earn the most with the average annual earnings of $55,777, while those with less than high school education have the smallest earnings of $19,266.
| Educational Attainment | Male Income | Female Income |
| Less than High School | $24,961 | $19,266 |
| High School Diploma | $32,797 | $24,390 |
| College or Associate's Degree | $40,900 | $28,093 |
| Bachelor's Degree | $55,276 | $43,295 |
| Graduate Degree | $52,722 | $55,777 |
| Total | $36,092 | $29,300 |
Family Income in Canton
Family Income Brackets in Canton
According to the Canton family income data, there are 2,936 families falling into the $50,000 to $74,999 income range, which is the most common income bracket and makes up 18.4% of all families. Conversely, the $200,000+ income bracket is the least frequent group with only 447 families (2.8%) belonging to this category.
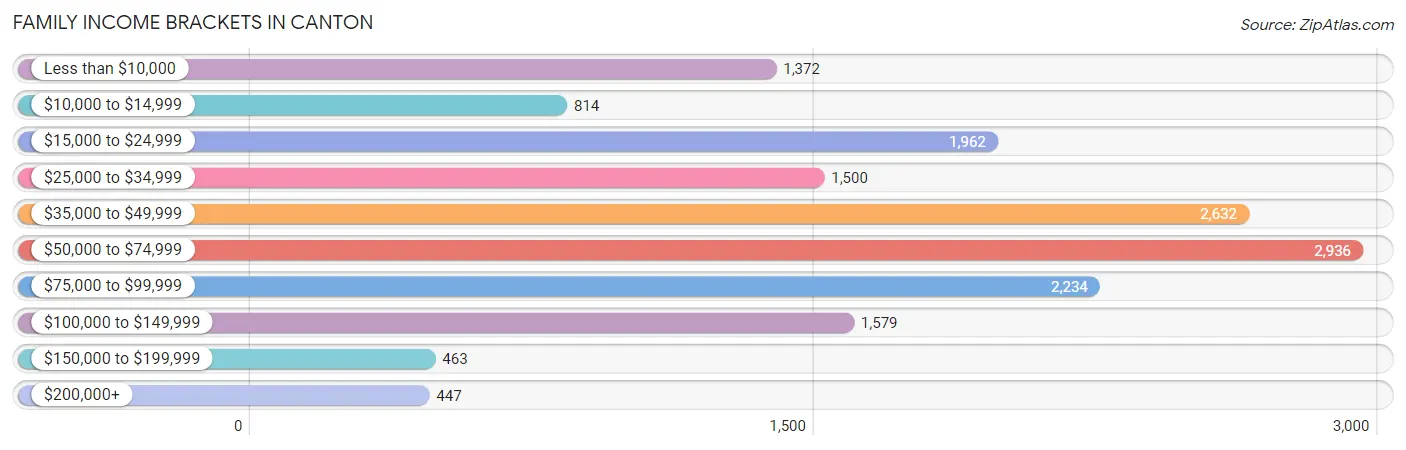
| Income Bracket | # Families | % Families |
| Less than $10,000 | 1,372 | 8.6% |
| $10,000 to $14,999 | 814 | 5.1% |
| $15,000 to $24,999 | 1,962 | 12.3% |
| $25,000 to $34,999 | 1,500 | 9.4% |
| $35,000 to $49,999 | 2,632 | 16.5% |
| $50,000 to $74,999 | 2,936 | 18.4% |
| $75,000 to $99,999 | 2,234 | 14.0% |
| $100,000 to $149,999 | 1,579 | 9.9% |
| $150,000 to $199,999 | 463 | 2.9% |
| $200,000+ | 447 | 2.8% |
Family Income by Famaliy Size in Canton
2-person families (7,590 | 47.6%) account for the highest median family income in Canton with $49,994 per family, while 2-person families (7,590 | 47.6%) have the highest median income of $24,997 per family member.
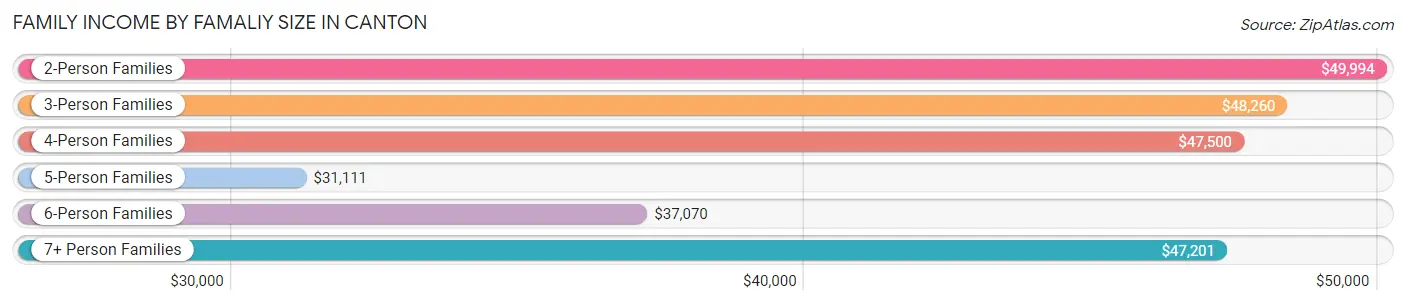
| Income Bracket | # Families | Median Income |
| 2-Person Families | 7,590 (47.6%) | $49,994 |
| 3-Person Families | 4,078 (25.6%) | $48,260 |
| 4-Person Families | 2,210 (13.9%) | $47,500 |
| 5-Person Families | 1,262 (7.9%) | $31,111 |
| 6-Person Families | 333 (2.1%) | $37,070 |
| 7+ Person Families | 481 (3.0%) | $47,201 |
| Total | 15,954 (100.0%) | $48,791 |
Family Income by Number of Earners in Canton
The median family income in Canton is $48,791, with families comprising 3+ earners (1,139) having the highest median family income of $99,023, while families with no earners (2,847) have the lowest median family income of $24,174, accounting for 7.1% and 17.8% of families, respectively.
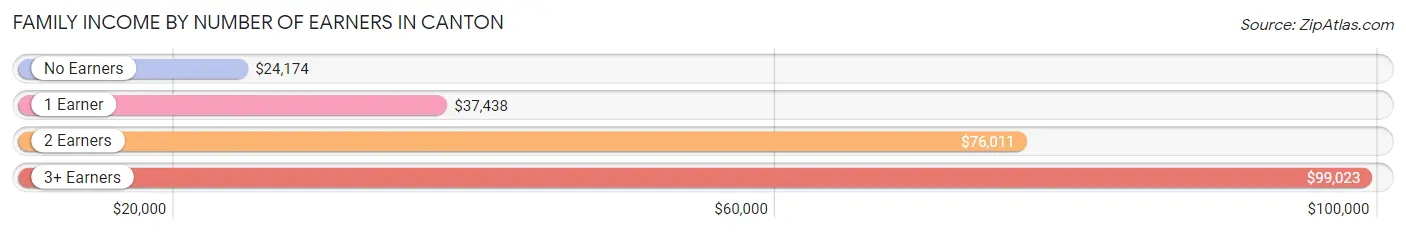
| Number of Earners | # Families | Median Income |
| No Earners | 2,847 (17.8%) | $24,174 |
| 1 Earner | 7,193 (45.1%) | $37,438 |
| 2 Earners | 4,775 (29.9%) | $76,011 |
| 3+ Earners | 1,139 (7.1%) | $99,023 |
| Total | 15,954 (100.0%) | $48,791 |
Household Income in Canton
Household Income Brackets in Canton
With 4,935 households falling in the category, the $50,000 to $74,999 income range is the most frequent in Canton, accounting for 16.2% of all households. In contrast, only 518 households (1.7%) fall into the $200,000+ income bracket, making it the least populous group.
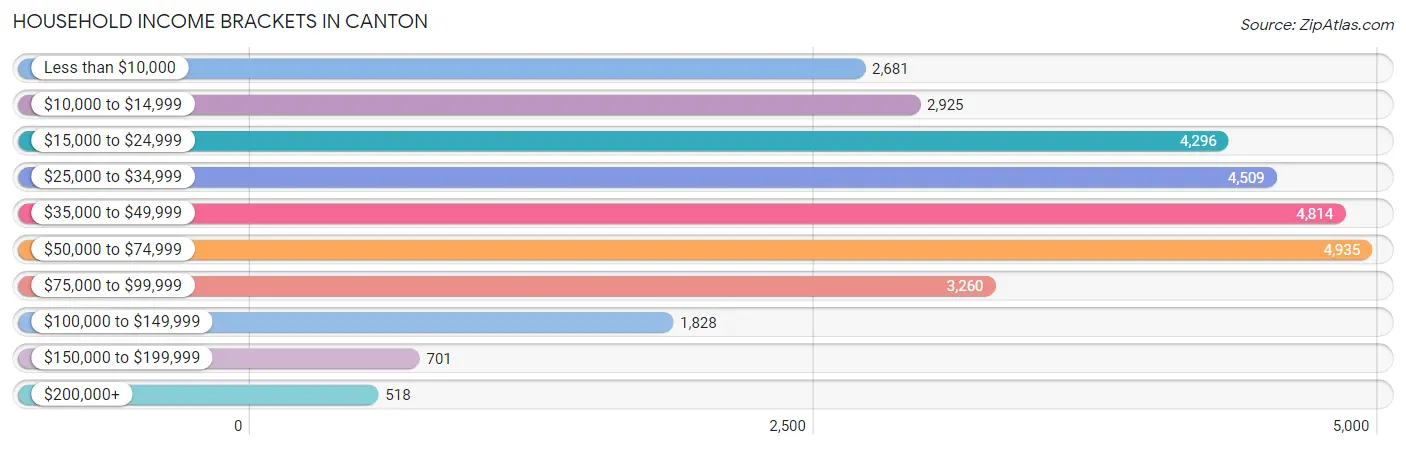
| Income Bracket | # Households | % Households |
| Less than $10,000 | 2,681 | 8.8% |
| $10,000 to $14,999 | 2,925 | 9.6% |
| $15,000 to $24,999 | 4,296 | 14.1% |
| $25,000 to $34,999 | 4,509 | 14.8% |
| $35,000 to $49,999 | 4,814 | 15.8% |
| $50,000 to $74,999 | 4,935 | 16.2% |
| $75,000 to $99,999 | 3,260 | 10.7% |
| $100,000 to $149,999 | 1,828 | 6.0% |
| $150,000 to $199,999 | 701 | 2.3% |
| $200,000+ | 518 | 1.7% |
Household Income by Householder Age in Canton
The median household income in Canton is $37,627, with the highest median household income of $42,411 found in the 45 to 64 years age bracket for the primary householder. A total of 10,992 households (36.1%) fall into this category. Meanwhile, the 15 to 24 years age bracket for the primary householder has the lowest median household income of $27,512, with 1,599 households (5.2%) in this group.
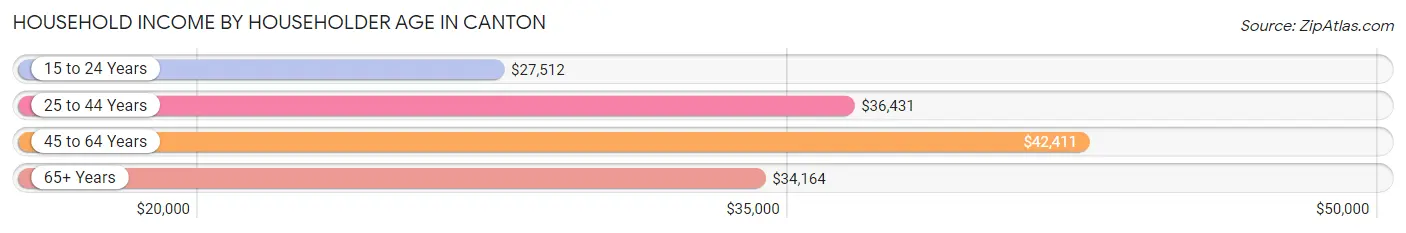
| Income Bracket | # Households | Median Income |
| 15 to 24 Years | 1,599 (5.2%) | $27,512 |
| 25 to 44 Years | 10,652 (35.0%) | $36,431 |
| 45 to 64 Years | 10,992 (36.1%) | $42,411 |
| 65+ Years | 7,223 (23.7%) | $34,164 |
| Total | 30,466 (100.0%) | $37,627 |
Poverty in Canton
Income Below Poverty by Sex and Age in Canton
With 28.5% poverty level for males and 31.9% for females among the residents of Canton, 15 year old males and 5 year old females are the most vulnerable to poverty, with 286 males (65.9%) and 320 females (53.8%) in their respective age groups living below the poverty level.
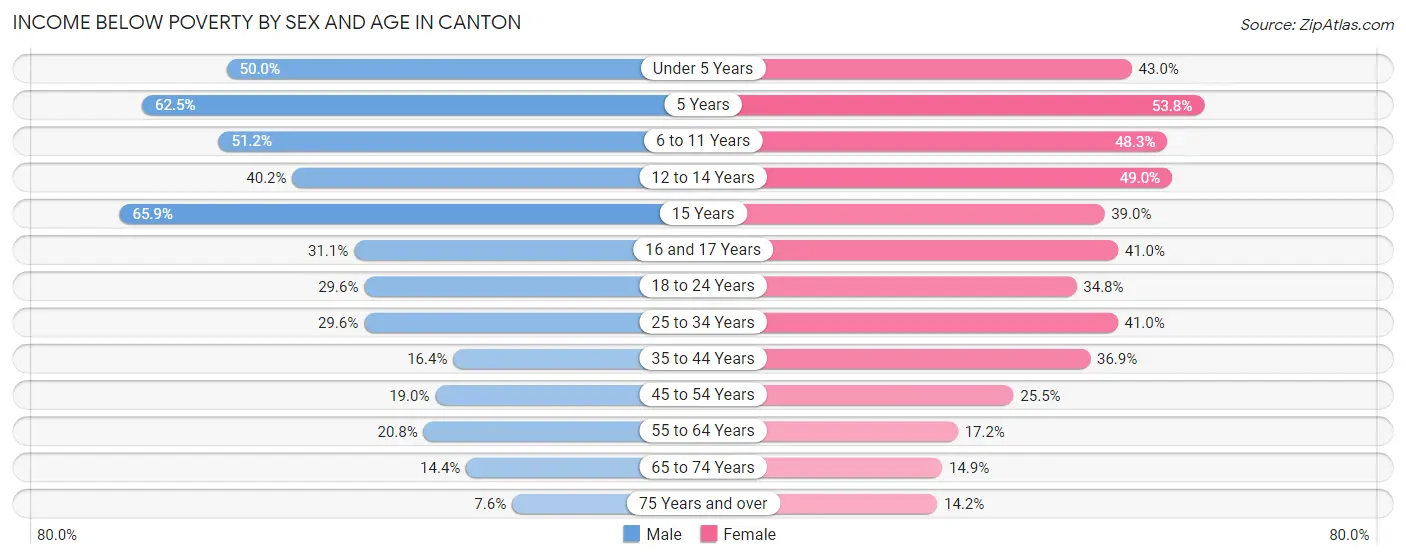
| Age Bracket | Male | Female |
| Under 5 Years | 1,335 (50.0%) | 992 (43.0%) |
| 5 Years | 394 (62.5%) | 320 (53.8%) |
| 6 to 11 Years | 1,514 (51.2%) | 1,363 (48.3%) |
| 12 to 14 Years | 565 (40.2%) | 498 (49.0%) |
| 15 Years | 286 (65.9%) | 166 (39.0%) |
| 16 and 17 Years | 239 (31.1%) | 436 (41.0%) |
| 18 to 24 Years | 840 (29.6%) | 1,025 (34.8%) |
| 25 to 34 Years | 1,470 (29.6%) | 2,109 (40.9%) |
| 35 to 44 Years | 607 (16.4%) | 1,587 (36.9%) |
| 45 to 54 Years | 709 (19.0%) | 1,075 (25.5%) |
| 55 to 64 Years | 903 (20.8%) | 734 (17.2%) |
| 65 to 74 Years | 440 (14.4%) | 521 (14.9%) |
| 75 Years and over | 116 (7.6%) | 347 (14.1%) |
| Total | 9,418 (28.5%) | 11,173 (31.9%) |
Income Above Poverty by Sex and Age in Canton
According to the poverty statistics in Canton, males aged 75 years and over and females aged 75 years and over are the age groups that are most secure financially, with 92.4% of males and 85.9% of females in these age groups living above the poverty line.
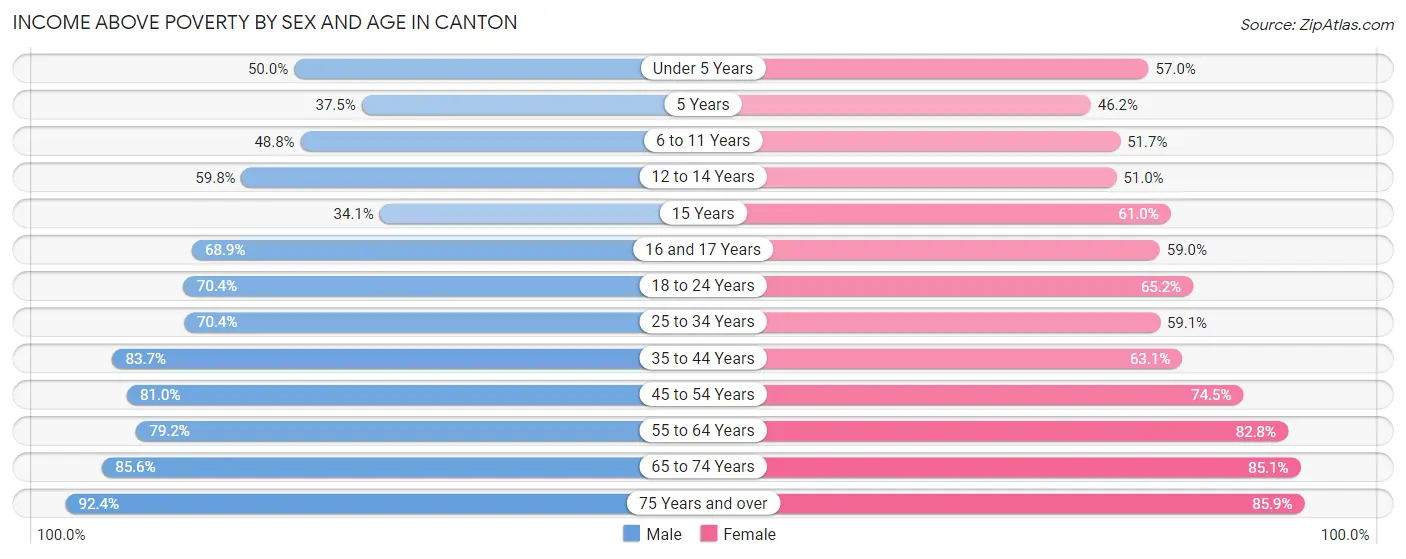
| Age Bracket | Male | Female |
| Under 5 Years | 1,335 (50.0%) | 1,313 (57.0%) |
| 5 Years | 236 (37.5%) | 275 (46.2%) |
| 6 to 11 Years | 1,443 (48.8%) | 1,458 (51.7%) |
| 12 to 14 Years | 839 (59.8%) | 518 (51.0%) |
| 15 Years | 148 (34.1%) | 260 (61.0%) |
| 16 and 17 Years | 530 (68.9%) | 628 (59.0%) |
| 18 to 24 Years | 2,001 (70.4%) | 1,918 (65.2%) |
| 25 to 34 Years | 3,496 (70.4%) | 3,041 (59.1%) |
| 35 to 44 Years | 3,106 (83.7%) | 2,718 (63.1%) |
| 45 to 54 Years | 3,018 (81.0%) | 3,144 (74.5%) |
| 55 to 64 Years | 3,446 (79.2%) | 3,530 (82.8%) |
| 65 to 74 Years | 2,610 (85.6%) | 2,978 (85.1%) |
| 75 Years and over | 1,404 (92.4%) | 2,105 (85.9%) |
| Total | 23,612 (71.5%) | 23,886 (68.1%) |
Income Below Poverty Among Married-Couple Families in Canton
The poverty statistics for married-couple families in Canton show that 9.1% or 723 of the total 7,955 families live below the poverty line. Families with 5 or more children have the highest poverty rate of 45.4%, comprising of 83 families. On the other hand, families with no children have the lowest poverty rate of 4.3%, which includes 218 families.
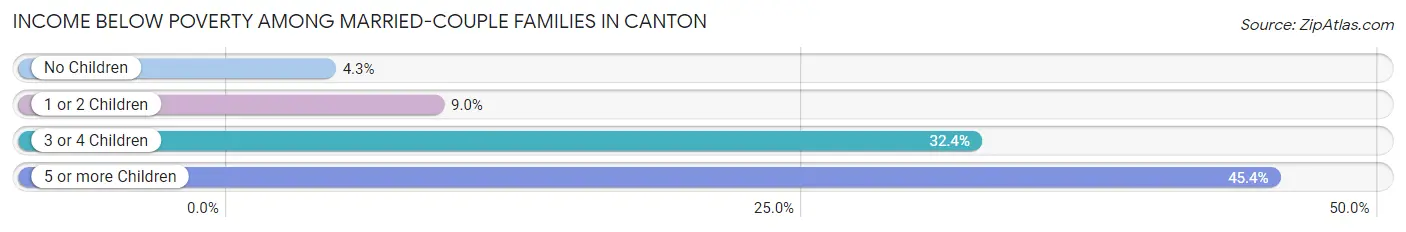
| Children | Above Poverty | Below Poverty |
| No Children | 4,912 (95.8%) | 218 (4.3%) |
| 1 or 2 Children | 1,685 (91.0%) | 166 (9.0%) |
| 3 or 4 Children | 535 (67.6%) | 256 (32.4%) |
| 5 or more Children | 100 (54.6%) | 83 (45.4%) |
| Total | 7,232 (90.9%) | 723 (9.1%) |
Income Below Poverty Among Single-Parent Households in Canton
According to the poverty data in Canton, 20.6% or 326 single-father households and 47.2% or 3,032 single-mother households are living below the poverty line. Among single-father households, those with 5 or more children have the highest poverty rate, with 23 households (100.0%) experiencing poverty. Likewise, among single-mother households, those with 5 or more children have the highest poverty rate, with 177 households (100.0%) falling below the poverty line.
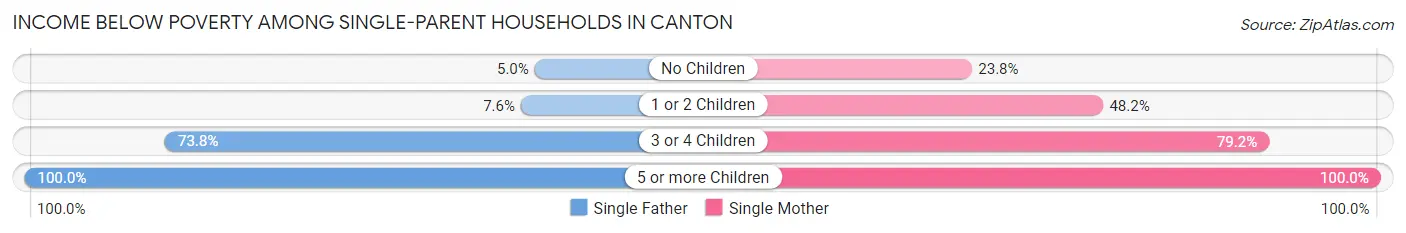
| Children | Single Father | Single Mother |
| No Children | 24 (5.0%) | 425 (23.8%) |
| 1 or 2 Children | 59 (7.6%) | 1,710 (48.2%) |
| 3 or 4 Children | 220 (73.8%) | 720 (79.2%) |
| 5 or more Children | 23 (100.0%) | 177 (100.0%) |
| Total | 326 (20.6%) | 3,032 (47.2%) |
Income Below Poverty Among Married-Couple vs Single-Parent Households in Canton
The poverty data for Canton shows that 723 of the married-couple family households (9.1%) and 3,358 of the single-parent households (42.0%) are living below the poverty level. Within the married-couple family households, those with 5 or more children have the highest poverty rate, with 83 households (45.4%) falling below the poverty line. Among the single-parent households, those with 5 or more children have the highest poverty rate, with 200 household (100.0%) living below poverty.
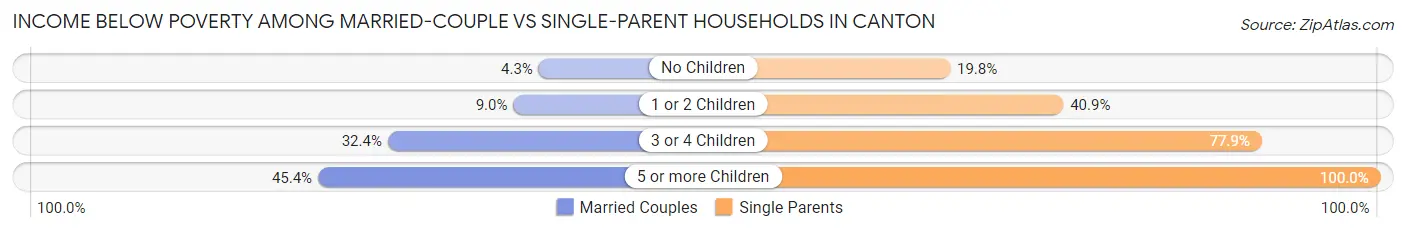
| Children | Married-Couple Families | Single-Parent Households |
| No Children | 218 (4.3%) | 449 (19.8%) |
| 1 or 2 Children | 166 (9.0%) | 1,769 (40.9%) |
| 3 or 4 Children | 256 (32.4%) | 940 (77.9%) |
| 5 or more Children | 83 (45.4%) | 200 (100.0%) |
| Total | 723 (9.1%) | 3,358 (42.0%) |
Race in Canton
The most populous races in Canton are White / Caucasian (44,420 | 62.9%), Black / African American (17,705 | 25.1%), and Two or more Races (7,353 | 10.4%).
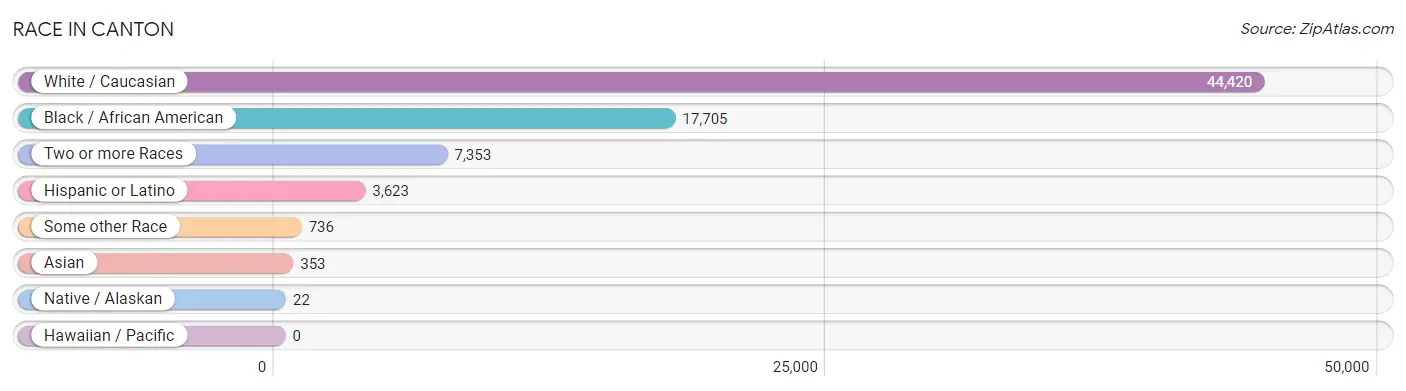
| Race | # Population | % Population |
| Asian | 353 | 0.5% |
| Black / African American | 17,705 | 25.1% |
| Hawaiian / Pacific | 0 | 0.0% |
| Hispanic or Latino | 3,623 | 5.1% |
| Native / Alaskan | 22 | 0.0% |
| White / Caucasian | 44,420 | 62.9% |
| Two or more Races | 7,353 | 10.4% |
| Some other Race | 736 | 1.0% |
| Total | 70,589 | 100.0% |
Ancestry in Canton
The most populous ancestries reported in Canton are German (13,161 | 18.6%), Irish (8,192 | 11.6%), Subsaharan African (7,338 | 10.4%), African (7,196 | 10.2%), and English (5,423 | 7.7%), together accounting for 58.5% of all Canton residents.
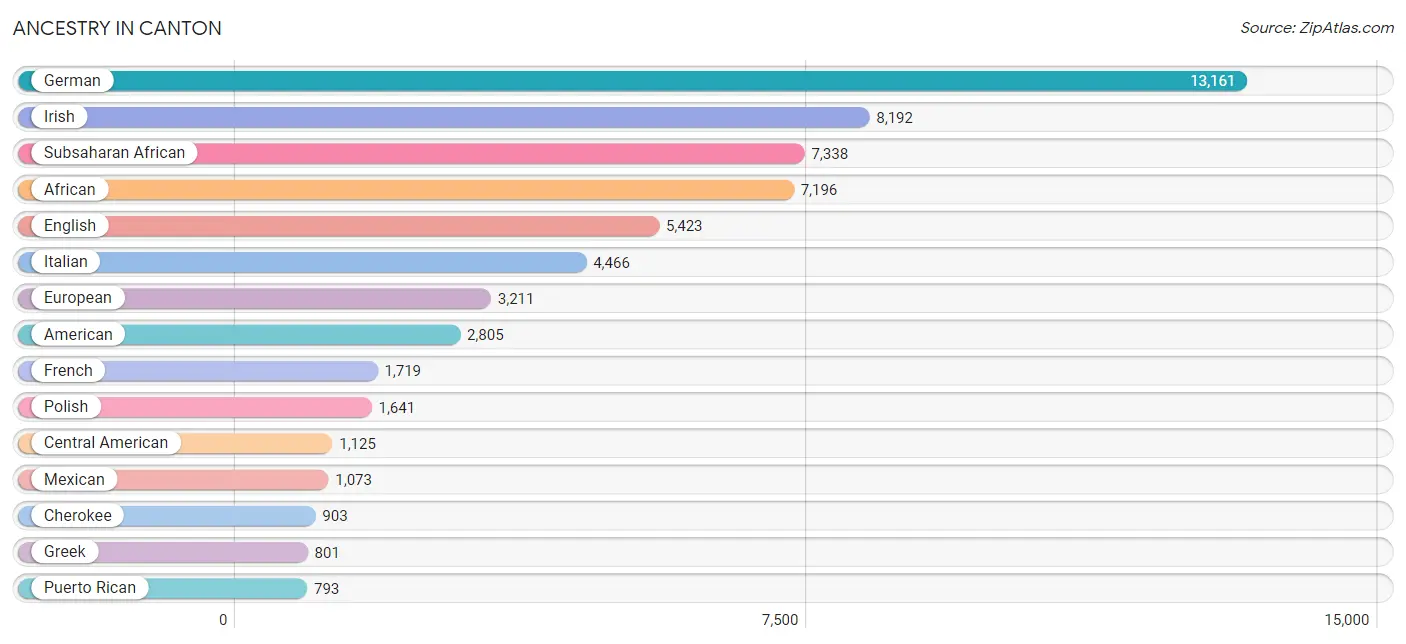
| Ancestry | # Population | % Population |
| African | 7,196 | 10.2% |
| Albanian | 17 | 0.0% |
| American | 2,805 | 4.0% |
| Apache | 46 | 0.1% |
| Arab | 138 | 0.2% |
| Armenian | 10 | 0.0% |
| Australian | 67 | 0.1% |
| Austrian | 217 | 0.3% |
| Belgian | 97 | 0.1% |
| Bhutanese | 23 | 0.0% |
| Blackfeet | 217 | 0.3% |
| British | 155 | 0.2% |
| Burmese | 128 | 0.2% |
| Canadian | 34 | 0.1% |
| Cape Verdean | 40 | 0.1% |
| Celtic | 22 | 0.0% |
| Central American | 1,125 | 1.6% |
| Cherokee | 903 | 1.3% |
| Chinese | 21 | 0.0% |
| Colombian | 14 | 0.0% |
| Croatian | 174 | 0.3% |
| Crow | 19 | 0.0% |
| Cuban | 93 | 0.1% |
| Czech | 245 | 0.4% |
| Czechoslovakian | 99 | 0.1% |
| Danish | 6 | 0.0% |
| Delaware | 65 | 0.1% |
| Dominican | 76 | 0.1% |
| Dutch | 538 | 0.8% |
| Eastern European | 163 | 0.2% |
| Egyptian | 29 | 0.0% |
| English | 5,423 | 7.7% |
| European | 3,211 | 4.5% |
| Finnish | 28 | 0.0% |
| French | 1,719 | 2.4% |
| French Canadian | 208 | 0.3% |
| German | 13,161 | 18.6% |
| Greek | 801 | 1.1% |
| Guatemalan | 466 | 0.7% |
| Haitian | 116 | 0.2% |
| Honduran | 268 | 0.4% |
| Hungarian | 619 | 0.9% |
| Indian (Asian) | 102 | 0.1% |
| Indonesian | 10 | 0.0% |
| Iraqi | 3 | 0.0% |
| Irish | 8,192 | 11.6% |
| Israeli | 19 | 0.0% |
| Italian | 4,466 | 6.3% |
| Jamaican | 49 | 0.1% |
| Japanese | 64 | 0.1% |
| Korean | 121 | 0.2% |
| Lebanese | 25 | 0.0% |
| Lithuanian | 58 | 0.1% |
| Macedonian | 62 | 0.1% |
| Mexican | 1,073 | 1.5% |
| Mexican American Indian | 19 | 0.0% |
| Navajo | 13 | 0.0% |
| Nigerian | 32 | 0.1% |
| Northern European | 20 | 0.0% |
| Norwegian | 136 | 0.2% |
| Panamanian | 3 | 0.0% |
| Pennsylvania German | 135 | 0.2% |
| Peruvian | 23 | 0.0% |
| Polish | 1,641 | 2.3% |
| Portuguese | 358 | 0.5% |
| Puerto Rican | 793 | 1.1% |
| Romanian | 350 | 0.5% |
| Russian | 310 | 0.4% |
| Salvadoran | 388 | 0.5% |
| Scandinavian | 163 | 0.2% |
| Scotch-Irish | 647 | 0.9% |
| Scottish | 451 | 0.6% |
| Serbian | 42 | 0.1% |
| Shoshone | 12 | 0.0% |
| Sioux | 35 | 0.1% |
| Slovak | 286 | 0.4% |
| Slovene | 20 | 0.0% |
| South African | 18 | 0.0% |
| South American | 37 | 0.1% |
| Spaniard | 77 | 0.1% |
| Spanish | 235 | 0.3% |
| Sri Lankan | 19 | 0.0% |
| Subsaharan African | 7,338 | 10.4% |
| Swedish | 204 | 0.3% |
| Swiss | 466 | 0.7% |
| Syrian | 45 | 0.1% |
| Thai | 80 | 0.1% |
| Turkish | 11 | 0.0% |
| Ukrainian | 46 | 0.1% |
| Welsh | 662 | 0.9% |
| Yugoslavian | 51 | 0.1% | View All 91 Rows |
Immigrants in Canton
The most numerous immigrant groups reported in Canton came from Latin America (962 | 1.4%), Central America (902 | 1.3%), Europe (384 | 0.5%), Asia (303 | 0.4%), and Mexico (296 | 0.4%), together accounting for 4.0% of all Canton residents.
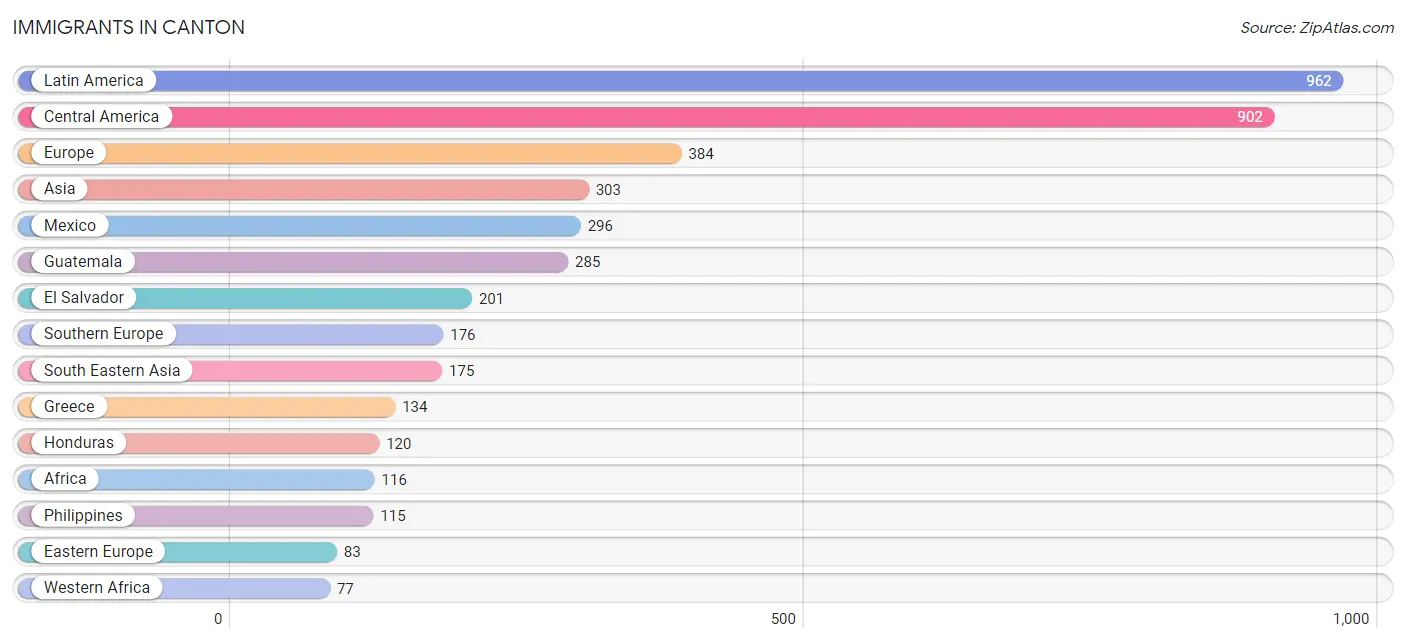
| Immigration Origin | # Population | % Population |
| Africa | 116 | 0.2% |
| Asia | 303 | 0.4% |
| Australia | 11 | 0.0% |
| Belgium | 14 | 0.0% |
| Bulgaria | 6 | 0.0% |
| Cambodia | 50 | 0.1% |
| Canada | 27 | 0.0% |
| Caribbean | 23 | 0.0% |
| Central America | 902 | 1.3% |
| China | 3 | 0.0% |
| Colombia | 14 | 0.0% |
| Czechoslovakia | 20 | 0.0% |
| Eastern Africa | 26 | 0.0% |
| Eastern Asia | 47 | 0.1% |
| Eastern Europe | 83 | 0.1% |
| El Salvador | 201 | 0.3% |
| England | 11 | 0.0% |
| Europe | 384 | 0.5% |
| Germany | 40 | 0.1% |
| Greece | 134 | 0.2% |
| Guatemala | 285 | 0.4% |
| Honduras | 120 | 0.2% |
| India | 45 | 0.1% |
| Israel | 19 | 0.0% |
| Italy | 33 | 0.1% |
| Jamaica | 23 | 0.0% |
| Korea | 44 | 0.1% |
| Latin America | 962 | 1.4% |
| Liberia | 15 | 0.0% |
| Lithuania | 18 | 0.0% |
| Mexico | 296 | 0.4% |
| Nepal | 3 | 0.0% |
| Netherlands | 18 | 0.0% |
| Nigeria | 32 | 0.1% |
| North Macedonia | 9 | 0.0% |
| Northern Europe | 53 | 0.1% |
| Norway | 3 | 0.0% |
| Oceania | 11 | 0.0% |
| Pakistan | 14 | 0.0% |
| Peru | 23 | 0.0% |
| Philippines | 115 | 0.2% |
| Poland | 3 | 0.0% |
| Russia | 3 | 0.0% |
| Senegal | 9 | 0.0% |
| Sierra Leone | 21 | 0.0% |
| South Africa | 13 | 0.0% |
| South America | 37 | 0.1% |
| South Central Asia | 62 | 0.1% |
| South Eastern Asia | 175 | 0.3% |
| Southern Europe | 176 | 0.3% |
| Spain | 9 | 0.0% |
| Sweden | 17 | 0.0% |
| Thailand | 7 | 0.0% |
| Ukraine | 24 | 0.0% |
| Vietnam | 3 | 0.0% |
| Western Africa | 77 | 0.1% |
| Western Asia | 19 | 0.0% |
| Western Europe | 72 | 0.1% | View All 58 Rows |
Sex and Age in Canton
Sex and Age in Canton
The most populous age groups in Canton are Under 5 Years (2,764 | 8.1%) for men and 25 to 29 Years (2,856 | 7.9%) for women.
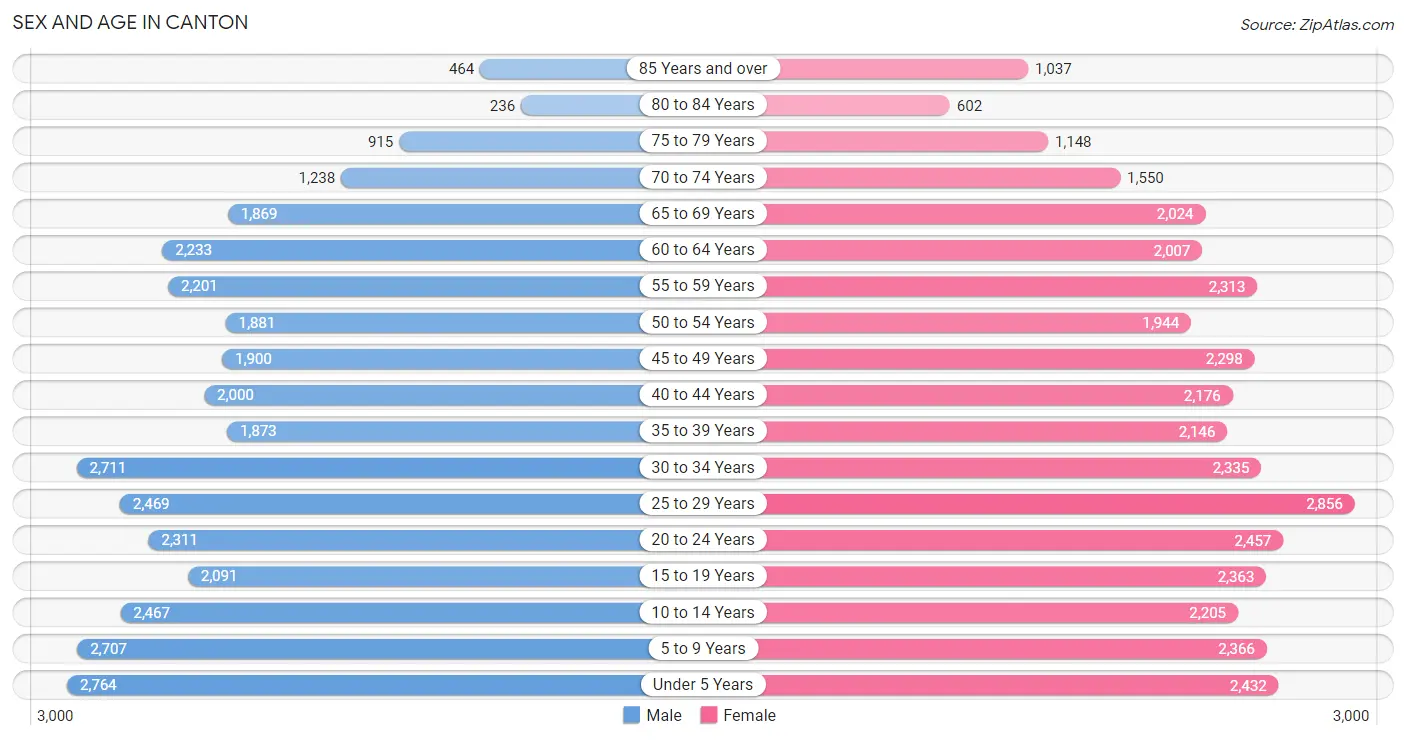
| Age Bracket | Male | Female |
| Under 5 Years | 2,764 (8.1%) | 2,432 (6.7%) |
| 5 to 9 Years | 2,707 (7.9%) | 2,366 (6.5%) |
| 10 to 14 Years | 2,467 (7.2%) | 2,205 (6.1%) |
| 15 to 19 Years | 2,091 (6.1%) | 2,363 (6.5%) |
| 20 to 24 Years | 2,311 (6.7%) | 2,457 (6.8%) |
| 25 to 29 Years | 2,469 (7.2%) | 2,856 (7.9%) |
| 30 to 34 Years | 2,711 (7.9%) | 2,335 (6.4%) |
| 35 to 39 Years | 1,873 (5.5%) | 2,146 (5.9%) |
| 40 to 44 Years | 2,000 (5.8%) | 2,176 (6.0%) |
| 45 to 49 Years | 1,900 (5.5%) | 2,298 (6.3%) |
| 50 to 54 Years | 1,881 (5.5%) | 1,944 (5.4%) |
| 55 to 59 Years | 2,201 (6.4%) | 2,313 (6.4%) |
| 60 to 64 Years | 2,233 (6.5%) | 2,007 (5.5%) |
| 65 to 69 Years | 1,869 (5.4%) | 2,024 (5.6%) |
| 70 to 74 Years | 1,238 (3.6%) | 1,550 (4.3%) |
| 75 to 79 Years | 915 (2.7%) | 1,148 (3.2%) |
| 80 to 84 Years | 236 (0.7%) | 602 (1.7%) |
| 85 Years and over | 464 (1.3%) | 1,037 (2.9%) |
| Total | 34,330 (100.0%) | 36,259 (100.0%) |
Families and Households in Canton
Median Family Size in Canton
The median family size in Canton is 3.02 persons per family, with single male/father families (1,579 | 9.9%) accounting for the largest median family size of 3.27 persons per family. On the other hand, married-couple families (7,955 | 49.9%) represent the smallest median family size with 3.00 persons per family.
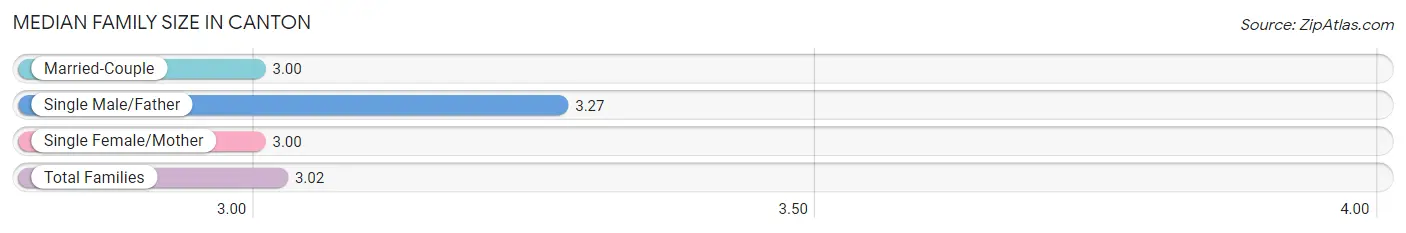
| Family Type | # Families | Family Size |
| Married-Couple | 7,955 (49.9%) | 3.00 |
| Single Male/Father | 1,579 (9.9%) | 3.27 |
| Single Female/Mother | 6,420 (40.2%) | 3.00 |
| Total Families | 15,954 (100.0%) | 3.02 |
Median Household Size in Canton
The median household size in Canton is 2.24 persons per household, with single male/father households (1,579 | 5.2%) accounting for the largest median household size of 3.95 persons per household. non-family households (14,512 | 47.6%) represent the smallest median household size with 1.20 persons per household.
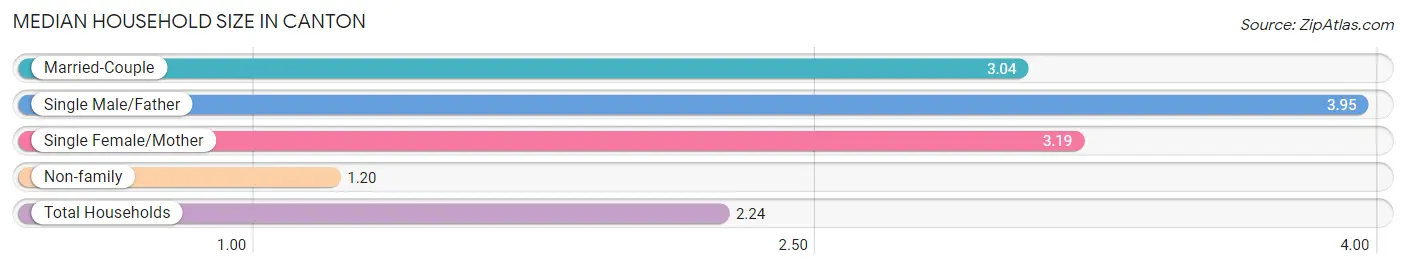
| Household Type | # Households | Household Size |
| Married-Couple | 7,955 (26.1%) | 3.04 |
| Single Male/Father | 1,579 (5.2%) | 3.95 |
| Single Female/Mother | 6,420 (21.1%) | 3.19 |
| Non-family | 14,512 (47.6%) | 1.20 |
| Total Households | 30,466 (100.0%) | 2.24 |
Household Size by Marriage Status in Canton
Out of a total of 30,466 households in Canton, 15,954 (52.4%) are family households, while 14,512 (47.6%) are nonfamily households. The most numerous type of family households are 2-person households, comprising 6,762, and the most common type of nonfamily households are 1-person households, comprising 12,217.
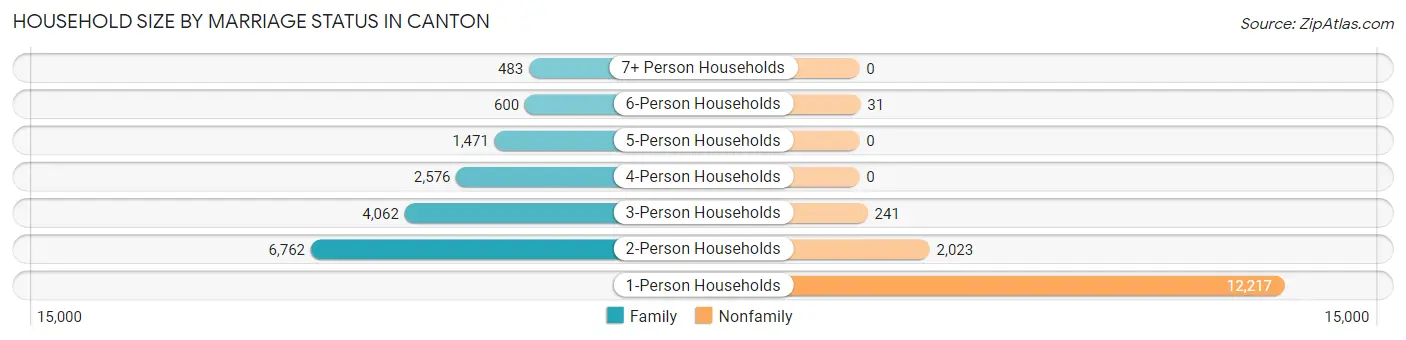
| Household Size | Family Households | Nonfamily Households |
| 1-Person Households | - | 12,217 (40.1%) |
| 2-Person Households | 6,762 (22.2%) | 2,023 (6.6%) |
| 3-Person Households | 4,062 (13.3%) | 241 (0.8%) |
| 4-Person Households | 2,576 (8.5%) | 0 (0.0%) |
| 5-Person Households | 1,471 (4.8%) | 0 (0.0%) |
| 6-Person Households | 600 (2.0%) | 31 (0.1%) |
| 7+ Person Households | 483 (1.6%) | 0 (0.0%) |
| Total | 15,954 (52.4%) | 14,512 (47.6%) |
Female Fertility in Canton
Fertility by Age in Canton
Average fertility rate in Canton is 70.0 births per 1,000 women. Women in the age bracket of 20 to 34 years have the highest fertility rate with 122.0 births per 1,000 women. Women in the age bracket of 20 to 34 years acount for 77.6% of all women with births.
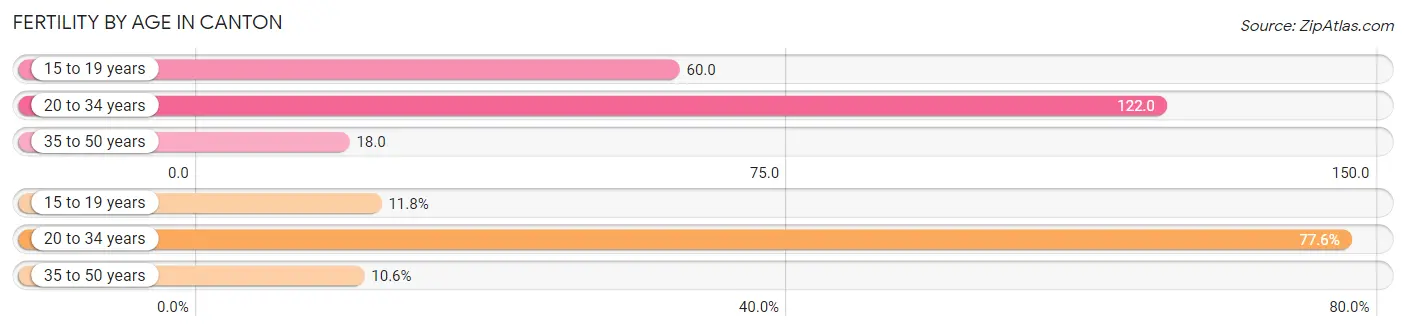
| Age Bracket | Women with Births | Births / 1,000 Women |
| 15 to 19 years | 142 (11.8%) | 60.0 |
| 20 to 34 years | 936 (77.6%) | 122.0 |
| 35 to 50 years | 128 (10.6%) | 18.0 |
| Total | 1,206 (100.0%) | 70.0 |
Fertility by Age by Marriage Status in Canton
30.1% of women with births (1,206) in Canton are married. The highest percentage of unmarried women with births falls into 15 to 19 years age bracket with 100.0% of them unmarried at the time of birth, while the lowest percentage of unmarried women with births belong to 35 to 50 years age bracket with 39.1% of them unmarried.
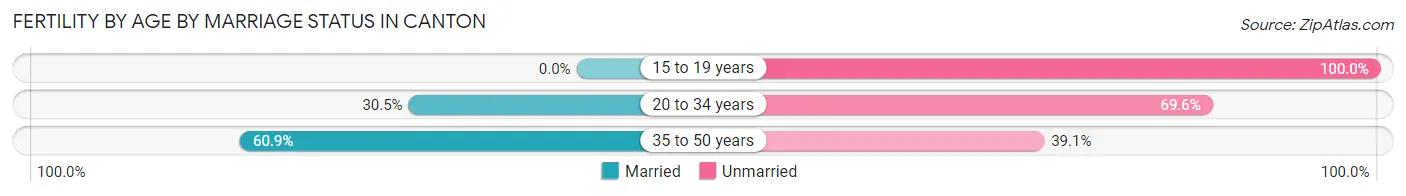
| Age Bracket | Married | Unmarried |
| 15 to 19 years | 0 (0.0%) | 142 (100.0%) |
| 20 to 34 years | 285 (30.4%) | 651 (69.6%) |
| 35 to 50 years | 78 (60.9%) | 50 (39.1%) |
| Total | 363 (30.1%) | 843 (69.9%) |
Fertility by Education in Canton
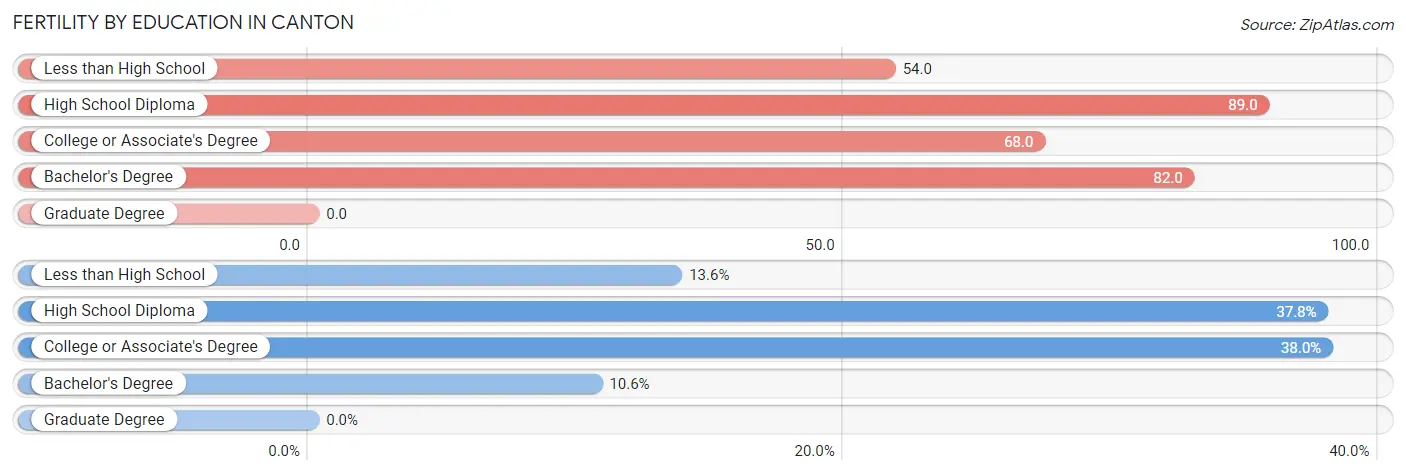
| Educational Attainment | Women with Births | Births / 1,000 Women |
| Less than High School | 164 (13.6%) | 54.0 |
| High School Diploma | 456 (37.8%) | 89.0 |
| College or Associate's Degree | 458 (38.0%) | 68.0 |
| Bachelor's Degree | 128 (10.6%) | 82.0 |
| Graduate Degree | 0 (0.0%) | 0.0 |
| Total | 1,206 (100.0%) | 70.0 |
Fertility by Education by Marriage Status in Canton
69.9% of women with births in Canton are unmarried. Women with the educational attainment of bachelor's degree are most likely to be married with 82.0% of them married at childbirth, while women with the educational attainment of high school diploma are least likely to be married with 79.2% of them unmarried at childbirth.
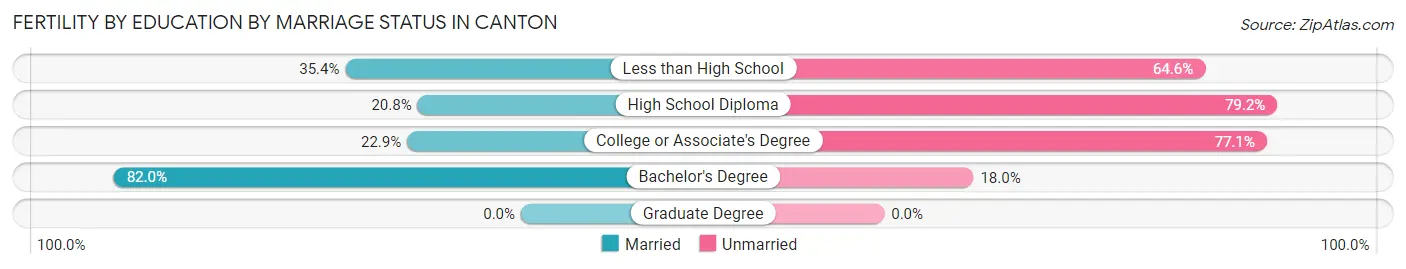
| Educational Attainment | Married | Unmarried |
| Less than High School | 58 (35.4%) | 106 (64.6%) |
| High School Diploma | 95 (20.8%) | 361 (79.2%) |
| College or Associate's Degree | 105 (22.9%) | 353 (77.1%) |
| Bachelor's Degree | 105 (82.0%) | 23 (18.0%) |
| Graduate Degree | 0 (0.0%) | 0 (0.0%) |
| Total | 363 (30.1%) | 843 (69.9%) |
Employment Characteristics in Canton
Employment by Class of Employer in Canton
Among the 28,451 employed individuals in Canton, private company employees (20,448 | 71.9%), not-for-profit organizations (3,305 | 11.6%), and local government employees (1,953 | 6.9%) make up the most common classes of employment.
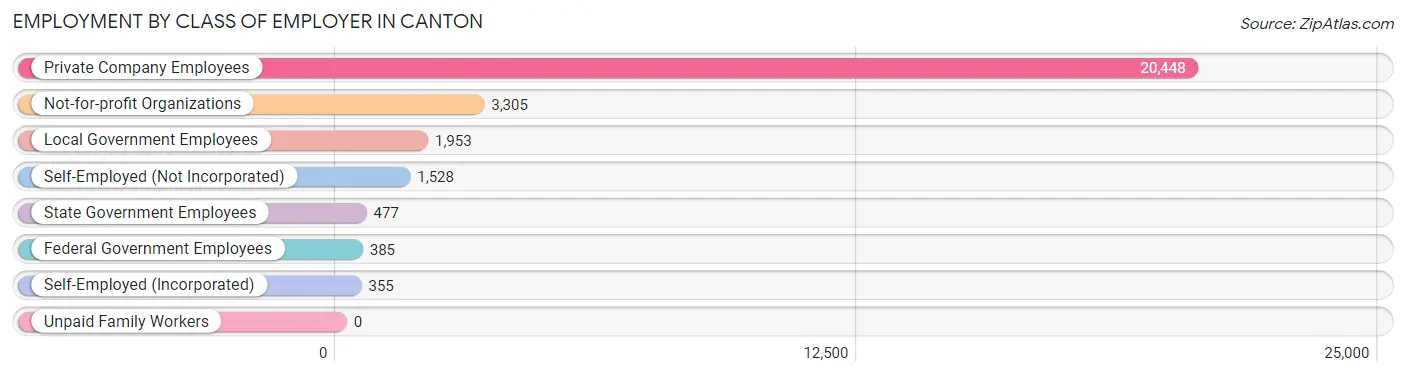
| Employer Class | # Employees | % Employees |
| Private Company Employees | 20,448 | 71.9% |
| Self-Employed (Incorporated) | 355 | 1.3% |
| Self-Employed (Not Incorporated) | 1,528 | 5.4% |
| Not-for-profit Organizations | 3,305 | 11.6% |
| Local Government Employees | 1,953 | 6.9% |
| State Government Employees | 477 | 1.7% |
| Federal Government Employees | 385 | 1.3% |
| Unpaid Family Workers | 0 | 0.0% |
| Total | 28,451 | 100.0% |
Employment Status by Age in Canton
According to the labor force statistics for Canton, out of the total population over 16 years of age (54,788), 58.2% or 31,887 individuals are in the labor force, with 9.0% or 2,870 of them unemployed. The age group with the highest labor force participation rate is 20 to 24 years, with 80.7% or 3,848 individuals in the labor force. Within the labor force, the 16 to 19 years age range has the highest percentage of unemployed individuals, with 27.1% or 413 of them being unemployed.
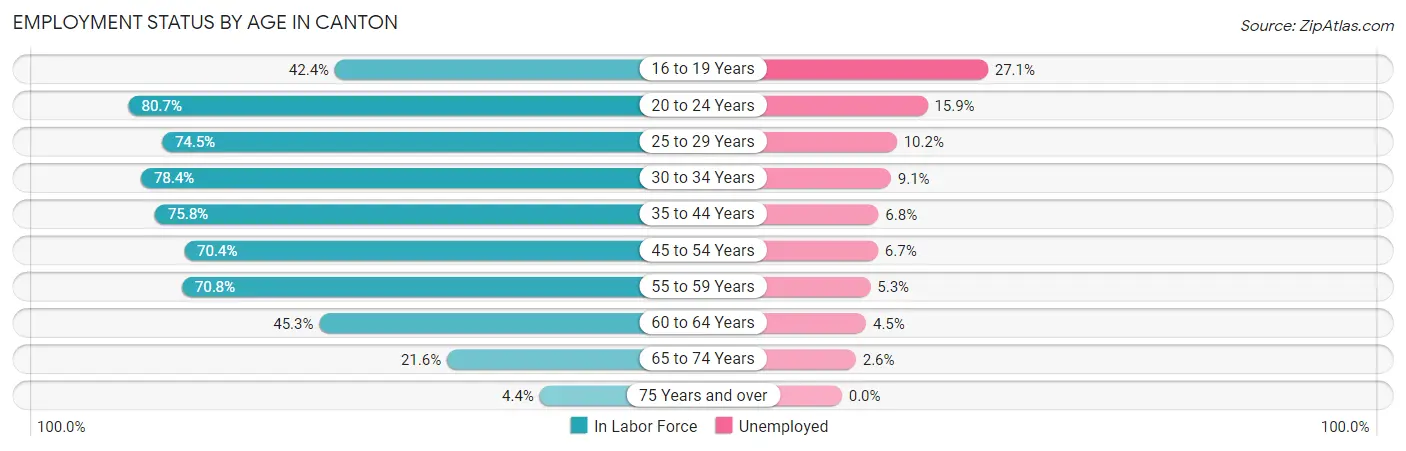
| Age Bracket | In Labor Force | Unemployed |
| 16 to 19 Years | 1,524 (42.4%) | 413 (27.1%) |
| 20 to 24 Years | 3,848 (80.7%) | 612 (15.9%) |
| 25 to 29 Years | 3,967 (74.5%) | 405 (10.2%) |
| 30 to 34 Years | 3,956 (78.4%) | 360 (9.1%) |
| 35 to 44 Years | 6,212 (75.8%) | 422 (6.8%) |
| 45 to 54 Years | 5,648 (70.4%) | 378 (6.7%) |
| 55 to 59 Years | 3,196 (70.8%) | 169 (5.3%) |
| 60 to 64 Years | 1,921 (45.3%) | 86 (4.5%) |
| 65 to 74 Years | 1,443 (21.6%) | 38 (2.6%) |
| 75 Years and over | 194 (4.4%) | 0 (0.0%) |
| Total | 31,887 (58.2%) | 2,870 (9.0%) |
Employment Status by Educational Attainment in Canton
According to labor force statistics for Canton, 70.5% of individuals (24,917) out of the total population between 25 and 64 years of age (35,343) are in the labor force, with 7.3% or 1,819 of them being unemployed. The group with the highest labor force participation rate are those with the educational attainment of bachelor's degree or higher, with 87.5% or 4,358 individuals in the labor force. Within the labor force, individuals with less than high school education have the highest percentage of unemployment, with 17.7% or 400 of them being unemployed.
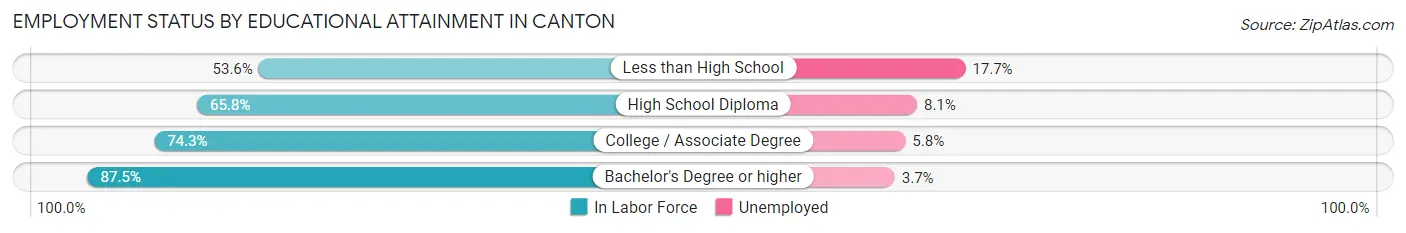
| Educational Attainment | In Labor Force | Unemployed |
| Less than High School | 2,259 (53.6%) | 746 (17.7%) |
| High School Diploma | 8,777 (65.8%) | 1,080 (8.1%) |
| College / Associate Degree | 9,516 (74.3%) | 743 (5.8%) |
| Bachelor's Degree or higher | 4,358 (87.5%) | 184 (3.7%) |
| Total | 24,917 (70.5%) | 2,580 (7.3%) |
Employment Occupations by Sex in Canton
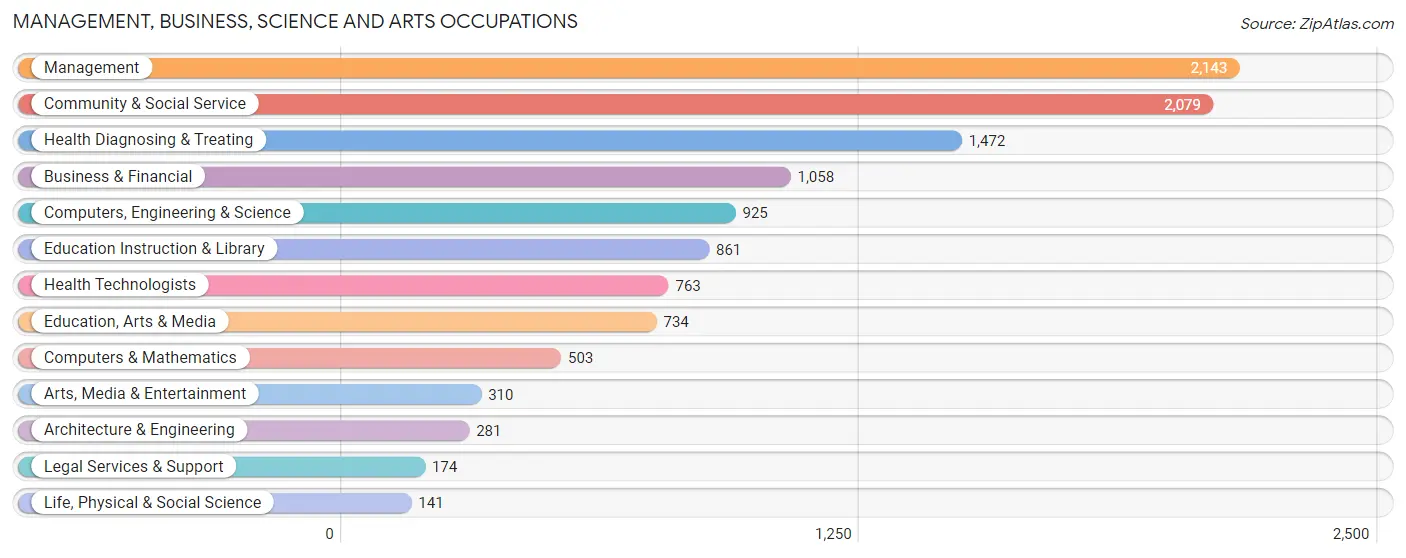
Management, Business, Science and Arts Occupations
The most common Management, Business, Science and Arts occupations in Canton are Management (2,143 | 7.4%), Community & Social Service (2,079 | 7.2%), Health Diagnosing & Treating (1,472 | 5.1%), Business & Financial (1,058 | 3.6%), and Computers, Engineering & Science (925 | 3.2%).
Management, Business, Science and Arts Occupations by Sex
Within the Management, Business, Science and Arts occupations in Canton, the most male-oriented occupations are Architecture & Engineering (80.4%), Computers & Mathematics (72.6%), and Computers, Engineering & Science (70.3%), while the most female-oriented occupations are Health Diagnosing & Treating (86.0%), Health Technologists (82.6%), and Education Instruction & Library (71.7%).
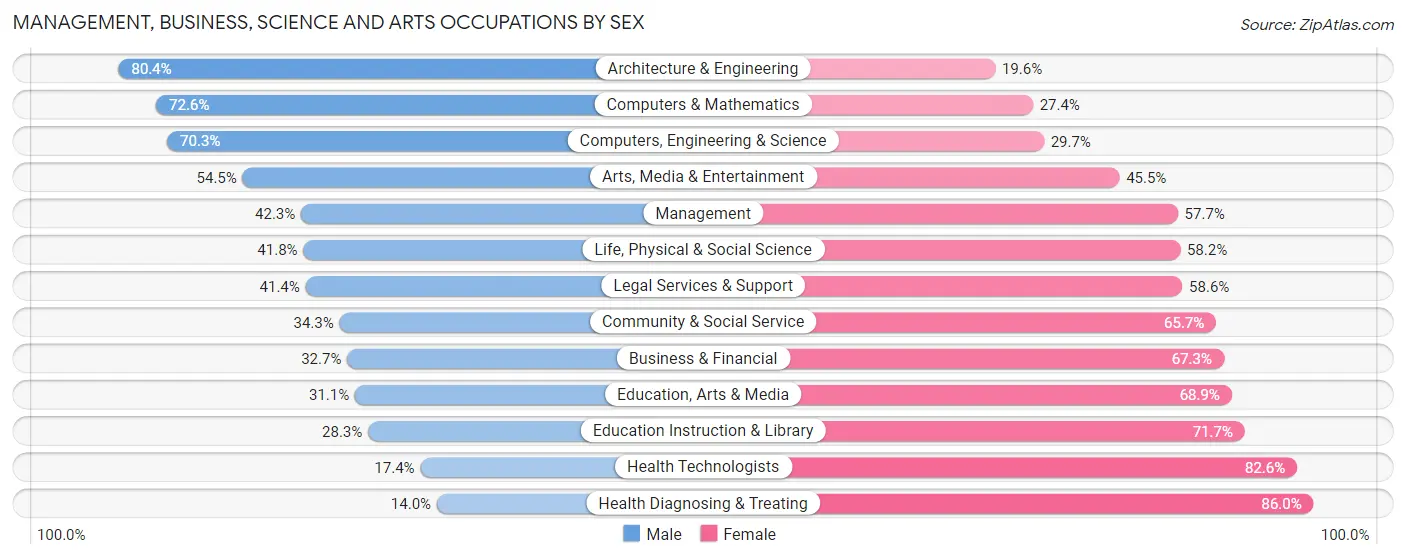
| Occupation | Male | Female |
| Management | 907 (42.3%) | 1,236 (57.7%) |
| Business & Financial | 346 (32.7%) | 712 (67.3%) |
| Computers, Engineering & Science | 650 (70.3%) | 275 (29.7%) |
| Computers & Mathematics | 365 (72.6%) | 138 (27.4%) |
| Architecture & Engineering | 226 (80.4%) | 55 (19.6%) |
| Life, Physical & Social Science | 59 (41.8%) | 82 (58.2%) |
| Community & Social Service | 713 (34.3%) | 1,366 (65.7%) |
| Education, Arts & Media | 228 (31.1%) | 506 (68.9%) |
| Legal Services & Support | 72 (41.4%) | 102 (58.6%) |
| Education Instruction & Library | 244 (28.3%) | 617 (71.7%) |
| Arts, Media & Entertainment | 169 (54.5%) | 141 (45.5%) |
| Health Diagnosing & Treating | 206 (14.0%) | 1,266 (86.0%) |
| Health Technologists | 133 (17.4%) | 630 (82.6%) |
| Total (Category) | 2,822 (36.8%) | 4,855 (63.2%) |
| Total (Overall) | 13,714 (47.4%) | 15,235 (52.6%) |
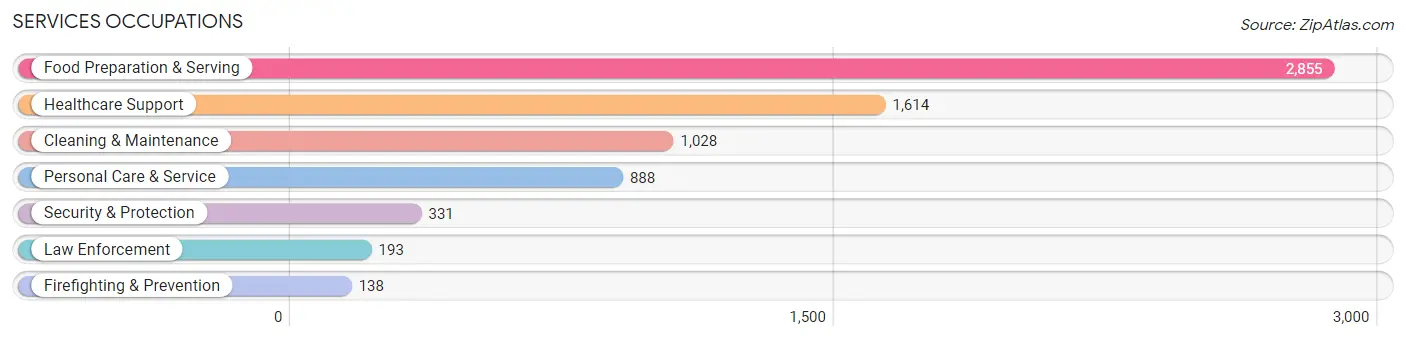
Services Occupations
The most common Services occupations in Canton are Food Preparation & Serving (2,855 | 9.9%), Healthcare Support (1,614 | 5.6%), Cleaning & Maintenance (1,028 | 3.5%), Personal Care & Service (888 | 3.1%), and Security & Protection (331 | 1.1%).
Services Occupations by Sex
Within the Services occupations in Canton, the most male-oriented occupations are Firefighting & Prevention (58.7%), Cleaning & Maintenance (52.0%), and Security & Protection (50.1%), while the most female-oriented occupations are Healthcare Support (85.9%), Personal Care & Service (69.8%), and Food Preparation & Serving (59.4%).
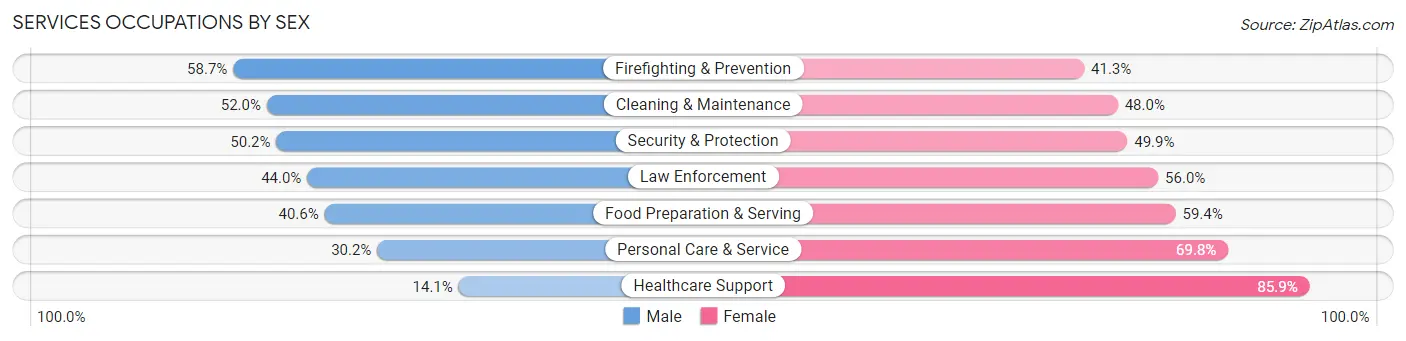
| Occupation | Male | Female |
| Healthcare Support | 227 (14.1%) | 1,387 (85.9%) |
| Security & Protection | 166 (50.1%) | 165 (49.8%) |
| Firefighting & Prevention | 81 (58.7%) | 57 (41.3%) |
| Law Enforcement | 85 (44.0%) | 108 (56.0%) |
| Food Preparation & Serving | 1,159 (40.6%) | 1,696 (59.4%) |
| Cleaning & Maintenance | 535 (52.0%) | 493 (48.0%) |
| Personal Care & Service | 268 (30.2%) | 620 (69.8%) |
| Total (Category) | 2,355 (35.1%) | 4,361 (64.9%) |
| Total (Overall) | 13,714 (47.4%) | 15,235 (52.6%) |
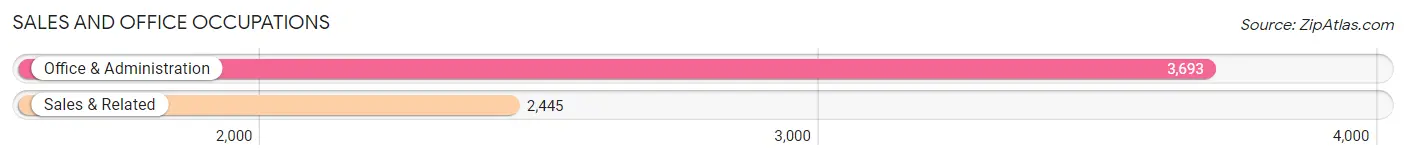
Sales and Office Occupations
The most common Sales and Office occupations in Canton are Office & Administration (3,693 | 12.8%), and Sales & Related (2,445 | 8.5%).
Sales and Office Occupations by Sex
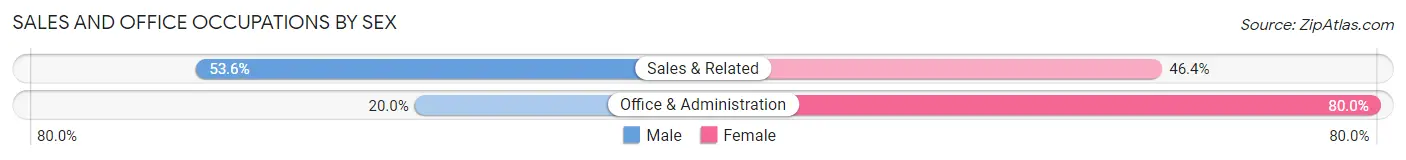
| Occupation | Male | Female |
| Sales & Related | 1,310 (53.6%) | 1,135 (46.4%) |
| Office & Administration | 739 (20.0%) | 2,954 (80.0%) |
| Total (Category) | 2,049 (33.4%) | 4,089 (66.6%) |
| Total (Overall) | 13,714 (47.4%) | 15,235 (52.6%) |
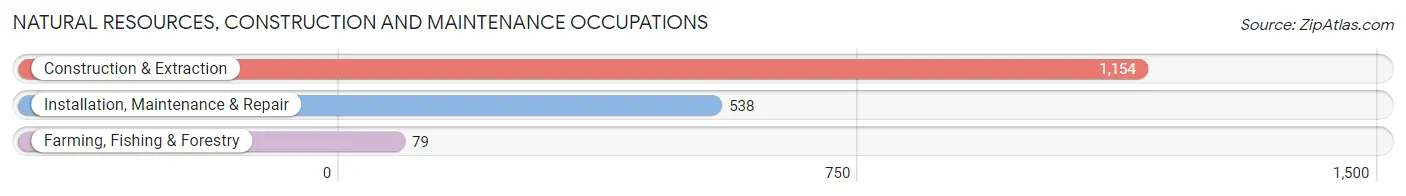
Natural Resources, Construction and Maintenance Occupations
The most common Natural Resources, Construction and Maintenance occupations in Canton are Construction & Extraction (1,154 | 4.0%), Installation, Maintenance & Repair (538 | 1.9%), and Farming, Fishing & Forestry (79 | 0.3%).
Natural Resources, Construction and Maintenance Occupations by Sex
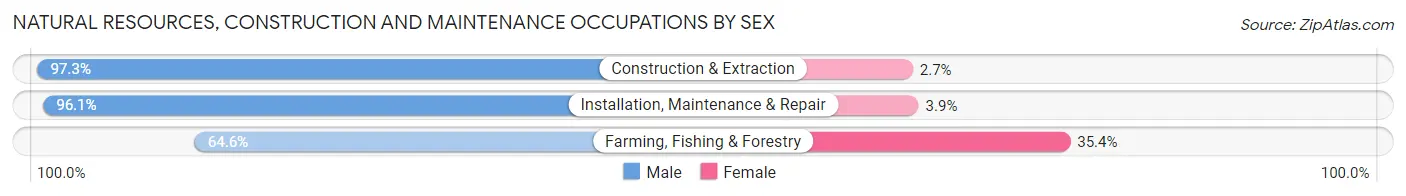
| Occupation | Male | Female |
| Farming, Fishing & Forestry | 51 (64.6%) | 28 (35.4%) |
| Construction & Extraction | 1,123 (97.3%) | 31 (2.7%) |
| Installation, Maintenance & Repair | 517 (96.1%) | 21 (3.9%) |
| Total (Category) | 1,691 (95.5%) | 80 (4.5%) |
| Total (Overall) | 13,714 (47.4%) | 15,235 (52.6%) |
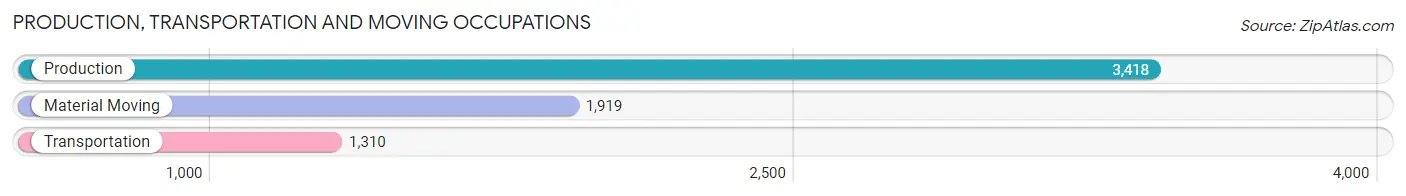
Production, Transportation and Moving Occupations
The most common Production, Transportation and Moving occupations in Canton are Production (3,418 | 11.8%), Material Moving (1,919 | 6.6%), and Transportation (1,310 | 4.5%).
Production, Transportation and Moving Occupations by Sex
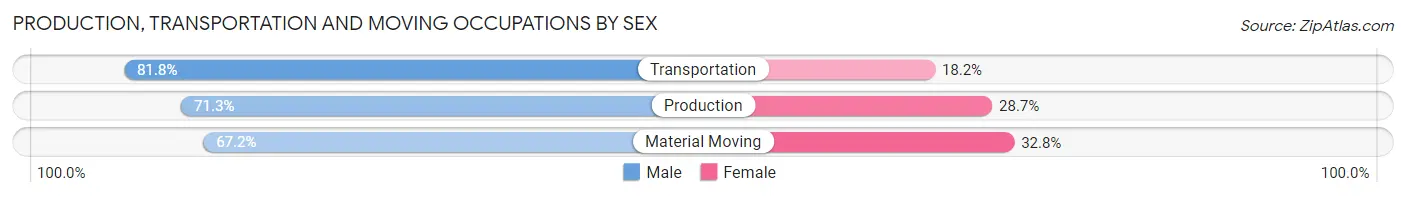
| Occupation | Male | Female |
| Production | 2,436 (71.3%) | 982 (28.7%) |
| Transportation | 1,071 (81.8%) | 239 (18.2%) |
| Material Moving | 1,290 (67.2%) | 629 (32.8%) |
| Total (Category) | 4,797 (72.2%) | 1,850 (27.8%) |
| Total (Overall) | 13,714 (47.4%) | 15,235 (52.6%) |
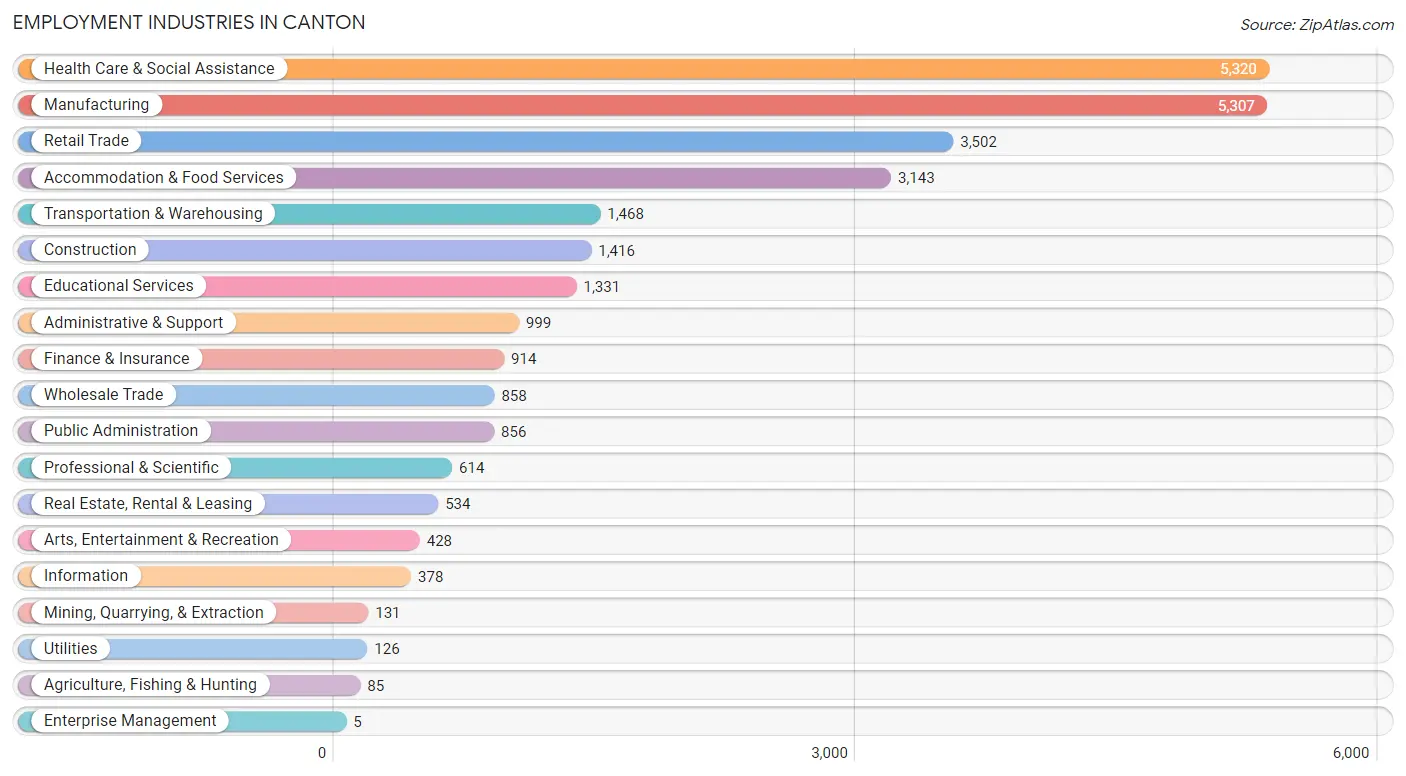
Employment Industries by Sex in Canton
Employment Industries in Canton
The major employment industries in Canton include Health Care & Social Assistance (5,320 | 18.4%), Manufacturing (5,307 | 18.3%), Retail Trade (3,502 | 12.1%), Accommodation & Food Services (3,143 | 10.9%), and Transportation & Warehousing (1,468 | 5.1%).
Employment Industries by Sex in Canton
The Canton industries that see more men than women are Construction (94.1%), Utilities (90.5%), and Mining, Quarrying, & Extraction (85.5%), whereas the industries that tend to have a higher number of women are Enterprise Management (100.0%), Health Care & Social Assistance (85.8%), and Finance & Insurance (80.3%).
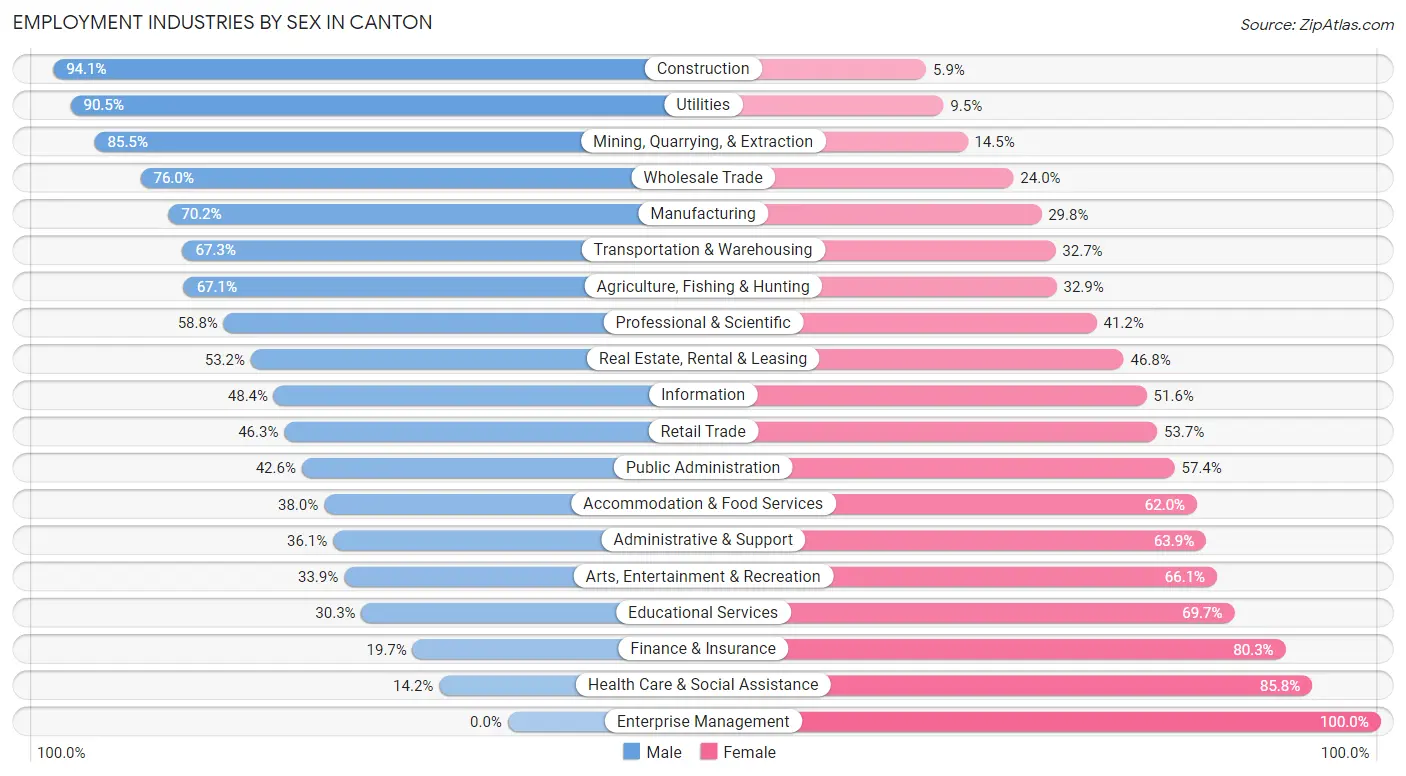
| Industry | Male | Female |
| Agriculture, Fishing & Hunting | 57 (67.1%) | 28 (32.9%) |
| Mining, Quarrying, & Extraction | 112 (85.5%) | 19 (14.5%) |
| Construction | 1,332 (94.1%) | 84 (5.9%) |
| Manufacturing | 3,727 (70.2%) | 1,580 (29.8%) |
| Wholesale Trade | 652 (76.0%) | 206 (24.0%) |
| Retail Trade | 1,620 (46.3%) | 1,882 (53.7%) |
| Transportation & Warehousing | 988 (67.3%) | 480 (32.7%) |
| Utilities | 114 (90.5%) | 12 (9.5%) |
| Information | 183 (48.4%) | 195 (51.6%) |
| Finance & Insurance | 180 (19.7%) | 734 (80.3%) |
| Real Estate, Rental & Leasing | 284 (53.2%) | 250 (46.8%) |
| Professional & Scientific | 361 (58.8%) | 253 (41.2%) |
| Enterprise Management | 0 (0.0%) | 5 (100.0%) |
| Administrative & Support | 361 (36.1%) | 638 (63.9%) |
| Educational Services | 403 (30.3%) | 928 (69.7%) |
| Health Care & Social Assistance | 755 (14.2%) | 4,565 (85.8%) |
| Arts, Entertainment & Recreation | 145 (33.9%) | 283 (66.1%) |
| Accommodation & Food Services | 1,195 (38.0%) | 1,948 (62.0%) |
| Public Administration | 365 (42.6%) | 491 (57.4%) |
| Total | 13,714 (47.4%) | 15,235 (52.6%) |
Education in Canton
School Enrollment in Canton
The most common levels of schooling among the 15,760 students in Canton are elementary school (3,943 | 25.0%), middle school (3,613 | 22.9%), and high school (3,219 | 20.4%).
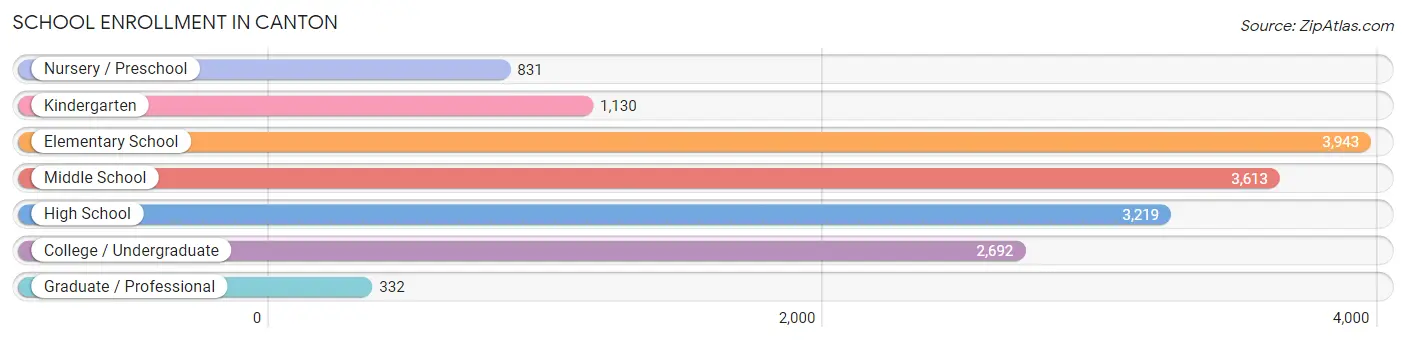
| School Level | # Students | % Students |
| Nursery / Preschool | 831 | 5.3% |
| Kindergarten | 1,130 | 7.2% |
| Elementary School | 3,943 | 25.0% |
| Middle School | 3,613 | 22.9% |
| High School | 3,219 | 20.4% |
| College / Undergraduate | 2,692 | 17.1% |
| Graduate / Professional | 332 | 2.1% |
| Total | 15,760 | 100.0% |
School Enrollment by Age by Funding Source in Canton
Out of a total of 15,760 students who are enrolled in schools in Canton, 2,931 (18.6%) attend a private institution, while the remaining 12,829 (81.4%) are enrolled in public schools. The age group of 20 to 24 year olds has the highest likelihood of being enrolled in private schools, with 531 (48.0% in the age bracket) enrolled. Conversely, the age group of 15 to 17 year olds has the lowest likelihood of being enrolled in a private school, with 2,264 (89.8% in the age bracket) attending a public institution.
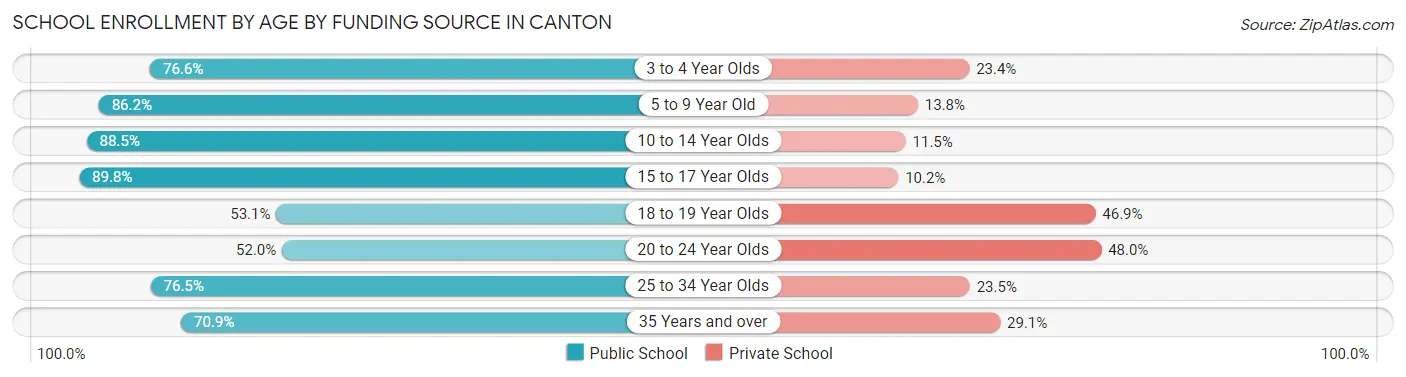
| Age Bracket | Public School | Private School |
| 3 to 4 Year Olds | 462 (76.6%) | 141 (23.4%) |
| 5 to 9 Year Old | 4,035 (86.2%) | 647 (13.8%) |
| 10 to 14 Year Olds | 3,887 (88.5%) | 507 (11.5%) |
| 15 to 17 Year Olds | 2,264 (89.8%) | 256 (10.2%) |
| 18 to 19 Year Olds | 503 (53.1%) | 444 (46.9%) |
| 20 to 24 Year Olds | 576 (52.0%) | 531 (48.0%) |
| 25 to 34 Year Olds | 502 (76.5%) | 154 (23.5%) |
| 35 Years and over | 603 (70.9%) | 248 (29.1%) |
| Total | 12,829 (81.4%) | 2,931 (18.6%) |
Educational Attainment by Field of Study in Canton
Business (1,564 | 22.0%), education (1,099 | 15.5%), science & technology (834 | 11.7%), arts & humanities (567 | 8.0%), and psychology (501 | 7.0%) are the most common fields of study among 7,109 individuals in Canton who have obtained a bachelor's degree or higher.
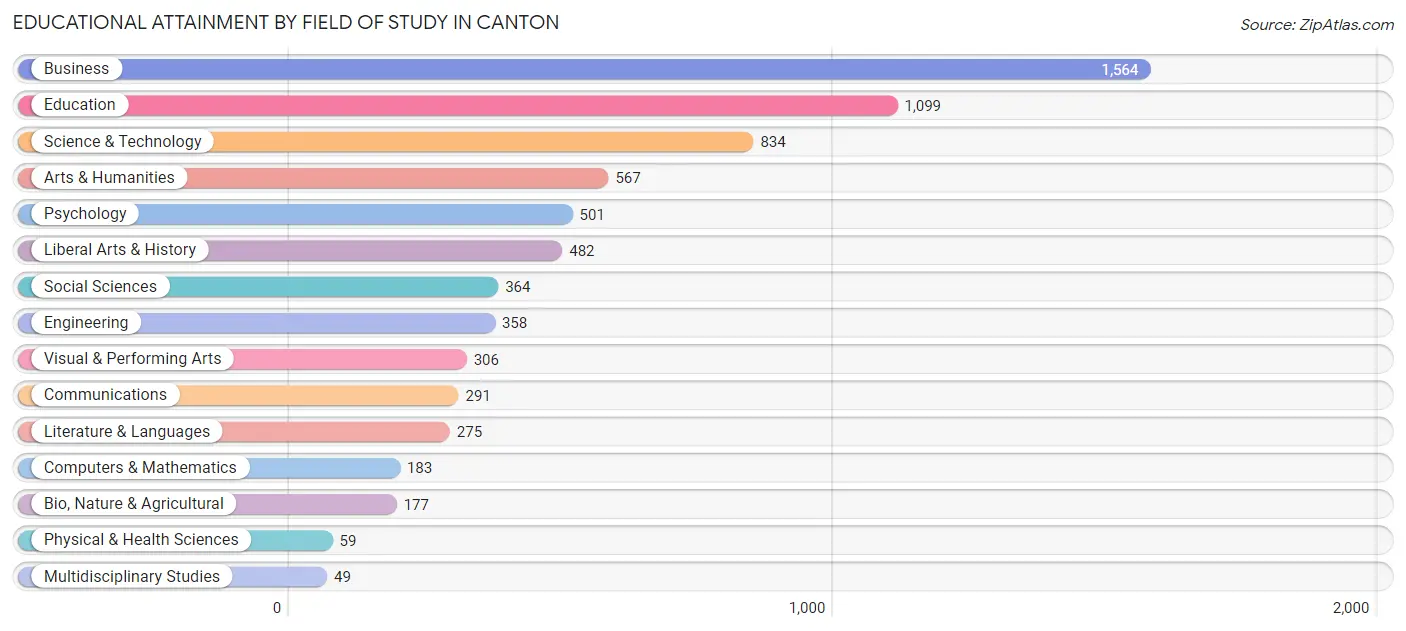
| Field of Study | # Graduates | % Graduates |
| Computers & Mathematics | 183 | 2.6% |
| Bio, Nature & Agricultural | 177 | 2.5% |
| Physical & Health Sciences | 59 | 0.8% |
| Psychology | 501 | 7.0% |
| Social Sciences | 364 | 5.1% |
| Engineering | 358 | 5.0% |
| Multidisciplinary Studies | 49 | 0.7% |
| Science & Technology | 834 | 11.7% |
| Business | 1,564 | 22.0% |
| Education | 1,099 | 15.5% |
| Literature & Languages | 275 | 3.9% |
| Liberal Arts & History | 482 | 6.8% |
| Visual & Performing Arts | 306 | 4.3% |
| Communications | 291 | 4.1% |
| Arts & Humanities | 567 | 8.0% |
| Total | 7,109 | 100.0% |
Transportation & Commute in Canton
Vehicle Availability by Sex in Canton
The most prevalent vehicle ownership categories in Canton are males with 2 vehicles (5,585, accounting for 41.4%) and females with 2 vehicles (4,743, making up 38.2%).
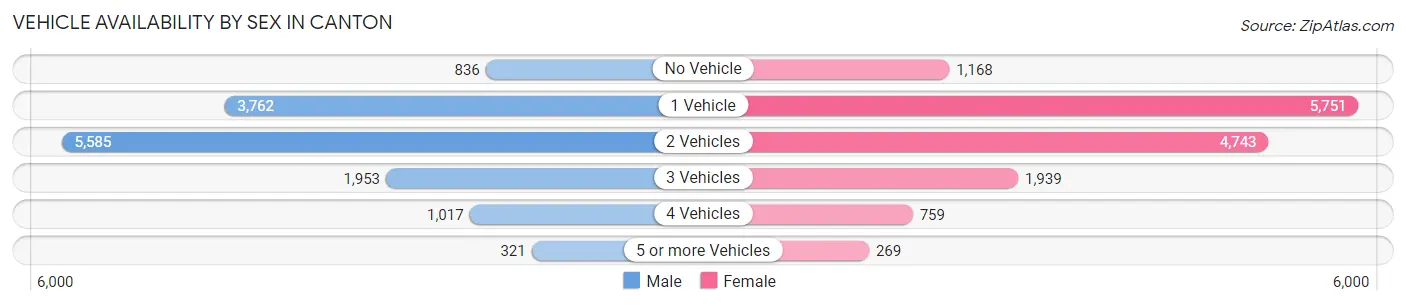
| Vehicles Available | Male | Female |
| No Vehicle | 836 (6.2%) | 1,168 (8.0%) |
| 1 Vehicle | 3,762 (27.9%) | 5,751 (39.3%) |
| 2 Vehicles | 5,585 (41.4%) | 4,743 (32.4%) |
| 3 Vehicles | 1,953 (14.5%) | 1,939 (13.3%) |
| 4 Vehicles | 1,017 (7.5%) | 759 (5.2%) |
| 5 or more Vehicles | 321 (2.4%) | 269 (1.8%) |
| Total | 13,474 (100.0%) | 14,629 (100.0%) |
Commute Time in Canton
The most frequently occuring commute durations in Canton are 10 to 14 minutes (6,517 commuters, 24.3%), 15 to 19 minutes (5,113 commuters, 19.1%), and 5 to 9 minutes (3,830 commuters, 14.3%).
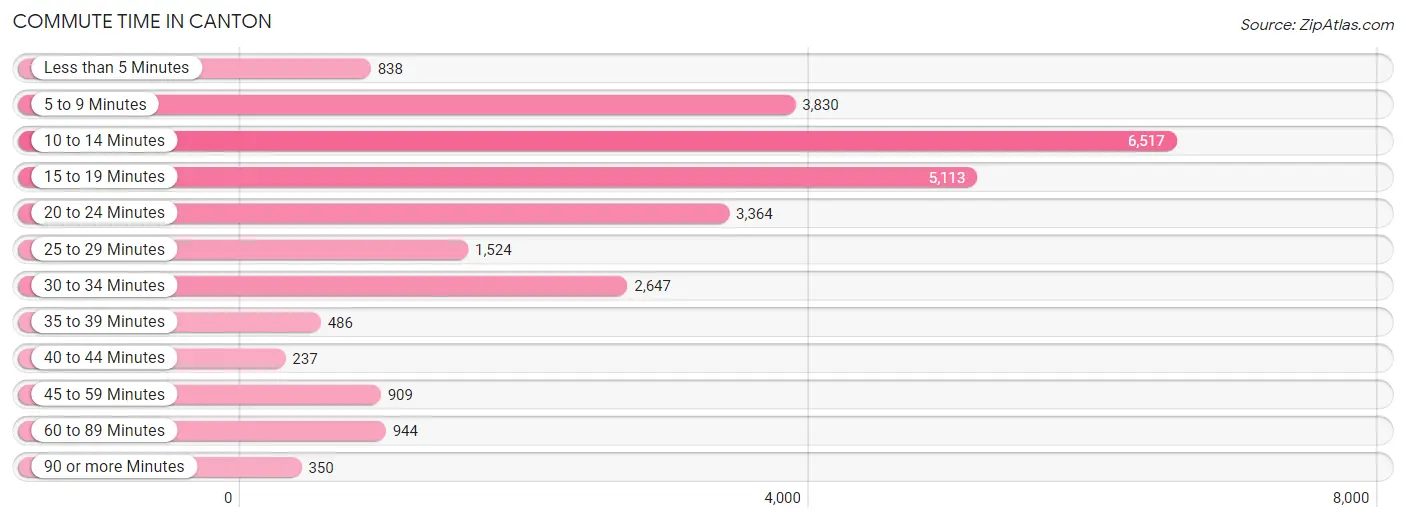
| Commute Time | # Commuters | % Commuters |
| Less than 5 Minutes | 838 | 3.1% |
| 5 to 9 Minutes | 3,830 | 14.3% |
| 10 to 14 Minutes | 6,517 | 24.3% |
| 15 to 19 Minutes | 5,113 | 19.1% |
| 20 to 24 Minutes | 3,364 | 12.6% |
| 25 to 29 Minutes | 1,524 | 5.7% |
| 30 to 34 Minutes | 2,647 | 9.9% |
| 35 to 39 Minutes | 486 | 1.8% |
| 40 to 44 Minutes | 237 | 0.9% |
| 45 to 59 Minutes | 909 | 3.4% |
| 60 to 89 Minutes | 944 | 3.5% |
| 90 or more Minutes | 350 | 1.3% |
Commute Time by Sex in Canton
The most common commute times in Canton are 10 to 14 minutes (2,856 commuters, 22.2%) for males and 10 to 14 minutes (3,661 commuters, 26.4%) for females.
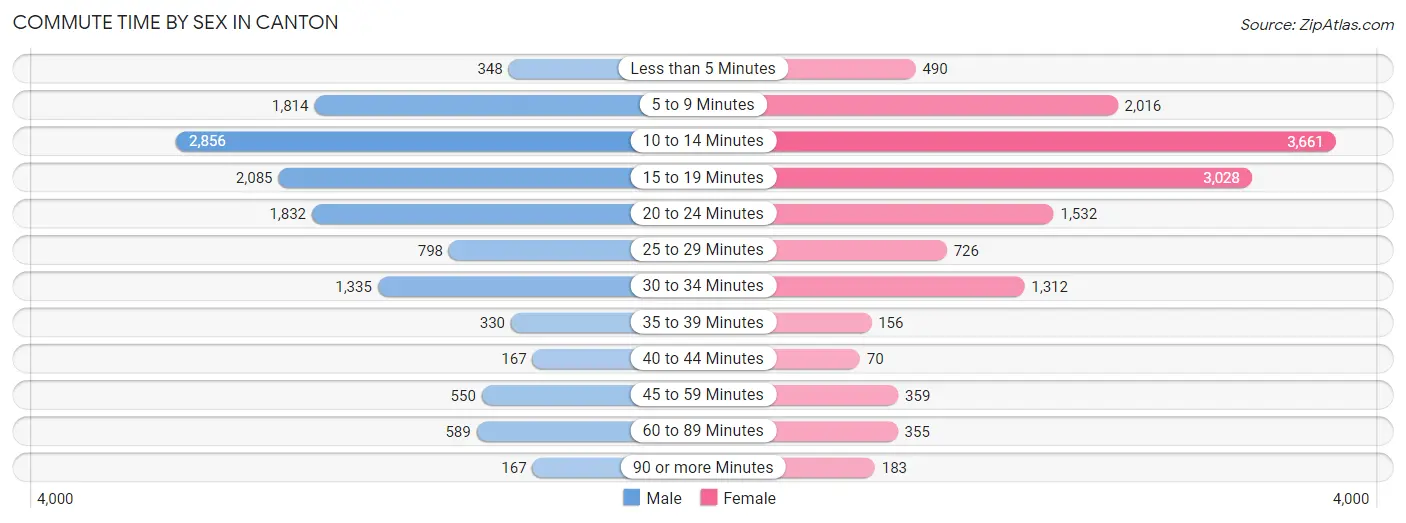
| Commute Time | Male | Female |
| Less than 5 Minutes | 348 (2.7%) | 490 (3.5%) |
| 5 to 9 Minutes | 1,814 (14.1%) | 2,016 (14.5%) |
| 10 to 14 Minutes | 2,856 (22.2%) | 3,661 (26.4%) |
| 15 to 19 Minutes | 2,085 (16.2%) | 3,028 (21.8%) |
| 20 to 24 Minutes | 1,832 (14.2%) | 1,532 (11.0%) |
| 25 to 29 Minutes | 798 (6.2%) | 726 (5.2%) |
| 30 to 34 Minutes | 1,335 (10.4%) | 1,312 (9.5%) |
| 35 to 39 Minutes | 330 (2.6%) | 156 (1.1%) |
| 40 to 44 Minutes | 167 (1.3%) | 70 (0.5%) |
| 45 to 59 Minutes | 550 (4.3%) | 359 (2.6%) |
| 60 to 89 Minutes | 589 (4.6%) | 355 (2.6%) |
| 90 or more Minutes | 167 (1.3%) | 183 (1.3%) |
Time of Departure to Work by Sex in Canton
The most frequent times of departure to work in Canton are 12:00 PM to 3:59 PM (1,961, 15.2%) for males and 7:30 AM to 7:59 AM (1,847, 13.3%) for females.
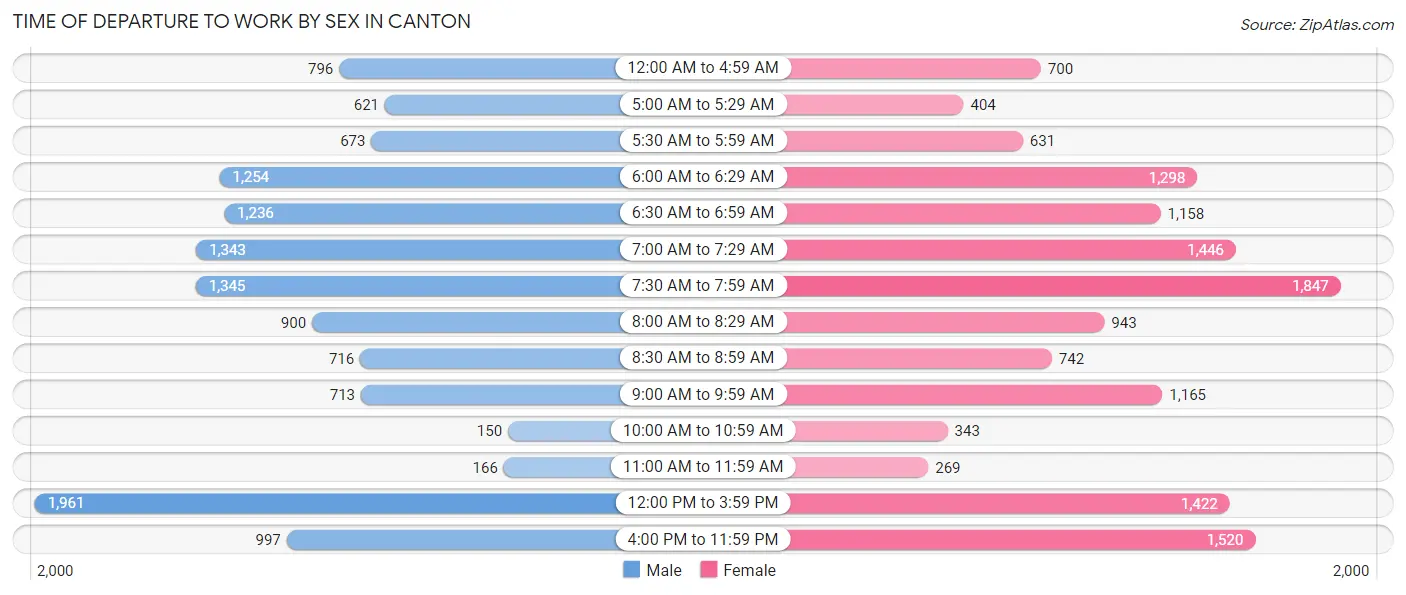
| Time of Departure | Male | Female |
| 12:00 AM to 4:59 AM | 796 (6.2%) | 700 (5.0%) |
| 5:00 AM to 5:29 AM | 621 (4.8%) | 404 (2.9%) |
| 5:30 AM to 5:59 AM | 673 (5.2%) | 631 (4.5%) |
| 6:00 AM to 6:29 AM | 1,254 (9.7%) | 1,298 (9.3%) |
| 6:30 AM to 6:59 AM | 1,236 (9.6%) | 1,158 (8.3%) |
| 7:00 AM to 7:29 AM | 1,343 (10.4%) | 1,446 (10.4%) |
| 7:30 AM to 7:59 AM | 1,345 (10.4%) | 1,847 (13.3%) |
| 8:00 AM to 8:29 AM | 900 (7.0%) | 943 (6.8%) |
| 8:30 AM to 8:59 AM | 716 (5.6%) | 742 (5.3%) |
| 9:00 AM to 9:59 AM | 713 (5.5%) | 1,165 (8.4%) |
| 10:00 AM to 10:59 AM | 150 (1.2%) | 343 (2.5%) |
| 11:00 AM to 11:59 AM | 166 (1.3%) | 269 (1.9%) |
| 12:00 PM to 3:59 PM | 1,961 (15.2%) | 1,422 (10.2%) |
| 4:00 PM to 11:59 PM | 997 (7.7%) | 1,520 (10.9%) |
| Total | 12,871 (100.0%) | 13,888 (100.0%) |
Housing Occupancy in Canton
Occupancy by Ownership in Canton
Of the total 30,466 dwellings in Canton, owner-occupied units account for 14,692 (48.2%), while renter-occupied units make up 15,774 (51.8%).
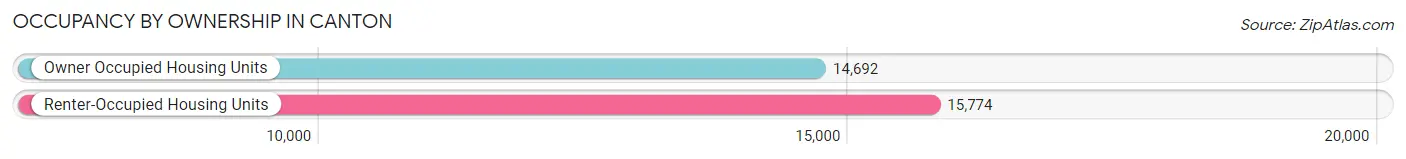
| Occupancy | # Housing Units | % Housing Units |
| Owner Occupied Housing Units | 14,692 | 48.2% |
| Renter-Occupied Housing Units | 15,774 | 51.8% |
| Total Occupied Housing Units | 30,466 | 100.0% |
Occupancy by Household Size in Canton
| Household Size | # Housing Units | % Housing Units |
| 1-Person Household | 12,217 | 40.1% |
| 2-Person Household | 8,785 | 28.8% |
| 3-Person Household | 4,303 | 14.1% |
| 4+ Person Household | 5,161 | 16.9% |
| Total Housing Units | 30,466 | 100.0% |
Occupancy by Ownership by Household Size in Canton
| Household Size | Owner-occupied | Renter-occupied |
| 1-Person Household | 5,259 (43.0%) | 6,958 (57.0%) |
| 2-Person Household | 5,299 (60.3%) | 3,486 (39.7%) |
| 3-Person Household | 2,093 (48.6%) | 2,210 (51.4%) |
| 4+ Person Household | 2,041 (39.6%) | 3,120 (60.5%) |
| Total Housing Units | 14,692 (48.2%) | 15,774 (51.8%) |
Occupancy by Educational Attainment in Canton
| Household Size | Owner-occupied | Renter-occupied |
| Less than High School | 1,101 (31.5%) | 2,397 (68.5%) |
| High School Diploma | 5,416 (48.3%) | 5,795 (51.7%) |
| College/Associate Degree | 5,022 (44.1%) | 6,370 (55.9%) |
| Bachelor's Degree or higher | 3,153 (72.2%) | 1,212 (27.8%) |
Occupancy by Age of Householder in Canton
| Age Bracket | # Households | % Households |
| Under 35 Years | 7,286 | 23.9% |
| 35 to 44 Years | 4,965 | 16.3% |
| 45 to 54 Years | 4,900 | 16.1% |
| 55 to 64 Years | 6,092 | 20.0% |
| 65 to 74 Years | 4,536 | 14.9% |
| 75 to 84 Years | 1,822 | 6.0% |
| 85 Years and Over | 865 | 2.8% |
| Total | 30,466 | 100.0% |
Housing Finances in Canton
Median Income by Occupancy in Canton
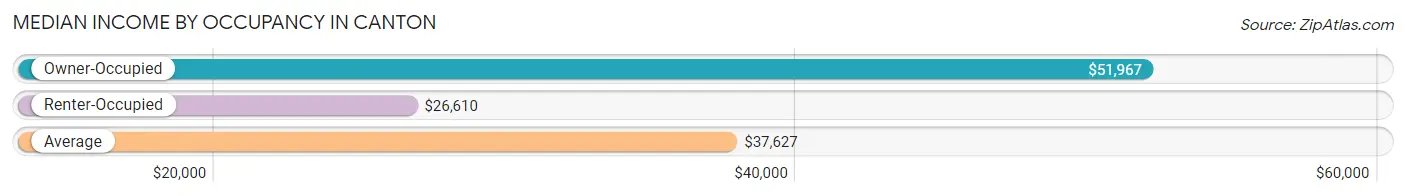
| Occupancy Type | # Households | Median Income |
| Owner-Occupied | 14,692 (48.2%) | $51,967 |
| Renter-Occupied | 15,774 (51.8%) | $26,610 |
| Average | 30,466 (100.0%) | $37,627 |
Occupancy by Householder Income Bracket in Canton
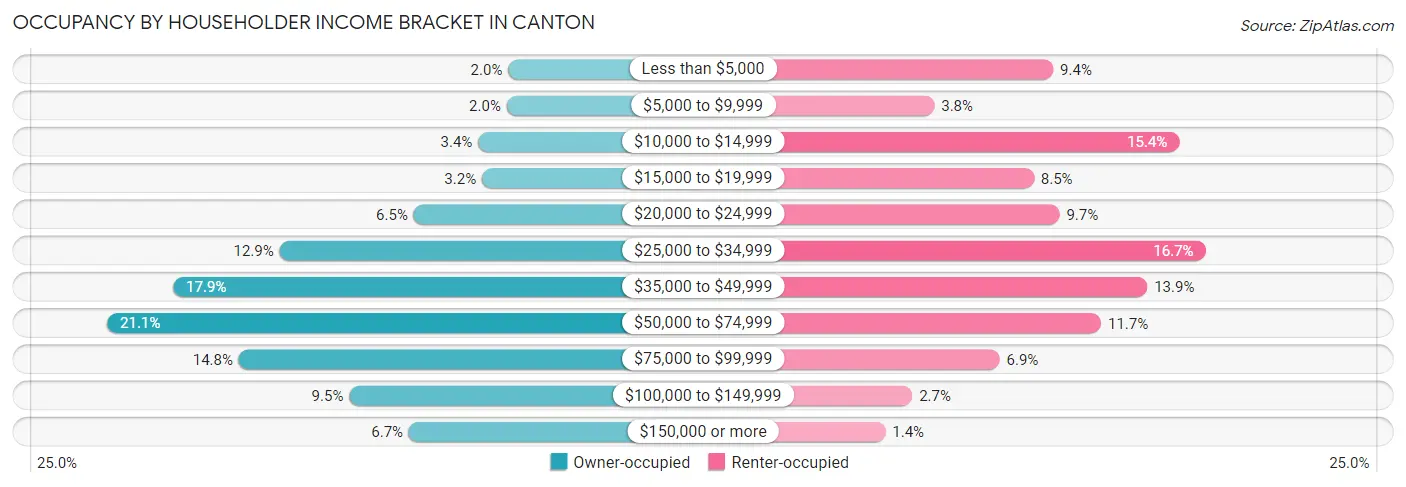
| Income Bracket | Owner-occupied | Renter-occupied |
| Less than $5,000 | 290 (2.0%) | 1,485 (9.4%) |
| $5,000 to $9,999 | 300 (2.0%) | 592 (3.7%) |
| $10,000 to $14,999 | 499 (3.4%) | 2,431 (15.4%) |
| $15,000 to $19,999 | 473 (3.2%) | 1,339 (8.5%) |
| $20,000 to $24,999 | 950 (6.5%) | 1,532 (9.7%) |
| $25,000 to $34,999 | 1,889 (12.9%) | 2,628 (16.7%) |
| $35,000 to $49,999 | 2,635 (17.9%) | 2,191 (13.9%) |
| $50,000 to $74,999 | 3,096 (21.1%) | 1,844 (11.7%) |
| $75,000 to $99,999 | 2,174 (14.8%) | 1,082 (6.9%) |
| $100,000 to $149,999 | 1,401 (9.5%) | 426 (2.7%) |
| $150,000 or more | 985 (6.7%) | 224 (1.4%) |
| Total | 14,692 (100.0%) | 15,774 (100.0%) |
Monthly Housing Cost Tiers in Canton
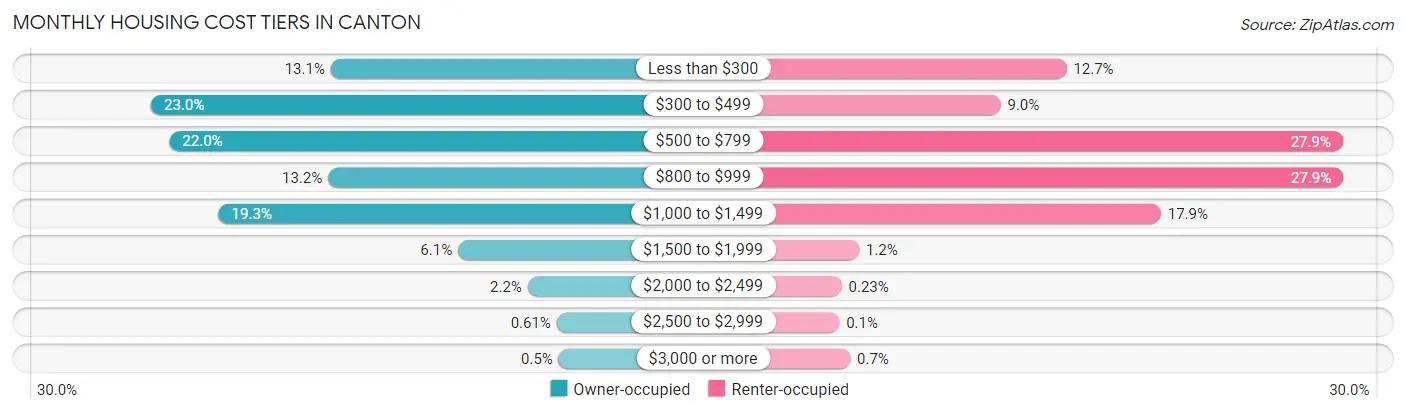
| Monthly Cost | Owner-occupied | Renter-occupied |
| Less than $300 | 1,923 (13.1%) | 1,996 (12.7%) |
| $300 to $499 | 3,381 (23.0%) | 1,421 (9.0%) |
| $500 to $799 | 3,232 (22.0%) | 4,403 (27.9%) |
| $800 to $999 | 1,945 (13.2%) | 4,406 (27.9%) |
| $1,000 to $1,499 | 2,832 (19.3%) | 2,818 (17.9%) |
| $1,500 to $1,999 | 890 (6.1%) | 187 (1.2%) |
| $2,000 to $2,499 | 325 (2.2%) | 36 (0.2%) |
| $2,500 to $2,999 | 90 (0.6%) | 15 (0.1%) |
| $3,000 or more | 74 (0.5%) | 110 (0.7%) |
| Total | 14,692 (100.0%) | 15,774 (100.0%) |
Physical Housing Characteristics in Canton
Housing Structures in Canton
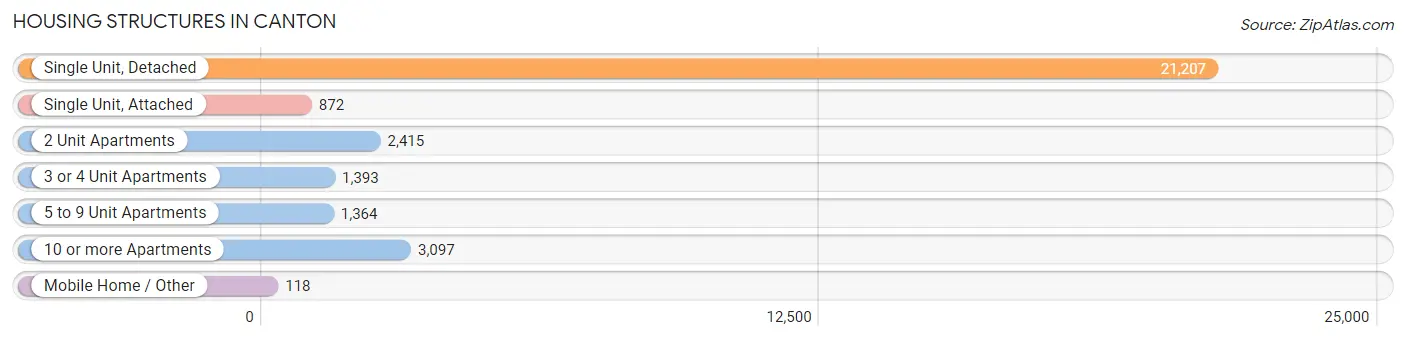
| Structure Type | # Housing Units | % Housing Units |
| Single Unit, Detached | 21,207 | 69.6% |
| Single Unit, Attached | 872 | 2.9% |
| 2 Unit Apartments | 2,415 | 7.9% |
| 3 or 4 Unit Apartments | 1,393 | 4.6% |
| 5 to 9 Unit Apartments | 1,364 | 4.5% |
| 10 or more Apartments | 3,097 | 10.2% |
| Mobile Home / Other | 118 | 0.4% |
| Total | 30,466 | 100.0% |
Housing Structures by Occupancy in Canton
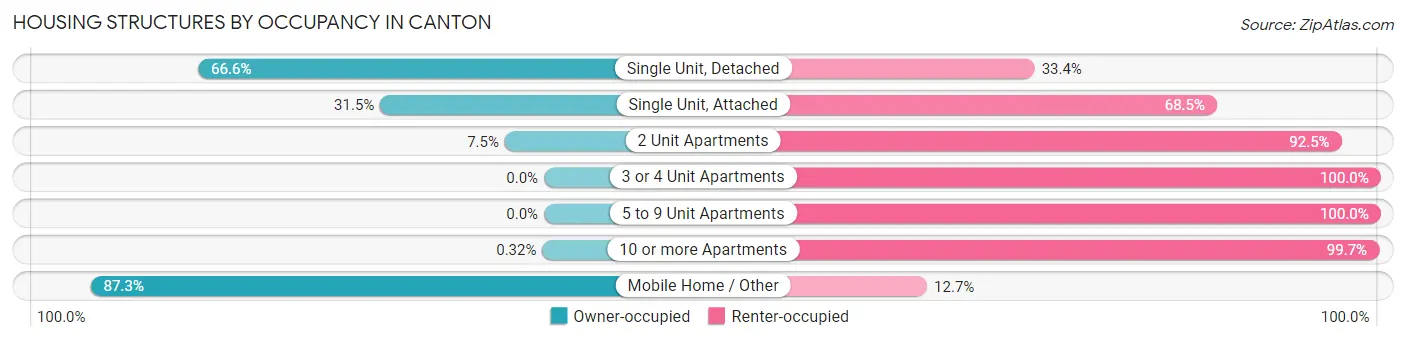
| Structure Type | Owner-occupied | Renter-occupied |
| Single Unit, Detached | 14,122 (66.6%) | 7,085 (33.4%) |
| Single Unit, Attached | 275 (31.5%) | 597 (68.5%) |
| 2 Unit Apartments | 182 (7.5%) | 2,233 (92.5%) |
| 3 or 4 Unit Apartments | 0 (0.0%) | 1,393 (100.0%) |
| 5 to 9 Unit Apartments | 0 (0.0%) | 1,364 (100.0%) |
| 10 or more Apartments | 10 (0.3%) | 3,087 (99.7%) |
| Mobile Home / Other | 103 (87.3%) | 15 (12.7%) |
| Total | 14,692 (48.2%) | 15,774 (51.8%) |
Housing Structures by Number of Rooms in Canton
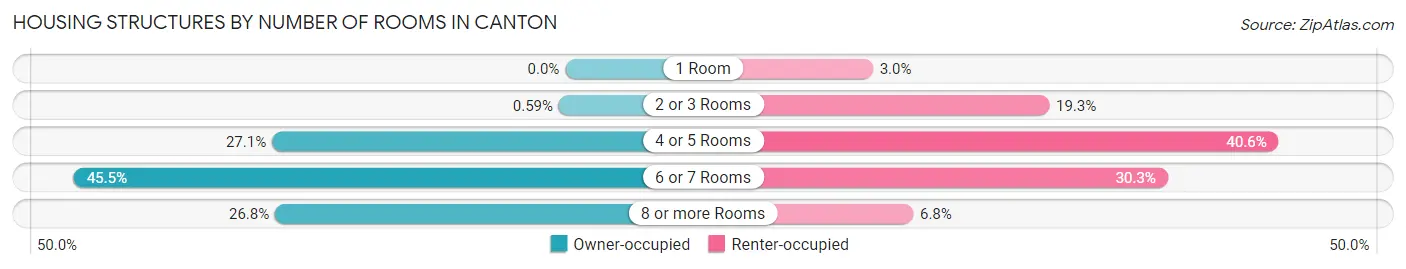
| Number of Rooms | Owner-occupied | Renter-occupied |
| 1 Room | 0 (0.0%) | 478 (3.0%) |
| 2 or 3 Rooms | 87 (0.6%) | 3,050 (19.3%) |
| 4 or 5 Rooms | 3,984 (27.1%) | 6,399 (40.6%) |
| 6 or 7 Rooms | 6,678 (45.5%) | 4,781 (30.3%) |
| 8 or more Rooms | 3,943 (26.8%) | 1,066 (6.8%) |
| Total | 14,692 (100.0%) | 15,774 (100.0%) |
Housing Structure by Heating Type in Canton
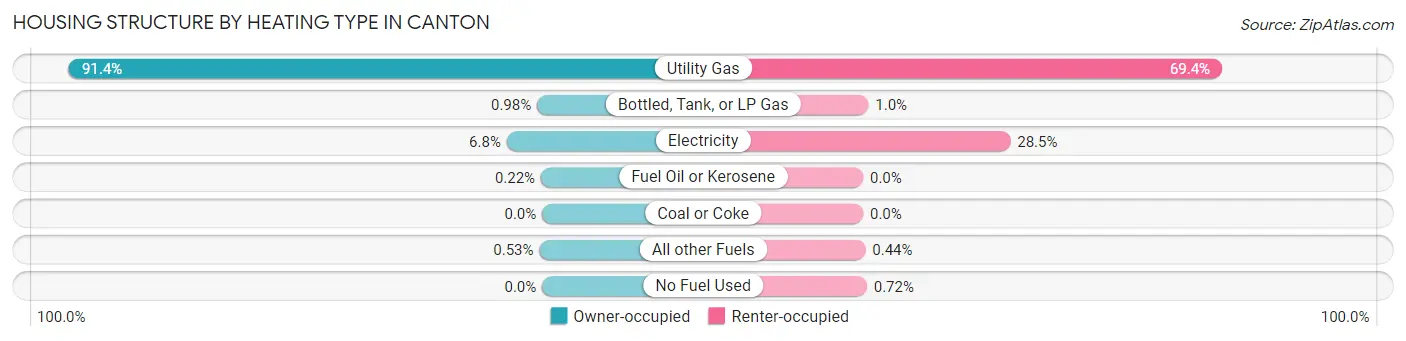
| Heating Type | Owner-occupied | Renter-occupied |
| Utility Gas | 13,433 (91.4%) | 10,939 (69.4%) |
| Bottled, Tank, or LP Gas | 144 (1.0%) | 162 (1.0%) |
| Electricity | 1,004 (6.8%) | 4,490 (28.5%) |
| Fuel Oil or Kerosene | 33 (0.2%) | 0 (0.0%) |
| Coal or Coke | 0 (0.0%) | 0 (0.0%) |
| All other Fuels | 78 (0.5%) | 69 (0.4%) |
| No Fuel Used | 0 (0.0%) | 114 (0.7%) |
| Total | 14,692 (100.0%) | 15,774 (100.0%) |
Household Vehicle Usage in Canton
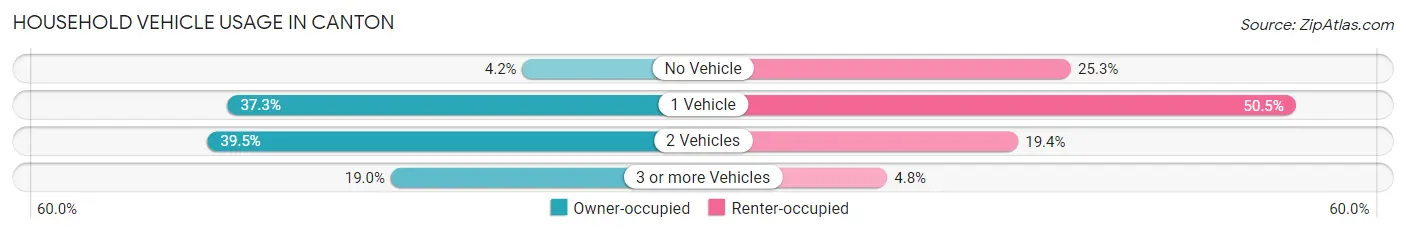
| Vehicles per Household | Owner-occupied | Renter-occupied |
| No Vehicle | 622 (4.2%) | 3,997 (25.3%) |
| 1 Vehicle | 5,475 (37.3%) | 7,963 (50.5%) |
| 2 Vehicles | 5,806 (39.5%) | 3,064 (19.4%) |
| 3 or more Vehicles | 2,789 (19.0%) | 750 (4.8%) |
| Total | 14,692 (100.0%) | 15,774 (100.0%) |
Real Estate & Mortgages in Canton
Real Estate and Mortgage Overview in Canton
| Characteristic | Without Mortgage | With Mortgage |
| Housing Units | 6,409 | 8,283 |
| Median Property Value | $64,600 | $99,100 |
| Median Household Income | $41,406 | $681 |
| Monthly Housing Costs | $376 | $39 |
| Real Estate Taxes | $939 | $233 |
Property Value by Mortgage Status in Canton
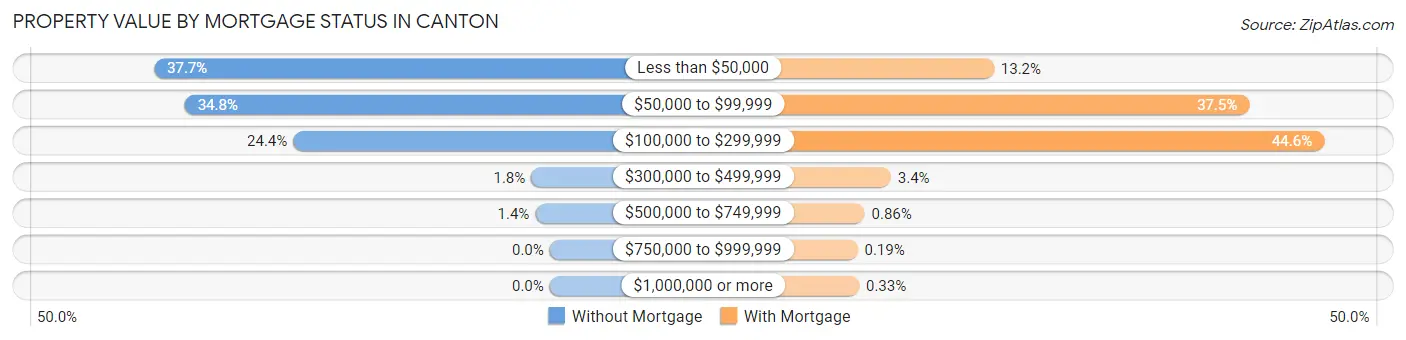
| Property Value | Without Mortgage | With Mortgage |
| Less than $50,000 | 2,415 (37.7%) | 1,091 (13.2%) |
| $50,000 to $99,999 | 2,227 (34.7%) | 3,105 (37.5%) |
| $100,000 to $299,999 | 1,566 (24.4%) | 3,695 (44.6%) |
| $300,000 to $499,999 | 113 (1.8%) | 278 (3.4%) |
| $500,000 to $749,999 | 88 (1.4%) | 71 (0.9%) |
| $750,000 to $999,999 | 0 (0.0%) | 16 (0.2%) |
| $1,000,000 or more | 0 (0.0%) | 27 (0.3%) |
| Total | 6,409 (100.0%) | 8,283 (100.0%) |
Household Income by Mortgage Status in Canton
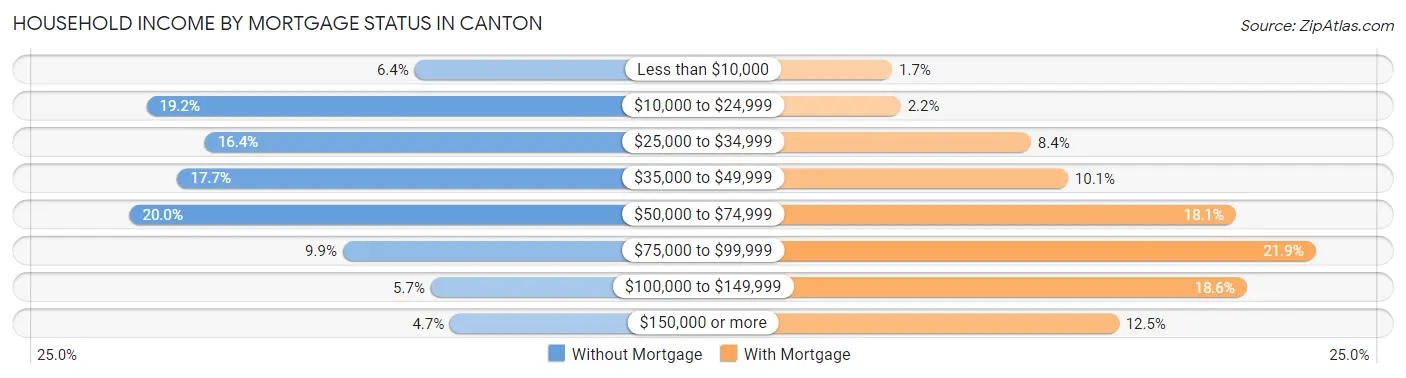
| Household Income | Without Mortgage | With Mortgage |
| Less than $10,000 | 412 (6.4%) | 144 (1.7%) |
| $10,000 to $24,999 | 1,230 (19.2%) | 178 (2.1%) |
| $25,000 to $34,999 | 1,052 (16.4%) | 692 (8.4%) |
| $35,000 to $49,999 | 1,135 (17.7%) | 837 (10.1%) |
| $50,000 to $74,999 | 1,282 (20.0%) | 1,500 (18.1%) |
| $75,000 to $99,999 | 631 (9.9%) | 1,814 (21.9%) |
| $100,000 to $149,999 | 363 (5.7%) | 1,543 (18.6%) |
| $150,000 or more | 304 (4.7%) | 1,038 (12.5%) |
| Total | 6,409 (100.0%) | 8,283 (100.0%) |
Property Value to Household Income Ratio in Canton
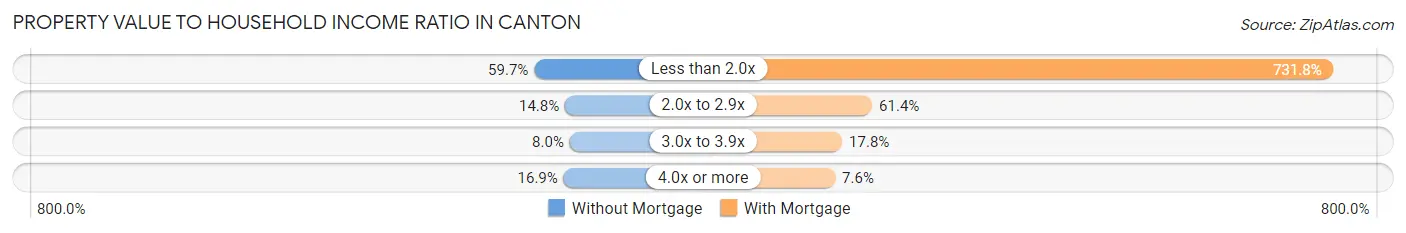
| Value-to-Income Ratio | Without Mortgage | With Mortgage |
| Less than 2.0x | 3,826 (59.7%) | 60,612 (731.8%) |
| 2.0x to 2.9x | 951 (14.8%) | 5,084 (61.4%) |
| 3.0x to 3.9x | 512 (8.0%) | 1,473 (17.8%) |
| 4.0x or more | 1,082 (16.9%) | 632 (7.6%) |
| Total | 6,409 (100.0%) | 8,283 (100.0%) |
Real Estate Taxes by Mortgage Status in Canton
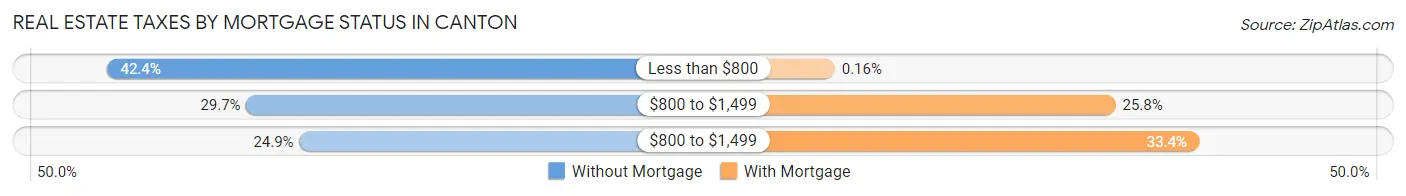
| Property Taxes | Without Mortgage | With Mortgage |
| Less than $800 | 2,719 (42.4%) | 13 (0.2%) |
| $800 to $1,499 | 1,906 (29.7%) | 2,137 (25.8%) |
| $800 to $1,499 | 1,596 (24.9%) | 2,767 (33.4%) |
| Total | 6,409 (100.0%) | 8,283 (100.0%) |
Health & Disability in Canton
Health Insurance Coverage by Age in Canton
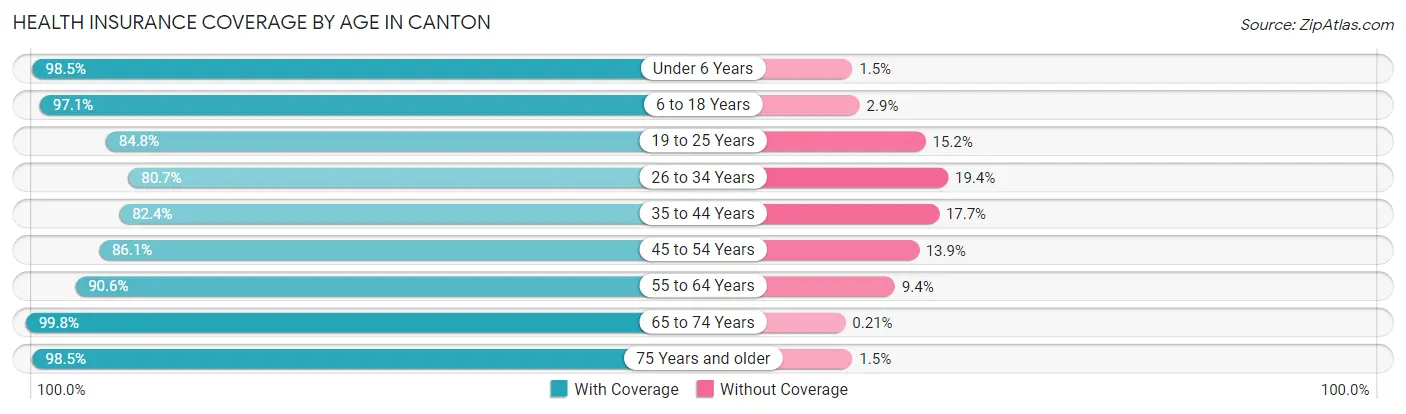
| Age Bracket | With Coverage | Without Coverage |
| Under 6 Years | 6,429 (98.5%) | 98 (1.5%) |
| 6 to 18 Years | 11,600 (97.1%) | 342 (2.9%) |
| 19 to 25 Years | 5,523 (84.8%) | 987 (15.2%) |
| 26 to 34 Years | 7,419 (80.6%) | 1,780 (19.4%) |
| 35 to 44 Years | 6,566 (82.4%) | 1,407 (17.6%) |
| 45 to 54 Years | 6,844 (86.1%) | 1,102 (13.9%) |
| 55 to 64 Years | 7,800 (90.6%) | 813 (9.4%) |
| 65 to 74 Years | 6,535 (99.8%) | 14 (0.2%) |
| 75 Years and older | 3,912 (98.5%) | 60 (1.5%) |
| Total | 62,628 (90.5%) | 6,603 (9.5%) |
Health Insurance Coverage by Citizenship Status in Canton
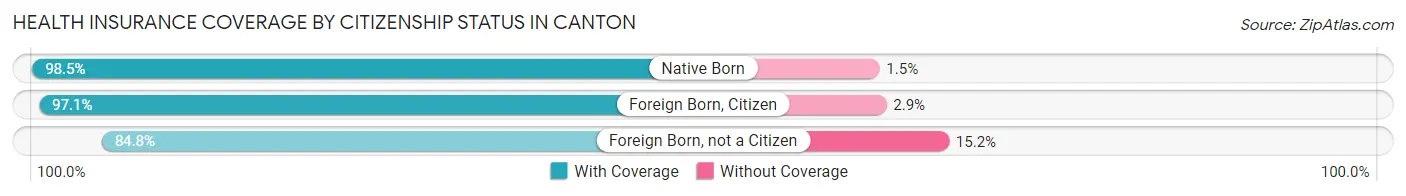
| Citizenship Status | With Coverage | Without Coverage |
| Native Born | 6,429 (98.5%) | 98 (1.5%) |
| Foreign Born, Citizen | 11,600 (97.1%) | 342 (2.9%) |
| Foreign Born, not a Citizen | 5,523 (84.8%) | 987 (15.2%) |
Health Insurance Coverage by Household Income in Canton
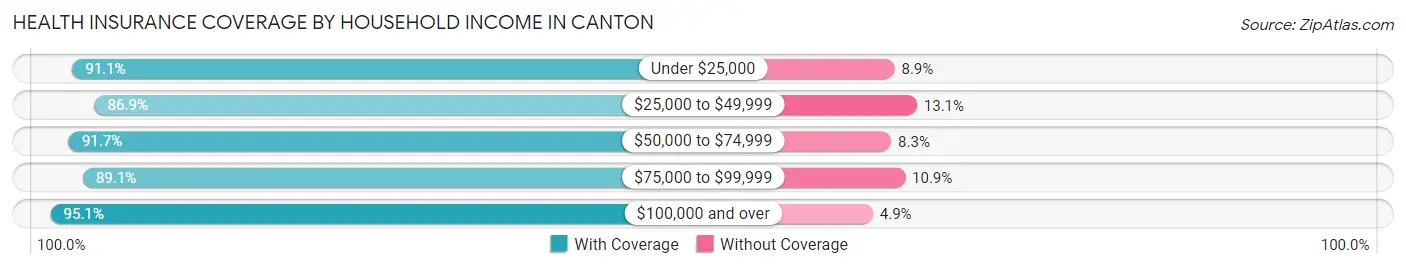
| Household Income | With Coverage | Without Coverage |
| Under $25,000 | 16,597 (91.1%) | 1,629 (8.9%) |
| $25,000 to $49,999 | 15,726 (86.9%) | 2,377 (13.1%) |
| $50,000 to $74,999 | 11,983 (91.7%) | 1,086 (8.3%) |
| $75,000 to $99,999 | 8,273 (89.1%) | 1,015 (10.9%) |
| $100,000 and over | 9,030 (95.1%) | 463 (4.9%) |
Public vs Private Health Insurance Coverage by Age in Canton
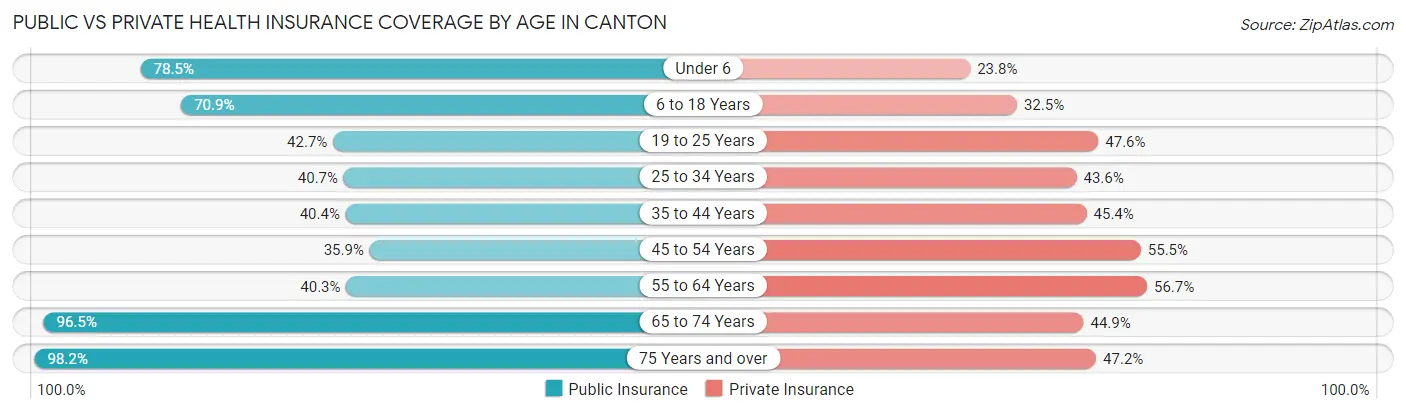
| Age Bracket | Public Insurance | Private Insurance |
| Under 6 | 5,121 (78.5%) | 1,556 (23.8%) |
| 6 to 18 Years | 8,469 (70.9%) | 3,884 (32.5%) |
| 19 to 25 Years | 2,782 (42.7%) | 3,100 (47.6%) |
| 25 to 34 Years | 3,748 (40.7%) | 4,008 (43.6%) |
| 35 to 44 Years | 3,220 (40.4%) | 3,623 (45.4%) |
| 45 to 54 Years | 2,856 (35.9%) | 4,411 (55.5%) |
| 55 to 64 Years | 3,469 (40.3%) | 4,880 (56.7%) |
| 65 to 74 Years | 6,318 (96.5%) | 2,939 (44.9%) |
| 75 Years and over | 3,899 (98.2%) | 1,875 (47.2%) |
| Total | 39,882 (57.6%) | 30,276 (43.7%) |
Disability Status by Sex by Age in Canton
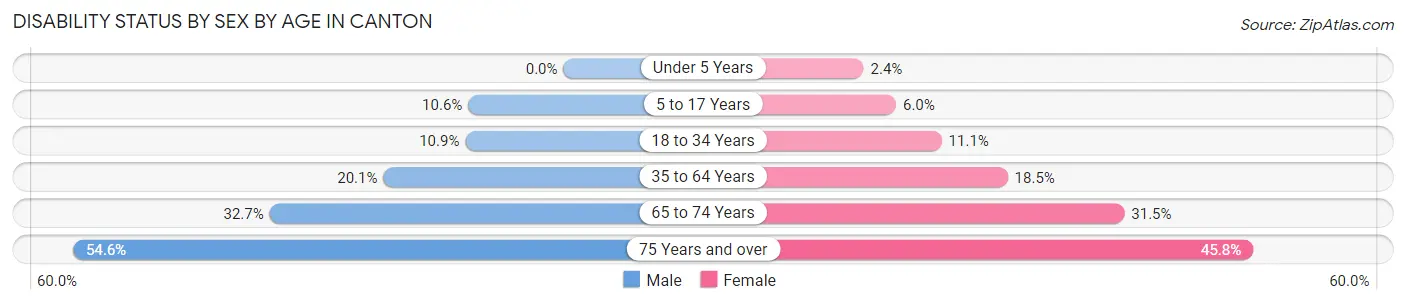
| Age Bracket | Male | Female |
| Under 5 Years | 0 (0.0%) | 59 (2.4%) |
| 5 to 17 Years | 676 (10.6%) | 366 (6.0%) |
| 18 to 34 Years | 883 (10.9%) | 941 (11.1%) |
| 35 to 64 Years | 2,355 (20.1%) | 2,362 (18.5%) |
| 65 to 74 Years | 998 (32.7%) | 1,101 (31.5%) |
| 75 Years and over | 830 (54.6%) | 1,123 (45.8%) |
Disability Class by Sex by Age in Canton
Disability Class: Hearing Difficulty
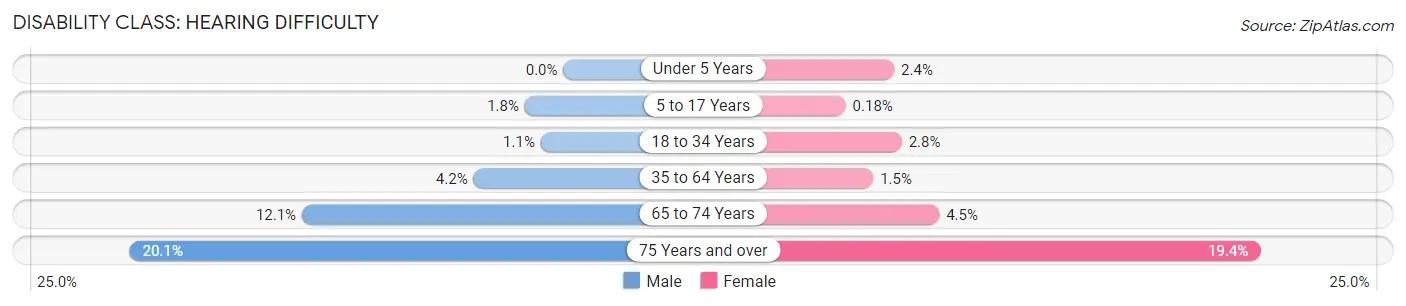
| Age Bracket | Male | Female |
| Under 5 Years | 0 (0.0%) | 59 (2.4%) |
| 5 to 17 Years | 114 (1.8%) | 11 (0.2%) |
| 18 to 34 Years | 85 (1.1%) | 235 (2.8%) |
| 35 to 64 Years | 490 (4.2%) | 187 (1.5%) |
| 65 to 74 Years | 370 (12.1%) | 158 (4.5%) |
| 75 Years and over | 306 (20.1%) | 476 (19.4%) |
Disability Class: Vision Difficulty
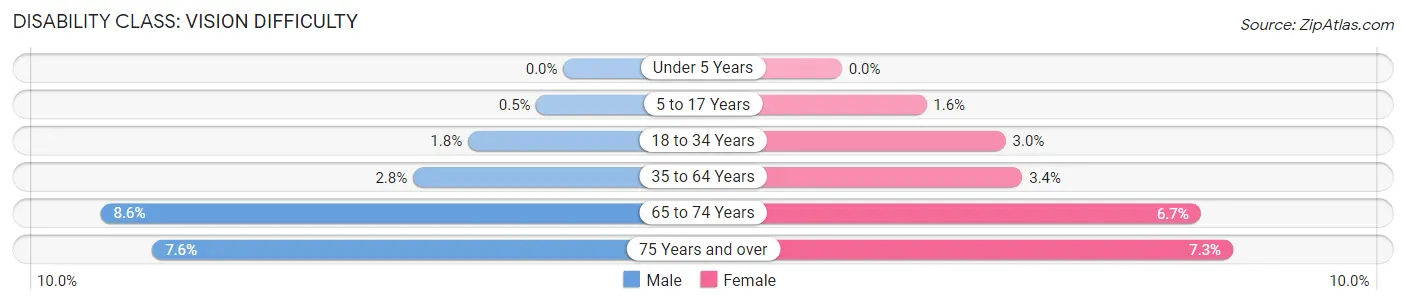
| Age Bracket | Male | Female |
| Under 5 Years | 0 (0.0%) | 0 (0.0%) |
| 5 to 17 Years | 32 (0.5%) | 95 (1.6%) |
| 18 to 34 Years | 143 (1.8%) | 257 (3.0%) |
| 35 to 64 Years | 328 (2.8%) | 429 (3.4%) |
| 65 to 74 Years | 262 (8.6%) | 233 (6.7%) |
| 75 Years and over | 116 (7.6%) | 178 (7.3%) |
Disability Class: Cognitive Difficulty
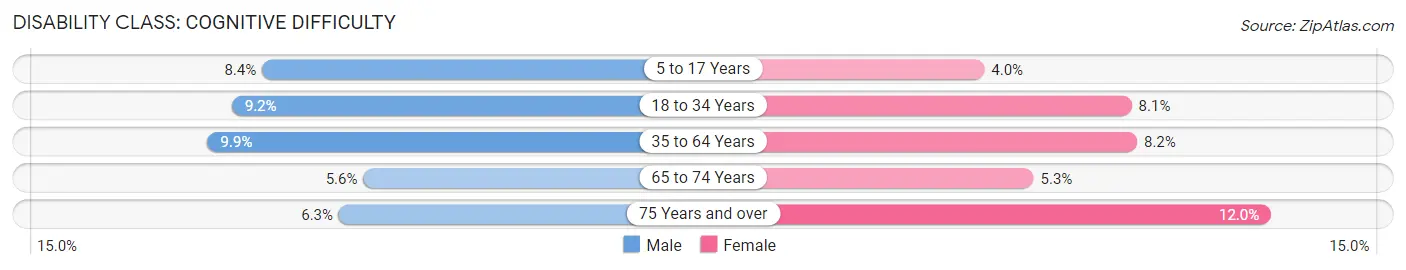
| Age Bracket | Male | Female |
| 5 to 17 Years | 535 (8.4%) | 241 (4.0%) |
| 18 to 34 Years | 746 (9.2%) | 683 (8.1%) |
| 35 to 64 Years | 1,164 (9.9%) | 1,051 (8.2%) |
| 65 to 74 Years | 170 (5.6%) | 187 (5.3%) |
| 75 Years and over | 95 (6.2%) | 293 (11.9%) |
Disability Class: Ambulatory Difficulty
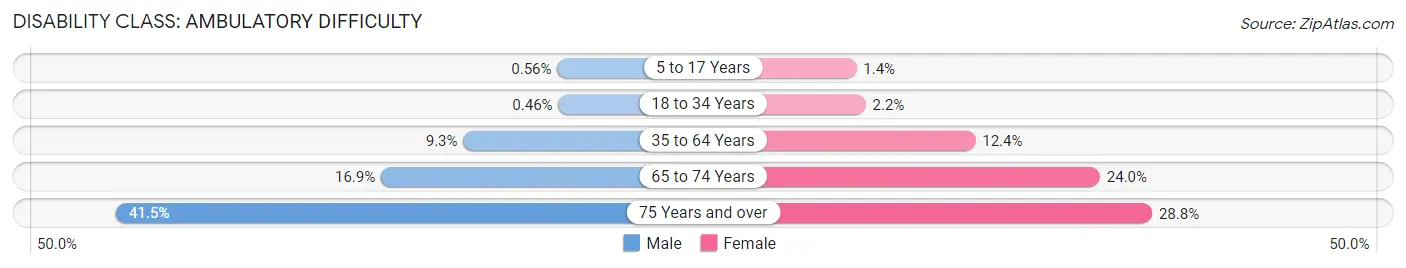
| Age Bracket | Male | Female |
| 5 to 17 Years | 36 (0.6%) | 82 (1.3%) |
| 18 to 34 Years | 37 (0.5%) | 187 (2.2%) |
| 35 to 64 Years | 1,090 (9.3%) | 1,584 (12.4%) |
| 65 to 74 Years | 516 (16.9%) | 838 (23.9%) |
| 75 Years and over | 631 (41.5%) | 706 (28.8%) |
Disability Class: Self-Care Difficulty
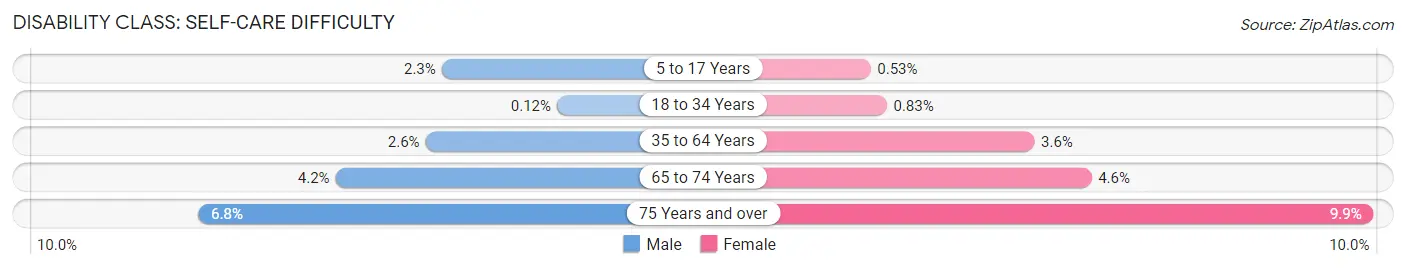
| Age Bracket | Male | Female |
| 5 to 17 Years | 144 (2.3%) | 32 (0.5%) |
| 18 to 34 Years | 10 (0.1%) | 70 (0.8%) |
| 35 to 64 Years | 301 (2.6%) | 457 (3.6%) |
| 65 to 74 Years | 129 (4.2%) | 162 (4.6%) |
| 75 Years and over | 103 (6.8%) | 242 (9.9%) |
Technology Access in Canton
Computing Device Access in Canton
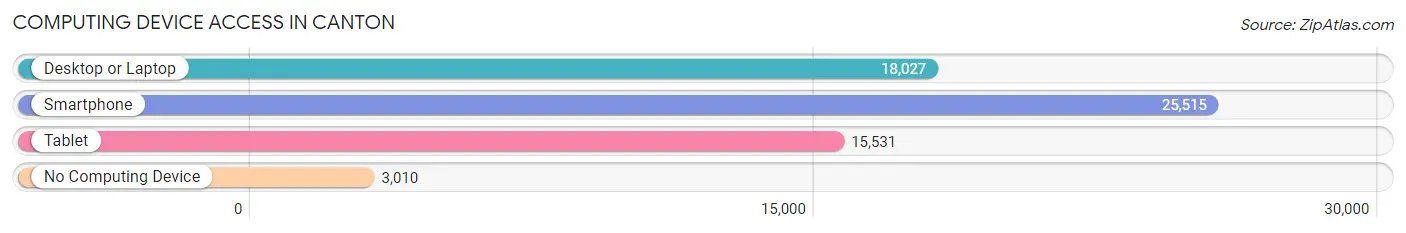
| Device Type | # Households | % Households |
| Desktop or Laptop | 18,027 | 59.2% |
| Smartphone | 25,515 | 83.8% |
| Tablet | 15,531 | 51.0% |
| No Computing Device | 3,010 | 9.9% |
| Total | 30,466 | 100.0% |
Internet Access in Canton

| Internet Type | # Households | % Households |
| Dial-Up Internet | 10 | 0.0% |
| Broadband Home | 19,152 | 62.9% |
| Cellular Data Only | 3,500 | 11.5% |
| Satellite Internet | 1,558 | 5.1% |
| No Internet | 7,102 | 23.3% |
| Total | 30,466 | 100.0% |
Canton Summary
Canton, Ohio is a city located in Stark County in the northeastern part of the state. It is the county seat and the largest city in the county. The city is located on the Tuscarawas River and is part of the Canton-Massillon metropolitan area. As of the 2010 census, the city had a population of 73,007, making it the eighth largest city in Ohio.
History
The area that is now Canton was first settled in 1805 by Bezaleel Wells and William Henry. The two men had been sent by the Connecticut Land Company to survey the area and to establish a town. The town was named after Canton, China, which was the source of the first shipment of tea to the United States. The town was officially incorporated in 1805 and was made the county seat of Stark County in 1808.
In the early 19th century, Canton was a major stop on the Underground Railroad, with many slaves escaping to freedom in Canada. The city was also a major center of industry, with several factories and mills being established in the area. The city was also home to several prominent figures in American history, including President William McKinley, who was born in Canton in 1843.
Geography
Canton is located in northeastern Ohio, about 40 miles south of Cleveland and 60 miles north of Akron. The city is situated on the Tuscarawas River and is part of the Canton-Massillon metropolitan area. The city has a total area of 22.2 square miles, of which 21.9 square miles is land and 0.3 square miles is water.
Economy
Canton’s economy is largely based on manufacturing and services. The city is home to several major employers, including the Timken Company, Diebold, Inc., and the Pro Football Hall of Fame. The city is also home to several educational institutions, including Malone University and Stark State College.
Demographics
As of the 2010 census, the city had a population of 73,007. The racial makeup of the city was 79.2% White, 14.3% African American, 0.4% Native American, 1.2% Asian, 0.1% Pacific Islander, 2.2% from other races, and 2.7% from two or more races. Hispanic or Latino of any race were 4.7% of the population.
The median income for a household in the city was $35,945, and the median income for a family was $45,845. The per capita income for the city was $20,945. About 15.2% of families and 18.7% of the population were below the poverty line, including 28.2% of those under age 18 and 8.7% of those age 65 or over.
Common Questions
What is Per Capita Income in Canton?
Per Capita income in Canton is $22,649.
What is the Median Family Income in Canton?
Median Family Income in Canton is $48,791.
What is the Median Household income in Canton?
Median Household Income in Canton is $37,627.
What is Income or Wage Gap in Canton?
Income or Wage Gap in Canton is 15.9%.
Women in Canton earn 84.1 cents for every dollar earned by a man.
What is Family Income Deficit in Canton?
Family Income Deficit in Canton is $11,589.
Families that are below poverty line in Canton earn $11,589 less on average than the poverty threshold level.
What is Inequality or Gini Index in Canton?
Inequality or Gini Index in Canton is 0.46.
What is the Total Population of Canton?
Total Population of Canton is 70,589.
What is the Total Male Population of Canton?
Total Male Population of Canton is 34,330.
What is the Total Female Population of Canton?
Total Female Population of Canton is 36,259.
What is the Ratio of Males per 100 Females in Canton?
There are 94.68 Males per 100 Females in Canton.
What is the Ratio of Females per 100 Males in Canton?
There are 105.62 Females per 100 Males in Canton.
What is the Median Population Age in Canton?
Median Population Age in Canton is 36.1 Years.
What is the Average Family Size in Canton
Average Family Size in Canton is 3.0 People.
What is the Average Household Size in Canton
Average Household Size in Canton is 2.2 People.
How Large is the Labor Force in Canton?
There are 31,887 People in the Labor Forcein in Canton.
What is the Percentage of People in the Labor Force in Canton?
58.2% of People are in the Labor Force in Canton.
What is the Unemployment Rate in Canton?
Unemployment Rate in Canton is 9.0%.