Milford, OH Map & Demographics
Milford Map
Milford Overview
$46,225
PER CAPITA INCOME
$98,156
AVG FAMILY INCOME
$69,141
AVG HOUSEHOLD INCOME
36.3%
WAGE / INCOME GAP [ % ]
63.7¢/ $1
WAGE / INCOME GAP [ $ ]
0.45
INEQUALITY / GINI INDEX
6,556
TOTAL POPULATION
3,196
MALE POPULATION
3,360
FEMALE POPULATION
95.12
MALES / 100 FEMALES
105.13
FEMALES / 100 MALES
45.2
MEDIAN AGE
2.7
AVG FAMILY SIZE
1.9
AVG HOUSEHOLD SIZE
3,638
LABOR FORCE [ PEOPLE ]
64.9%
PERCENT IN LABOR FORCE
4.7%
UNEMPLOYMENT RATE
Milford Zip Codes
Milford Area Codes
Income in Milford
Income Overview in Milford
Per Capita Income in Milford is $46,225, while median incomes of families and households are $98,156 and $69,141 respectively.
| Characteristic | Number | Measure |
| Per Capita Income | 6,556 | $46,225 |
| Median Family Income | 1,652 | $98,156 |
| Mean Family Income | 1,652 | $126,439 |
| Median Household Income | 3,305 | $69,141 |
| Mean Household Income | 3,305 | $89,964 |
| Income Deficit | 1,652 | $0 |
| Wage / Income Gap (%) | 6,556 | 36.32% |
| Wage / Income Gap ($) | 6,556 | 63.68¢ per $1 |
| Gini / Inequality Index | 6,556 | 0.45 |
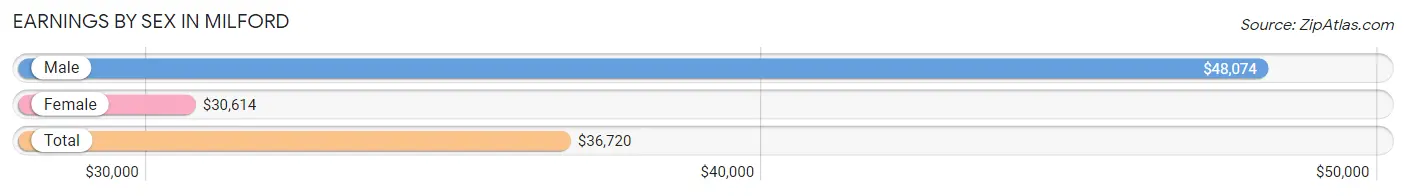
Earnings by Sex in Milford
Average Earnings in Milford are $36,720, $48,074 for men and $30,614 for women, a difference of 36.3%.
| Sex | Number | Average Earnings |
| Male | 1,738 (47.3%) | $48,074 |
| Female | 1,938 (52.7%) | $30,614 |
| Total | 3,676 (100.0%) | $36,720 |
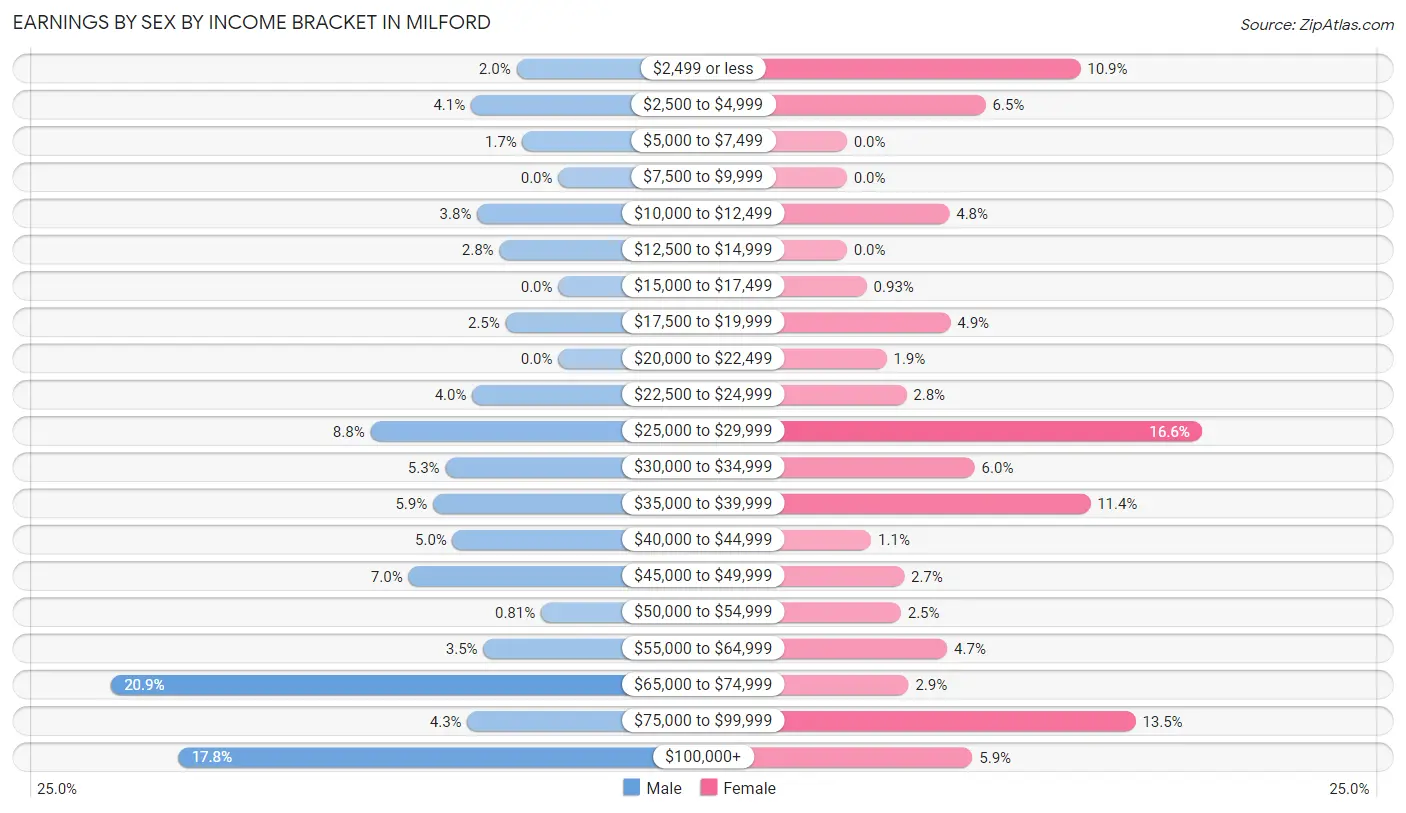
Earnings by Sex by Income Bracket in Milford
The most common earnings brackets in Milford are $65,000 to $74,999 for men (364 | 20.9%) and $25,000 to $29,999 for women (322 | 16.6%).
| Income | Male | Female |
| $2,499 or less | 34 (2.0%) | 212 (10.9%) |
| $2,500 to $4,999 | 71 (4.1%) | 126 (6.5%) |
| $5,000 to $7,499 | 29 (1.7%) | 0 (0.0%) |
| $7,500 to $9,999 | 0 (0.0%) | 0 (0.0%) |
| $10,000 to $12,499 | 66 (3.8%) | 93 (4.8%) |
| $12,500 to $14,999 | 48 (2.8%) | 0 (0.0%) |
| $15,000 to $17,499 | 0 (0.0%) | 18 (0.9%) |
| $17,500 to $19,999 | 43 (2.5%) | 94 (4.9%) |
| $20,000 to $22,499 | 0 (0.0%) | 36 (1.9%) |
| $22,500 to $24,999 | 70 (4.0%) | 54 (2.8%) |
| $25,000 to $29,999 | 153 (8.8%) | 322 (16.6%) |
| $30,000 to $34,999 | 92 (5.3%) | 116 (6.0%) |
| $35,000 to $39,999 | 102 (5.9%) | 221 (11.4%) |
| $40,000 to $44,999 | 86 (5.0%) | 22 (1.1%) |
| $45,000 to $49,999 | 122 (7.0%) | 52 (2.7%) |
| $50,000 to $54,999 | 14 (0.8%) | 49 (2.5%) |
| $55,000 to $64,999 | 61 (3.5%) | 91 (4.7%) |
| $65,000 to $74,999 | 364 (20.9%) | 56 (2.9%) |
| $75,000 to $99,999 | 74 (4.3%) | 262 (13.5%) |
| $100,000+ | 309 (17.8%) | 114 (5.9%) |
| Total | 1,738 (100.0%) | 1,938 (100.0%) |
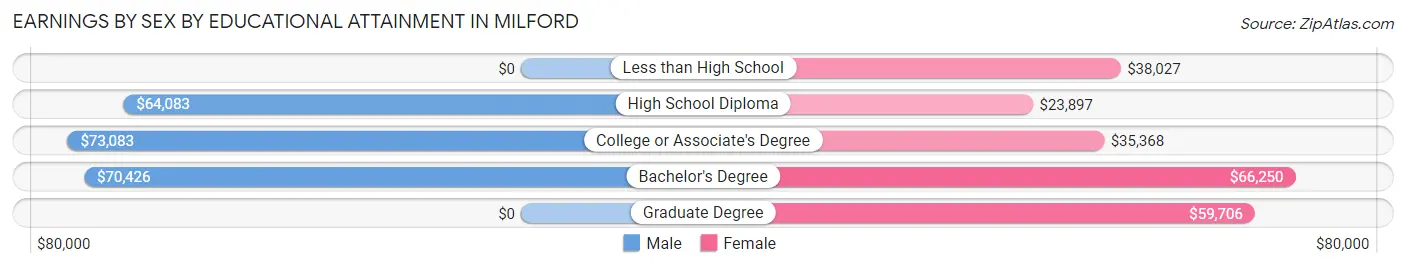
Earnings by Sex by Educational Attainment in Milford
Average earnings in Milford are $55,809 for men and $35,616 for women, a difference of 36.2%. Men with an educational attainment of college or associate's degree enjoy the highest average annual earnings of $73,083, while those with high school diploma education earn the least with $64,083. Women with an educational attainment of bachelor's degree earn the most with the average annual earnings of $66,250, while those with high school diploma education have the smallest earnings of $23,897.
| Educational Attainment | Male Income | Female Income |
| Less than High School | - | - |
| High School Diploma | $64,083 | $23,897 |
| College or Associate's Degree | $73,083 | $35,368 |
| Bachelor's Degree | $70,426 | $66,250 |
| Graduate Degree | - | - |
| Total | $55,809 | $35,616 |
Family Income in Milford
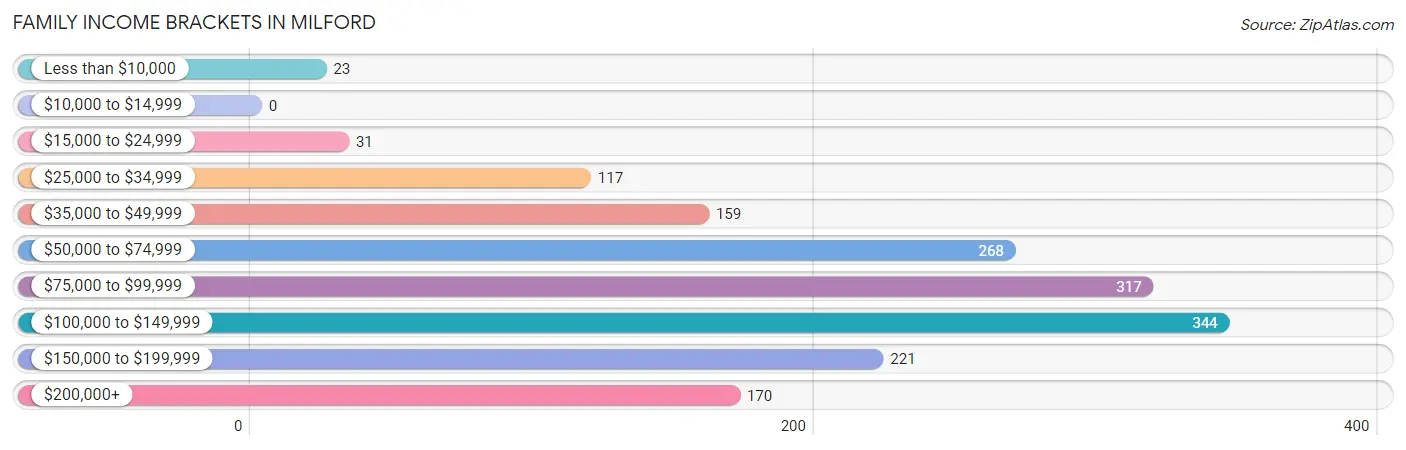
Family Income Brackets in Milford
According to the Milford family income data, there are 344 families falling into the $100,000 to $149,999 income range, which is the most common income bracket and makes up 20.8% of all families.
| Income Bracket | # Families | % Families |
| Less than $10,000 | 23 | 1.4% |
| $10,000 to $14,999 | 0 | 0.0% |
| $15,000 to $24,999 | 31 | 1.9% |
| $25,000 to $34,999 | 117 | 7.1% |
| $35,000 to $49,999 | 159 | 9.6% |
| $50,000 to $74,999 | 268 | 16.2% |
| $75,000 to $99,999 | 317 | 19.2% |
| $100,000 to $149,999 | 344 | 20.8% |
| $150,000 to $199,999 | 221 | 13.4% |
| $200,000+ | 170 | 10.3% |
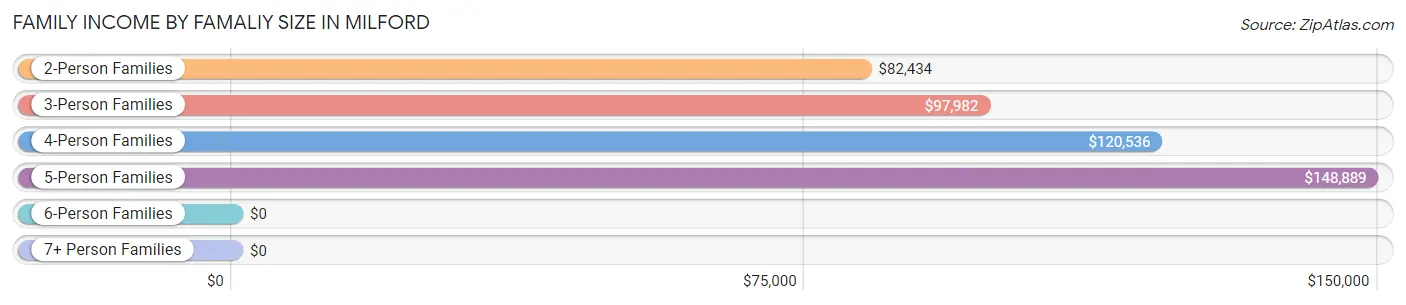
Family Income by Famaliy Size in Milford
5-person families (36 | 2.2%) account for the highest median family income in Milford with $148,889 per family, while 2-person families (803 | 48.6%) have the highest median income of $41,217 per family member.
| Income Bracket | # Families | Median Income |
| 2-Person Families | 803 (48.6%) | $82,434 |
| 3-Person Families | 585 (35.4%) | $97,982 |
| 4-Person Families | 228 (13.8%) | $120,536 |
| 5-Person Families | 36 (2.2%) | $148,889 |
| 6-Person Families | 0 (0.0%) | $0 |
| 7+ Person Families | 0 (0.0%) | $0 |
| Total | 1,652 (100.0%) | $98,156 |
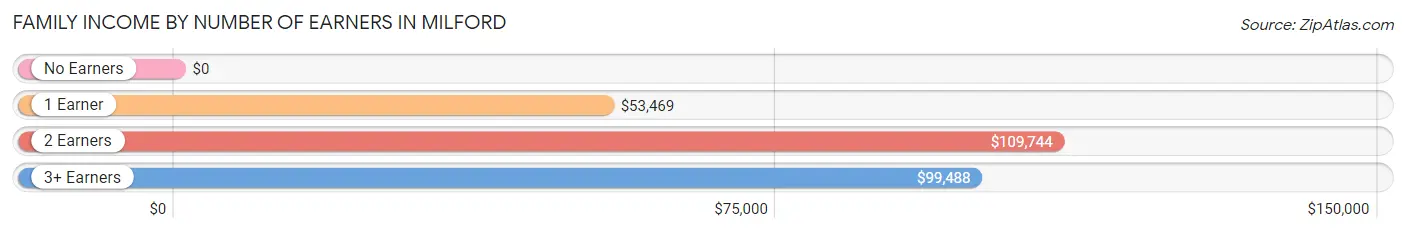
Family Income by Number of Earners in Milford
| Number of Earners | # Families | Median Income |
| No Earners | 221 (13.4%) | $0 |
| 1 Earner | 566 (34.3%) | $53,469 |
| 2 Earners | 671 (40.6%) | $109,744 |
| 3+ Earners | 194 (11.7%) | $99,488 |
| Total | 1,652 (100.0%) | $98,156 |
Household Income in Milford
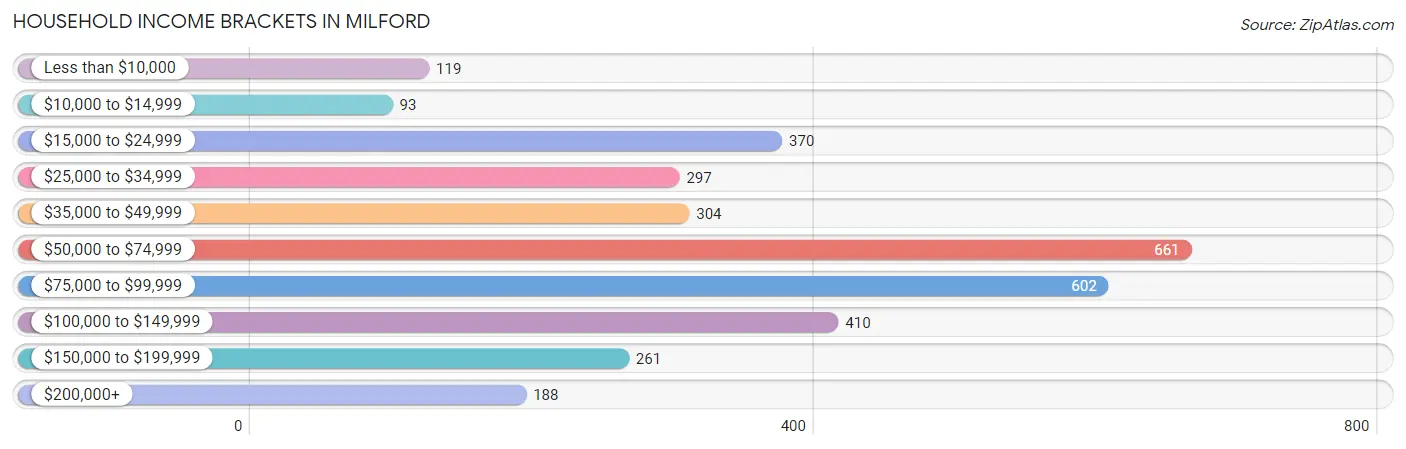
Household Income Brackets in Milford
With 661 households falling in the category, the $50,000 to $74,999 income range is the most frequent in Milford, accounting for 20.0% of all households. In contrast, only 93 households (2.8%) fall into the $10,000 to $14,999 income bracket, making it the least populous group.
| Income Bracket | # Households | % Households |
| Less than $10,000 | 119 | 3.6% |
| $10,000 to $14,999 | 93 | 2.8% |
| $15,000 to $24,999 | 370 | 11.2% |
| $25,000 to $34,999 | 297 | 9.0% |
| $35,000 to $49,999 | 304 | 9.2% |
| $50,000 to $74,999 | 661 | 20.0% |
| $75,000 to $99,999 | 602 | 18.2% |
| $100,000 to $149,999 | 410 | 12.4% |
| $150,000 to $199,999 | 261 | 7.9% |
| $200,000+ | 188 | 5.7% |
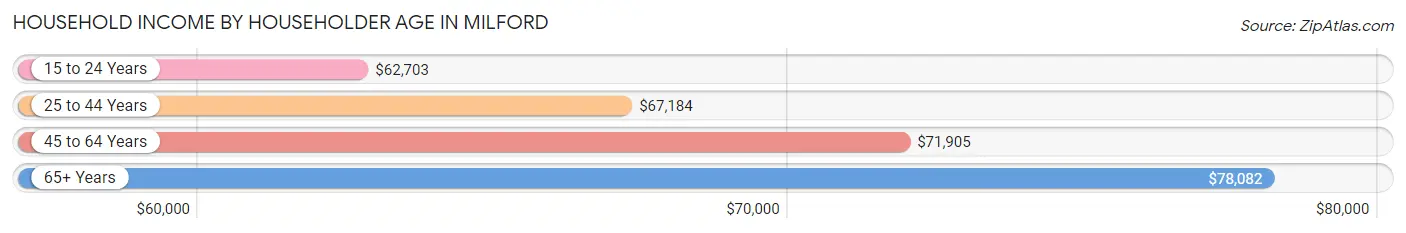
Household Income by Householder Age in Milford
The median household income in Milford is $69,141, with the highest median household income of $78,082 found in the 65+ years age bracket for the primary householder. A total of 1,283 households (38.8%) fall into this category. Meanwhile, the 15 to 24 years age bracket for the primary householder has the lowest median household income of $62,703, with 97 households (2.9%) in this group.
| Income Bracket | # Households | Median Income |
| 15 to 24 Years | 97 (2.9%) | $62,703 |
| 25 to 44 Years | 961 (29.1%) | $67,184 |
| 45 to 64 Years | 964 (29.2%) | $71,905 |
| 65+ Years | 1,283 (38.8%) | $78,082 |
| Total | 3,305 (100.0%) | $69,141 |
Poverty in Milford
Income Below Poverty by Sex and Age in Milford
With 10.8% poverty level for males and 2.8% for females among the residents of Milford, 35 to 44 year old males and 75 year old and over females are the most vulnerable to poverty, with 108 males (29.9%) and 58 females (15.1%) in their respective age groups living below the poverty level.
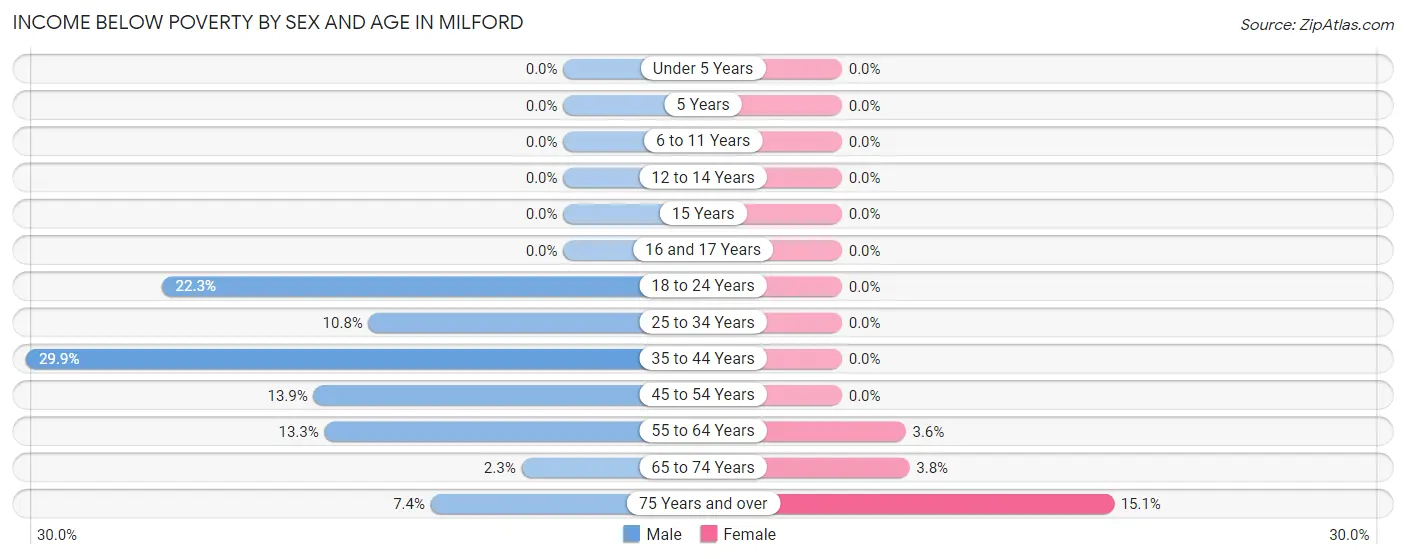
| Age Bracket | Male | Female |
| Under 5 Years | 0 (0.0%) | 0 (0.0%) |
| 5 Years | 0 (0.0%) | 0 (0.0%) |
| 6 to 11 Years | 0 (0.0%) | 0 (0.0%) |
| 12 to 14 Years | 0 (0.0%) | 0 (0.0%) |
| 15 Years | 0 (0.0%) | 0 (0.0%) |
| 16 and 17 Years | 0 (0.0%) | 0 (0.0%) |
| 18 to 24 Years | 58 (22.3%) | 0 (0.0%) |
| 25 to 34 Years | 53 (10.8%) | 0 (0.0%) |
| 35 to 44 Years | 108 (29.9%) | 0 (0.0%) |
| 45 to 54 Years | 37 (13.9%) | 0 (0.0%) |
| 55 to 64 Years | 54 (13.3%) | 15 (3.5%) |
| 65 to 74 Years | 12 (2.3%) | 20 (3.8%) |
| 75 Years and over | 18 (7.4%) | 58 (15.1%) |
| Total | 340 (10.8%) | 93 (2.8%) |
Income Above Poverty by Sex and Age in Milford
According to the poverty statistics in Milford, males aged under 5 years and females aged under 5 years are the age groups that are most secure financially, with 100.0% of males and 100.0% of females in these age groups living above the poverty line.
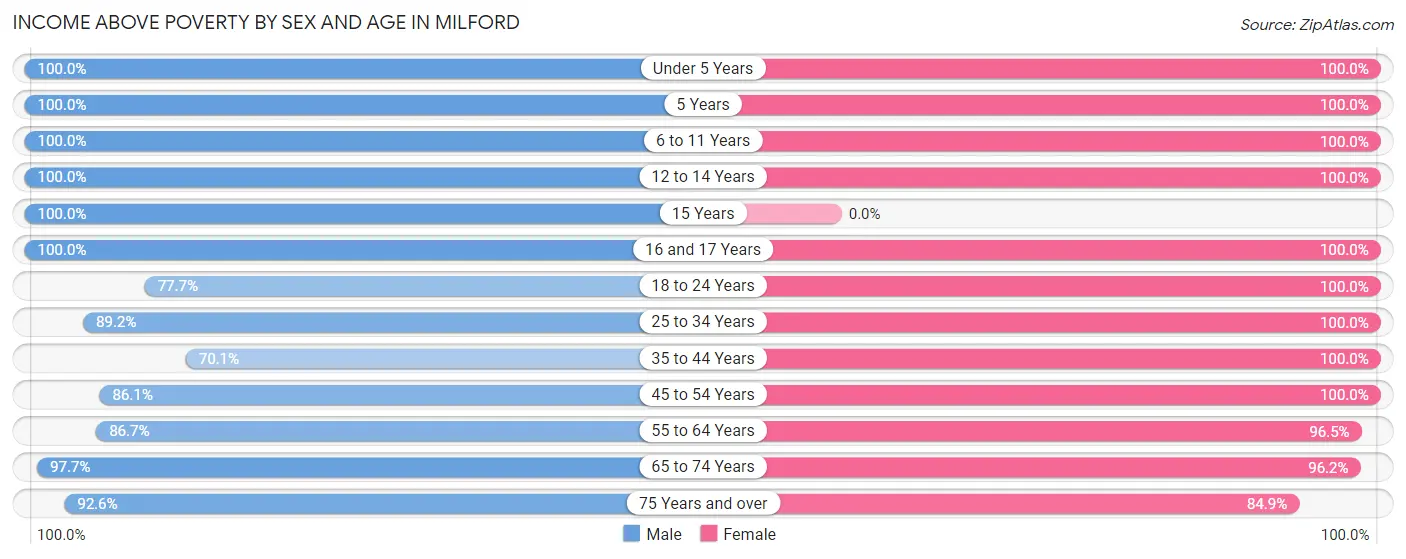
| Age Bracket | Male | Female |
| Under 5 Years | 64 (100.0%) | 172 (100.0%) |
| 5 Years | 140 (100.0%) | 49 (100.0%) |
| 6 to 11 Years | 244 (100.0%) | 83 (100.0%) |
| 12 to 14 Years | 97 (100.0%) | 55 (100.0%) |
| 15 Years | 47 (100.0%) | 0 (0.0%) |
| 16 and 17 Years | 27 (100.0%) | 62 (100.0%) |
| 18 to 24 Years | 202 (77.7%) | 289 (100.0%) |
| 25 to 34 Years | 436 (89.2%) | 355 (100.0%) |
| 35 to 44 Years | 253 (70.1%) | 452 (100.0%) |
| 45 to 54 Years | 229 (86.1%) | 451 (100.0%) |
| 55 to 64 Years | 352 (86.7%) | 407 (96.5%) |
| 65 to 74 Years | 503 (97.7%) | 512 (96.2%) |
| 75 Years and over | 226 (92.6%) | 325 (84.9%) |
| Total | 2,820 (89.2%) | 3,212 (97.2%) |
Income Below Poverty Among Married-Couple Families in Milford
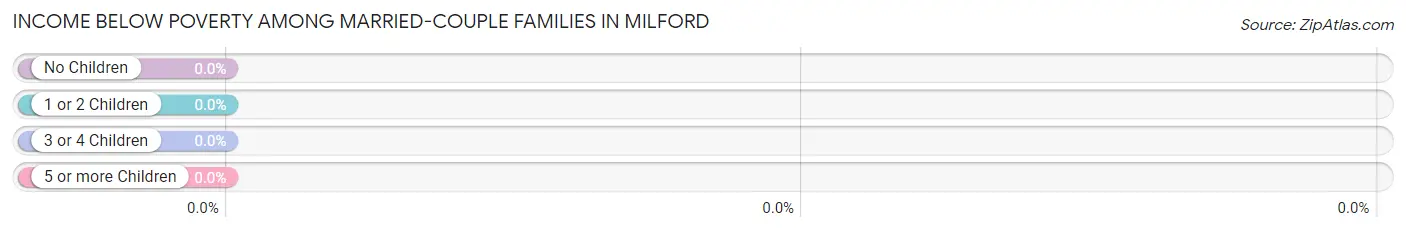
| Children | Above Poverty | Below Poverty |
| No Children | 595 (100.0%) | 0 (0.0%) |
| 1 or 2 Children | 369 (100.0%) | 0 (0.0%) |
| 3 or 4 Children | 18 (100.0%) | 0 (0.0%) |
| 5 or more Children | 0 (0.0%) | 0 (0.0%) |
| Total | 982 (100.0%) | 0 (0.0%) |
Income Below Poverty Among Single-Parent Households in Milford
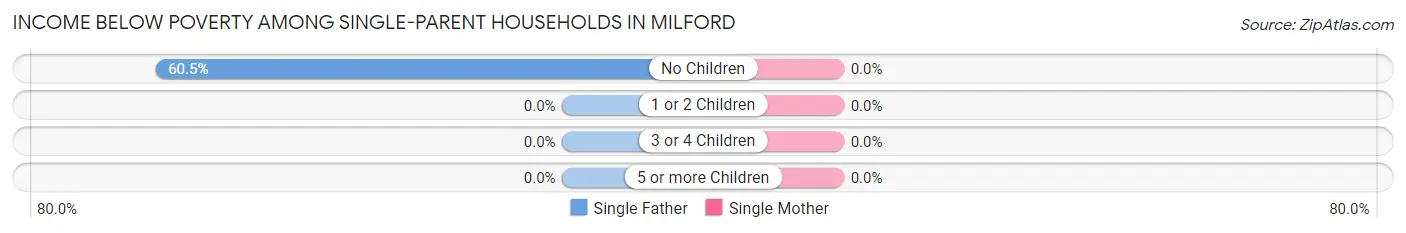
| Children | Single Father | Single Mother |
| No Children | 23 (60.5%) | 0 (0.0%) |
| 1 or 2 Children | 0 (0.0%) | 0 (0.0%) |
| 3 or 4 Children | 0 (0.0%) | 0 (0.0%) |
| 5 or more Children | 0 (0.0%) | 0 (0.0%) |
| Total | 23 (21.9%) | 0 (0.0%) |
Income Below Poverty Among Married-Couple vs Single-Parent Households in Milford
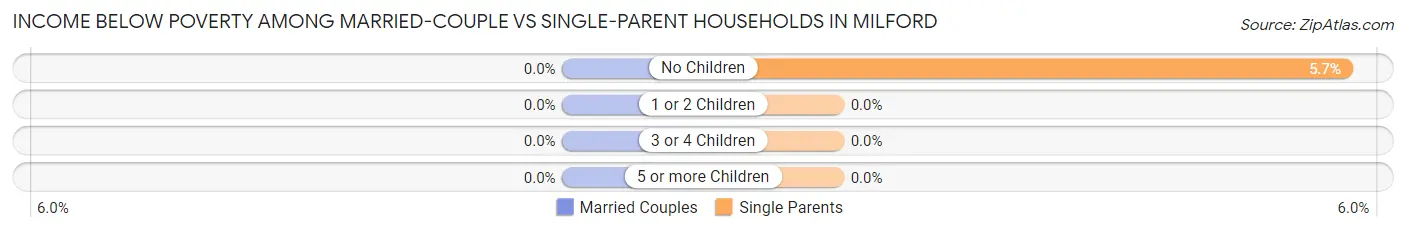
| Children | Married-Couple Families | Single-Parent Households |
| No Children | 0 (0.0%) | 23 (5.7%) |
| 1 or 2 Children | 0 (0.0%) | 0 (0.0%) |
| 3 or 4 Children | 0 (0.0%) | 0 (0.0%) |
| 5 or more Children | 0 (0.0%) | 0 (0.0%) |
| Total | 0 (0.0%) | 23 (3.4%) |
Race in Milford
The most populous races in Milford are White / Caucasian (6,114 | 93.3%), Two or more Races (279 | 4.3%), and Black / African American (139 | 2.1%).
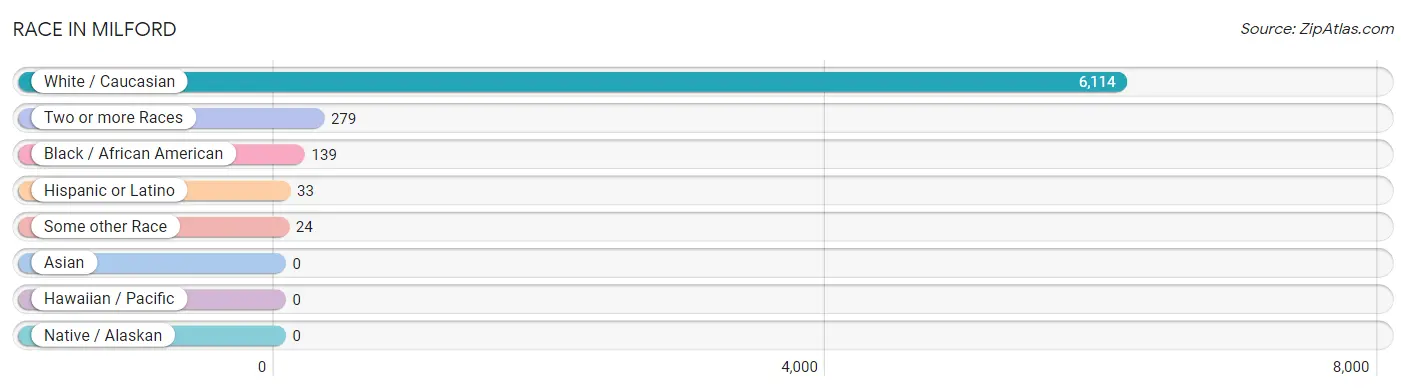
| Race | # Population | % Population |
| Asian | 0 | 0.0% |
| Black / African American | 139 | 2.1% |
| Hawaiian / Pacific | 0 | 0.0% |
| Hispanic or Latino | 33 | 0.5% |
| Native / Alaskan | 0 | 0.0% |
| White / Caucasian | 6,114 | 93.3% |
| Two or more Races | 279 | 4.3% |
| Some other Race | 24 | 0.4% |
| Total | 6,556 | 100.0% |
Ancestry in Milford
The most populous ancestries reported in Milford are German (2,156 | 32.9%), Irish (965 | 14.7%), English (931 | 14.2%), Italian (538 | 8.2%), and American (404 | 6.2%), together accounting for 76.2% of all Milford residents.
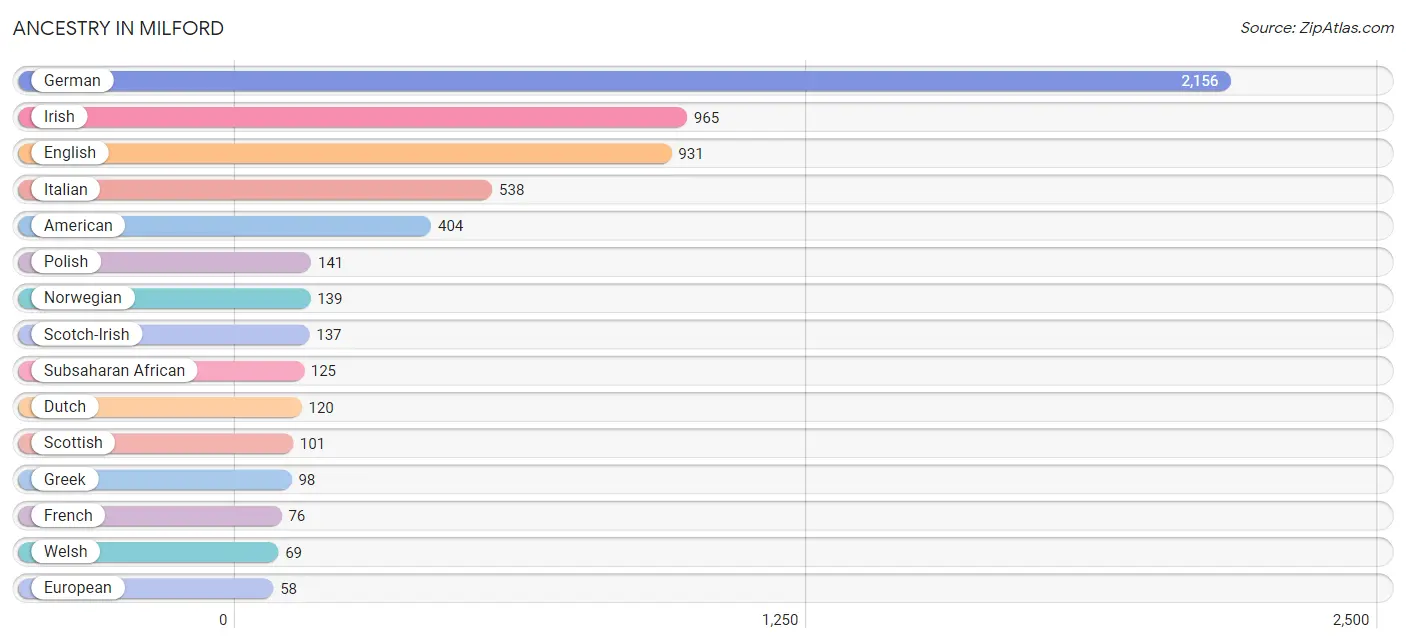
| Ancestry | # Population | % Population |
| African | 21 | 0.3% |
| American | 404 | 6.2% |
| British | 36 | 0.5% |
| Cherokee | 45 | 0.7% |
| Czech | 15 | 0.2% |
| Dutch | 120 | 1.8% |
| Eastern European | 18 | 0.3% |
| English | 931 | 14.2% |
| European | 58 | 0.9% |
| French | 76 | 1.2% |
| German | 2,156 | 32.9% |
| Greek | 98 | 1.5% |
| Hungarian | 28 | 0.4% |
| Irish | 965 | 14.7% |
| Italian | 538 | 8.2% |
| Japanese | 24 | 0.4% |
| Korean | 9 | 0.1% |
| Mexican | 22 | 0.3% |
| Norwegian | 139 | 2.1% |
| Polish | 141 | 2.1% |
| Portuguese | 13 | 0.2% |
| Puerto Rican | 11 | 0.2% |
| Russian | 42 | 0.6% |
| Scotch-Irish | 137 | 2.1% |
| Scottish | 101 | 1.5% |
| Serbian | 52 | 0.8% |
| Slavic | 6 | 0.1% |
| Subsaharan African | 125 | 1.9% |
| Swedish | 32 | 0.5% |
| Swiss | 16 | 0.2% |
| Welsh | 69 | 1.1% | View All 31 Rows |
Immigrants in Milford
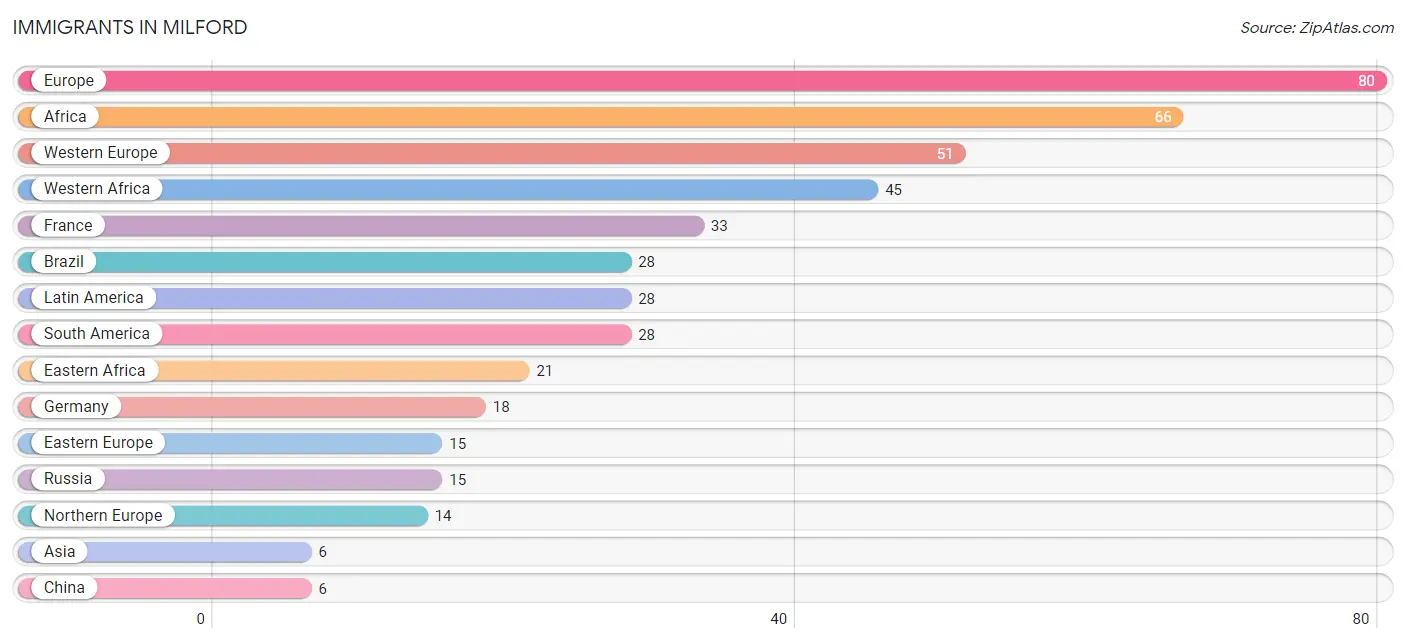
The most numerous immigrant groups reported in Milford came from Europe (80 | 1.2%), Africa (66 | 1.0%), Western Europe (51 | 0.8%), Western Africa (45 | 0.7%), and France (33 | 0.5%), together accounting for 4.2% of all Milford residents.
| Immigration Origin | # Population | % Population |
| Africa | 66 | 1.0% |
| Asia | 6 | 0.1% |
| Brazil | 28 | 0.4% |
| China | 6 | 0.1% |
| Eastern Africa | 21 | 0.3% |
| Eastern Asia | 6 | 0.1% |
| Eastern Europe | 15 | 0.2% |
| Europe | 80 | 1.2% |
| France | 33 | 0.5% |
| Germany | 18 | 0.3% |
| Latin America | 28 | 0.4% |
| Northern Europe | 14 | 0.2% |
| Russia | 15 | 0.2% |
| South America | 28 | 0.4% |
| Western Africa | 45 | 0.7% |
| Western Europe | 51 | 0.8% | View All 16 Rows |
Sex and Age in Milford
Sex and Age in Milford
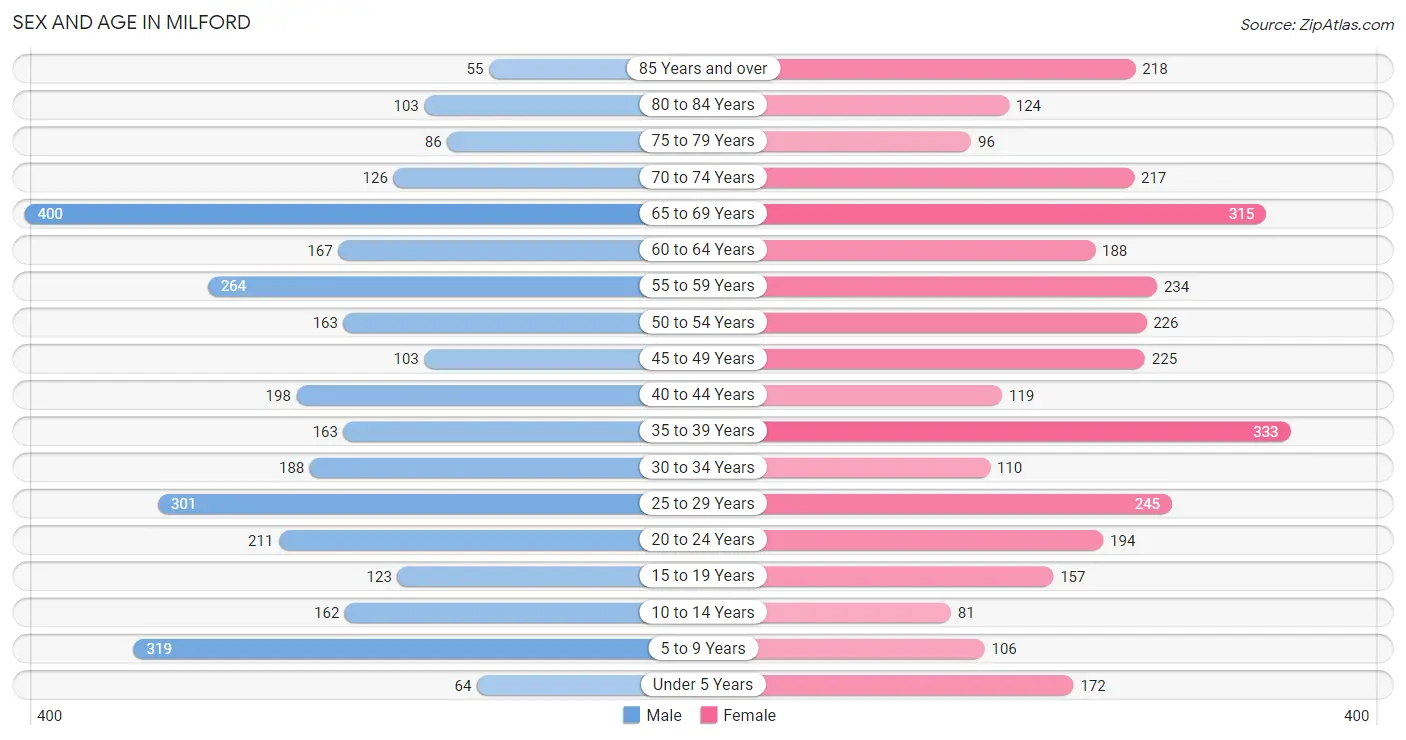
The most populous age groups in Milford are 65 to 69 Years (400 | 12.5%) for men and 35 to 39 Years (333 | 9.9%) for women.
| Age Bracket | Male | Female |
| Under 5 Years | 64 (2.0%) | 172 (5.1%) |
| 5 to 9 Years | 319 (10.0%) | 106 (3.2%) |
| 10 to 14 Years | 162 (5.1%) | 81 (2.4%) |
| 15 to 19 Years | 123 (3.8%) | 157 (4.7%) |
| 20 to 24 Years | 211 (6.6%) | 194 (5.8%) |
| 25 to 29 Years | 301 (9.4%) | 245 (7.3%) |
| 30 to 34 Years | 188 (5.9%) | 110 (3.3%) |
| 35 to 39 Years | 163 (5.1%) | 333 (9.9%) |
| 40 to 44 Years | 198 (6.2%) | 119 (3.5%) |
| 45 to 49 Years | 103 (3.2%) | 225 (6.7%) |
| 50 to 54 Years | 163 (5.1%) | 226 (6.7%) |
| 55 to 59 Years | 264 (8.3%) | 234 (7.0%) |
| 60 to 64 Years | 167 (5.2%) | 188 (5.6%) |
| 65 to 69 Years | 400 (12.5%) | 315 (9.4%) |
| 70 to 74 Years | 126 (3.9%) | 217 (6.5%) |
| 75 to 79 Years | 86 (2.7%) | 96 (2.9%) |
| 80 to 84 Years | 103 (3.2%) | 124 (3.7%) |
| 85 Years and over | 55 (1.7%) | 218 (6.5%) |
| Total | 3,196 (100.0%) | 3,360 (100.0%) |
Families and Households in Milford
Median Family Size in Milford
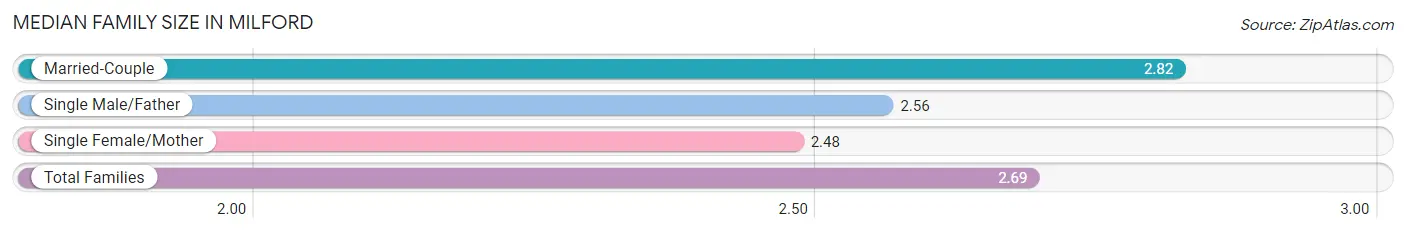
The median family size in Milford is 2.69 persons per family, with married-couple families (982 | 59.4%) accounting for the largest median family size of 2.82 persons per family. On the other hand, single female/mother families (565 | 34.2%) represent the smallest median family size with 2.48 persons per family.
| Family Type | # Families | Family Size |
| Married-Couple | 982 (59.4%) | 2.82 |
| Single Male/Father | 105 (6.4%) | 2.56 |
| Single Female/Mother | 565 (34.2%) | 2.48 |
| Total Families | 1,652 (100.0%) | 2.69 |
Median Household Size in Milford
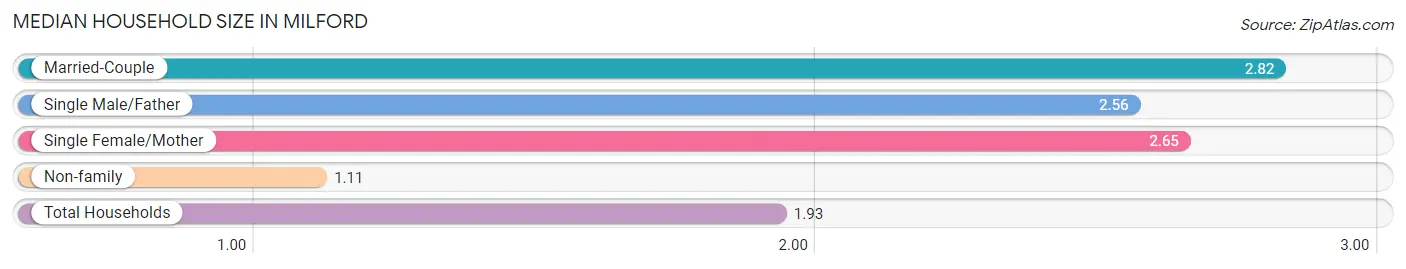
The median household size in Milford is 1.93 persons per household, with married-couple households (982 | 29.7%) accounting for the largest median household size of 2.82 persons per household. non-family households (1,653 | 50.0%) represent the smallest median household size with 1.11 persons per household.
| Household Type | # Households | Household Size |
| Married-Couple | 982 (29.7%) | 2.82 |
| Single Male/Father | 105 (3.2%) | 2.56 |
| Single Female/Mother | 565 (17.1%) | 2.65 |
| Non-family | 1,653 (50.0%) | 1.11 |
| Total Households | 3,305 (100.0%) | 1.93 |
Household Size by Marriage Status in Milford
Out of a total of 3,305 households in Milford, 1,652 (50.0%) are family households, while 1,653 (50.0%) are nonfamily households. The most numerous type of family households are 2-person households, comprising 738, and the most common type of nonfamily households are 1-person households, comprising 1,472.
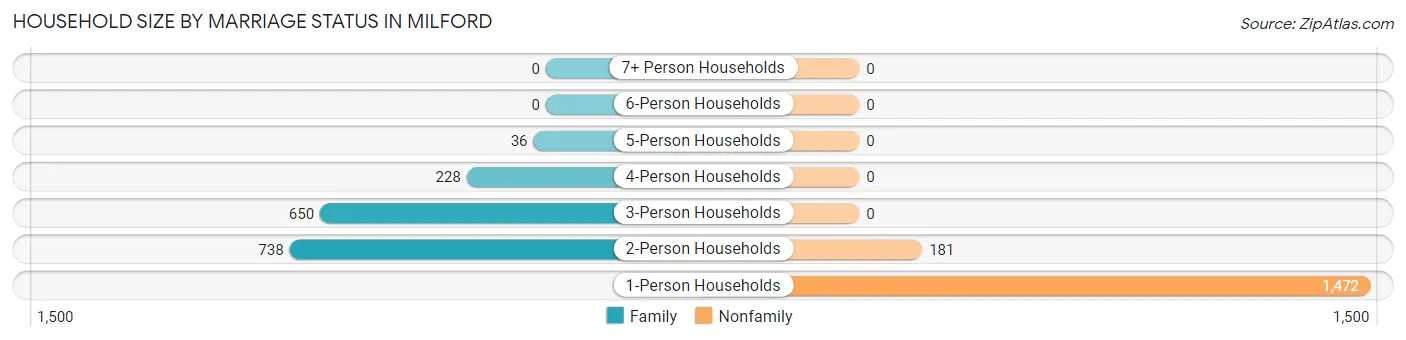
| Household Size | Family Households | Nonfamily Households |
| 1-Person Households | - | 1,472 (44.5%) |
| 2-Person Households | 738 (22.3%) | 181 (5.5%) |
| 3-Person Households | 650 (19.7%) | 0 (0.0%) |
| 4-Person Households | 228 (6.9%) | 0 (0.0%) |
| 5-Person Households | 36 (1.1%) | 0 (0.0%) |
| 6-Person Households | 0 (0.0%) | 0 (0.0%) |
| 7+ Person Households | 0 (0.0%) | 0 (0.0%) |
| Total | 1,652 (50.0%) | 1,653 (50.0%) |
Female Fertility in Milford
Fertility by Age in Milford
Average fertility rate in Milford is 36.0 births per 1,000 women. Women in the age bracket of 20 to 34 years have the highest fertility rate with 93.0 births per 1,000 women. Women in the age bracket of 20 to 34 years acount for 100.0% of all women with births.
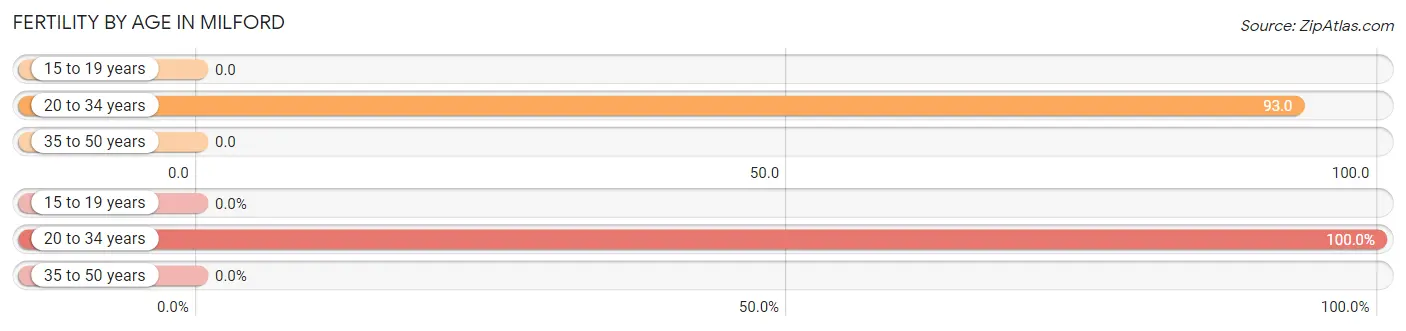
| Age Bracket | Women with Births | Births / 1,000 Women |
| 15 to 19 years | 0 (0.0%) | 0.0 |
| 20 to 34 years | 51 (100.0%) | 93.0 |
| 35 to 50 years | 0 (0.0%) | 0.0 |
| Total | 51 (100.0%) | 36.0 |
Fertility by Age by Marriage Status in Milford
68.6% of women with births (51) in Milford are married. The highest percentage of unmarried women with births falls into 20 to 34 years age bracket with 31.4% of them unmarried at the time of birth, while the lowest percentage of unmarried women with births belong to 20 to 34 years age bracket with 31.4% of them unmarried.
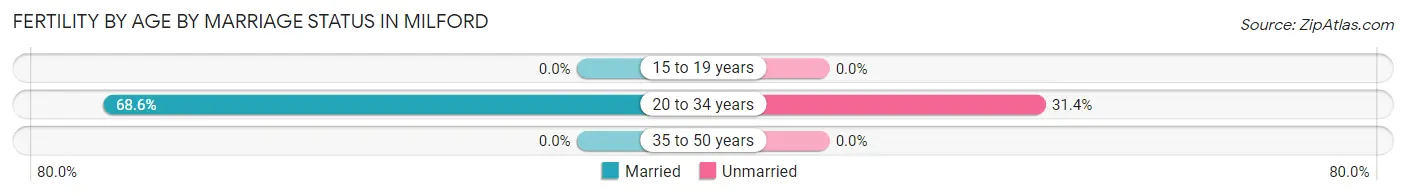
| Age Bracket | Married | Unmarried |
| 15 to 19 years | 0 (0.0%) | 0 (0.0%) |
| 20 to 34 years | 35 (68.6%) | 16 (31.4%) |
| 35 to 50 years | 0 (0.0%) | 0 (0.0%) |
| Total | 35 (68.6%) | 16 (31.4%) |
Fertility by Education in Milford
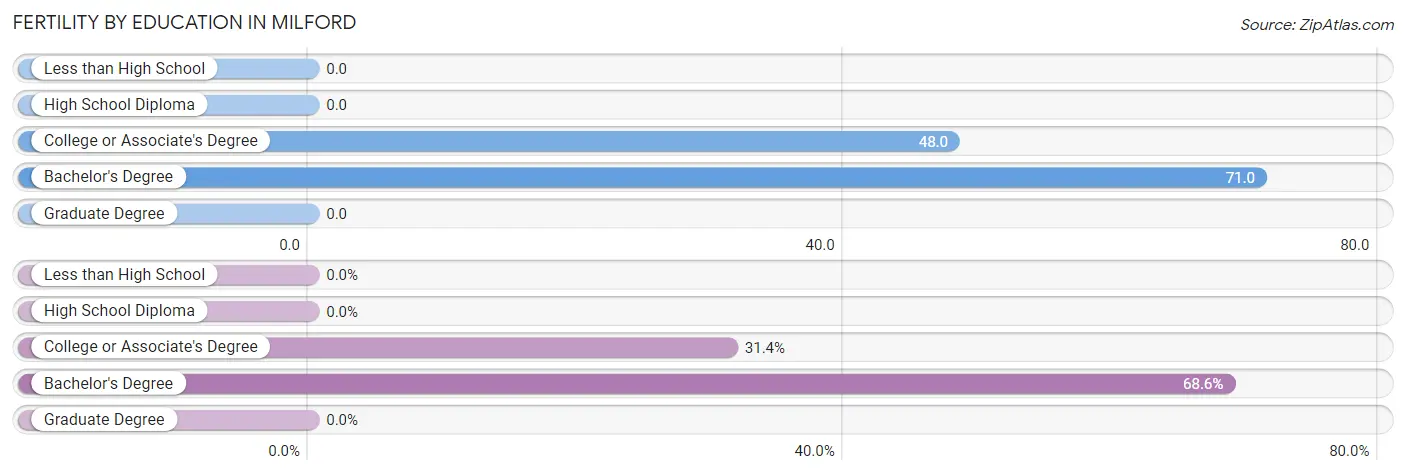
| Educational Attainment | Women with Births | Births / 1,000 Women |
| Less than High School | 0 (0.0%) | 0.0 |
| High School Diploma | 0 (0.0%) | 0.0 |
| College or Associate's Degree | 16 (31.4%) | 48.0 |
| Bachelor's Degree | 35 (68.6%) | 71.0 |
| Graduate Degree | 0 (0.0%) | 0.0 |
| Total | 51 (100.0%) | 36.0 |
Fertility by Education by Marriage Status in Milford
31.4% of women with births in Milford are unmarried. Women with the educational attainment of bachelor's degree are most likely to be married with 100.0% of them married at childbirth, while women with the educational attainment of college or associate's degree are least likely to be married with 100.0% of them unmarried at childbirth.
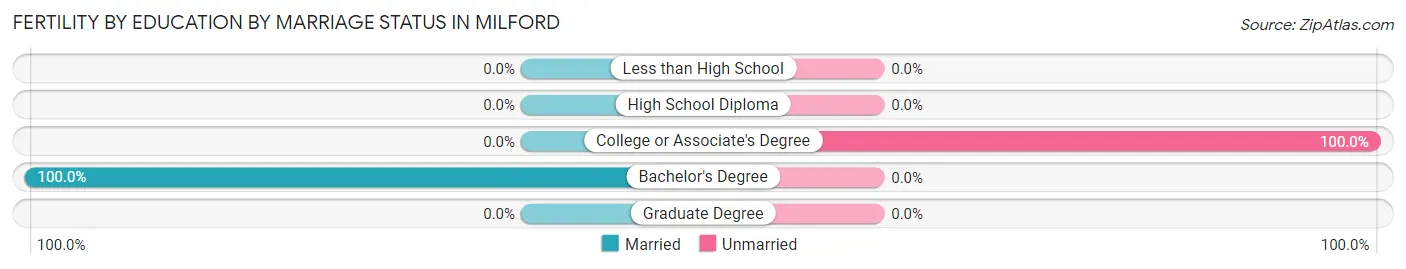
| Educational Attainment | Married | Unmarried |
| Less than High School | 0 (0.0%) | 0 (0.0%) |
| High School Diploma | 0 (0.0%) | 0 (0.0%) |
| College or Associate's Degree | 0 (0.0%) | 16 (100.0%) |
| Bachelor's Degree | 35 (100.0%) | 0 (0.0%) |
| Graduate Degree | 0 (0.0%) | 0 (0.0%) |
| Total | 35 (68.6%) | 16 (31.4%) |
Employment Characteristics in Milford
Employment by Class of Employer in Milford
Among the 3,449 employed individuals in Milford, private company employees (2,570 | 74.5%), not-for-profit organizations (287 | 8.3%), and self-employed (incorporated) (188 | 5.4%) make up the most common classes of employment.
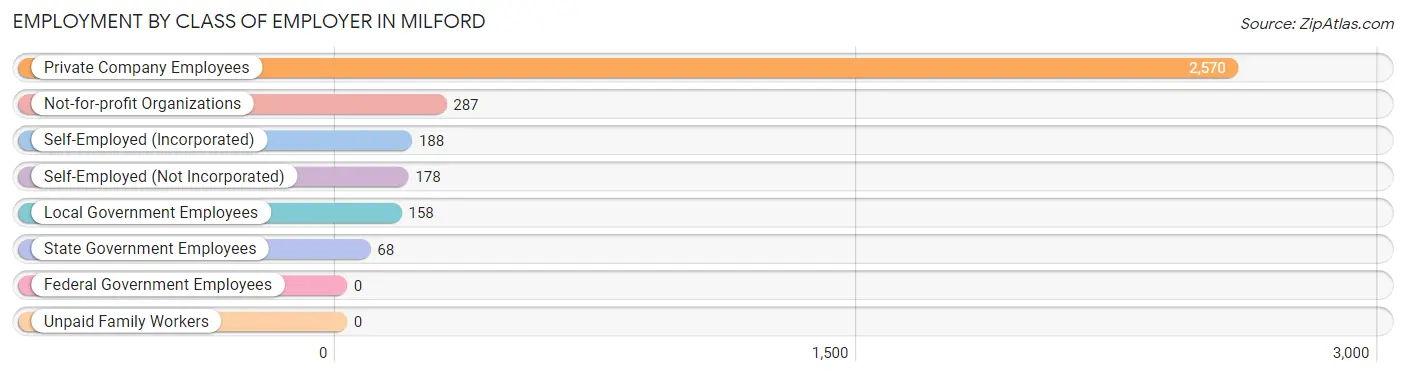
| Employer Class | # Employees | % Employees |
| Private Company Employees | 2,570 | 74.5% |
| Self-Employed (Incorporated) | 188 | 5.4% |
| Self-Employed (Not Incorporated) | 178 | 5.2% |
| Not-for-profit Organizations | 287 | 8.3% |
| Local Government Employees | 158 | 4.6% |
| State Government Employees | 68 | 2.0% |
| Federal Government Employees | 0 | 0.0% |
| Unpaid Family Workers | 0 | 0.0% |
| Total | 3,449 | 100.0% |
Employment Status by Age in Milford
According to the labor force statistics for Milford, out of the total population over 16 years of age (5,605), 64.9% or 3,638 individuals are in the labor force, with 4.7% or 171 of them unemployed. The age group with the highest labor force participation rate is 25 to 29 years, with 91.0% or 497 individuals in the labor force. Within the labor force, the 75 years and over age range has the highest percentage of unemployed individuals, with 59.5% or 44 of them being unemployed.
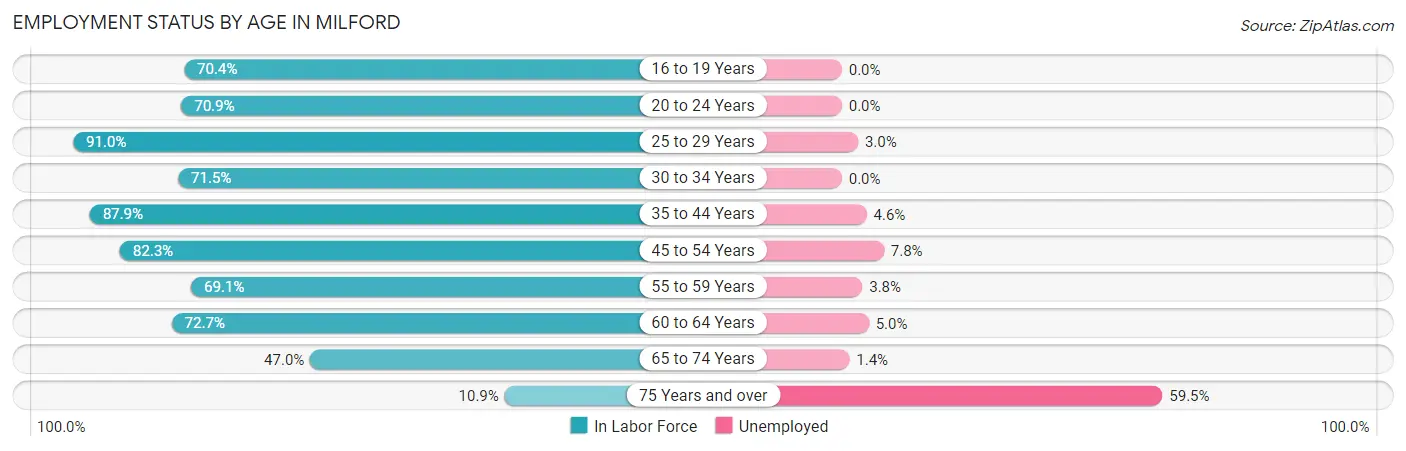
| Age Bracket | In Labor Force | Unemployed |
| 16 to 19 Years | 164 (70.4%) | 0 (0.0%) |
| 20 to 24 Years | 287 (70.9%) | 0 (0.0%) |
| 25 to 29 Years | 497 (91.0%) | 15 (3.0%) |
| 30 to 34 Years | 213 (71.5%) | 0 (0.0%) |
| 35 to 44 Years | 715 (87.9%) | 33 (4.6%) |
| 45 to 54 Years | 590 (82.3%) | 46 (7.8%) |
| 55 to 59 Years | 344 (69.1%) | 13 (3.8%) |
| 60 to 64 Years | 258 (72.7%) | 13 (5.0%) |
| 65 to 74 Years | 497 (47.0%) | 7 (1.4%) |
| 75 Years and over | 74 (10.9%) | 44 (59.5%) |
| Total | 3,638 (64.9%) | 171 (4.7%) |
Employment Status by Educational Attainment in Milford
According to labor force statistics for Milford, 81.1% of individuals (2,617) out of the total population between 25 and 64 years of age (3,227) are in the labor force, with 4.6% or 120 of them being unemployed. The group with the highest labor force participation rate are those with the educational attainment of bachelor's degree or higher, with 87.2% or 1,277 individuals in the labor force. Within the labor force, individuals with less than high school education have the highest percentage of unemployment, with 9.4% or 13 of them being unemployed.
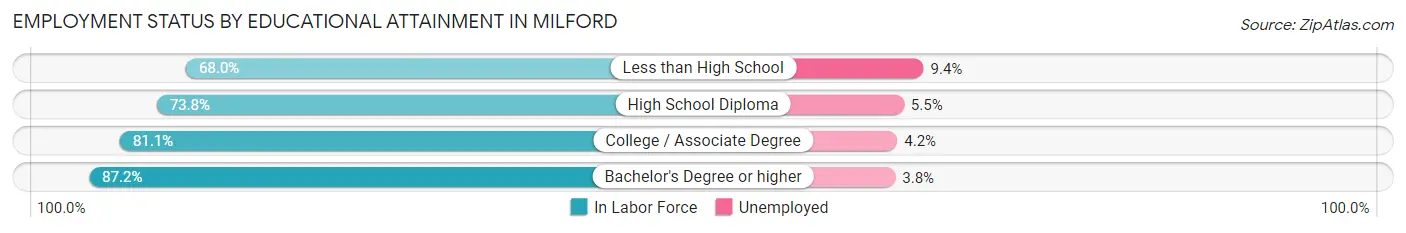
| Educational Attainment | In Labor Force | Unemployed |
| Less than High School | 138 (68.0%) | 19 (9.4%) |
| High School Diploma | 631 (73.8%) | 47 (5.5%) |
| College / Associate Degree | 571 (81.1%) | 30 (4.2%) |
| Bachelor's Degree or higher | 1,277 (87.2%) | 56 (3.8%) |
| Total | 2,617 (81.1%) | 148 (4.6%) |
Employment Occupations by Sex in Milford
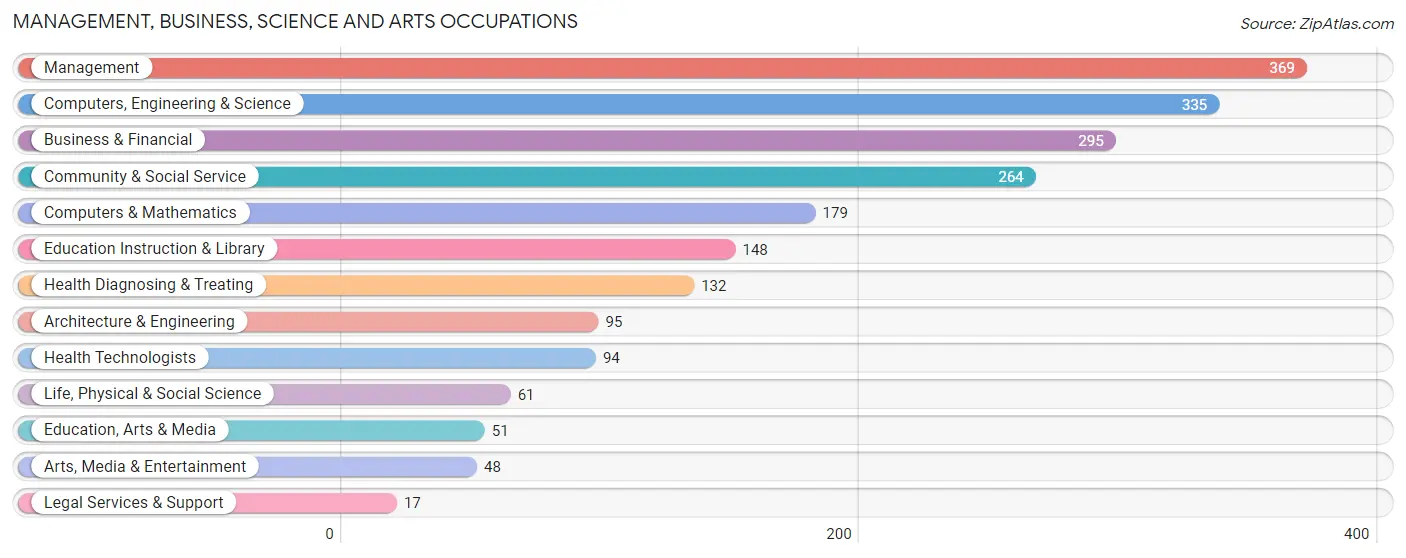
Management, Business, Science and Arts Occupations
The most common Management, Business, Science and Arts occupations in Milford are Management (369 | 10.6%), Computers, Engineering & Science (335 | 9.7%), Business & Financial (295 | 8.5%), Community & Social Service (264 | 7.6%), and Computers & Mathematics (179 | 5.2%).
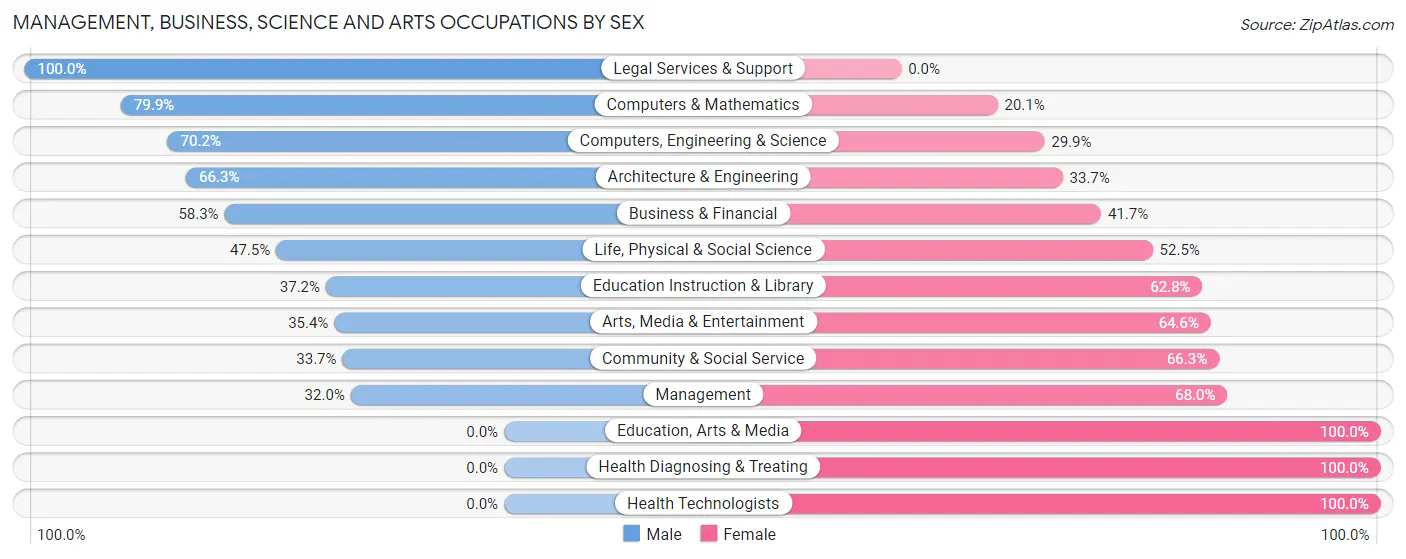
Management, Business, Science and Arts Occupations by Sex
Within the Management, Business, Science and Arts occupations in Milford, the most male-oriented occupations are Legal Services & Support (100.0%), Computers & Mathematics (79.9%), and Computers, Engineering & Science (70.2%), while the most female-oriented occupations are Education, Arts & Media (100.0%), Health Diagnosing & Treating (100.0%), and Health Technologists (100.0%).
| Occupation | Male | Female |
| Management | 118 (32.0%) | 251 (68.0%) |
| Business & Financial | 172 (58.3%) | 123 (41.7%) |
| Computers, Engineering & Science | 235 (70.2%) | 100 (29.8%) |
| Computers & Mathematics | 143 (79.9%) | 36 (20.1%) |
| Architecture & Engineering | 63 (66.3%) | 32 (33.7%) |
| Life, Physical & Social Science | 29 (47.5%) | 32 (52.5%) |
| Community & Social Service | 89 (33.7%) | 175 (66.3%) |
| Education, Arts & Media | 0 (0.0%) | 51 (100.0%) |
| Legal Services & Support | 17 (100.0%) | 0 (0.0%) |
| Education Instruction & Library | 55 (37.2%) | 93 (62.8%) |
| Arts, Media & Entertainment | 17 (35.4%) | 31 (64.6%) |
| Health Diagnosing & Treating | 0 (0.0%) | 132 (100.0%) |
| Health Technologists | 0 (0.0%) | 94 (100.0%) |
| Total (Category) | 614 (44.0%) | 781 (56.0%) |
| Total (Overall) | 1,627 (46.9%) | 1,841 (53.1%) |
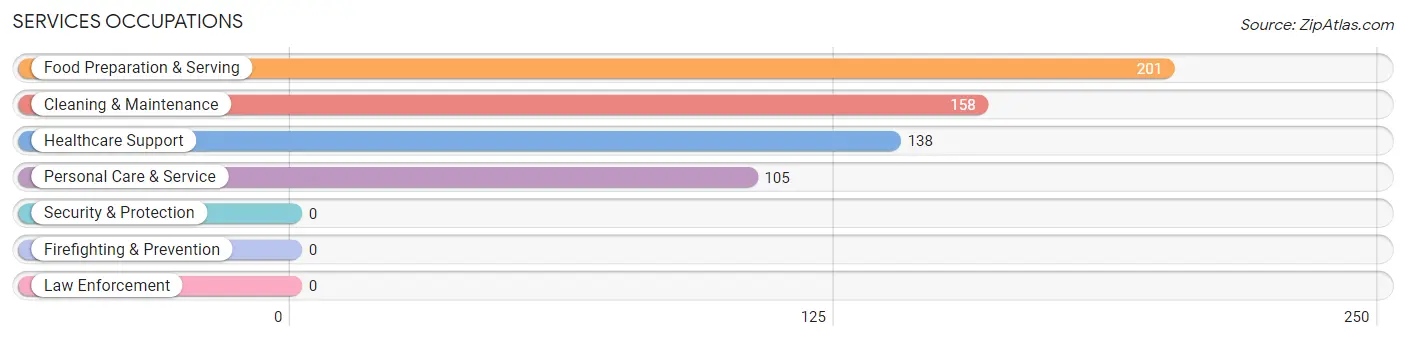
Services Occupations
The most common Services occupations in Milford are Food Preparation & Serving (201 | 5.8%), Cleaning & Maintenance (158 | 4.6%), Healthcare Support (138 | 4.0%), and Personal Care & Service (105 | 3.0%).
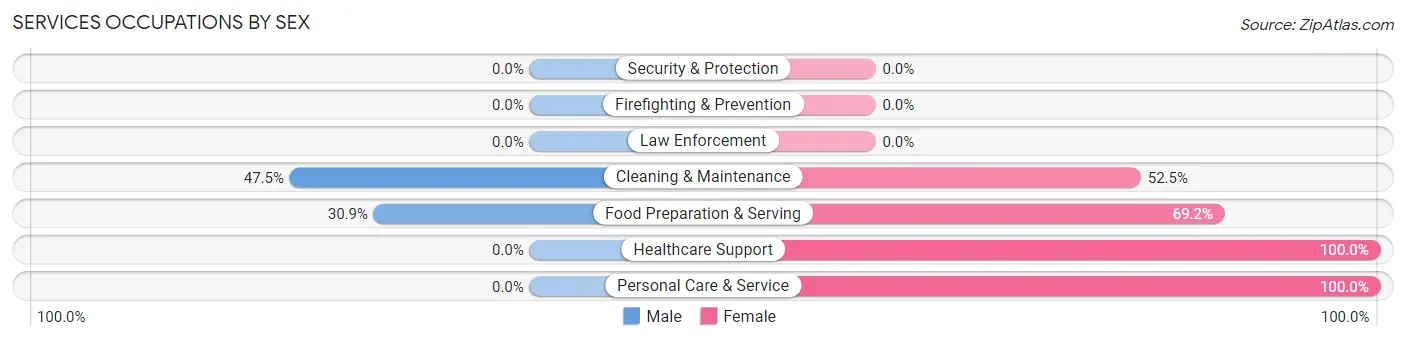
Services Occupations by Sex
Within the Services occupations in Milford, the most male-oriented occupations are Cleaning & Maintenance (47.5%), and Food Preparation & Serving (30.8%), while the most female-oriented occupations are Healthcare Support (100.0%), Personal Care & Service (100.0%), and Food Preparation & Serving (69.2%).
| Occupation | Male | Female |
| Healthcare Support | 0 (0.0%) | 138 (100.0%) |
| Security & Protection | 0 (0.0%) | 0 (0.0%) |
| Firefighting & Prevention | 0 (0.0%) | 0 (0.0%) |
| Law Enforcement | 0 (0.0%) | 0 (0.0%) |
| Food Preparation & Serving | 62 (30.8%) | 139 (69.2%) |
| Cleaning & Maintenance | 75 (47.5%) | 83 (52.5%) |
| Personal Care & Service | 0 (0.0%) | 105 (100.0%) |
| Total (Category) | 137 (22.8%) | 465 (77.2%) |
| Total (Overall) | 1,627 (46.9%) | 1,841 (53.1%) |
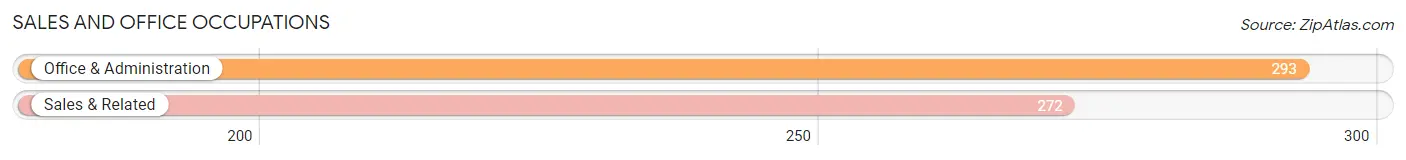
Sales and Office Occupations
The most common Sales and Office occupations in Milford are Office & Administration (293 | 8.5%), and Sales & Related (272 | 7.8%).
Sales and Office Occupations by Sex
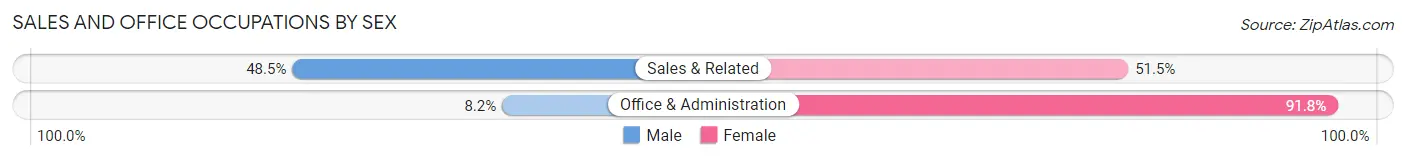
| Occupation | Male | Female |
| Sales & Related | 132 (48.5%) | 140 (51.5%) |
| Office & Administration | 24 (8.2%) | 269 (91.8%) |
| Total (Category) | 156 (27.6%) | 409 (72.4%) |
| Total (Overall) | 1,627 (46.9%) | 1,841 (53.1%) |
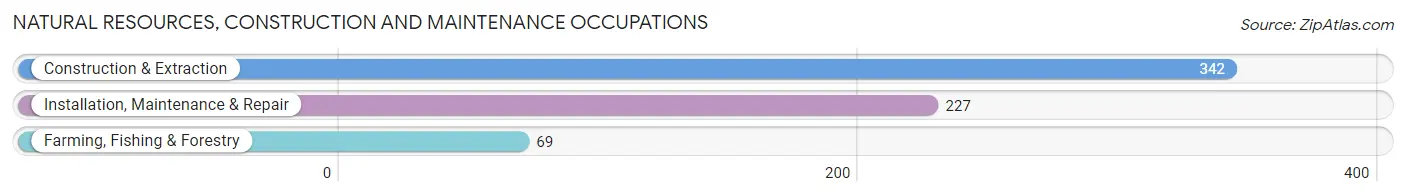
Natural Resources, Construction and Maintenance Occupations
The most common Natural Resources, Construction and Maintenance occupations in Milford are Construction & Extraction (342 | 9.9%), Installation, Maintenance & Repair (227 | 6.6%), and Farming, Fishing & Forestry (69 | 2.0%).
Natural Resources, Construction and Maintenance Occupations by Sex
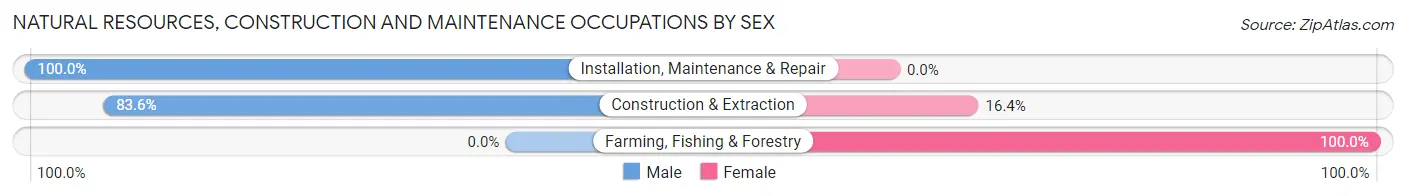
| Occupation | Male | Female |
| Farming, Fishing & Forestry | 0 (0.0%) | 69 (100.0%) |
| Construction & Extraction | 286 (83.6%) | 56 (16.4%) |
| Installation, Maintenance & Repair | 227 (100.0%) | 0 (0.0%) |
| Total (Category) | 513 (80.4%) | 125 (19.6%) |
| Total (Overall) | 1,627 (46.9%) | 1,841 (53.1%) |
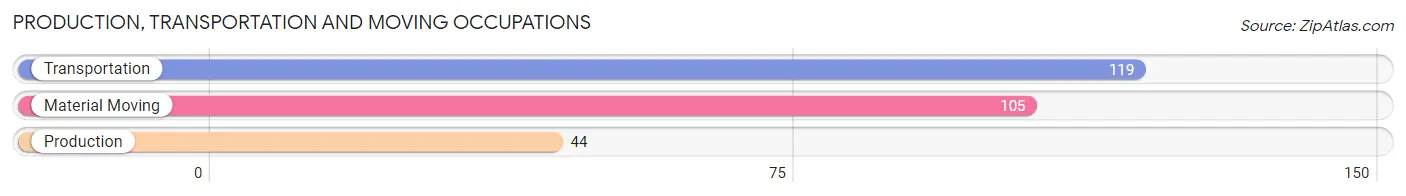
Production, Transportation and Moving Occupations
The most common Production, Transportation and Moving occupations in Milford are Transportation (119 | 3.4%), Material Moving (105 | 3.0%), and Production (44 | 1.3%).
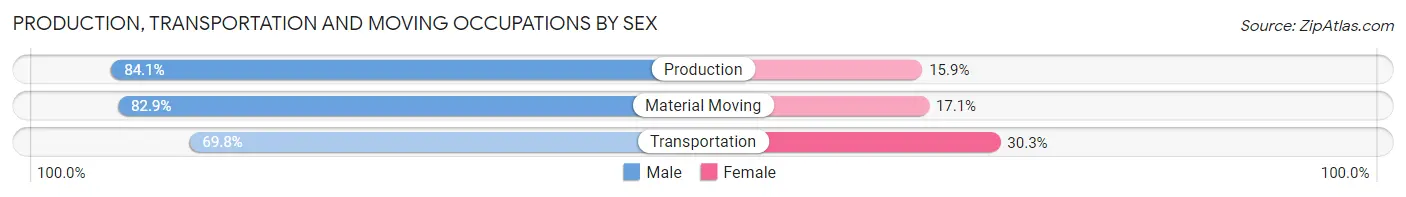
Production, Transportation and Moving Occupations by Sex
| Occupation | Male | Female |
| Production | 37 (84.1%) | 7 (15.9%) |
| Transportation | 83 (69.8%) | 36 (30.2%) |
| Material Moving | 87 (82.9%) | 18 (17.1%) |
| Total (Category) | 207 (77.2%) | 61 (22.8%) |
| Total (Overall) | 1,627 (46.9%) | 1,841 (53.1%) |
Employment Industries by Sex in Milford
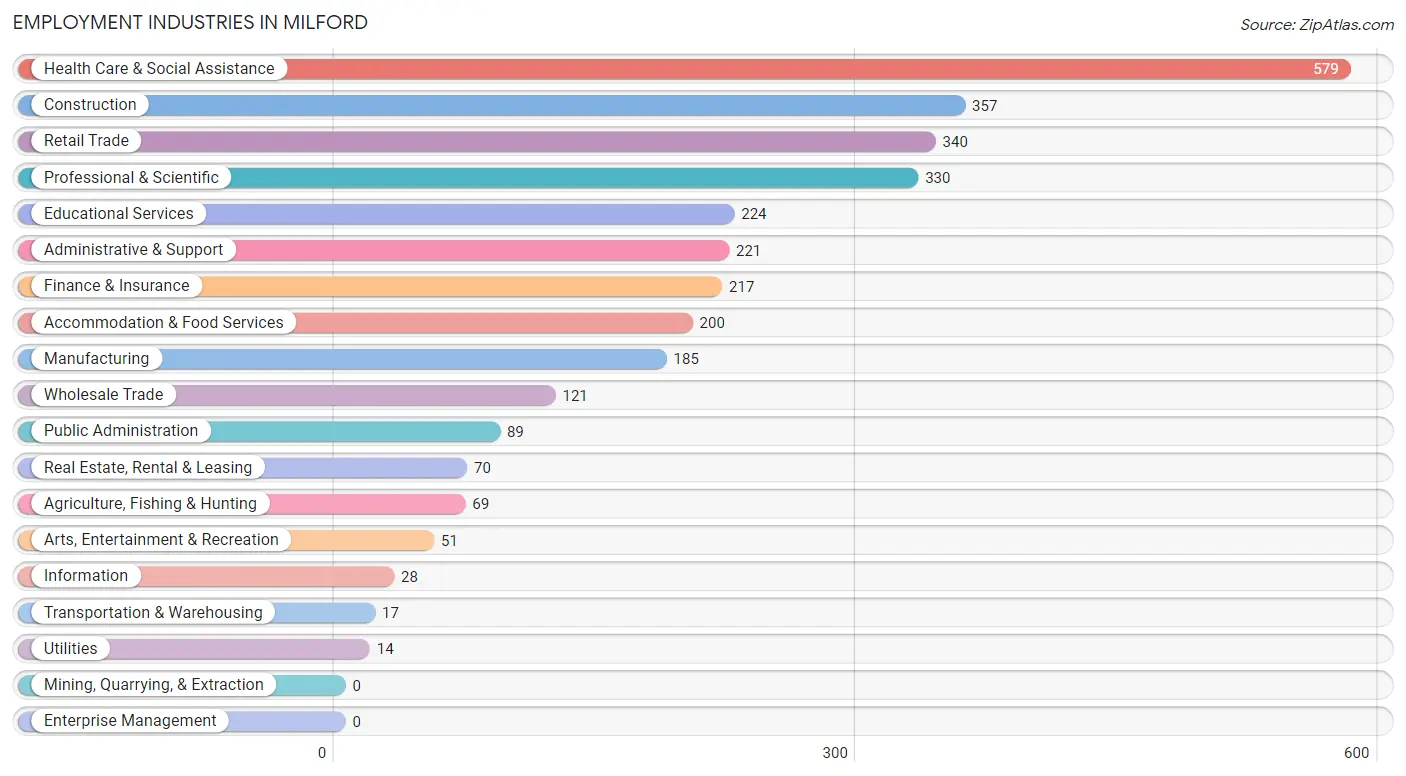
Employment Industries in Milford
The major employment industries in Milford include Health Care & Social Assistance (579 | 16.7%), Construction (357 | 10.3%), Retail Trade (340 | 9.8%), Professional & Scientific (330 | 9.5%), and Educational Services (224 | 6.5%).
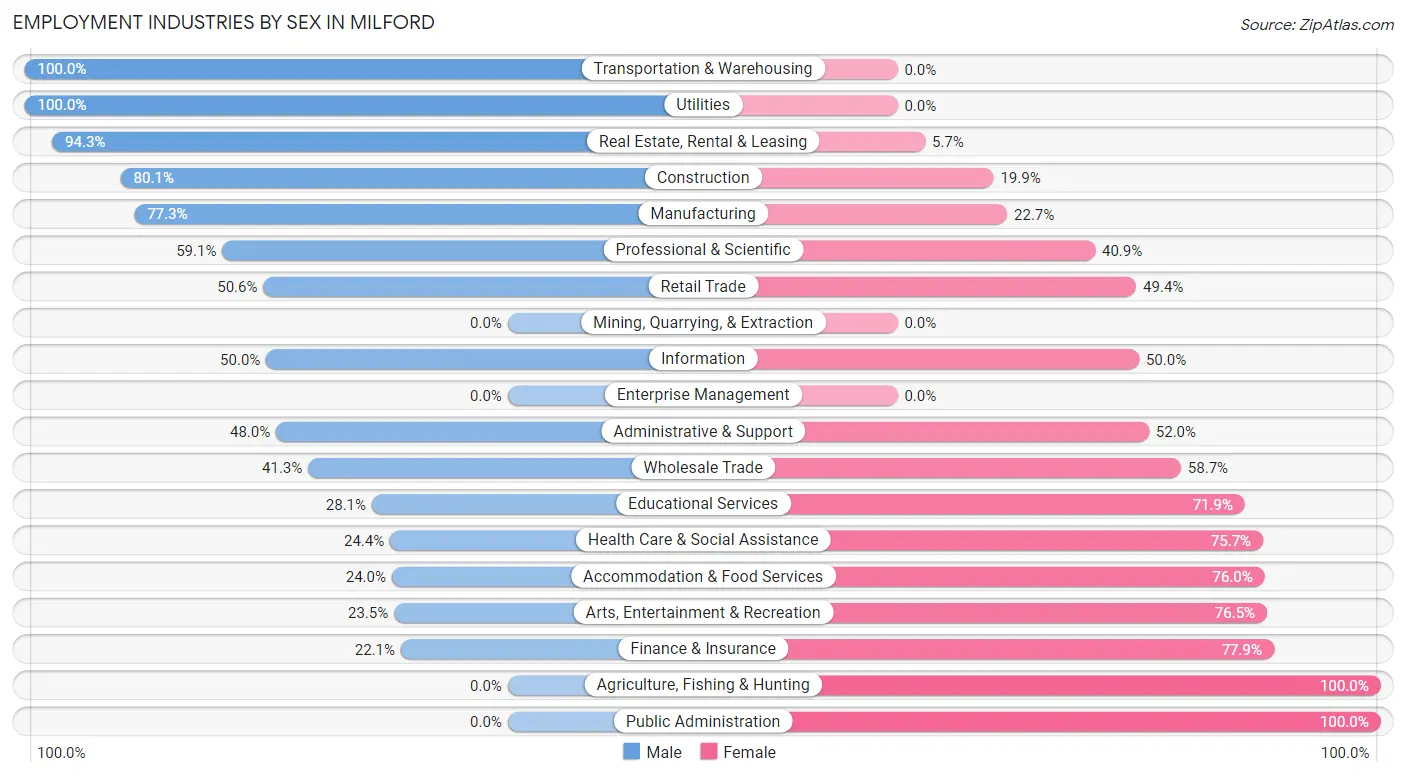
Employment Industries by Sex in Milford
The Milford industries that see more men than women are Transportation & Warehousing (100.0%), Utilities (100.0%), and Real Estate, Rental & Leasing (94.3%), whereas the industries that tend to have a higher number of women are Agriculture, Fishing & Hunting (100.0%), Public Administration (100.0%), and Finance & Insurance (77.9%).
| Industry | Male | Female |
| Agriculture, Fishing & Hunting | 0 (0.0%) | 69 (100.0%) |
| Mining, Quarrying, & Extraction | 0 (0.0%) | 0 (0.0%) |
| Construction | 286 (80.1%) | 71 (19.9%) |
| Manufacturing | 143 (77.3%) | 42 (22.7%) |
| Wholesale Trade | 50 (41.3%) | 71 (58.7%) |
| Retail Trade | 172 (50.6%) | 168 (49.4%) |
| Transportation & Warehousing | 17 (100.0%) | 0 (0.0%) |
| Utilities | 14 (100.0%) | 0 (0.0%) |
| Information | 14 (50.0%) | 14 (50.0%) |
| Finance & Insurance | 48 (22.1%) | 169 (77.9%) |
| Real Estate, Rental & Leasing | 66 (94.3%) | 4 (5.7%) |
| Professional & Scientific | 195 (59.1%) | 135 (40.9%) |
| Enterprise Management | 0 (0.0%) | 0 (0.0%) |
| Administrative & Support | 106 (48.0%) | 115 (52.0%) |
| Educational Services | 63 (28.1%) | 161 (71.9%) |
| Health Care & Social Assistance | 141 (24.3%) | 438 (75.6%) |
| Arts, Entertainment & Recreation | 12 (23.5%) | 39 (76.5%) |
| Accommodation & Food Services | 48 (24.0%) | 152 (76.0%) |
| Public Administration | 0 (0.0%) | 89 (100.0%) |
| Total | 1,627 (46.9%) | 1,841 (53.1%) |
Education in Milford
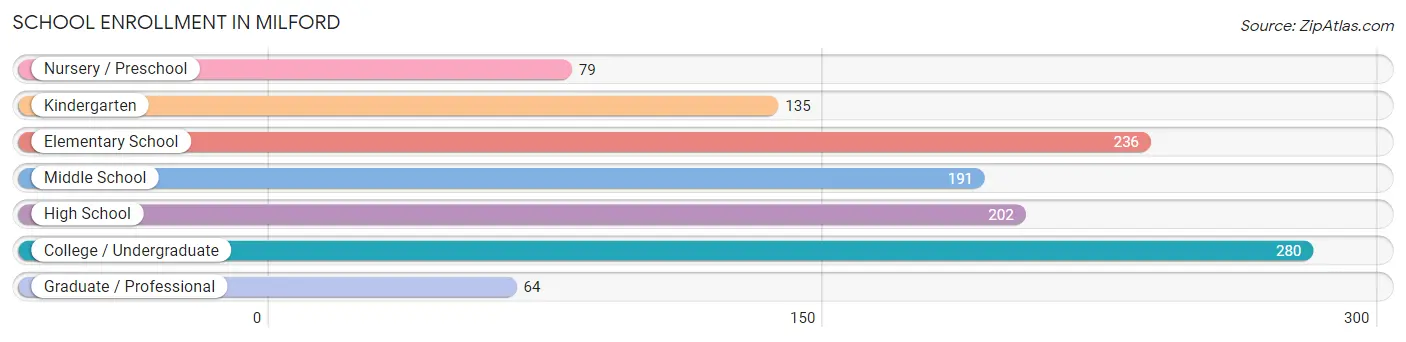
School Enrollment in Milford
The most common levels of schooling among the 1,187 students in Milford are college / undergraduate (280 | 23.6%), elementary school (236 | 19.9%), and high school (202 | 17.0%).
| School Level | # Students | % Students |
| Nursery / Preschool | 79 | 6.7% |
| Kindergarten | 135 | 11.4% |
| Elementary School | 236 | 19.9% |
| Middle School | 191 | 16.1% |
| High School | 202 | 17.0% |
| College / Undergraduate | 280 | 23.6% |
| Graduate / Professional | 64 | 5.4% |
| Total | 1,187 | 100.0% |
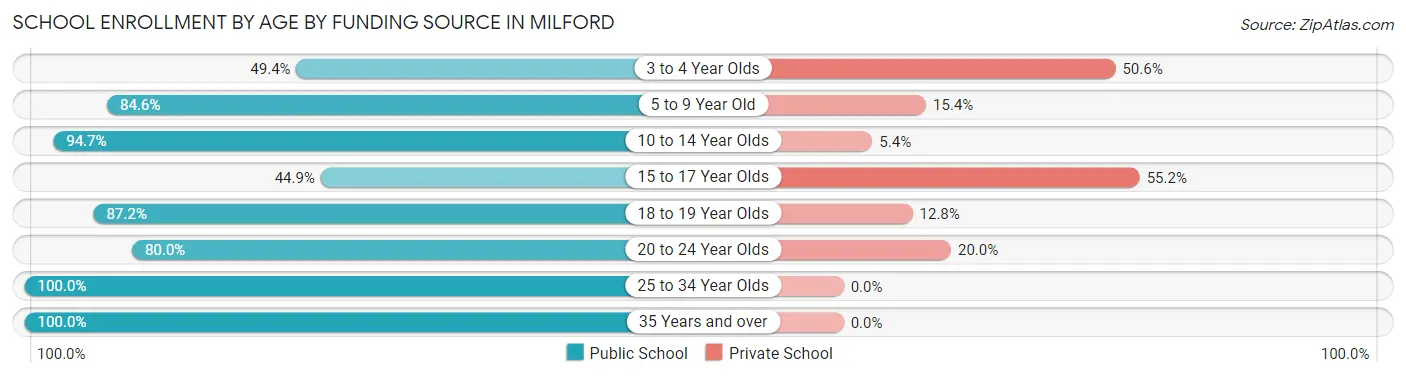
School Enrollment by Age by Funding Source in Milford
Out of a total of 1,187 students who are enrolled in schools in Milford, 211 (17.8%) attend a private institution, while the remaining 976 (82.2%) are enrolled in public schools. The age group of 15 to 17 year olds has the highest likelihood of being enrolled in private schools, with 75 (55.1% in the age bracket) enrolled. Conversely, the age group of 25 to 34 year olds has the lowest likelihood of being enrolled in a private school, with 16 (100.0% in the age bracket) attending a public institution.
| Age Bracket | Public School | Private School |
| 3 to 4 Year Olds | 39 (49.4%) | 40 (50.6%) |
| 5 to 9 Year Old | 314 (84.6%) | 57 (15.4%) |
| 10 to 14 Year Olds | 230 (94.7%) | 13 (5.3%) |
| 15 to 17 Year Olds | 61 (44.9%) | 75 (55.1%) |
| 18 to 19 Year Olds | 95 (87.2%) | 14 (12.8%) |
| 20 to 24 Year Olds | 48 (80.0%) | 12 (20.0%) |
| 25 to 34 Year Olds | 16 (100.0%) | 0 (0.0%) |
| 35 Years and over | 173 (100.0%) | 0 (0.0%) |
| Total | 976 (82.2%) | 211 (17.8%) |
Educational Attainment by Field of Study in Milford
Business (579 | 26.8%), social sciences (296 | 13.7%), science & technology (242 | 11.2%), education (178 | 8.2%), and arts & humanities (151 | 7.0%) are the most common fields of study among 2,163 individuals in Milford who have obtained a bachelor's degree or higher.
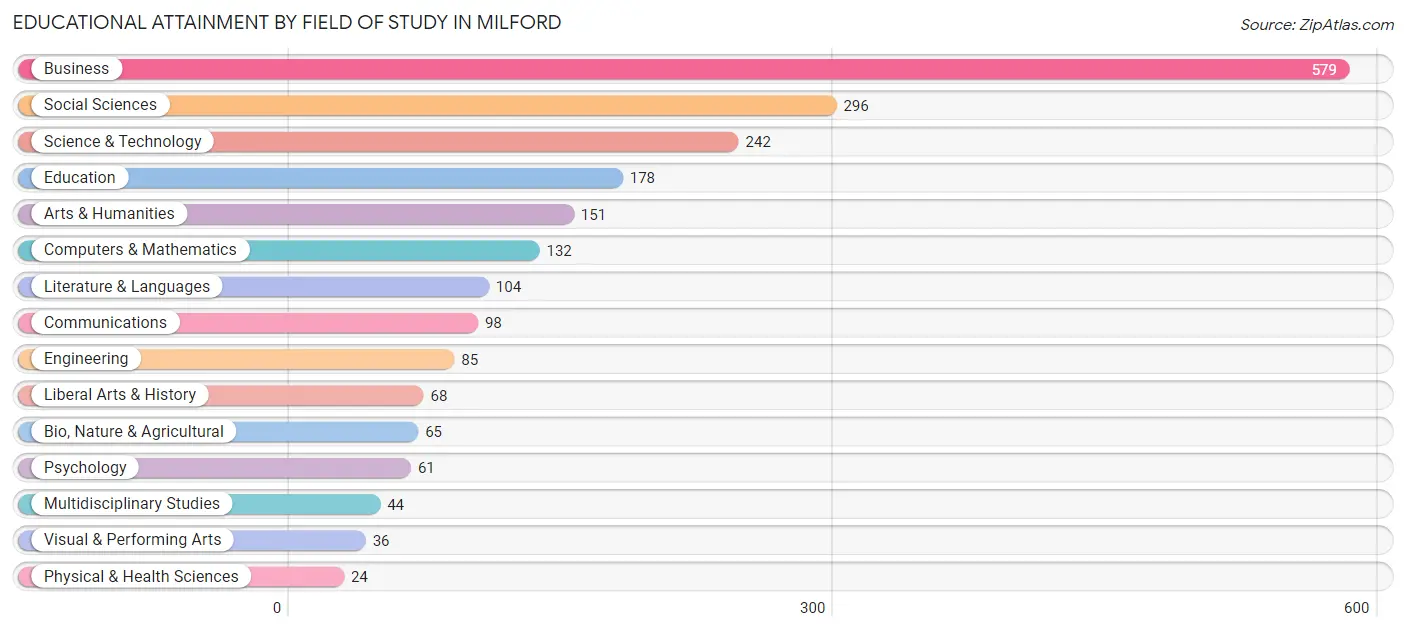
| Field of Study | # Graduates | % Graduates |
| Computers & Mathematics | 132 | 6.1% |
| Bio, Nature & Agricultural | 65 | 3.0% |
| Physical & Health Sciences | 24 | 1.1% |
| Psychology | 61 | 2.8% |
| Social Sciences | 296 | 13.7% |
| Engineering | 85 | 3.9% |
| Multidisciplinary Studies | 44 | 2.0% |
| Science & Technology | 242 | 11.2% |
| Business | 579 | 26.8% |
| Education | 178 | 8.2% |
| Literature & Languages | 104 | 4.8% |
| Liberal Arts & History | 68 | 3.1% |
| Visual & Performing Arts | 36 | 1.7% |
| Communications | 98 | 4.5% |
| Arts & Humanities | 151 | 7.0% |
| Total | 2,163 | 100.0% |
Transportation & Commute in Milford
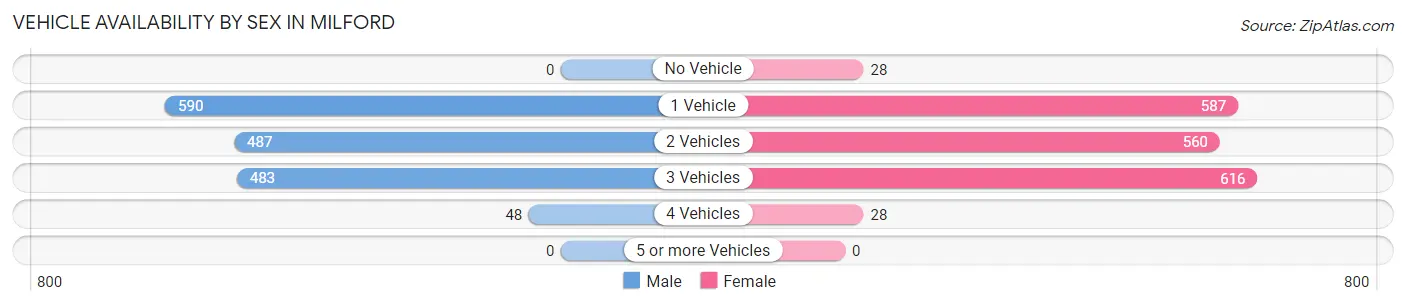
Vehicle Availability by Sex in Milford
The most prevalent vehicle ownership categories in Milford are males with 1 vehicle (590, accounting for 36.7%) and females with 1 vehicle (587, making up 32.4%).
| Vehicles Available | Male | Female |
| No Vehicle | 0 (0.0%) | 28 (1.5%) |
| 1 Vehicle | 590 (36.7%) | 587 (32.3%) |
| 2 Vehicles | 487 (30.3%) | 560 (30.8%) |
| 3 Vehicles | 483 (30.0%) | 616 (33.9%) |
| 4 Vehicles | 48 (3.0%) | 28 (1.5%) |
| 5 or more Vehicles | 0 (0.0%) | 0 (0.0%) |
| Total | 1,608 (100.0%) | 1,819 (100.0%) |
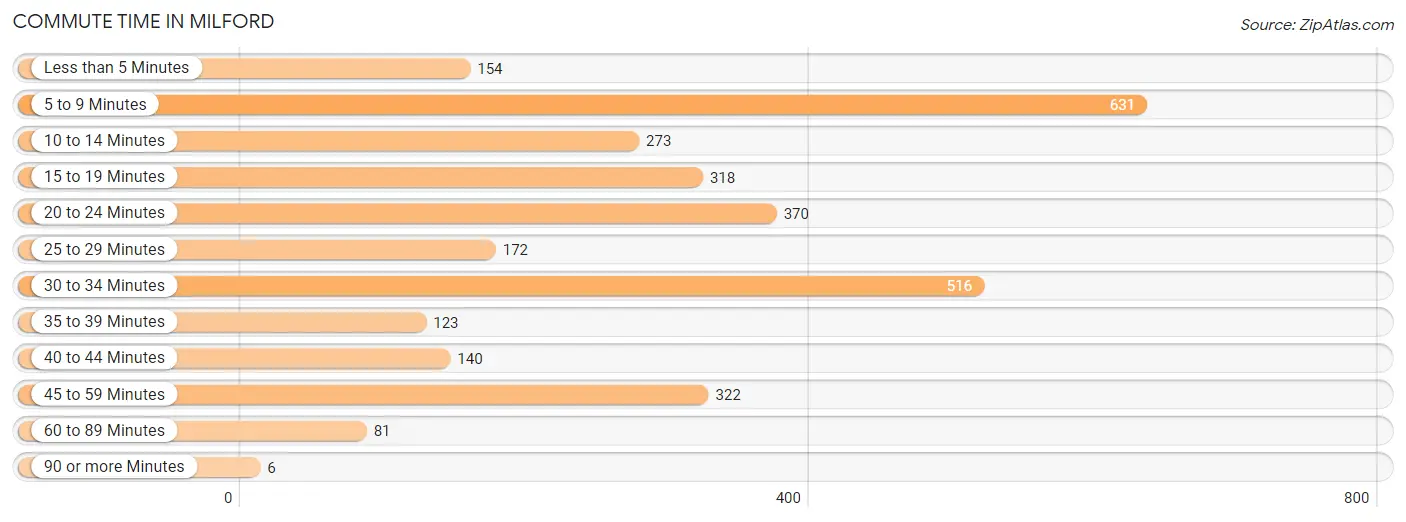
Commute Time in Milford
The most frequently occuring commute durations in Milford are 5 to 9 minutes (631 commuters, 20.3%), 30 to 34 minutes (516 commuters, 16.6%), and 20 to 24 minutes (370 commuters, 11.9%).
| Commute Time | # Commuters | % Commuters |
| Less than 5 Minutes | 154 | 5.0% |
| 5 to 9 Minutes | 631 | 20.3% |
| 10 to 14 Minutes | 273 | 8.8% |
| 15 to 19 Minutes | 318 | 10.2% |
| 20 to 24 Minutes | 370 | 11.9% |
| 25 to 29 Minutes | 172 | 5.5% |
| 30 to 34 Minutes | 516 | 16.6% |
| 35 to 39 Minutes | 123 | 4.0% |
| 40 to 44 Minutes | 140 | 4.5% |
| 45 to 59 Minutes | 322 | 10.4% |
| 60 to 89 Minutes | 81 | 2.6% |
| 90 or more Minutes | 6 | 0.2% |
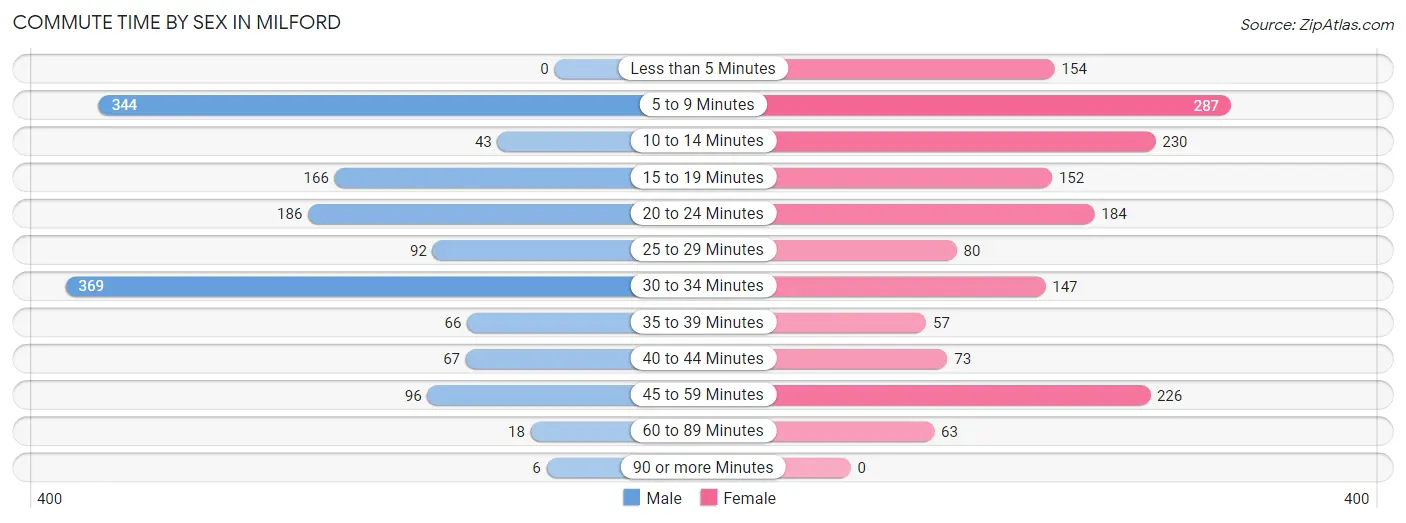
Commute Time by Sex in Milford
The most common commute times in Milford are 30 to 34 minutes (369 commuters, 25.4%) for males and 5 to 9 minutes (287 commuters, 17.4%) for females.
| Commute Time | Male | Female |
| Less than 5 Minutes | 0 (0.0%) | 154 (9.3%) |
| 5 to 9 Minutes | 344 (23.7%) | 287 (17.4%) |
| 10 to 14 Minutes | 43 (3.0%) | 230 (13.9%) |
| 15 to 19 Minutes | 166 (11.4%) | 152 (9.2%) |
| 20 to 24 Minutes | 186 (12.8%) | 184 (11.1%) |
| 25 to 29 Minutes | 92 (6.3%) | 80 (4.8%) |
| 30 to 34 Minutes | 369 (25.4%) | 147 (8.9%) |
| 35 to 39 Minutes | 66 (4.5%) | 57 (3.5%) |
| 40 to 44 Minutes | 67 (4.6%) | 73 (4.4%) |
| 45 to 59 Minutes | 96 (6.6%) | 226 (13.7%) |
| 60 to 89 Minutes | 18 (1.2%) | 63 (3.8%) |
| 90 or more Minutes | 6 (0.4%) | 0 (0.0%) |
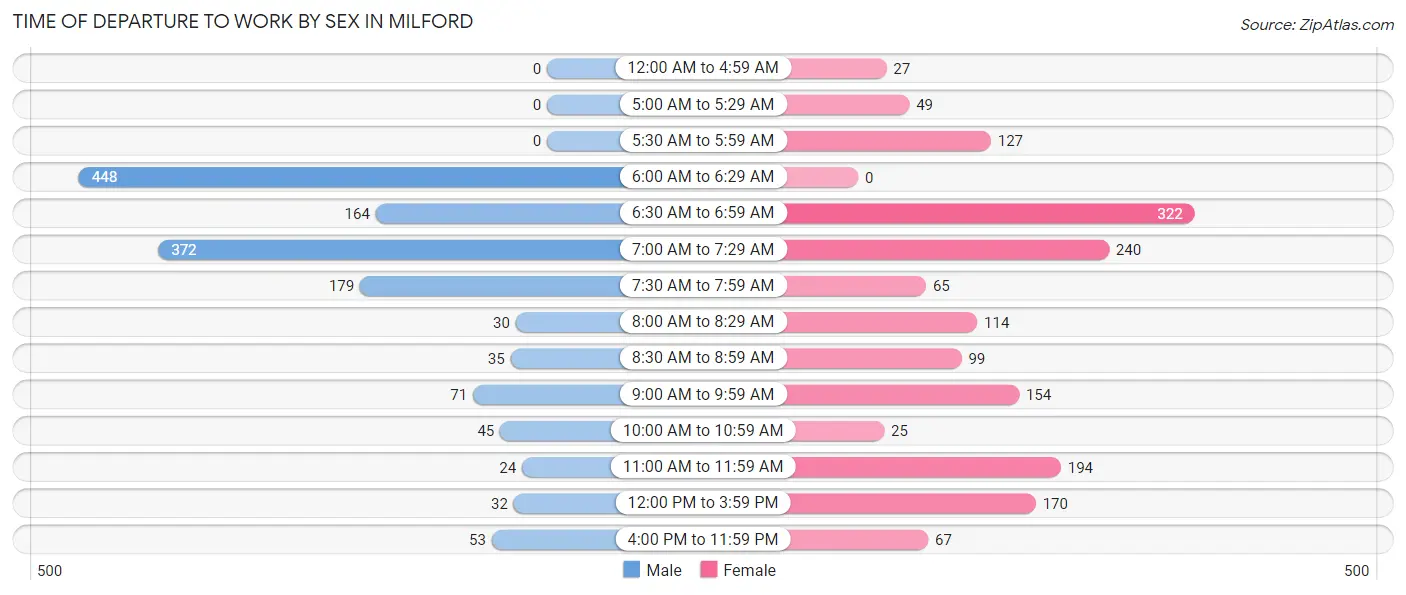
Time of Departure to Work by Sex in Milford
The most frequent times of departure to work in Milford are 6:00 AM to 6:29 AM (448, 30.8%) for males and 6:30 AM to 6:59 AM (322, 19.5%) for females.
| Time of Departure | Male | Female |
| 12:00 AM to 4:59 AM | 0 (0.0%) | 27 (1.6%) |
| 5:00 AM to 5:29 AM | 0 (0.0%) | 49 (3.0%) |
| 5:30 AM to 5:59 AM | 0 (0.0%) | 127 (7.7%) |
| 6:00 AM to 6:29 AM | 448 (30.8%) | 0 (0.0%) |
| 6:30 AM to 6:59 AM | 164 (11.3%) | 322 (19.5%) |
| 7:00 AM to 7:29 AM | 372 (25.6%) | 240 (14.5%) |
| 7:30 AM to 7:59 AM | 179 (12.3%) | 65 (3.9%) |
| 8:00 AM to 8:29 AM | 30 (2.1%) | 114 (6.9%) |
| 8:30 AM to 8:59 AM | 35 (2.4%) | 99 (6.0%) |
| 9:00 AM to 9:59 AM | 71 (4.9%) | 154 (9.3%) |
| 10:00 AM to 10:59 AM | 45 (3.1%) | 25 (1.5%) |
| 11:00 AM to 11:59 AM | 24 (1.7%) | 194 (11.7%) |
| 12:00 PM to 3:59 PM | 32 (2.2%) | 170 (10.3%) |
| 4:00 PM to 11:59 PM | 53 (3.6%) | 67 (4.1%) |
| Total | 1,453 (100.0%) | 1,653 (100.0%) |
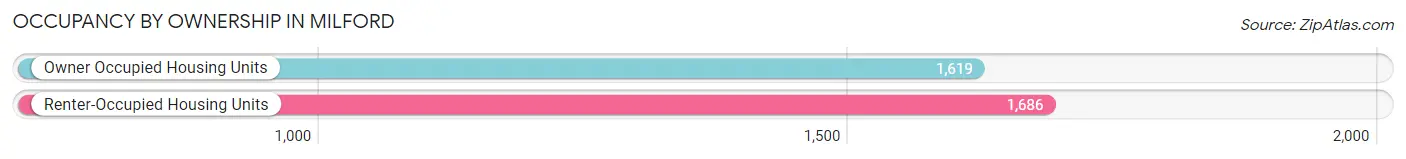
Housing Occupancy in Milford
Occupancy by Ownership in Milford
Of the total 3,305 dwellings in Milford, owner-occupied units account for 1,619 (49.0%), while renter-occupied units make up 1,686 (51.0%).
| Occupancy | # Housing Units | % Housing Units |
| Owner Occupied Housing Units | 1,619 | 49.0% |
| Renter-Occupied Housing Units | 1,686 | 51.0% |
| Total Occupied Housing Units | 3,305 | 100.0% |
Occupancy by Household Size in Milford
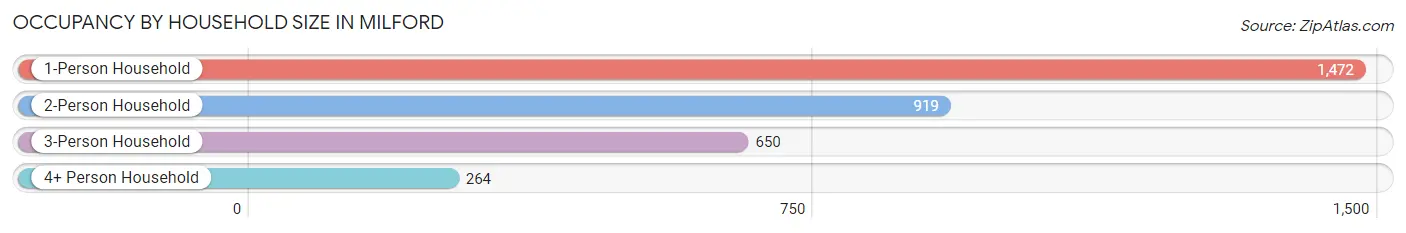
| Household Size | # Housing Units | % Housing Units |
| 1-Person Household | 1,472 | 44.5% |
| 2-Person Household | 919 | 27.8% |
| 3-Person Household | 650 | 19.7% |
| 4+ Person Household | 264 | 8.0% |
| Total Housing Units | 3,305 | 100.0% |
Occupancy by Ownership by Household Size in Milford
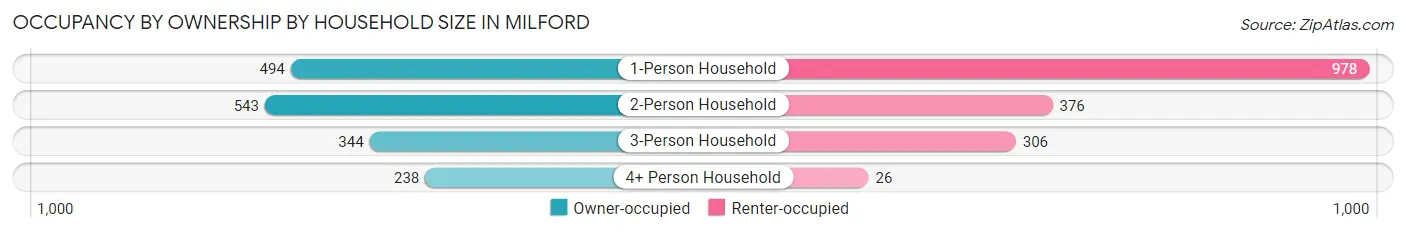
| Household Size | Owner-occupied | Renter-occupied |
| 1-Person Household | 494 (33.6%) | 978 (66.4%) |
| 2-Person Household | 543 (59.1%) | 376 (40.9%) |
| 3-Person Household | 344 (52.9%) | 306 (47.1%) |
| 4+ Person Household | 238 (90.1%) | 26 (9.9%) |
| Total Housing Units | 1,619 (49.0%) | 1,686 (51.0%) |
Occupancy by Educational Attainment in Milford
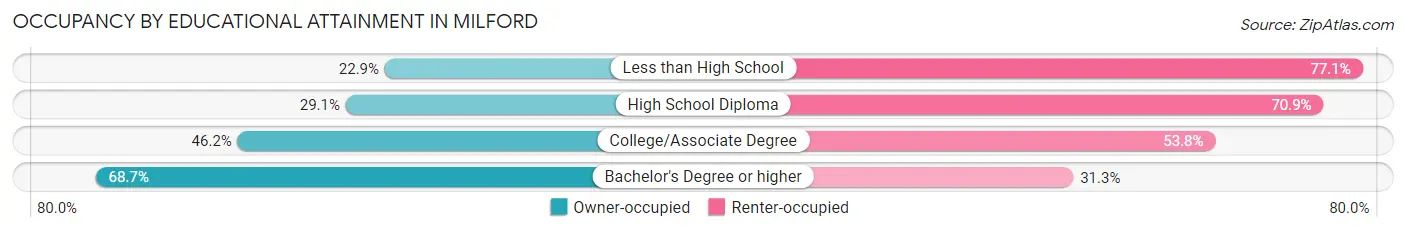
| Household Size | Owner-occupied | Renter-occupied |
| Less than High School | 48 (22.9%) | 162 (77.1%) |
| High School Diploma | 290 (29.1%) | 708 (70.9%) |
| College/Associate Degree | 329 (46.2%) | 383 (53.8%) |
| Bachelor's Degree or higher | 952 (68.7%) | 433 (31.3%) |
Occupancy by Age of Householder in Milford
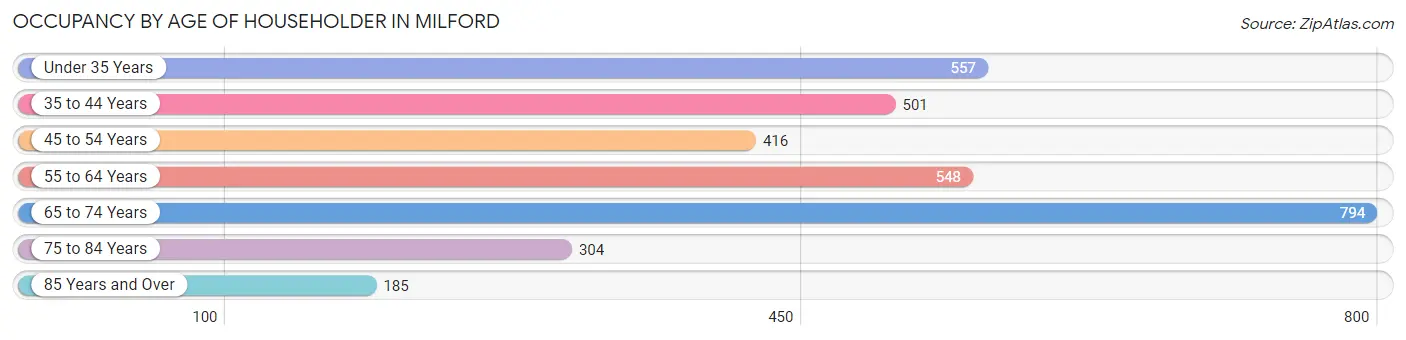
| Age Bracket | # Households | % Households |
| Under 35 Years | 557 | 16.9% |
| 35 to 44 Years | 501 | 15.2% |
| 45 to 54 Years | 416 | 12.6% |
| 55 to 64 Years | 548 | 16.6% |
| 65 to 74 Years | 794 | 24.0% |
| 75 to 84 Years | 304 | 9.2% |
| 85 Years and Over | 185 | 5.6% |
| Total | 3,305 | 100.0% |
Housing Finances in Milford
Median Income by Occupancy in Milford
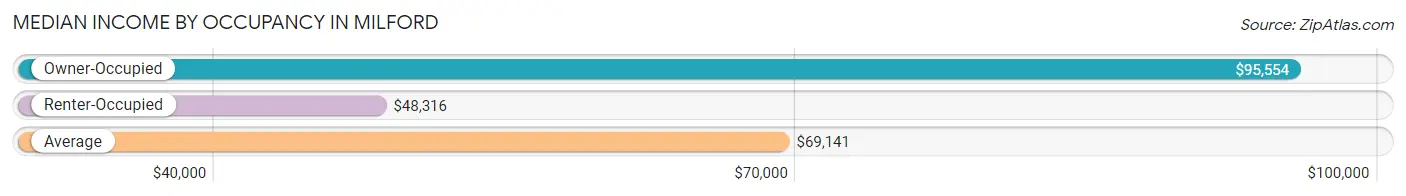
| Occupancy Type | # Households | Median Income |
| Owner-Occupied | 1,619 (49.0%) | $95,554 |
| Renter-Occupied | 1,686 (51.0%) | $48,316 |
| Average | 3,305 (100.0%) | $69,141 |
Occupancy by Householder Income Bracket in Milford
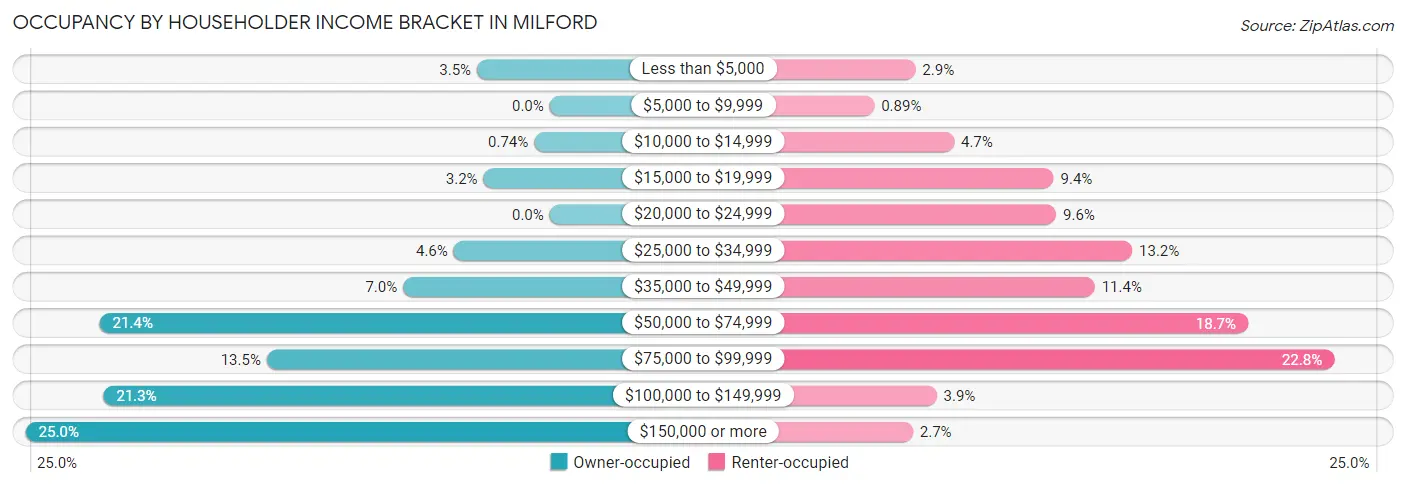
| Income Bracket | Owner-occupied | Renter-occupied |
| Less than $5,000 | 56 (3.5%) | 48 (2.9%) |
| $5,000 to $9,999 | 0 (0.0%) | 15 (0.9%) |
| $10,000 to $14,999 | 12 (0.7%) | 79 (4.7%) |
| $15,000 to $19,999 | 51 (3.2%) | 159 (9.4%) |
| $20,000 to $24,999 | 0 (0.0%) | 161 (9.6%) |
| $25,000 to $34,999 | 74 (4.6%) | 222 (13.2%) |
| $35,000 to $49,999 | 113 (7.0%) | 192 (11.4%) |
| $50,000 to $74,999 | 347 (21.4%) | 315 (18.7%) |
| $75,000 to $99,999 | 218 (13.5%) | 384 (22.8%) |
| $100,000 to $149,999 | 344 (21.2%) | 65 (3.9%) |
| $150,000 or more | 404 (24.9%) | 46 (2.7%) |
| Total | 1,619 (100.0%) | 1,686 (100.0%) |
Monthly Housing Cost Tiers in Milford
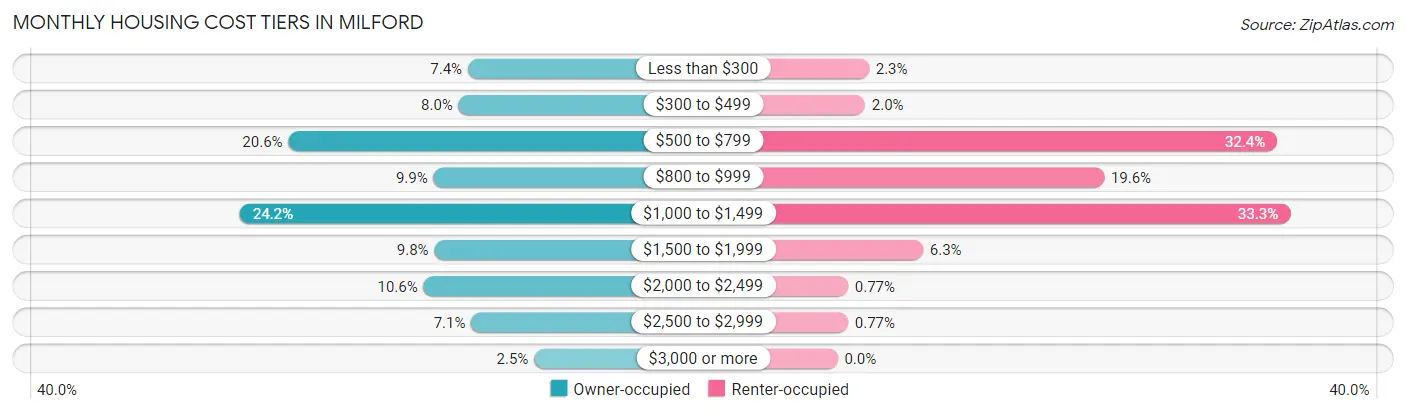
| Monthly Cost | Owner-occupied | Renter-occupied |
| Less than $300 | 119 (7.3%) | 39 (2.3%) |
| $300 to $499 | 130 (8.0%) | 34 (2.0%) |
| $500 to $799 | 333 (20.6%) | 546 (32.4%) |
| $800 to $999 | 160 (9.9%) | 331 (19.6%) |
| $1,000 to $1,499 | 391 (24.1%) | 562 (33.3%) |
| $1,500 to $1,999 | 159 (9.8%) | 106 (6.3%) |
| $2,000 to $2,499 | 172 (10.6%) | 13 (0.8%) |
| $2,500 to $2,999 | 115 (7.1%) | 13 (0.8%) |
| $3,000 or more | 40 (2.5%) | 0 (0.0%) |
| Total | 1,619 (100.0%) | 1,686 (100.0%) |
Physical Housing Characteristics in Milford
Housing Structures in Milford
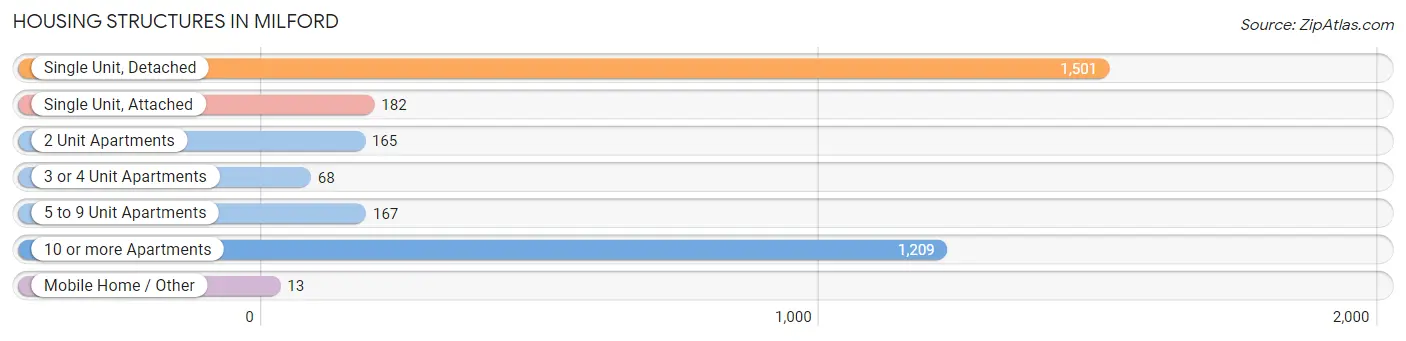
| Structure Type | # Housing Units | % Housing Units |
| Single Unit, Detached | 1,501 | 45.4% |
| Single Unit, Attached | 182 | 5.5% |
| 2 Unit Apartments | 165 | 5.0% |
| 3 or 4 Unit Apartments | 68 | 2.1% |
| 5 to 9 Unit Apartments | 167 | 5.1% |
| 10 or more Apartments | 1,209 | 36.6% |
| Mobile Home / Other | 13 | 0.4% |
| Total | 3,305 | 100.0% |
Housing Structures by Occupancy in Milford
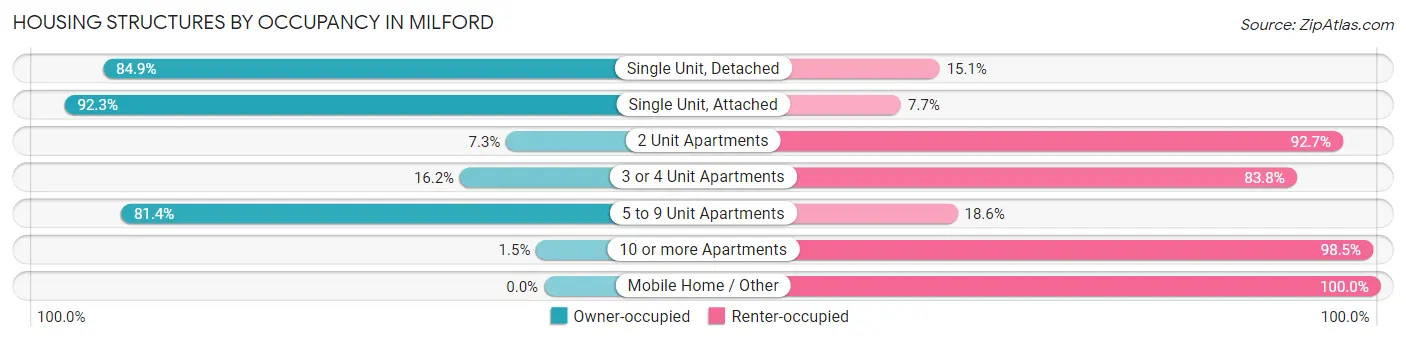
| Structure Type | Owner-occupied | Renter-occupied |
| Single Unit, Detached | 1,274 (84.9%) | 227 (15.1%) |
| Single Unit, Attached | 168 (92.3%) | 14 (7.7%) |
| 2 Unit Apartments | 12 (7.3%) | 153 (92.7%) |
| 3 or 4 Unit Apartments | 11 (16.2%) | 57 (83.8%) |
| 5 to 9 Unit Apartments | 136 (81.4%) | 31 (18.6%) |
| 10 or more Apartments | 18 (1.5%) | 1,191 (98.5%) |
| Mobile Home / Other | 0 (0.0%) | 13 (100.0%) |
| Total | 1,619 (49.0%) | 1,686 (51.0%) |
Housing Structures by Number of Rooms in Milford
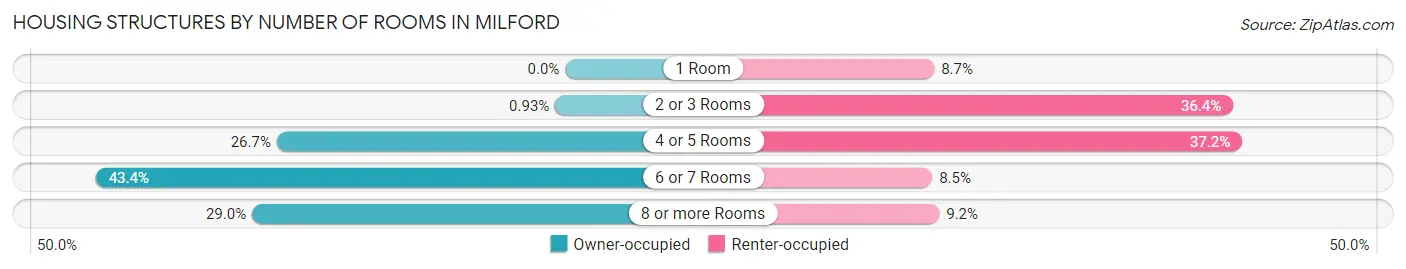
| Number of Rooms | Owner-occupied | Renter-occupied |
| 1 Room | 0 (0.0%) | 147 (8.7%) |
| 2 or 3 Rooms | 15 (0.9%) | 613 (36.4%) |
| 4 or 5 Rooms | 432 (26.7%) | 627 (37.2%) |
| 6 or 7 Rooms | 703 (43.4%) | 144 (8.5%) |
| 8 or more Rooms | 469 (29.0%) | 155 (9.2%) |
| Total | 1,619 (100.0%) | 1,686 (100.0%) |
Housing Structure by Heating Type in Milford
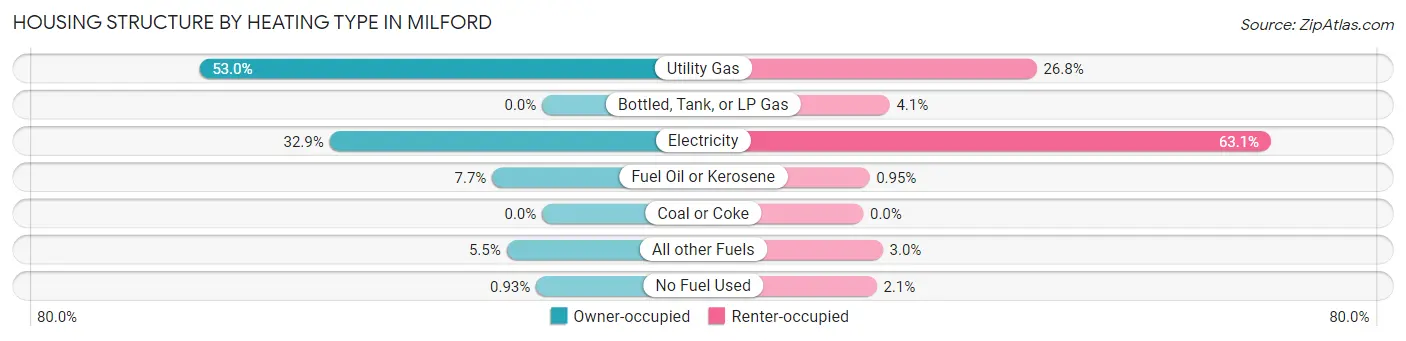
| Heating Type | Owner-occupied | Renter-occupied |
| Utility Gas | 858 (53.0%) | 452 (26.8%) |
| Bottled, Tank, or LP Gas | 0 (0.0%) | 69 (4.1%) |
| Electricity | 532 (32.9%) | 1,063 (63.0%) |
| Fuel Oil or Kerosene | 125 (7.7%) | 16 (0.9%) |
| Coal or Coke | 0 (0.0%) | 0 (0.0%) |
| All other Fuels | 89 (5.5%) | 51 (3.0%) |
| No Fuel Used | 15 (0.9%) | 35 (2.1%) |
| Total | 1,619 (100.0%) | 1,686 (100.0%) |
Household Vehicle Usage in Milford
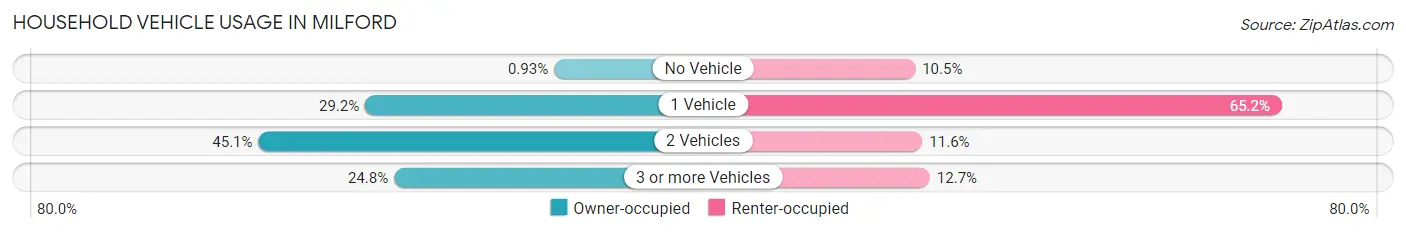
| Vehicles per Household | Owner-occupied | Renter-occupied |
| No Vehicle | 15 (0.9%) | 177 (10.5%) |
| 1 Vehicle | 472 (29.1%) | 1,100 (65.2%) |
| 2 Vehicles | 730 (45.1%) | 195 (11.6%) |
| 3 or more Vehicles | 402 (24.8%) | 214 (12.7%) |
| Total | 1,619 (100.0%) | 1,686 (100.0%) |
Real Estate & Mortgages in Milford
Real Estate and Mortgage Overview in Milford
| Characteristic | Without Mortgage | With Mortgage |
| Housing Units | 650 | 969 |
| Median Property Value | $216,900 | $201,900 |
| Median Household Income | $78,185 | $274 |
| Monthly Housing Costs | $615 | $40 |
| Real Estate Taxes | $2,821 | $41 |
Property Value by Mortgage Status in Milford
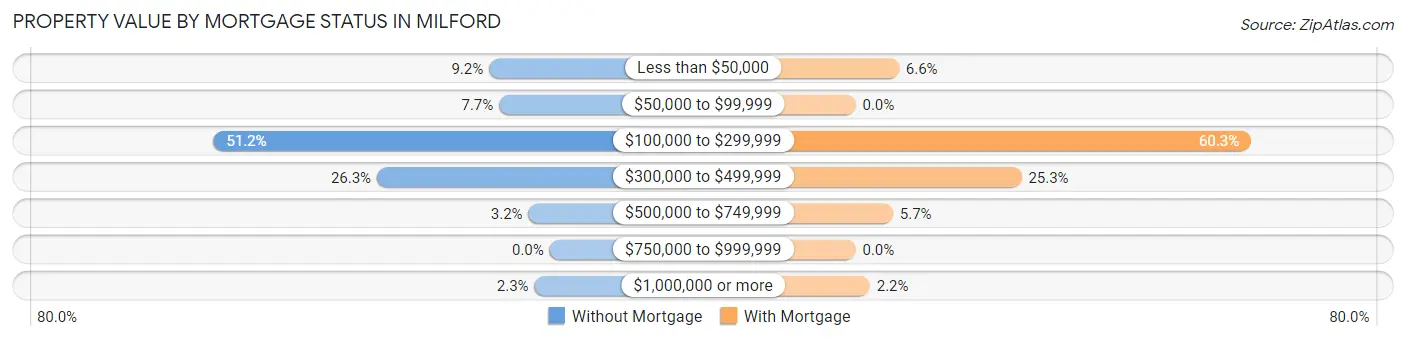
| Property Value | Without Mortgage | With Mortgage |
| Less than $50,000 | 60 (9.2%) | 64 (6.6%) |
| $50,000 to $99,999 | 50 (7.7%) | 0 (0.0%) |
| $100,000 to $299,999 | 333 (51.2%) | 584 (60.3%) |
| $300,000 to $499,999 | 171 (26.3%) | 245 (25.3%) |
| $500,000 to $749,999 | 21 (3.2%) | 55 (5.7%) |
| $750,000 to $999,999 | 0 (0.0%) | 0 (0.0%) |
| $1,000,000 or more | 15 (2.3%) | 21 (2.2%) |
| Total | 650 (100.0%) | 969 (100.0%) |
Household Income by Mortgage Status in Milford
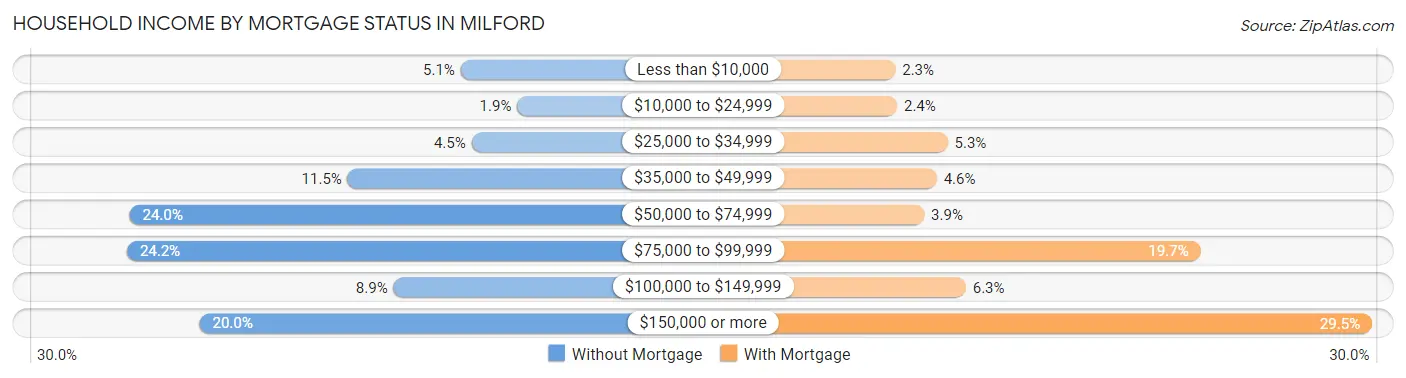
| Household Income | Without Mortgage | With Mortgage |
| Less than $10,000 | 33 (5.1%) | 22 (2.3%) |
| $10,000 to $24,999 | 12 (1.8%) | 23 (2.4%) |
| $25,000 to $34,999 | 29 (4.5%) | 51 (5.3%) |
| $35,000 to $49,999 | 75 (11.5%) | 45 (4.6%) |
| $50,000 to $74,999 | 156 (24.0%) | 38 (3.9%) |
| $75,000 to $99,999 | 157 (24.1%) | 191 (19.7%) |
| $100,000 to $149,999 | 58 (8.9%) | 61 (6.3%) |
| $150,000 or more | 130 (20.0%) | 286 (29.5%) |
| Total | 650 (100.0%) | 969 (100.0%) |
Property Value to Household Income Ratio in Milford
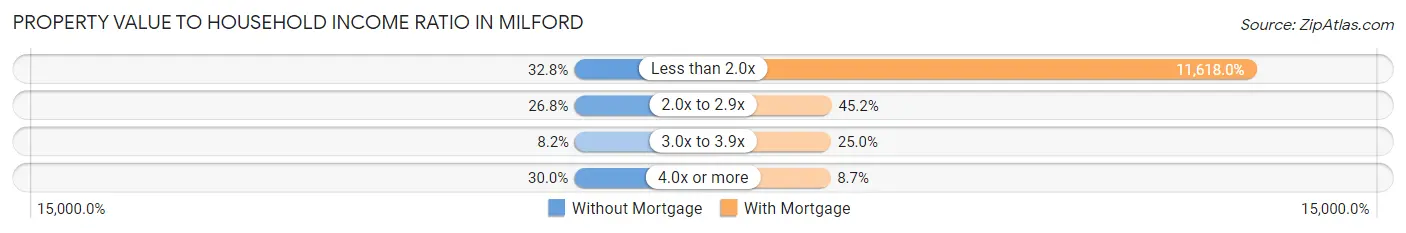
| Value-to-Income Ratio | Without Mortgage | With Mortgage |
| Less than 2.0x | 213 (32.8%) | 112,578 (11,618.0%) |
| 2.0x to 2.9x | 174 (26.8%) | 438 (45.2%) |
| 3.0x to 3.9x | 53 (8.2%) | 242 (25.0%) |
| 4.0x or more | 195 (30.0%) | 84 (8.7%) |
| Total | 650 (100.0%) | 969 (100.0%) |
Real Estate Taxes by Mortgage Status in Milford
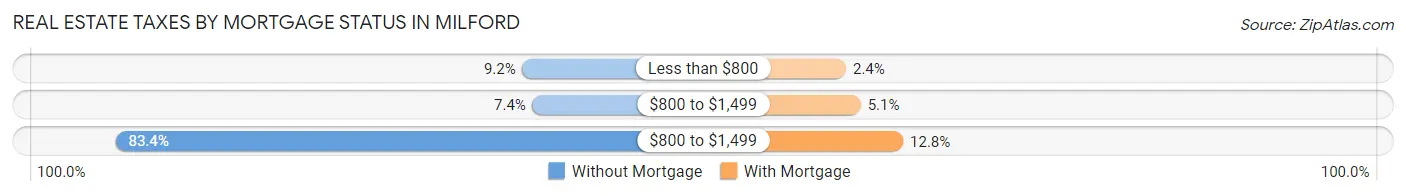
| Property Taxes | Without Mortgage | With Mortgage |
| Less than $800 | 60 (9.2%) | 23 (2.4%) |
| $800 to $1,499 | 48 (7.4%) | 49 (5.1%) |
| $800 to $1,499 | 542 (83.4%) | 124 (12.8%) |
| Total | 650 (100.0%) | 969 (100.0%) |
Health & Disability in Milford
Health Insurance Coverage by Age in Milford
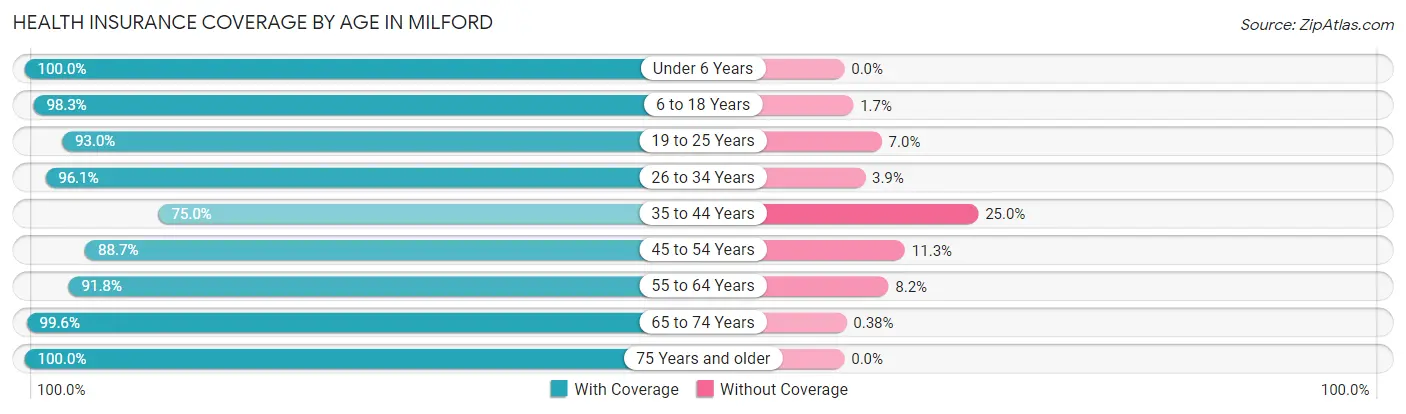
| Age Bracket | With Coverage | Without Coverage |
| Under 6 Years | 425 (100.0%) | 0 (0.0%) |
| 6 to 18 Years | 653 (98.3%) | 11 (1.7%) |
| 19 to 25 Years | 721 (93.0%) | 54 (7.0%) |
| 26 to 34 Years | 547 (96.1%) | 22 (3.9%) |
| 35 to 44 Years | 610 (75.0%) | 203 (25.0%) |
| 45 to 54 Years | 636 (88.7%) | 81 (11.3%) |
| 55 to 64 Years | 760 (91.8%) | 68 (8.2%) |
| 65 to 74 Years | 1,043 (99.6%) | 4 (0.4%) |
| 75 Years and older | 627 (100.0%) | 0 (0.0%) |
| Total | 6,022 (93.1%) | 443 (6.9%) |
Health Insurance Coverage by Citizenship Status in Milford
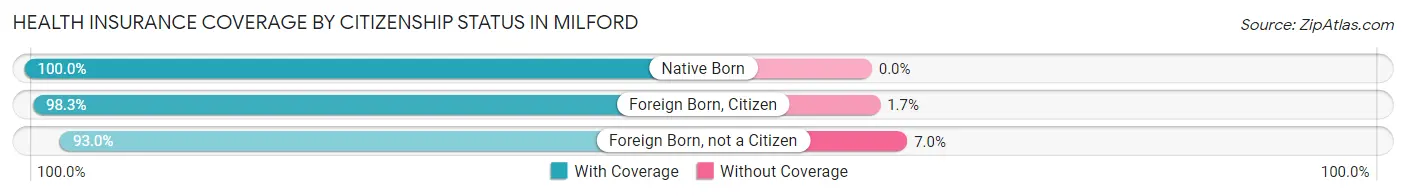
| Citizenship Status | With Coverage | Without Coverage |
| Native Born | 425 (100.0%) | 0 (0.0%) |
| Foreign Born, Citizen | 653 (98.3%) | 11 (1.7%) |
| Foreign Born, not a Citizen | 721 (93.0%) | 54 (7.0%) |
Health Insurance Coverage by Household Income in Milford
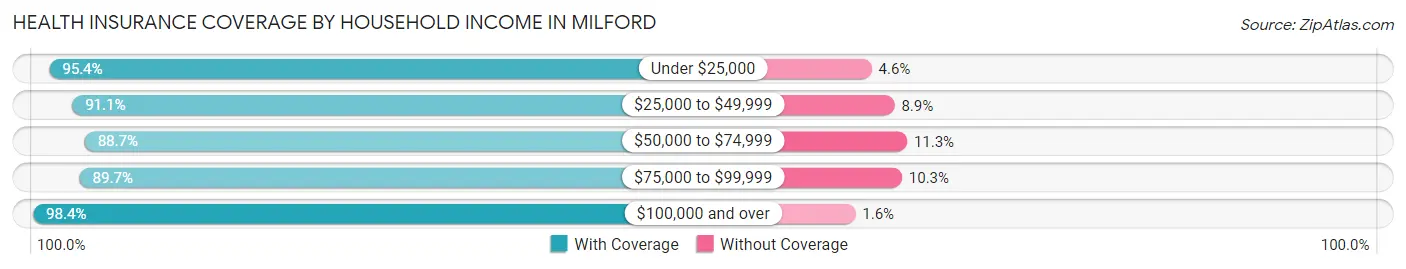
| Household Income | With Coverage | Without Coverage |
| Under $25,000 | 617 (95.4%) | 30 (4.6%) |
| $25,000 to $49,999 | 1,010 (91.1%) | 99 (8.9%) |
| $50,000 to $74,999 | 1,094 (88.7%) | 139 (11.3%) |
| $75,000 to $99,999 | 912 (89.7%) | 105 (10.3%) |
| $100,000 and over | 2,322 (98.4%) | 38 (1.6%) |
Public vs Private Health Insurance Coverage by Age in Milford
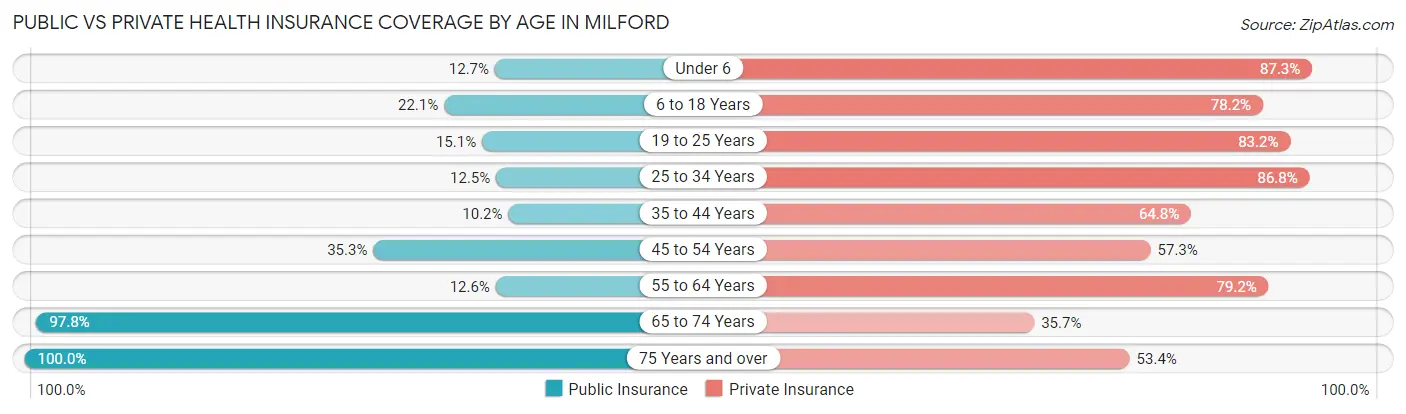
| Age Bracket | Public Insurance | Private Insurance |
| Under 6 | 54 (12.7%) | 371 (87.3%) |
| 6 to 18 Years | 147 (22.1%) | 519 (78.2%) |
| 19 to 25 Years | 117 (15.1%) | 645 (83.2%) |
| 25 to 34 Years | 71 (12.5%) | 494 (86.8%) |
| 35 to 44 Years | 83 (10.2%) | 527 (64.8%) |
| 45 to 54 Years | 253 (35.3%) | 411 (57.3%) |
| 55 to 64 Years | 104 (12.6%) | 656 (79.2%) |
| 65 to 74 Years | 1,024 (97.8%) | 374 (35.7%) |
| 75 Years and over | 627 (100.0%) | 335 (53.4%) |
| Total | 2,480 (38.4%) | 4,332 (67.0%) |
Disability Status by Sex by Age in Milford
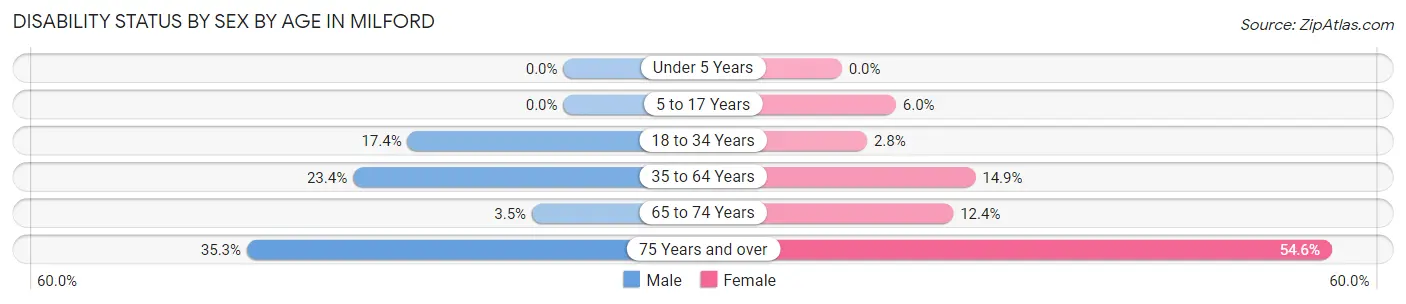
| Age Bracket | Male | Female |
| Under 5 Years | 0 (0.0%) | 0 (0.0%) |
| 5 to 17 Years | 0 (0.0%) | 15 (6.0%) |
| 18 to 34 Years | 130 (17.4%) | 18 (2.8%) |
| 35 to 64 Years | 242 (23.4%) | 197 (14.9%) |
| 65 to 74 Years | 18 (3.5%) | 66 (12.4%) |
| 75 Years and over | 86 (35.2%) | 209 (54.6%) |
Disability Class by Sex by Age in Milford
Disability Class: Hearing Difficulty
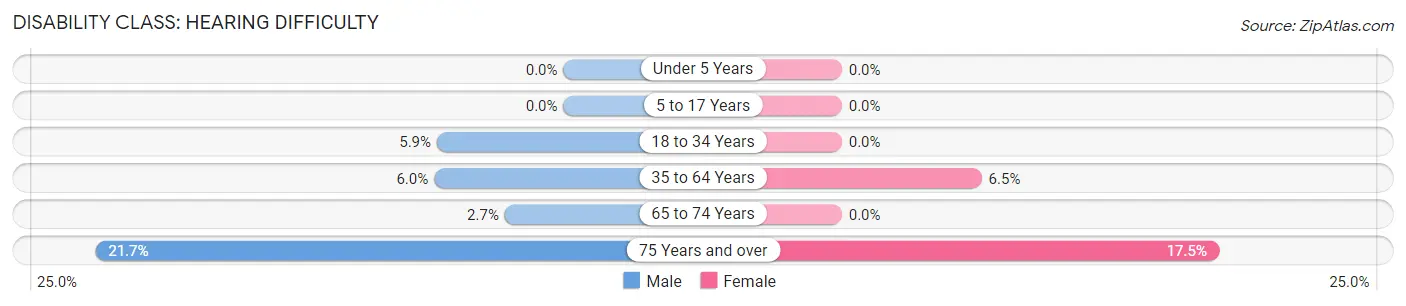
| Age Bracket | Male | Female |
| Under 5 Years | 0 (0.0%) | 0 (0.0%) |
| 5 to 17 Years | 0 (0.0%) | 0 (0.0%) |
| 18 to 34 Years | 44 (5.9%) | 0 (0.0%) |
| 35 to 64 Years | 62 (6.0%) | 86 (6.5%) |
| 65 to 74 Years | 14 (2.7%) | 0 (0.0%) |
| 75 Years and over | 53 (21.7%) | 67 (17.5%) |
Disability Class: Vision Difficulty
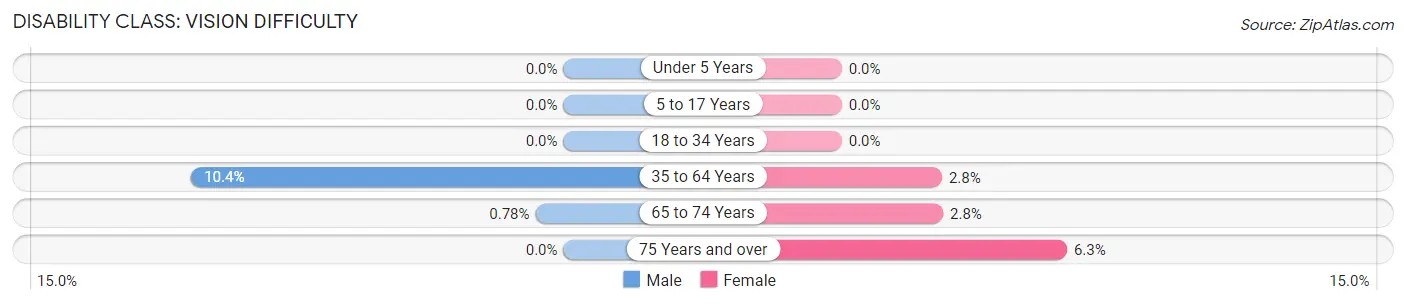
| Age Bracket | Male | Female |
| Under 5 Years | 0 (0.0%) | 0 (0.0%) |
| 5 to 17 Years | 0 (0.0%) | 0 (0.0%) |
| 18 to 34 Years | 0 (0.0%) | 0 (0.0%) |
| 35 to 64 Years | 107 (10.4%) | 37 (2.8%) |
| 65 to 74 Years | 4 (0.8%) | 15 (2.8%) |
| 75 Years and over | 0 (0.0%) | 24 (6.3%) |
Disability Class: Cognitive Difficulty
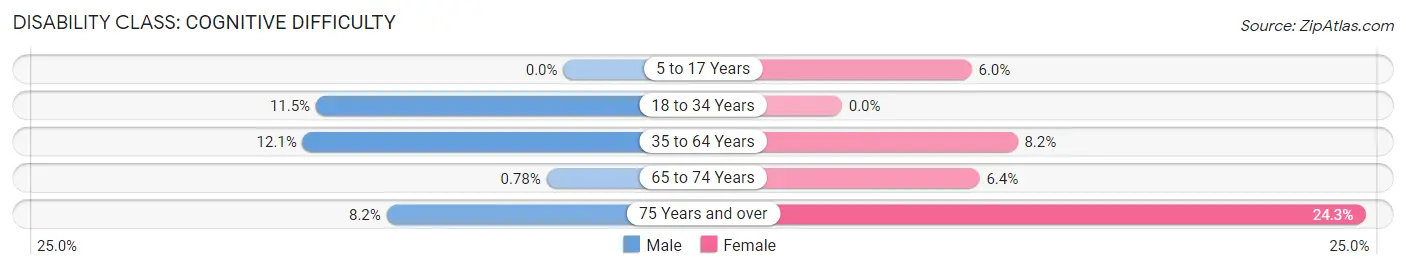
| Age Bracket | Male | Female |
| 5 to 17 Years | 0 (0.0%) | 15 (6.0%) |
| 18 to 34 Years | 86 (11.5%) | 0 (0.0%) |
| 35 to 64 Years | 125 (12.1%) | 108 (8.2%) |
| 65 to 74 Years | 4 (0.8%) | 34 (6.4%) |
| 75 Years and over | 20 (8.2%) | 93 (24.3%) |
Disability Class: Ambulatory Difficulty
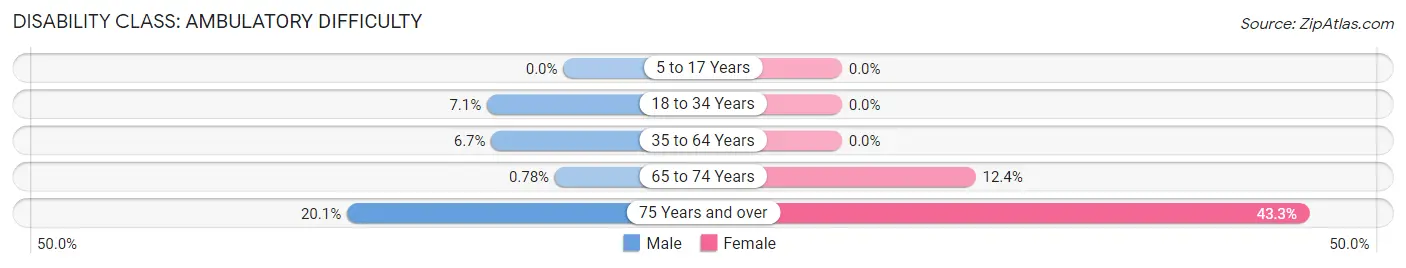
| Age Bracket | Male | Female |
| 5 to 17 Years | 0 (0.0%) | 0 (0.0%) |
| 18 to 34 Years | 53 (7.1%) | 0 (0.0%) |
| 35 to 64 Years | 69 (6.7%) | 0 (0.0%) |
| 65 to 74 Years | 4 (0.8%) | 66 (12.4%) |
| 75 Years and over | 49 (20.1%) | 166 (43.3%) |
Disability Class: Self-Care Difficulty
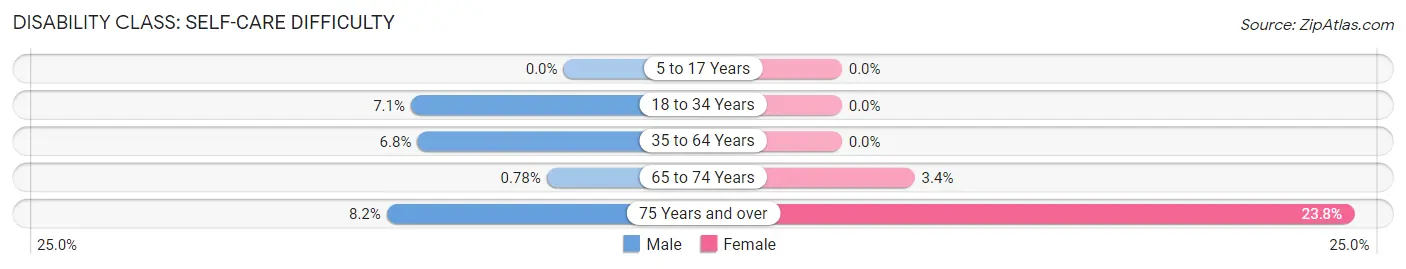
| Age Bracket | Male | Female |
| 5 to 17 Years | 0 (0.0%) | 0 (0.0%) |
| 18 to 34 Years | 53 (7.1%) | 0 (0.0%) |
| 35 to 64 Years | 70 (6.8%) | 0 (0.0%) |
| 65 to 74 Years | 4 (0.8%) | 18 (3.4%) |
| 75 Years and over | 20 (8.2%) | 91 (23.8%) |
Technology Access in Milford
Computing Device Access in Milford
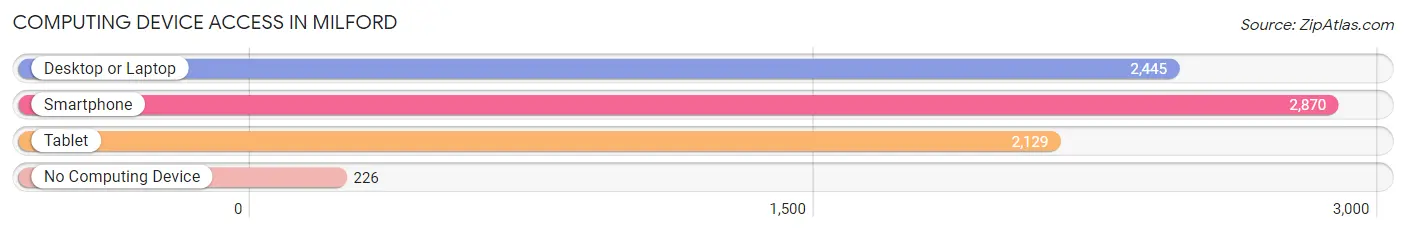
| Device Type | # Households | % Households |
| Desktop or Laptop | 2,445 | 74.0% |
| Smartphone | 2,870 | 86.8% |
| Tablet | 2,129 | 64.4% |
| No Computing Device | 226 | 6.8% |
| Total | 3,305 | 100.0% |
Internet Access in Milford
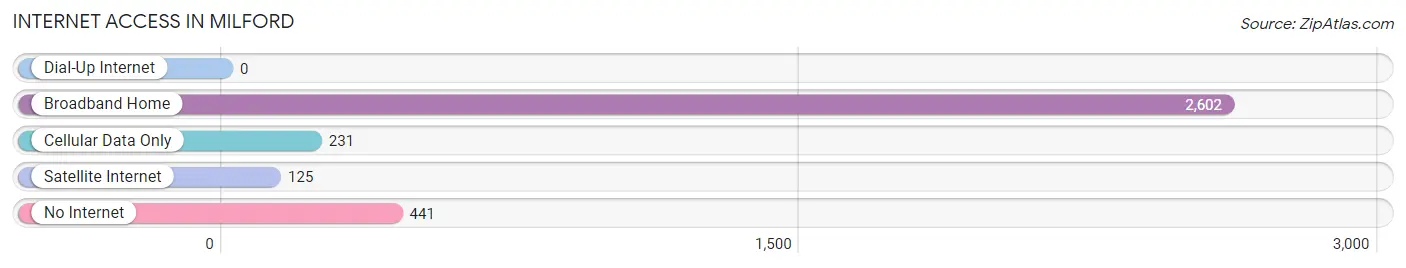
| Internet Type | # Households | % Households |
| Dial-Up Internet | 0 | 0.0% |
| Broadband Home | 2,602 | 78.7% |
| Cellular Data Only | 231 | 7.0% |
| Satellite Internet | 125 | 3.8% |
| No Internet | 441 | 13.3% |
| Total | 3,305 | 100.0% |
Milford Summary
Milford, Ohio is a small city located in Clermont County, Ohio, United States. It is situated along the Little Miami River, approximately 20 miles east of Cincinnati. The city has a population of 6,709 as of the 2010 census.
History
The area that is now Milford was first settled in 1796 by a group of Quakers from North Carolina. The settlement was originally known as “The Forks of the Little Miami”, due to its location at the confluence of the Little Miami and Great Miami Rivers. In 1803, the settlement was renamed “Milford” after the town of Milford, Massachusetts.
In 1817, Milford was incorporated as a village. The village grew rapidly, and by 1835 it had a population of over 500. In 1867, Milford was incorporated as a city.
Geography
Milford is located at 39°10′N 84°17′W (39.17, -84.28). According to the United States Census Bureau, the city has a total area of 4.2 square miles (10.8 km2), all land.
Economy
Milford’s economy is largely based on retail and services. The city is home to several large retail stores, including Walmart, Kroger, and Meijer. Milford also has a number of restaurants, bars, and other businesses.
The city is also home to several manufacturing companies, including Milford Industries, a manufacturer of automotive parts, and Milford Tool & Die, a manufacturer of industrial tools.
Demographics
As of the 2010 census, there were 6,709 people, 2,717 households, and 1,817 families residing in the city. The population density was 1,611.2 people per square mile (619.7/km2). There were 2,945 housing units at an average density of 703.2 per square mile (271.3/km2). The racial makeup of the city was 94.2% White, 1.7% African American, 0.2% Native American, 1.2% Asian, 0.1% Pacific Islander, 0.9% from other races, and 1.7% from two or more races. Hispanic or Latino of any race were 2.3% of the population.
There were 2,717 households, out of which 32.2% had children under the age of 18 living with them, 51.2% were married couples living together, 11.7% had a female householder with no husband present, and 32.7% were non-families. 27.2% of all households were made up of individuals, and 9.2% had someone living alone who was 65 years of age or older. The average household size was 2.45 and the average family size was 2.98.
In the city, the population was spread out, with 25.2% under the age of 18, 7.2% from 18 to 24, 30.2% from 25 to 44, 24.2% from 45 to 64, and 13.2% who were 65 years of age or older. The median age was 37 years. For every 100 females, there were 93.2 males. For every 100 females age 18 and over, there were 90.2 males.
The median income for a household in the city was $50,945, and the median income for a family was $60,945. Males had a median income of $41,945 versus $30,945 for females. The per capita income for the city was $24,945. About 4.2% of families and 5.2% of the population were below the poverty line, including 6.2% of those under age 18 and 5.2% of those age 65 or over.
Common Questions
What is Per Capita Income in Milford?
Per Capita income in Milford is $46,225.
What is the Median Family Income in Milford?
Median Family Income in Milford is $98,156.
What is the Median Household income in Milford?
Median Household Income in Milford is $69,141.
What is Income or Wage Gap in Milford?
Income or Wage Gap in Milford is 36.3%.
Women in Milford earn 63.7 cents for every dollar earned by a man.
What is Inequality or Gini Index in Milford?
Inequality or Gini Index in Milford is 0.45.
What is the Total Population of Milford?
Total Population of Milford is 6,556.
What is the Total Male Population of Milford?
Total Male Population of Milford is 3,196.
What is the Total Female Population of Milford?
Total Female Population of Milford is 3,360.
What is the Ratio of Males per 100 Females in Milford?
There are 95.12 Males per 100 Females in Milford.
What is the Ratio of Females per 100 Males in Milford?
There are 105.13 Females per 100 Males in Milford.
What is the Median Population Age in Milford?
Median Population Age in Milford is 45.2 Years.
What is the Average Family Size in Milford
Average Family Size in Milford is 2.7 People.
What is the Average Household Size in Milford
Average Household Size in Milford is 1.9 People.
How Large is the Labor Force in Milford?
There are 3,638 People in the Labor Forcein in Milford.
What is the Percentage of People in the Labor Force in Milford?
64.9% of People are in the Labor Force in Milford.
What is the Unemployment Rate in Milford?
Unemployment Rate in Milford is 4.7%.