Lorain, OH Map & Demographics
Lorain Map
Lorain Overview
$25,637
PER CAPITA INCOME
$60,457
AVG FAMILY INCOME
$46,562
AVG HOUSEHOLD INCOME
28.9%
WAGE / INCOME GAP [ % ]
71.1¢/ $1
WAGE / INCOME GAP [ $ ]
$11,769
FAMILY INCOME DEFICIT
0.47
INEQUALITY / GINI INDEX
65,138
TOTAL POPULATION
31,755
MALE POPULATION
33,383
FEMALE POPULATION
95.12
MALES / 100 FEMALES
105.13
FEMALES / 100 MALES
38.5
MEDIAN AGE
3.2
AVG FAMILY SIZE
2.4
AVG HOUSEHOLD SIZE
28,872
LABOR FORCE [ PEOPLE ]
56.8%
PERCENT IN LABOR FORCE
6.2%
UNEMPLOYMENT RATE
Lorain Area Codes
Income in Lorain
Income Overview in Lorain
Per Capita Income in Lorain is $25,637, while median incomes of families and households are $60,457 and $46,562 respectively.
| Characteristic | Number | Measure |
| Per Capita Income | 65,138 | $25,637 |
| Median Family Income | 15,084 | $60,457 |
| Mean Family Income | 15,084 | $73,193 |
| Median Household Income | 26,876 | $46,562 |
| Mean Household Income | 26,876 | $60,021 |
| Income Deficit | 15,084 | $11,769 |
| Wage / Income Gap (%) | 65,138 | 28.90% |
| Wage / Income Gap ($) | 65,138 | 71.10¢ per $1 |
| Gini / Inequality Index | 65,138 | 0.47 |
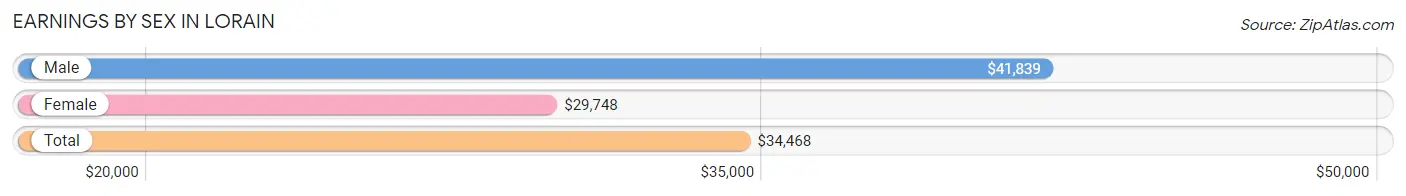
Earnings by Sex in Lorain
Average Earnings in Lorain are $34,468, $41,839 for men and $29,748 for women, a difference of 28.9%.
| Sex | Number | Average Earnings |
| Male | 14,391 (48.8%) | $41,839 |
| Female | 15,122 (51.2%) | $29,748 |
| Total | 29,513 (100.0%) | $34,468 |
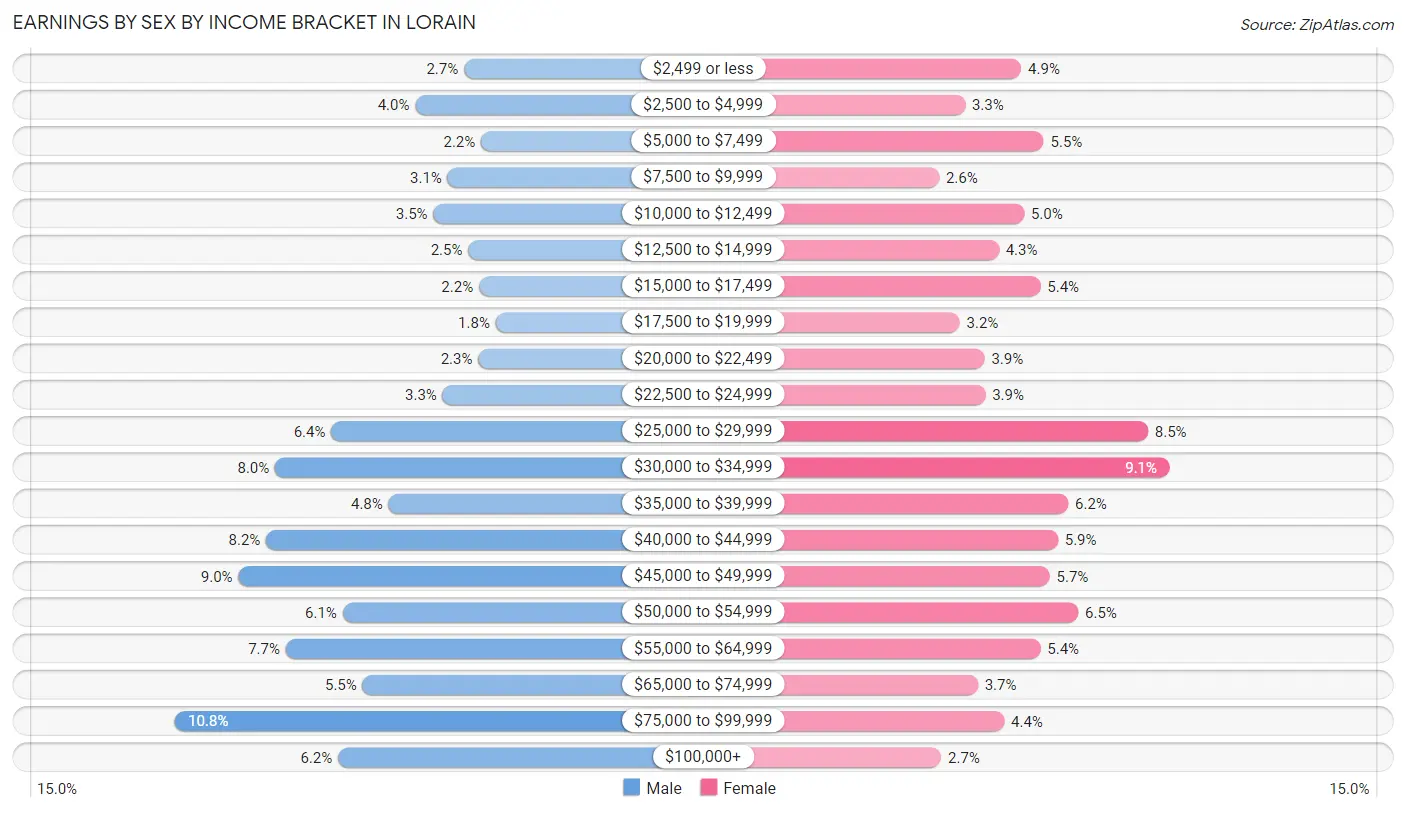
Earnings by Sex by Income Bracket in Lorain
The most common earnings brackets in Lorain are $75,000 to $99,999 for men (1,550 | 10.8%) and $30,000 to $34,999 for women (1,368 | 9.0%).
| Income | Male | Female |
| $2,499 or less | 381 (2.6%) | 741 (4.9%) |
| $2,500 to $4,999 | 579 (4.0%) | 502 (3.3%) |
| $5,000 to $7,499 | 313 (2.2%) | 836 (5.5%) |
| $7,500 to $9,999 | 448 (3.1%) | 391 (2.6%) |
| $10,000 to $12,499 | 505 (3.5%) | 753 (5.0%) |
| $12,500 to $14,999 | 364 (2.5%) | 646 (4.3%) |
| $15,000 to $17,499 | 321 (2.2%) | 822 (5.4%) |
| $17,500 to $19,999 | 254 (1.8%) | 479 (3.2%) |
| $20,000 to $22,499 | 324 (2.2%) | 585 (3.9%) |
| $22,500 to $24,999 | 468 (3.3%) | 588 (3.9%) |
| $25,000 to $29,999 | 918 (6.4%) | 1,280 (8.5%) |
| $30,000 to $34,999 | 1,146 (8.0%) | 1,368 (9.0%) |
| $35,000 to $39,999 | 686 (4.8%) | 941 (6.2%) |
| $40,000 to $44,999 | 1,182 (8.2%) | 896 (5.9%) |
| $45,000 to $49,999 | 1,294 (9.0%) | 862 (5.7%) |
| $50,000 to $54,999 | 872 (6.1%) | 983 (6.5%) |
| $55,000 to $64,999 | 1,103 (7.7%) | 822 (5.4%) |
| $65,000 to $74,999 | 792 (5.5%) | 557 (3.7%) |
| $75,000 to $99,999 | 1,550 (10.8%) | 669 (4.4%) |
| $100,000+ | 891 (6.2%) | 401 (2.6%) |
| Total | 14,391 (100.0%) | 15,122 (100.0%) |
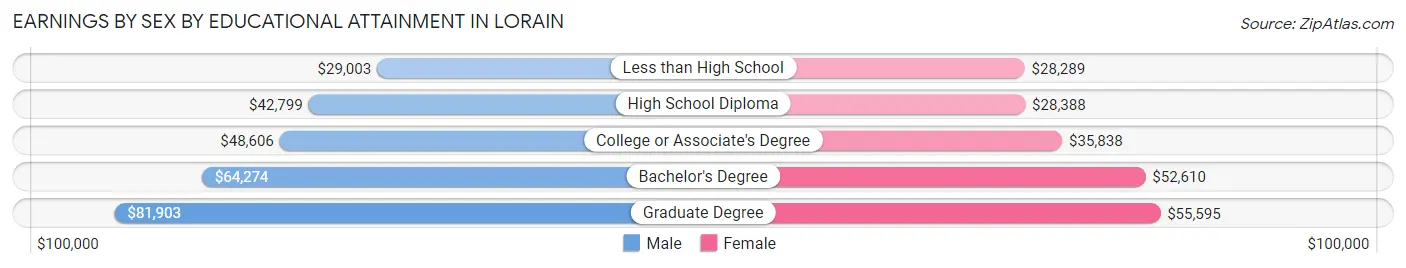
Earnings by Sex by Educational Attainment in Lorain
Average earnings in Lorain are $45,332 for men and $33,913 for women, a difference of 25.2%. Men with an educational attainment of graduate degree enjoy the highest average annual earnings of $81,903, while those with less than high school education earn the least with $29,003. Women with an educational attainment of graduate degree earn the most with the average annual earnings of $55,595, while those with less than high school education have the smallest earnings of $28,289.
| Educational Attainment | Male Income | Female Income |
| Less than High School | $29,003 | $28,289 |
| High School Diploma | $42,799 | $28,388 |
| College or Associate's Degree | $48,606 | $35,838 |
| Bachelor's Degree | $64,274 | $52,610 |
| Graduate Degree | $81,903 | $55,595 |
| Total | $45,332 | $33,913 |
Family Income in Lorain
Family Income Brackets in Lorain
According to the Lorain family income data, there are 2,941 families falling into the $50,000 to $74,999 income range, which is the most common income bracket and makes up 19.5% of all families. Conversely, the $200,000+ income bracket is the least frequent group with only 317 families (2.1%) belonging to this category.
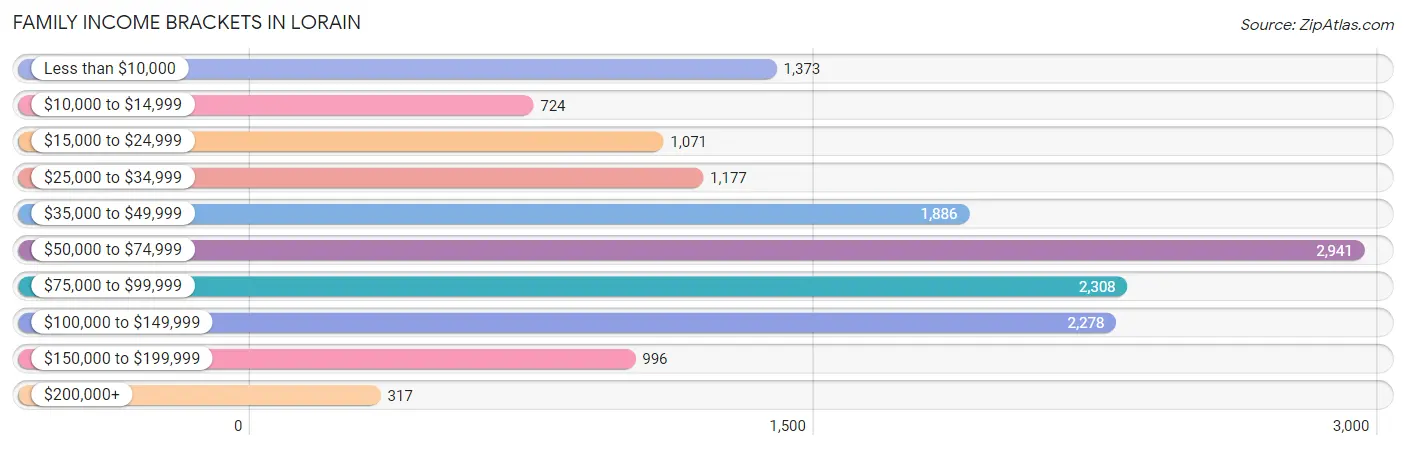
| Income Bracket | # Families | % Families |
| Less than $10,000 | 1,373 | 9.1% |
| $10,000 to $14,999 | 724 | 4.8% |
| $15,000 to $24,999 | 1,071 | 7.1% |
| $25,000 to $34,999 | 1,177 | 7.8% |
| $35,000 to $49,999 | 1,886 | 12.5% |
| $50,000 to $74,999 | 2,941 | 19.5% |
| $75,000 to $99,999 | 2,308 | 15.3% |
| $100,000 to $149,999 | 2,278 | 15.1% |
| $150,000 to $199,999 | 996 | 6.6% |
| $200,000+ | 317 | 2.1% |
Family Income by Famaliy Size in Lorain
4-person families (2,237 | 14.8%) account for the highest median family income in Lorain with $65,508 per family, while 2-person families (6,886 | 45.7%) have the highest median income of $29,789 per family member.
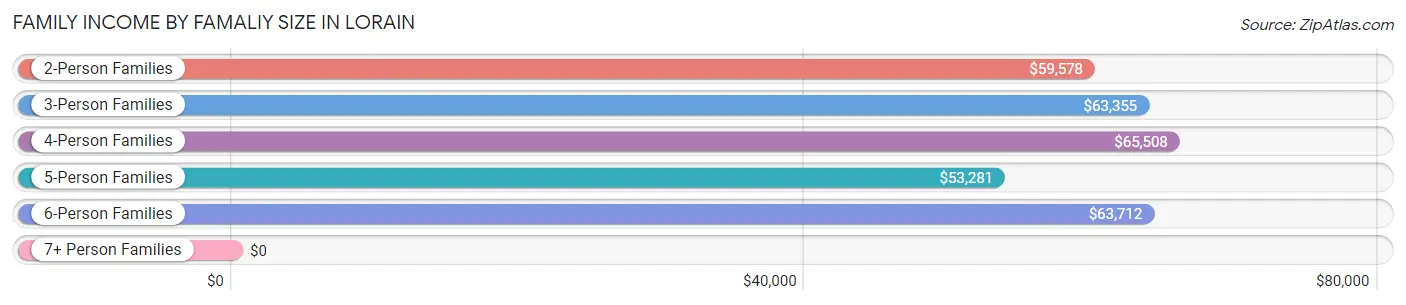
| Income Bracket | # Families | Median Income |
| 2-Person Families | 6,886 (45.7%) | $59,578 |
| 3-Person Families | 4,012 (26.6%) | $63,355 |
| 4-Person Families | 2,237 (14.8%) | $65,508 |
| 5-Person Families | 1,326 (8.8%) | $53,281 |
| 6-Person Families | 406 (2.7%) | $63,712 |
| 7+ Person Families | 217 (1.4%) | $0 |
| Total | 15,084 (100.0%) | $60,457 |
Family Income by Number of Earners in Lorain
The median family income in Lorain is $60,457, with families comprising 3+ earners (1,148) having the highest median family income of $109,412, while families with no earners (3,370) have the lowest median family income of $26,008, accounting for 7.6% and 22.3% of families, respectively.
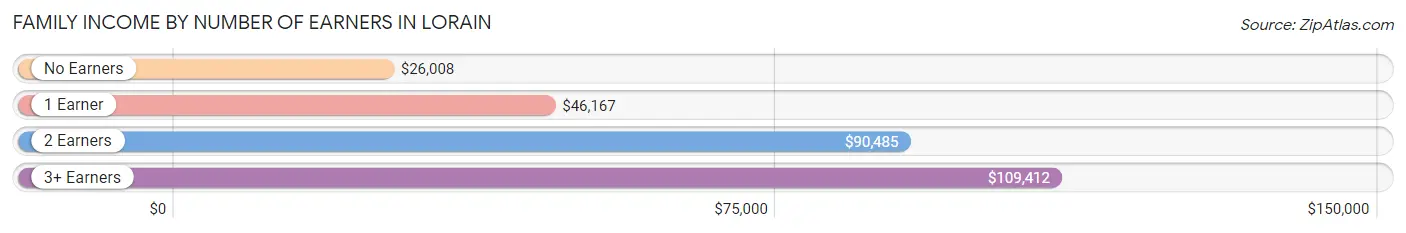
| Number of Earners | # Families | Median Income |
| No Earners | 3,370 (22.3%) | $26,008 |
| 1 Earner | 5,685 (37.7%) | $46,167 |
| 2 Earners | 4,881 (32.4%) | $90,485 |
| 3+ Earners | 1,148 (7.6%) | $109,412 |
| Total | 15,084 (100.0%) | $60,457 |
Household Income in Lorain
Household Income Brackets in Lorain
With 4,676 households falling in the category, the $50,000 to $74,999 income range is the most frequent in Lorain, accounting for 17.4% of all households. In contrast, only 376 households (1.4%) fall into the $200,000+ income bracket, making it the least populous group.
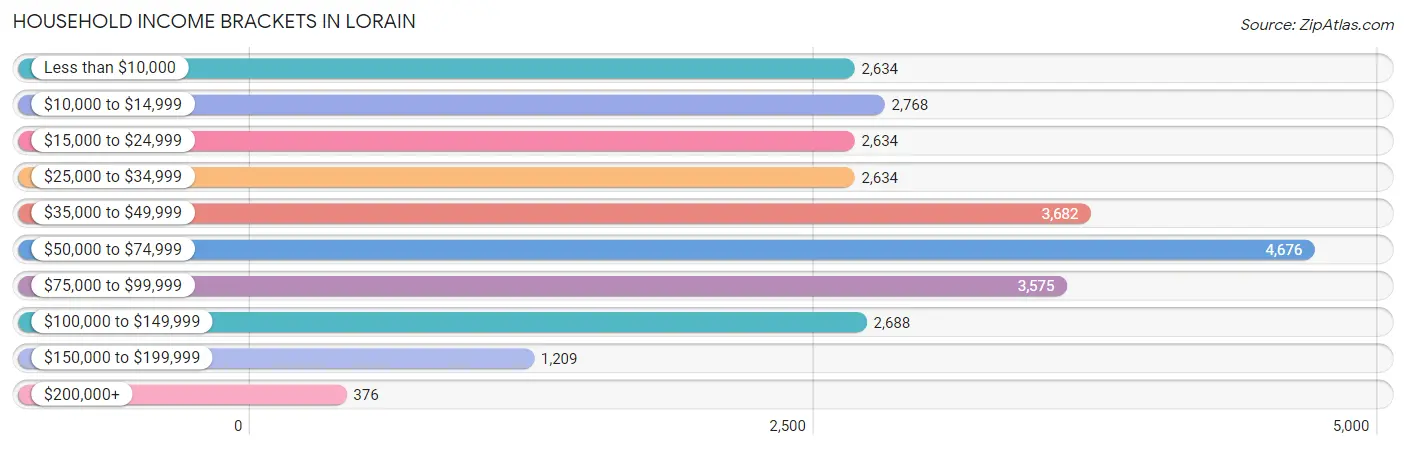
| Income Bracket | # Households | % Households |
| Less than $10,000 | 2,634 | 9.8% |
| $10,000 to $14,999 | 2,768 | 10.3% |
| $15,000 to $24,999 | 2,634 | 9.8% |
| $25,000 to $34,999 | 2,634 | 9.8% |
| $35,000 to $49,999 | 3,682 | 13.7% |
| $50,000 to $74,999 | 4,676 | 17.4% |
| $75,000 to $99,999 | 3,575 | 13.3% |
| $100,000 to $149,999 | 2,688 | 10.0% |
| $150,000 to $199,999 | 1,209 | 4.5% |
| $200,000+ | 376 | 1.4% |
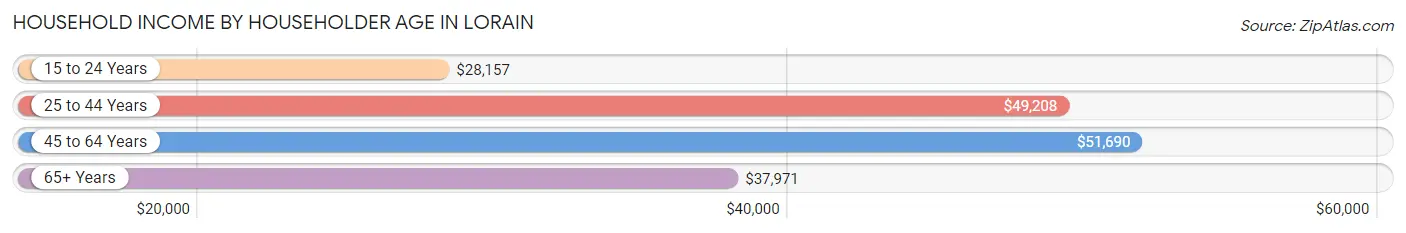
Household Income by Householder Age in Lorain
The median household income in Lorain is $46,562, with the highest median household income of $51,690 found in the 45 to 64 years age bracket for the primary householder. A total of 10,179 households (37.9%) fall into this category. Meanwhile, the 15 to 24 years age bracket for the primary householder has the lowest median household income of $28,157, with 1,251 households (4.6%) in this group.
| Income Bracket | # Households | Median Income |
| 15 to 24 Years | 1,251 (4.6%) | $28,157 |
| 25 to 44 Years | 8,437 (31.4%) | $49,208 |
| 45 to 64 Years | 10,179 (37.9%) | $51,690 |
| 65+ Years | 7,009 (26.1%) | $37,971 |
| Total | 26,876 (100.0%) | $46,562 |
Poverty in Lorain
Income Below Poverty by Sex and Age in Lorain
With 24.6% poverty level for males and 30.3% for females among the residents of Lorain, 5 year old males and under 5 year old females are the most vulnerable to poverty, with 367 males (64.3%) and 1,425 females (59.4%) in their respective age groups living below the poverty level.
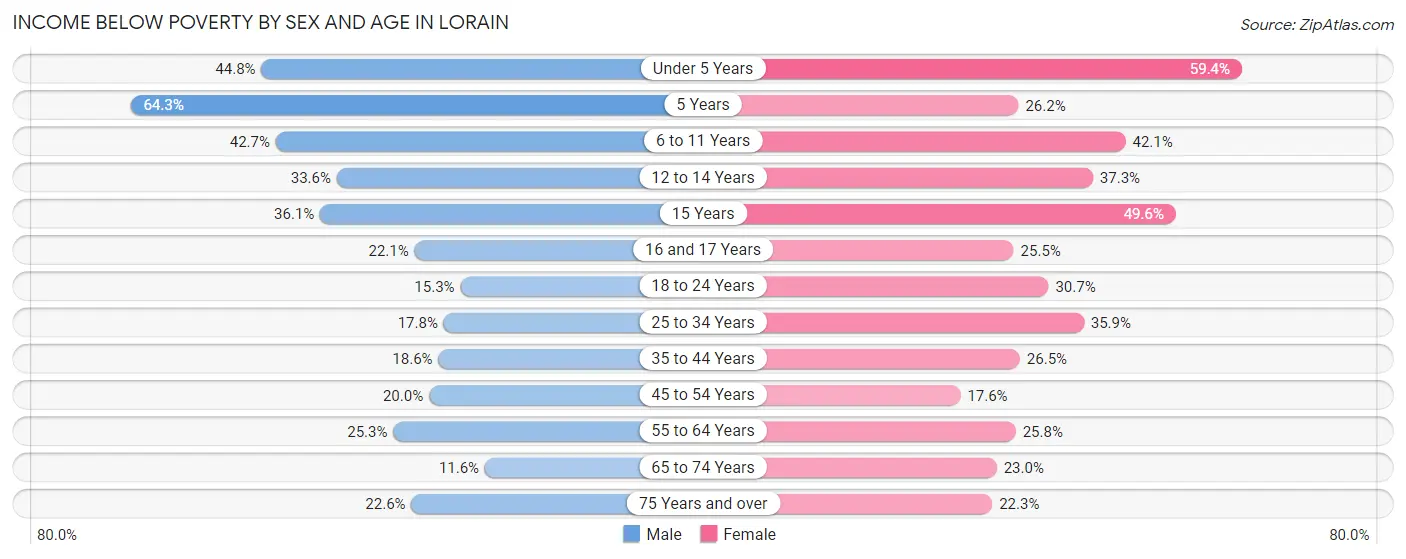
| Age Bracket | Male | Female |
| Under 5 Years | 1,064 (44.8%) | 1,425 (59.4%) |
| 5 Years | 367 (64.3%) | 95 (26.2%) |
| 6 to 11 Years | 1,020 (42.7%) | 1,009 (42.1%) |
| 12 to 14 Years | 512 (33.6%) | 295 (37.3%) |
| 15 Years | 217 (36.1%) | 178 (49.6%) |
| 16 and 17 Years | 183 (22.1%) | 222 (25.5%) |
| 18 to 24 Years | 400 (15.3%) | 953 (30.7%) |
| 25 to 34 Years | 730 (17.8%) | 1,454 (35.9%) |
| 35 to 44 Years | 689 (18.5%) | 1,101 (26.5%) |
| 45 to 54 Years | 733 (20.0%) | 672 (17.6%) |
| 55 to 64 Years | 1,051 (25.3%) | 1,240 (25.8%) |
| 65 to 74 Years | 358 (11.6%) | 721 (23.0%) |
| 75 Years and over | 402 (22.6%) | 574 (22.3%) |
| Total | 7,726 (24.6%) | 9,939 (30.3%) |
Income Above Poverty by Sex and Age in Lorain
According to the poverty statistics in Lorain, males aged 65 to 74 years and females aged 45 to 54 years are the age groups that are most secure financially, with 88.4% of males and 82.4% of females in these age groups living above the poverty line.
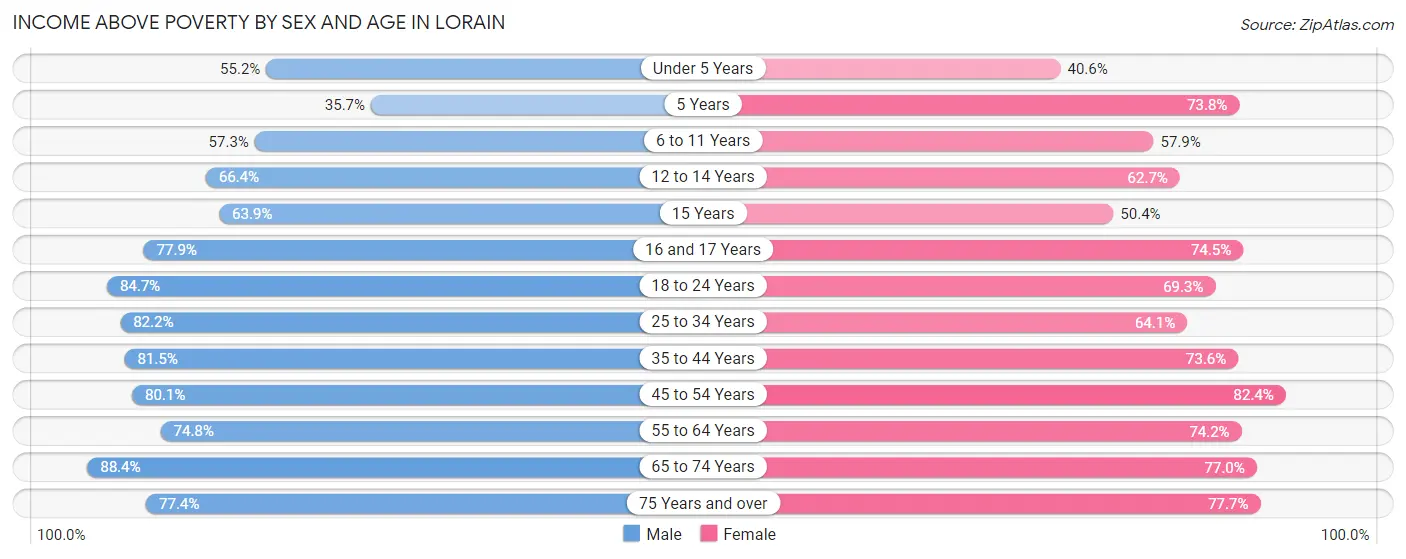
| Age Bracket | Male | Female |
| Under 5 Years | 1,309 (55.2%) | 974 (40.6%) |
| 5 Years | 204 (35.7%) | 267 (73.8%) |
| 6 to 11 Years | 1,369 (57.3%) | 1,386 (57.9%) |
| 12 to 14 Years | 1,010 (66.4%) | 496 (62.7%) |
| 15 Years | 384 (63.9%) | 181 (50.4%) |
| 16 and 17 Years | 645 (77.9%) | 648 (74.5%) |
| 18 to 24 Years | 2,216 (84.7%) | 2,152 (69.3%) |
| 25 to 34 Years | 3,381 (82.2%) | 2,593 (64.1%) |
| 35 to 44 Years | 3,025 (81.5%) | 3,061 (73.6%) |
| 45 to 54 Years | 2,941 (80.0%) | 3,142 (82.4%) |
| 55 to 64 Years | 3,112 (74.8%) | 3,560 (74.2%) |
| 65 to 74 Years | 2,718 (88.4%) | 2,412 (77.0%) |
| 75 Years and over | 1,380 (77.4%) | 1,995 (77.7%) |
| Total | 23,694 (75.4%) | 22,867 (69.7%) |
Income Below Poverty Among Married-Couple Families in Lorain
The poverty statistics for married-couple families in Lorain show that 7.9% or 669 of the total 8,438 families live below the poverty line. Families with 5 or more children have the highest poverty rate of 38.5%, comprising of 52 families. On the other hand, families with 1 or 2 children have the lowest poverty rate of 5.9%, which includes 134 families.
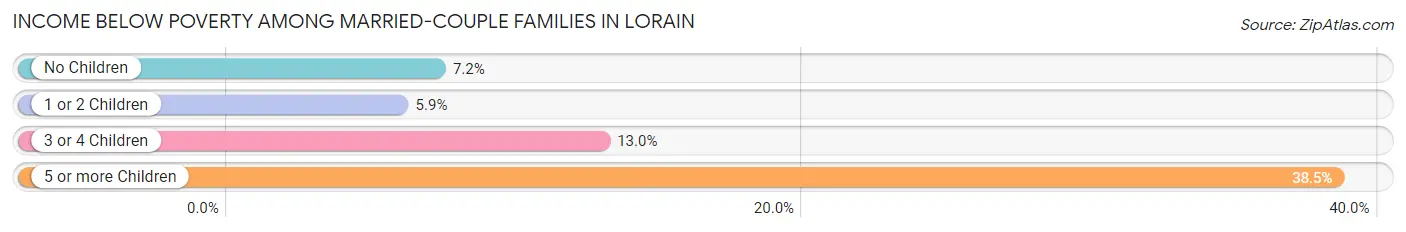
| Children | Above Poverty | Below Poverty |
| No Children | 4,880 (92.8%) | 381 (7.2%) |
| 1 or 2 Children | 2,121 (94.1%) | 134 (5.9%) |
| 3 or 4 Children | 685 (87.0%) | 102 (13.0%) |
| 5 or more Children | 83 (61.5%) | 52 (38.5%) |
| Total | 7,769 (92.1%) | 669 (7.9%) |
Income Below Poverty Among Single-Parent Households in Lorain
According to the poverty data in Lorain, 22.4% or 333 single-father households and 46.7% or 2,407 single-mother households are living below the poverty line. Among single-father households, those with 3 or 4 children have the highest poverty rate, with 80 households (72.1%) experiencing poverty. Likewise, among single-mother households, those with 5 or more children have the highest poverty rate, with 69 households (85.2%) falling below the poverty line.
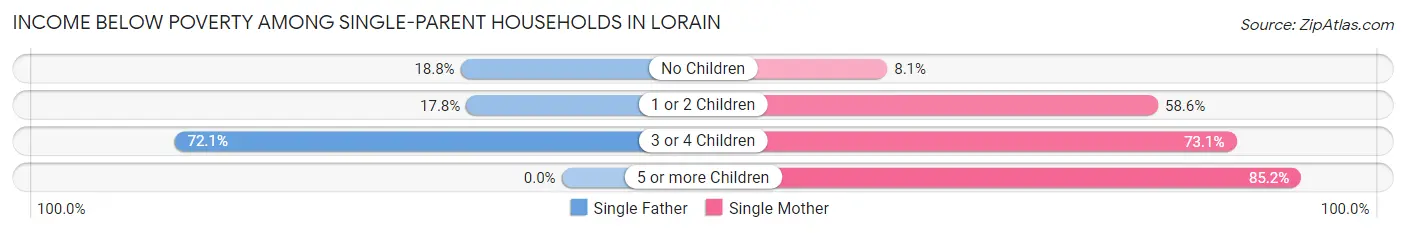
| Children | Single Father | Single Mother |
| No Children | 153 (18.8%) | 130 (8.1%) |
| 1 or 2 Children | 100 (17.8%) | 1,346 (58.6%) |
| 3 or 4 Children | 80 (72.1%) | 862 (73.1%) |
| 5 or more Children | 0 (0.0%) | 69 (85.2%) |
| Total | 333 (22.4%) | 2,407 (46.7%) |
Income Below Poverty Among Married-Couple vs Single-Parent Households in Lorain
The poverty data for Lorain shows that 669 of the married-couple family households (7.9%) and 2,740 of the single-parent households (41.2%) are living below the poverty level. Within the married-couple family households, those with 5 or more children have the highest poverty rate, with 52 households (38.5%) falling below the poverty line. Among the single-parent households, those with 5 or more children have the highest poverty rate, with 69 household (85.2%) living below poverty.
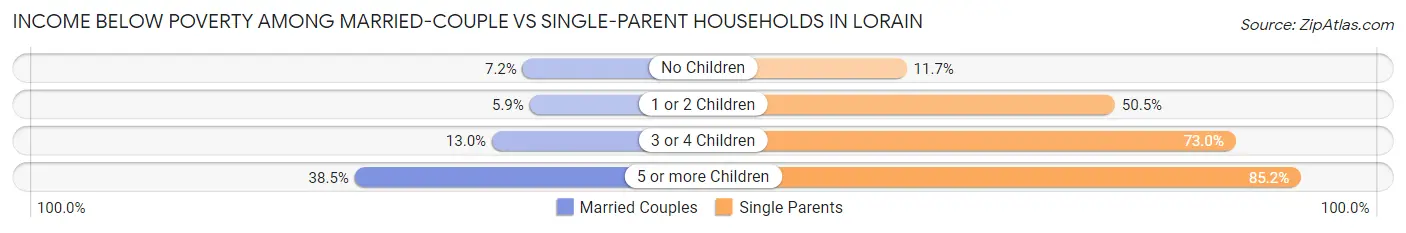
| Children | Married-Couple Families | Single-Parent Households |
| No Children | 381 (7.2%) | 283 (11.7%) |
| 1 or 2 Children | 134 (5.9%) | 1,446 (50.5%) |
| 3 or 4 Children | 102 (13.0%) | 942 (73.0%) |
| 5 or more Children | 52 (38.5%) | 69 (85.2%) |
| Total | 669 (7.9%) | 2,740 (41.2%) |
Race in Lorain
The most populous races in Lorain are White / Caucasian (40,695 | 62.5%), Hispanic or Latino (18,364 | 28.2%), and Black / African American (10,891 | 16.7%).
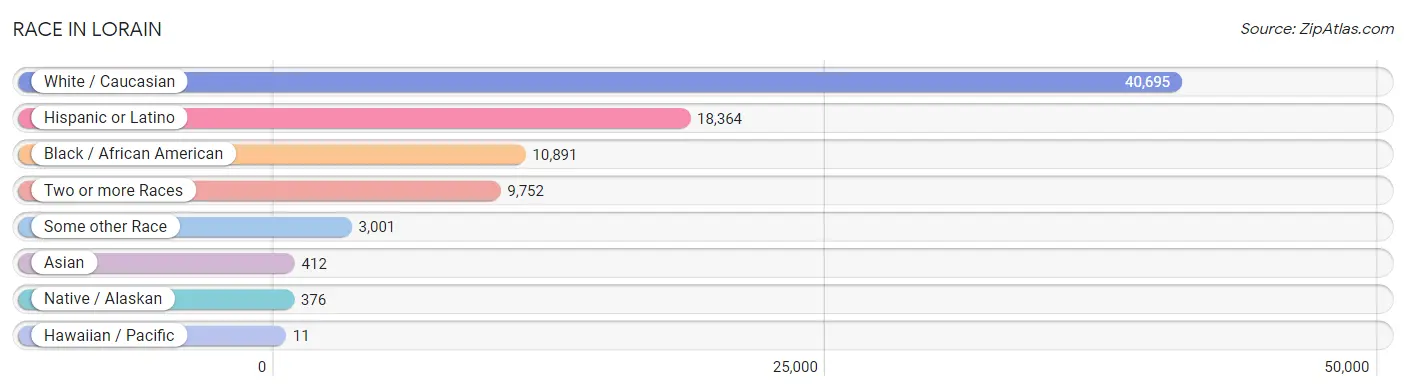
| Race | # Population | % Population |
| Asian | 412 | 0.6% |
| Black / African American | 10,891 | 16.7% |
| Hawaiian / Pacific | 11 | 0.0% |
| Hispanic or Latino | 18,364 | 28.2% |
| Native / Alaskan | 376 | 0.6% |
| White / Caucasian | 40,695 | 62.5% |
| Two or more Races | 9,752 | 15.0% |
| Some other Race | 3,001 | 4.6% |
| Total | 65,138 | 100.0% |
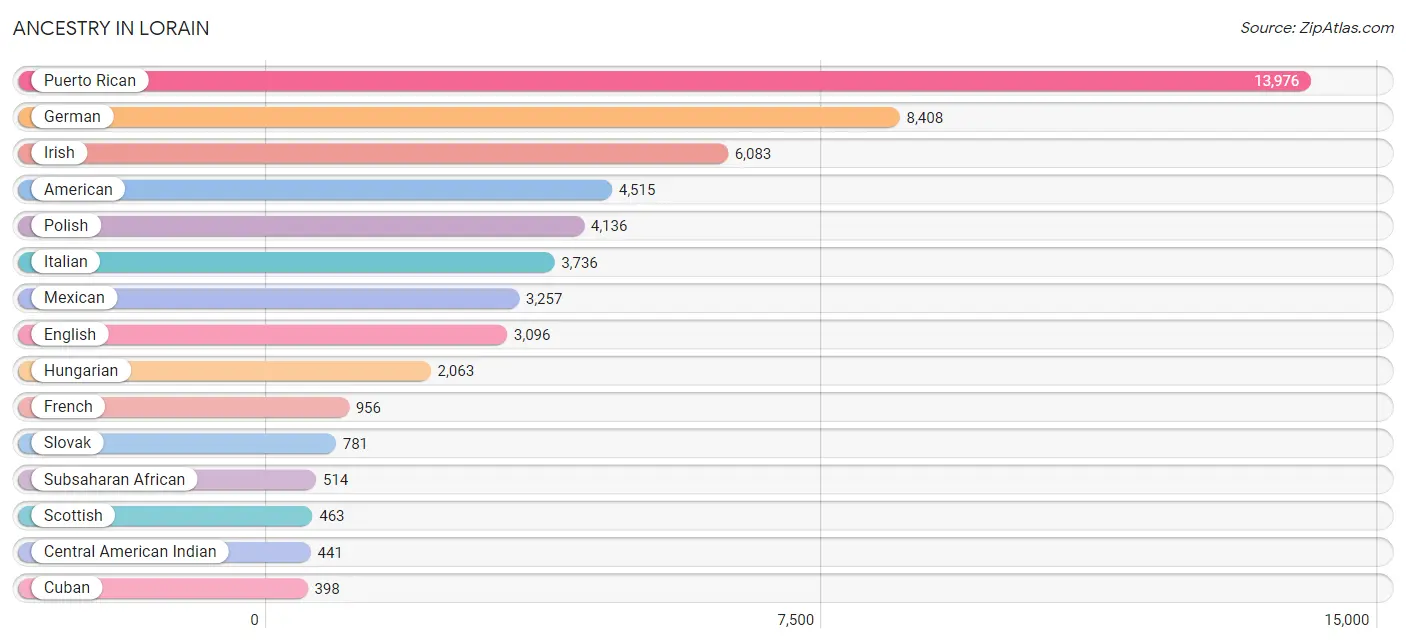
Ancestry in Lorain
The most populous ancestries reported in Lorain are Puerto Rican (13,976 | 21.5%), German (8,408 | 12.9%), Irish (6,083 | 9.3%), American (4,515 | 6.9%), and Polish (4,136 | 6.4%), together accounting for 57.0% of all Lorain residents.
| Ancestry | # Population | % Population |
| African | 387 | 0.6% |
| American | 4,515 | 6.9% |
| Arab | 217 | 0.3% |
| Argentinean | 16 | 0.0% |
| Austrian | 76 | 0.1% |
| Belgian | 6 | 0.0% |
| Bhutanese | 45 | 0.1% |
| Blackfeet | 78 | 0.1% |
| British | 107 | 0.2% |
| Bulgarian | 113 | 0.2% |
| Burmese | 35 | 0.1% |
| Canadian | 7 | 0.0% |
| Central American | 292 | 0.4% |
| Central American Indian | 441 | 0.7% |
| Cherokee | 393 | 0.6% |
| Costa Rican | 126 | 0.2% |
| Creek | 32 | 0.1% |
| Croatian | 243 | 0.4% |
| Cuban | 398 | 0.6% |
| Czech | 109 | 0.2% |
| Czechoslovakian | 119 | 0.2% |
| Dominican | 27 | 0.0% |
| Dutch | 296 | 0.4% |
| Eastern European | 107 | 0.2% |
| Ecuadorian | 26 | 0.0% |
| Egyptian | 2 | 0.0% |
| English | 3,096 | 4.8% |
| Ethiopian | 2 | 0.0% |
| European | 215 | 0.3% |
| Finnish | 44 | 0.1% |
| French | 956 | 1.5% |
| French American Indian | 9 | 0.0% |
| French Canadian | 29 | 0.0% |
| German | 8,408 | 12.9% |
| Greek | 217 | 0.3% |
| Guatemalan | 1 | 0.0% |
| Honduran | 102 | 0.2% |
| Hungarian | 2,063 | 3.2% |
| Indian (Asian) | 78 | 0.1% |
| Iraqi | 17 | 0.0% |
| Irish | 6,083 | 9.3% |
| Iroquois | 12 | 0.0% |
| Italian | 3,736 | 5.7% |
| Jordanian | 5 | 0.0% |
| Korean | 147 | 0.2% |
| Lebanese | 101 | 0.2% |
| Lithuanian | 35 | 0.1% |
| Macedonian | 123 | 0.2% |
| Mexican | 3,257 | 5.0% |
| Mexican American Indian | 17 | 0.0% |
| Native Hawaiian | 11 | 0.0% |
| Nigerian | 125 | 0.2% |
| Northern European | 11 | 0.0% |
| Norwegian | 55 | 0.1% |
| Panamanian | 20 | 0.0% |
| Pennsylvania German | 20 | 0.0% |
| Peruvian | 23 | 0.0% |
| Polish | 4,136 | 6.4% |
| Portuguese | 3 | 0.0% |
| Puerto Rican | 13,976 | 21.5% |
| Romanian | 132 | 0.2% |
| Russian | 221 | 0.3% |
| Salvadoran | 43 | 0.1% |
| Scotch-Irish | 125 | 0.2% |
| Scottish | 463 | 0.7% |
| Serbian | 127 | 0.2% |
| Sioux | 6 | 0.0% |
| Slavic | 11 | 0.0% |
| Slovak | 781 | 1.2% |
| Slovene | 193 | 0.3% |
| South American | 193 | 0.3% |
| Spaniard | 60 | 0.1% |
| Spanish | 91 | 0.1% |
| Sri Lankan | 22 | 0.0% |
| Subsaharan African | 514 | 0.8% |
| Swedish | 123 | 0.2% |
| Syrian | 20 | 0.0% |
| Thai | 93 | 0.1% |
| Ukrainian | 202 | 0.3% |
| Venezuelan | 128 | 0.2% |
| Welsh | 343 | 0.5% |
| West Indian | 103 | 0.2% |
| Yugoslavian | 44 | 0.1% | View All 83 Rows |
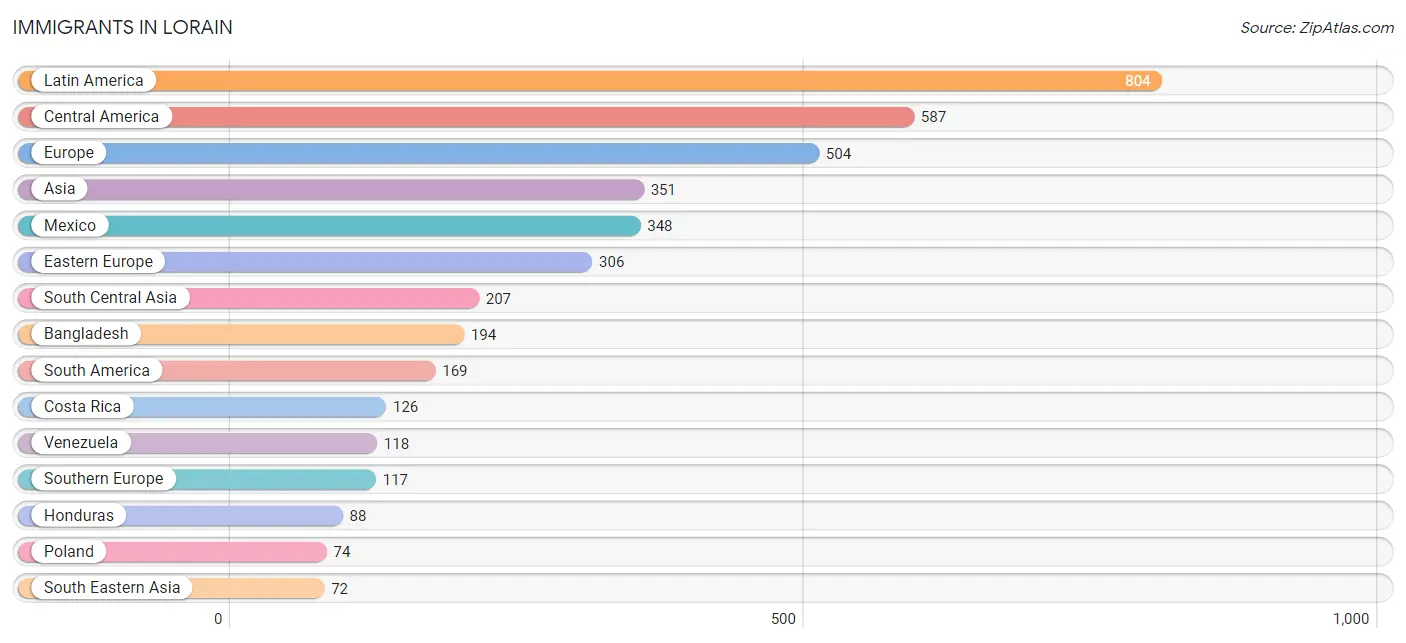
Immigrants in Lorain
The most numerous immigrant groups reported in Lorain came from Latin America (804 | 1.2%), Central America (587 | 0.9%), Europe (504 | 0.8%), Asia (351 | 0.5%), and Mexico (348 | 0.5%), together accounting for 4.0% of all Lorain residents.
| Immigration Origin | # Population | % Population |
| Africa | 27 | 0.0% |
| Argentina | 2 | 0.0% |
| Asia | 351 | 0.5% |
| Bangladesh | 194 | 0.3% |
| Bosnia and Herzegovina | 8 | 0.0% |
| Bulgaria | 63 | 0.1% |
| Canada | 62 | 0.1% |
| Caribbean | 48 | 0.1% |
| Central America | 587 | 0.9% |
| China | 32 | 0.1% |
| Costa Rica | 126 | 0.2% |
| Croatia | 19 | 0.0% |
| Cuba | 7 | 0.0% |
| Dominican Republic | 27 | 0.0% |
| Eastern Asia | 32 | 0.1% |
| Eastern Europe | 306 | 0.5% |
| Ecuador | 26 | 0.0% |
| England | 11 | 0.0% |
| Europe | 504 | 0.8% |
| France | 6 | 0.0% |
| Germany | 34 | 0.1% |
| Greece | 30 | 0.1% |
| Guatemala | 10 | 0.0% |
| Haiti | 14 | 0.0% |
| Honduras | 88 | 0.1% |
| Hungary | 30 | 0.1% |
| India | 13 | 0.0% |
| Italy | 50 | 0.1% |
| Kuwait | 4 | 0.0% |
| Latin America | 804 | 1.2% |
| Lebanon | 16 | 0.0% |
| Mexico | 348 | 0.5% |
| Nigeria | 27 | 0.0% |
| North Macedonia | 12 | 0.0% |
| Northern Europe | 41 | 0.1% |
| Panama | 15 | 0.0% |
| Peru | 23 | 0.0% |
| Philippines | 5 | 0.0% |
| Poland | 74 | 0.1% |
| Romania | 29 | 0.0% |
| South America | 169 | 0.3% |
| South Central Asia | 207 | 0.3% |
| South Eastern Asia | 72 | 0.1% |
| Southern Europe | 117 | 0.2% |
| Spain | 37 | 0.1% |
| Syria | 20 | 0.0% |
| Ukraine | 37 | 0.1% |
| Venezuela | 118 | 0.2% |
| Vietnam | 67 | 0.1% |
| Western Africa | 27 | 0.0% |
| Western Asia | 40 | 0.1% |
| Western Europe | 40 | 0.1% | View All 52 Rows |
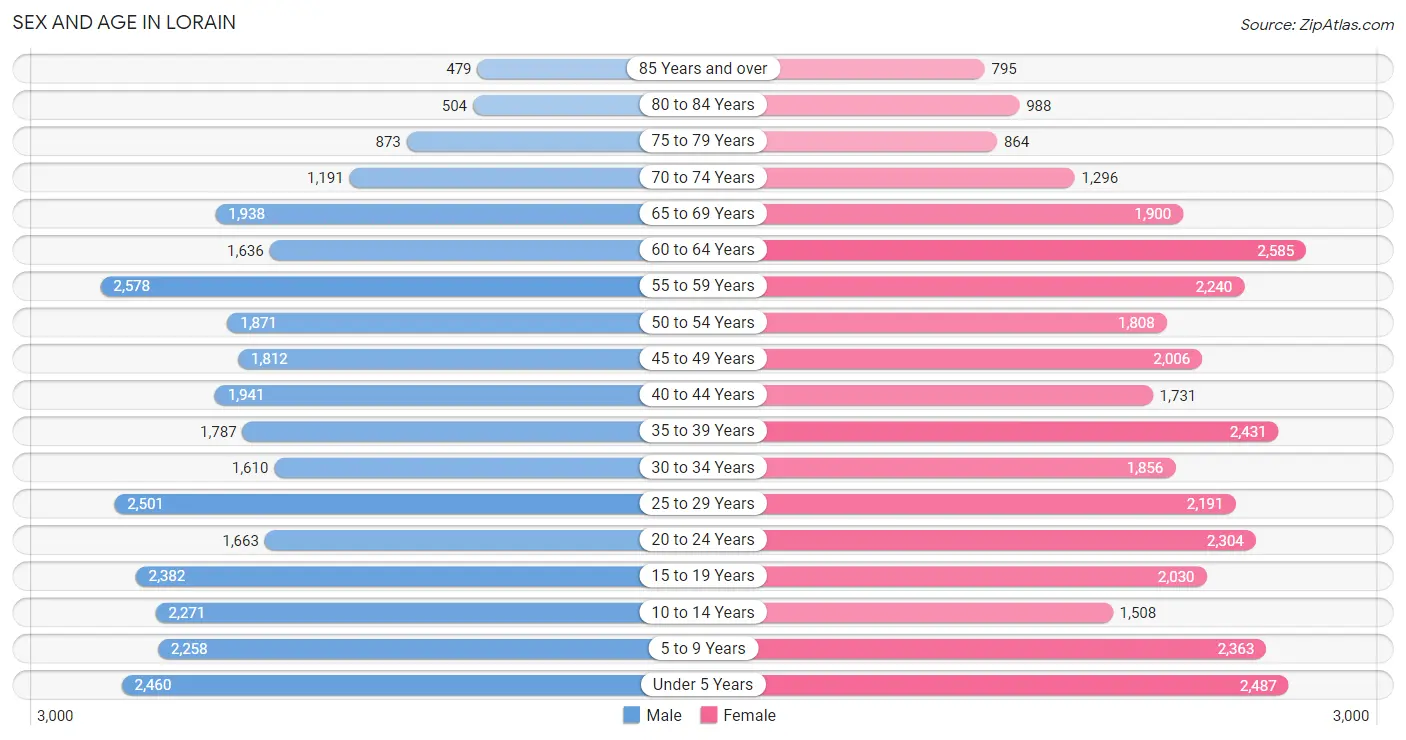
Sex and Age in Lorain
Sex and Age in Lorain
The most populous age groups in Lorain are 55 to 59 Years (2,578 | 8.1%) for men and 60 to 64 Years (2,585 | 7.7%) for women.
| Age Bracket | Male | Female |
| Under 5 Years | 2,460 (7.7%) | 2,487 (7.4%) |
| 5 to 9 Years | 2,258 (7.1%) | 2,363 (7.1%) |
| 10 to 14 Years | 2,271 (7.1%) | 1,508 (4.5%) |
| 15 to 19 Years | 2,382 (7.5%) | 2,030 (6.1%) |
| 20 to 24 Years | 1,663 (5.2%) | 2,304 (6.9%) |
| 25 to 29 Years | 2,501 (7.9%) | 2,191 (6.6%) |
| 30 to 34 Years | 1,610 (5.1%) | 1,856 (5.6%) |
| 35 to 39 Years | 1,787 (5.6%) | 2,431 (7.3%) |
| 40 to 44 Years | 1,941 (6.1%) | 1,731 (5.2%) |
| 45 to 49 Years | 1,812 (5.7%) | 2,006 (6.0%) |
| 50 to 54 Years | 1,871 (5.9%) | 1,808 (5.4%) |
| 55 to 59 Years | 2,578 (8.1%) | 2,240 (6.7%) |
| 60 to 64 Years | 1,636 (5.1%) | 2,585 (7.7%) |
| 65 to 69 Years | 1,938 (6.1%) | 1,900 (5.7%) |
| 70 to 74 Years | 1,191 (3.7%) | 1,296 (3.9%) |
| 75 to 79 Years | 873 (2.8%) | 864 (2.6%) |
| 80 to 84 Years | 504 (1.6%) | 988 (3.0%) |
| 85 Years and over | 479 (1.5%) | 795 (2.4%) |
| Total | 31,755 (100.0%) | 33,383 (100.0%) |
Families and Households in Lorain
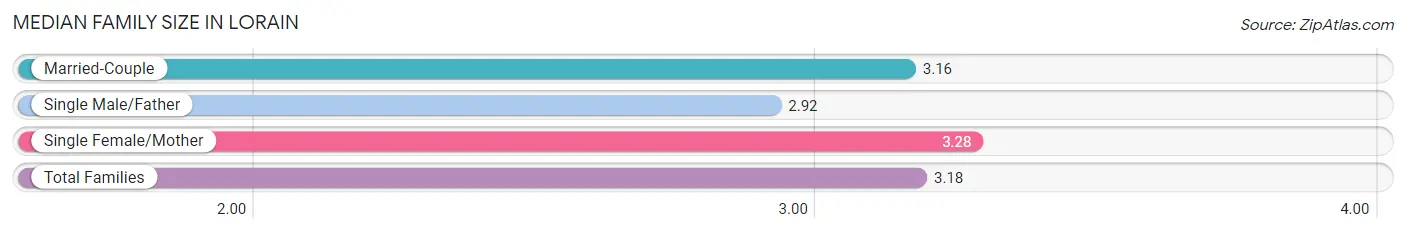
Median Family Size in Lorain
The median family size in Lorain is 3.18 persons per family, with single female/mother families (5,159 | 34.2%) accounting for the largest median family size of 3.28 persons per family. On the other hand, single male/father families (1,487 | 9.9%) represent the smallest median family size with 2.92 persons per family.
| Family Type | # Families | Family Size |
| Married-Couple | 8,438 (55.9%) | 3.16 |
| Single Male/Father | 1,487 (9.9%) | 2.92 |
| Single Female/Mother | 5,159 (34.2%) | 3.28 |
| Total Families | 15,084 (100.0%) | 3.18 |
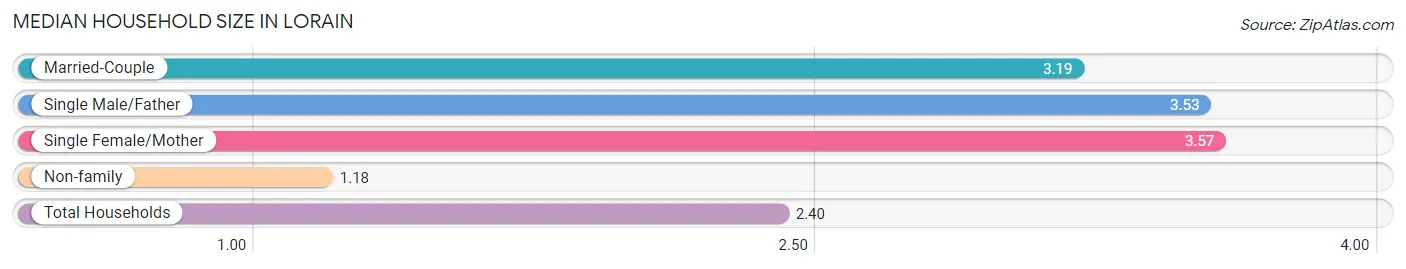
Median Household Size in Lorain
The median household size in Lorain is 2.40 persons per household, with single female/mother households (5,159 | 19.2%) accounting for the largest median household size of 3.57 persons per household. non-family households (11,792 | 43.9%) represent the smallest median household size with 1.18 persons per household.
| Household Type | # Households | Household Size |
| Married-Couple | 8,438 (31.4%) | 3.19 |
| Single Male/Father | 1,487 (5.5%) | 3.53 |
| Single Female/Mother | 5,159 (19.2%) | 3.57 |
| Non-family | 11,792 (43.9%) | 1.18 |
| Total Households | 26,876 (100.0%) | 2.40 |
Household Size by Marriage Status in Lorain
Out of a total of 26,876 households in Lorain, 15,084 (56.1%) are family households, while 11,792 (43.9%) are nonfamily households. The most numerous type of family households are 2-person households, comprising 5,991, and the most common type of nonfamily households are 1-person households, comprising 10,145.
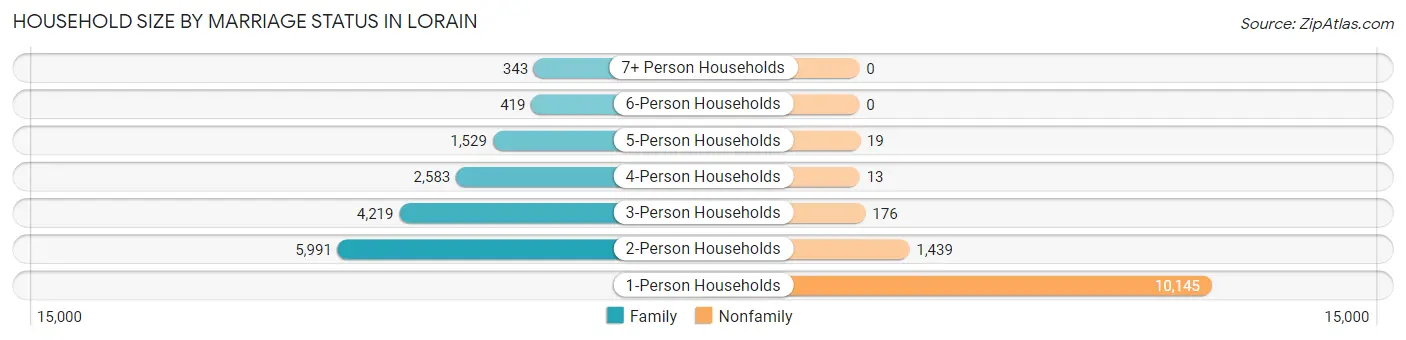
| Household Size | Family Households | Nonfamily Households |
| 1-Person Households | - | 10,145 (37.8%) |
| 2-Person Households | 5,991 (22.3%) | 1,439 (5.3%) |
| 3-Person Households | 4,219 (15.7%) | 176 (0.6%) |
| 4-Person Households | 2,583 (9.6%) | 13 (0.1%) |
| 5-Person Households | 1,529 (5.7%) | 19 (0.1%) |
| 6-Person Households | 419 (1.6%) | 0 (0.0%) |
| 7+ Person Households | 343 (1.3%) | 0 (0.0%) |
| Total | 15,084 (56.1%) | 11,792 (43.9%) |
Female Fertility in Lorain
Fertility by Age in Lorain
Average fertility rate in Lorain is 86.0 births per 1,000 women. Women in the age bracket of 20 to 34 years have the highest fertility rate with 155.0 births per 1,000 women. Women in the age bracket of 20 to 34 years acount for 76.7% of all women with births.
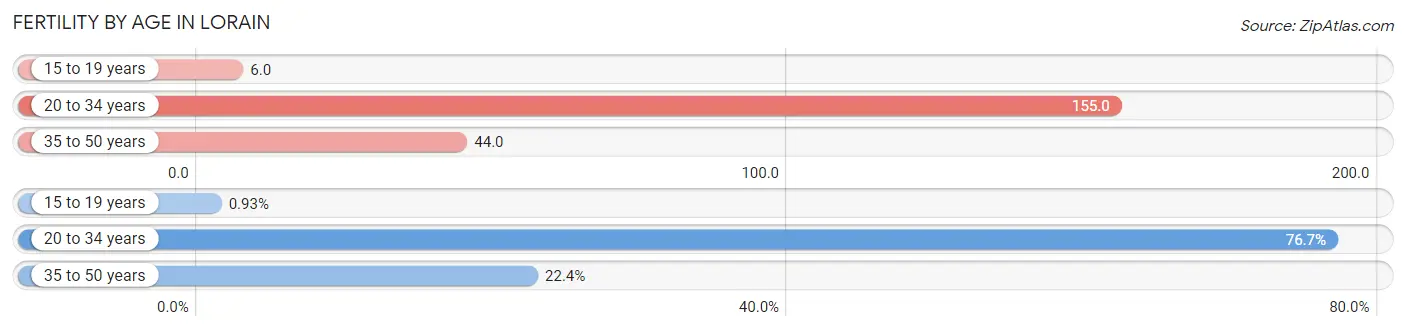
| Age Bracket | Women with Births | Births / 1,000 Women |
| 15 to 19 years | 12 (0.9%) | 6.0 |
| 20 to 34 years | 986 (76.7%) | 155.0 |
| 35 to 50 years | 288 (22.4%) | 44.0 |
| Total | 1,286 (100.0%) | 86.0 |
Fertility by Age by Marriage Status in Lorain
34.5% of women with births (1,286) in Lorain are married. The highest percentage of unmarried women with births falls into 15 to 19 years age bracket with 100.0% of them unmarried at the time of birth, while the lowest percentage of unmarried women with births belong to 35 to 50 years age bracket with 18.1% of them unmarried.
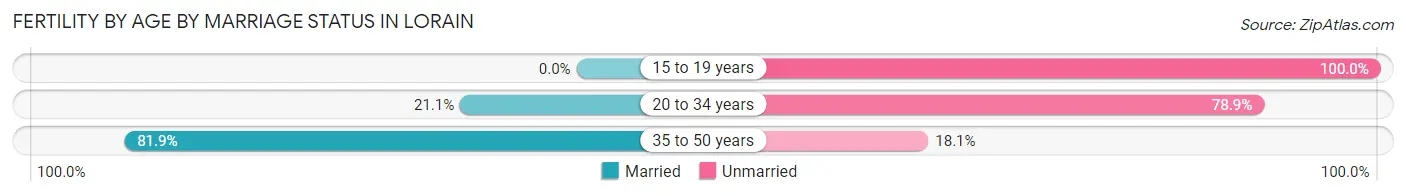
| Age Bracket | Married | Unmarried |
| 15 to 19 years | 0 (0.0%) | 12 (100.0%) |
| 20 to 34 years | 208 (21.1%) | 778 (78.9%) |
| 35 to 50 years | 236 (81.9%) | 52 (18.1%) |
| Total | 444 (34.5%) | 842 (65.5%) |
Fertility by Education in Lorain
Average fertility rate in Lorain is 86.0 births per 1,000 women. Women with the education attainment of graduate degree have the highest fertility rate of 211.0 births per 1,000 women, while women with the education attainment of bachelor's degree have the lowest fertility at 26.0 births per 1,000 women. Women with the education attainment of high school diploma represent 42.6% of all women with births.
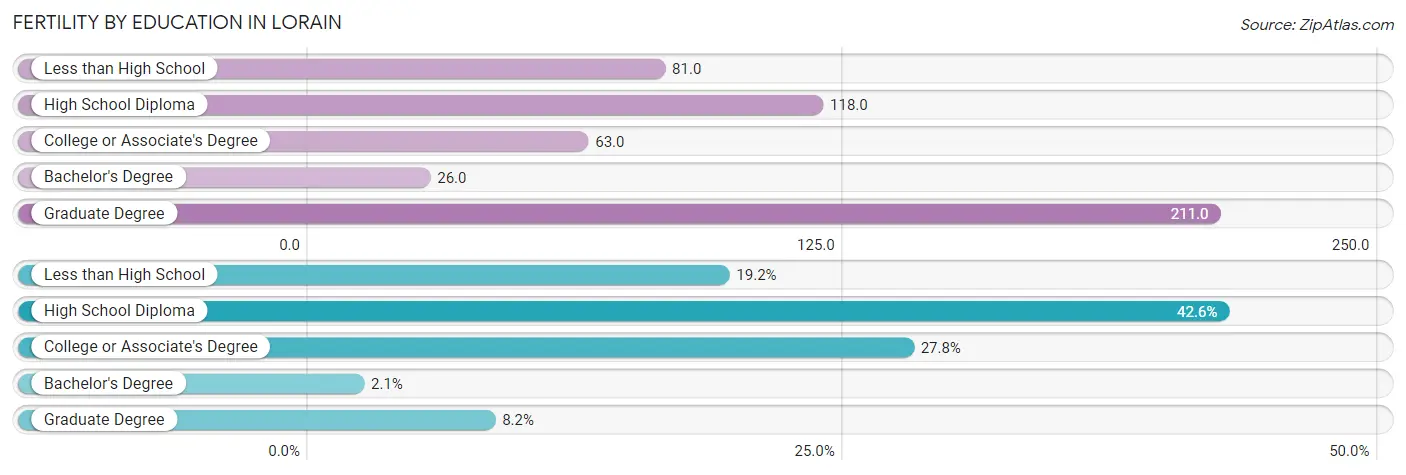
| Educational Attainment | Women with Births | Births / 1,000 Women |
| Less than High School | 247 (19.2%) | 81.0 |
| High School Diploma | 548 (42.6%) | 118.0 |
| College or Associate's Degree | 358 (27.8%) | 63.0 |
| Bachelor's Degree | 27 (2.1%) | 26.0 |
| Graduate Degree | 106 (8.2%) | 211.0 |
| Total | 1,286 (100.0%) | 86.0 |
Fertility by Education by Marriage Status in Lorain
65.5% of women with births in Lorain are unmarried. Women with the educational attainment of bachelor's degree are most likely to be married with 100.0% of them married at childbirth, while women with the educational attainment of high school diploma are least likely to be married with 90.9% of them unmarried at childbirth.
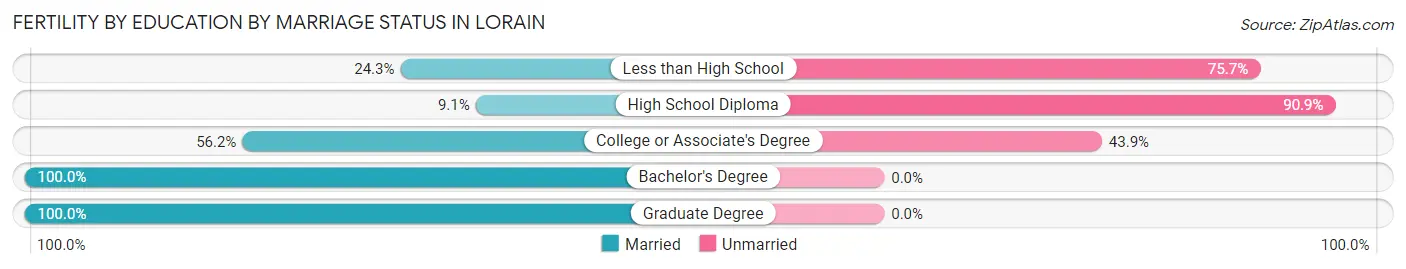
| Educational Attainment | Married | Unmarried |
| Less than High School | 60 (24.3%) | 187 (75.7%) |
| High School Diploma | 50 (9.1%) | 498 (90.9%) |
| College or Associate's Degree | 201 (56.1%) | 157 (43.9%) |
| Bachelor's Degree | 27 (100.0%) | 0 (0.0%) |
| Graduate Degree | 106 (100.0%) | 0 (0.0%) |
| Total | 444 (34.5%) | 842 (65.5%) |
Employment Characteristics in Lorain
Employment by Class of Employer in Lorain
Among the 26,355 employed individuals in Lorain, private company employees (20,583 | 78.1%), local government employees (1,917 | 7.3%), and not-for-profit organizations (1,667 | 6.3%) make up the most common classes of employment.
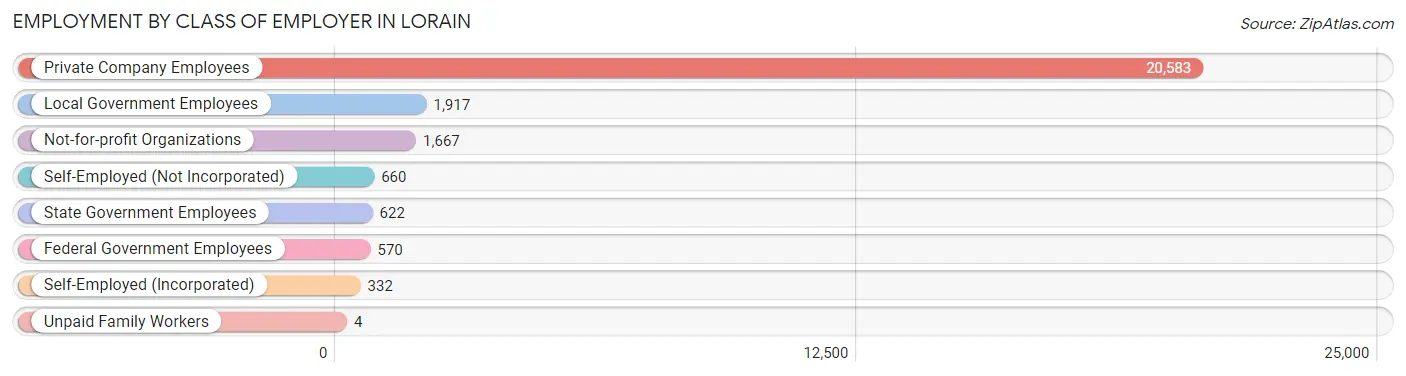
| Employer Class | # Employees | % Employees |
| Private Company Employees | 20,583 | 78.1% |
| Self-Employed (Incorporated) | 332 | 1.3% |
| Self-Employed (Not Incorporated) | 660 | 2.5% |
| Not-for-profit Organizations | 1,667 | 6.3% |
| Local Government Employees | 1,917 | 7.3% |
| State Government Employees | 622 | 2.4% |
| Federal Government Employees | 570 | 2.2% |
| Unpaid Family Workers | 4 | 0.0% |
| Total | 26,355 | 100.0% |
Employment Status by Age in Lorain
According to the labor force statistics for Lorain, out of the total population over 16 years of age (50,831), 56.8% or 28,872 individuals are in the labor force, with 6.2% or 1,790 of them unemployed. The age group with the highest labor force participation rate is 30 to 34 years, with 78.2% or 2,710 individuals in the labor force. Within the labor force, the 16 to 19 years age range has the highest percentage of unemployed individuals, with 9.9% or 176 of them being unemployed.
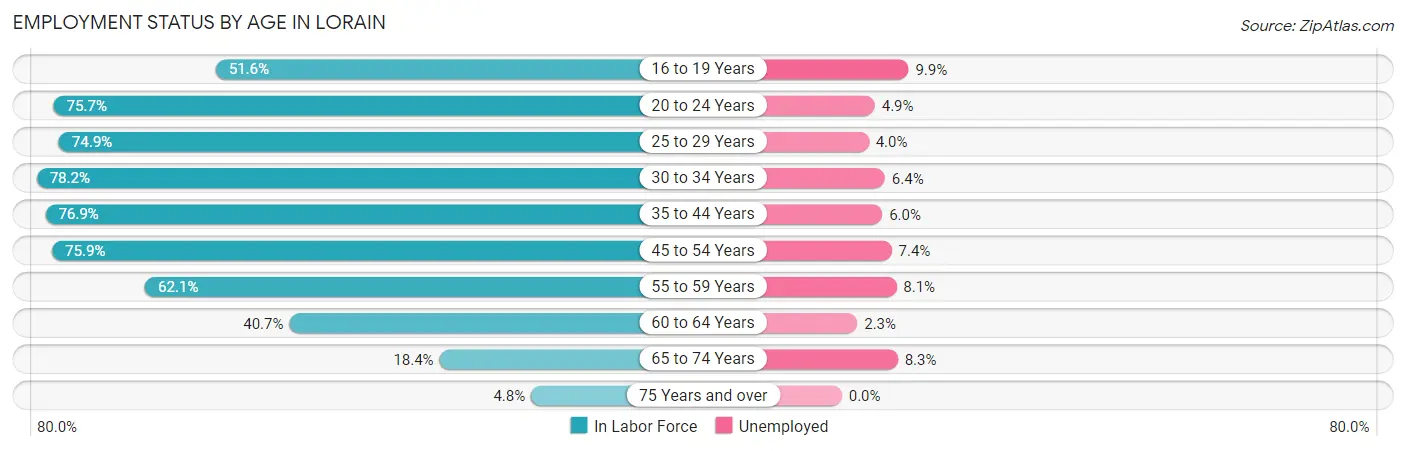
| Age Bracket | In Labor Force | Unemployed |
| 16 to 19 Years | 1,781 (51.6%) | 176 (9.9%) |
| 20 to 24 Years | 3,003 (75.7%) | 147 (4.9%) |
| 25 to 29 Years | 3,514 (74.9%) | 141 (4.0%) |
| 30 to 34 Years | 2,710 (78.2%) | 173 (6.4%) |
| 35 to 44 Years | 6,067 (76.9%) | 364 (6.0%) |
| 45 to 54 Years | 5,690 (75.9%) | 421 (7.4%) |
| 55 to 59 Years | 2,992 (62.1%) | 242 (8.1%) |
| 60 to 64 Years | 1,718 (40.7%) | 40 (2.3%) |
| 65 to 74 Years | 1,164 (18.4%) | 97 (8.3%) |
| 75 Years and over | 216 (4.8%) | 0 (0.0%) |
| Total | 28,872 (56.8%) | 1,790 (6.2%) |
Employment Status by Educational Attainment in Lorain
According to labor force statistics for Lorain, 69.6% of individuals (22,678) out of the total population between 25 and 64 years of age (32,584) are in the labor force, with 6.1% or 1,383 of them being unemployed. The group with the highest labor force participation rate are those with the educational attainment of bachelor's degree or higher, with 88.0% or 3,580 individuals in the labor force. Within the labor force, individuals with less than high school education have the highest percentage of unemployment, with 24.6% or 575 of them being unemployed.
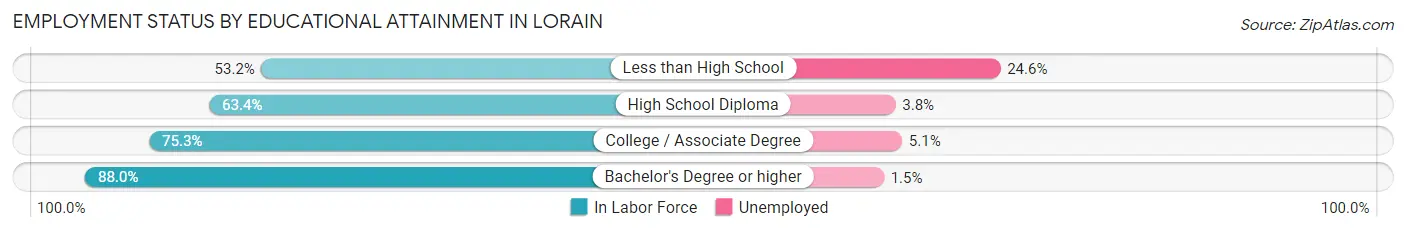
| Educational Attainment | In Labor Force | Unemployed |
| Less than High School | 2,336 (53.2%) | 1,080 (24.6%) |
| High School Diploma | 7,444 (63.4%) | 446 (3.8%) |
| College / Associate Degree | 9,325 (75.3%) | 632 (5.1%) |
| Bachelor's Degree or higher | 3,580 (88.0%) | 61 (1.5%) |
| Total | 22,678 (69.6%) | 1,988 (6.1%) |
Employment Occupations by Sex in Lorain
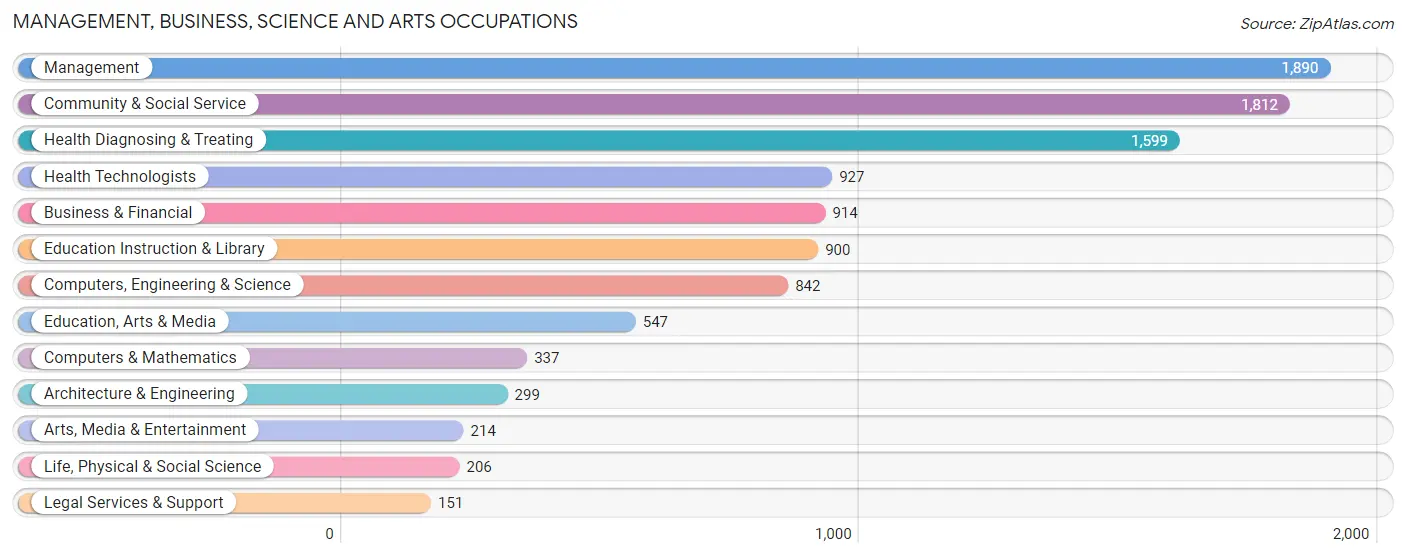
Management, Business, Science and Arts Occupations
The most common Management, Business, Science and Arts occupations in Lorain are Management (1,890 | 7.0%), Community & Social Service (1,812 | 6.7%), Health Diagnosing & Treating (1,599 | 5.9%), Health Technologists (927 | 3.4%), and Business & Financial (914 | 3.4%).
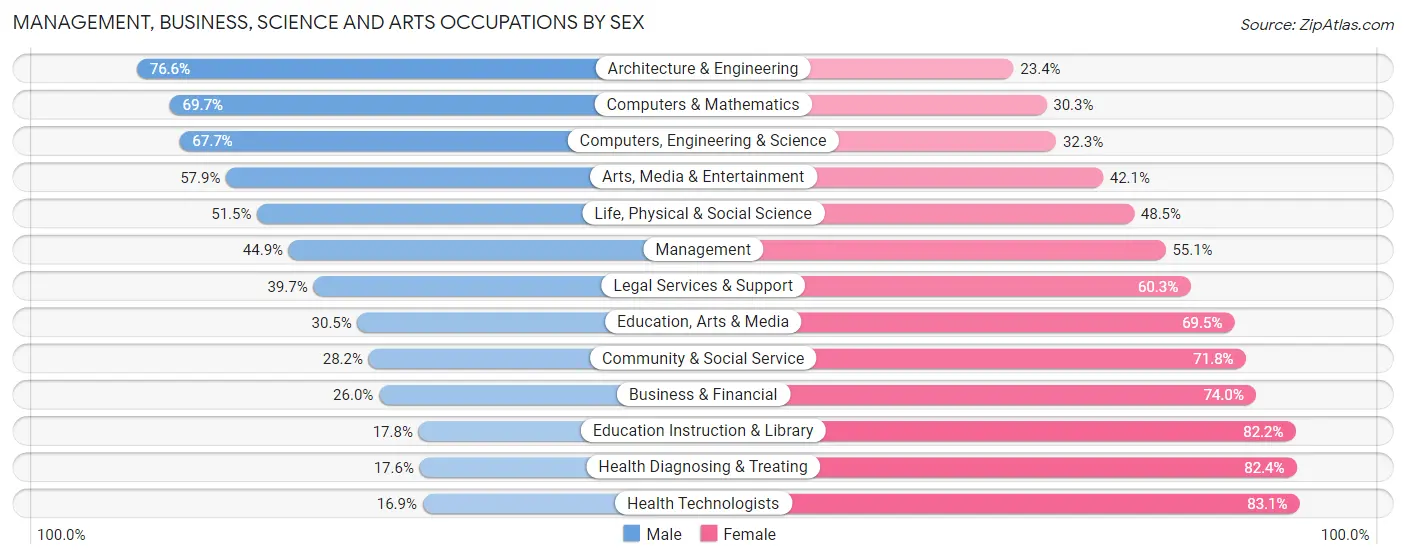
Management, Business, Science and Arts Occupations by Sex
Within the Management, Business, Science and Arts occupations in Lorain, the most male-oriented occupations are Architecture & Engineering (76.6%), Computers & Mathematics (69.7%), and Computers, Engineering & Science (67.7%), while the most female-oriented occupations are Health Technologists (83.1%), Health Diagnosing & Treating (82.4%), and Education Instruction & Library (82.2%).
| Occupation | Male | Female |
| Management | 848 (44.9%) | 1,042 (55.1%) |
| Business & Financial | 238 (26.0%) | 676 (74.0%) |
| Computers, Engineering & Science | 570 (67.7%) | 272 (32.3%) |
| Computers & Mathematics | 235 (69.7%) | 102 (30.3%) |
| Architecture & Engineering | 229 (76.6%) | 70 (23.4%) |
| Life, Physical & Social Science | 106 (51.5%) | 100 (48.5%) |
| Community & Social Service | 511 (28.2%) | 1,301 (71.8%) |
| Education, Arts & Media | 167 (30.5%) | 380 (69.5%) |
| Legal Services & Support | 60 (39.7%) | 91 (60.3%) |
| Education Instruction & Library | 160 (17.8%) | 740 (82.2%) |
| Arts, Media & Entertainment | 124 (57.9%) | 90 (42.1%) |
| Health Diagnosing & Treating | 281 (17.6%) | 1,318 (82.4%) |
| Health Technologists | 157 (16.9%) | 770 (83.1%) |
| Total (Category) | 2,448 (34.7%) | 4,609 (65.3%) |
| Total (Overall) | 13,059 (48.3%) | 13,993 (51.7%) |
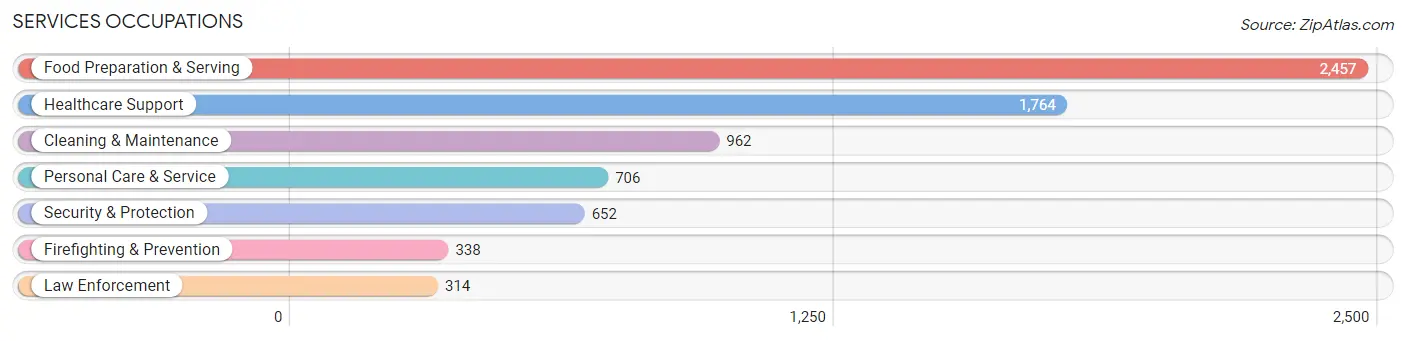
Services Occupations
The most common Services occupations in Lorain are Food Preparation & Serving (2,457 | 9.1%), Healthcare Support (1,764 | 6.5%), Cleaning & Maintenance (962 | 3.6%), Personal Care & Service (706 | 2.6%), and Security & Protection (652 | 2.4%).
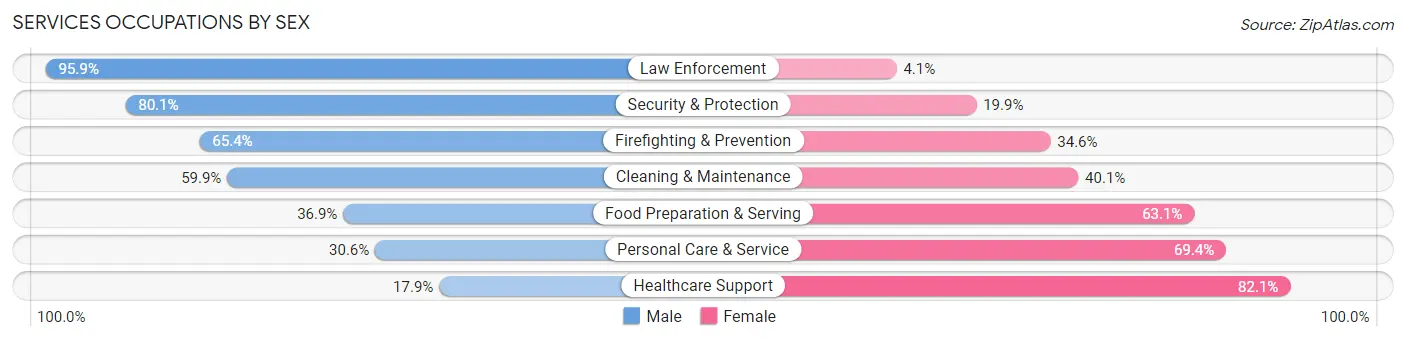
Services Occupations by Sex
Within the Services occupations in Lorain, the most male-oriented occupations are Law Enforcement (95.9%), Security & Protection (80.1%), and Firefighting & Prevention (65.4%), while the most female-oriented occupations are Healthcare Support (82.1%), Personal Care & Service (69.4%), and Food Preparation & Serving (63.1%).
| Occupation | Male | Female |
| Healthcare Support | 316 (17.9%) | 1,448 (82.1%) |
| Security & Protection | 522 (80.1%) | 130 (19.9%) |
| Firefighting & Prevention | 221 (65.4%) | 117 (34.6%) |
| Law Enforcement | 301 (95.9%) | 13 (4.1%) |
| Food Preparation & Serving | 907 (36.9%) | 1,550 (63.1%) |
| Cleaning & Maintenance | 576 (59.9%) | 386 (40.1%) |
| Personal Care & Service | 216 (30.6%) | 490 (69.4%) |
| Total (Category) | 2,537 (38.8%) | 4,004 (61.2%) |
| Total (Overall) | 13,059 (48.3%) | 13,993 (51.7%) |
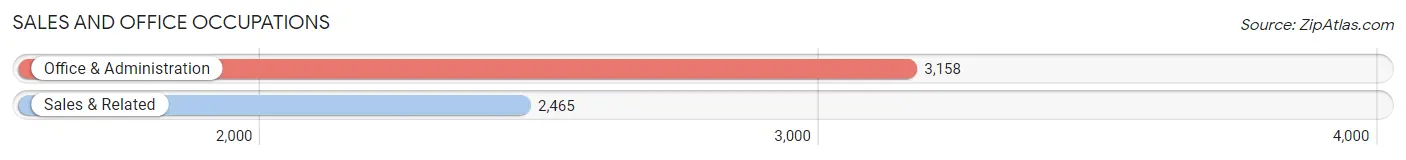
Sales and Office Occupations
The most common Sales and Office occupations in Lorain are Office & Administration (3,158 | 11.7%), and Sales & Related (2,465 | 9.1%).
Sales and Office Occupations by Sex
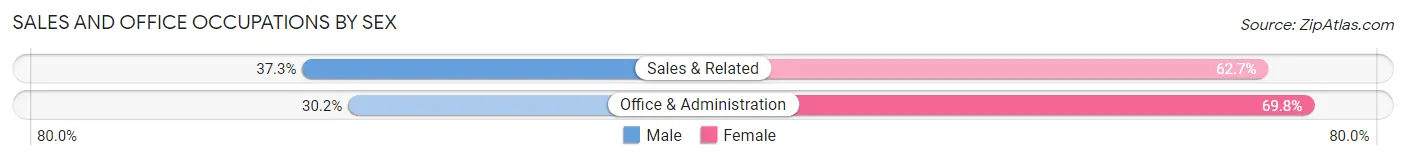
| Occupation | Male | Female |
| Sales & Related | 919 (37.3%) | 1,546 (62.7%) |
| Office & Administration | 955 (30.2%) | 2,203 (69.8%) |
| Total (Category) | 1,874 (33.3%) | 3,749 (66.7%) |
| Total (Overall) | 13,059 (48.3%) | 13,993 (51.7%) |
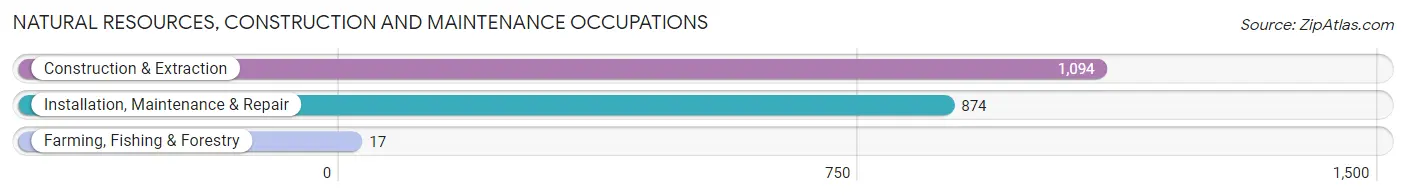
Natural Resources, Construction and Maintenance Occupations
The most common Natural Resources, Construction and Maintenance occupations in Lorain are Construction & Extraction (1,094 | 4.0%), Installation, Maintenance & Repair (874 | 3.2%), and Farming, Fishing & Forestry (17 | 0.1%).
Natural Resources, Construction and Maintenance Occupations by Sex
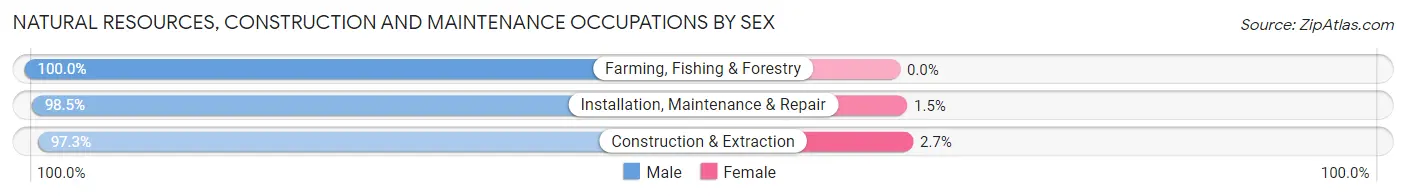
| Occupation | Male | Female |
| Farming, Fishing & Forestry | 17 (100.0%) | 0 (0.0%) |
| Construction & Extraction | 1,064 (97.3%) | 30 (2.7%) |
| Installation, Maintenance & Repair | 861 (98.5%) | 13 (1.5%) |
| Total (Category) | 1,942 (97.8%) | 43 (2.2%) |
| Total (Overall) | 13,059 (48.3%) | 13,993 (51.7%) |
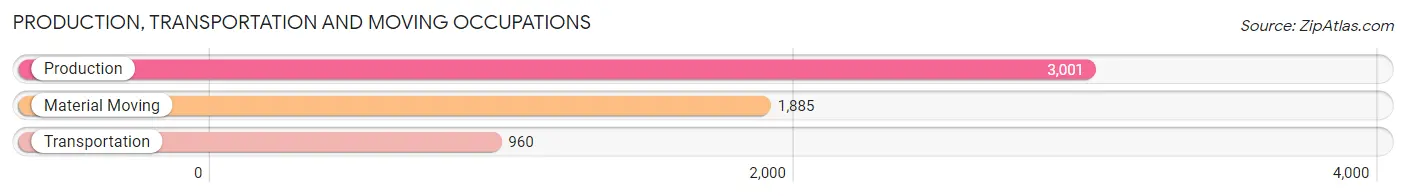
Production, Transportation and Moving Occupations
The most common Production, Transportation and Moving occupations in Lorain are Production (3,001 | 11.1%), Material Moving (1,885 | 7.0%), and Transportation (960 | 3.5%).
Production, Transportation and Moving Occupations by Sex
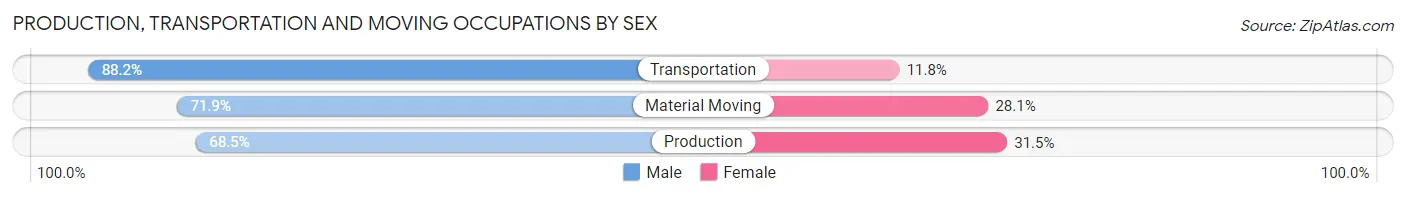
| Occupation | Male | Female |
| Production | 2,055 (68.5%) | 946 (31.5%) |
| Transportation | 847 (88.2%) | 113 (11.8%) |
| Material Moving | 1,356 (71.9%) | 529 (28.1%) |
| Total (Category) | 4,258 (72.8%) | 1,588 (27.2%) |
| Total (Overall) | 13,059 (48.3%) | 13,993 (51.7%) |
Employment Industries by Sex in Lorain
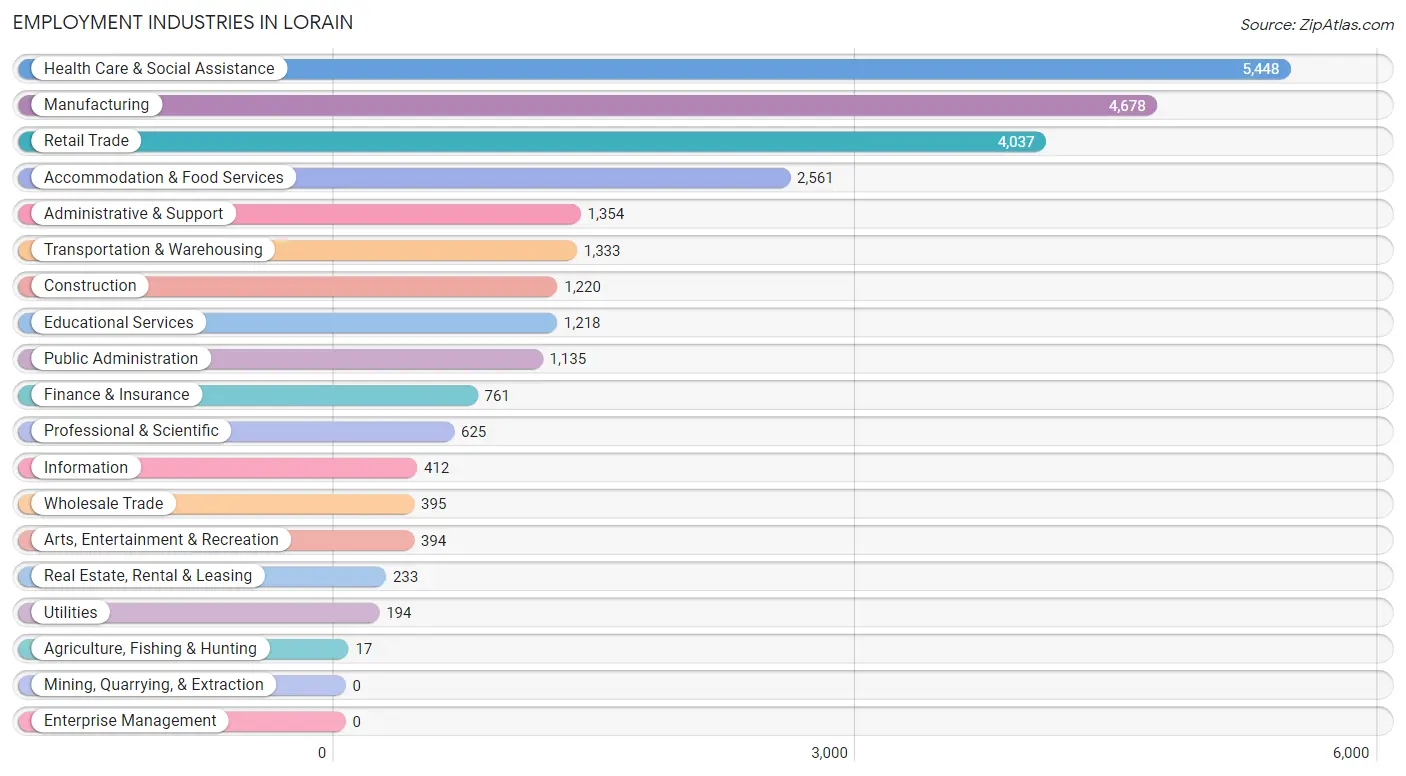
Employment Industries in Lorain
The major employment industries in Lorain include Health Care & Social Assistance (5,448 | 20.1%), Manufacturing (4,678 | 17.3%), Retail Trade (4,037 | 14.9%), Accommodation & Food Services (2,561 | 9.5%), and Administrative & Support (1,354 | 5.0%).
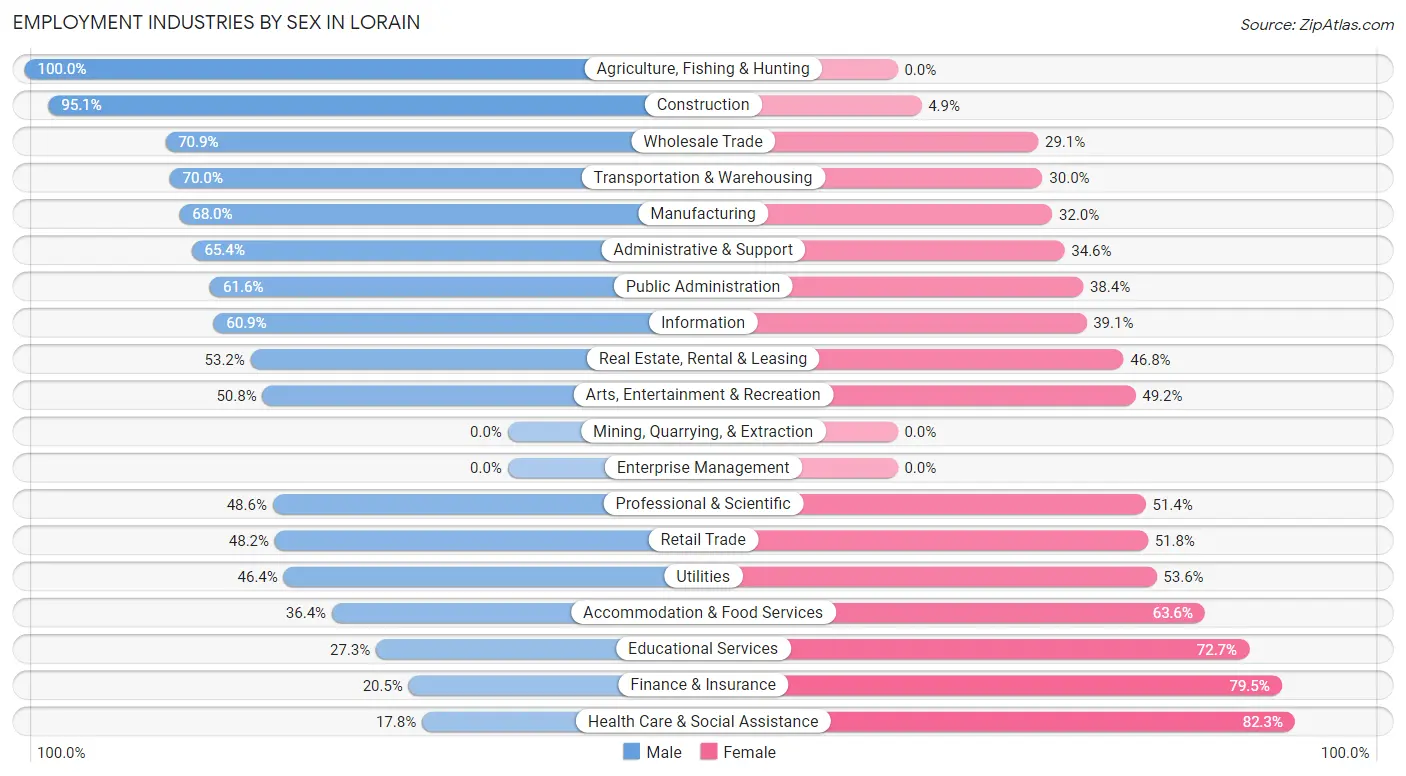
Employment Industries by Sex in Lorain
The Lorain industries that see more men than women are Agriculture, Fishing & Hunting (100.0%), Construction (95.1%), and Wholesale Trade (70.9%), whereas the industries that tend to have a higher number of women are Health Care & Social Assistance (82.3%), Finance & Insurance (79.5%), and Educational Services (72.7%).
| Industry | Male | Female |
| Agriculture, Fishing & Hunting | 17 (100.0%) | 0 (0.0%) |
| Mining, Quarrying, & Extraction | 0 (0.0%) | 0 (0.0%) |
| Construction | 1,160 (95.1%) | 60 (4.9%) |
| Manufacturing | 3,180 (68.0%) | 1,498 (32.0%) |
| Wholesale Trade | 280 (70.9%) | 115 (29.1%) |
| Retail Trade | 1,946 (48.2%) | 2,091 (51.8%) |
| Transportation & Warehousing | 933 (70.0%) | 400 (30.0%) |
| Utilities | 90 (46.4%) | 104 (53.6%) |
| Information | 251 (60.9%) | 161 (39.1%) |
| Finance & Insurance | 156 (20.5%) | 605 (79.5%) |
| Real Estate, Rental & Leasing | 124 (53.2%) | 109 (46.8%) |
| Professional & Scientific | 304 (48.6%) | 321 (51.4%) |
| Enterprise Management | 0 (0.0%) | 0 (0.0%) |
| Administrative & Support | 886 (65.4%) | 468 (34.6%) |
| Educational Services | 332 (27.3%) | 886 (72.7%) |
| Health Care & Social Assistance | 967 (17.7%) | 4,481 (82.3%) |
| Arts, Entertainment & Recreation | 200 (50.8%) | 194 (49.2%) |
| Accommodation & Food Services | 932 (36.4%) | 1,629 (63.6%) |
| Public Administration | 699 (61.6%) | 436 (38.4%) |
| Total | 13,059 (48.3%) | 13,993 (51.7%) |
Education in Lorain
School Enrollment in Lorain
The most common levels of schooling among the 15,059 students in Lorain are high school (3,667 | 24.3%), college / undergraduate (3,269 | 21.7%), and elementary school (3,230 | 21.4%).
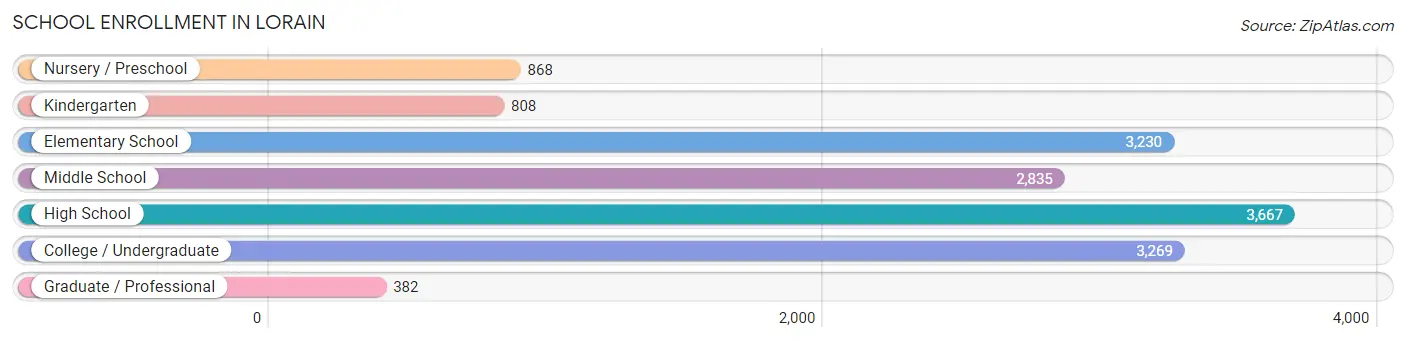
| School Level | # Students | % Students |
| Nursery / Preschool | 868 | 5.8% |
| Kindergarten | 808 | 5.4% |
| Elementary School | 3,230 | 21.4% |
| Middle School | 2,835 | 18.8% |
| High School | 3,667 | 24.3% |
| College / Undergraduate | 3,269 | 21.7% |
| Graduate / Professional | 382 | 2.5% |
| Total | 15,059 | 100.0% |
School Enrollment by Age by Funding Source in Lorain
Out of a total of 15,059 students who are enrolled in schools in Lorain, 3,072 (20.4%) attend a private institution, while the remaining 11,987 (79.6%) are enrolled in public schools. The age group of 20 to 24 year olds has the highest likelihood of being enrolled in private schools, with 344 (30.3% in the age bracket) enrolled. Conversely, the age group of 15 to 17 year olds has the lowest likelihood of being enrolled in a private school, with 2,253 (91.0% in the age bracket) attending a public institution.
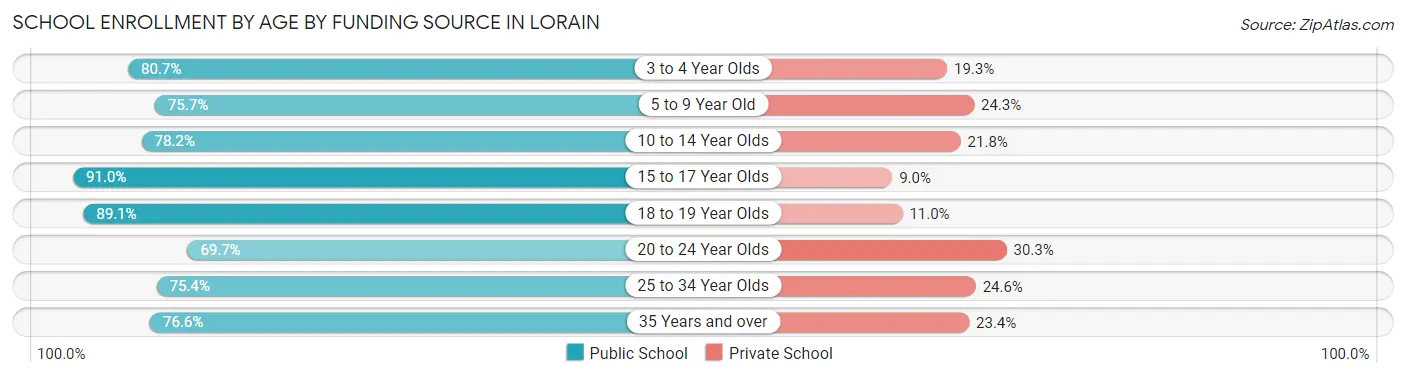
| Age Bracket | Public School | Private School |
| 3 to 4 Year Olds | 595 (80.7%) | 142 (19.3%) |
| 5 to 9 Year Old | 2,921 (75.7%) | 937 (24.3%) |
| 10 to 14 Year Olds | 2,789 (78.2%) | 777 (21.8%) |
| 15 to 17 Year Olds | 2,253 (91.0%) | 224 (9.0%) |
| 18 to 19 Year Olds | 968 (89.0%) | 119 (11.0%) |
| 20 to 24 Year Olds | 790 (69.7%) | 344 (30.3%) |
| 25 to 34 Year Olds | 736 (75.4%) | 240 (24.6%) |
| 35 Years and over | 938 (76.6%) | 286 (23.4%) |
| Total | 11,987 (79.6%) | 3,072 (20.4%) |
Educational Attainment by Field of Study in Lorain
Education (1,345 | 21.0%), business (1,141 | 17.8%), science & technology (926 | 14.5%), arts & humanities (424 | 6.6%), and engineering (410 | 6.4%) are the most common fields of study among 6,402 individuals in Lorain who have obtained a bachelor's degree or higher.
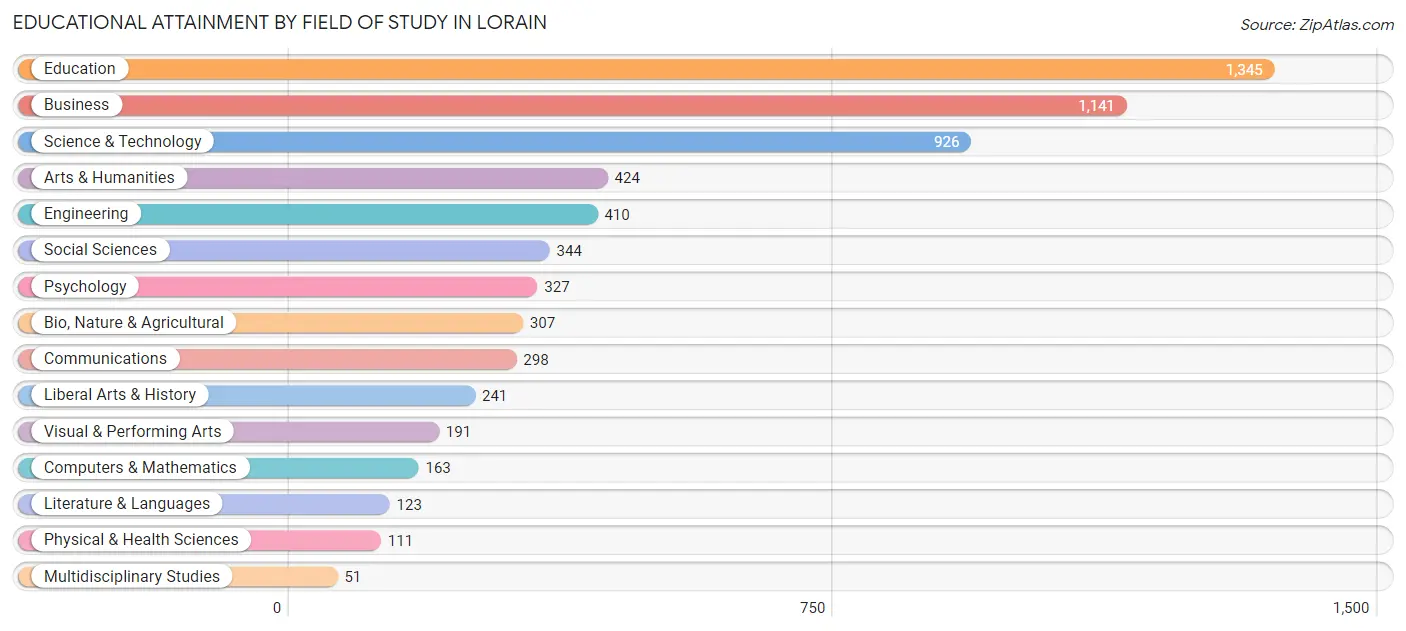
| Field of Study | # Graduates | % Graduates |
| Computers & Mathematics | 163 | 2.5% |
| Bio, Nature & Agricultural | 307 | 4.8% |
| Physical & Health Sciences | 111 | 1.7% |
| Psychology | 327 | 5.1% |
| Social Sciences | 344 | 5.4% |
| Engineering | 410 | 6.4% |
| Multidisciplinary Studies | 51 | 0.8% |
| Science & Technology | 926 | 14.5% |
| Business | 1,141 | 17.8% |
| Education | 1,345 | 21.0% |
| Literature & Languages | 123 | 1.9% |
| Liberal Arts & History | 241 | 3.8% |
| Visual & Performing Arts | 191 | 3.0% |
| Communications | 298 | 4.6% |
| Arts & Humanities | 424 | 6.6% |
| Total | 6,402 | 100.0% |
Transportation & Commute in Lorain
Vehicle Availability by Sex in Lorain
The most prevalent vehicle ownership categories in Lorain are males with 2 vehicles (5,384, accounting for 41.9%) and females with 2 vehicles (5,012, making up 40.2%).
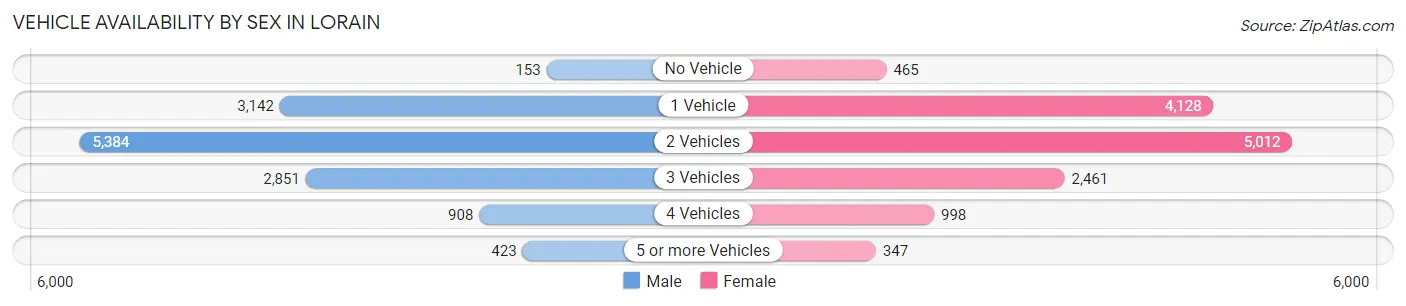
| Vehicles Available | Male | Female |
| No Vehicle | 153 (1.2%) | 465 (3.5%) |
| 1 Vehicle | 3,142 (24.4%) | 4,128 (30.8%) |
| 2 Vehicles | 5,384 (41.9%) | 5,012 (37.4%) |
| 3 Vehicles | 2,851 (22.2%) | 2,461 (18.3%) |
| 4 Vehicles | 908 (7.1%) | 998 (7.4%) |
| 5 or more Vehicles | 423 (3.3%) | 347 (2.6%) |
| Total | 12,861 (100.0%) | 13,411 (100.0%) |
Commute Time in Lorain
The most frequently occuring commute durations in Lorain are 15 to 19 minutes (4,253 commuters, 16.9%), 20 to 24 minutes (4,082 commuters, 16.2%), and 30 to 34 minutes (3,324 commuters, 13.2%).
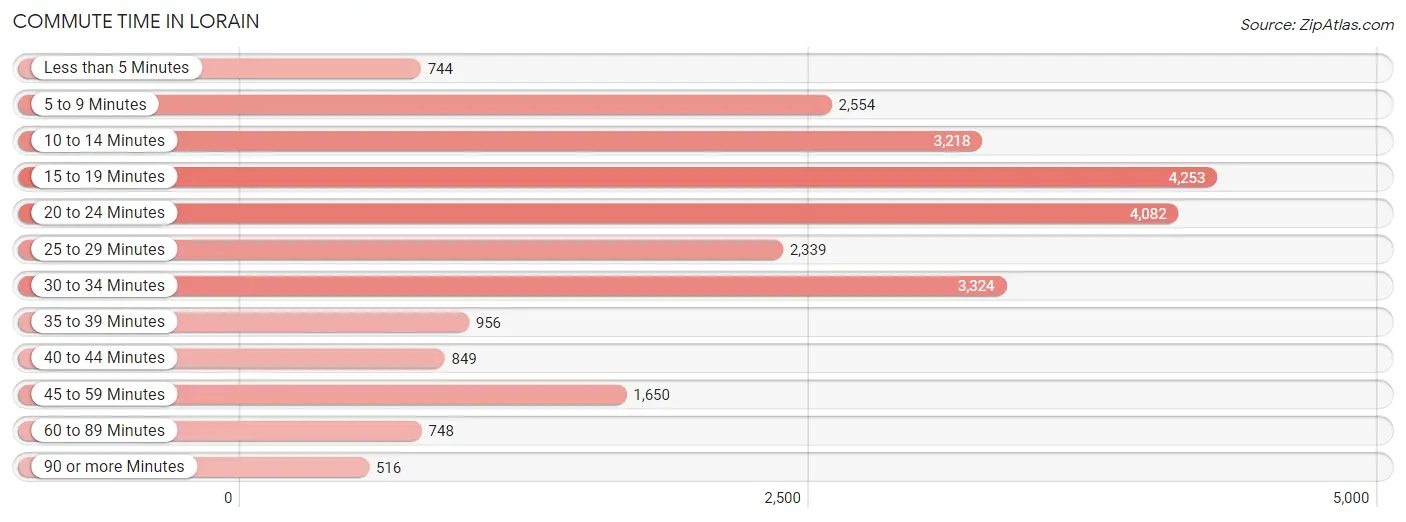
| Commute Time | # Commuters | % Commuters |
| Less than 5 Minutes | 744 | 2.9% |
| 5 to 9 Minutes | 2,554 | 10.1% |
| 10 to 14 Minutes | 3,218 | 12.8% |
| 15 to 19 Minutes | 4,253 | 16.9% |
| 20 to 24 Minutes | 4,082 | 16.2% |
| 25 to 29 Minutes | 2,339 | 9.3% |
| 30 to 34 Minutes | 3,324 | 13.2% |
| 35 to 39 Minutes | 956 | 3.8% |
| 40 to 44 Minutes | 849 | 3.4% |
| 45 to 59 Minutes | 1,650 | 6.5% |
| 60 to 89 Minutes | 748 | 3.0% |
| 90 or more Minutes | 516 | 2.0% |
Commute Time by Sex in Lorain
The most common commute times in Lorain are 15 to 19 minutes (2,291 commuters, 18.4%) for males and 10 to 14 minutes (2,072 commuters, 16.2%) for females.
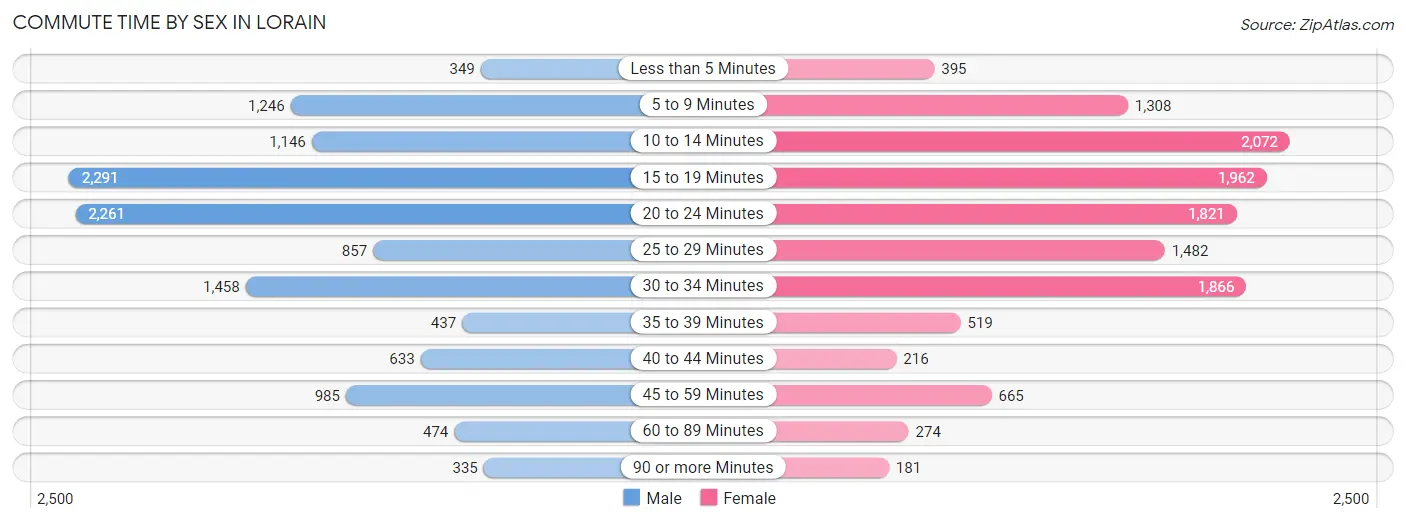
| Commute Time | Male | Female |
| Less than 5 Minutes | 349 (2.8%) | 395 (3.1%) |
| 5 to 9 Minutes | 1,246 (10.0%) | 1,308 (10.2%) |
| 10 to 14 Minutes | 1,146 (9.2%) | 2,072 (16.2%) |
| 15 to 19 Minutes | 2,291 (18.4%) | 1,962 (15.4%) |
| 20 to 24 Minutes | 2,261 (18.1%) | 1,821 (14.3%) |
| 25 to 29 Minutes | 857 (6.9%) | 1,482 (11.6%) |
| 30 to 34 Minutes | 1,458 (11.7%) | 1,866 (14.6%) |
| 35 to 39 Minutes | 437 (3.5%) | 519 (4.1%) |
| 40 to 44 Minutes | 633 (5.1%) | 216 (1.7%) |
| 45 to 59 Minutes | 985 (7.9%) | 665 (5.2%) |
| 60 to 89 Minutes | 474 (3.8%) | 274 (2.1%) |
| 90 or more Minutes | 335 (2.7%) | 181 (1.4%) |
Time of Departure to Work by Sex in Lorain
The most frequent times of departure to work in Lorain are 7:00 AM to 7:29 AM (1,703, 13.7%) for males and 7:00 AM to 7:29 AM (1,700, 13.3%) for females.
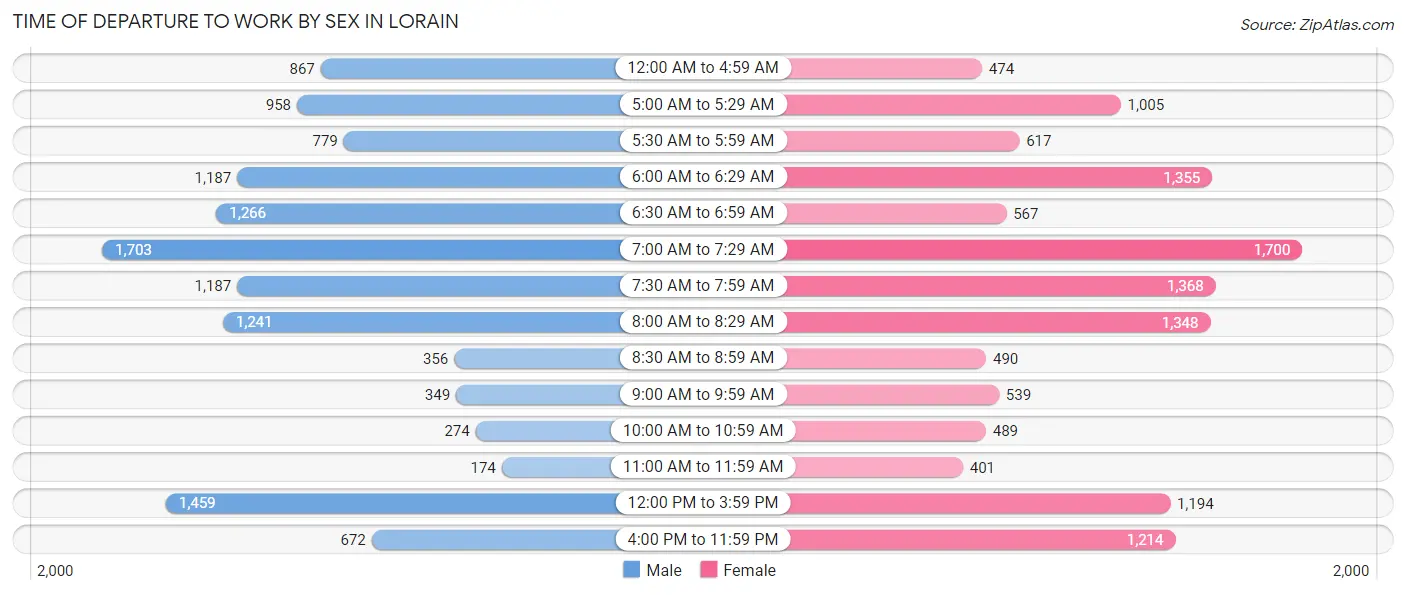
| Time of Departure | Male | Female |
| 12:00 AM to 4:59 AM | 867 (7.0%) | 474 (3.7%) |
| 5:00 AM to 5:29 AM | 958 (7.7%) | 1,005 (7.9%) |
| 5:30 AM to 5:59 AM | 779 (6.2%) | 617 (4.8%) |
| 6:00 AM to 6:29 AM | 1,187 (9.5%) | 1,355 (10.6%) |
| 6:30 AM to 6:59 AM | 1,266 (10.2%) | 567 (4.4%) |
| 7:00 AM to 7:29 AM | 1,703 (13.7%) | 1,700 (13.3%) |
| 7:30 AM to 7:59 AM | 1,187 (9.5%) | 1,368 (10.7%) |
| 8:00 AM to 8:29 AM | 1,241 (10.0%) | 1,348 (10.6%) |
| 8:30 AM to 8:59 AM | 356 (2.9%) | 490 (3.8%) |
| 9:00 AM to 9:59 AM | 349 (2.8%) | 539 (4.2%) |
| 10:00 AM to 10:59 AM | 274 (2.2%) | 489 (3.8%) |
| 11:00 AM to 11:59 AM | 174 (1.4%) | 401 (3.1%) |
| 12:00 PM to 3:59 PM | 1,459 (11.7%) | 1,194 (9.4%) |
| 4:00 PM to 11:59 PM | 672 (5.4%) | 1,214 (9.5%) |
| Total | 12,472 (100.0%) | 12,761 (100.0%) |
Housing Occupancy in Lorain
Occupancy by Ownership in Lorain
Of the total 26,876 dwellings in Lorain, owner-occupied units account for 14,804 (55.1%), while renter-occupied units make up 12,072 (44.9%).
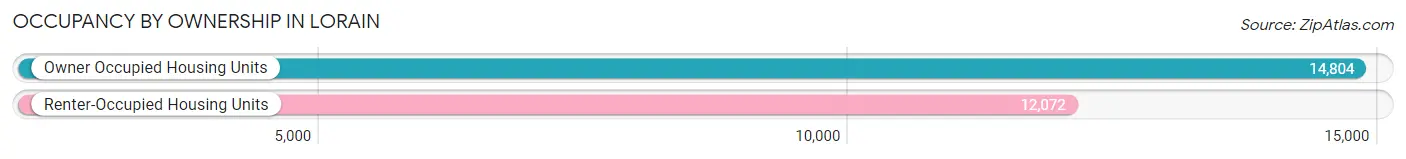
| Occupancy | # Housing Units | % Housing Units |
| Owner Occupied Housing Units | 14,804 | 55.1% |
| Renter-Occupied Housing Units | 12,072 | 44.9% |
| Total Occupied Housing Units | 26,876 | 100.0% |
Occupancy by Household Size in Lorain
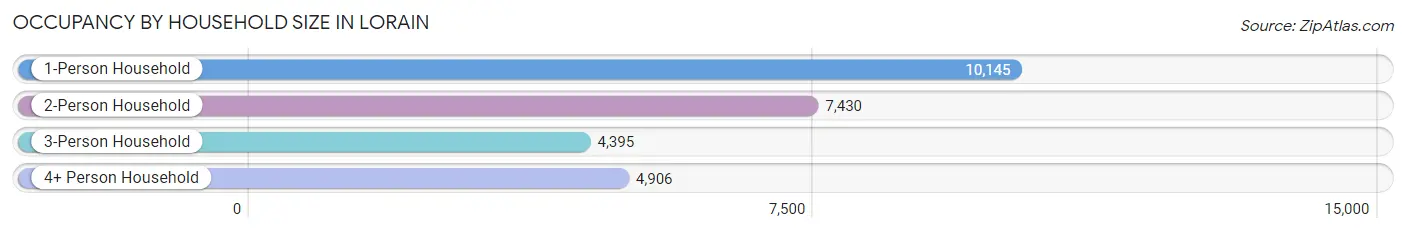
| Household Size | # Housing Units | % Housing Units |
| 1-Person Household | 10,145 | 37.8% |
| 2-Person Household | 7,430 | 27.7% |
| 3-Person Household | 4,395 | 16.4% |
| 4+ Person Household | 4,906 | 18.2% |
| Total Housing Units | 26,876 | 100.0% |
Occupancy by Ownership by Household Size in Lorain
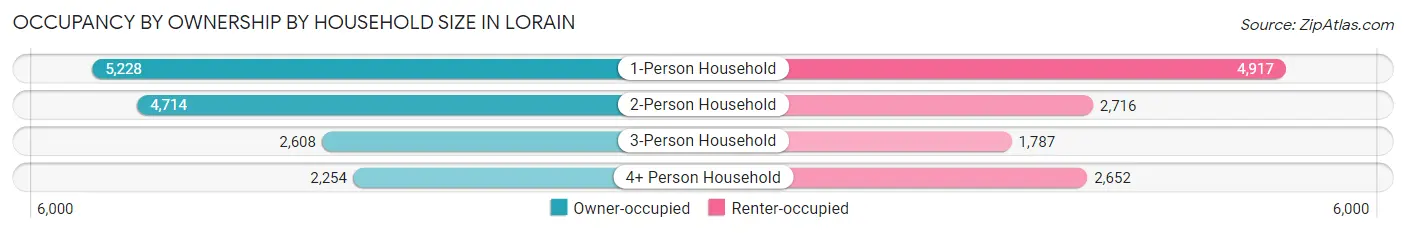
| Household Size | Owner-occupied | Renter-occupied |
| 1-Person Household | 5,228 (51.5%) | 4,917 (48.5%) |
| 2-Person Household | 4,714 (63.4%) | 2,716 (36.5%) |
| 3-Person Household | 2,608 (59.3%) | 1,787 (40.7%) |
| 4+ Person Household | 2,254 (45.9%) | 2,652 (54.1%) |
| Total Housing Units | 14,804 (55.1%) | 12,072 (44.9%) |
Occupancy by Educational Attainment in Lorain
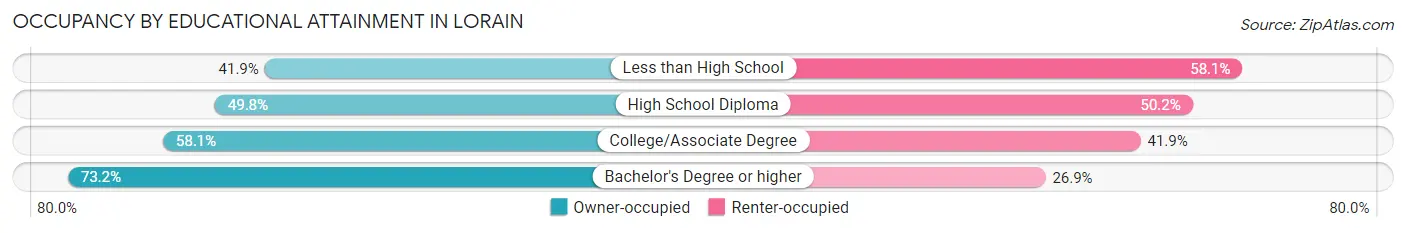
| Household Size | Owner-occupied | Renter-occupied |
| Less than High School | 1,654 (41.9%) | 2,291 (58.1%) |
| High School Diploma | 4,564 (49.8%) | 4,597 (50.2%) |
| College/Associate Degree | 5,725 (58.1%) | 4,134 (41.9%) |
| Bachelor's Degree or higher | 2,861 (73.2%) | 1,050 (26.9%) |
Occupancy by Age of Householder in Lorain
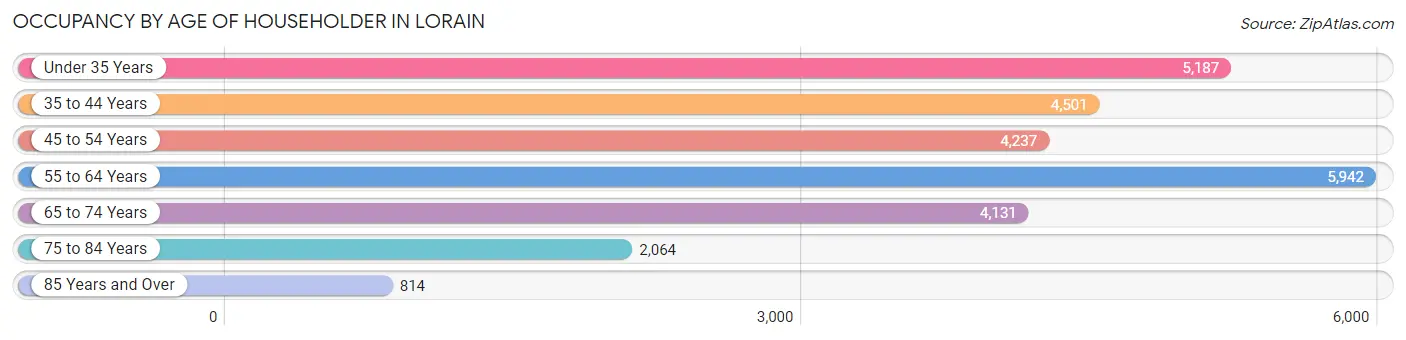
| Age Bracket | # Households | % Households |
| Under 35 Years | 5,187 | 19.3% |
| 35 to 44 Years | 4,501 | 16.8% |
| 45 to 54 Years | 4,237 | 15.8% |
| 55 to 64 Years | 5,942 | 22.1% |
| 65 to 74 Years | 4,131 | 15.4% |
| 75 to 84 Years | 2,064 | 7.7% |
| 85 Years and Over | 814 | 3.0% |
| Total | 26,876 | 100.0% |
Housing Finances in Lorain
Median Income by Occupancy in Lorain
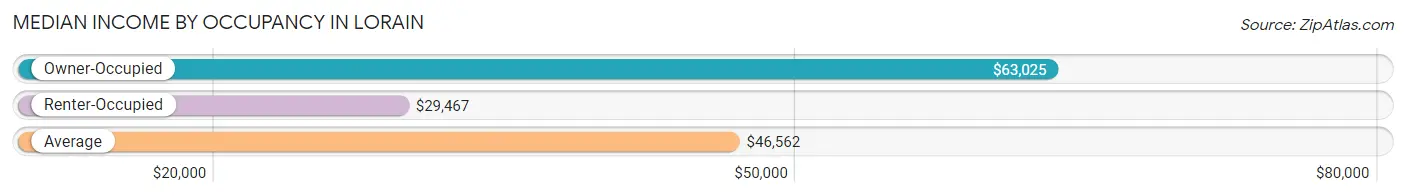
| Occupancy Type | # Households | Median Income |
| Owner-Occupied | 14,804 (55.1%) | $63,025 |
| Renter-Occupied | 12,072 (44.9%) | $29,467 |
| Average | 26,876 (100.0%) | $46,562 |
Occupancy by Householder Income Bracket in Lorain
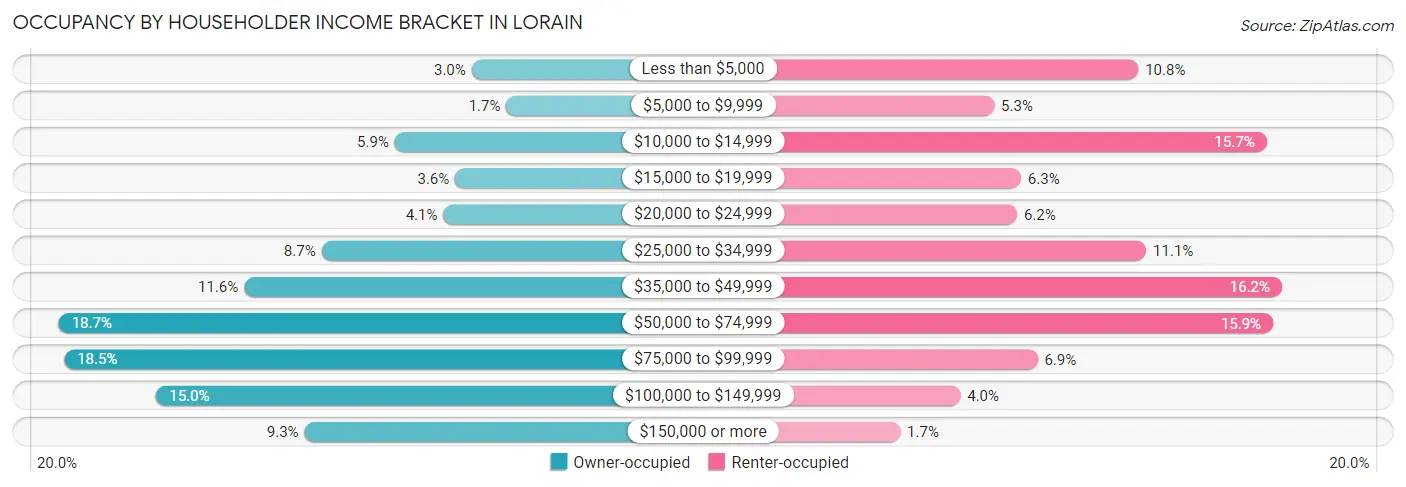
| Income Bracket | Owner-occupied | Renter-occupied |
| Less than $5,000 | 440 (3.0%) | 1,300 (10.8%) |
| $5,000 to $9,999 | 245 (1.7%) | 638 (5.3%) |
| $10,000 to $14,999 | 874 (5.9%) | 1,890 (15.7%) |
| $15,000 to $19,999 | 533 (3.6%) | 761 (6.3%) |
| $20,000 to $24,999 | 599 (4.1%) | 742 (6.1%) |
| $25,000 to $34,999 | 1,286 (8.7%) | 1,336 (11.1%) |
| $35,000 to $49,999 | 1,723 (11.6%) | 1,961 (16.2%) |
| $50,000 to $74,999 | 2,768 (18.7%) | 1,920 (15.9%) |
| $75,000 to $99,999 | 2,737 (18.5%) | 837 (6.9%) |
| $100,000 to $149,999 | 2,217 (15.0%) | 482 (4.0%) |
| $150,000 or more | 1,382 (9.3%) | 205 (1.7%) |
| Total | 14,804 (100.0%) | 12,072 (100.0%) |
Monthly Housing Cost Tiers in Lorain
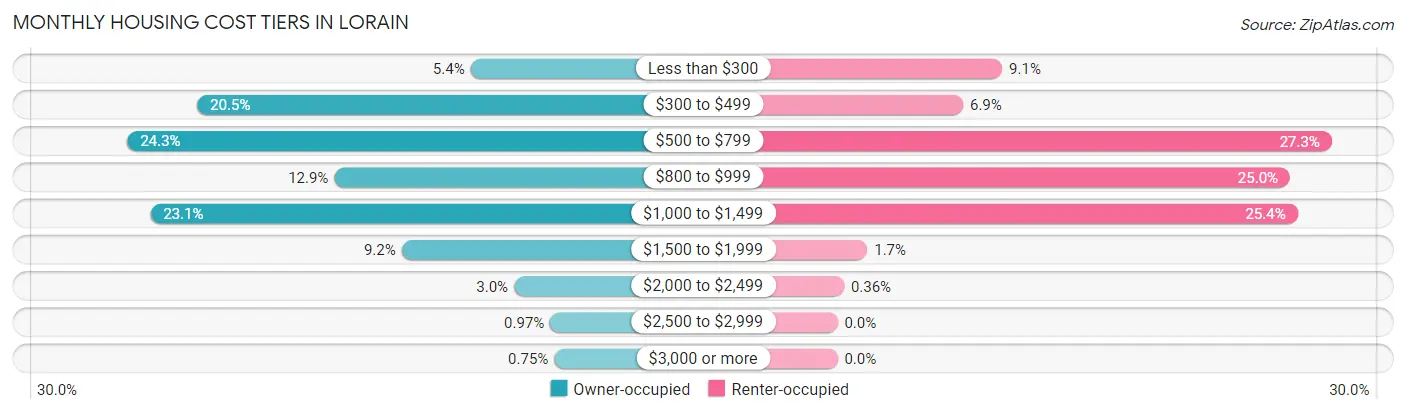
| Monthly Cost | Owner-occupied | Renter-occupied |
| Less than $300 | 795 (5.4%) | 1,098 (9.1%) |
| $300 to $499 | 3,031 (20.5%) | 838 (6.9%) |
| $500 to $799 | 3,602 (24.3%) | 3,296 (27.3%) |
| $800 to $999 | 1,910 (12.9%) | 3,017 (25.0%) |
| $1,000 to $1,499 | 3,414 (23.1%) | 3,067 (25.4%) |
| $1,500 to $1,999 | 1,359 (9.2%) | 199 (1.7%) |
| $2,000 to $2,499 | 439 (3.0%) | 43 (0.4%) |
| $2,500 to $2,999 | 143 (1.0%) | 0 (0.0%) |
| $3,000 or more | 111 (0.7%) | 0 (0.0%) |
| Total | 14,804 (100.0%) | 12,072 (100.0%) |
Physical Housing Characteristics in Lorain
Housing Structures in Lorain
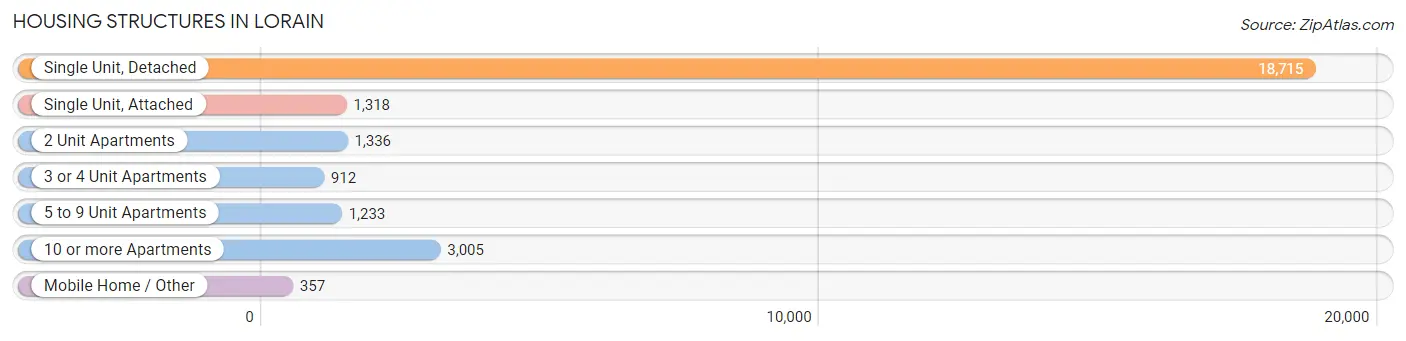
| Structure Type | # Housing Units | % Housing Units |
| Single Unit, Detached | 18,715 | 69.6% |
| Single Unit, Attached | 1,318 | 4.9% |
| 2 Unit Apartments | 1,336 | 5.0% |
| 3 or 4 Unit Apartments | 912 | 3.4% |
| 5 to 9 Unit Apartments | 1,233 | 4.6% |
| 10 or more Apartments | 3,005 | 11.2% |
| Mobile Home / Other | 357 | 1.3% |
| Total | 26,876 | 100.0% |
Housing Structures by Occupancy in Lorain
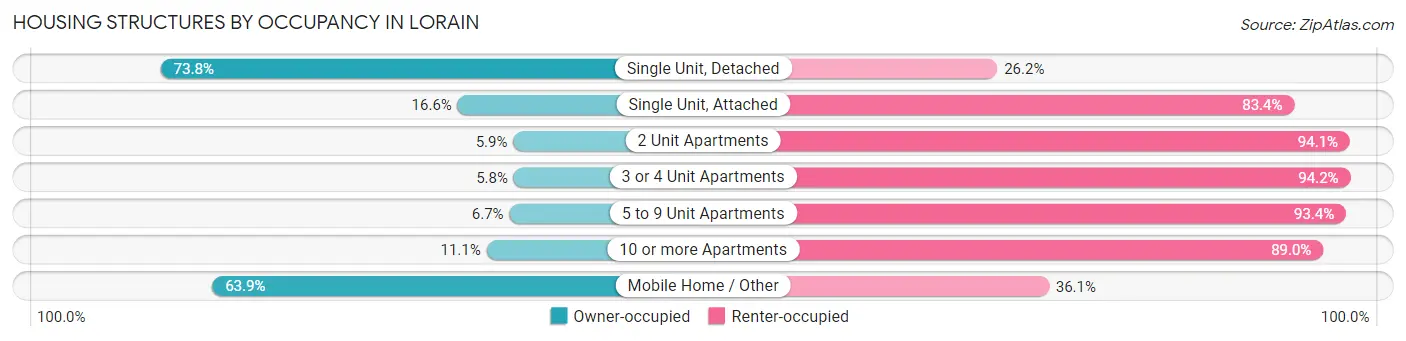
| Structure Type | Owner-occupied | Renter-occupied |
| Single Unit, Detached | 13,811 (73.8%) | 4,904 (26.2%) |
| Single Unit, Attached | 219 (16.6%) | 1,099 (83.4%) |
| 2 Unit Apartments | 79 (5.9%) | 1,257 (94.1%) |
| 3 or 4 Unit Apartments | 53 (5.8%) | 859 (94.2%) |
| 5 to 9 Unit Apartments | 82 (6.7%) | 1,151 (93.3%) |
| 10 or more Apartments | 332 (11.1%) | 2,673 (88.9%) |
| Mobile Home / Other | 228 (63.9%) | 129 (36.1%) |
| Total | 14,804 (55.1%) | 12,072 (44.9%) |
Housing Structures by Number of Rooms in Lorain
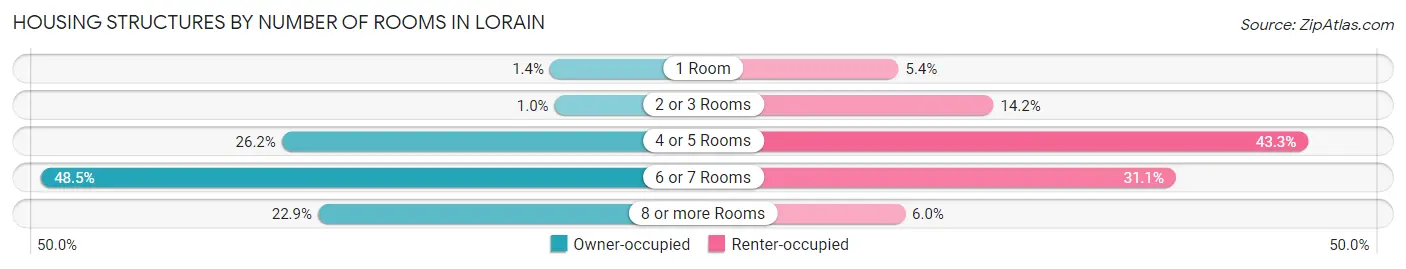
| Number of Rooms | Owner-occupied | Renter-occupied |
| 1 Room | 212 (1.4%) | 654 (5.4%) |
| 2 or 3 Rooms | 148 (1.0%) | 1,715 (14.2%) |
| 4 or 5 Rooms | 3,883 (26.2%) | 5,226 (43.3%) |
| 6 or 7 Rooms | 7,174 (48.5%) | 3,749 (31.1%) |
| 8 or more Rooms | 3,387 (22.9%) | 728 (6.0%) |
| Total | 14,804 (100.0%) | 12,072 (100.0%) |
Housing Structure by Heating Type in Lorain
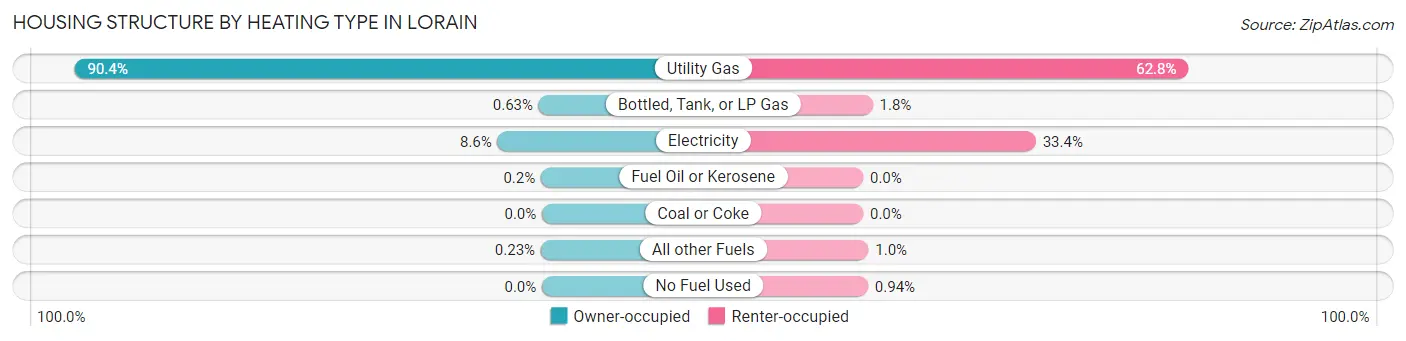
| Heating Type | Owner-occupied | Renter-occupied |
| Utility Gas | 13,376 (90.3%) | 7,586 (62.8%) |
| Bottled, Tank, or LP Gas | 93 (0.6%) | 222 (1.8%) |
| Electricity | 1,271 (8.6%) | 4,028 (33.4%) |
| Fuel Oil or Kerosene | 30 (0.2%) | 0 (0.0%) |
| Coal or Coke | 0 (0.0%) | 0 (0.0%) |
| All other Fuels | 34 (0.2%) | 123 (1.0%) |
| No Fuel Used | 0 (0.0%) | 113 (0.9%) |
| Total | 14,804 (100.0%) | 12,072 (100.0%) |
Household Vehicle Usage in Lorain
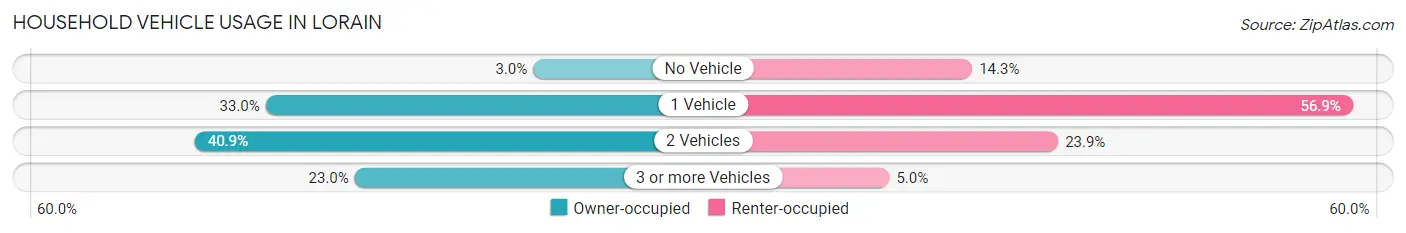
| Vehicles per Household | Owner-occupied | Renter-occupied |
| No Vehicle | 450 (3.0%) | 1,721 (14.3%) |
| 1 Vehicle | 4,886 (33.0%) | 6,865 (56.9%) |
| 2 Vehicles | 6,059 (40.9%) | 2,884 (23.9%) |
| 3 or more Vehicles | 3,409 (23.0%) | 602 (5.0%) |
| Total | 14,804 (100.0%) | 12,072 (100.0%) |
Real Estate & Mortgages in Lorain
Real Estate and Mortgage Overview in Lorain
| Characteristic | Without Mortgage | With Mortgage |
| Housing Units | 6,438 | 8,366 |
| Median Property Value | $100,500 | $125,000 |
| Median Household Income | $50,337 | $972 |
| Monthly Housing Costs | $469 | $90 |
| Real Estate Taxes | $1,438 | $315 |
Property Value by Mortgage Status in Lorain
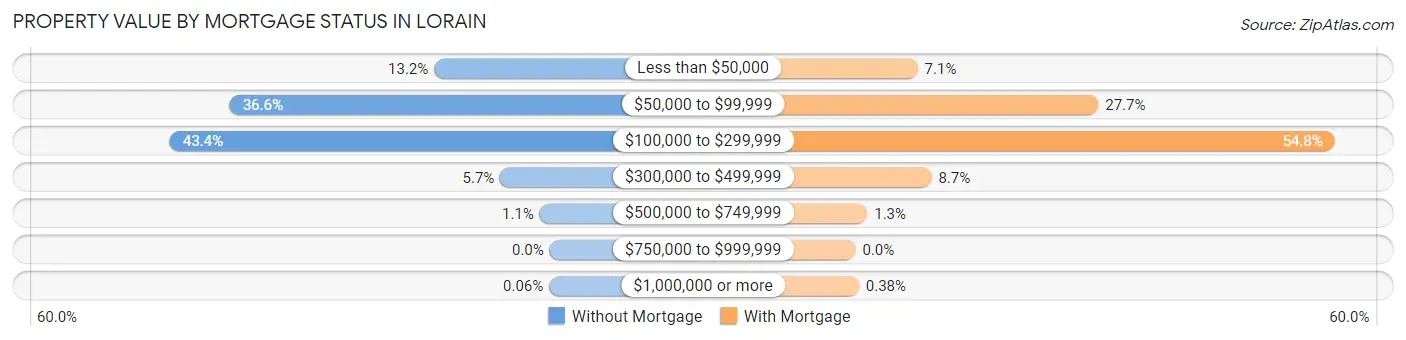
| Property Value | Without Mortgage | With Mortgage |
| Less than $50,000 | 850 (13.2%) | 594 (7.1%) |
| $50,000 to $99,999 | 2,353 (36.5%) | 2,321 (27.7%) |
| $100,000 to $299,999 | 2,794 (43.4%) | 4,581 (54.8%) |
| $300,000 to $499,999 | 364 (5.7%) | 726 (8.7%) |
| $500,000 to $749,999 | 73 (1.1%) | 112 (1.3%) |
| $750,000 to $999,999 | 0 (0.0%) | 0 (0.0%) |
| $1,000,000 or more | 4 (0.1%) | 32 (0.4%) |
| Total | 6,438 (100.0%) | 8,366 (100.0%) |
Household Income by Mortgage Status in Lorain
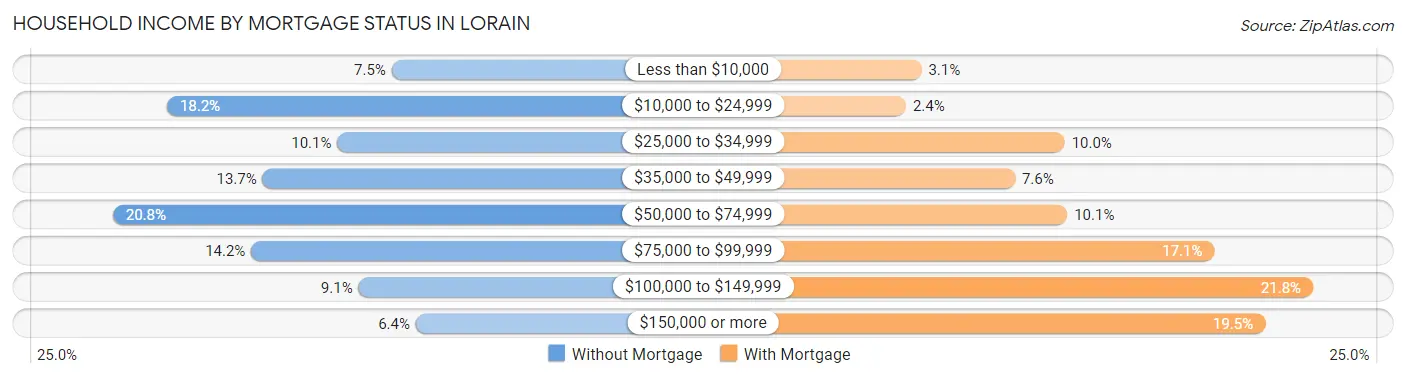
| Household Income | Without Mortgage | With Mortgage |
| Less than $10,000 | 484 (7.5%) | 263 (3.1%) |
| $10,000 to $24,999 | 1,173 (18.2%) | 201 (2.4%) |
| $25,000 to $34,999 | 651 (10.1%) | 833 (10.0%) |
| $35,000 to $49,999 | 880 (13.7%) | 635 (7.6%) |
| $50,000 to $74,999 | 1,339 (20.8%) | 843 (10.1%) |
| $75,000 to $99,999 | 915 (14.2%) | 1,429 (17.1%) |
| $100,000 to $149,999 | 586 (9.1%) | 1,822 (21.8%) |
| $150,000 or more | 410 (6.4%) | 1,631 (19.5%) |
| Total | 6,438 (100.0%) | 8,366 (100.0%) |
Property Value to Household Income Ratio in Lorain
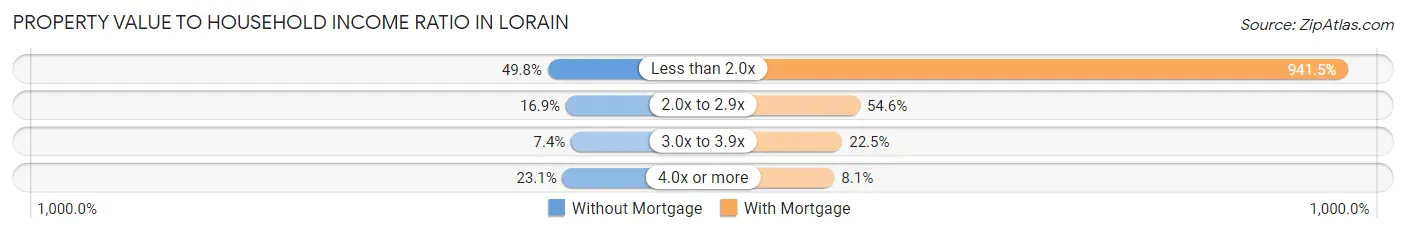
| Value-to-Income Ratio | Without Mortgage | With Mortgage |
| Less than 2.0x | 3,204 (49.8%) | 78,767 (941.5%) |
| 2.0x to 2.9x | 1,087 (16.9%) | 4,568 (54.6%) |
| 3.0x to 3.9x | 476 (7.4%) | 1,885 (22.5%) |
| 4.0x or more | 1,487 (23.1%) | 681 (8.1%) |
| Total | 6,438 (100.0%) | 8,366 (100.0%) |
Real Estate Taxes by Mortgage Status in Lorain
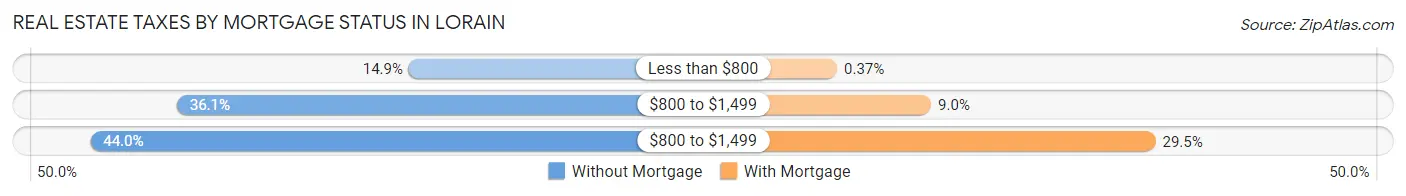
| Property Taxes | Without Mortgage | With Mortgage |
| Less than $800 | 960 (14.9%) | 31 (0.4%) |
| $800 to $1,499 | 2,324 (36.1%) | 750 (9.0%) |
| $800 to $1,499 | 2,833 (44.0%) | 2,464 (29.4%) |
| Total | 6,438 (100.0%) | 8,366 (100.0%) |
Health & Disability in Lorain
Health Insurance Coverage by Age in Lorain
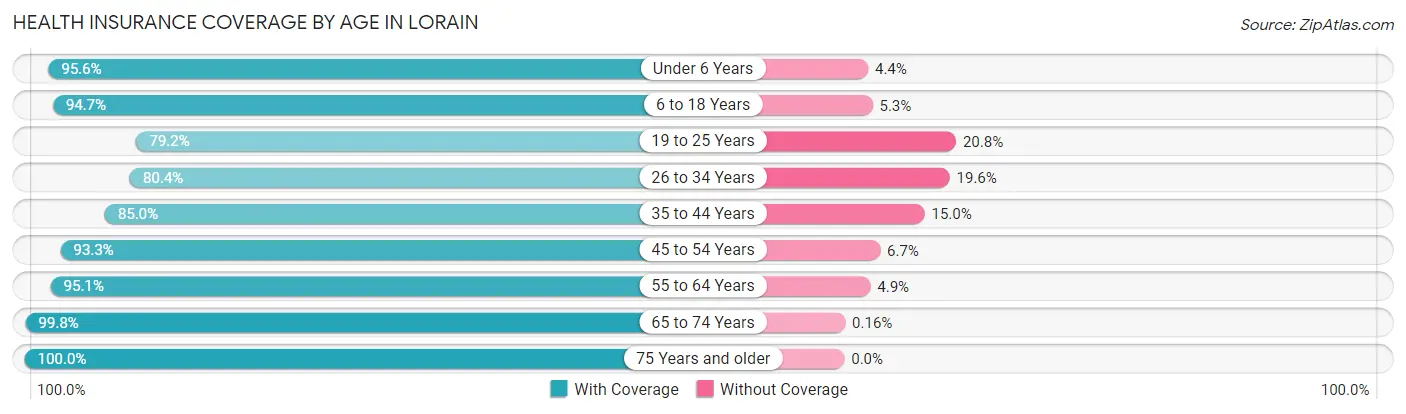
| Age Bracket | With Coverage | Without Coverage |
| Under 6 Years | 5,627 (95.6%) | 261 (4.4%) |
| 6 to 18 Years | 10,297 (94.7%) | 573 (5.3%) |
| 19 to 25 Years | 4,937 (79.2%) | 1,299 (20.8%) |
| 26 to 34 Years | 5,537 (80.4%) | 1,353 (19.6%) |
| 35 to 44 Years | 6,697 (85.0%) | 1,179 (15.0%) |
| 45 to 54 Years | 6,988 (93.3%) | 500 (6.7%) |
| 55 to 64 Years | 8,527 (95.1%) | 436 (4.9%) |
| 65 to 74 Years | 6,199 (99.8%) | 10 (0.2%) |
| 75 Years and older | 4,351 (100.0%) | 0 (0.0%) |
| Total | 59,160 (91.3%) | 5,611 (8.7%) |
Health Insurance Coverage by Citizenship Status in Lorain
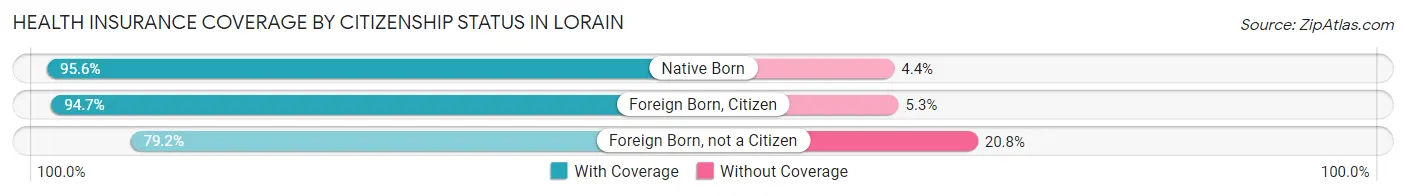
| Citizenship Status | With Coverage | Without Coverage |
| Native Born | 5,627 (95.6%) | 261 (4.4%) |
| Foreign Born, Citizen | 10,297 (94.7%) | 573 (5.3%) |
| Foreign Born, not a Citizen | 4,937 (79.2%) | 1,299 (20.8%) |
Health Insurance Coverage by Household Income in Lorain
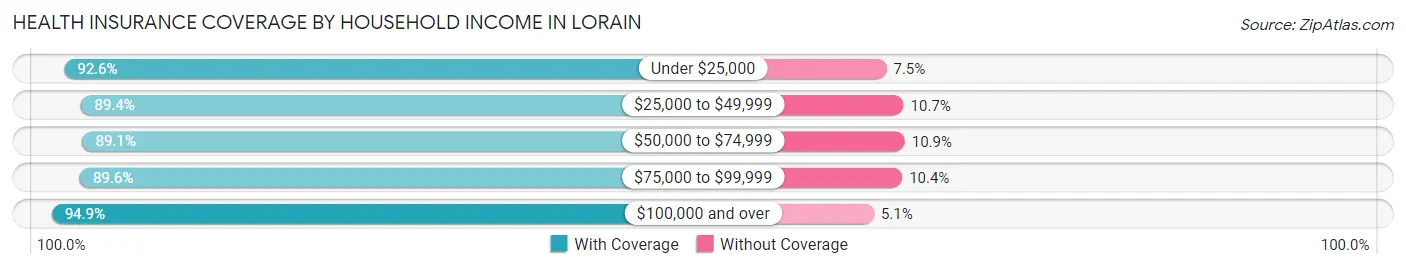
| Household Income | With Coverage | Without Coverage |
| Under $25,000 | 13,297 (92.5%) | 1,070 (7.4%) |
| $25,000 to $49,999 | 12,940 (89.3%) | 1,542 (10.6%) |
| $50,000 to $74,999 | 9,906 (89.1%) | 1,208 (10.9%) |
| $75,000 to $99,999 | 9,025 (89.6%) | 1,045 (10.4%) |
| $100,000 and over | 13,728 (94.9%) | 736 (5.1%) |
Public vs Private Health Insurance Coverage by Age in Lorain
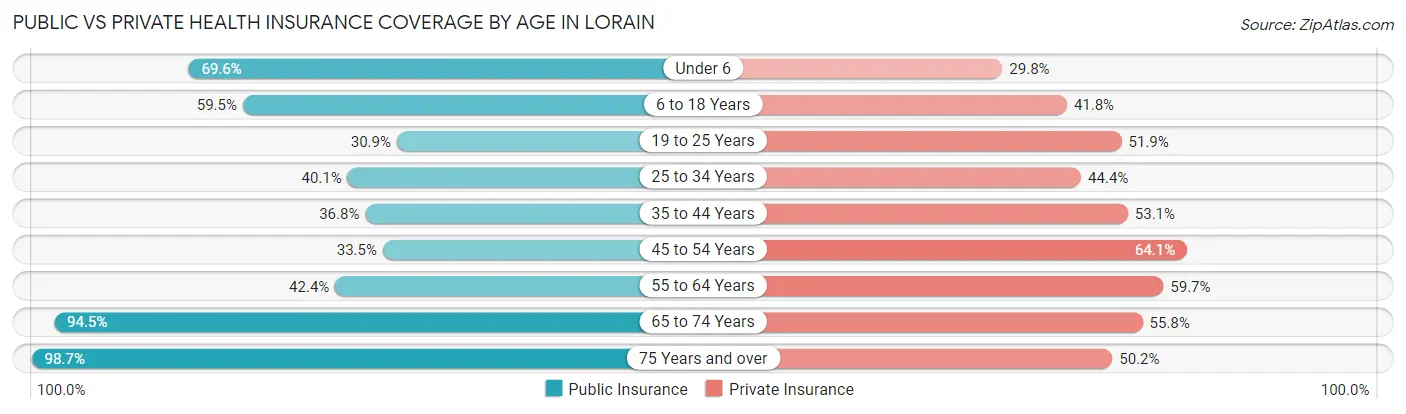
| Age Bracket | Public Insurance | Private Insurance |
| Under 6 | 4,097 (69.6%) | 1,755 (29.8%) |
| 6 to 18 Years | 6,468 (59.5%) | 4,543 (41.8%) |
| 19 to 25 Years | 1,928 (30.9%) | 3,239 (51.9%) |
| 25 to 34 Years | 2,760 (40.1%) | 3,061 (44.4%) |
| 35 to 44 Years | 2,896 (36.8%) | 4,182 (53.1%) |
| 45 to 54 Years | 2,509 (33.5%) | 4,798 (64.1%) |
| 55 to 64 Years | 3,797 (42.4%) | 5,350 (59.7%) |
| 65 to 74 Years | 5,869 (94.5%) | 3,467 (55.8%) |
| 75 Years and over | 4,295 (98.7%) | 2,185 (50.2%) |
| Total | 34,619 (53.4%) | 32,580 (50.3%) |
Disability Status by Sex by Age in Lorain
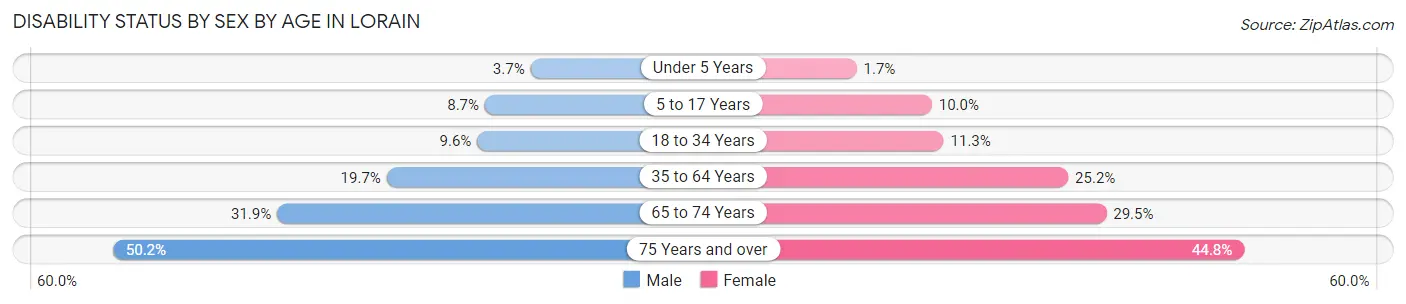
| Age Bracket | Male | Female |
| Under 5 Years | 90 (3.7%) | 41 (1.7%) |
| 5 to 17 Years | 521 (8.7%) | 511 (10.0%) |
| 18 to 34 Years | 646 (9.6%) | 811 (11.3%) |
| 35 to 64 Years | 2,273 (19.7%) | 3,221 (25.2%) |
| 65 to 74 Years | 981 (31.9%) | 923 (29.5%) |
| 75 Years and over | 894 (50.2%) | 1,151 (44.8%) |
Disability Class by Sex by Age in Lorain
Disability Class: Hearing Difficulty
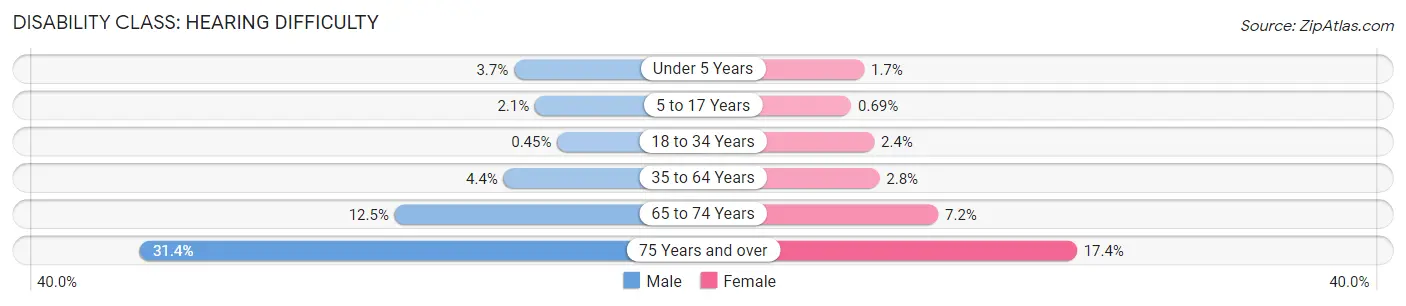
| Age Bracket | Male | Female |
| Under 5 Years | 90 (3.7%) | 41 (1.7%) |
| 5 to 17 Years | 125 (2.1%) | 35 (0.7%) |
| 18 to 34 Years | 30 (0.4%) | 172 (2.4%) |
| 35 to 64 Years | 512 (4.4%) | 357 (2.8%) |
| 65 to 74 Years | 385 (12.5%) | 224 (7.1%) |
| 75 Years and over | 560 (31.4%) | 448 (17.4%) |
Disability Class: Vision Difficulty
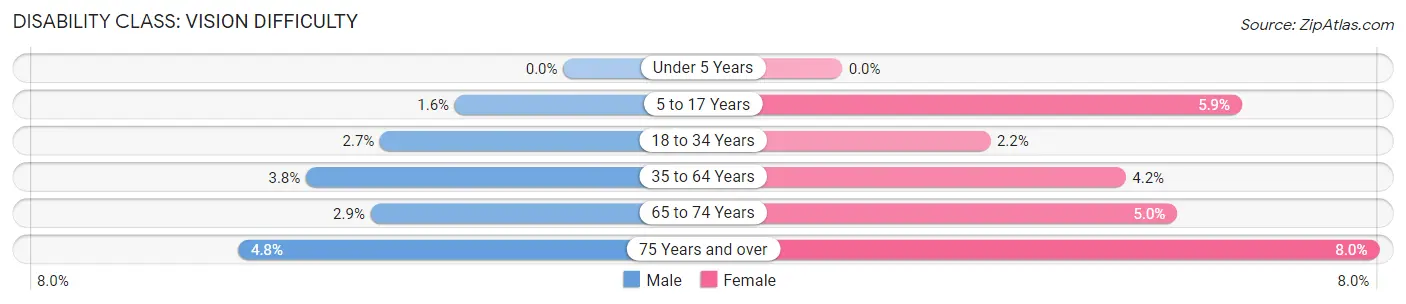
| Age Bracket | Male | Female |
| Under 5 Years | 0 (0.0%) | 0 (0.0%) |
| 5 to 17 Years | 96 (1.6%) | 303 (5.9%) |
| 18 to 34 Years | 183 (2.7%) | 157 (2.2%) |
| 35 to 64 Years | 441 (3.8%) | 538 (4.2%) |
| 65 to 74 Years | 88 (2.9%) | 156 (5.0%) |
| 75 Years and over | 86 (4.8%) | 205 (8.0%) |
Disability Class: Cognitive Difficulty
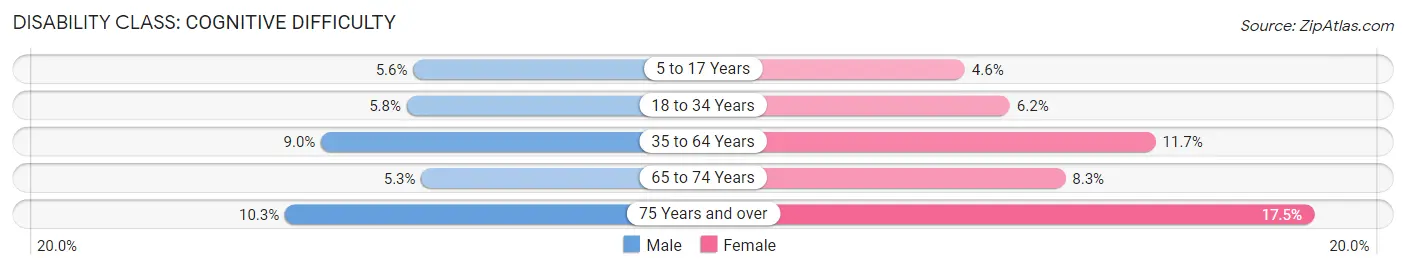
| Age Bracket | Male | Female |
| 5 to 17 Years | 332 (5.6%) | 233 (4.6%) |
| 18 to 34 Years | 391 (5.8%) | 446 (6.2%) |
| 35 to 64 Years | 1,038 (9.0%) | 1,488 (11.7%) |
| 65 to 74 Years | 162 (5.3%) | 260 (8.3%) |
| 75 Years and over | 184 (10.3%) | 450 (17.5%) |
Disability Class: Ambulatory Difficulty
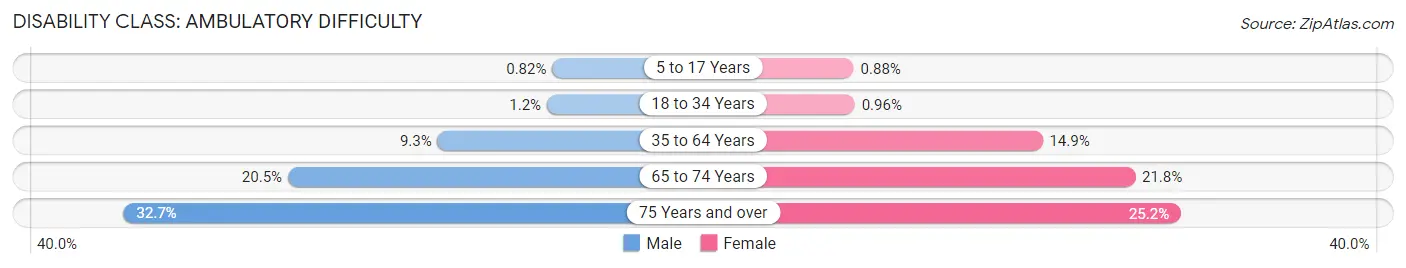
| Age Bracket | Male | Female |
| 5 to 17 Years | 49 (0.8%) | 45 (0.9%) |
| 18 to 34 Years | 82 (1.2%) | 69 (1.0%) |
| 35 to 64 Years | 1,079 (9.3%) | 1,903 (14.9%) |
| 65 to 74 Years | 629 (20.4%) | 682 (21.8%) |
| 75 Years and over | 582 (32.7%) | 647 (25.2%) |
Disability Class: Self-Care Difficulty
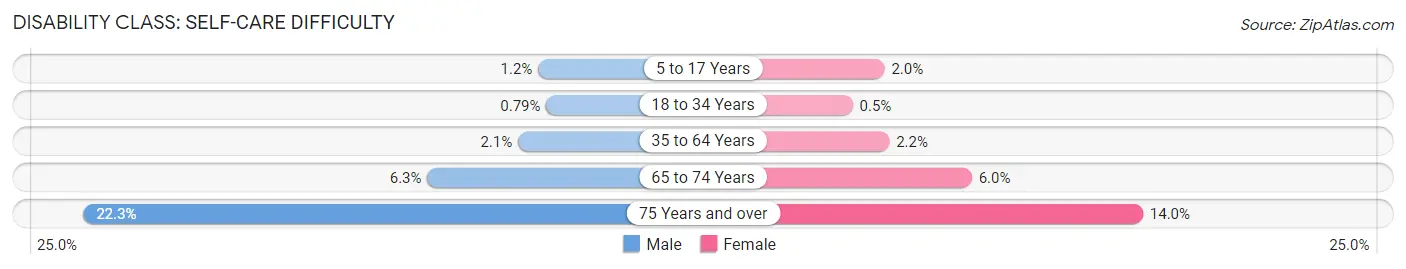
| Age Bracket | Male | Female |
| 5 to 17 Years | 70 (1.2%) | 101 (2.0%) |
| 18 to 34 Years | 53 (0.8%) | 36 (0.5%) |
| 35 to 64 Years | 243 (2.1%) | 281 (2.2%) |
| 65 to 74 Years | 194 (6.3%) | 189 (6.0%) |
| 75 Years and over | 397 (22.3%) | 359 (14.0%) |
Technology Access in Lorain
Computing Device Access in Lorain
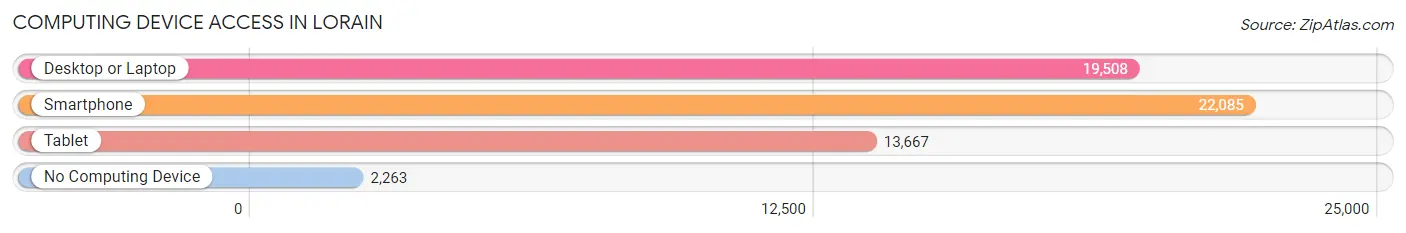
| Device Type | # Households | % Households |
| Desktop or Laptop | 19,508 | 72.6% |
| Smartphone | 22,085 | 82.2% |
| Tablet | 13,667 | 50.8% |
| No Computing Device | 2,263 | 8.4% |
| Total | 26,876 | 100.0% |
Internet Access in Lorain
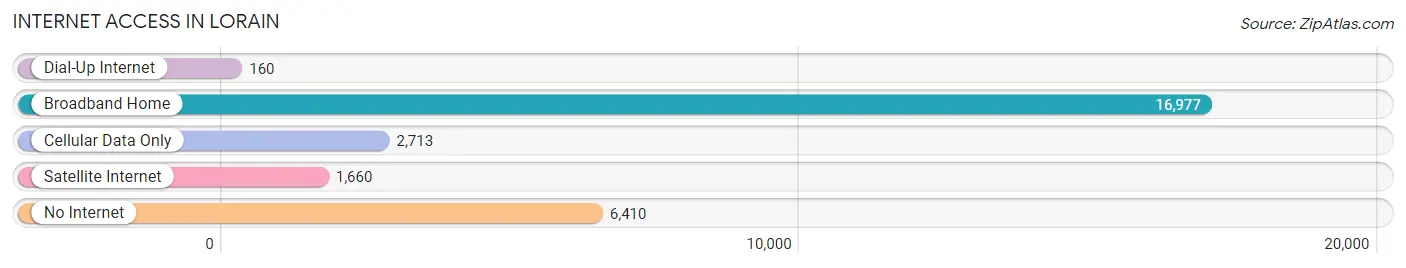
| Internet Type | # Households | % Households |
| Dial-Up Internet | 160 | 0.6% |
| Broadband Home | 16,977 | 63.2% |
| Cellular Data Only | 2,713 | 10.1% |
| Satellite Internet | 1,660 | 6.2% |
| No Internet | 6,410 | 23.8% |
| Total | 26,876 | 100.0% |
Lorain Summary
Lorain, Ohio is a city located in the northeastern part of the state, on the southern shore of Lake Erie. It is part of the Greater Cleveland metropolitan area and is the largest city in Lorain County. The city has a population of approximately 64,000 people, making it the tenth largest city in Ohio.
Geography
Lorain is located in the northeastern part of Ohio, on the southern shore of Lake Erie. It is situated on the Black River, which flows into the lake. The city is bordered by the cities of Elyria and Amherst to the east, Avon Lake to the south, and Sheffield Lake to the west. The city covers an area of approximately 20 square miles.
History
The area that is now Lorain was first settled in 1807 by a group of settlers from Connecticut. The settlement was originally known as Charleston, but was later renamed Lorain in 1834 after the French explorer, Jean-Baptiste-Louis Franquelin. The city was officially incorporated in 1874.
In the late 19th century, Lorain became an important port city, with a large steel mill and other industries. The city was also home to a large immigrant population, with many coming from Eastern Europe and Italy. The city experienced a period of growth and prosperity in the early 20th century, but the Great Depression and World War II caused a decline in the city's economy.
Economy
Lorain's economy is largely based on manufacturing and services. The city is home to several large manufacturing companies, including U.S. Steel, Ford Motor Company, and General Motors. The city is also home to several healthcare providers, including Mercy Health and University Hospitals.
The city's unemployment rate was 5.2% in 2019, slightly higher than the national average of 3.7%. The median household income in Lorain was $37,845 in 2019, slightly lower than the national median of $61,937.
Demographics
As of 2019, the population of Lorain was 64,097, making it the tenth largest city in Ohio. The population is largely white (77.2%), with smaller percentages of African Americans (14.2%), Hispanics (5.3%), and Asians (2.2%). The median age in Lorain is 40.3, slightly higher than the national median of 38.2.
The city has a poverty rate of 22.2%, higher than the national average of 11.8%. The largest industries in Lorain are manufacturing (17.2%), healthcare (13.2%), and retail trade (10.2%).
Conclusion
Lorain, Ohio is a city located in the northeastern part of the state, on the southern shore of Lake Erie. It is part of the Greater Cleveland metropolitan area and is the largest city in Lorain County. The city has a population of approximately 64,000 people, making it the tenth largest city in Ohio. The city's economy is largely based on manufacturing and services, and the city has a poverty rate of 22.2%. The population is largely white, with smaller percentages of African Americans, Hispanics, and Asians.
Common Questions
What is Per Capita Income in Lorain?
Per Capita income in Lorain is $25,637.
What is the Median Family Income in Lorain?
Median Family Income in Lorain is $60,457.
What is the Median Household income in Lorain?
Median Household Income in Lorain is $46,562.
What is Income or Wage Gap in Lorain?
Income or Wage Gap in Lorain is 28.9%.
Women in Lorain earn 71.1 cents for every dollar earned by a man.
What is Family Income Deficit in Lorain?
Family Income Deficit in Lorain is $11,769.
Families that are below poverty line in Lorain earn $11,769 less on average than the poverty threshold level.
What is Inequality or Gini Index in Lorain?
Inequality or Gini Index in Lorain is 0.47.
What is the Total Population of Lorain?
Total Population of Lorain is 65,138.
What is the Total Male Population of Lorain?
Total Male Population of Lorain is 31,755.
What is the Total Female Population of Lorain?
Total Female Population of Lorain is 33,383.
What is the Ratio of Males per 100 Females in Lorain?
There are 95.12 Males per 100 Females in Lorain.
What is the Ratio of Females per 100 Males in Lorain?
There are 105.13 Females per 100 Males in Lorain.
What is the Median Population Age in Lorain?
Median Population Age in Lorain is 38.5 Years.
What is the Average Family Size in Lorain
Average Family Size in Lorain is 3.2 People.
What is the Average Household Size in Lorain
Average Household Size in Lorain is 2.4 People.
How Large is the Labor Force in Lorain?
There are 28,872 People in the Labor Forcein in Lorain.
What is the Percentage of People in the Labor Force in Lorain?
56.8% of People are in the Labor Force in Lorain.
What is the Unemployment Rate in Lorain?
Unemployment Rate in Lorain is 6.2%.