Zip Codes with the Highest Percentage of Households with Income Below $10,000 in Akron, OH
RELATED REPORTS & OPTIONS
Household Income | $0-10k
Akron
Compare Zip Codes
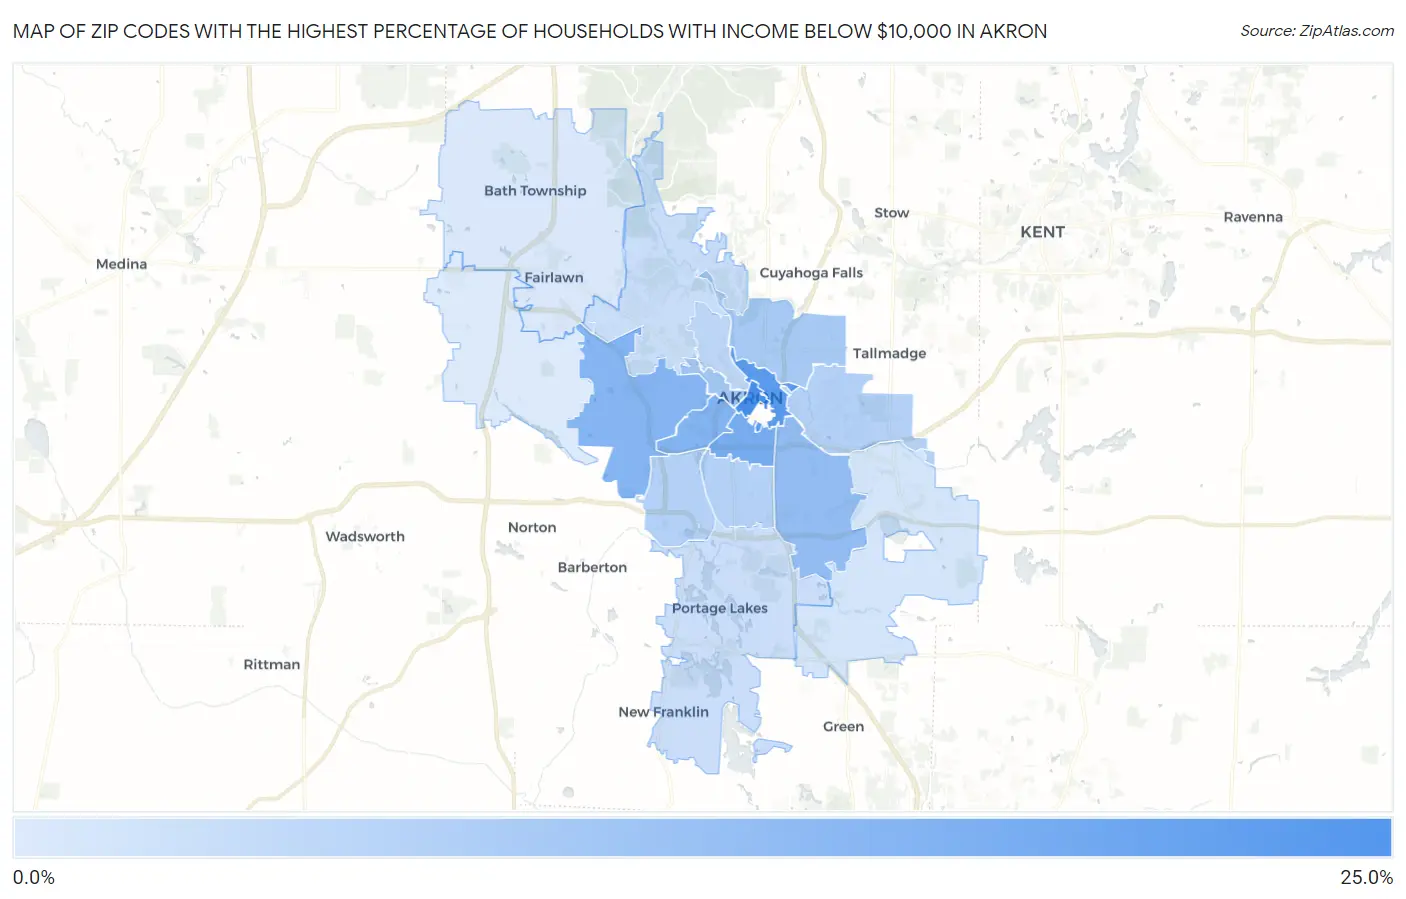
Map of Zip Codes with the Highest Percentage of Households with Income Below $10,000 in Akron
1.8%
21.8%
Zip Codes with the Highest Percentage of Households with Income Below $10,000 in Akron, OH
| Zip Code | Households with Income < $10k | vs State | vs National | |
| 1. | 44308 | 21.8% | 5.2%(+16.6)#13 | 4.9%(+16.9)#648 |
| 2. | 44304 | 19.1% | 5.2%(+13.9)#19 | 4.9%(+14.2)#894 |
| 3. | 44311 | 14.8% | 5.2%(+9.60)#46 | 4.9%(+9.90)#1,568 |
| 4. | 44307 | 13.5% | 5.2%(+8.30)#56 | 4.9%(+8.60)#1,917 |
| 5. | 44320 | 13.2% | 5.2%(+8.00)#62 | 4.9%(+8.30)#1,998 |
| 6. | 44306 | 11.1% | 5.2%(+5.90)#93 | 4.9%(+6.20)#2,886 |
| 7. | 44302 | 9.1% | 5.2%(+3.90)#144 | 4.9%(+4.20)#4,328 |
| 8. | 44310 | 8.4% | 5.2%(+3.20)#163 | 4.9%(+3.50)#5,035 |
| 9. | 44301 | 7.0% | 5.2%(+1.80)#237 | 4.9%(+2.10)#6,986 |
| 10. | 44305 | 6.9% | 5.2%(+1.70)#245 | 4.9%(+2.00)#7,123 |
| 11. | 44314 | 6.9% | 5.2%(+1.70)#247 | 4.9%(+2.00)#7,131 |
| 12. | 44303 | 5.7% | 5.2%(+0.500)#346 | 4.9%(+0.800)#9,785 |
| 13. | 44313 | 4.5% | 5.2%(-0.700)#459 | 4.9%(-0.400)#13,373 |
| 14. | 44319 | 4.1% | 5.2%(-1.10)#529 | 4.9%(-0.800)#14,891 |
| 15. | 44312 | 2.9% | 5.2%(-2.30)#696 | 4.9%(-2.00)#19,830 |
| 16. | 44333 | 2.0% | 5.2%(-3.20)#841 | 4.9%(-2.90)#23,653 |
| 17. | 44321 | 1.8% | 5.2%(-3.40)#865 | 4.9%(-3.10)#24,403 |
1
Common Questions
What are the Top 10 Zip Codes with the Highest Percentage of Households with Income Below $10,000 in Akron, OH?
Top 10 Zip Codes with the Highest Percentage of Households with Income Below $10,000 in Akron, OH are:
What zip code has the Highest Percentage of Households with Income Below $10,000 in Akron, OH?
44308 has the Highest Percentage of Households with Income Below $10,000 in Akron, OH with 21.8%.
What is the Percentage of Households with Income Below $10,000 in Akron, OH?
Percentage of Households with Income Below $10,000 in Akron is 8.2%.
What is the Percentage of Households with Income Below $10,000 in Ohio?
Percentage of Households with Income Below $10,000 in Ohio is 5.2%.
What is the Percentage of Households with Income Below $10,000 in the United States?
Percentage of Households with Income Below $10,000 in the United States is 4.9%.