Zip Codes with the Highest Percentage of Households with Income Below $10,000 in Springfield, OH
RELATED REPORTS & OPTIONS
Household Income | $0-10k
Springfield
Compare Zip Codes
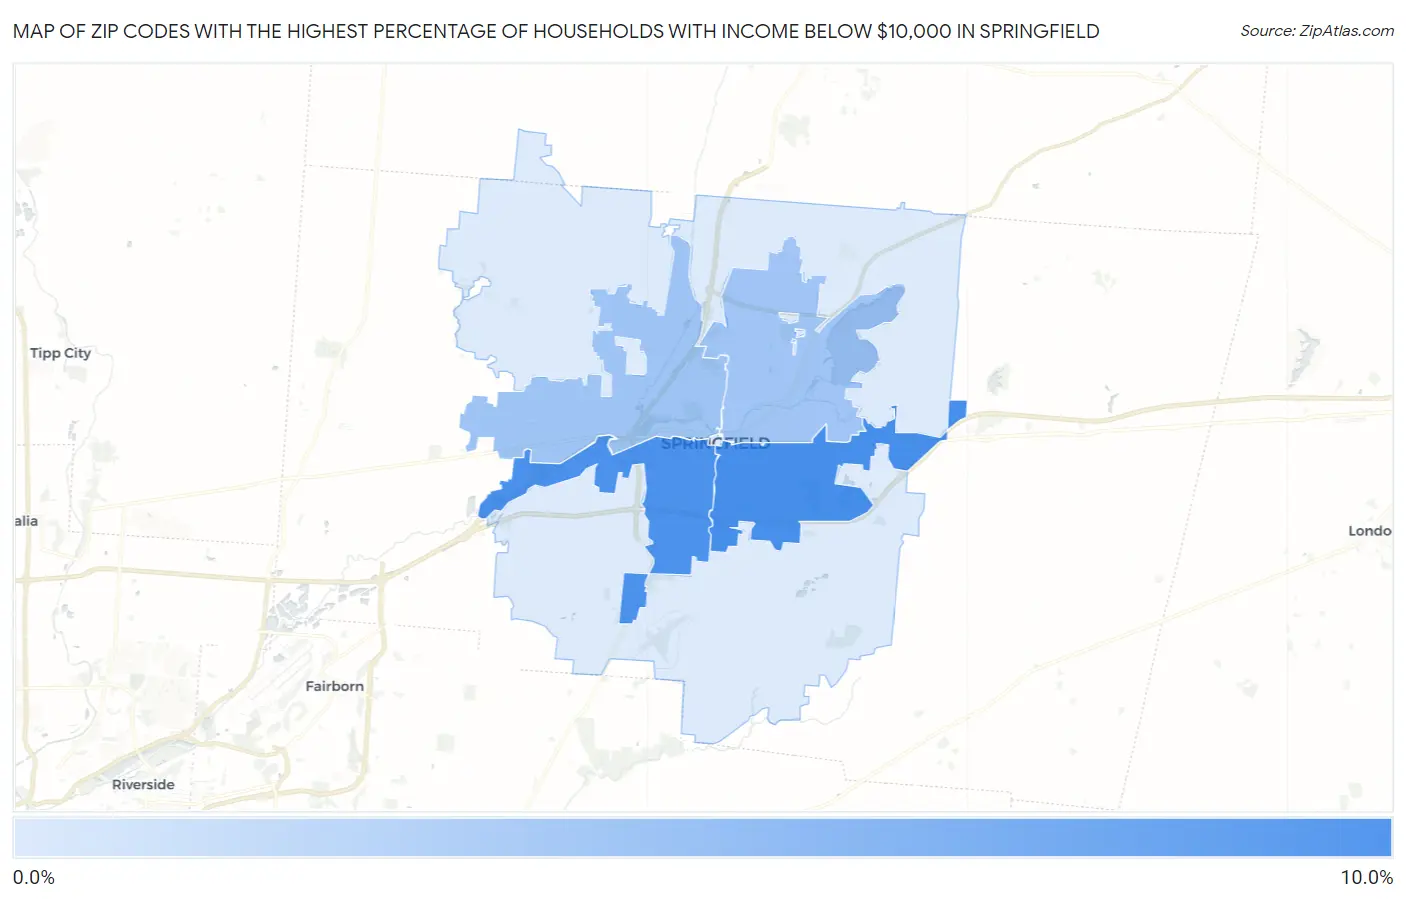
Map of Zip Codes with the Highest Percentage of Households with Income Below $10,000 in Springfield
1.7%
9.0%
Zip Codes with the Highest Percentage of Households with Income Below $10,000 in Springfield, OH
| Zip Code | Households with Income < $10k | vs State | vs National | |
| 1. | 45505 | 9.0% | 5.2%(+3.80)#147 | 4.9%(+4.10)#4,411 |
| 2. | 45506 | 8.8% | 5.2%(+3.60)#154 | 4.9%(+3.90)#4,625 |
| 3. | 45504 | 4.7% | 5.2%(-0.500)#440 | 4.9%(-0.200)#12,716 |
| 4. | 45503 | 4.6% | 5.2%(-0.600)#448 | 4.9%(-0.300)#13,009 |
| 5. | 45502 | 1.7% | 5.2%(-3.50)#883 | 4.9%(-3.20)#24,757 |
1
Common Questions
What are the Top 3 Zip Codes with the Highest Percentage of Households with Income Below $10,000 in Springfield, OH?
Top 3 Zip Codes with the Highest Percentage of Households with Income Below $10,000 in Springfield, OH are:
What zip code has the Highest Percentage of Households with Income Below $10,000 in Springfield, OH?
45505 has the Highest Percentage of Households with Income Below $10,000 in Springfield, OH with 9.0%.
What is the Percentage of Households with Income Below $10,000 in Springfield, OH?
Percentage of Households with Income Below $10,000 in Springfield is 7.9%.
What is the Percentage of Households with Income Below $10,000 in Ohio?
Percentage of Households with Income Below $10,000 in Ohio is 5.2%.
What is the Percentage of Households with Income Below $10,000 in the United States?
Percentage of Households with Income Below $10,000 in the United States is 4.9%.