Zip Codes with the Highest Percentage of Population Employed in Architecture & Engineering in Akron, OH
RELATED REPORTS & OPTIONS
Architecture & Engineering
Akron
Compare Zip Codes
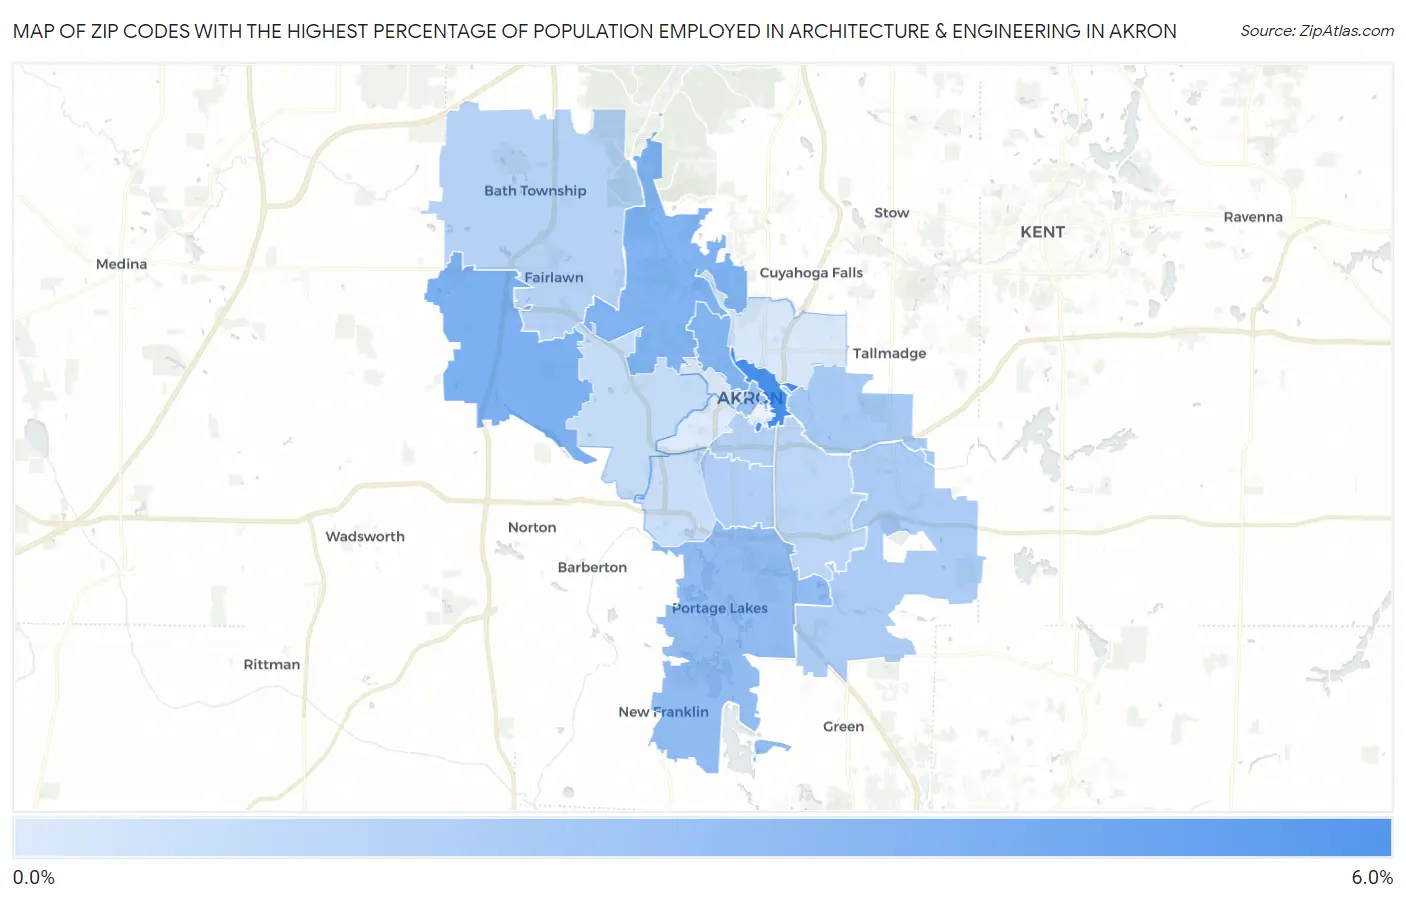
Map of Zip Codes with the Highest Percentage of Population Employed in Architecture & Engineering in Akron
0.28%
5.3%
Zip Codes with the Highest Percentage of Population Employed in Architecture & Engineering in Akron, OH
| Zip Code | % Employed | vs State | vs National | |
| 1. | 44304 | 5.3% | 2.1%(+3.19)#52 | 2.1%(+3.17)#1,434 |
| 2. | 44321 | 3.5% | 2.1%(+1.35)#162 | 2.1%(+1.33)#3,777 |
| 3. | 44313 | 3.3% | 2.1%(+1.20)#171 | 2.1%(+1.18)#4,111 |
| 4. | 44303 | 3.3% | 2.1%(+1.12)#182 | 2.1%(+1.11)#4,309 |
| 5. | 44319 | 2.8% | 2.1%(+0.674)#250 | 2.1%(+0.659)#5,762 |
| 6. | 44308 | 2.4% | 2.1%(+0.274)#331 | 2.1%(+0.259)#7,448 |
| 7. | 44305 | 2.0% | 2.1%(-0.109)#417 | 2.1%(-0.125)#9,457 |
| 8. | 44312 | 1.9% | 2.1%(-0.262)#454 | 2.1%(-0.277)#10,422 |
| 9. | 44301 | 1.7% | 2.1%(-0.411)#500 | 2.1%(-0.426)#11,341 |
| 10. | 44311 | 1.6% | 2.1%(-0.505)#510 | 2.1%(-0.520)#11,985 |
| 11. | 44333 | 1.6% | 2.1%(-0.570)#535 | 2.1%(-0.586)#12,428 |
| 12. | 44306 | 1.3% | 2.1%(-0.795)#602 | 2.1%(-0.810)#14,035 |
| 13. | 44320 | 1.0% | 2.1%(-1.10)#699 | 2.1%(-1.12)#16,395 |
| 14. | 44314 | 0.94% | 2.1%(-1.20)#719 | 2.1%(-1.21)#17,063 |
| 15. | 44310 | 0.44% | 2.1%(-1.69)#853 | 2.1%(-1.71)#20,666 |
| 16. | 44302 | 0.39% | 2.1%(-1.74)#865 | 2.1%(-1.75)#20,999 |
| 17. | 44307 | 0.28% | 2.1%(-1.85)#888 | 2.1%(-1.87)#21,664 |
1
Common Questions
What are the Top 10 Zip Codes with the Highest Percentage of Population Employed in Architecture & Engineering in Akron, OH?
Top 10 Zip Codes with the Highest Percentage of Population Employed in Architecture & Engineering in Akron, OH are:
What zip code has the Highest Percentage of Population Employed in Architecture & Engineering in Akron, OH?
44304 has the Highest Percentage of Population Employed in Architecture & Engineering in Akron, OH with 5.3%.
What is the Percentage of Population Employed in Architecture & Engineering in Akron, OH?
Percentage of Population Employed in Architecture & Engineering in Akron is 1.7%.
What is the Percentage of Population Employed in Architecture & Engineering in Ohio?
Percentage of Population Employed in Architecture & Engineering in Ohio is 2.1%.
What is the Percentage of Population Employed in Architecture & Engineering in the United States?
Percentage of Population Employed in Architecture & Engineering in the United States is 2.1%.