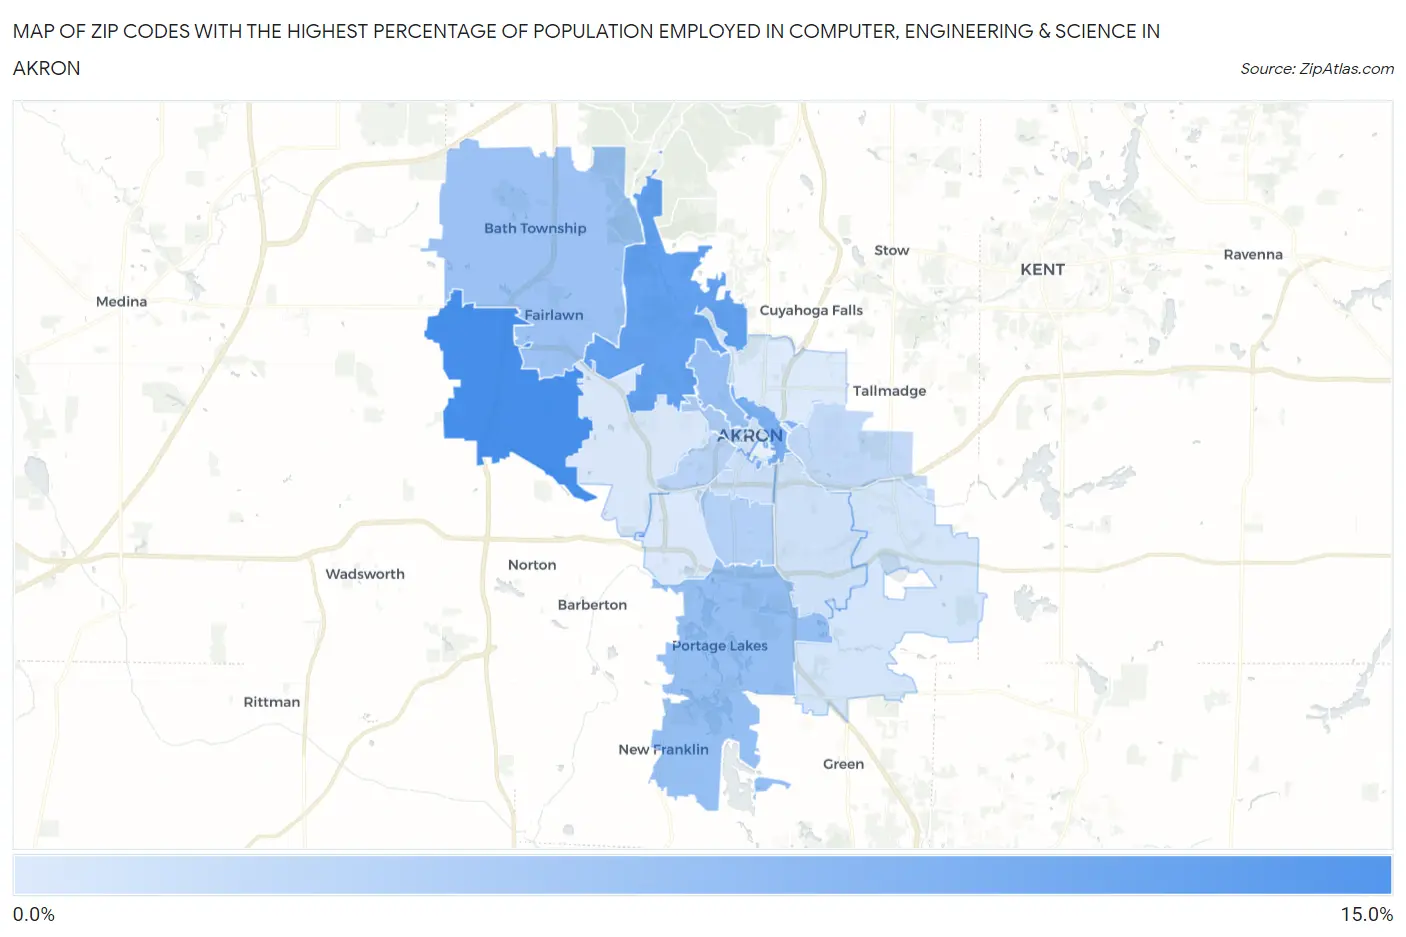
Zip Codes with the Highest Percentage of Population Employed in Computer, Engineering & Science in Akron, OH
RELATED REPORTS & OPTIONS
Computer, Engineering & Science
Akron
Compare Zip Codes
Map of Zip Codes with the Highest Percentage of Population Employed in Computer, Engineering & Science in Akron
2.7%
11.2%
Zip Codes with the Highest Percentage of Population Employed in Computer, Engineering & Science in Akron, OH
| Zip Code | % Employed | vs State | vs National | |
| 1. | 44321 | 11.2% | 6.1%(+5.15)#65 | 6.8%(+4.45)#2,451 |
| 2. | 44313 | 9.6% | 6.1%(+3.52)#98 | 6.8%(+2.82)#3,540 |
| 3. | 44304 | 8.1% | 6.1%(+2.06)#157 | 6.8%(+1.36)#5,085 |
| 4. | 44319 | 6.7% | 6.1%(+0.620)#246 | 6.8%(-0.079)#7,376 |
| 5. | 44303 | 6.6% | 6.1%(+0.520)#261 | 6.8%(-0.180)#7,561 |
| 6. | 44333 | 6.4% | 6.1%(+0.317)#277 | 6.8%(-0.383)#7,956 |
| 7. | 44302 | 5.5% | 6.1%(-0.582)#374 | 6.8%(-1.28)#10,114 |
| 8. | 44301 | 4.9% | 6.1%(-1.15)#424 | 6.8%(-1.85)#11,616 |
| 9. | 44307 | 4.7% | 6.1%(-1.33)#452 | 6.8%(-2.03)#12,119 |
| 10. | 44305 | 4.2% | 6.1%(-1.87)#525 | 6.8%(-2.57)#13,861 |
| 11. | 44311 | 3.7% | 6.1%(-2.33)#581 | 6.8%(-3.03)#15,342 |
| 12. | 44308 | 3.4% | 6.1%(-2.64)#635 | 6.8%(-3.34)#16,554 |
| 13. | 44306 | 3.4% | 6.1%(-2.68)#643 | 6.8%(-3.38)#16,702 |
| 14. | 44312 | 3.2% | 6.1%(-2.88)#670 | 6.8%(-3.58)#17,448 |
| 15. | 44320 | 3.0% | 6.1%(-3.08)#703 | 6.8%(-3.78)#18,148 |
| 16. | 44314 | 2.8% | 6.1%(-3.31)#738 | 6.8%(-4.01)#19,024 |
| 17. | 44310 | 2.7% | 6.1%(-3.38)#754 | 6.8%(-4.08)#19,318 |
1
Common Questions
What are the Top 10 Zip Codes with the Highest Percentage of Population Employed in Computer, Engineering & Science in Akron, OH?
Top 10 Zip Codes with the Highest Percentage of Population Employed in Computer, Engineering & Science in Akron, OH are:
What zip code has the Highest Percentage of Population Employed in Computer, Engineering & Science in Akron, OH?
44321 has the Highest Percentage of Population Employed in Computer, Engineering & Science in Akron, OH with 11.2%.
What is the Percentage of Population Employed in Computer, Engineering & Science in Akron, OH?
Percentage of Population Employed in Computer, Engineering & Science in Akron is 4.7%.
What is the Percentage of Population Employed in Computer, Engineering & Science in Ohio?
Percentage of Population Employed in Computer, Engineering & Science in Ohio is 6.1%.
What is the Percentage of Population Employed in Computer, Engineering & Science in the United States?
Percentage of Population Employed in Computer, Engineering & Science in the United States is 6.8%.