Zip Codes with the Highest Percentage of Families with Income Below $10,000 in Akron, OH

RELATED REPORTS & OPTIONS

Family Income | $0-10k
Population
Families and Households
Female Fertility
Female Fertility (Unmarried)
Race (Community Size)
Race (Percentage)
Ancestry (Community Size)
AfghanAfricanAmericanApacheArabArmenianAustrianBangladeshiBelgianBelizeanBhutaneseBlackfeetBrazilianBritishBurmeseCajunCanadianCelticCentral AmericanCentral American IndianCherokeeChippewaChoctawColombianCreekCroatianCubanCzechCzechoslovakianDanishDelawareDominicanDutchEastern EuropeanEcuadorianEgyptianEnglishEuropeanFinnishFrenchFrench CanadianGermanGhanaianGreekGuamanian / ChamorroGuatemalanHaitianHonduranHungarianIndian (Asian)IndonesianIranianIrishIroquoisItalianJamaicanJapaneseJordanianKenyanKoreanLebaneseLiberianLithuanianMacedonianMalaysianMexicanMexican American IndianMoroccanNative HawaiianNavajoNicaraguanNigerianNorthern EuropeanNorwegianPakistaniPalestinianPanamanianPennsylvania GermanPeruvianPolishPortuguesePuerto RicanRomanianRussianSamoanScandinavianScotch-IrishScottishSerbianSiouxSlavicSlovakSloveneSouth AmericanSpaniardSpanishSri LankanSubsaharan AfricanSwedishSwissSyrianThaiTurkishUkrainianWelshWest IndianYugoslavian
Ancestry (Percentage)
AfghanAfricanAmericanApacheArabArmenianAustrianBangladeshiBelgianBelizeanBhutaneseBlackfeetBrazilianBritishBurmeseCajunCanadianCelticCentral AmericanCentral American IndianCherokeeChippewaChoctawColombianCreekCroatianCubanCzechCzechoslovakianDanishDelawareDominicanDutchEastern EuropeanEcuadorianEgyptianEnglishEuropeanFinnishFrenchFrench CanadianGermanGhanaianGreekGuamanian / ChamorroGuatemalanHaitianHonduranHungarianIndian (Asian)IndonesianIranianIrishIroquoisItalianJamaicanJapaneseJordanianKenyanKoreanLebaneseLiberianLithuanianMacedonianMalaysianMexicanMexican American IndianMoroccanNative HawaiianNavajoNicaraguanNigerianNorthern EuropeanNorwegianPakistaniPalestinianPanamanianPennsylvania GermanPeruvianPolishPortuguesePuerto RicanRomanianRussianSamoanScandinavianScotch-IrishScottishSerbianSiouxSlavicSlovakSloveneSouth AmericanSpaniardSpanishSri LankanSubsaharan AfricanSwedishSwissSyrianThaiTurkishUkrainianWelshWest IndianYugoslavian
Immigrant Origin (Total)
Immigrant Origin (Percentage)
Income
Income (Families)
Income (Households)
Poverty
Poverty (Families)
Unemployment
Employment Occupations
Employment Industries
Employer Class
Commute Time
Commute Means
School Enrollment
Education by Degree Field
Occupancy
Finances
Physical Characteristics
Akron
Compare Zip Codes
Comparison Subject

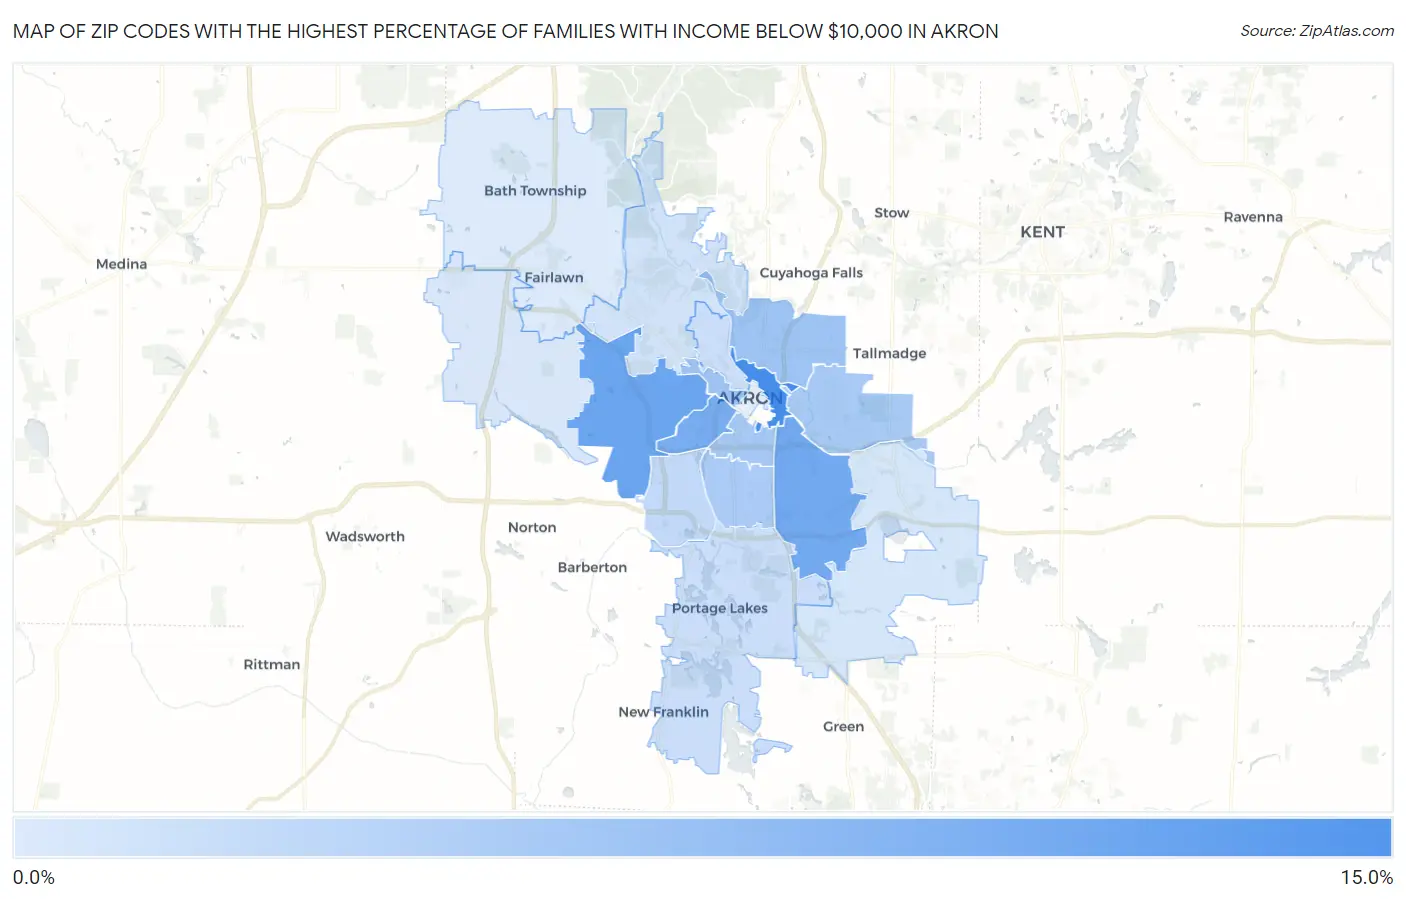
Map of Zip Codes with the Highest Percentage of Families with Income Below $10,000 in Akron

0.0%
15.0%
Zip Codes with the Highest Percentage of Families with Income Below $10,000 in Akron Map

Zip Codes with the Highest Percentage of Families with Income Below $10,000 in Akron, OH

Zip Code Families with Income < $10k vs State vs National
1.4430414.7%3.3%(+11.4)#293.1%(+11.6)#896
2.4432011.1%3.3%(+7.80)#563.1%(+8.00)#1,554
3.4430610.5%3.3%(+7.20)#653.1%(+7.40)#1,738
4.4430710.1%3.3%(+6.80)#713.1%(+7.00)#1,877
5.443106.4%3.3%(+3.10)#1793.1%(+3.30)#4,209
6.443026.3%3.3%(+3.00)#1833.1%(+3.20)#4,342
7.443115.7%3.3%(+2.40)#2003.1%(+2.60)#5,062
8.443055.5%3.3%(+2.20)#2093.1%(+2.40)#5,326
9.443015.4%3.3%(+2.10)#2153.1%(+2.30)#5,475
10.443143.3%3.3%(=0.000)#3843.1%(+0.200)#10,183
11.443192.5%3.3%(-0.800)#4933.1%(-0.600)#13,137
12.443032.5%3.3%(-0.800)#4953.1%(-0.600)#13,224
13.443132.0%3.3%(-1.30)#5783.1%(-1.10)#15,335
14.443121.5%3.3%(-1.80)#6693.1%(-1.60)#17,729
15.443211.3%3.3%(-2.00)#7163.1%(-1.80)#18,838
16.443330.90%3.3%(-2.40)#7773.1%(-2.20)#20,810

Common Questions

What are the Top 10 Zip Codes with the Highest Percentage of Families with Income Below $10,000 in Akron, OH?
Top 10 Zip Codes with the Highest Percentage of Families with Income Below $10,000 in Akron, OH are:
#1
14.7%
#2
11.1%
#3
10.5%
#4
10.1%
#5
6.4%
#6
6.3%
#7
5.7%
#8
5.5%
#9
5.4%
#10
3.3%
What zip code has the Highest Percentage of Families with Income Below $10,000 in Akron, OH?
44304 has the Highest Percentage of Families with Income Below $10,000 in Akron, OH with 14.7%.
What is the Percentage of Families with Income Below $10,000 in Akron, OH?
Percentage of Families with Income Below $10,000 in Akron is 5.7%.
What is the Percentage of Families with Income Below $10,000 in Ohio?
Percentage of Families with Income Below $10,000 in Ohio is 3.3%.
What is the Percentage of Families with Income Below $10,000 in the United States?
Percentage of Families with Income Below $10,000 in the United States is 3.1%.