Zip Codes with the Highest Percentage of Population with a Degree in Engineering in Akron, OH
RELATED REPORTS & OPTIONS
Engineering
Akron
Compare Zip Codes
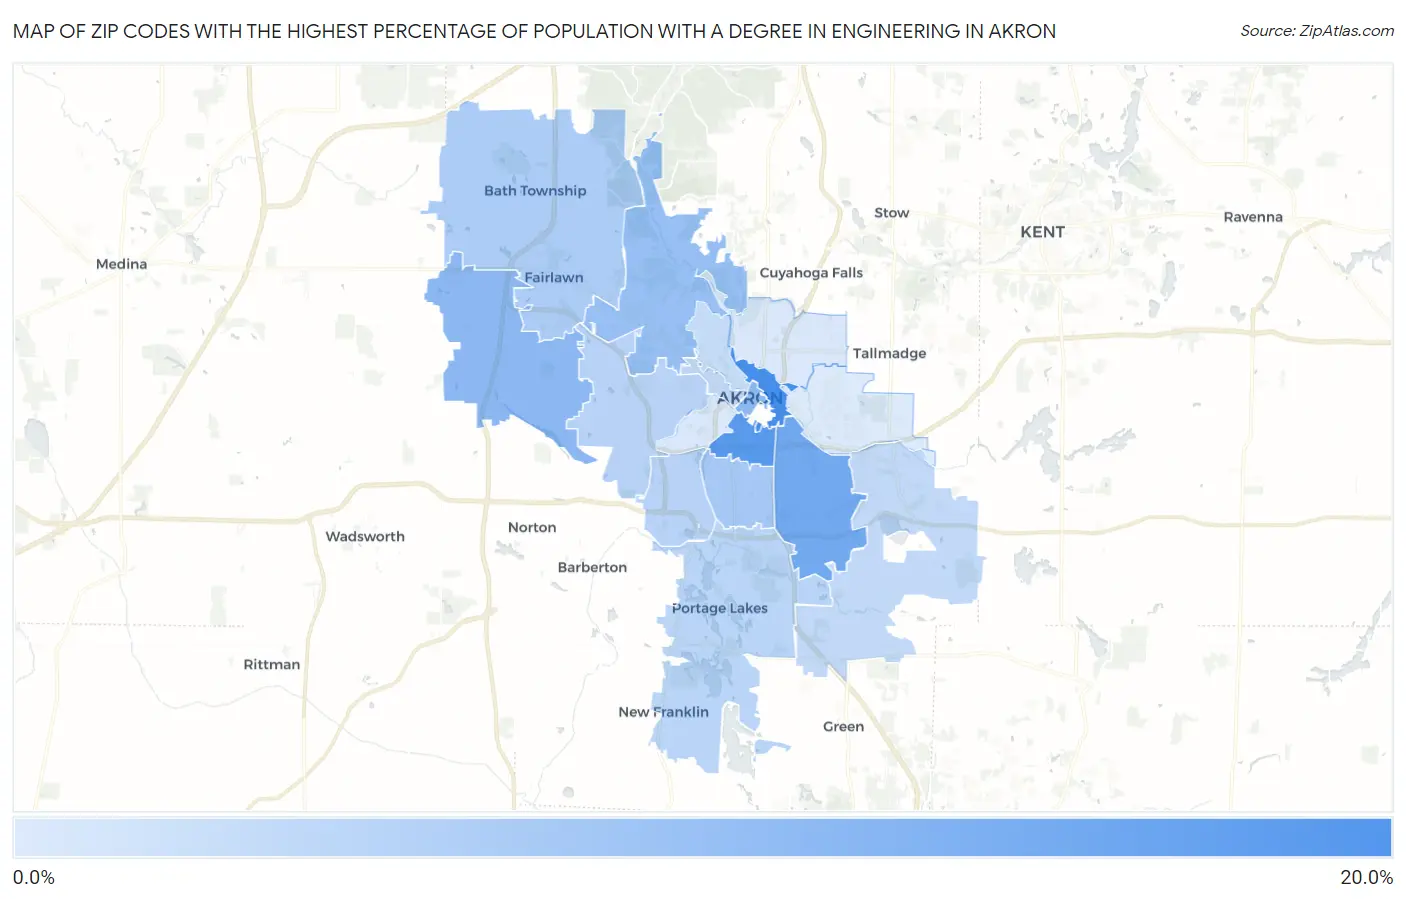
Map of Zip Codes with the Highest Percentage of Population with a Degree in Engineering in Akron
1.8%
18.3%
Zip Codes with the Highest Percentage of Population with a Degree in Engineering in Akron, OH
| Zip Code | % Graduates | vs State | vs National | |
| 1. | 44304 | 18.3% | 7.4%(+10.9)#43 | 7.6%(+10.7)#1,124 |
| 2. | 44311 | 16.4% | 7.4%(+9.06)#58 | 7.6%(+8.79)#1,413 |
| 3. | 44306 | 13.3% | 7.4%(+5.95)#93 | 7.6%(+5.68)#2,295 |
| 4. | 44321 | 10.4% | 7.4%(+3.03)#172 | 7.6%(+2.76)#4,068 |
| 5. | 44308 | 10.2% | 7.4%(+2.80)#181 | 7.6%(+2.52)#4,295 |
| 6. | 44313 | 9.0% | 7.4%(+1.62)#250 | 7.6%(+1.35)#5,611 |
| 7. | 44301 | 7.5% | 7.4%(+0.115)#355 | 7.6%(-0.158)#8,025 |
| 8. | 44333 | 6.8% | 7.4%(-0.559)#401 | 7.6%(-0.832)#9,376 |
| 9. | 44320 | 5.7% | 7.4%(-1.66)#510 | 7.6%(-1.93)#11,926 |
| 10. | 44314 | 5.6% | 7.4%(-1.78)#525 | 7.6%(-2.05)#12,213 |
| 11. | 44319 | 5.4% | 7.4%(-1.97)#543 | 7.6%(-2.24)#12,648 |
| 12. | 44302 | 4.6% | 7.4%(-2.74)#615 | 7.6%(-3.01)#14,714 |
| 13. | 44312 | 4.6% | 7.4%(-2.74)#616 | 7.6%(-3.02)#14,724 |
| 14. | 44303 | 4.0% | 7.4%(-3.33)#665 | 7.6%(-3.60)#16,223 |
| 15. | 44310 | 2.1% | 7.4%(-5.28)#814 | 7.6%(-5.56)#20,775 |
| 16. | 44307 | 1.9% | 7.4%(-5.47)#825 | 7.6%(-5.74)#21,129 |
| 17. | 44305 | 1.8% | 7.4%(-5.59)#829 | 7.6%(-5.86)#21,376 |
1
Common Questions
What are the Top 10 Zip Codes with the Highest Percentage of Population with a Degree in Engineering in Akron, OH?
Top 10 Zip Codes with the Highest Percentage of Population with a Degree in Engineering in Akron, OH are:
What zip code has the Highest Percentage of Population with a Degree in Engineering in Akron, OH?
44304 has the Highest Percentage of Population with a Degree in Engineering in Akron, OH with 18.3%.
What is the Percentage of Population with a Degree in Engineering in Akron, OH?
Percentage of Population with a Degree in Engineering in Akron is 6.4%.
What is the Percentage of Population with a Degree in Engineering in Ohio?
Percentage of Population with a Degree in Engineering in Ohio is 7.4%.
What is the Percentage of Population with a Degree in Engineering in the United States?
Percentage of Population with a Degree in Engineering in the United States is 7.6%.