Zip Codes with the Highest Percentage of Population Employed in Accommodation & Food Services in Akron, OH
RELATED REPORTS & OPTIONS
Accommodation & Food Services
Akron
Compare Zip Codes
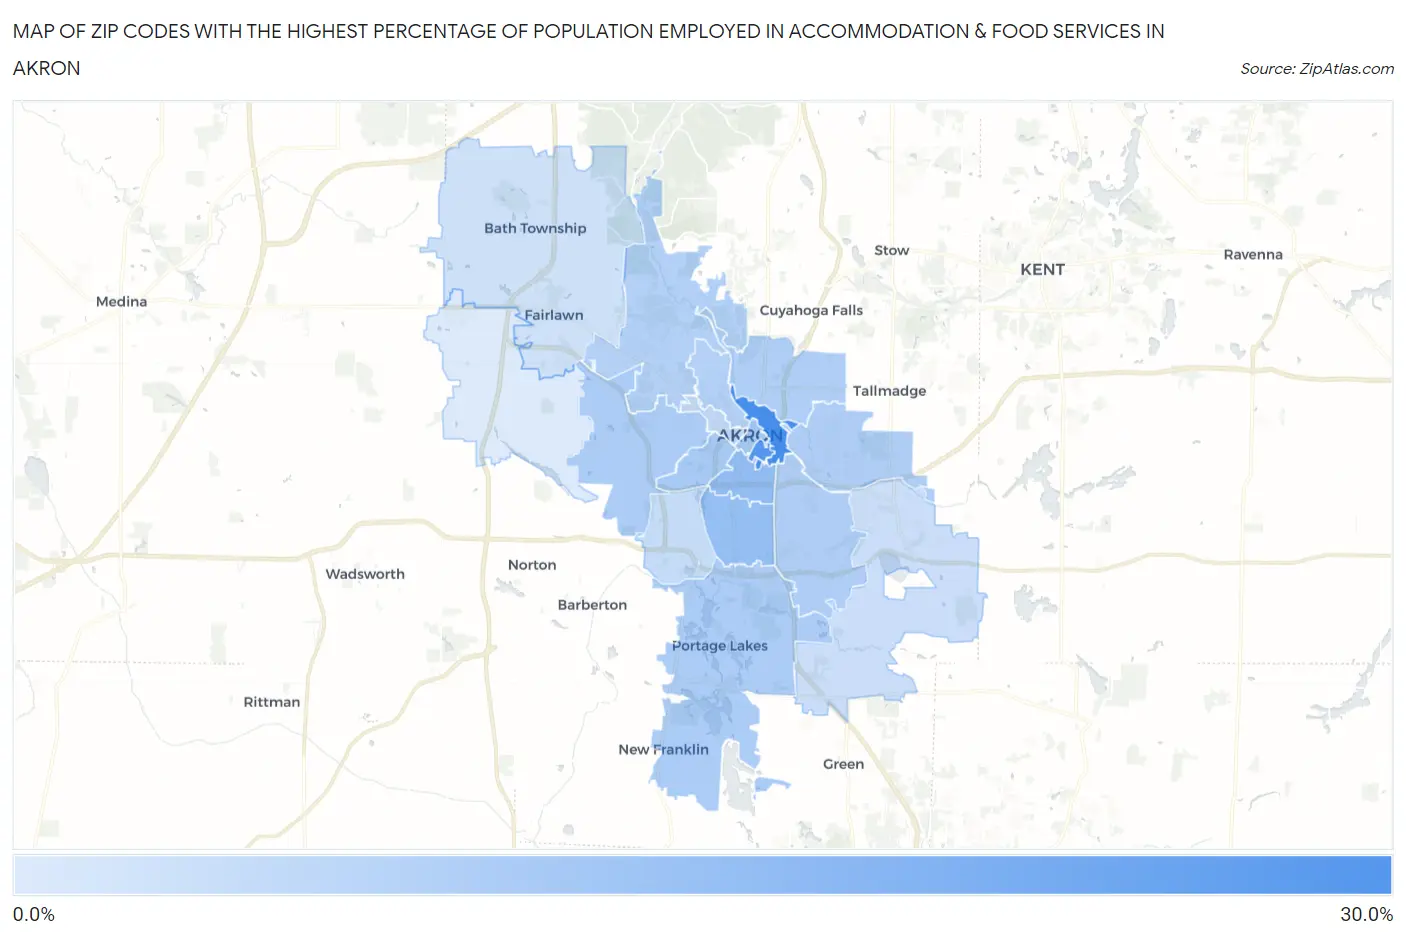
Map of Zip Codes with the Highest Percentage of Population Employed in Accommodation & Food Services in Akron
3.6%
25.6%
Zip Codes with the Highest Percentage of Population Employed in Accommodation & Food Services in Akron, OH
| Zip Code | % Employed | vs State | vs National | |
| 1. | 44304 | 25.6% | 7.0%(+18.6)#19 | 6.9%(+18.7)#479 |
| 2. | 44325 | 23.3% | 7.0%(+16.3)#27 | 6.9%(+16.5)#594 |
| 3. | 44311 | 14.0% | 7.0%(+7.02)#72 | 6.9%(+7.15)#1,961 |
| 4. | 44301 | 13.7% | 7.0%(+6.70)#74 | 6.9%(+6.83)#2,050 |
| 5. | 44308 | 11.4% | 7.0%(+4.40)#127 | 6.9%(+4.53)#3,227 |
| 6. | 44307 | 11.1% | 7.0%(+4.06)#142 | 6.9%(+4.19)#3,499 |
| 7. | 44320 | 10.3% | 7.0%(+3.26)#181 | 6.9%(+3.39)#4,228 |
| 8. | 44319 | 10.2% | 7.0%(+3.22)#183 | 6.9%(+3.35)#4,267 |
| 9. | 44306 | 9.9% | 7.0%(+2.91)#204 | 6.9%(+3.03)#4,651 |
| 10. | 44305 | 9.9% | 7.0%(+2.90)#205 | 6.9%(+3.03)#4,652 |
| 11. | 44310 | 9.7% | 7.0%(+2.72)#215 | 6.9%(+2.85)#4,892 |
| 12. | 44303 | 9.2% | 7.0%(+2.23)#252 | 6.9%(+2.36)#5,602 |
| 13. | 44313 | 9.2% | 7.0%(+2.20)#254 | 6.9%(+2.33)#5,640 |
| 14. | 44302 | 7.5% | 7.0%(+0.486)#403 | 6.9%(+0.614)#9,005 |
| 15. | 44314 | 6.8% | 7.0%(-0.187)#480 | 6.9%(-0.059)#10,826 |
| 16. | 44312 | 6.2% | 7.0%(-0.795)#574 | 6.9%(-0.667)#12,752 |
| 17. | 44333 | 5.5% | 7.0%(-1.53)#662 | 6.9%(-1.40)#15,121 |
| 18. | 44321 | 3.6% | 7.0%(-3.39)#896 | 6.9%(-3.26)#21,399 |
1
Common Questions
What are the Top 10 Zip Codes with the Highest Percentage of Population Employed in Accommodation & Food Services in Akron, OH?
Top 10 Zip Codes with the Highest Percentage of Population Employed in Accommodation & Food Services in Akron, OH are:
What zip code has the Highest Percentage of Population Employed in Accommodation & Food Services in Akron, OH?
44304 has the Highest Percentage of Population Employed in Accommodation & Food Services in Akron, OH with 25.6%.
What is the Percentage of Population Employed in Accommodation & Food Services in Akron, OH?
Percentage of Population Employed in Accommodation & Food Services in Akron is 9.9%.
What is the Percentage of Population Employed in Accommodation & Food Services in Ohio?
Percentage of Population Employed in Accommodation & Food Services in Ohio is 7.0%.
What is the Percentage of Population Employed in Accommodation & Food Services in the United States?
Percentage of Population Employed in Accommodation & Food Services in the United States is 6.9%.