Zip Codes with the Highest Percentage of Population with a Degree in Communications in Akron, OH
RELATED REPORTS & OPTIONS
Communications
Akron
Compare Zip Codes
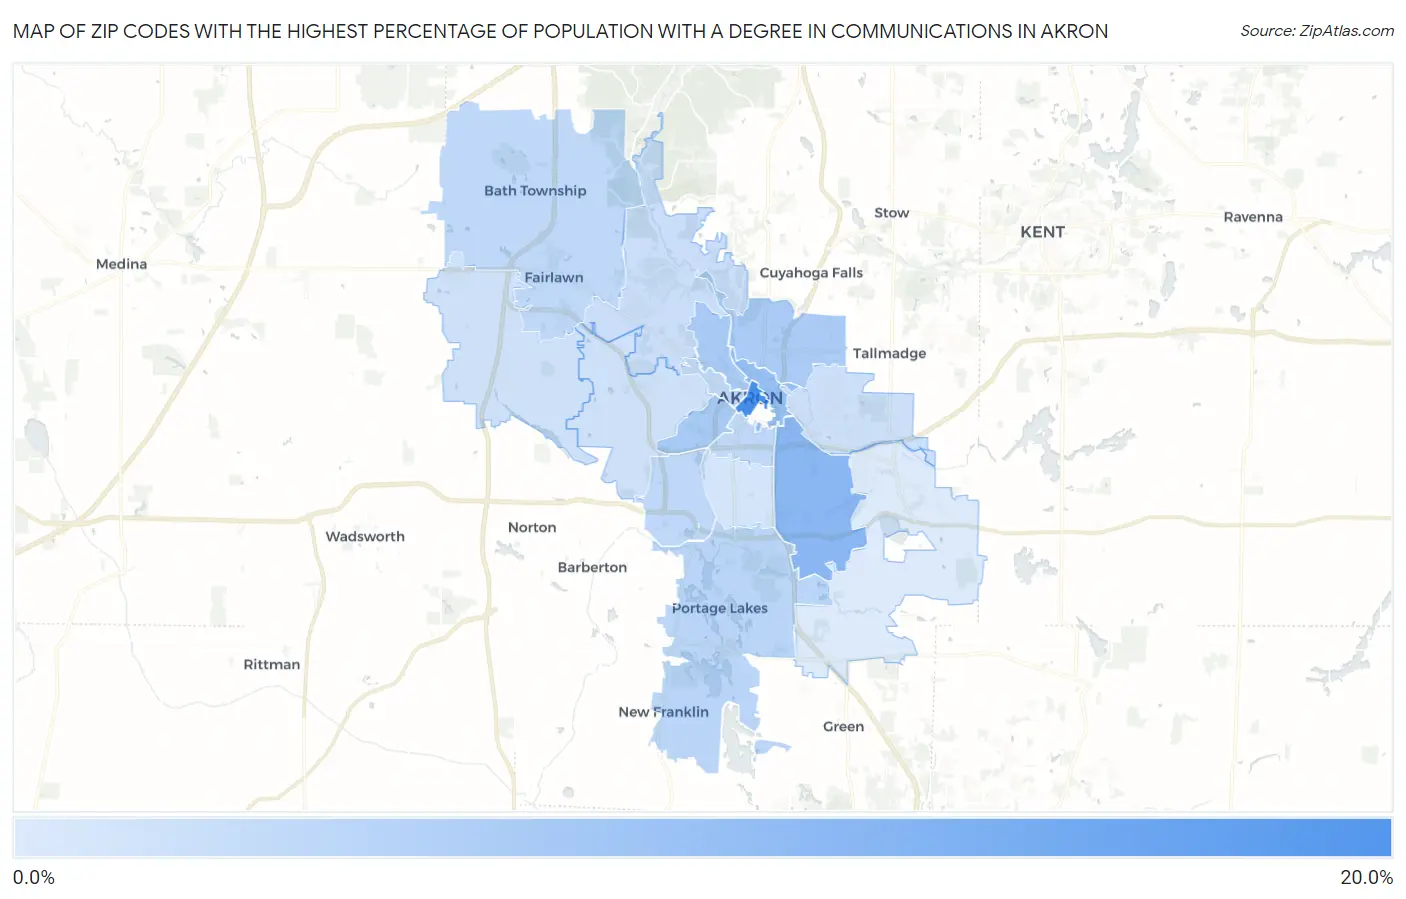
Map of Zip Codes with the Highest Percentage of Population with a Degree in Communications in Akron
1.7%
18.6%
Zip Codes with the Highest Percentage of Population with a Degree in Communications in Akron, OH
| Zip Code | % Graduates | vs State | vs National | |
| 1. | 44308 | 18.6% | 4.3%(+14.3)#16 | 4.1%(+14.5)#379 |
| 2. | 44306 | 10.8% | 4.3%(+6.46)#50 | 4.1%(+6.63)#1,012 |
| 3. | 44304 | 9.4% | 4.3%(+5.07)#65 | 4.1%(+5.24)#1,303 |
| 4. | 44303 | 7.5% | 4.3%(+3.18)#94 | 4.1%(+3.35)#2,204 |
| 5. | 44307 | 7.5% | 4.3%(+3.14)#98 | 4.1%(+3.32)#2,234 |
| 6. | 44310 | 7.2% | 4.3%(+2.93)#109 | 4.1%(+3.10)#2,411 |
| 7. | 44319 | 5.2% | 4.3%(+0.937)#219 | 4.1%(+1.11)#5,149 |
| 8. | 44314 | 4.9% | 4.3%(+0.579)#252 | 4.1%(+0.753)#5,949 |
| 9. | 44311 | 4.8% | 4.3%(+0.486)#263 | 4.1%(+0.660)#6,189 |
| 10. | 44333 | 4.8% | 4.3%(+0.476)#264 | 4.1%(+0.650)#6,215 |
| 11. | 44302 | 4.5% | 4.3%(+0.163)#295 | 4.1%(+0.337)#7,033 |
| 12. | 44313 | 3.5% | 4.3%(-0.772)#420 | 4.1%(-0.598)#10,188 |
| 13. | 44305 | 3.4% | 4.3%(-0.860)#436 | 4.1%(-0.687)#10,506 |
| 14. | 44321 | 3.2% | 4.3%(-1.14)#476 | 4.1%(-0.969)#11,584 |
| 15. | 44320 | 3.0% | 4.3%(-1.28)#493 | 4.1%(-1.10)#12,069 |
| 16. | 44301 | 2.6% | 4.3%(-1.72)#557 | 4.1%(-1.55)#13,828 |
| 17. | 44312 | 1.7% | 4.3%(-2.66)#650 | 4.1%(-2.48)#17,022 |
1
Common Questions
What are the Top 10 Zip Codes with the Highest Percentage of Population with a Degree in Communications in Akron, OH?
Top 10 Zip Codes with the Highest Percentage of Population with a Degree in Communications in Akron, OH are:
What zip code has the Highest Percentage of Population with a Degree in Communications in Akron, OH?
44308 has the Highest Percentage of Population with a Degree in Communications in Akron, OH with 18.6%.
What is the Percentage of Population with a Degree in Communications in Akron, OH?
Percentage of Population with a Degree in Communications in Akron is 5.1%.
What is the Percentage of Population with a Degree in Communications in Ohio?
Percentage of Population with a Degree in Communications in Ohio is 4.3%.
What is the Percentage of Population with a Degree in Communications in the United States?
Percentage of Population with a Degree in Communications in the United States is 4.1%.