Zip Codes with the Highest Percentage of Population Employed in Food Preparation & Serving in Akron, OH
RELATED REPORTS & OPTIONS
Food Preparation & Serving
Akron
Compare Zip Codes
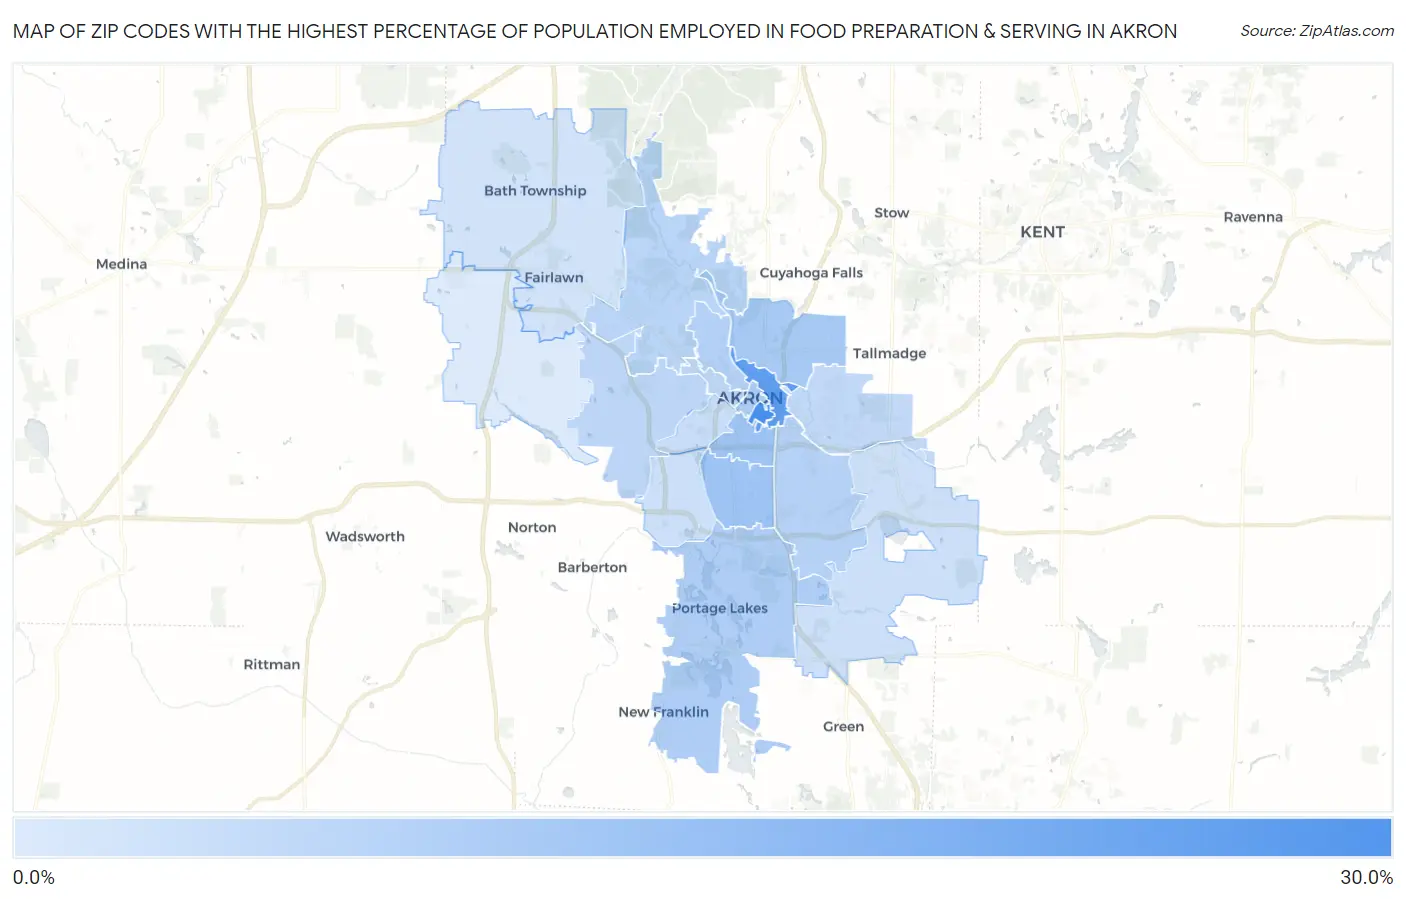
Map of Zip Codes with the Highest Percentage of Population Employed in Food Preparation & Serving in Akron
3.3%
26.3%
Zip Codes with the Highest Percentage of Population Employed in Food Preparation & Serving in Akron, OH
| Zip Code | % Employed | vs State | vs National | |
| 1. | 44325 | 26.3% | 5.6%(+20.7)#13 | 5.3%(+21.0)#276 |
| 2. | 44304 | 21.9% | 5.6%(+16.3)#21 | 5.3%(+16.7)#423 |
| 3. | 44301 | 12.2% | 5.6%(+6.62)#72 | 5.3%(+6.94)#1,588 |
| 4. | 44311 | 12.1% | 5.6%(+6.54)#73 | 5.3%(+6.86)#1,615 |
| 5. | 44310 | 11.1% | 5.6%(+5.45)#96 | 5.3%(+5.77)#2,031 |
| 6. | 44308 | 10.1% | 5.6%(+4.53)#111 | 5.3%(+4.85)#2,529 |
| 7. | 44319 | 9.7% | 5.6%(+4.13)#128 | 5.3%(+4.45)#2,855 |
| 8. | 44303 | 9.2% | 5.6%(+3.63)#149 | 5.3%(+3.95)#3,287 |
| 9. | 44306 | 8.8% | 5.6%(+3.19)#174 | 5.3%(+3.51)#3,735 |
| 10. | 44313 | 8.3% | 5.6%(+2.72)#199 | 5.3%(+3.04)#4,281 |
| 11. | 44320 | 7.7% | 5.6%(+2.09)#237 | 5.3%(+2.41)#5,207 |
| 12. | 44302 | 7.6% | 5.6%(+2.01)#247 | 5.3%(+2.33)#5,357 |
| 13. | 44305 | 7.1% | 5.6%(+1.47)#298 | 5.3%(+1.78)#6,399 |
| 14. | 44307 | 6.3% | 5.6%(+0.679)#374 | 5.3%(+0.999)#8,477 |
| 15. | 44314 | 5.7% | 5.6%(+0.064)#453 | 5.3%(+0.384)#10,457 |
| 16. | 44312 | 5.4% | 5.6%(-0.162)#487 | 5.3%(+0.157)#11,251 |
| 17. | 44333 | 4.9% | 5.6%(-0.689)#580 | 5.3%(-0.369)#13,283 |
| 18. | 44321 | 3.3% | 5.6%(-2.35)#860 | 5.3%(-2.03)#20,268 |
1
Common Questions
What are the Top 10 Zip Codes with the Highest Percentage of Population Employed in Food Preparation & Serving in Akron, OH?
Top 10 Zip Codes with the Highest Percentage of Population Employed in Food Preparation & Serving in Akron, OH are:
What zip code has the Highest Percentage of Population Employed in Food Preparation & Serving in Akron, OH?
44325 has the Highest Percentage of Population Employed in Food Preparation & Serving in Akron, OH with 26.3%.
What is the Percentage of Population Employed in Food Preparation & Serving in Akron, OH?
Percentage of Population Employed in Food Preparation & Serving in Akron is 8.8%.
What is the Percentage of Population Employed in Food Preparation & Serving in Ohio?
Percentage of Population Employed in Food Preparation & Serving in Ohio is 5.6%.
What is the Percentage of Population Employed in Food Preparation & Serving in the United States?
Percentage of Population Employed in Food Preparation & Serving in the United States is 5.3%.