Zip Codes with the Highest Percentage of Population Employed in Community & Social Service in Akron, OH
RELATED REPORTS & OPTIONS
Community & Social Service
Akron
Compare Zip Codes
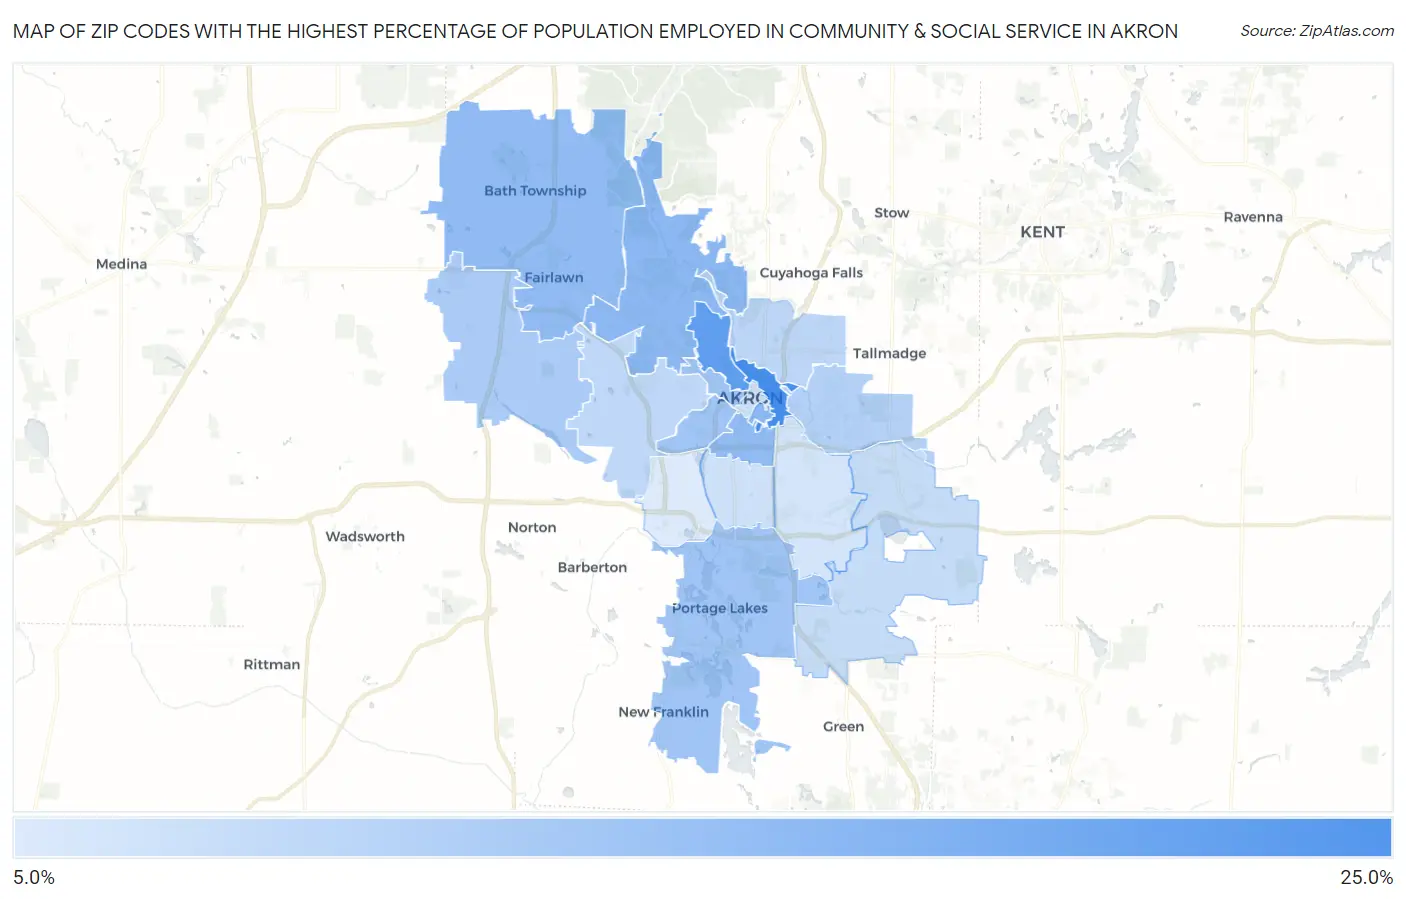
Map of Zip Codes with the Highest Percentage of Population Employed in Community & Social Service in Akron
5.3%
20.4%
Zip Codes with the Highest Percentage of Population Employed in Community & Social Service in Akron, OH
| Zip Code | % Employed | vs State | vs National | |
| 1. | 44304 | 20.4% | 10.0%(+10.5)#35 | 11.2%(+9.23)#1,893 |
| 2. | 44303 | 17.7% | 10.0%(+7.77)#57 | 11.2%(+6.51)#2,956 |
| 3. | 44325 | 13.3% | 10.0%(+3.38)#152 | 11.2%(+2.12)#7,005 |
| 4. | 44313 | 13.1% | 10.0%(+3.19)#163 | 11.2%(+1.93)#7,323 |
| 5. | 44311 | 12.8% | 10.0%(+2.82)#182 | 11.2%(+1.56)#7,935 |
| 6. | 44333 | 12.6% | 10.0%(+2.69)#188 | 11.2%(+1.43)#8,168 |
| 7. | 44302 | 11.2% | 10.0%(+1.25)#275 | 11.2%(-0.011)#11,118 |
| 8. | 44319 | 11.2% | 10.0%(+1.22)#278 | 11.2%(-0.041)#11,198 |
| 9. | 44307 | 11.2% | 10.0%(+1.21)#279 | 11.2%(-0.051)#11,220 |
| 10. | 44321 | 10.1% | 10.0%(+0.183)#362 | 11.2%(-1.08)#13,767 |
| 11. | 44305 | 9.3% | 10.0%(-0.641)#428 | 11.2%(-1.90)#15,940 |
| 12. | 44310 | 8.3% | 10.0%(-1.63)#538 | 11.2%(-2.89)#18,701 |
| 13. | 44320 | 8.2% | 10.0%(-1.72)#540 | 11.2%(-2.98)#18,919 |
| 14. | 44312 | 7.5% | 10.0%(-2.44)#634 | 11.2%(-3.70)#20,848 |
| 15. | 44308 | 6.8% | 10.0%(-3.11)#716 | 11.2%(-4.37)#22,516 |
| 16. | 44301 | 6.6% | 10.0%(-3.39)#757 | 11.2%(-4.65)#23,119 |
| 17. | 44306 | 6.3% | 10.0%(-3.68)#785 | 11.2%(-4.94)#23,759 |
| 18. | 44314 | 5.3% | 10.0%(-4.62)#885 | 11.2%(-5.88)#25,659 |
1
Common Questions
What are the Top 10 Zip Codes with the Highest Percentage of Population Employed in Community & Social Service in Akron, OH?
Top 10 Zip Codes with the Highest Percentage of Population Employed in Community & Social Service in Akron, OH are:
What zip code has the Highest Percentage of Population Employed in Community & Social Service in Akron, OH?
44304 has the Highest Percentage of Population Employed in Community & Social Service in Akron, OH with 20.4%.
What is the Percentage of Population Employed in Community & Social Service in Akron, OH?
Percentage of Population Employed in Community & Social Service in Akron is 9.4%.
What is the Percentage of Population Employed in Community & Social Service in Ohio?
Percentage of Population Employed in Community & Social Service in Ohio is 10.0%.
What is the Percentage of Population Employed in Community & Social Service in the United States?
Percentage of Population Employed in Community & Social Service in the United States is 11.2%.