Zip Codes with the Highest Percentage of Population with a Degree in Arts and Humanities in Akron, OH
RELATED REPORTS & OPTIONS
Arts and Humanities
Akron
Compare Zip Codes
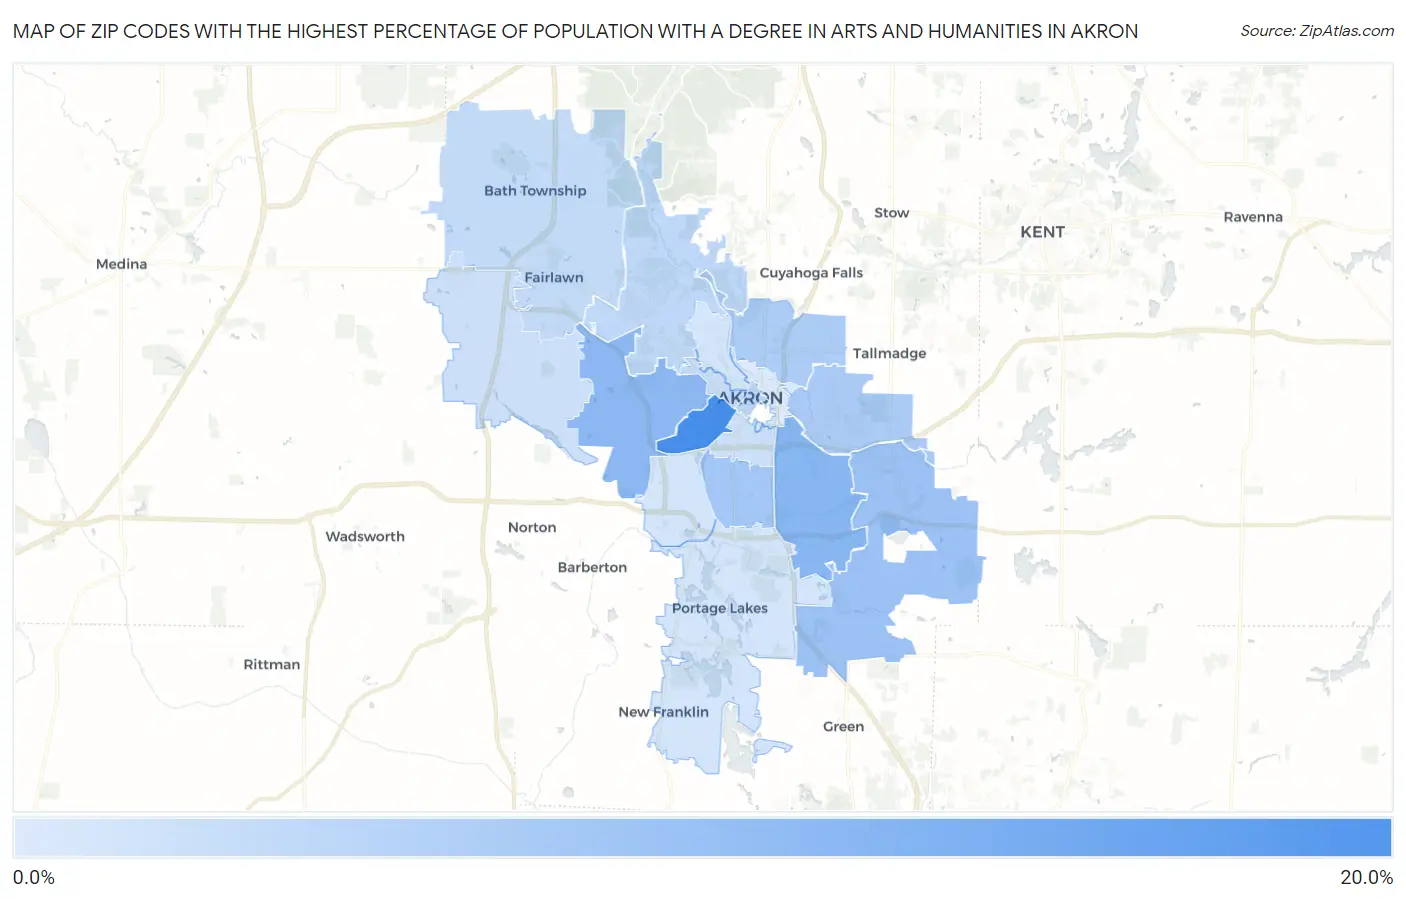
Map of Zip Codes with the Highest Percentage of Population with a Degree in Arts and Humanities in Akron
2.3%
19.8%
Zip Codes with the Highest Percentage of Population with a Degree in Arts and Humanities in Akron, OH
| Zip Code | % Graduates | vs State | vs National | |
| 1. | 44307 | 19.8% | 5.8%(+14.0)#51 | 6.0%(+13.8)#1,533 |
| 2. | 44306 | 11.9% | 5.8%(+6.14)#156 | 6.0%(+5.93)#4,360 |
| 3. | 44320 | 11.5% | 5.8%(+5.68)#168 | 6.0%(+5.47)#4,714 |
| 4. | 44312 | 9.4% | 5.8%(+3.65)#238 | 6.0%(+3.44)#7,032 |
| 5. | 44301 | 8.7% | 5.8%(+2.89)#286 | 6.0%(+2.68)#8,300 |
| 6. | 44305 | 7.8% | 5.8%(+2.02)#350 | 6.0%(+1.81)#10,043 |
| 7. | 44310 | 7.6% | 5.8%(+1.79)#364 | 6.0%(+1.58)#10,552 |
| 8. | 44308 | 6.1% | 5.8%(+0.317)#495 | 6.0%(+0.106)#14,390 |
| 9. | 44313 | 5.6% | 5.8%(-0.224)#557 | 6.0%(-0.435)#15,947 |
| 10. | 44333 | 5.1% | 5.8%(-0.649)#616 | 6.0%(-0.860)#17,209 |
| 11. | 44302 | 4.6% | 5.8%(-1.15)#674 | 6.0%(-1.36)#18,655 |
| 12. | 44311 | 4.1% | 5.8%(-1.67)#727 | 6.0%(-1.89)#20,033 |
| 13. | 44321 | 4.0% | 5.8%(-1.75)#735 | 6.0%(-1.96)#20,249 |
| 14. | 44319 | 3.2% | 5.8%(-2.54)#802 | 6.0%(-2.75)#22,152 |
| 15. | 44303 | 3.2% | 5.8%(-2.54)#803 | 6.0%(-2.75)#22,160 |
| 16. | 44314 | 3.2% | 5.8%(-2.55)#805 | 6.0%(-2.76)#22,169 |
| 17. | 44304 | 2.3% | 5.8%(-3.52)#885 | 6.0%(-3.73)#23,962 |
1
Common Questions
What are the Top 10 Zip Codes with the Highest Percentage of Population with a Degree in Arts and Humanities in Akron, OH?
Top 10 Zip Codes with the Highest Percentage of Population with a Degree in Arts and Humanities in Akron, OH are:
What zip code has the Highest Percentage of Population with a Degree in Arts and Humanities in Akron, OH?
44307 has the Highest Percentage of Population with a Degree in Arts and Humanities in Akron, OH with 19.8%.
What is the Percentage of Population with a Degree in Arts and Humanities in Akron, OH?
Percentage of Population with a Degree in Arts and Humanities in Akron is 7.1%.
What is the Percentage of Population with a Degree in Arts and Humanities in Ohio?
Percentage of Population with a Degree in Arts and Humanities in Ohio is 5.8%.
What is the Percentage of Population with a Degree in Arts and Humanities in the United States?
Percentage of Population with a Degree in Arts and Humanities in the United States is 6.0%.