Zip Codes with the Highest Percentage of Population Employed in Security & Protection in Akron, OH
RELATED REPORTS & OPTIONS
Security & Protection
Akron
Compare Zip Codes
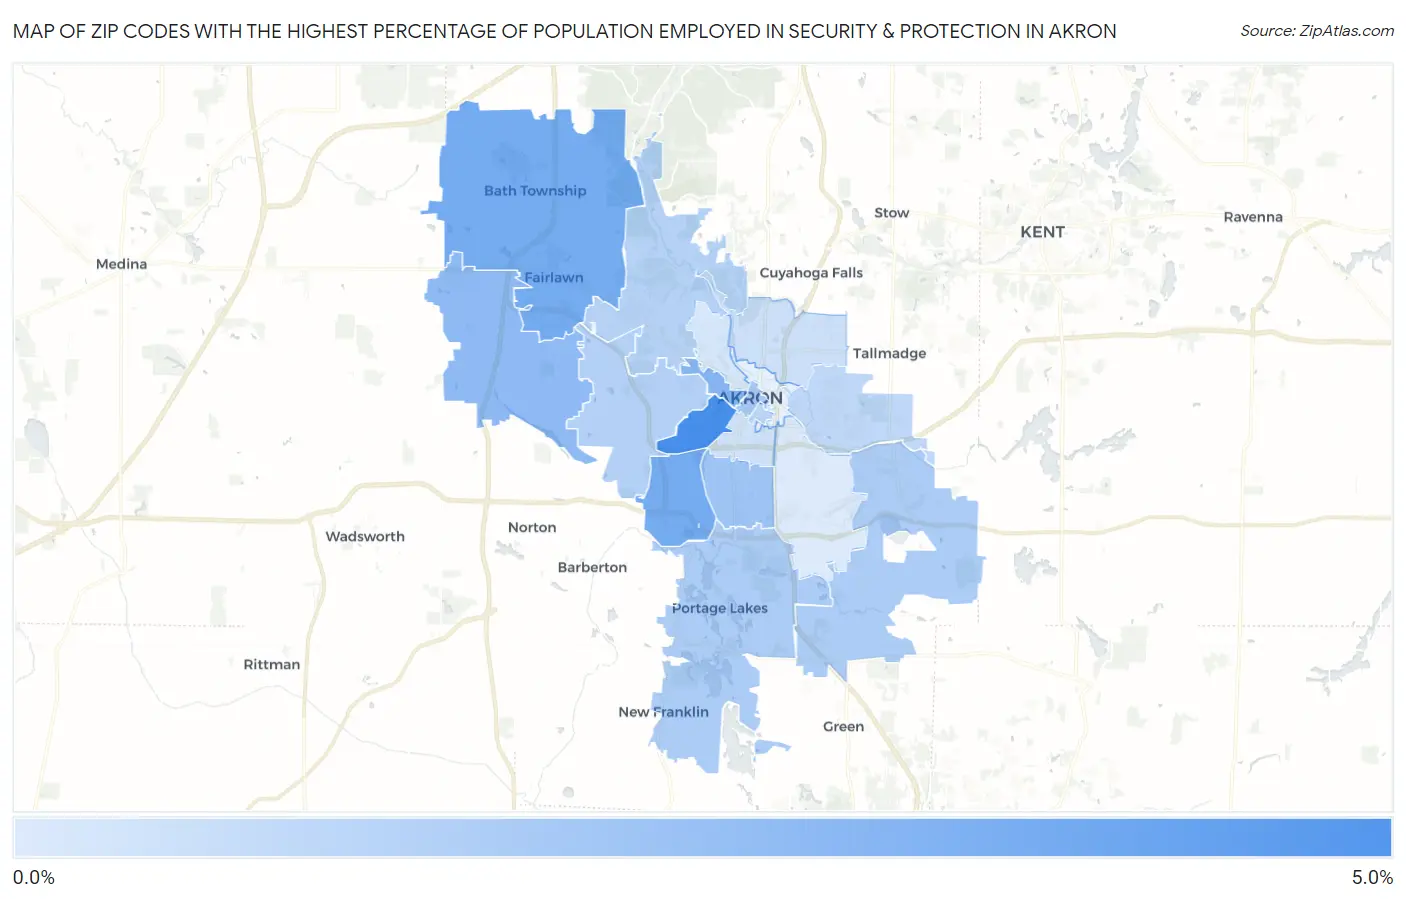
Map of Zip Codes with the Highest Percentage of Population Employed in Security & Protection in Akron
0.33%
4.6%
Zip Codes with the Highest Percentage of Population Employed in Security & Protection in Akron, OH
| Zip Code | % Employed | vs State | vs National | |
| 1. | 44307 | 4.6% | 1.9%(+2.69)#63 | 2.1%(+2.45)#3,453 |
| 2. | 44314 | 3.3% | 1.9%(+1.34)#152 | 2.1%(+1.10)#6,390 |
| 3. | 44333 | 3.2% | 1.9%(+1.34)#154 | 2.1%(+1.10)#6,411 |
| 4. | 44302 | 2.8% | 1.9%(+0.851)#228 | 2.1%(+0.613)#8,268 |
| 5. | 44321 | 2.6% | 1.9%(+0.653)#263 | 2.1%(+0.415)#9,192 |
| 6. | 44301 | 2.1% | 1.9%(+0.158)#386 | 2.1%(-0.081)#12,127 |
| 7. | 44308 | 1.9% | 1.9%(-0.009)#434 | 2.1%(-0.247)#13,212 |
| 8. | 44319 | 1.7% | 1.9%(-0.188)#482 | 2.1%(-0.426)#14,509 |
| 9. | 44312 | 1.7% | 1.9%(-0.204)#488 | 2.1%(-0.442)#14,630 |
| 10. | 44320 | 1.5% | 1.9%(-0.443)#565 | 2.1%(-0.681)#16,446 |
| 11. | 44313 | 1.4% | 1.9%(-0.484)#581 | 2.1%(-0.723)#16,763 |
| 12. | 44325 | 1.3% | 1.9%(-0.577)#616 | 2.1%(-0.815)#17,470 |
| 13. | 44305 | 1.1% | 1.9%(-0.763)#684 | 2.1%(-1.00)#18,917 |
| 14. | 44310 | 0.80% | 1.9%(-1.11)#801 | 2.1%(-1.34)#21,383 |
| 15. | 44311 | 0.70% | 1.9%(-1.21)#821 | 2.1%(-1.44)#22,055 |
| 16. | 44303 | 0.55% | 1.9%(-1.36)#863 | 2.1%(-1.59)#22,940 |
| 17. | 44306 | 0.33% | 1.9%(-1.58)#904 | 2.1%(-1.81)#24,037 |
1
Common Questions
What are the Top 10 Zip Codes with the Highest Percentage of Population Employed in Security & Protection in Akron, OH?
Top 10 Zip Codes with the Highest Percentage of Population Employed in Security & Protection in Akron, OH are:
What zip code has the Highest Percentage of Population Employed in Security & Protection in Akron, OH?
44307 has the Highest Percentage of Population Employed in Security & Protection in Akron, OH with 4.6%.
What is the Percentage of Population Employed in Security & Protection in Akron, OH?
Percentage of Population Employed in Security & Protection in Akron is 1.5%.
What is the Percentage of Population Employed in Security & Protection in Ohio?
Percentage of Population Employed in Security & Protection in Ohio is 1.9%.
What is the Percentage of Population Employed in Security & Protection in the United States?
Percentage of Population Employed in Security & Protection in the United States is 2.1%.