Zip Codes with the Highest Percentage of Self-Employed / Not Incorporated in Akron, OH
RELATED REPORTS & OPTIONS
Self-Employed / Not Incorporated
Akron
Compare Zip Codes
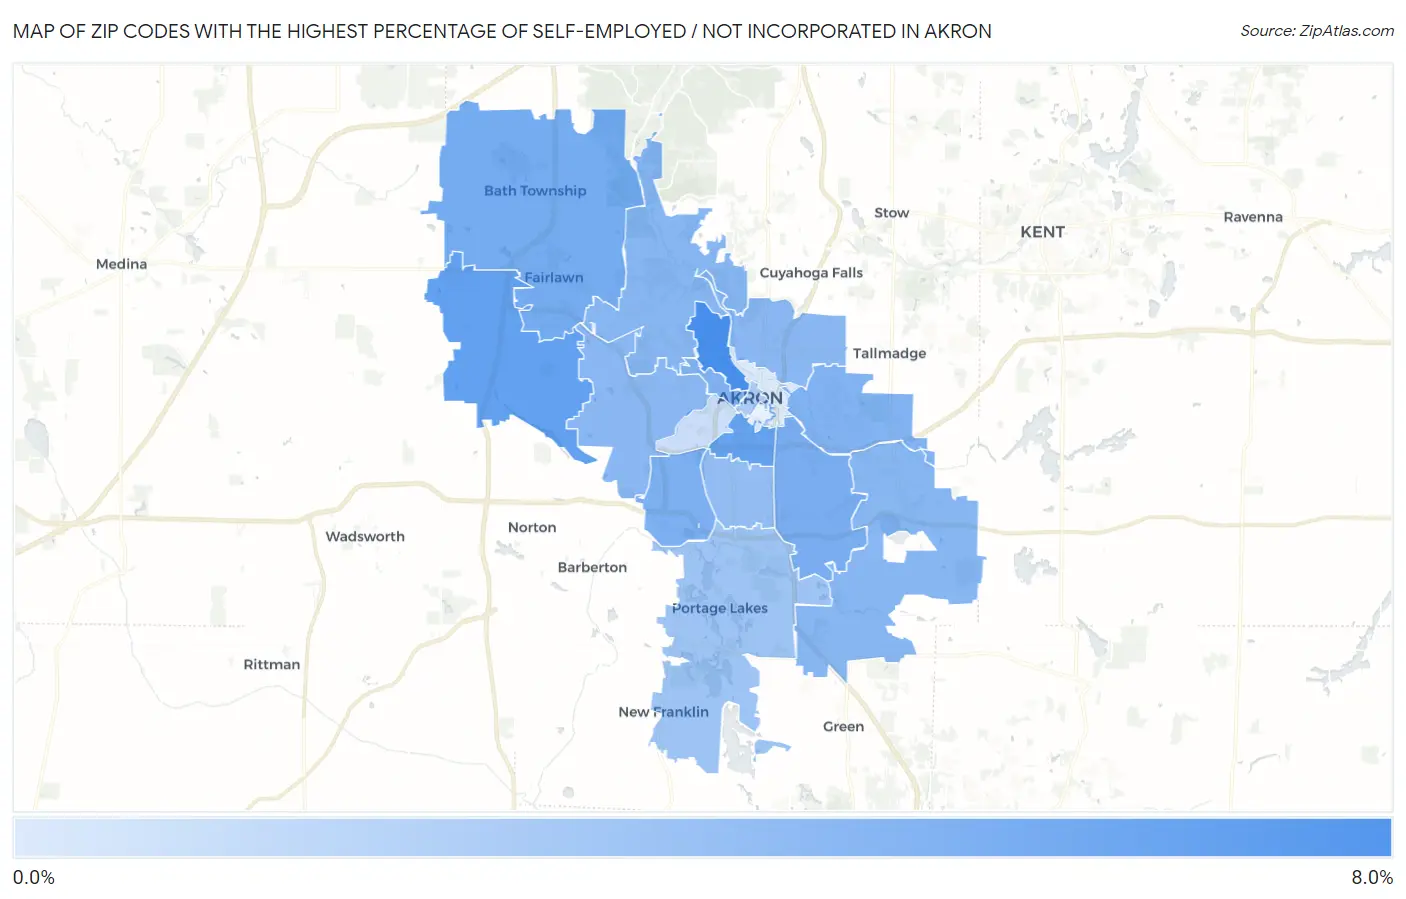
Map of Zip Codes with the Highest Percentage of Self-Employed / Not Incorporated in Akron
0.0%
8.0%
Zip Codes with the Highest Percentage of Self-Employed / Not Incorporated in Akron, OH
| Zip Code | % Self-Employed / Not Incorporated | vs State | vs National | |
| 1. | 44303 | 7.7% | 4.8%(+2.84)#247 | 5.8%(+1.85)#11,382 |
| 2. | 44321 | 6.2% | 4.8%(+1.41)#348 | 5.8%(+0.423)#15,293 |
| 3. | 44311 | 6.1% | 4.8%(+1.30)#366 | 5.8%(+0.309)#15,659 |
| 4. | 44333 | 5.4% | 4.8%(+0.562)#454 | 5.8%(-0.430)#18,181 |
| 5. | 44306 | 5.1% | 4.8%(+0.237)#521 | 5.8%(-0.754)#19,433 |
| 6. | 44314 | 5.0% | 4.8%(+0.170)#531 | 5.8%(-0.821)#19,697 |
| 7. | 44305 | 4.8% | 4.8%(-0.011)#568 | 5.8%(-1.00)#20,365 |
| 8. | 44302 | 4.7% | 4.8%(-0.089)#586 | 5.8%(-1.08)#20,668 |
| 9. | 44312 | 4.5% | 4.8%(-0.355)#637 | 5.8%(-1.35)#21,692 |
| 10. | 44313 | 4.4% | 4.8%(-0.448)#664 | 5.8%(-1.44)#22,045 |
| 11. | 44320 | 4.3% | 4.8%(-0.535)#681 | 5.8%(-1.53)#22,364 |
| 12. | 44310 | 4.3% | 4.8%(-0.551)#682 | 5.8%(-1.54)#22,427 |
| 13. | 44301 | 3.9% | 4.8%(-0.950)#757 | 5.8%(-1.94)#23,820 |
| 14. | 44319 | 3.3% | 4.8%(-1.55)#868 | 5.8%(-2.54)#25,662 |
| 15. | 44308 | 2.6% | 4.8%(-2.20)#941 | 5.8%(-3.19)#27,197 |
| 16. | 44307 | 1.1% | 4.8%(-3.68)#1,058 | 5.8%(-4.67)#29,029 |
| 17. | 44304 | 0.26% | 4.8%(-4.56)#1,079 | 5.8%(-5.55)#29,472 |
1
Common Questions
What are the Top 10 Zip Codes with the Highest Percentage of Self-Employed / Not Incorporated in Akron, OH?
Top 10 Zip Codes with the Highest Percentage of Self-Employed / Not Incorporated in Akron, OH are:
What zip code has the Highest Percentage of Self-Employed / Not Incorporated in Akron, OH?
44303 has the Highest Percentage of Self-Employed / Not Incorporated in Akron, OH with 7.7%.
What is the Percentage of Self-Employed / Not Incorporated in Akron, OH?
Percentage of Self-Employed / Not Incorporated in Akron is 4.4%.
What is the Percentage of Self-Employed / Not Incorporated in Ohio?
Percentage of Self-Employed / Not Incorporated in Ohio is 4.8%.
What is the Percentage of Self-Employed / Not Incorporated in the United States?
Percentage of Self-Employed / Not Incorporated in the United States is 5.8%.